Embed Size (px)
Citation preview

August 1999 PM Data Analysis Workbook: Introduction 1
Introduction to the PM Data Analysis Workbook
The objective of the workbook is to guide federal, state, and local agencies and other interested people in using particulate matter data
to meet their objectives.
• Guide to the Workbook
• PM2.5 Background
• Overview of the PM Monitoring Program• Critical Issues for Data Uses and Interpretation• Workbook Contents• Motivating Examples
August 1999 PM Data Analysis Workbook: Introduction 2
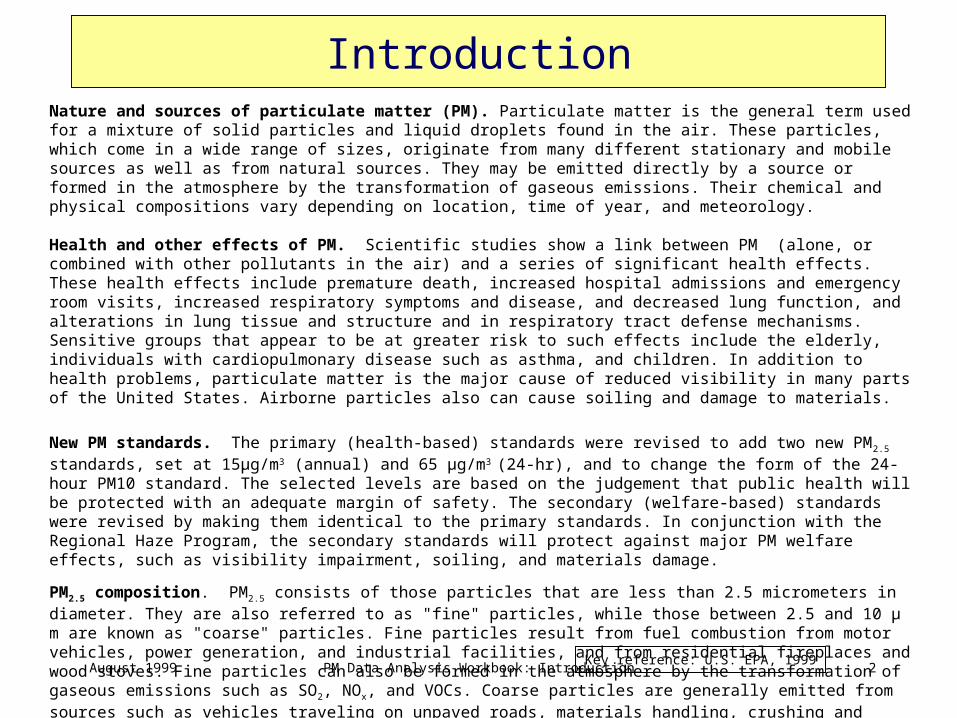
IntroductionNature and sources of particulate matter (PM). Particulate matter is the general term used for a mixture of solid particles and liquid droplets found in the air. These particles, which come in a wide range of sizes, originate from many different stationary and mobile sources as well as from natural sources. They may be emitted directly by a source or formed in the atmosphere by the transformation of gaseous emissions. Their chemical and physical compositions vary depending on location, time of year, and meteorology.
Health and other effects of PM. Scientific studies show a link between PM (alone, or combined with other pollutants in the air) and a series of significant health effects. These health effects include premature death, increased hospital admissions and emergency room visits, increased respiratory symptoms and disease, and decreased lung function, and alterations in lung tissue and structure and in respiratory tract defense mechanisms. Sensitive groups that appear to be at greater risk to such effects include the elderly, individuals with cardiopulmonary disease such as asthma, and children. In addition to health problems, particulate matter is the major cause of reduced visibility in many parts of the United States. Airborne particles also can cause soiling and damage to materials.
New PM standards. The primary (health-based) standards were revised to add two new PM2.5 standards, set at 15µg/m3 (annual) and 65 µg/m3 (24-hr), and to change the form of the 24-hour PM10 standard. The selected levels are based on the judgement that public health will be protected with an adequate margin of safety. The secondary (welfare-based) standards were revised by making them identical to the primary standards. In conjunction with the Regional Haze Program, the secondary standards will protect against major PM welfare effects, such as visibility impairment, soiling, and materials damage.
PM2.5 composition. PM2.5 consists of those particles that are less than 2.5 micrometers in diameter. They are also referred to as "fine" particles, while those between 2.5 and 10 µ m are known as "coarse" particles. Fine particles result from fuel combustion from motor vehicles, power generation, and industrial facilities, and from residential fireplaces and wood stoves. Fine particles can also be formed in the atmosphere by the transformation of gaseous emissions such as SO2, NOx, and VOCs. Coarse particles are generally emitted from sources such as vehicles traveling on unpaved roads, materials handling, crushing and grinding operations, and windblown dust.
Goals of PM2.5 monitoring. The goal of the PM2.5 monitoring program is to provide ambient data that support the nation's air quality programs, including both mass measurements and chemically resolved, or speciated, data. Data from this program will be used for PM2.5 NAAQS comparisons, development and tracking of implementation plans, assessments for regional haze, and assistance for studies of health effects, and other ambient PM research activities.
Key reference: U.S. EPA, 1999

August 1999 PM Data Analysis Workbook: Introduction 3
PM Data Analysis Workbook: Design Goals
• Relevant. The workbook should contain material that the State PM Data Analysts need and omit material that they don’t need.
• Technically sound. The workbook should be prepared and agreed upon by experienced PM analysts.
• Educational. The workbook content should be presented in a manner that State PM Data Analysts can learn relevant new PM analyses.
• Practical. Beyond theory, the workbook should contain practical advice and access to examples, tools and methods.
• Gateway. The core workbook should be a gateway to additional on-line resources.
• Evolving. The on-line and hard copy workbooks should improve in time through feedback from the user and producer communities.
August 1999 PM Data Analysis Workbook: Introduction 4
Why PM Data Analysis by the States?• There is an ever-growing data vs. analysis imbalance in favor of data
collection.
• The new PM2.5 regulations will further increase the need to better understand the nature, causes, effects, and reduction strategies for PM.
• States collecting data have unique 'local' perspectives on data quality, meteorology, and sources, and in articulating policy-relevant data analysis questions. States also face:
– large, complex new PM2.5 data quantities,
– large uncertainties about causes and effects,
– immature nature and inherent complexity of analysis techniques,
– importance of both local and transport sources for PM2.5, and
– connections between PM2.5, visibility, ozone, climate change, and toxics.
• Collaborative data analysis is needed, to develop and support linkages between:
– data analysis 'experts', 'novices' and 'beginners'
– data analysts and modelers, health researchers, and policymakers
– multiple states, regions, nations, environmental groups & industrial stakeholders
August 1999 PM Data Analysis Workbook: Introduction 5
Workbook Content
• Introduction
• Ensuring High Quality Data
• Quantifying PM NAAQS Attainment Status
• Characterizing Ambient PM Concentrations and Processes
• Quantifying Trends in PM and its Precursors
• Quantifying the Contribution of Important Sources to PM Concentrations
• Evaluating PM and Precursor Emission Inventories
• Identifying and Quantifying the Potential for Control Strategies in Helping Attain the Standard
• Using PM Data to Assess Visibility
• Glossary
• References
August 1999 PM Data Analysis Workbook: Introduction 6
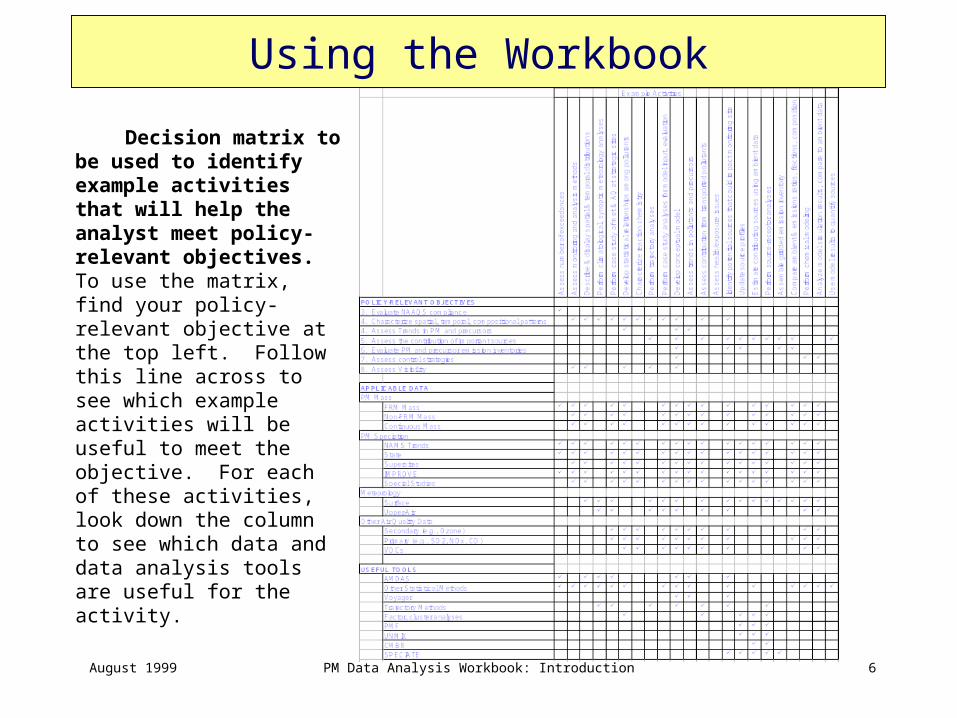
Using the Workbook
Decision matrix to be used to identify example activities that will help the analyst meet policy-relevant objectives. To use the matrix, find your policy-relevant objective at the top left. Follow this line across to see which example activities will be useful to meet the objective. For each of these activities, look down the column to see which data and data analysis tools are useful for the activity.
August 1999 PM Data Analysis Workbook: Introduction 7
PM2.5 Emission Sources
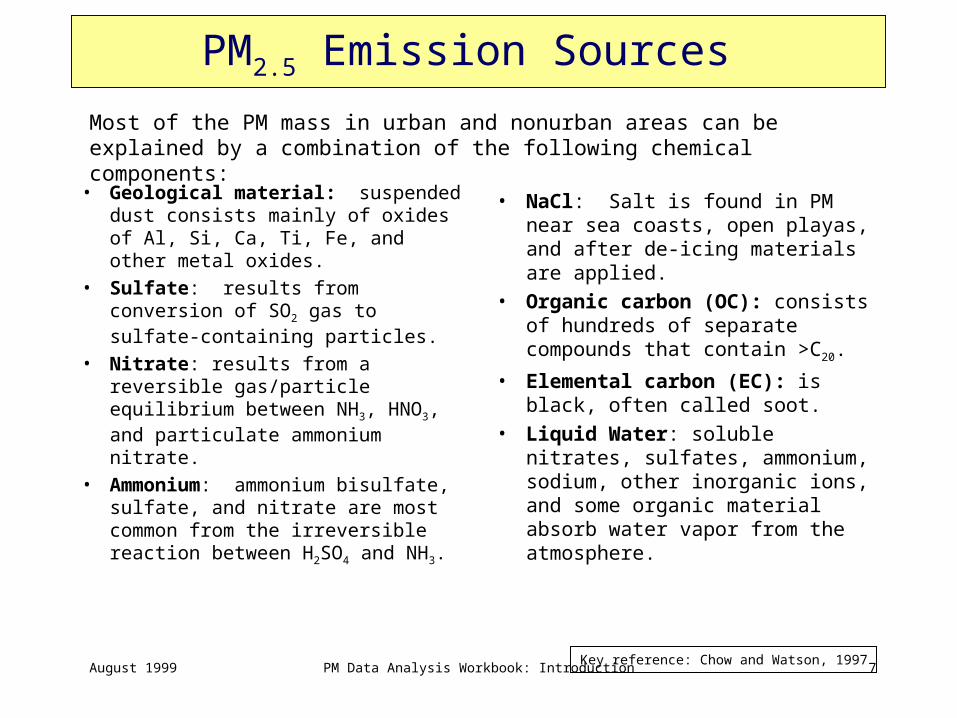
Key reference: Chow and Watson, 1997
• Geological material: suspended dust consists mainly of oxides of Al, Si, Ca, Ti, Fe, and other metal oxides.
• Sulfate: results from conversion of SO2 gas to sulfate-containing particles.
• Nitrate: results from a reversible gas/particle equilibrium between NH3, HNO3, and particulate ammonium nitrate.
• Ammonium: ammonium bisulfate, sulfate, and nitrate are most common from the irreversible reaction between H2SO4 and NH3.
Most of the PM mass in urban and nonurban areas can be explained by a combination of the following chemical components:
• NaCl: Salt is found in PM near sea coasts, open playas, and after de-icing materials are applied.
• Organic carbon (OC): consists of hundreds of separate compounds that contain >C20.
• Elemental carbon (EC): is black, often called soot.
• Liquid Water: soluble nitrates, sulfates, ammonium, sodium, other inorganic ions, and some organic material absorb water vapor from the atmosphere.
August 1999 PM Data Analysis Workbook: Introduction 8
Common Emission Source Profiles
August 1999 PM Data Analysis Workbook: Introduction 9
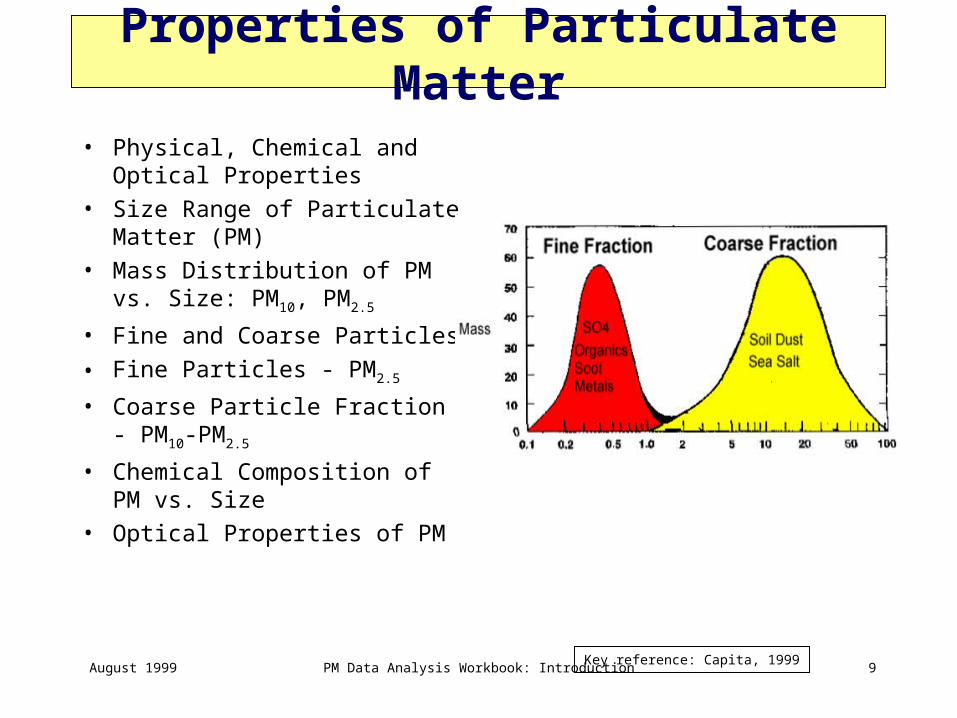
Properties of Particulate Matter
• Physical, Chemical and Optical Properties
• Size Range of Particulate Matter (PM)
• Mass Distribution of PM vs. Size: PM10, PM2.5
• Fine and Coarse Particles
• Fine Particles - PM2.5
• Coarse Particle Fraction - PM10-PM2.5
• Chemical Composition of PM vs. Size
• Optical Properties of PM
Key reference: Capita, 1999
August 1999 PM Data Analysis Workbook: Introduction 10
Physical, Chemical and Optical Properties
• PM is characterized by its physical, chemical, and optical properties• Physical properties include particle size and shape. Particle size refers to
particle diameter or ‘equivalent’ diameter for odd-shaped particles. Particles may be liquid droplets, regular or irregular shaped crystals, or aggregates of odd shape.
• Particle chemical composition may vary including dilute water solutions of acids or salts, organic liquids, earth's crust materials (dust), soot (unburned carbon), and toxic metals.
• Optical properties determine the visual appearance of dust, smoke and haze and include light extinction, scattering and absorption . The optical properties are determined by the physical and chemical properties of the ambient PM.
• Each PM source type produces particles with a specific physical, chemical and optical signature. Hence, PM may be viewed as several pollutants since each PM type has its own properties, and sources and may require different controls.
August 1999 PM Data Analysis Workbook: Introduction 11
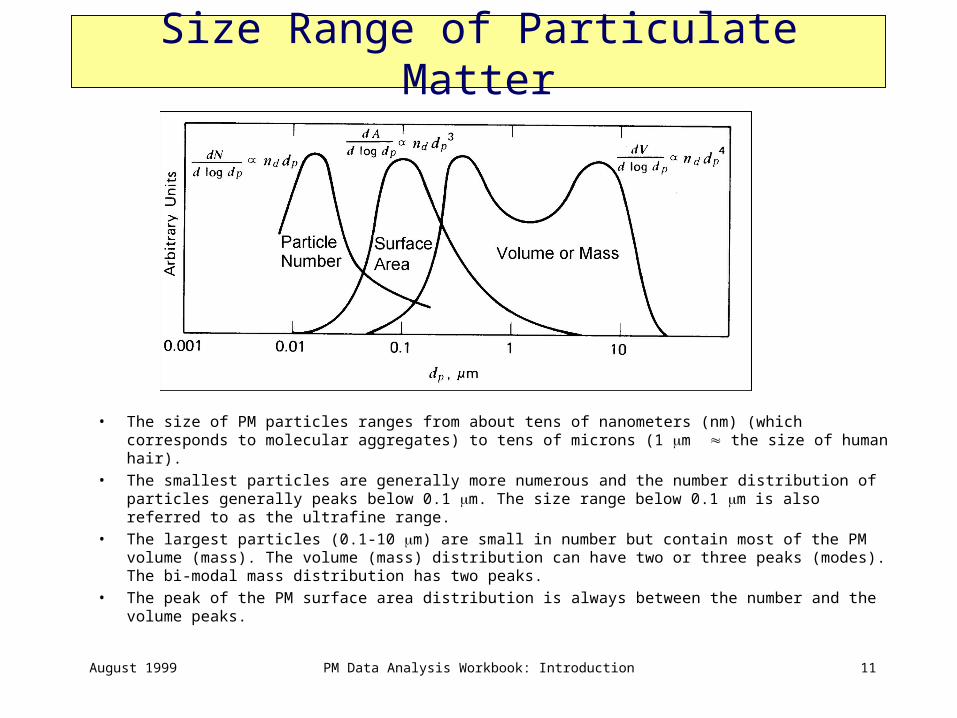
Size Range of Particulate Matter
• The size of PM particles ranges from about tens of nanometers (nm) (which corresponds to molecular aggregates) to tens of microns (1 m the size of human hair).
• The smallest particles are generally more numerous and the number distribution of particles generally peaks below 0.1 m. The size range below 0.1 m is also referred to as the ultrafine range.
• The largest particles (0.1-10 m) are small in number but contain most of the PM volume (mass). The volume (mass) distribution can have two or three peaks (modes). The bi-modal mass distribution has two peaks.
• The peak of the PM surface area distribution is always between the number and the volume peaks.
August 1999 PM Data Analysis Workbook: Introduction 12
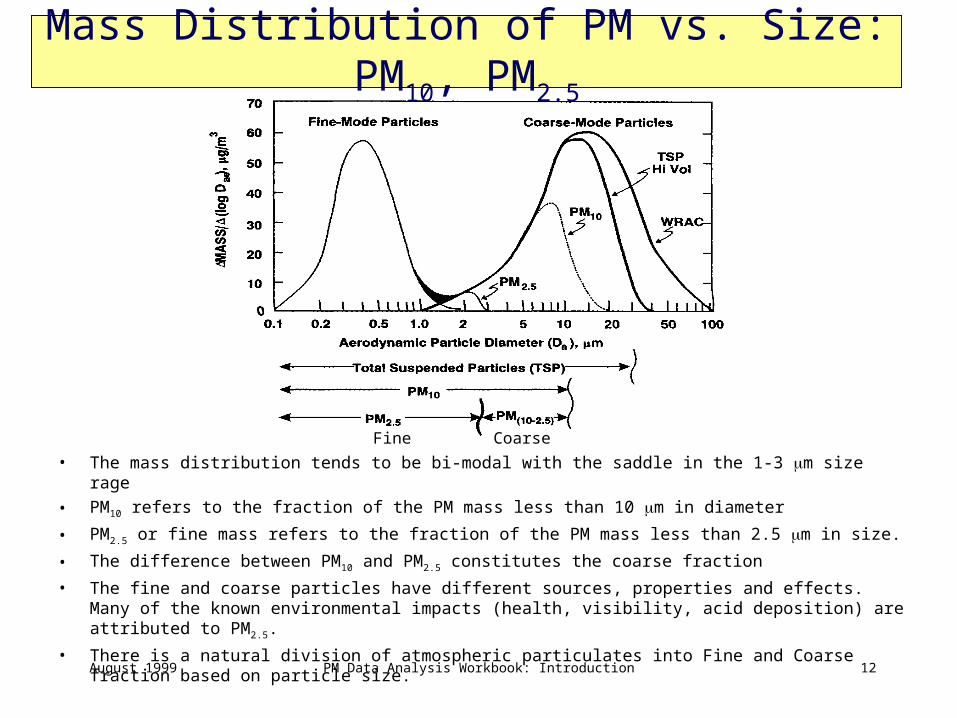
Mass Distribution of PM vs. Size: PM10, PM2.5
• The mass distribution tends to be bi-modal with the saddle in the 1-3 m size rage
• PM10 refers to the fraction of the PM mass less than 10 m in diameter
• PM2.5 or fine mass refers to the fraction of the PM mass less than 2.5 m in size.
• The difference between PM10 and PM2.5 constitutes the coarse fraction
• The fine and coarse particles have different sources, properties and effects. Many of the known environmental impacts (health, visibility, acid deposition) are attributed to PM2.5.
• There is a natural division of atmospheric particulates into Fine and Coarse fraction based on particle size.
Fine Coarse
August 1999 PM Data Analysis Workbook: Introduction 13
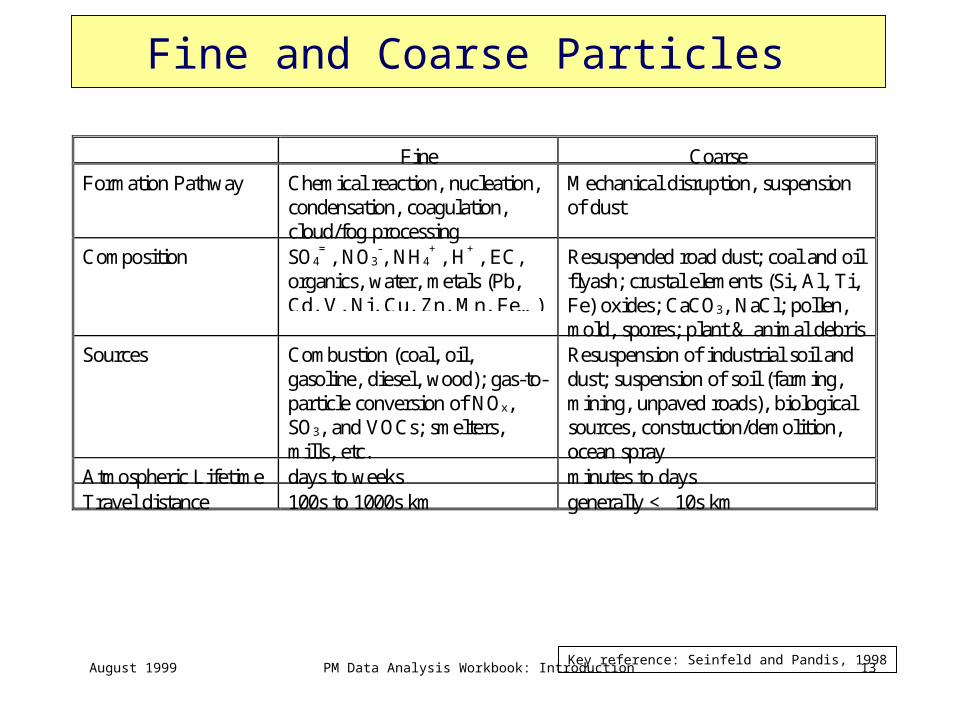
Fine and Coarse Particles
Key reference: Seinfeld and Pandis, 1998
Fine CoarseFormation Pathway Chemical reaction, nucleation,
condensation, coagulation,cloud/fog processing
Mechanical disruption, suspensionof dust
Composition SO4=, NO3
-, NH4+, H+, EC,
organics, water, metals (Pb,Cd, V, Ni, Cu, Zn, Mn, Fe…)
Resuspended road dust; coal and oilflyash; crustal elements (Si, Al, Ti,Fe) oxides; CaCO3, NaCl; pollen,mold, spores; plant & animal debris
Sources Combustion (coal, oil,gasoline, diesel, wood); gas-to-particle conversion of NOx,SO3, and VOCs; smelters,mills, etc.
Resuspension of industrial soil anddust; suspension of soil (farming,mining, unpaved roads), biologicalsources, construction/demolition,ocean spray
Atmospheric Lifetime days to weeks minutes to daysTravel distance 100s to 1000s km generally < 10s km
August 1999 PM Data Analysis Workbook: Introduction 14
Fine Particles - PM2.5
• Fine particles ( 2.5 m) result primarily from combustion of fossil fuels in industrial boilers, automobiles, and residential heating systems.
• A significant fraction of the PM2.5 mass over the US is produced in the atmosphere through gas-particle conversion of precursor gases such as sulfur oxides, nitrogen oxides, organics, and ammonia. The resulting secondary PM products are sulfates, nitrates, organics, and ammonium.
• Some PM2.5 is emitted as primary emissions from industrial activities and motor vehicles including soot (unburned carbon), trace metals, and oily residues.
• Fine particles are mostly droplets except for soot which is in the form of chain aggregates.
• Over the industrialized regions of the US, anthropogenic emissions from fossil fuel combustion contribute most of the PM2.5. In remote areas, biomass burning, windblown dust, and sea salt also contribute.
• Fine particles can remain suspended for long periods (days to weeks) and contribute to ambient PM levels hundreds of km away from where they are formed.
August 1999 PM Data Analysis Workbook: Introduction 15
Coarse Particles - PM10-PM2.5
• Coarse particles (2.5 - 10 m) are generated by mechanical processes that break down crustal material into dust that can be suspended by the wind, agricultural practices, and vehicular traffic on unpaved roads.
• Coarse particles are primary in that they are emitted as windblown dust and sea spray in coastal areas. Anthropogenic coarse particle sources include flyash from coal combustion and road dust from automobiles.
• The chemical composition of the coarse particle fraction is similar to that of the earth's crust or the sea but sometimes coarse particles also carry trace metals and nitrates.
• Coarse particles are removed from the atmosphere by gravitational settling, impaction to surfaces, and scavenging by precipitation. Their atmospheric residence time is generally less than a day, and their typical transport distance is below a few hundred km. Some dust storms tend to lift the dust to several km altitude, which increases the transport distance to many thousand km.
Key reference: Albritton and Greenbaum, 1998
August 1999 PM Data Analysis Workbook: Introduction 16
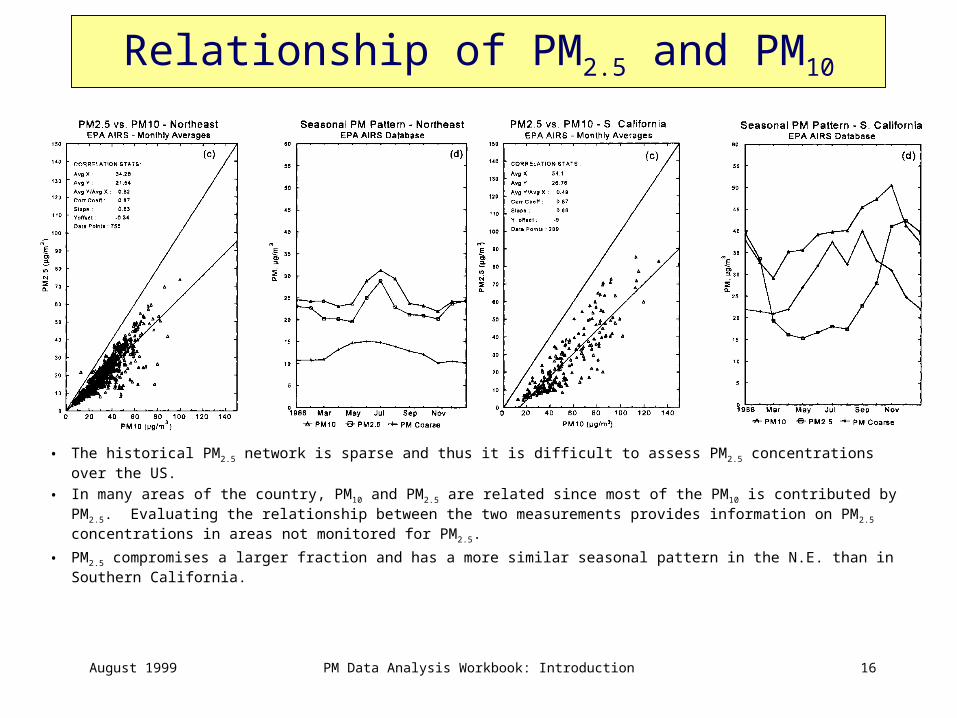
Relationship of PM2.5 and PM10
• The historical PM2.5 network is sparse and thus it is difficult to assess PM2.5 concentrations over the US.
• In many areas of the country, PM10 and PM2.5 are related since most of the PM10 is contributed by PM2.5. Evaluating the relationship between the two measurements provides information on PM2.5 concentrations in areas not monitored for PM2.5.
• PM2.5 compromises a larger fraction and has a more similar seasonal pattern in the N.E. than in Southern California.
August 1999 PM Data Analysis Workbook: Introduction 17
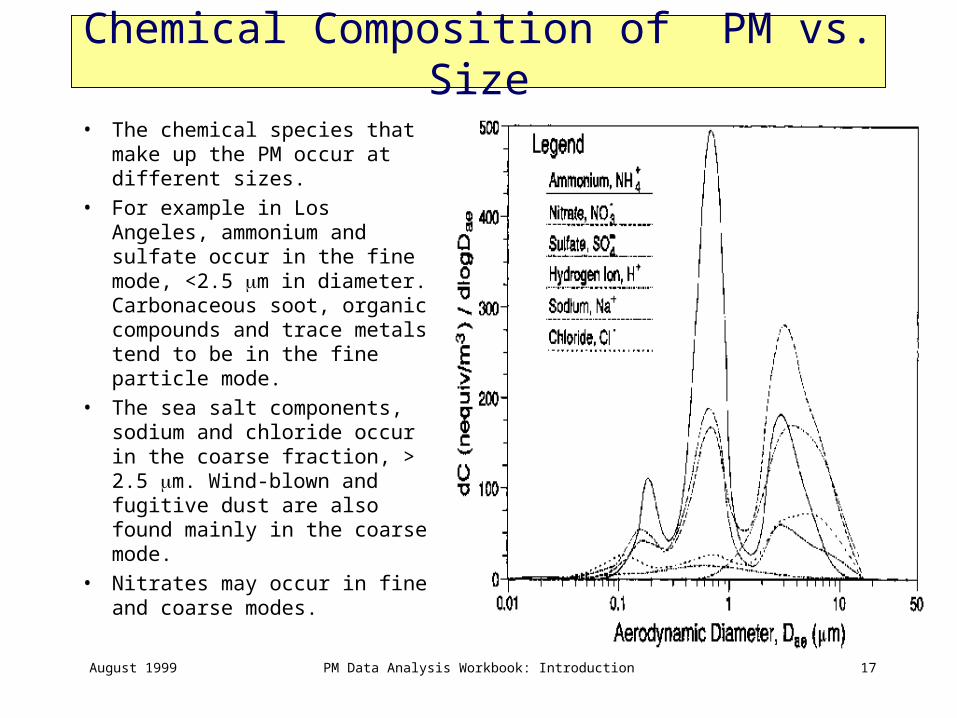
Chemical Composition of PM vs. Size
• The chemical species that make up the PM occur at different sizes.
• For example in Los Angeles, ammonium and sulfate occur in the fine mode, <2.5 m in diameter. Carbonaceous soot, organic compounds and trace metals tend to be in the fine particle mode.
• The sea salt components, sodium and chloride occur in the coarse fraction, > 2.5 m. Wind-blown and fugitive dust are also found mainly in the coarse mode.
• Nitrates may occur in fine and coarse modes.
August 1999 PM Data Analysis Workbook: Introduction 18
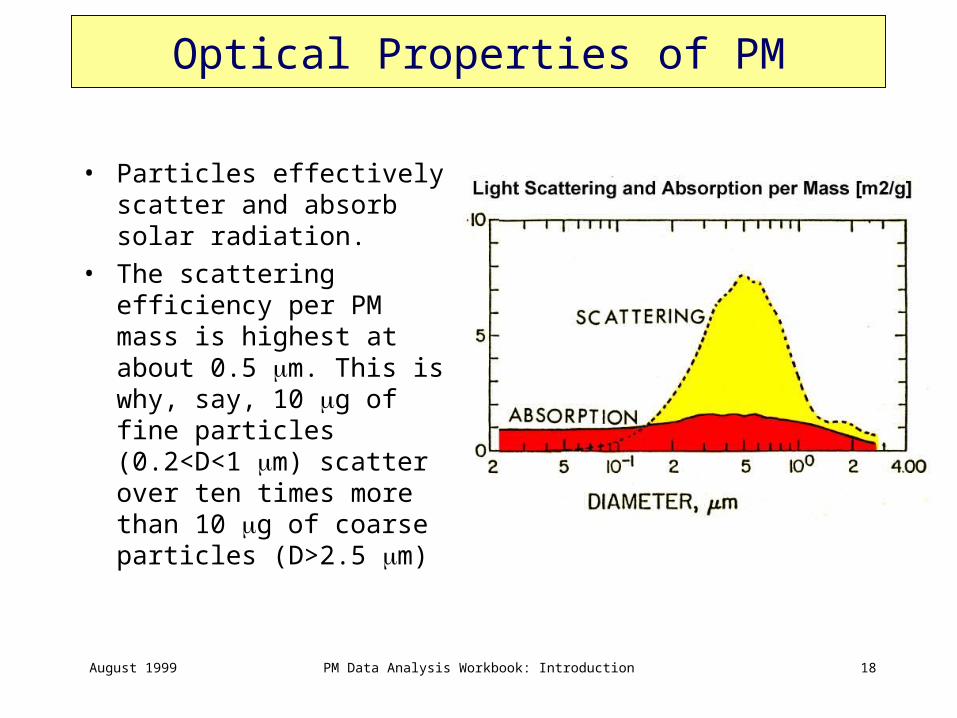
Optical Properties of PM
• Particles effectively scatter and absorb solar radiation.
• The scattering efficiency per PM mass is highest at about 0.5 m. This is why, say, 10 g of fine particles (0.2<D<1 m) scatter over ten times more than 10 g of coarse particles (D>2.5 m)
August 1999 PM Data Analysis Workbook: Introduction 19
•Sulfate Formation in the Atmosphere
•Sulfate Formation in Clouds
•Season SO2-Sulfate Transformation rate
•Residence Time of Sulfur and Organics
•Internal and External Mixtures of Particles
•Need to add nitrate discussion, ammonium discussion
PM Formation in the Atmosphere
Key reference: Capita, 1999
August 1999 PM Data Analysis Workbook: Introduction 20
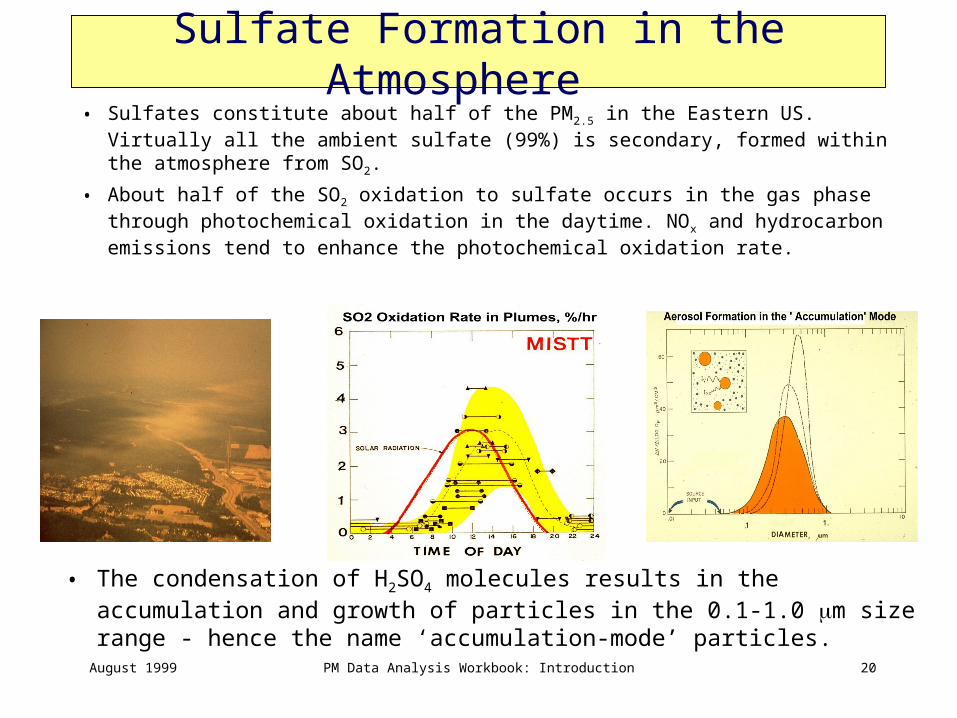
• The condensation of H2SO4 molecules results in the accumulation and growth of particles in the 0.1-1.0 m size range - hence the name ‘accumulation-mode’ particles.
Sulfate Formation in the Atmosphere • Sulfates constitute about half of the PM2.5 in the Eastern US. Virtually all the
ambient sulfate (99%) is secondary, formed within the atmosphere from SO2.
• About half of the SO2 oxidation to sulfate occurs in the gas phase through photochemical oxidation in the daytime. NOx and hydrocarbon emissions tend to enhance the photochemical oxidation rate.
August 1999 PM Data Analysis Workbook: Introduction 21
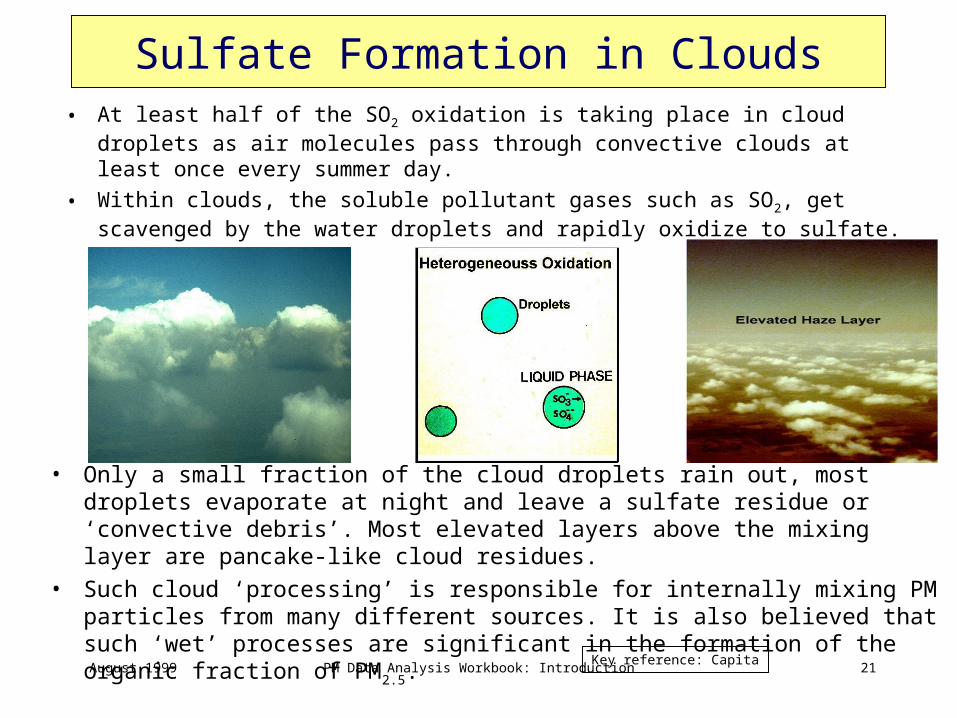
• Only a small fraction of the cloud droplets rain out, most droplets evaporate at night and leave a sulfate residue or ‘convective debris’. Most elevated layers above the mixing layer are pancake-like cloud residues.
• Such cloud ‘processing’ is responsible for internally mixing PM particles from many different sources. It is also believed that such ‘wet’ processes are significant in the formation of the organic fraction of PM2.5.
Sulfate Formation in Clouds• At least half of the SO2 oxidation is taking place in cloud droplets as air molecules
pass through convective clouds at least once every summer day.
• Within clouds, the soluble pollutant gases such as SO2, get scavenged by the water droplets and rapidly oxidize to sulfate.
Key reference: Capita
August 1999 PM Data Analysis Workbook: Introduction 22
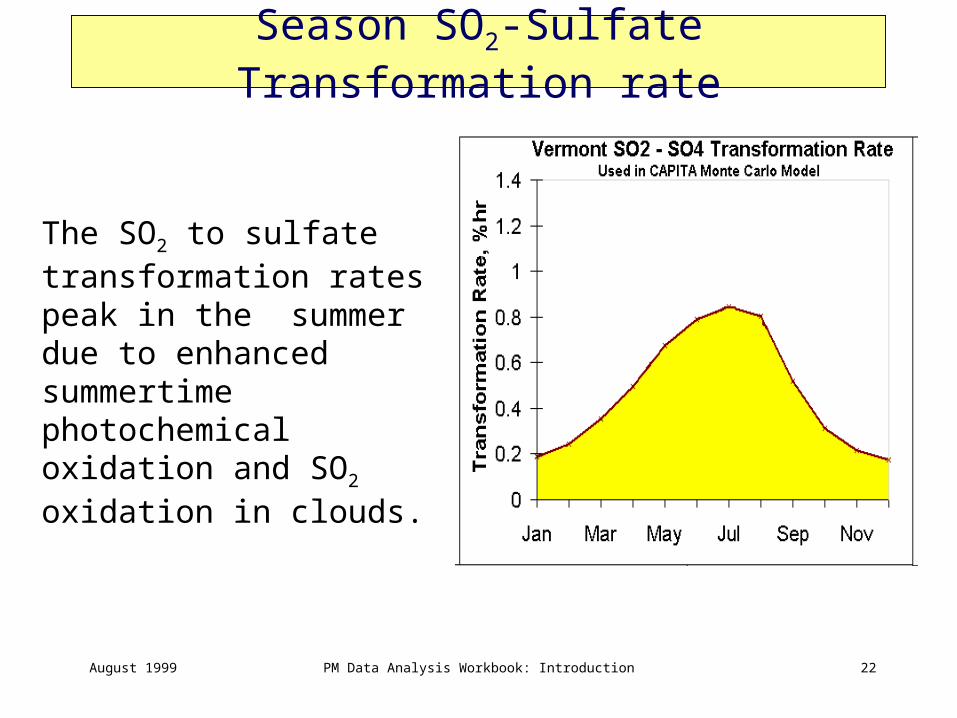
Season SO2-Sulfate Transformation rate
The SO2 to sulfate transformation rates peak in the summer due to enhanced summertime photochemical oxidation and SO2 oxidation in clouds.
August 1999 PM Data Analysis Workbook: Introduction 23
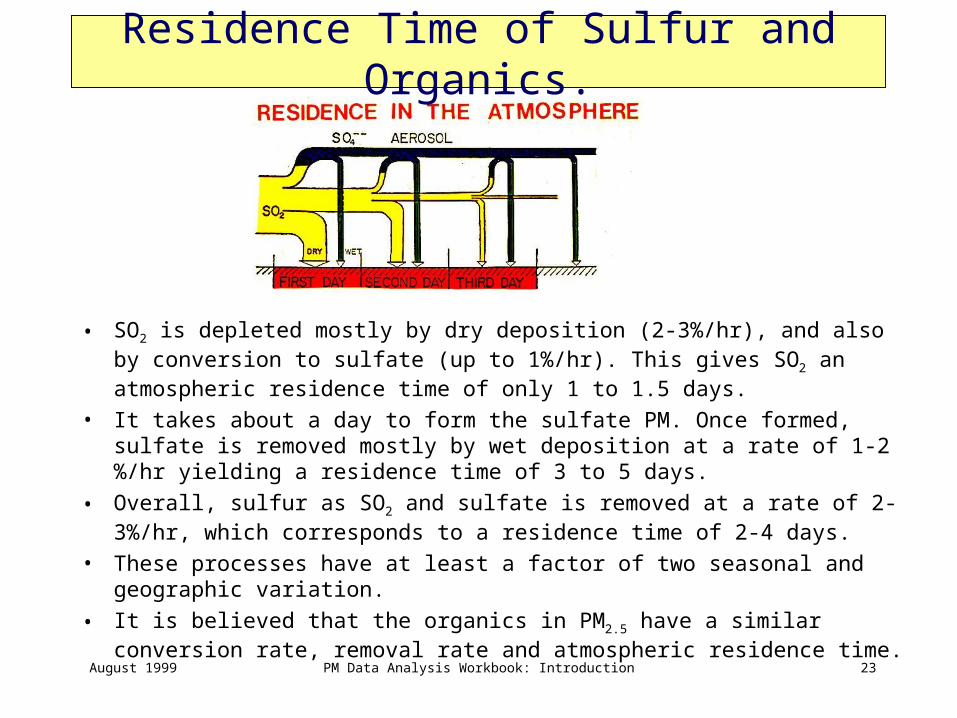
Residence Time of Sulfur and Organics.
• SO2 is depleted mostly by dry deposition (2-3%/hr), and also by conversion to sulfate (up to 1%/hr). This gives SO2 an atmospheric residence time of only 1 to 1.5 days.
• It takes about a day to form the sulfate PM. Once formed, sulfate is removed mostly by wet deposition at a rate of 1-2 %/hr yielding a residence time of 3 to 5 days.
• Overall, sulfur as SO2 and sulfate is removed at a rate of 2-3%/hr, which corresponds to a residence time of 2-4 days.
• These processes have at least a factor of two seasonal and geographic variation.
• It is believed that the organics in PM2.5 have a similar conversion rate, removal rate and atmospheric residence time.
August 1999 PM Data Analysis Workbook: Introduction 24
PM, ozone, and other pollutants
Key reference:
August 1999 PM Data Analysis Workbook: Introduction 25
Atmospheric Transport of PM
• Transport mechanisms
• Influence of transport on source regions
• Plume transport
• Long-range transport
Key reference: Capita, 1999
August 1999 PM Data Analysis Workbook: Introduction 26
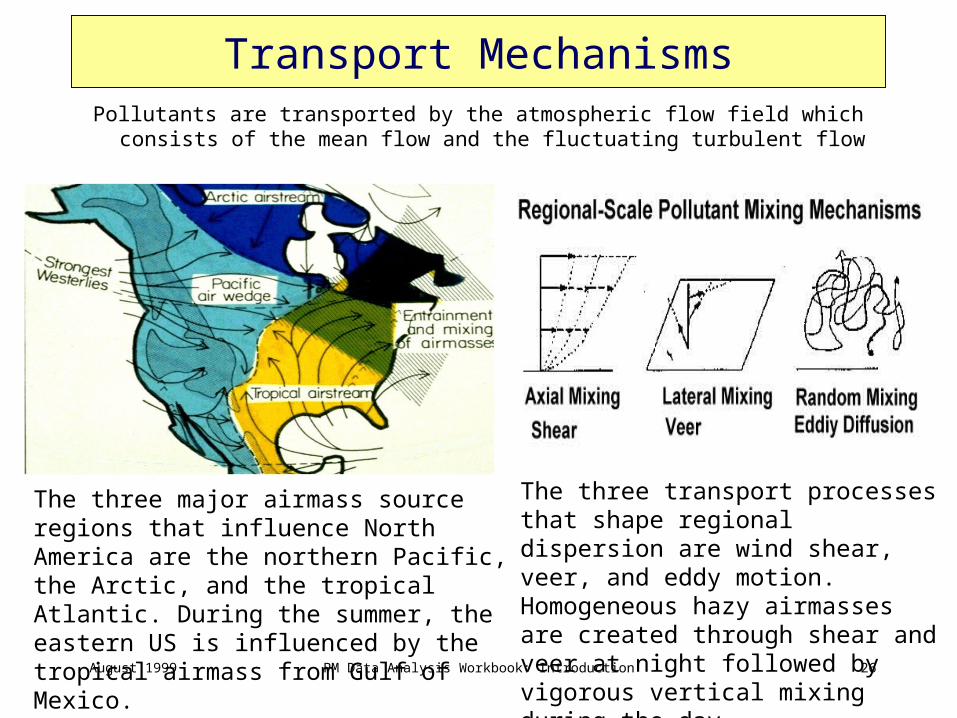
The three major airmass source regions that influence North America are the northern Pacific, the Arctic, and the tropical Atlantic. During the summer, the eastern US is influenced by the tropical airmass from Gulf of Mexico.
The three transport processes that shape regional dispersion are wind shear, veer, and eddy motion. Homogeneous hazy airmasses are created through shear and veer at night followed by vigorous vertical mixing during the day.
Transport MechanismsPollutants are transported by the atmospheric flow field which consists of
the mean flow and the fluctuating turbulent flow
August 1999 PM Data Analysis Workbook: Introduction 27
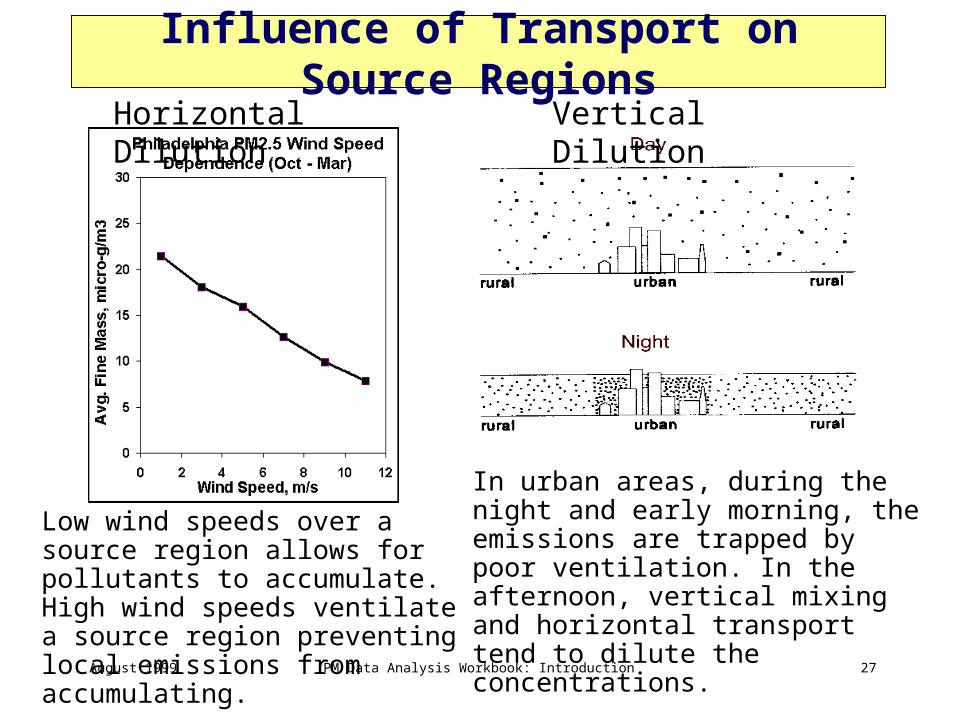
Low wind speeds over a source region allows for pollutants to accumulate. High wind speeds ventilate a source region preventing local emissions from accumulating.
Horizontal Dilution Vertical Dilution
In urban areas, during the night and early morning, the emissions are trapped by poor ventilation. In the afternoon, vertical mixing and horizontal transport tend to dilute the concentrations.
Influence of Transport on Source Regions
August 1999 PM Data Analysis Workbook: Introduction 28
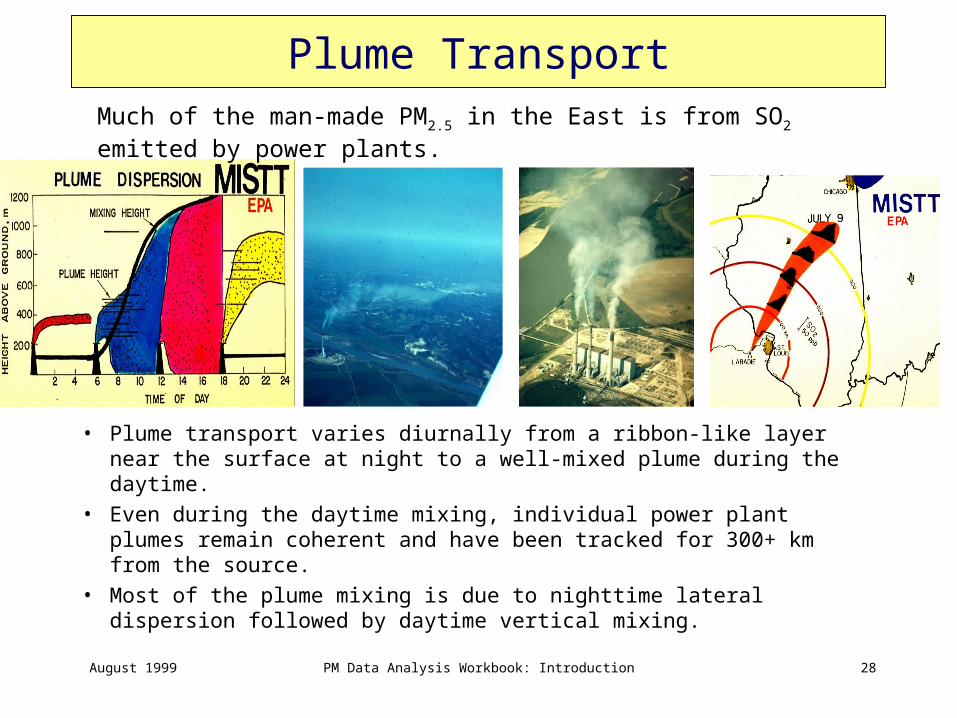
Plume Transport
• Plume transport varies diurnally from a ribbon-like layer near the surface at night to a well-mixed plume during the daytime.
• Even during the daytime mixing, individual power plant plumes remain coherent and have been tracked for 300+ km from the source.
• Most of the plume mixing is due to nighttime lateral dispersion followed by daytime vertical mixing.
Much of the man-made PM2.5 in the East is from SO2 emitted by power plants.
August 1999 PM Data Analysis Workbook: Introduction 29
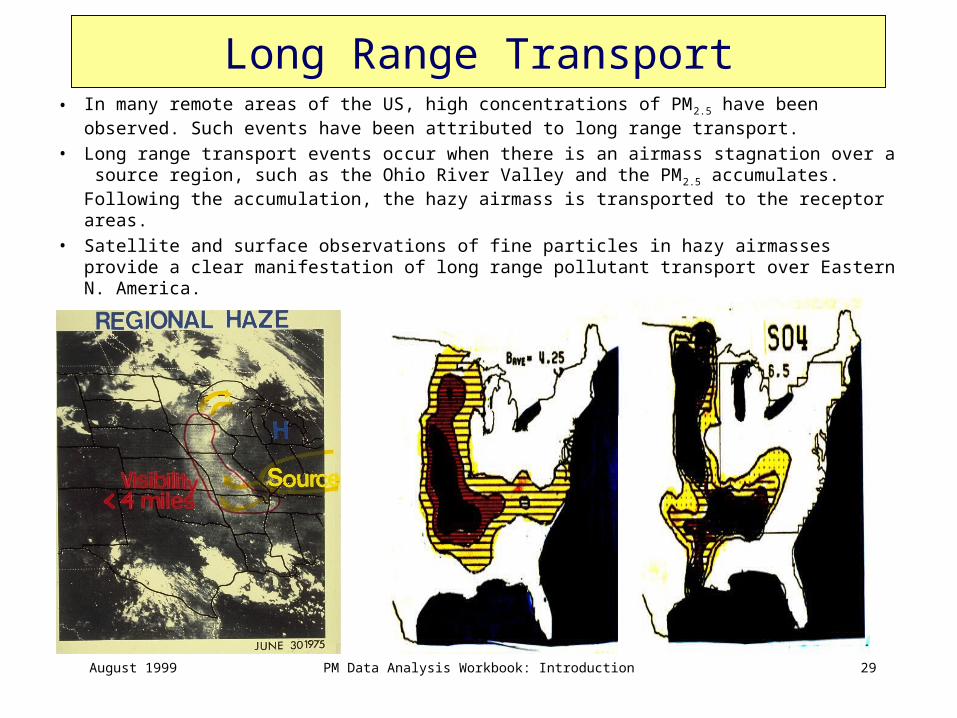
Long Range Transport• In many remote areas of the US, high concentrations of PM2.5 have been observed.
Such events have been attributed to long range transport.• Long range transport events occur when there is an airmass stagnation over a source
region, such as the Ohio River Valley and the PM2.5 accumulates. Following the accumulation, the hazy airmass is transported to the receptor areas.
• Satellite and surface observations of fine particles in hazy airmasses provide a clear manifestation of long range pollutant transport over Eastern N. America.
August 1999 PM Data Analysis Workbook: Introduction 30
Objectives of the PM Monitoring Program
• The primary objective of the PM monitoring program is to provide ambient data that support the Nation’s air quality program objectives:– Assess annual and seasonal spatial
characterization of PM– Perform air quality trends analysis and track
progress of control programs– Develop emission control strategies
Key reference: Homolya et al., 1998
August 1999 PM Data Analysis Workbook: Introduction 31
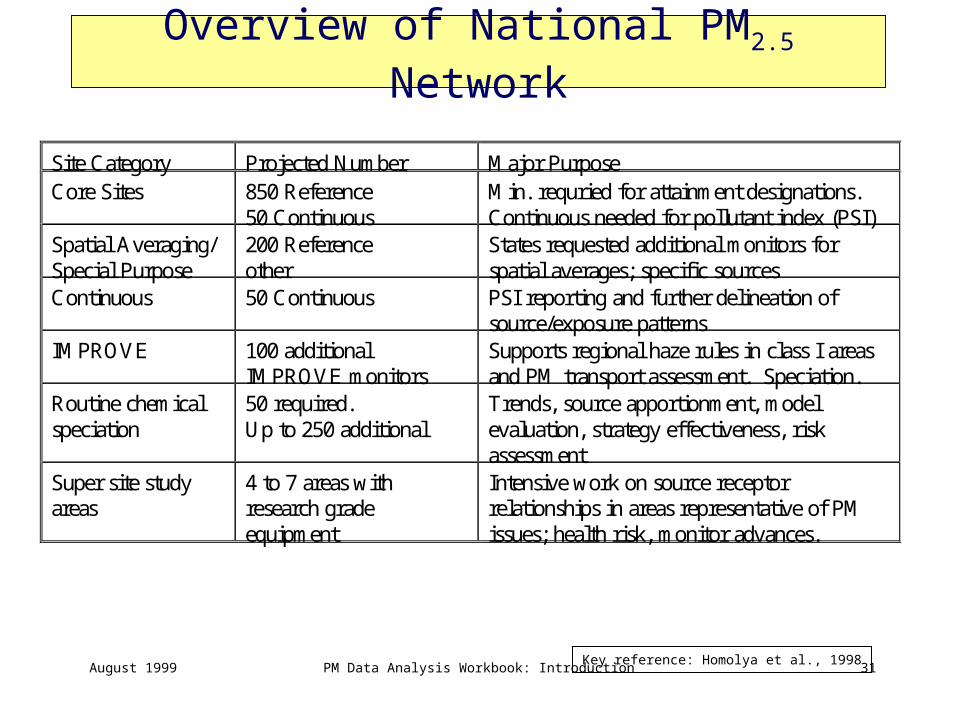
Overview of National PM2.5 Network
Site Category Projected Number Major PurposeCore Sites 850 Reference
50 ContinuousMin. requried for attainment designations.Continuous needed for pollutant index (PSI)
Spatial Averaging/Special Purpose
200 Referenceother
States requested additional monitors forspatial averages; specific sources
Continuous 50 Continuous PSI reporting and further delineation ofsource/exposure patterns
IMPROVE 100 additionalIMPROVE monitors
Supports regional haze rules in class I areasand PM transport assessment. Speciation.
Routine chemicalspeciation
50 required.Up to 250 additional
Trends, source apportionment, modelevaluation, strategy effectiveness, riskassessment
Super site studyareas
4 to 7 areas withresearch gradeequipment
Intensive work on source receptorrelationships in areas representative of PMissues; health risk, monitor advances.
Key reference: Homolya et al., 1998
August 1999 PM Data Analysis Workbook: Introduction 32
Implementation update
Key reference:
• maps?
• implementation schedule?
August 1999 PM Data Analysis Workbook: Introduction 33
Sampling Schedule
Key reference:
August 1999 PM Data Analysis Workbook: Introduction 34Key reference:
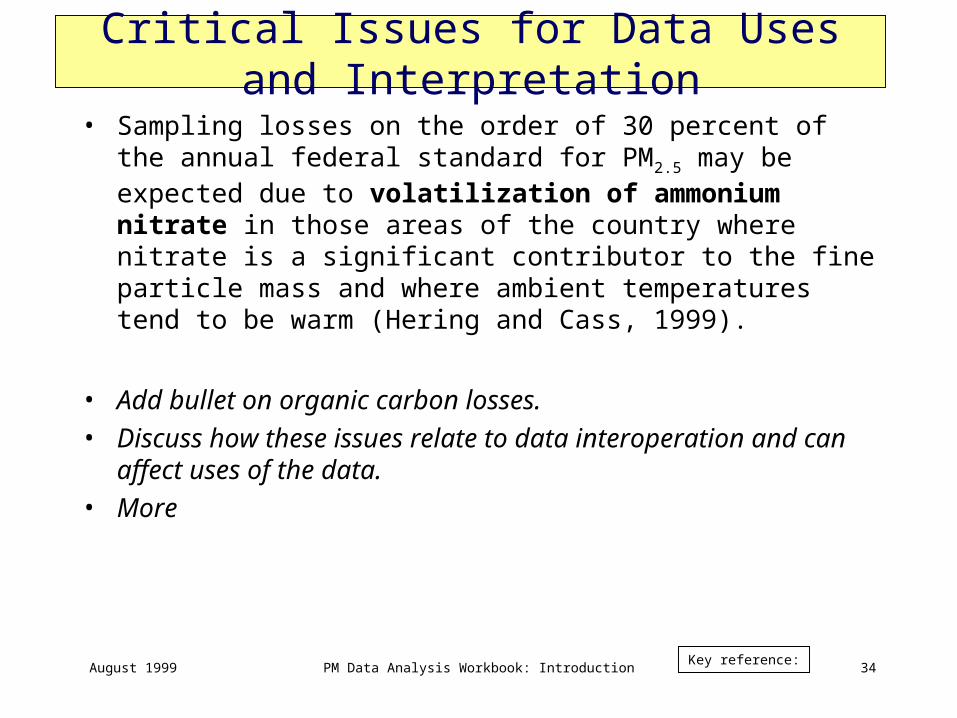
Critical Issues for Data Uses and Interpretation
• Sampling losses on the order of 30 percent of the annual federal standard for PM2.5 may be expected due to volatilization of ammonium nitrate in those areas of the country where nitrate is a significant contributor to the fine particle mass and where ambient temperatures tend to be warm (Hering and Cass, 1999).
• Add bullet on organic carbon losses.
• Discuss how these issues relate to data interoperation and can affect uses of the data.
• More
August 1999 PM Data Analysis Workbook: Introduction 35
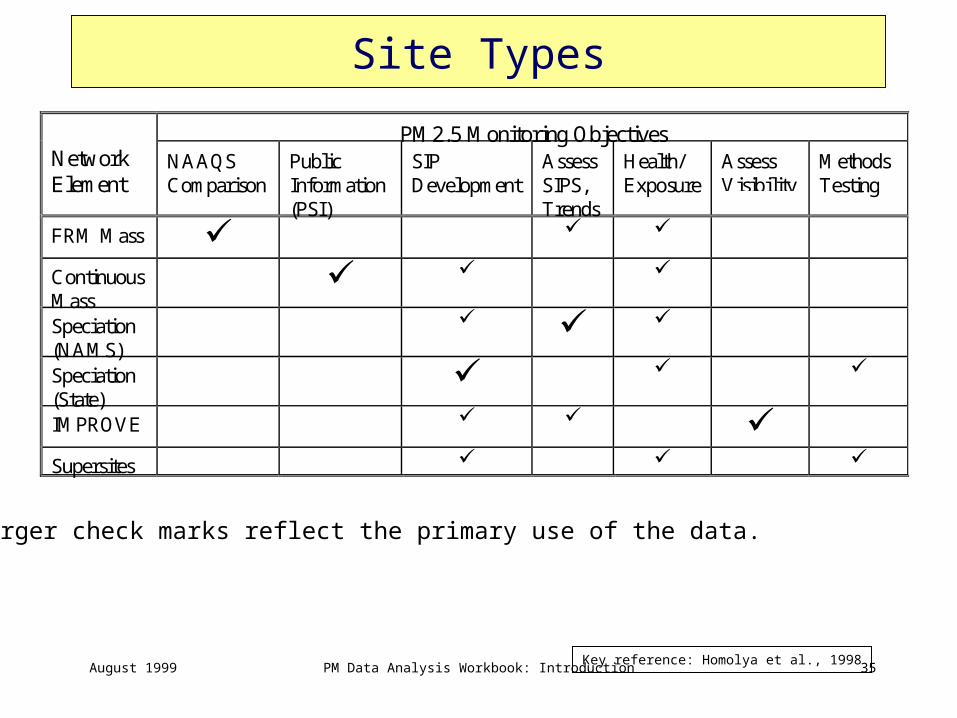
Site Types
PM2.5 Monitoring ObjectivesNetworkElement
NAAQSComparison
PublicInformation(PSI)
SIPDevelopment
AssessSIPS,Trends
Health/Exposure
AssessVisibility
MethodsTesting
FRM Mass
ContinuousMass
Speciation(NAMS)
Speciation(State)
IMPROVE Supersites
Key reference: Homolya et al., 1998
The larger check marks reflect the primary use of the data.
August 1999 PM Data Analysis Workbook: Introduction 36
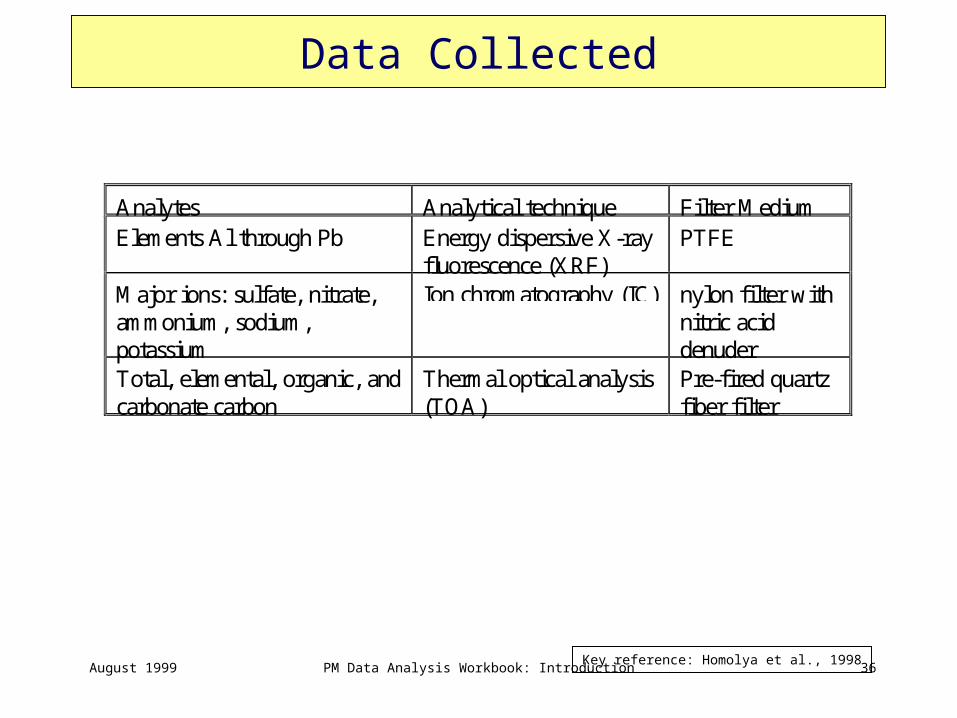
Data Collected
Analytes Analytical technique Filter MediumElements Al through Pb Energy dispersive X-ray
fluorescence (XRF)PTFE
Major ions: sulfate, nitrate,ammonium, sodium,potassium
Ion chromatography (IC) nylon filter withnitric aciddenuder
Total, elemental, organic, andcarbonate carbon
Thermal optical analysis(TOA)
Pre-fired quartzfiber filter
Key reference: Homolya et al., 1998
August 1999 PM Data Analysis Workbook: Introduction 37
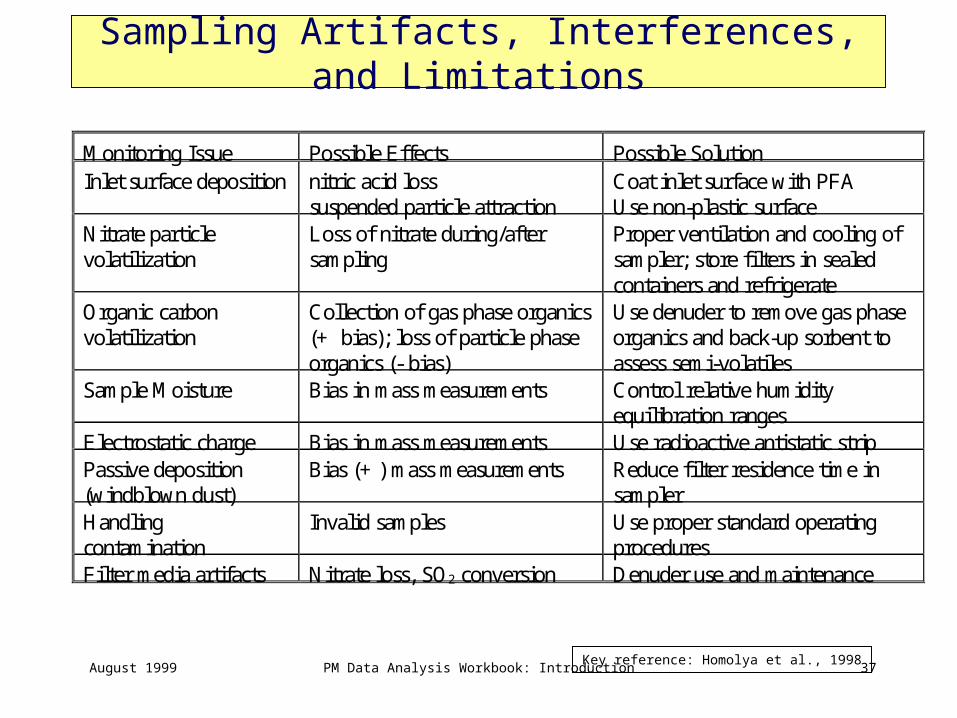
Sampling Artifacts, Interferences, and Limitations
Monitoring Issue Possible Effects Possible SolutionInlet surface deposition nitric acid loss
suspended particle attractionCoat inlet surface with PFAUse non-plastic surface
Nitrate particlevolatilization
Loss of nitrate during/aftersampling
Proper ventilation and cooling ofsampler; store filters in sealedcontainers and refrigerate
Organic carbonvolatilization
Collection of gas phase organics(+ bias); loss of particle phaseorganics (- bias)
Use denuder to remove gas phaseorganics and back-up sorbent toassess semi-volatiles
Sample Moisture Bias in mass measurements Control relative humidityequilibration ranges
Electrostatic charge Bias in mass measurements Use radioactive antistatic stripPassive deposition(windblown dust)
Bias (+) mass measurements Reduce filter residence time insampler
Handlingcontamination
Invalid samples Use proper standard operatingprocedures
Filter media artifacts Nitrate loss, SO2 conversion Denuder use and maintenance
Key reference: Homolya et al., 1998
August 1999 PM Data Analysis Workbook: Introduction 38
Motivating Examples
• To be added as we complete the other sections - these will be examples that illustrate key PM data analysis and validation issues.
August 1999 PM Data Analysis Workbook: Introduction 39
References
Albritton D.L. and Greenbaum D.S. (1998) Atmospheric observations: Helping build the scientific basis for decisions related to airborne particulate matter.
Chow J.C. (1995) Measurement methods to determine compliance with ambient air quality standards for suspended particles. J. Air & Waste Manage., 45, pp. 320-382.
Chow J.C. and Watson J.G. (1997) Guideline on speciated particulate monitoring. Report prepared by Desert Research Institute and available at http://www.epa.gov/ttn/amtic/files/ambient/pm25/spec/drispec.pdf
Hering S. and Cass G. (1999) the magnitude of bias in the measurement of PM2.5 arising from volatilization of particulate nitrate from Teflon filters. J. Air & Waste Manage. Assoc., 49, pp. 725-733.
Homolya J.B., Rice J., Scheffe R.D. (1998) PM2.5 speciation - objectives, requirements, and approach. Presentation. September.
Seinfeld J.H. and Pandis S.N. (1998) Atmospheric chemistry and physics: from air pollution to climate change. John Wiley and Sons, Inc., New York, New York.
U.S. EPA (1999) Particulate matter (PM2.5) speciation guidance document.
U.S. EPA (1999) General Information regarding PM2.5 data analysis posted on the EPA Internet web site http://www.epa.gov/oar/oaqps/pm25/general.html


![01-Introduction1 [Compatibility Mode]](https://img.pdfslide.us/doc/110x75/577d21b51a28ab4e1e95c7b3/01-introduction1-compatibility-mode.jpg)


![Introduction1 [Compatibility Mode]](https://img.pdfslide.us/doc/110x75/577cd5b71a28ab9e789b74c4/introduction1-compatibility-mode.jpg)