Embed Size (px)
Citation preview

Salary Deferral Plan for Employees of Coweta County, Georgia
Employee Matching Plan of Coweta County, Georgia
Plans Demographic Information
June 30, 2017
August 10, 2017
BB&T Retirement &
Institutional
Services
Coweta County, GeorgiaDefined Contribution Plans Summary
Salary Deferral
Plan
Matching Plan
Salary Deferral
Plan
Matching Plan
Salary Deferral
Plan
Matching Plan
Total Plan Assets & ParticipantsTotal Plan Assets $4,602,784 $3,326,562 $5,669,239 $4,253,826 $7,448,520 $5,606,247 Total Active Participant Accounts 397 401 440 440 496 497Total Terminated Participant Accounts 54 64 42 39 58 38Average Account Balance $10,390 $7,442 $11,204 $8,374 $15,017 $11,280
Asset Allocation Total Participants 100% account in 1 fund, excluding target date 13 4 13 15 14 13
Total Participants using target date funds 22 36 117 113 164 179Total Participants exclusively using 1 target date fund 9 8 76 82 114 113
Average number of funds held by a participant 5 5 5 4 5 5
ProNvest Advisory ServicesParticipants ProNvest Planner – fully utilized 1 1 17 16 28 21Number of ProNvest hires 1 1 11 11 25 25Total Assets under Management $31,891 $18,800 $348,258 $250,990 $697,565 $524,396
12/31/14 First Quarter Ended with BB&T 6/30/16 Plan Year End 6/30/17Quarter End
1
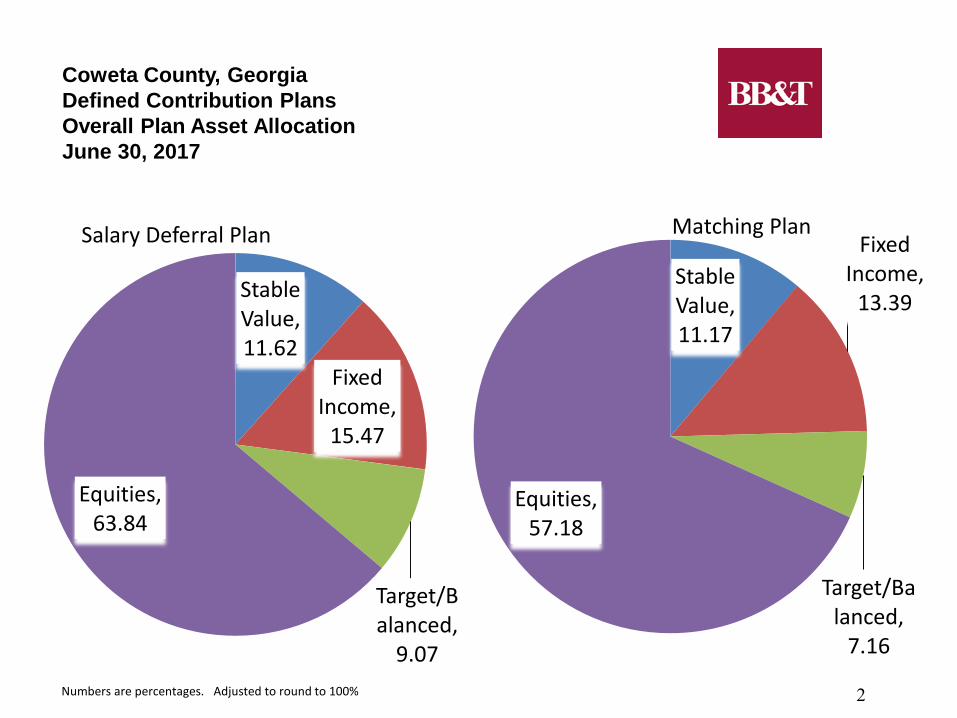
Stable Value, 11.17
Fixed Income,
13.39
Target/Balanced,
7.16
Equities, 57.18
Matching Plan
Stable Value, 11.62
Fixed Income,
15.47
Target/Balanced,
9.07
Equities, 63.84
Coweta County, Georgia Defined Contribution Plans Overall Plan Asset Allocation June 30, 2017
Salary Deferral Plan
Numbers are percentages. Adjusted to round to 100% 2
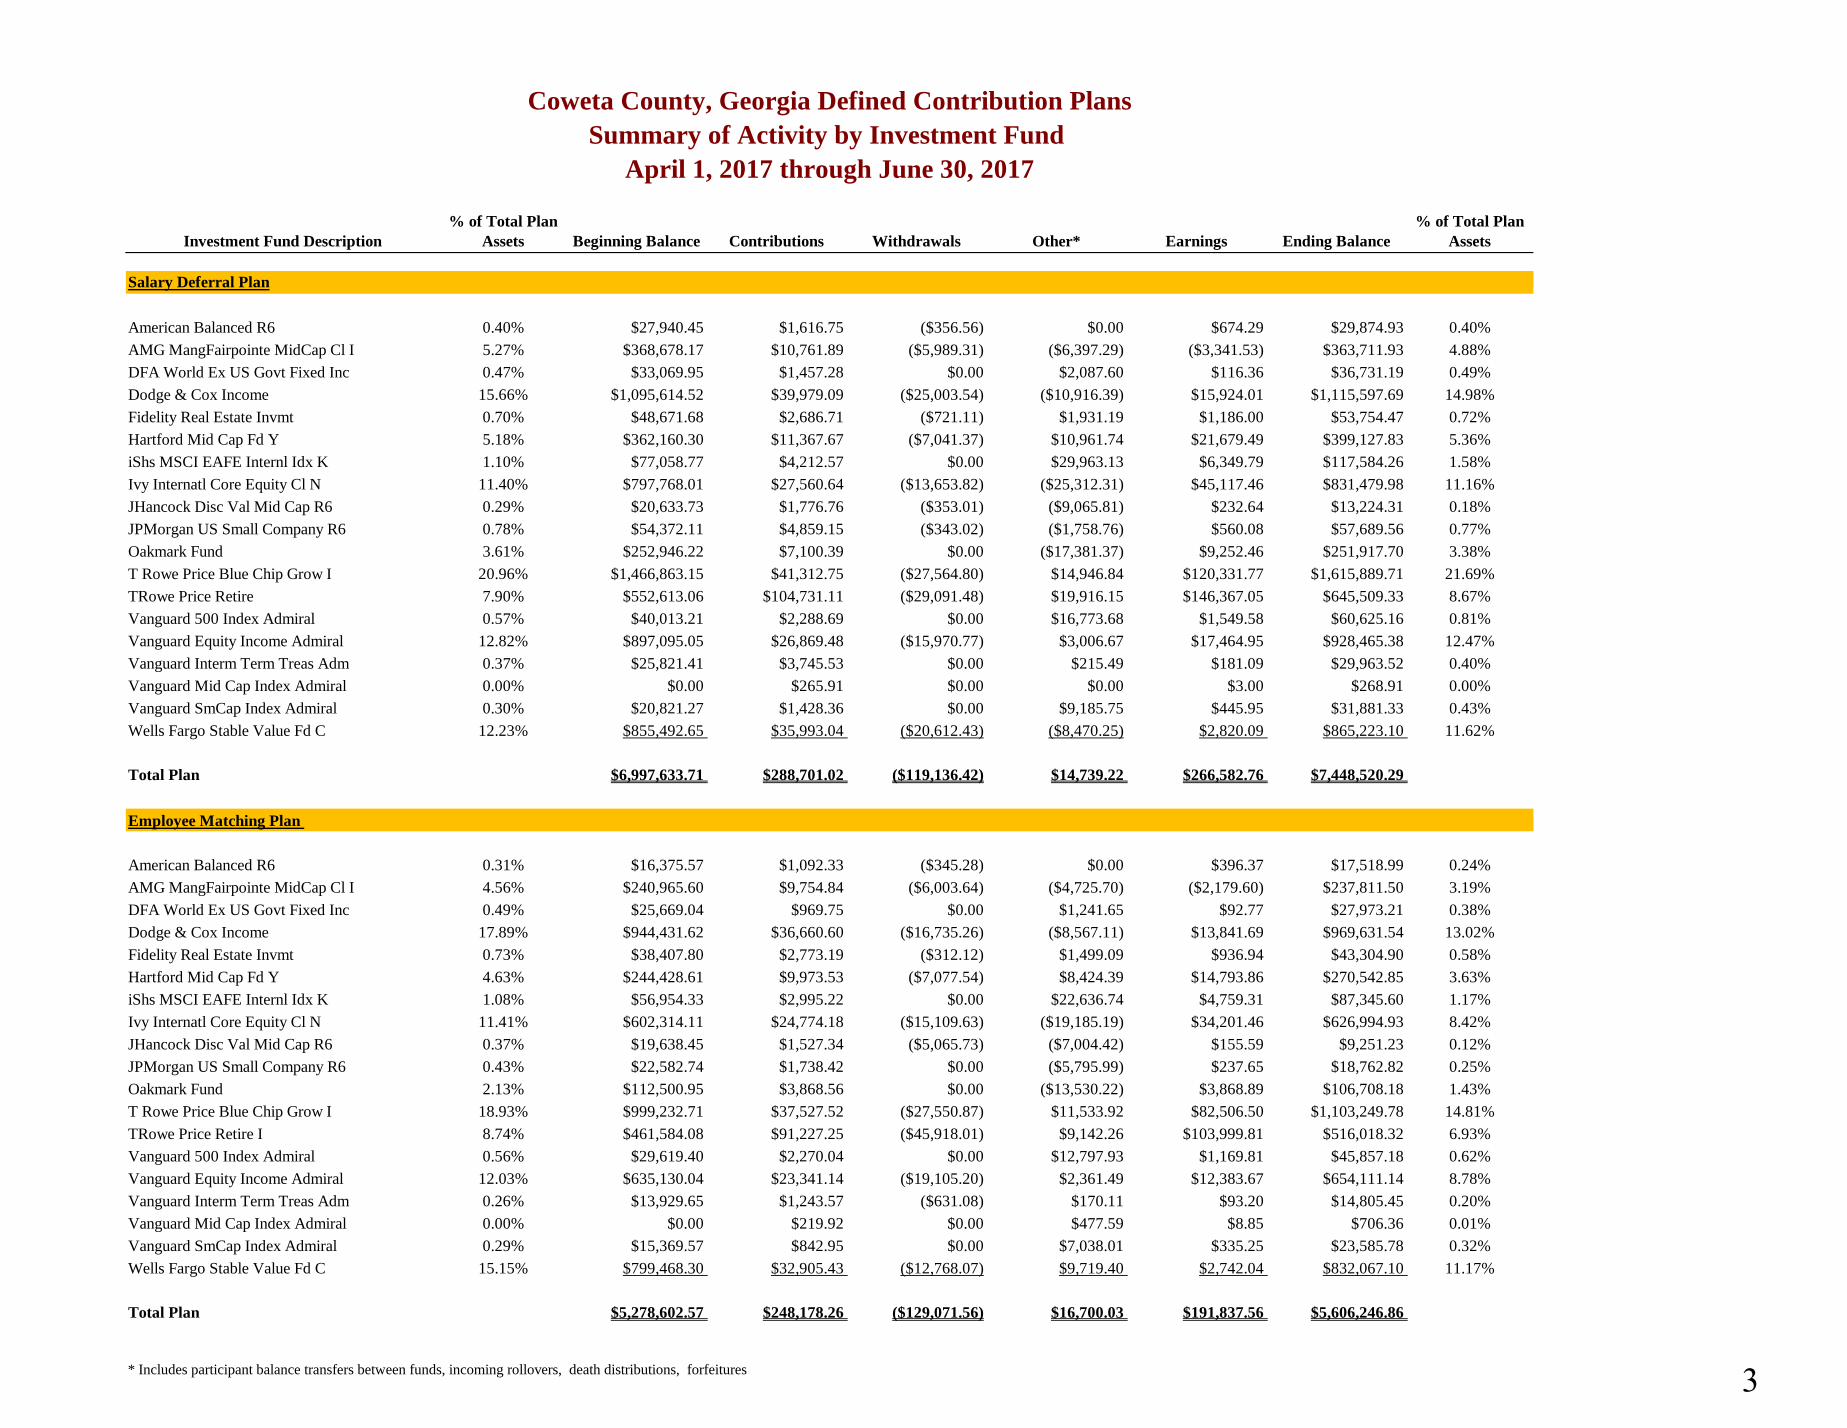
Investment Fund Description% of Total Plan
Assets Beginning Balance Contributions Withdrawals Other* Earnings Ending Balance% of Total Plan
Assets
Salary Deferral Plan
American Balanced R6 0.40% $27,940.45 $1,616.75 ($356.56) $0.00 $674.29 $29,874.93 0.40%AMG MangFairpointe MidCap Cl I 5.27% $368,678.17 $10,761.89 ($5,989.31) ($6,397.29) ($3,341.53) $363,711.93 4.88%DFA World Ex US Govt Fixed Inc 0.47% $33,069.95 $1,457.28 $0.00 $2,087.60 $116.36 $36,731.19 0.49%Dodge & Cox Income 15.66% $1,095,614.52 $39,979.09 ($25,003.54) ($10,916.39) $15,924.01 $1,115,597.69 14.98%Fidelity Real Estate Invmt 0.70% $48,671.68 $2,686.71 ($721.11) $1,931.19 $1,186.00 $53,754.47 0.72%Hartford Mid Cap Fd Y 5.18% $362,160.30 $11,367.67 ($7,041.37) $10,961.74 $21,679.49 $399,127.83 5.36%iShs MSCI EAFE Internl Idx K 1.10% $77,058.77 $4,212.57 $0.00 $29,963.13 $6,349.79 $117,584.26 1.58%Ivy Internatl Core Equity Cl N 11.40% $797,768.01 $27,560.64 ($13,653.82) ($25,312.31) $45,117.46 $831,479.98 11.16%JHancock Disc Val Mid Cap R6 0.29% $20,633.73 $1,776.76 ($353.01) ($9,065.81) $232.64 $13,224.31 0.18%JPMorgan US Small Company R6 0.78% $54,372.11 $4,859.15 ($343.02) ($1,758.76) $560.08 $57,689.56 0.77%Oakmark Fund 3.61% $252,946.22 $7,100.39 $0.00 ($17,381.37) $9,252.46 $251,917.70 3.38%T Rowe Price Blue Chip Grow I 20.96% $1,466,863.15 $41,312.75 ($27,564.80) $14,946.84 $120,331.77 $1,615,889.71 21.69%TRowe Price Retire 7.90% $552,613.06 $104,731.11 ($29,091.48) $19,916.15 $146,367.05 $645,509.33 8.67%Vanguard 500 Index Admiral 0.57% $40,013.21 $2,288.69 $0.00 $16,773.68 $1,549.58 $60,625.16 0.81%Vanguard Equity Income Admiral 12.82% $897,095.05 $26,869.48 ($15,970.77) $3,006.67 $17,464.95 $928,465.38 12.47%Vanguard Interm Term Treas Adm 0.37% $25,821.41 $3,745.53 $0.00 $215.49 $181.09 $29,963.52 0.40%Vanguard Mid Cap Index Admiral 0.00% $0.00 $265.91 $0.00 $0.00 $3.00 $268.91 0.00%Vanguard SmCap Index Admiral 0.30% $20,821.27 $1,428.36 $0.00 $9,185.75 $445.95 $31,881.33 0.43%Wells Fargo Stable Value Fd C 12.23% $855,492.65 $35,993.04 ($20,612.43) ($8,470.25) $2,820.09 $865,223.10 11.62%
Total Plan $6,997,633.71 $288,701.02 ($119,136.42) $14,739.22 $266,582.76 $7,448,520.29
Employee Matching Plan
American Balanced R6 0.31% $16,375.57 $1,092.33 ($345.28) $0.00 $396.37 $17,518.99 0.24%AMG MangFairpointe MidCap Cl I 4.56% $240,965.60 $9,754.84 ($6,003.64) ($4,725.70) ($2,179.60) $237,811.50 3.19%DFA World Ex US Govt Fixed Inc 0.49% $25,669.04 $969.75 $0.00 $1,241.65 $92.77 $27,973.21 0.38%Dodge & Cox Income 17.89% $944,431.62 $36,660.60 ($16,735.26) ($8,567.11) $13,841.69 $969,631.54 13.02%Fidelity Real Estate Invmt 0.73% $38,407.80 $2,773.19 ($312.12) $1,499.09 $936.94 $43,304.90 0.58%Hartford Mid Cap Fd Y 4.63% $244,428.61 $9,973.53 ($7,077.54) $8,424.39 $14,793.86 $270,542.85 3.63%iShs MSCI EAFE Internl Idx K 1.08% $56,954.33 $2,995.22 $0.00 $22,636.74 $4,759.31 $87,345.60 1.17%Ivy Internatl Core Equity Cl N 11.41% $602,314.11 $24,774.18 ($15,109.63) ($19,185.19) $34,201.46 $626,994.93 8.42%JHancock Disc Val Mid Cap R6 0.37% $19,638.45 $1,527.34 ($5,065.73) ($7,004.42) $155.59 $9,251.23 0.12%JPMorgan US Small Company R6 0.43% $22,582.74 $1,738.42 $0.00 ($5,795.99) $237.65 $18,762.82 0.25%Oakmark Fund 2.13% $112,500.95 $3,868.56 $0.00 ($13,530.22) $3,868.89 $106,708.18 1.43%T Rowe Price Blue Chip Grow I 18.93% $999,232.71 $37,527.52 ($27,550.87) $11,533.92 $82,506.50 $1,103,249.78 14.81%TRowe Price Retire I 8.74% $461,584.08 $91,227.25 ($45,918.01) $9,142.26 $103,999.81 $516,018.32 6.93%Vanguard 500 Index Admiral 0.56% $29,619.40 $2,270.04 $0.00 $12,797.93 $1,169.81 $45,857.18 0.62%Vanguard Equity Income Admiral 12.03% $635,130.04 $23,341.14 ($19,105.20) $2,361.49 $12,383.67 $654,111.14 8.78%Vanguard Interm Term Treas Adm 0.26% $13,929.65 $1,243.57 ($631.08) $170.11 $93.20 $14,805.45 0.20%Vanguard Mid Cap Index Admiral 0.00% $0.00 $219.92 $0.00 $477.59 $8.85 $706.36 0.01%Vanguard SmCap Index Admiral 0.29% $15,369.57 $842.95 $0.00 $7,038.01 $335.25 $23,585.78 0.32%Wells Fargo Stable Value Fd C 15.15% $799,468.30 $32,905.43 ($12,768.07) $9,719.40 $2,742.04 $832,067.10 11.17%
Total Plan $5,278,602.57 $248,178.26 ($129,071.56) $16,700.03 $191,837.56 $5,606,246.86
* Includes participant balance transfers between funds, incoming rollovers, death distributions, forfeitures
Coweta County, Georgia Defined Contribution PlansSummary of Activity by Investment Fund
April 1, 2017 through June 30, 2017
3
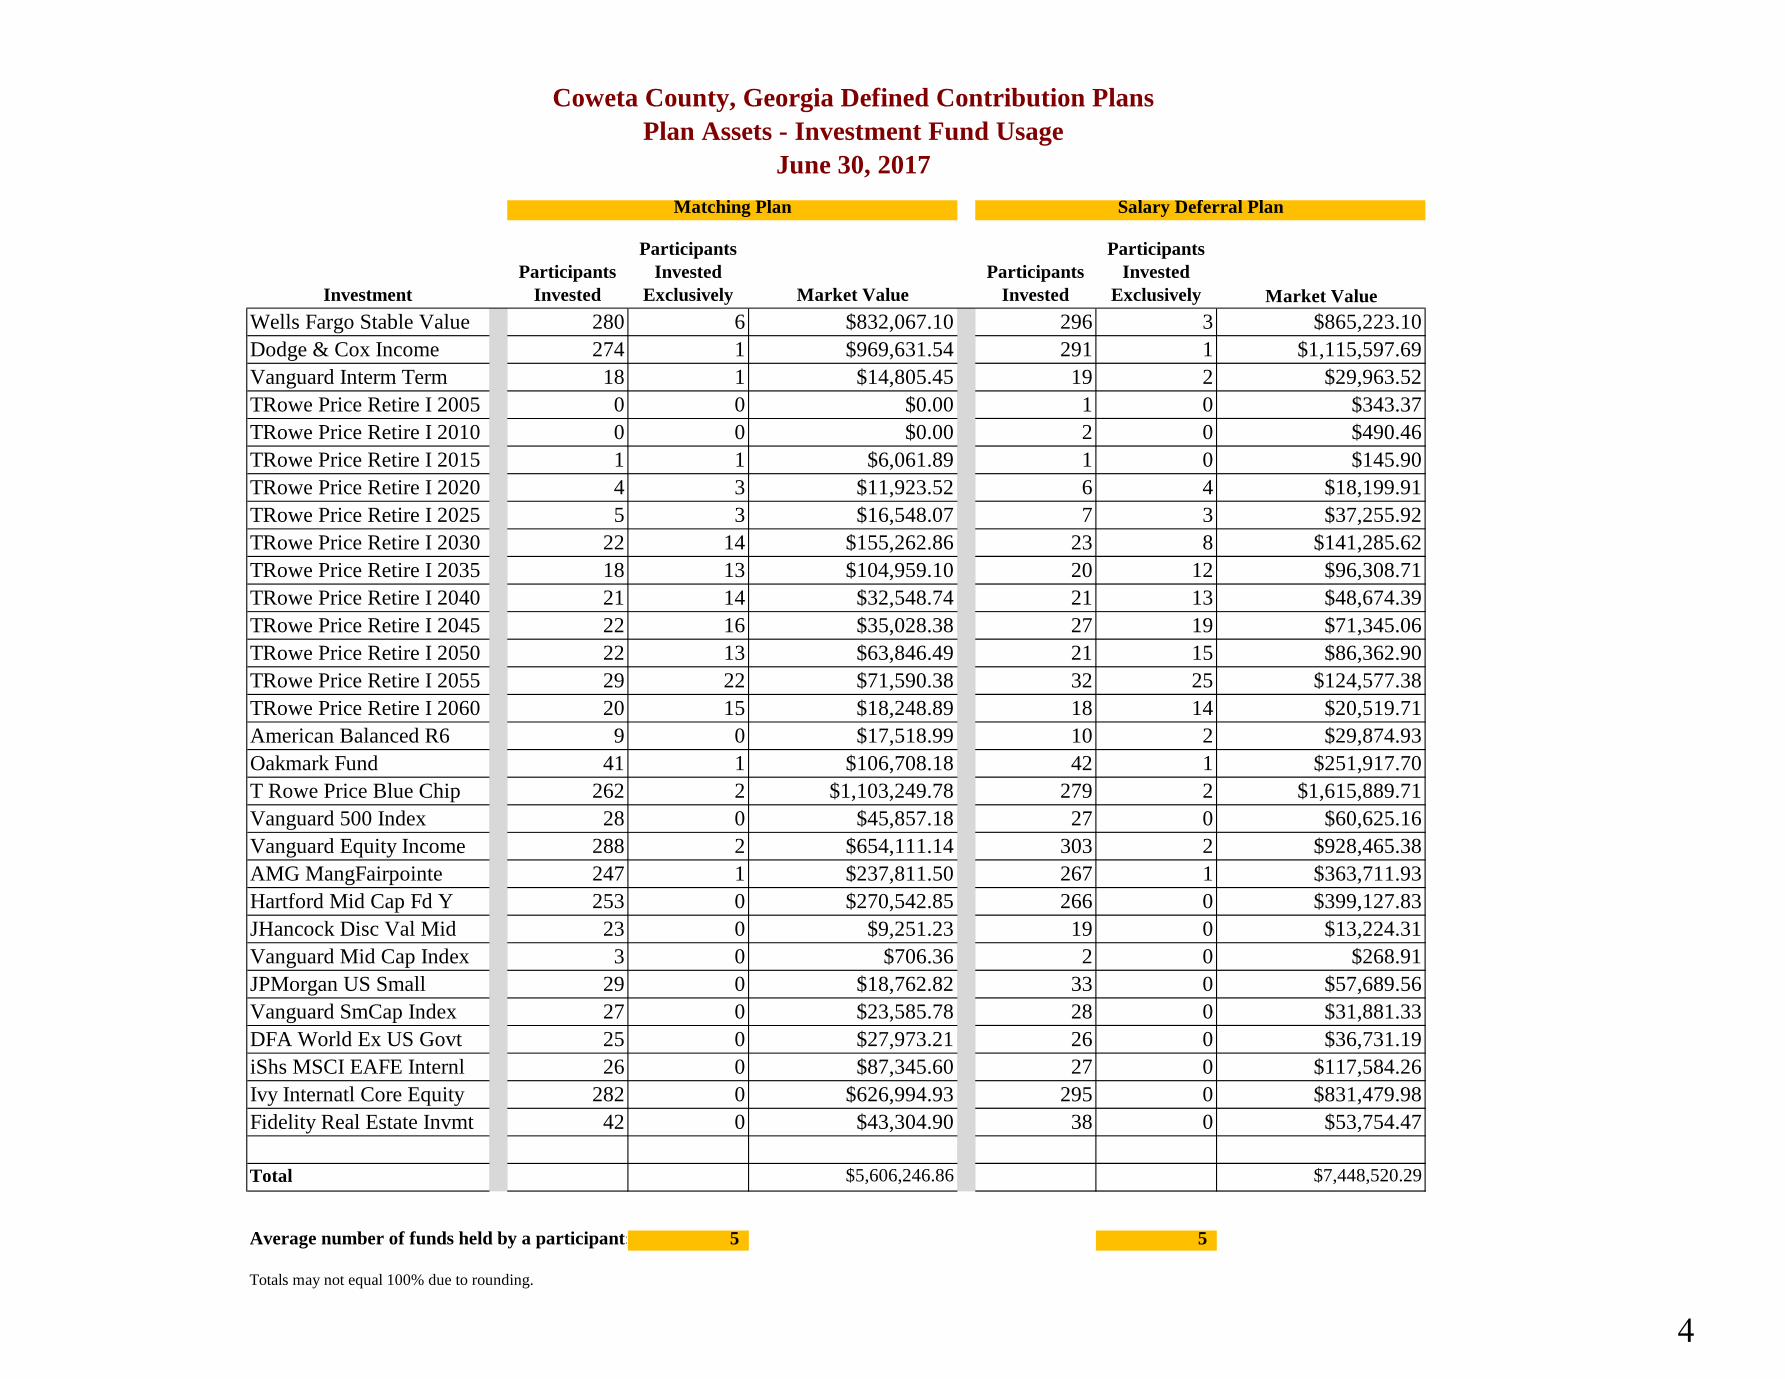
Coweta County, Georgia Defined Contribution PlansPlan Assets - Investment Fund Usage
June 30, 2017
InvestmentParticipants
Invested
Participants Invested
Exclusively Market ValueParticipants
Invested
Participants Invested
Exclusively Market ValueWells Fargo Stable Value
280 6 $832,067.10 296 3 $865,223.10
Dodge & Cox Income 274 1 $969,631.54 291 1 $1,115,597.69Vanguard Interm Term
18 1 $14,805.45 19 2 $29,963.52
TRowe Price Retire I 2005
0 0 $0.00 1 0 $343.37TRowe Price Retire I 2010
0 0 $0.00 2 0 $490.46
TRowe Price Retire I 2015
1 1 $6,061.89 1 0 $145.90TRowe Price Retire I 2020
4 3 $11,923.52 6 4 $18,199.91
TRowe Price Retire I 2025
5 3 $16,548.07 7 3 $37,255.92TRowe Price Retire I 2030
22 14 $155,262.86 23 8 $141,285.62
TRowe Price Retire I 2035
18 13 $104,959.10 20 12 $96,308.71TRowe Price Retire I 2040
21 14 $32,548.74 21 13 $48,674.39
TRowe Price Retire I 2045
22 16 $35,028.38 27 19 $71,345.06TRowe Price Retire I 2050
22 13 $63,846.49 21 15 $86,362.90
TRowe Price Retire I 2055
29 22 $71,590.38 32 25 $124,577.38TRowe Price Retire I 2060
20 15 $18,248.89 18 14 $20,519.71
American Balanced R6 9 0 $17,518.99 10 2 $29,874.93Oakmark Fund 41 1 $106,708.18 42 1 $251,917.70T Rowe Price Blue Chip
262 2 $1,103,249.78 279 2 $1,615,889.71
Vanguard 500 Index 28 0 $45,857.18 27 0 $60,625.16Vanguard Equity Income 288 2 $654,111.14 303 2 $928,465.38AMG MangFairpointe
247 1 $237,811.50 267 1 $363,711.93
Hartford Mid Cap Fd Y 253 0 $270,542.85 266 0 $399,127.83JHancock Disc Val Mid
23 0 $9,251.23 19 0 $13,224.31
Vanguard Mid Cap Index 3 0 $706.36 2 0 $268.91JPMorgan US Small
29 0 $18,762.82 33 0 $57,689.56
Vanguard SmCap Index 27 0 $23,585.78 28 0 $31,881.33DFA World Ex US Govt
25 0 $27,973.21 26 0 $36,731.19
iShs MSCI EAFE Internl
26 0 $87,345.60 27 0 $117,584.26Ivy Internatl Core Equity
282 0 $626,994.93 295 0 $831,479.98
Fidelity Real Estate Invmt 42 0 $43,304.90 38 0 $53,754.47
Total $5,606,246.86 $7,448,520.29
Average number of funds held by a participant: 5 5
Totals may not equal 100% due to rounding.
Salary Deferral PlanMatching Plan
4
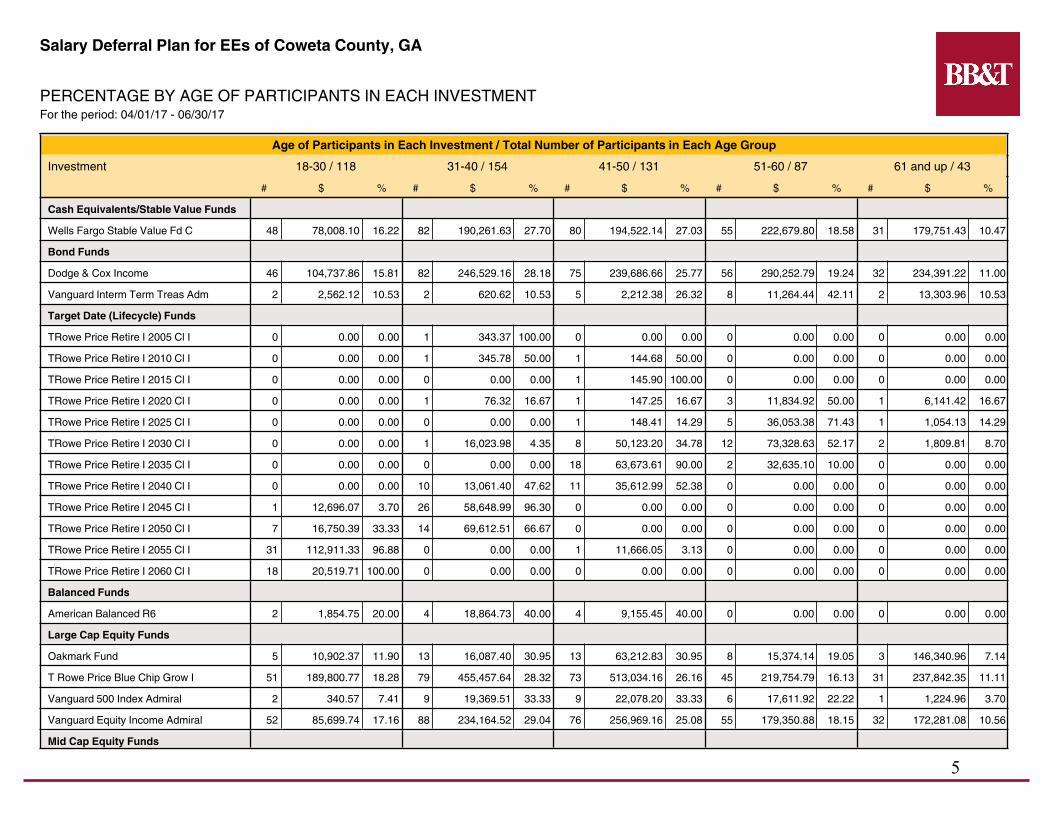
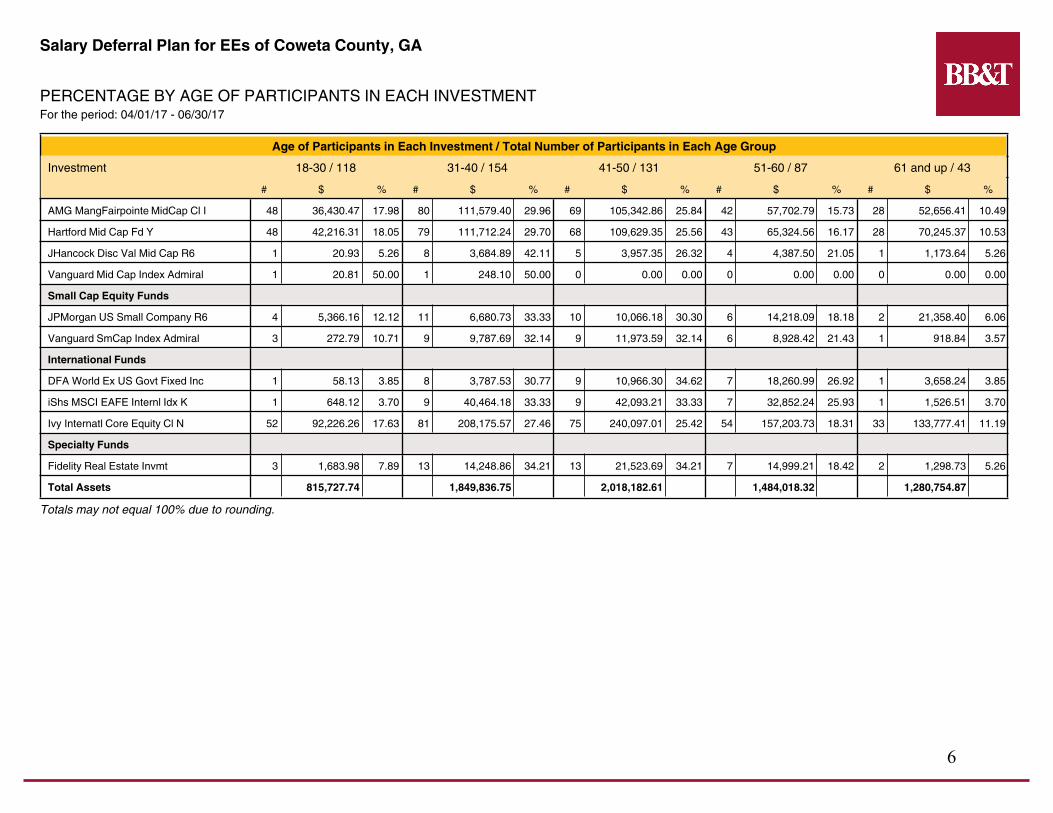
Salary Deferral Plan for EEs of Coweta County, GA
PERCENTAGE BY AGE OF PARTICIPANTS IN EACH INVESTMENTFor the period: 04/01/17 06/30/17
Age of Participants in Each Investment / Total Number of Participants in Each Age Group
Investment 1830 / 118 3140 / 154 4150 / 131 5160 / 87 61 and up / 43
# $ % # $ % # $ % # $ % # $ %
Cash Equivalents/Stable Value Funds
Wells Fargo Stable Value Fd C 48 78,008.10 16.22 82 190,261.63 27.70 80 194,522.14 27.03 55 222,679.80 18.58 31 179,751.43 10.47
Bond Funds
Dodge & Cox Income 46 104,737.86 15.81 82 246,529.16 28.18 75 239,686.66 25.77 56 290,252.79 19.24 32 234,391.22 11.00
Vanguard Interm Term Treas Adm 2 2,562.12 10.53 2 620.62 10.53 5 2,212.38 26.32 8 11,264.44 42.11 2 13,303.96 10.53
Target Date (Lifecycle) Funds
TRowe Price Retire I 2005 Cl I 0 0.00 0.00 1 343.37 100.00 0 0.00 0.00 0 0.00 0.00 0 0.00 0.00
TRowe Price Retire I 2010 Cl I 0 0.00 0.00 1 345.78 50.00 1 144.68 50.00 0 0.00 0.00 0 0.00 0.00
TRowe Price Retire I 2015 Cl I 0 0.00 0.00 0 0.00 0.00 1 145.90 100.00 0 0.00 0.00 0 0.00 0.00
TRowe Price Retire I 2020 Cl I 0 0.00 0.00 1 76.32 16.67 1 147.25 16.67 3 11,834.92 50.00 1 6,141.42 16.67
TRowe Price Retire I 2025 Cl I 0 0.00 0.00 0 0.00 0.00 1 148.41 14.29 5 36,053.38 71.43 1 1,054.13 14.29
TRowe Price Retire I 2030 Cl I 0 0.00 0.00 1 16,023.98 4.35 8 50,123.20 34.78 12 73,328.63 52.17 2 1,809.81 8.70
TRowe Price Retire I 2035 Cl I 0 0.00 0.00 0 0.00 0.00 18 63,673.61 90.00 2 32,635.10 10.00 0 0.00 0.00
TRowe Price Retire I 2040 Cl I 0 0.00 0.00 10 13,061.40 47.62 11 35,612.99 52.38 0 0.00 0.00 0 0.00 0.00
TRowe Price Retire I 2045 Cl I 1 12,696.07 3.70 26 58,648.99 96.30 0 0.00 0.00 0 0.00 0.00 0 0.00 0.00
TRowe Price Retire I 2050 Cl I 7 16,750.39 33.33 14 69,612.51 66.67 0 0.00 0.00 0 0.00 0.00 0 0.00 0.00
TRowe Price Retire I 2055 Cl I 31 112,911.33 96.88 0 0.00 0.00 1 11,666.05 3.13 0 0.00 0.00 0 0.00 0.00
TRowe Price Retire I 2060 Cl I 18 20,519.71 100.00 0 0.00 0.00 0 0.00 0.00 0 0.00 0.00 0 0.00 0.00
Balanced Funds
American Balanced R6 2 1,854.75 20.00 4 18,864.73 40.00 4 9,155.45 40.00 0 0.00 0.00 0 0.00 0.00
Large Cap Equity Funds
Oakmark Fund 5 10,902.37 11.90 13 16,087.40 30.95 13 63,212.83 30.95 8 15,374.14 19.05 3 146,340.96 7.14
T Rowe Price Blue Chip Grow I 51 189,800.77 18.28 79 455,457.64 28.32 73 513,034.16 26.16 45 219,754.79 16.13 31 237,842.35 11.11
Vanguard 500 Index Admiral 2 340.57 7.41 9 19,369.51 33.33 9 22,078.20 33.33 6 17,611.92 22.22 1 1,224.96 3.70
Vanguard Equity Income Admiral 52 85,699.74 17.16 88 234,164.52 29.04 76 256,969.16 25.08 55 179,350.88 18.15 32 172,281.08 10.56
Mid Cap Equity Funds
5
Salary Deferral Plan for EEs of Coweta County, GA
PERCENTAGE BY AGE OF PARTICIPANTS IN EACH INVESTMENTFor the period: 04/01/17 06/30/17
Age of Participants in Each Investment / Total Number of Participants in Each Age Group
Investment 1830 / 118 3140 / 154 4150 / 131 5160 / 87 61 and up / 43
# $ % # $ % # $ % # $ % # $ %
AMG MangFairpointe MidCap Cl I 48 36,430.47 17.98 80 111,579.40 29.96 69 105,342.86 25.84 42 57,702.79 15.73 28 52,656.41 10.49
Hartford Mid Cap Fd Y 48 42,216.31 18.05 79 111,712.24 29.70 68 109,629.35 25.56 43 65,324.56 16.17 28 70,245.37 10.53
JHancock Disc Val Mid Cap R6 1 20.93 5.26 8 3,684.89 42.11 5 3,957.35 26.32 4 4,387.50 21.05 1 1,173.64 5.26
Vanguard Mid Cap Index Admiral 1 20.81 50.00 1 248.10 50.00 0 0.00 0.00 0 0.00 0.00 0 0.00 0.00
Small Cap Equity Funds
JPMorgan US Small Company R6 4 5,366.16 12.12 11 6,680.73 33.33 10 10,066.18 30.30 6 14,218.09 18.18 2 21,358.40 6.06
Vanguard SmCap Index Admiral 3 272.79 10.71 9 9,787.69 32.14 9 11,973.59 32.14 6 8,928.42 21.43 1 918.84 3.57
International Funds
DFA World Ex US Govt Fixed Inc 1 58.13 3.85 8 3,787.53 30.77 9 10,966.30 34.62 7 18,260.99 26.92 1 3,658.24 3.85
iShs MSCI EAFE Internl Idx K 1 648.12 3.70 9 40,464.18 33.33 9 42,093.21 33.33 7 32,852.24 25.93 1 1,526.51 3.70
Ivy Internatl Core Equity Cl N 52 92,226.26 17.63 81 208,175.57 27.46 75 240,097.01 25.42 54 157,203.73 18.31 33 133,777.41 11.19
Specialty Funds
Fidelity Real Estate Invmt 3 1,683.98 7.89 13 14,248.86 34.21 13 21,523.69 34.21 7 14,999.21 18.42 2 1,298.73 5.26
Total Assets 815,727.74 1,849,836.75 2,018,182.61 1,484,018.32 1,280,754.87
Totals may not equal 100% due to rounding.
6
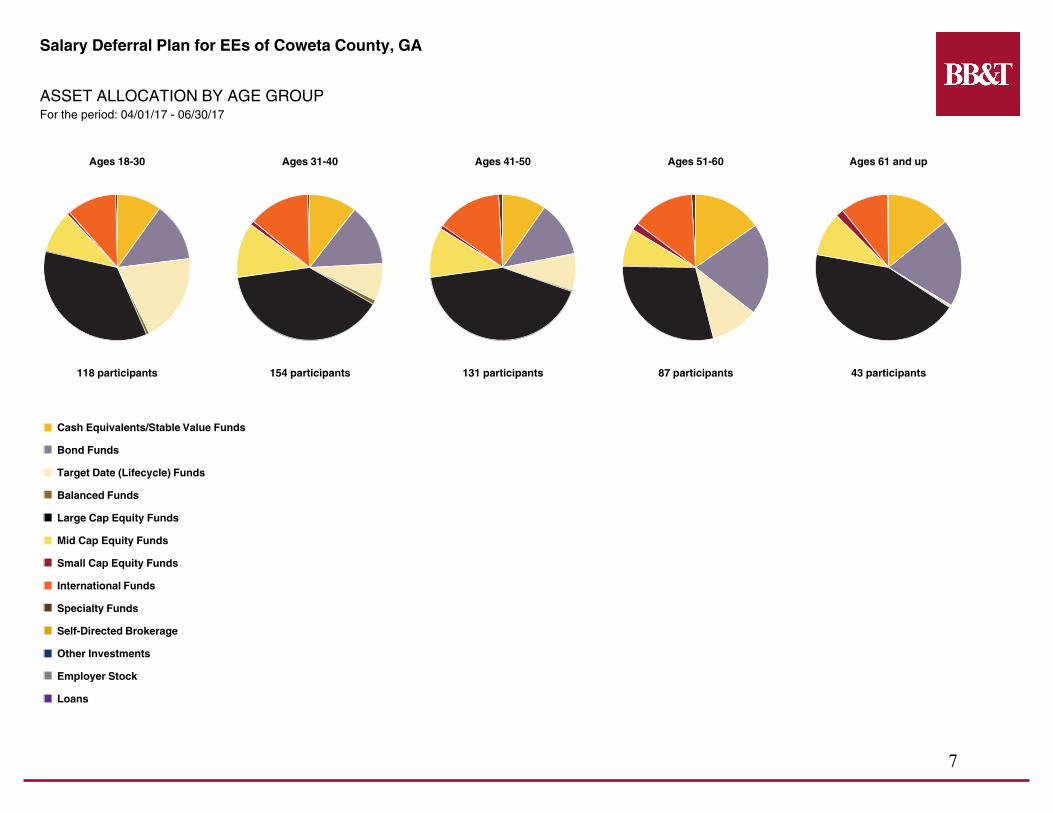
Salary Deferral Plan for EEs of Coweta County, GA
ASSET ALLOCATION BY AGE GROUPFor the period: 04/01/17 06/30/17
Ages 1830 Ages 3140 Ages 4150 Ages 5160 Ages 61 and up
118 participants 154 participants 131 participants 87 participants 43 participants
Cash Equivalents/Stable Value Funds
Bond Funds
Target Date (Lifecycle) Funds
Balanced Funds
Large Cap Equity Funds
Mid Cap Equity Funds
Small Cap Equity Funds
International Funds
Specialty Funds
SelfDirected Brokerage
Other Investments
Employer Stock
Loans
7
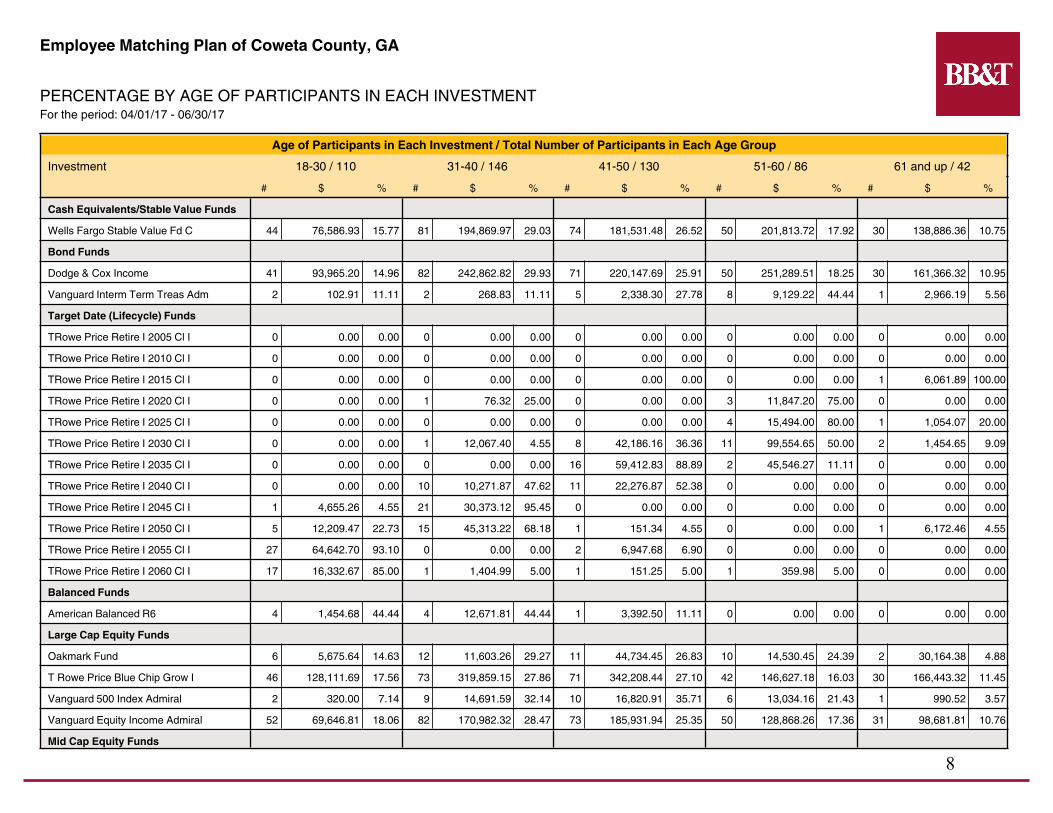
Employee Matching Plan of Coweta County, GA
PERCENTAGE BY AGE OF PARTICIPANTS IN EACH INVESTMENTFor the period: 04/01/17 06/30/17
Age of Participants in Each Investment / Total Number of Participants in Each Age Group
Investment 1830 / 110 3140 / 146 4150 / 130 5160 / 86 61 and up / 42
# $ % # $ % # $ % # $ % # $ %
Cash Equivalents/Stable Value Funds
Wells Fargo Stable Value Fd C 44 76,586.93 15.77 81 194,869.97 29.03 74 181,531.48 26.52 50 201,813.72 17.92 30 138,886.36 10.75
Bond Funds
Dodge & Cox Income 41 93,965.20 14.96 82 242,862.82 29.93 71 220,147.69 25.91 50 251,289.51 18.25 30 161,366.32 10.95
Vanguard Interm Term Treas Adm 2 102.91 11.11 2 268.83 11.11 5 2,338.30 27.78 8 9,129.22 44.44 1 2,966.19 5.56
Target Date (Lifecycle) Funds
TRowe Price Retire I 2005 Cl I 0 0.00 0.00 0 0.00 0.00 0 0.00 0.00 0 0.00 0.00 0 0.00 0.00
TRowe Price Retire I 2010 Cl I 0 0.00 0.00 0 0.00 0.00 0 0.00 0.00 0 0.00 0.00 0 0.00 0.00
TRowe Price Retire I 2015 Cl I 0 0.00 0.00 0 0.00 0.00 0 0.00 0.00 0 0.00 0.00 1 6,061.89 100.00
TRowe Price Retire I 2020 Cl I 0 0.00 0.00 1 76.32 25.00 0 0.00 0.00 3 11,847.20 75.00 0 0.00 0.00
TRowe Price Retire I 2025 Cl I 0 0.00 0.00 0 0.00 0.00 0 0.00 0.00 4 15,494.00 80.00 1 1,054.07 20.00
TRowe Price Retire I 2030 Cl I 0 0.00 0.00 1 12,067.40 4.55 8 42,186.16 36.36 11 99,554.65 50.00 2 1,454.65 9.09
TRowe Price Retire I 2035 Cl I 0 0.00 0.00 0 0.00 0.00 16 59,412.83 88.89 2 45,546.27 11.11 0 0.00 0.00
TRowe Price Retire I 2040 Cl I 0 0.00 0.00 10 10,271.87 47.62 11 22,276.87 52.38 0 0.00 0.00 0 0.00 0.00
TRowe Price Retire I 2045 Cl I 1 4,655.26 4.55 21 30,373.12 95.45 0 0.00 0.00 0 0.00 0.00 0 0.00 0.00
TRowe Price Retire I 2050 Cl I 5 12,209.47 22.73 15 45,313.22 68.18 1 151.34 4.55 0 0.00 0.00 1 6,172.46 4.55
TRowe Price Retire I 2055 Cl I 27 64,642.70 93.10 0 0.00 0.00 2 6,947.68 6.90 0 0.00 0.00 0 0.00 0.00
TRowe Price Retire I 2060 Cl I 17 16,332.67 85.00 1 1,404.99 5.00 1 151.25 5.00 1 359.98 5.00 0 0.00 0.00
Balanced Funds
American Balanced R6 4 1,454.68 44.44 4 12,671.81 44.44 1 3,392.50 11.11 0 0.00 0.00 0 0.00 0.00
Large Cap Equity Funds
Oakmark Fund 6 5,675.64 14.63 12 11,603.26 29.27 11 44,734.45 26.83 10 14,530.45 24.39 2 30,164.38 4.88
T Rowe Price Blue Chip Grow I 46 128,111.69 17.56 73 319,859.15 27.86 71 342,208.44 27.10 42 146,627.18 16.03 30 166,443.32 11.45
Vanguard 500 Index Admiral 2 320.00 7.14 9 14,691.59 32.14 10 16,820.91 35.71 6 13,034.16 21.43 1 990.52 3.57
Vanguard Equity Income Admiral 52 69,646.81 18.06 82 170,982.32 28.47 73 185,931.94 25.35 50 128,868.26 17.36 31 98,681.81 10.76
Mid Cap Equity Funds
8
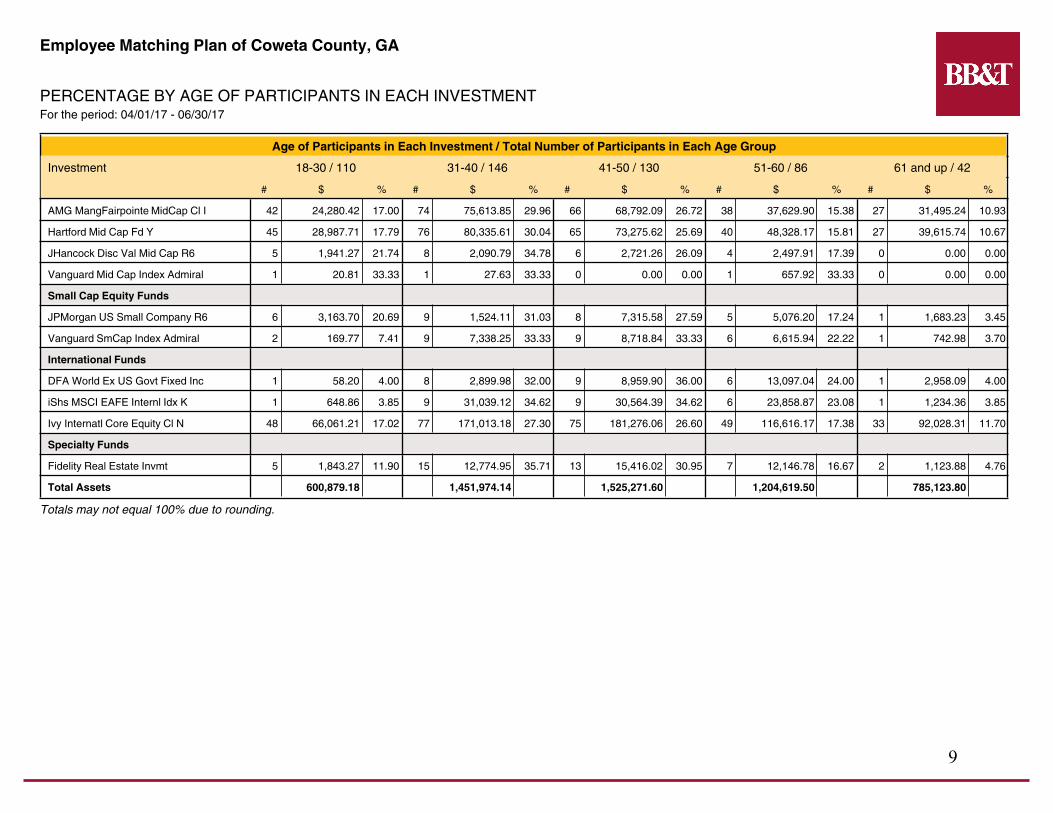
Employee Matching Plan of Coweta County, GA
PERCENTAGE BY AGE OF PARTICIPANTS IN EACH INVESTMENTFor the period: 04/01/17 06/30/17
Age of Participants in Each Investment / Total Number of Participants in Each Age Group
Investment 1830 / 110 3140 / 146 4150 / 130 5160 / 86 61 and up / 42
# $ % # $ % # $ % # $ % # $ %
AMG MangFairpointe MidCap Cl I 42 24,280.42 17.00 74 75,613.85 29.96 66 68,792.09 26.72 38 37,629.90 15.38 27 31,495.24 10.93
Hartford Mid Cap Fd Y 45 28,987.71 17.79 76 80,335.61 30.04 65 73,275.62 25.69 40 48,328.17 15.81 27 39,615.74 10.67
JHancock Disc Val Mid Cap R6 5 1,941.27 21.74 8 2,090.79 34.78 6 2,721.26 26.09 4 2,497.91 17.39 0 0.00 0.00
Vanguard Mid Cap Index Admiral 1 20.81 33.33 1 27.63 33.33 0 0.00 0.00 1 657.92 33.33 0 0.00 0.00
Small Cap Equity Funds
JPMorgan US Small Company R6 6 3,163.70 20.69 9 1,524.11 31.03 8 7,315.58 27.59 5 5,076.20 17.24 1 1,683.23 3.45
Vanguard SmCap Index Admiral 2 169.77 7.41 9 7,338.25 33.33 9 8,718.84 33.33 6 6,615.94 22.22 1 742.98 3.70
International Funds
DFA World Ex US Govt Fixed Inc 1 58.20 4.00 8 2,899.98 32.00 9 8,959.90 36.00 6 13,097.04 24.00 1 2,958.09 4.00
iShs MSCI EAFE Internl Idx K 1 648.86 3.85 9 31,039.12 34.62 9 30,564.39 34.62 6 23,858.87 23.08 1 1,234.36 3.85
Ivy Internatl Core Equity Cl N 48 66,061.21 17.02 77 171,013.18 27.30 75 181,276.06 26.60 49 116,616.17 17.38 33 92,028.31 11.70
Specialty Funds
Fidelity Real Estate Invmt 5 1,843.27 11.90 15 12,774.95 35.71 13 15,416.02 30.95 7 12,146.78 16.67 2 1,123.88 4.76
Total Assets 600,879.18 1,451,974.14 1,525,271.60 1,204,619.50 785,123.80
Totals may not equal 100% due to rounding.
9
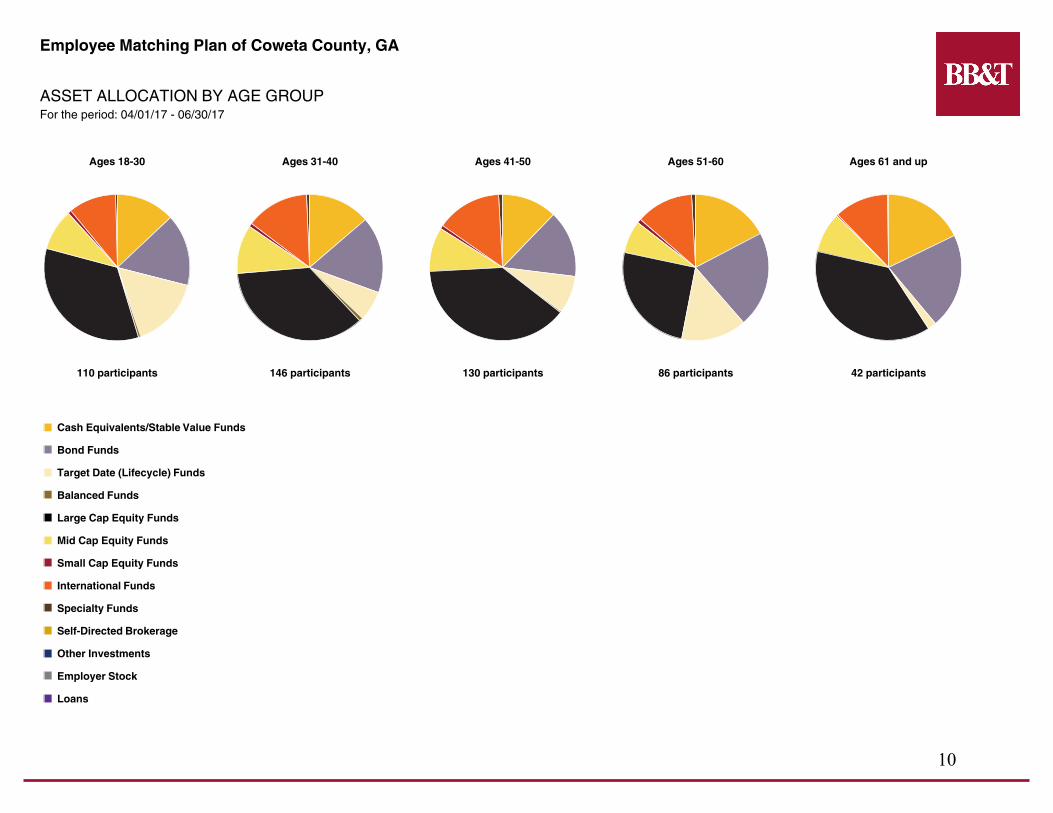
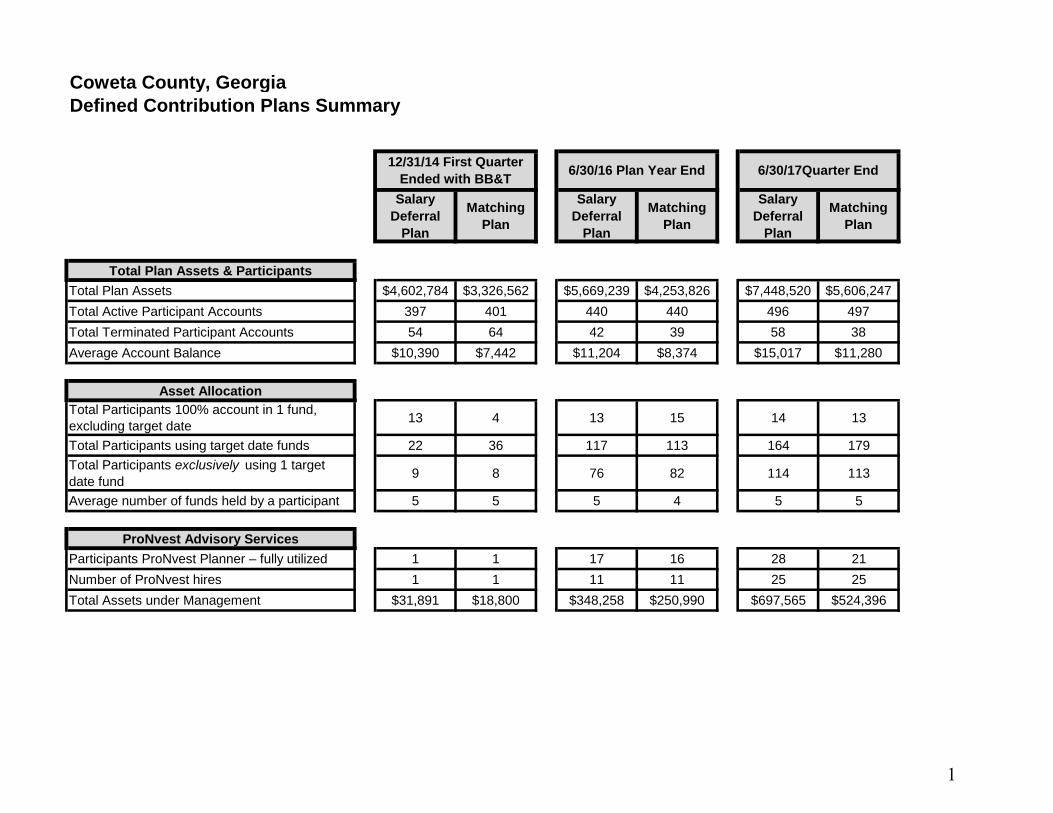
Employee Matching Plan of Coweta County, GA
ASSET ALLOCATION BY AGE GROUPFor the period: 04/01/17 06/30/17
Ages 1830 Ages 3140 Ages 4150 Ages 5160 Ages 61 and up
110 participants 146 participants 130 participants 86 participants 42 participants
Cash Equivalents/Stable Value Funds
Bond Funds
Target Date (Lifecycle) Funds
Balanced Funds
Large Cap Equity Funds
Mid Cap Equity Funds
Small Cap Equity Funds
International Funds
Specialty Funds
SelfDirected Brokerage
Other Investments
Employer Stock
Loans
10
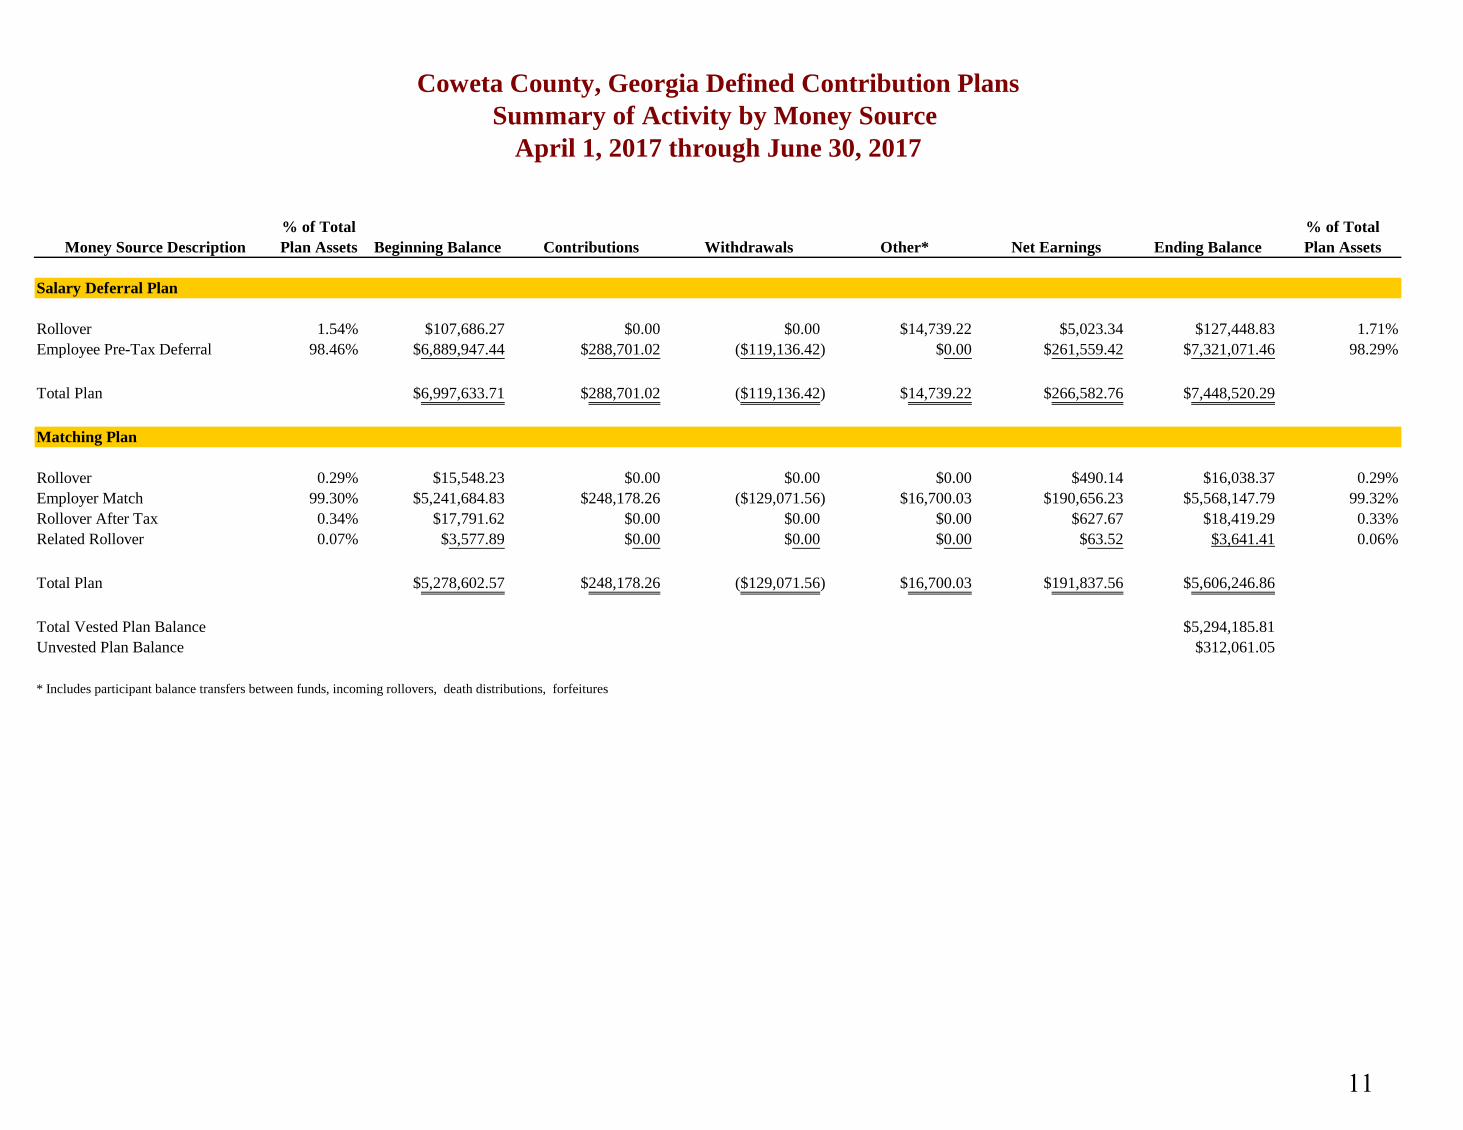
% of Total % of TotalMoney Source Description Plan Assets Beginning Balance Contributions Withdrawals Other* Net Earnings Ending Balance Plan Assets
Rollover 1.54% $107,686.27 $0.00 $0.00 $14,739.22 $5,023.34 $127,448.83 1.71%Employee Pre-Tax Deferral 98.46% $6,889,947.44 $288,701.02 ($119,136.42) $0.00 $261,559.42 $7,321,071.46 98.29%
Total Plan $6,997,633.71 $288,701.02 ($119,136.42) $14,739.22 $266,582.76 $7,448,520.29
Rollover 0.29% $15,548.23 $0.00 $0.00 $0.00 $490.14 $16,038.37 0.29%Employer Match 99.30% $5,241,684.83 $248,178.26 ($129,071.56) $16,700.03 $190,656.23 $5,568,147.79 99.32%Rollover After Tax 0.34% $17,791.62 $0.00 $0.00 $0.00 $627.67 $18,419.29 0.33%Related Rollover 0.07% $3,577.89 $0.00 $0.00 $0.00 $63.52 $3,641.41 0.06%
Total Plan $5,278,602.57 $248,178.26 ($129,071.56) $16,700.03 $191,837.56 $5,606,246.86
Total Vested Plan Balance $5,294,185.81Unvested Plan Balance $312,061.05
* Includes participant balance transfers between funds, incoming rollovers, death distributions, forfeitures
Matching Plan
Salary Deferral Plan
Coweta County, Georgia Defined Contribution PlansSummary of Activity by Money Source
April 1, 2017 through June 30, 2017
11
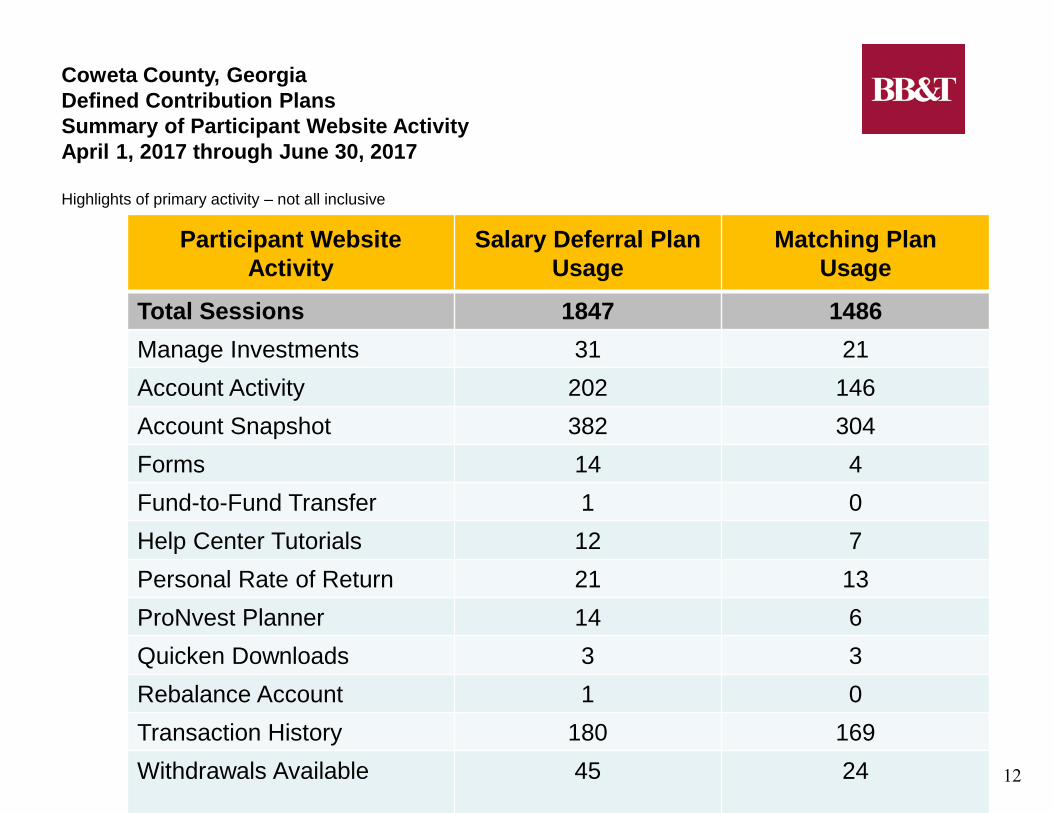
Participant Website Activity
Salary Deferral Plan Usage
Matching Plan Usage
Total Sessions 1847 1486 Manage Investments 31 21 Account Activity 202 146 Account Snapshot 382 304 Forms 14 4 Fund-to-Fund Transfer 1 0 Help Center Tutorials 12 7 Personal Rate of Return 21 13 ProNvest Planner 14 6 Quicken Downloads 3 3 Rebalance Account 1 0 Transaction History 180 169 Withdrawals Available 45 24
Coweta County, Georgia Defined Contribution Plans Summary of Participant Website Activity April 1, 2017 through June 30, 2017
Highlights of primary activity – not all inclusive
12
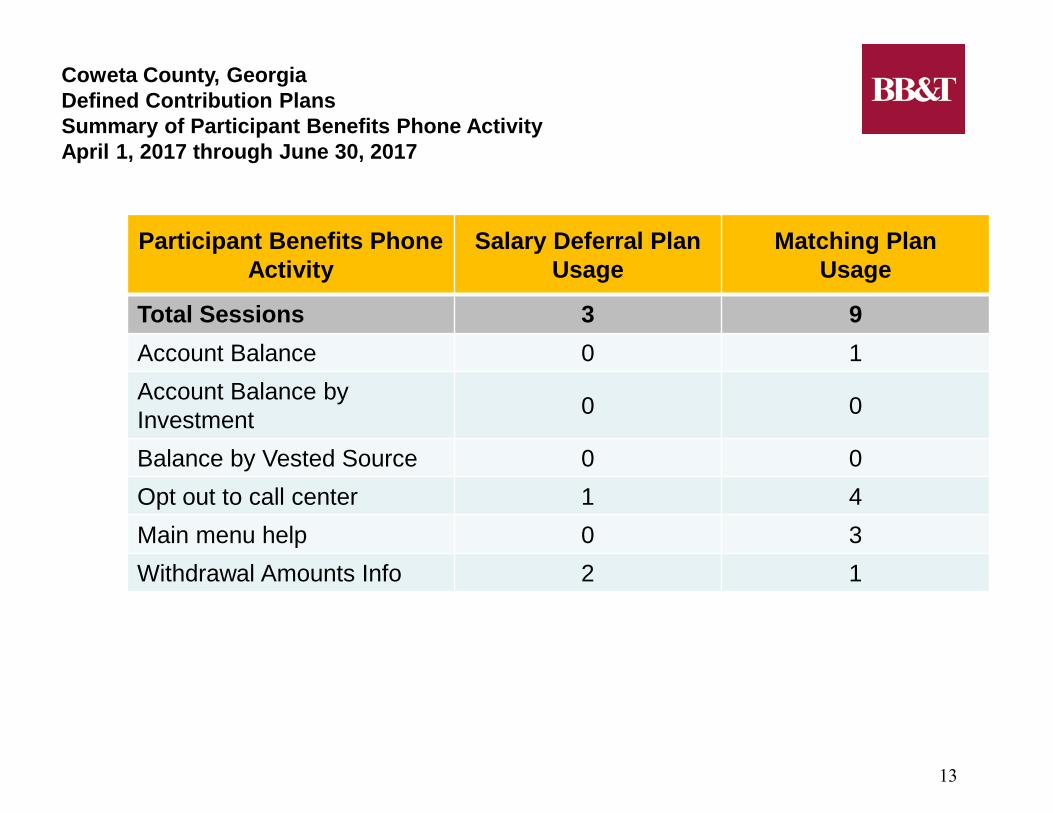
Participant Benefits Phone Activity
Salary Deferral Plan Usage
Matching Plan Usage
Total Sessions 3 9 Account Balance 0 1 Account Balance by Investment 0 0
Balance by Vested Source 0 0 Opt out to call center 1 4 Main menu help 0 3 Withdrawal Amounts Info 2 1
Coweta County, Georgia Defined Contribution Plans Summary of Participant Benefits Phone Activity April 1, 2017 through June 30, 2017
13

Your Feedback is Important
What can we do better or differently to service your plan? Are we meeting your expectations? Have we answered all of your questions? Can we use you as a reference for new clients?
BB&T and its representatives do not offer tax advice. Please consult your individual tax or legal advisor regarding your personal situation. Mutual funds and other investments are: NOT A DEPOSIT ● NOT FDIC-INSURED ● NOT GUARANTEED BY THE BANK ● NOT INSURED BY ANY STATE OR FEDERAL GOVERNMENT AGENCY ● MAY GO DOWN IN VALUE
Thank you for your business!!
14