Embed Size (px)
Citation preview

J.P. Morgan Auto Conference Kevin ClarkPresident and Chief Executive Officer
August 10, 2016
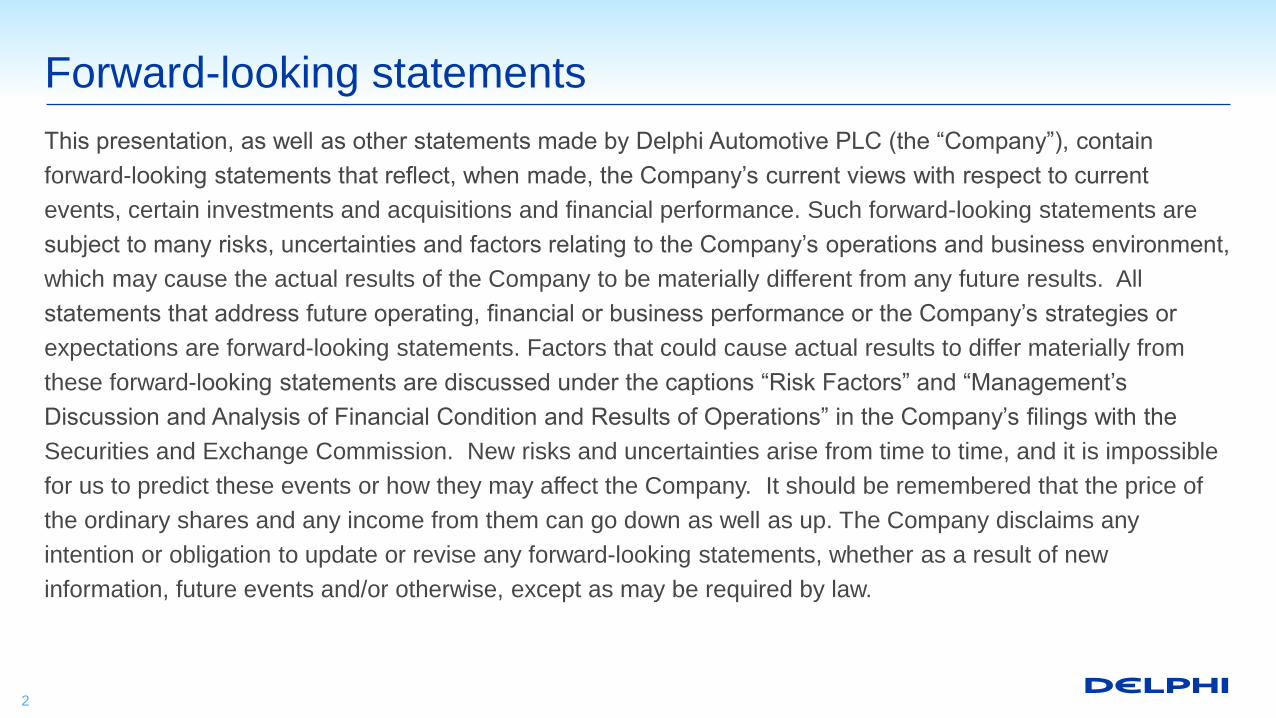
Forward-looking statements
This presentation, as well as other statements made by Delphi Automotive PLC (the “Company”), contain
forward-looking statements that reflect, when made, the Company’s current views with respect to current
events, certain investments and acquisitions and financial performance. Such forward-looking statements are
subject to many risks, uncertainties and factors relating to the Company’s operations and business environment,
which may cause the actual results of the Company to be materially different from any future results. All
statements that address future operating, financial or business performance or the Company’s strategies or
expectations are forward-looking statements. Factors that could cause actual results to differ materially from
these forward-looking statements are discussed under the captions “Risk Factors” and “Management’s
Discussion and Analysis of Financial Condition and Results of Operations” in the Company’s filings with the
Securities and Exchange Commission. New risks and uncertainties arise from time to time, and it is impossible
for us to predict these events or how they may affect the Company. It should be remembered that the price of
the ordinary shares and any income from them can go down as well as up. The Company disclaims any
intention or obligation to update or revise any forward-looking statements, whether as a result of new
information, future events and/or otherwise, except as may be required by law.
2
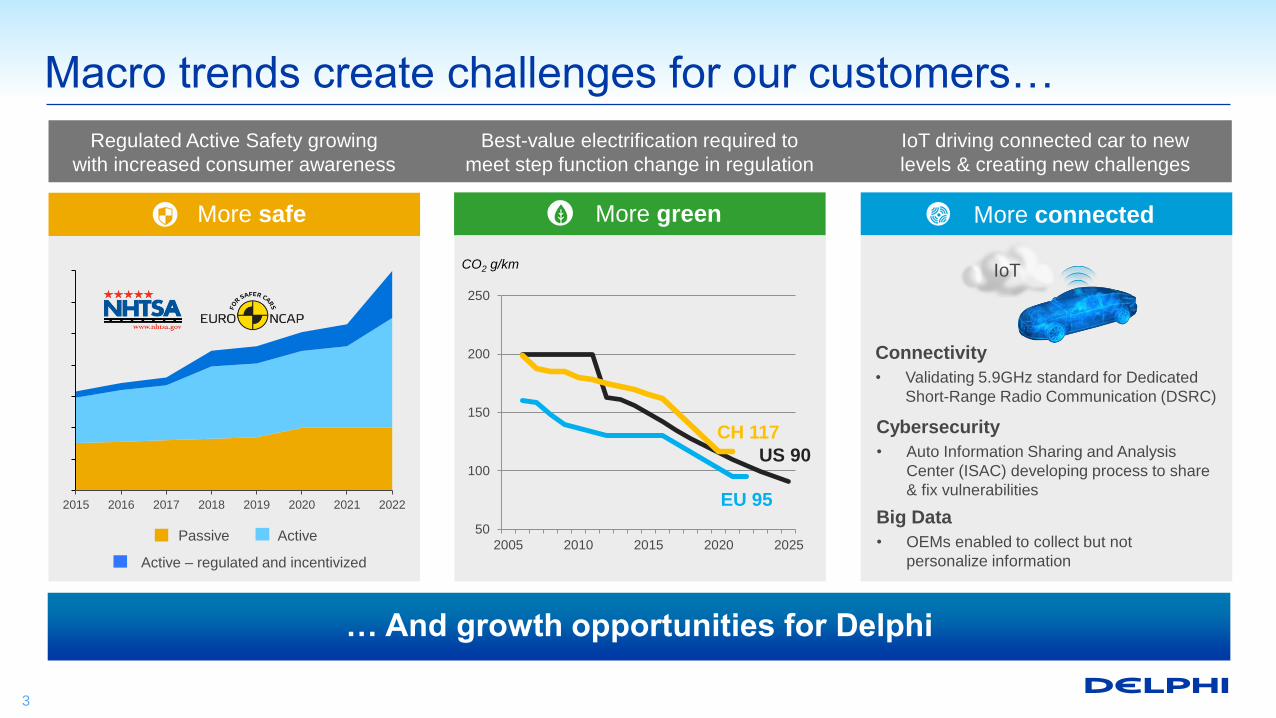
Macro trends create challenges for our customers…
Regulated Active Safety growing
with increased consumer awareness
Best-value electrification required to
meet step function change in regulation
IoT driving connected car to new
levels & creating new challenges
50
100
150
200
250
2005 2010 2015 2020 2025
EU 95
US 90
CH 117
CO2 g/km
Passive Active
Active – regulated and incentivized
Connectivity
• Validating 5.9GHz standard for Dedicated
Short-Range Radio Communication (DSRC)
Cybersecurity
• Auto Information Sharing and Analysis
Center (ISAC) developing process to share
& fix vulnerabilities
Big Data
• OEMs enabled to collect but not
personalize information
IoT
More safe More green More connected
2015 2016 2017 2018 2019 2020 2021 2022
3
… And growth opportunities for Delphi
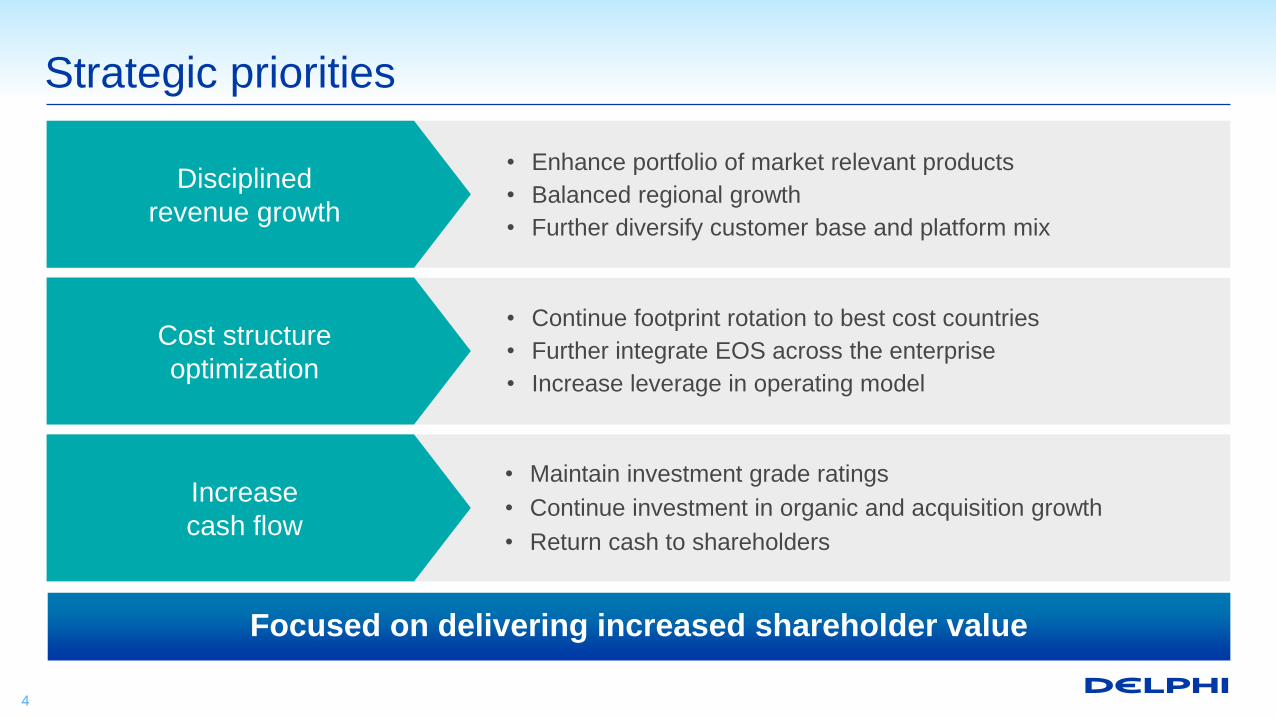
Strategic priorities
• Enhance portfolio of market relevant products
• Balanced regional growth
• Further diversify customer base and platform mix
• Maintain investment grade ratings
• Continue investment in organic and acquisition growth
• Return cash to shareholders
Disciplined
revenue growth
• Continue footprint rotation to best cost countries
• Further integrate EOS across the enterprise
• Increase leverage in operating model
Cost structure
optimization
Increase
cash flow
Focused on delivering increased shareholder value
4
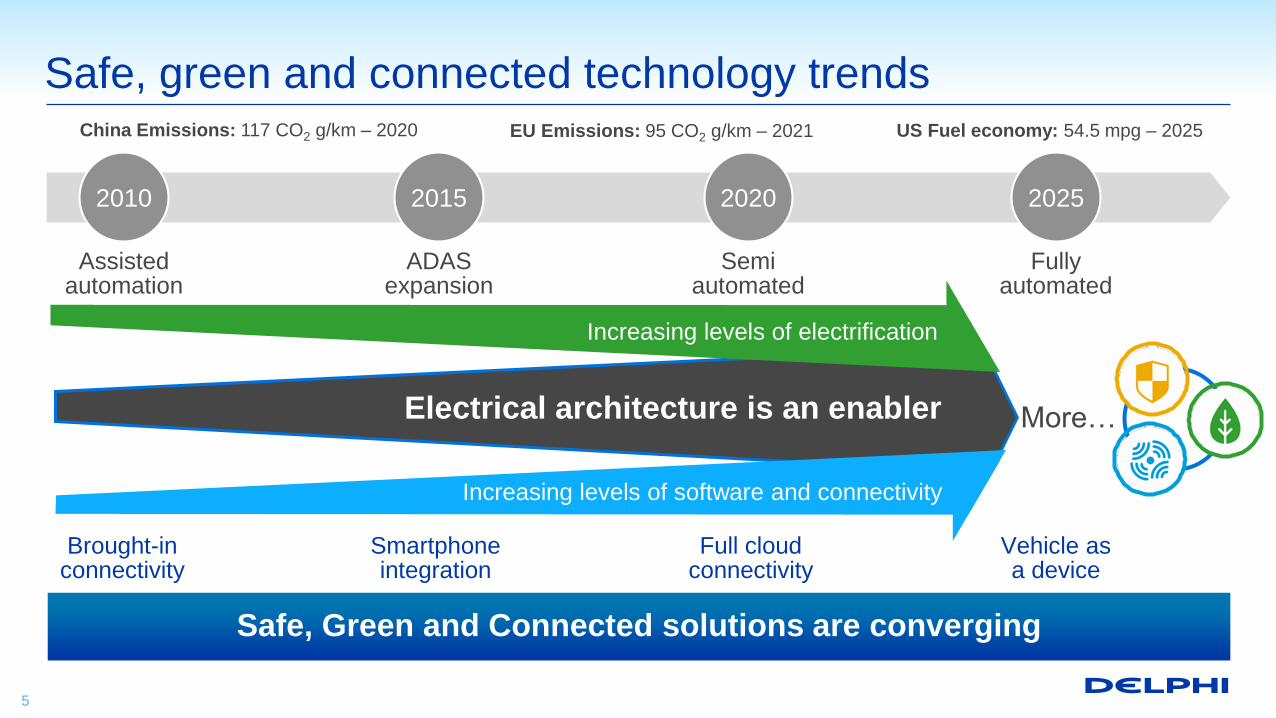
Safe, green and connected technology trends
2010 2020 20252015
Semiautomated
Assisted automation
ADASexpansion
Fullyautomated
Full cloud connectivity
Brought-in connectivity
Smartphoneintegration
Vehicle as a device
Electrical architecture is an enabler
Increasing levels of software and connectivity
Increasing levels of electrification
More…
US Fuel economy: 54.5 mpg – 2025EU Emissions: 95 CO2 g/km – 2021China Emissions: 117 CO2 g/km – 2020
5
Safe, Green and Connected solutions are converging
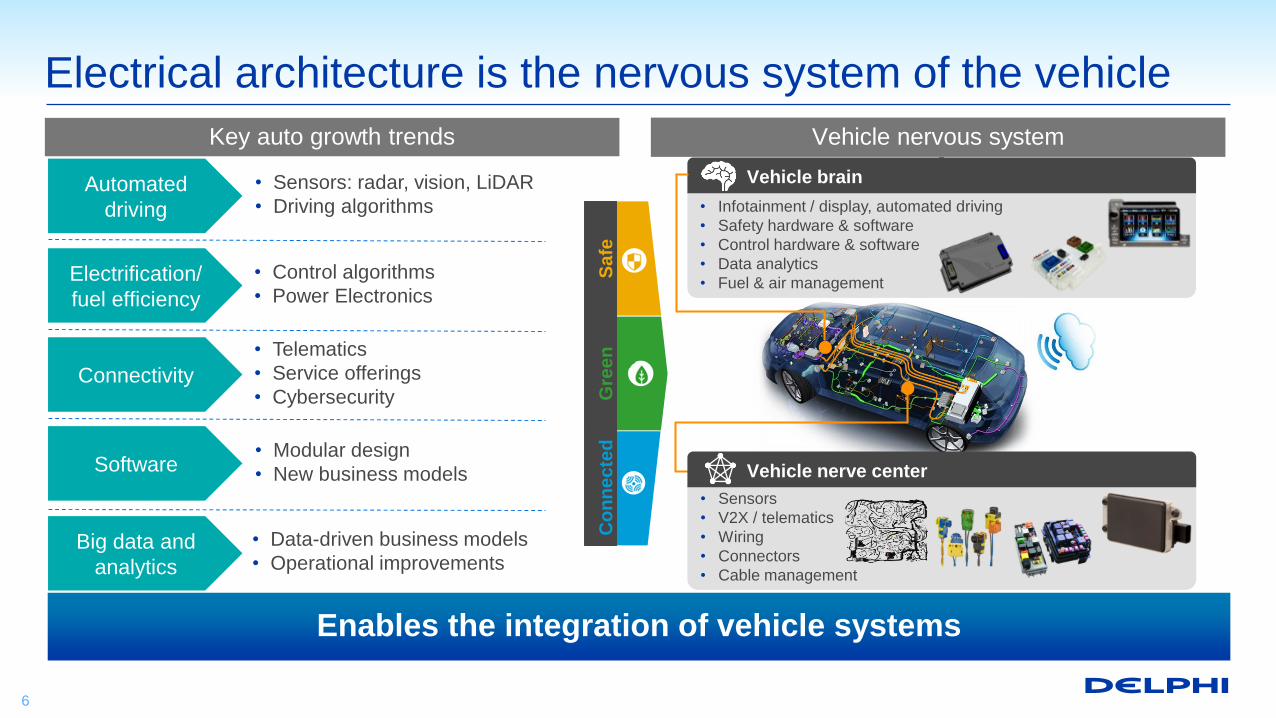
Automated
driving
Electrification/
fuel efficiency
Connectivity
Big data and
analytics
Software
• Telematics
• Service offerings
• Cybersecurity
• Sensors: radar, vision, LiDAR
• Driving algorithms
• Control algorithms
• Power Electronics
• Modular design
• New business models
• Data-driven business models
• Operational improvements
• Sensors
• V2X / telematics
• Wiring
• Connectors
• Cable management
Vehicle nerve center
• Infotainment / display, automated driving
• Safety hardware & software
• Control hardware & software
• Data analytics
• Fuel & air management
Vehicle brain
Safe
Gre
en
Co
nn
ec
ted
Electrical architecture is the nervous system of the vehicle
Vehicle nervous systemKey auto growth trends
6
Enables the integration of vehicle systems

Increase in
Electrification
– up to 600V
Vehicle complexity increasing
2015 2020+
Will exchange
~100,000
different pieces
of data in the
blink of an eye
1.5 miles of
cabling per
vehicle
67% increase
in cabling – up
to 2.5 miles
25%
increase in
connections
– up to 350
233%
increase in
diagnostics –
up to 1000
300 diagnostic
parameters,
monitoring
system
performance
Primarily 12V
powering the
vehicle
systems
Exchanges
~15,000
different pieces
of data in the
blink of an eye
280 connections
to manage power,
diagnostics
and signal
communication
7
Future solutions require increased content per vehicle
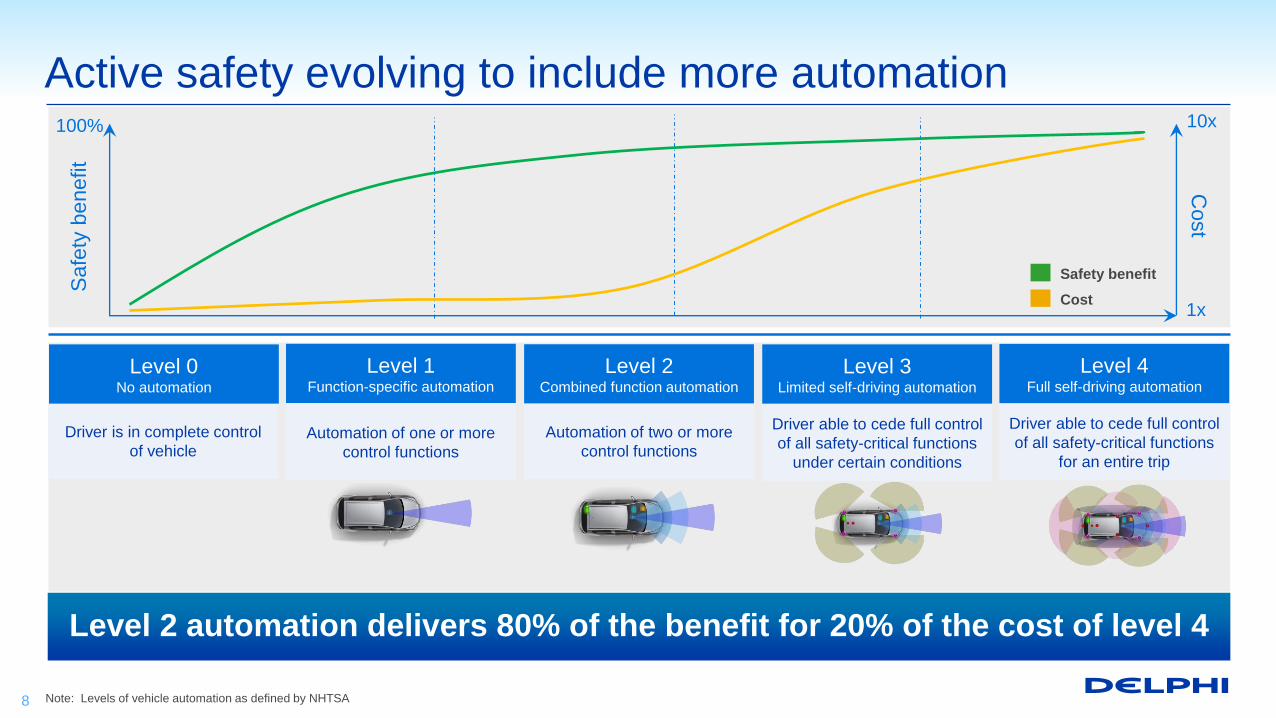
Active safety evolving to include more automationS
afe
ty b
enefit
Cost
100% 10x
1xCost
Safety benefit
Driver is in complete control
of vehicleAutomation of one or more
control functions
Level 0No automation
Level 1Function-specific automation
Automation of two or more
control functions
Level 2Combined function automation
Driver able to cede full control
of all safety-critical functions
under certain conditions
Level 3Limited self-driving automation
Driver able to cede full control
of all safety-critical functions
for an entire trip
Level 4Full self-driving automation
Note: Levels of vehicle automation as defined by NHTSA8
Level 2 automation delivers 80% of the benefit for 20% of the cost of level 4
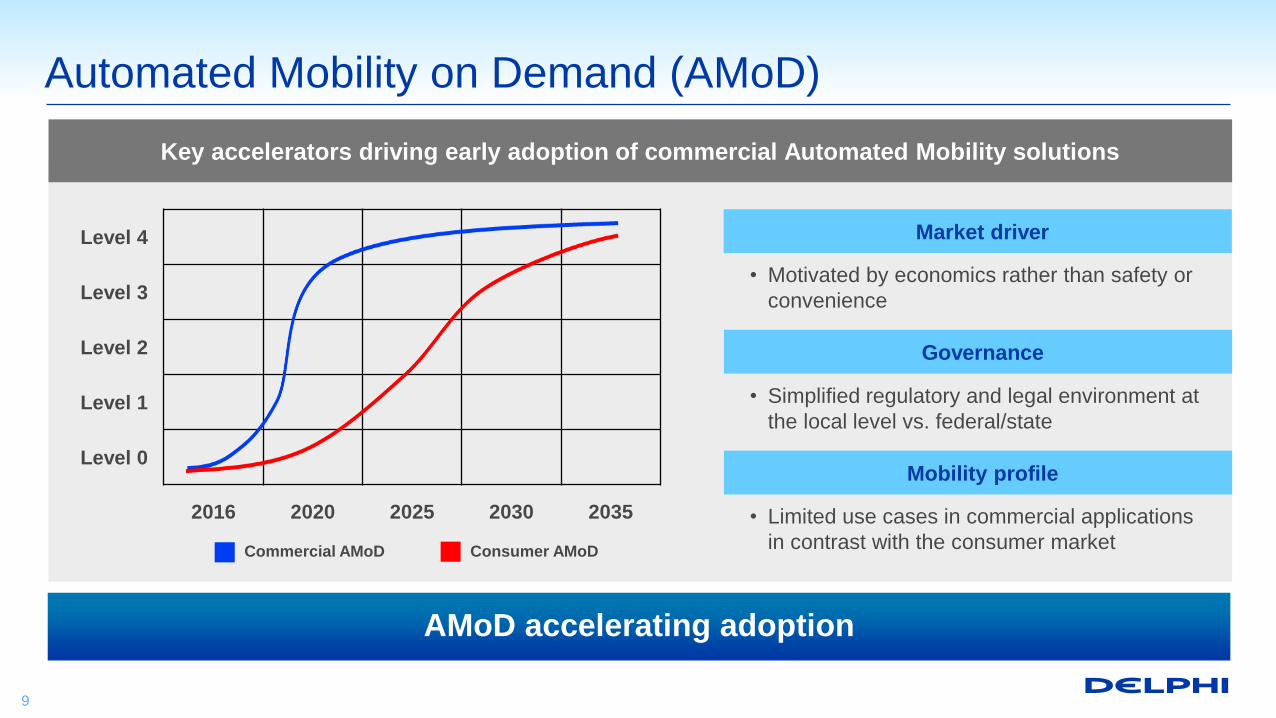
Automated Mobility on Demand (AMoD)
Key accelerators driving early adoption of commercial Automated Mobility solutions
Level 4
Level 3
Level 2
Level 1
Level 0
2016 2020 2025 2030 2035
Consumer AMoDCommercial AMoD
• Motivated by economics rather than safety or
convenience
Market driver
Governance
• Simplified regulatory and legal environment at
the local level vs. federal/state
Mobility profile
• Limited use cases in commercial applications
in contrast with the consumer market
9
AMoD accelerating adoption
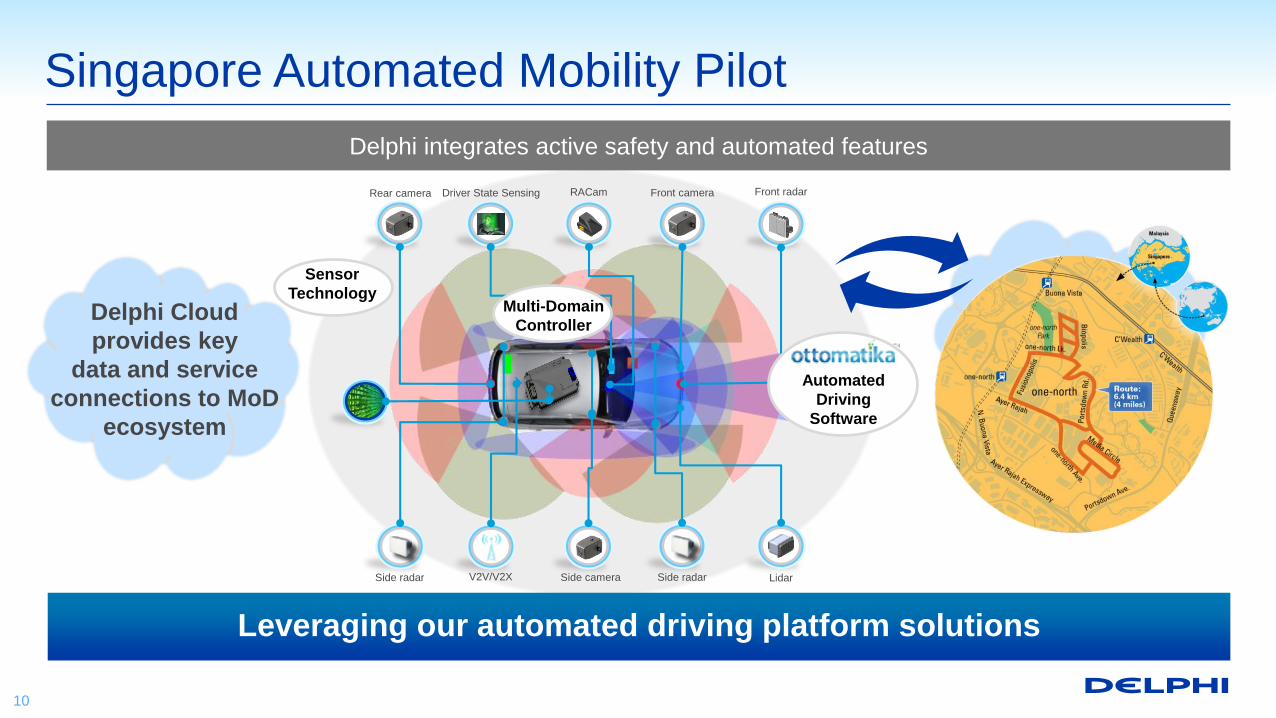
Singapore Automated Mobility Pilot
Front camera Front radarRACam
LidarSide radarSide radar
Driver State SensingRear camera
V2V/V2X Side camera
Multi-Domain
Controller
Automated
Driving
Software
Sensor
Technology
10
Delphi Cloud
provides key
data and service
connections to MoD
ecosystem
Delphi integrates active safety and automated features
Leveraging our automated driving platform solutions
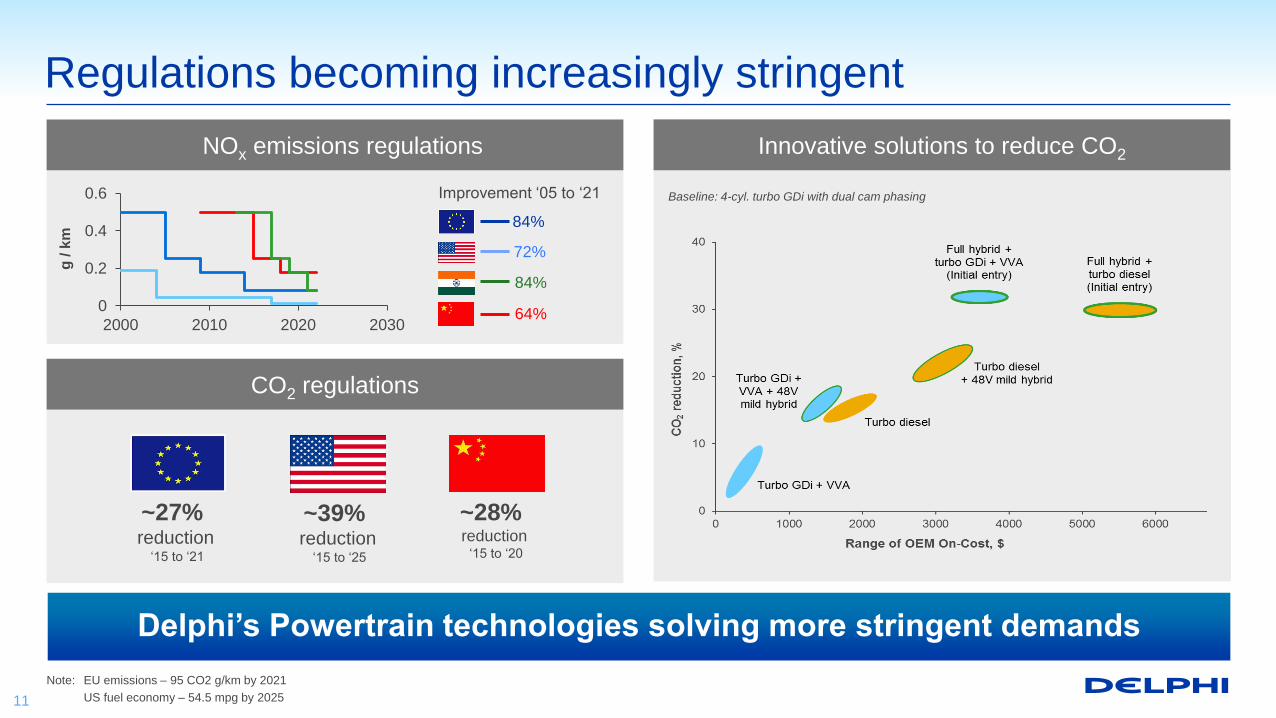
Regulations becoming increasingly stringent
Note: EU emissions – 95 CO2 g/km by 2021
US fuel economy – 54.5 mpg by 2025
NOx emissions regulations Innovative solutions to reduce CO2
CO2 regulations
0
0.2
0.4
0.6
2000 2010 2020 2030
g / k
m
84%
Improvement ‘05 to ‘21
72%
84%
64%
~27%reduction
‘15 to ‘21
~39% reduction
‘15 to ‘25
~28% reduction
‘15 to ‘20
Baseline: 4-cyl. turbo GDi with dual cam phasing
11
Delphi’s Powertrain technologies solving more stringent demands
0
20
40
60
80
100
120
2015 2016 2017 2018 2019 2020 2021 2022 2023 2024 2025
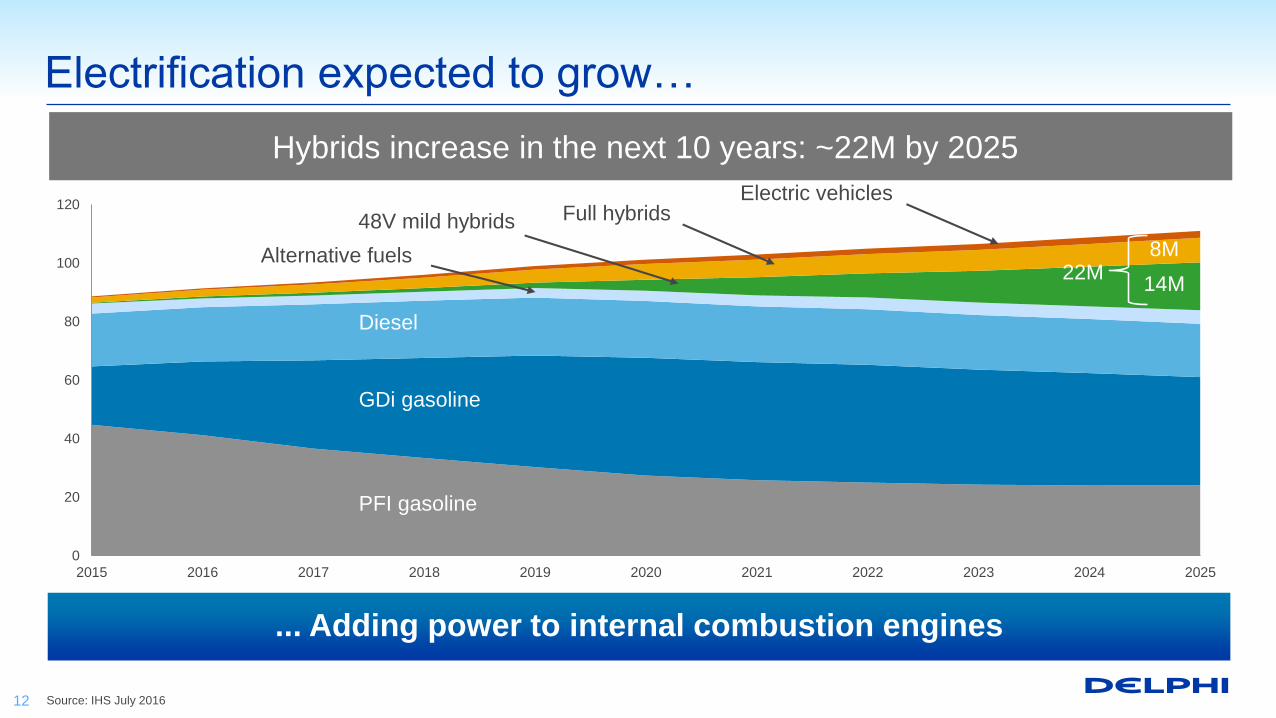
Electrification expected to grow…
Source: IHS July 2016
Hybrids increase in the next 10 years: ~22M by 2025
PFI gasoline
GDi gasoline
Diesel
Alternative fuels
48V mild hybrids Full hybridsElectric vehicles
22M14M
8M
... Adding power to internal combustion engines
12

Select electrification customer awards
Gen-4 global platform ... Battery pack
wiring system
Leading European OEM Hybrid ...
48V electrical system
Electrical architecture wins on all
current production models
Volt & Bolt … A broad portfolio of
electrical architecture
1. 2015-2018; adjusted for FX and commodities
Delivering improved functionality, better performance, greater efficiency
13
Electrification ... CAGR ~ 50%1
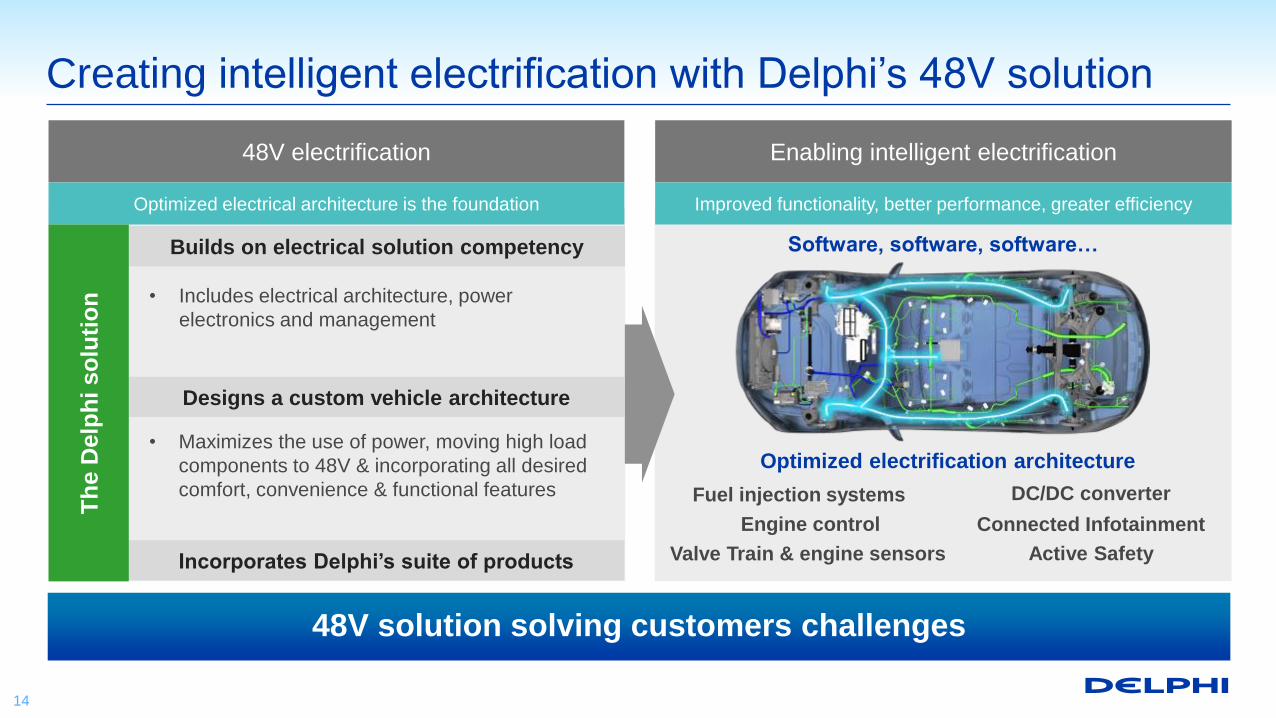
Creating intelligent electrification with Delphi’s 48V solution
Improved functionality, better performance, greater efficiencyOptimized electrical architecture is the foundation
DC/DC converter
Connected InfotainmentEngine control
Active Safety
Builds on electrical solution competency
• Includes electrical architecture, power
electronics and management
Fuel injection systems
Optimized electrification architecture
Valve Train & engine sensors
Software, software, software…
Designs a custom vehicle architecture
• Maximizes the use of power, moving high load
components to 48V & incorporating all desired
comfort, convenience & functional features
Incorporates Delphi’s suite of products
Th
e D
elp
hi s
olu
tio
n
48V electrification Enabling intelligent electrification
14
48V solution solving customers challenges
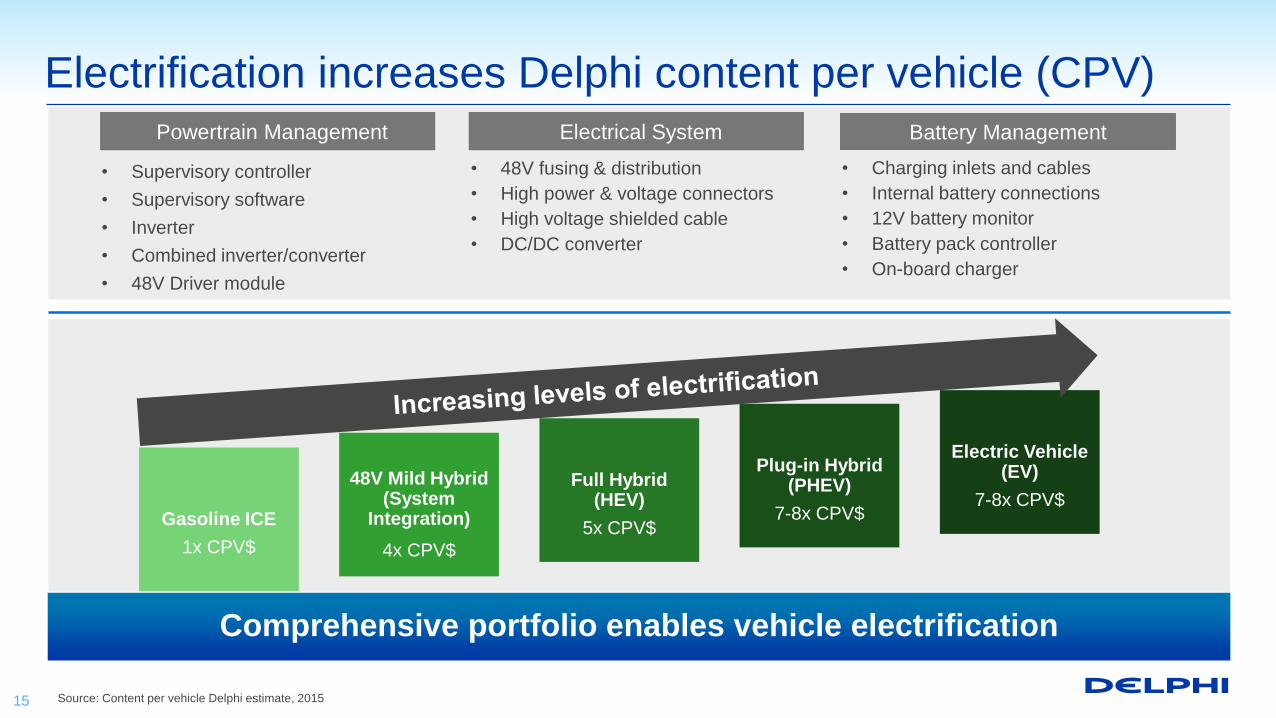
Source: Content per vehicle Delphi estimate, 2015
Electrification increases Delphi content per vehicle (CPV)
Comprehensive portfolio enables vehicle electrification
15
Powertrain Management Battery ManagementElectrical System
• Charging inlets and cables
• Internal battery connections
• 12V battery monitor
• Battery pack controller
• On-board charger
• Supervisory controller
• Supervisory software
• Inverter
• Combined inverter/converter
• 48V Driver module
• 48V fusing & distribution
• High power & voltage connectors
• High voltage shielded cable
• DC/DC converter
Full Hybrid(HEV)
5x CPV$
Plug-in Hybrid (PHEV)
7-8x CPV$
Electric Vehicle (EV)
7-8x CPV$48V Mild Hybrid
(System Integration)
4x CPV$
Gasoline ICE
1x CPV$
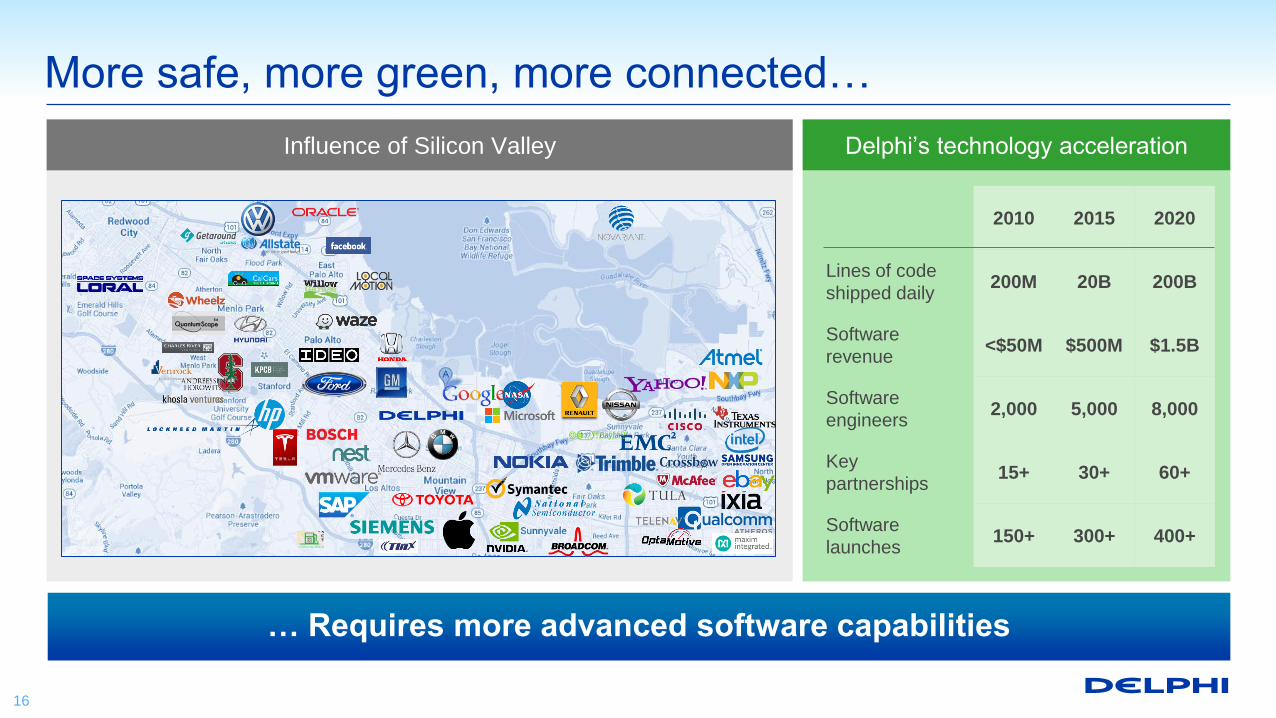
Influence of Silicon Valley
More safe, more green, more connected…
2010 2015 2020
Lines of code
shipped daily200M 20B 200B
Software
revenue<$50M $500M $1.5B
Software
engineers2,000 5,000 8,000
Key
partnerships15+ 30+ 60+
Software
launches150+ 300+ 400+
Delphi’s technology acceleration
… Requires more advanced software capabilities
16
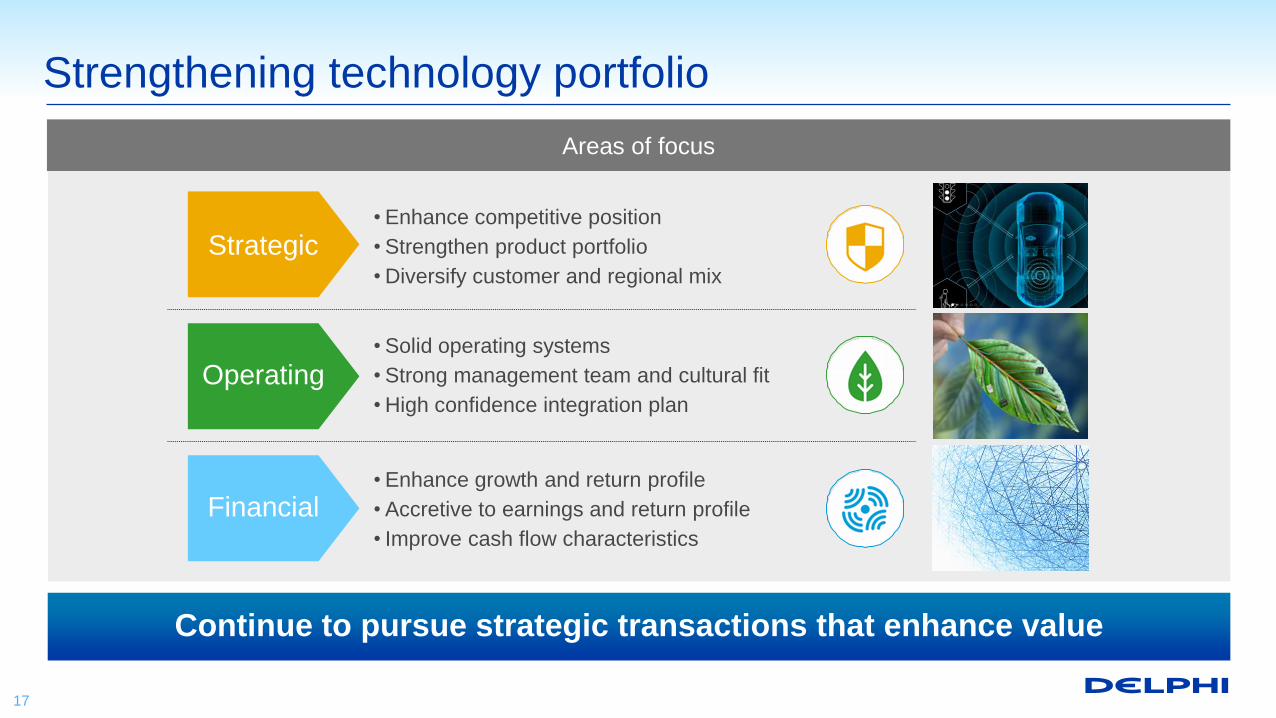
Strengthening technology portfolio
Areas of focus
Operating• Solid operating systems
• Strong management team and cultural fit
• High confidence integration plan
Strategic• Enhance competitive position
• Strengthen product portfolio
• Diversify customer and regional mix
Financial• Enhance growth and return profile
• Accretive to earnings and return profile
• Improve cash flow characteristics
Continue to pursue strategic transactions that enhance value
17
J.P. Morgan Auto Conference
Joe MassaroChief Financial Officer and Senior Vice President
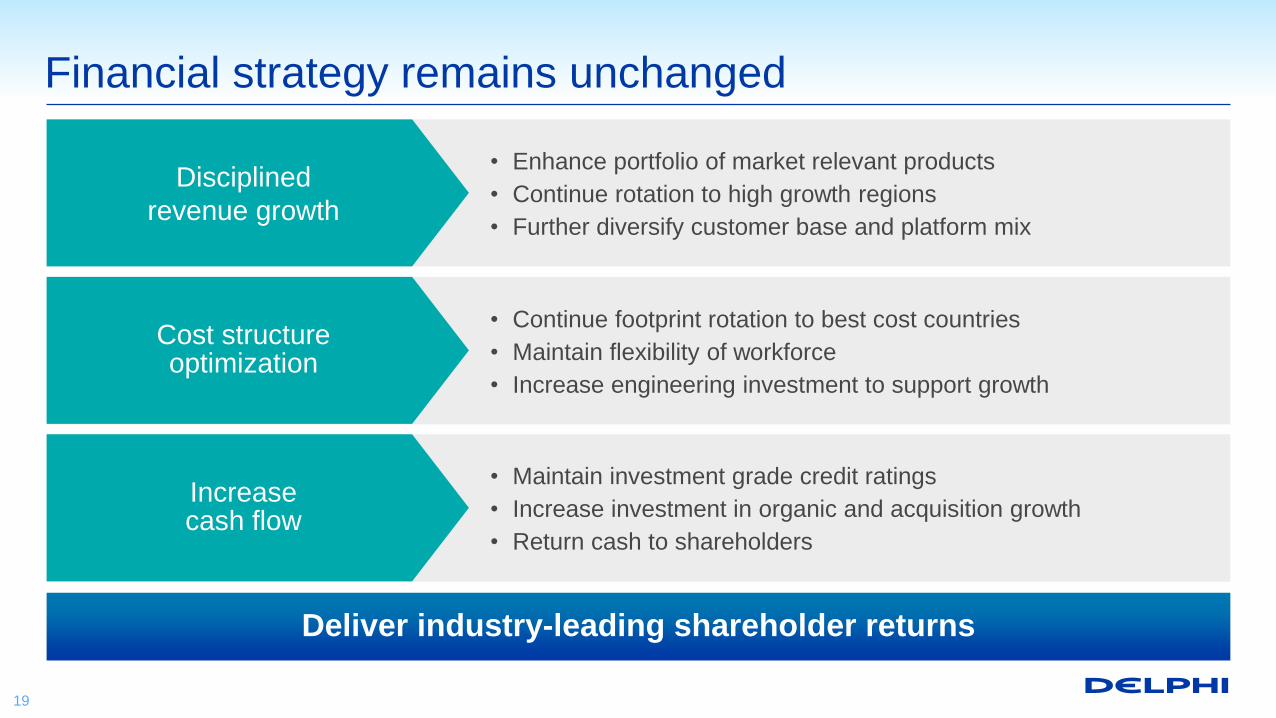
Financial strategy remains unchanged
Disciplined
revenue growth
Cost structure optimization
Increase cash flow
• Enhance portfolio of market relevant products
• Continue rotation to high growth regions
• Further diversify customer base and platform mix
• Continue footprint rotation to best cost countries
• Maintain flexibility of workforce
• Increase engineering investment to support growth
• Maintain investment grade credit ratings
• Increase investment in organic and acquisition growth
• Return cash to shareholders
Deliver industry-leading shareholder returns
19
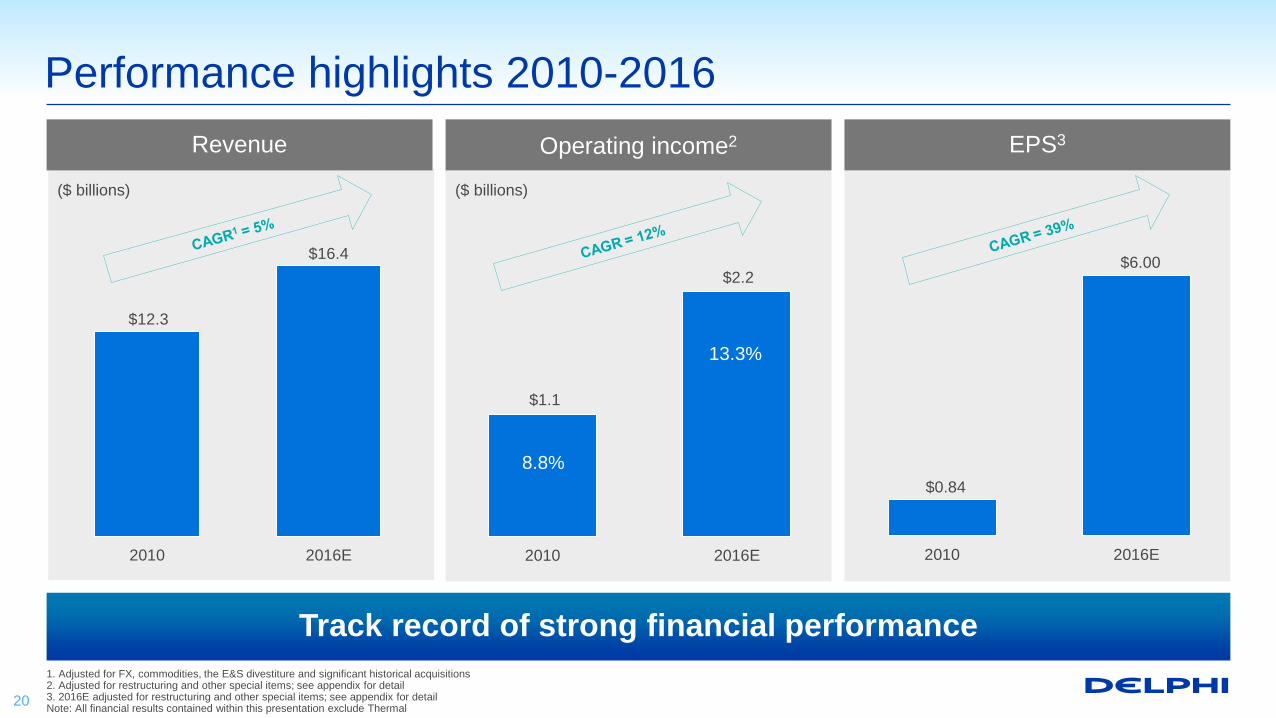
Performance highlights 2010-2016
1. Adjusted for FX, commodities, the E&S divestiture and significant historical acquisitions2. Adjusted for restructuring and other special items; see appendix for detail 3. 2016E adjusted for restructuring and other special items; see appendix for detailNote: All financial results contained within this presentation exclude Thermal
Track record of strong financial performance
$1.1
$2.2
2010 2016E
Operating income2 EPS3Revenue
($ billions) ($ billions)
20
$0.84
$6.00
2010 2016E
8.8%
13.3%
$16.4
$12.3
2010 2016E
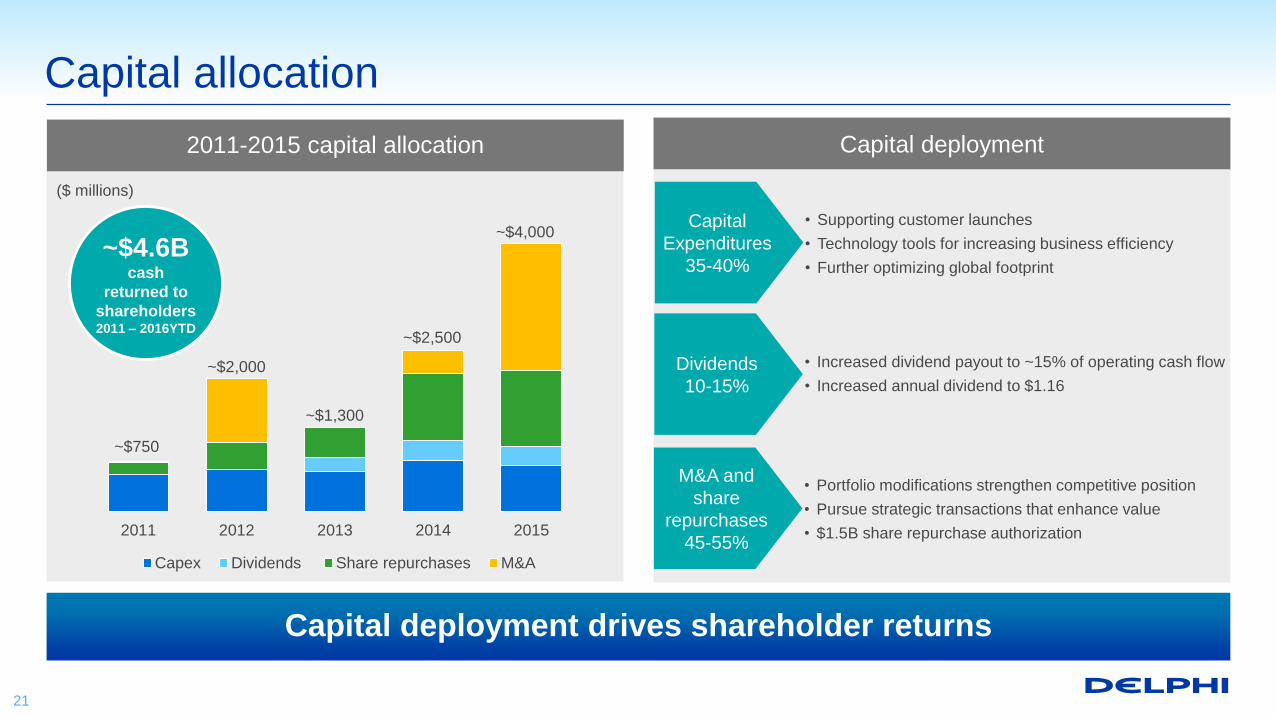
Capital allocation
~$750
~$2,000
~$2,500
~$1,300
2011 2012 2013 2014 2015
Capex Dividends Share repurchases M&A
~$4,000
2011-2015 capital allocation
($ millions)
Capital deployment drives shareholder returns
21
Dividends
10-15%
• Increased dividend payout to ~15% of operating cash flow
• Increased annual dividend to $1.16
Capital
Expenditures
35-40%
• Supporting customer launches
• Technology tools for increasing business efficiency
• Further optimizing global footprint
M&A and
share
repurchases
45-55%
• Portfolio modifications strengthen competitive position
• Pursue strategic transactions that enhance value
• $1.5B share repurchase authorization
Capital deployment
~$4.6Bcash
returned to
shareholders 2011 – 2016YTD

2015
Refocused core portfolio
2015
Software for automated driving
Value enhancing portfolio modifications
2012
(MVL)
Strengthened leading position in connectors
2015 Thermal divestituresWholly owned and
Korean JV
Refocused E&S portfolio
2015
Solid state LiDAR startup
2015
Software-as-a-service for data management
2014
Expanded connectivity products portfolio
2014
Reception Systems divestiture
Expanded connectivity products portfolio
2015
Software for dynamic cylinder deactivation
2015
Enhanced position in electrical architecture
Investment DivestitureAcquisition
2016
Thermal divestitureChina JV
Refocusedcore portfolio
2016
Multi-layer 3D display technology
Unwired
Transactions have increased shareholder value
22
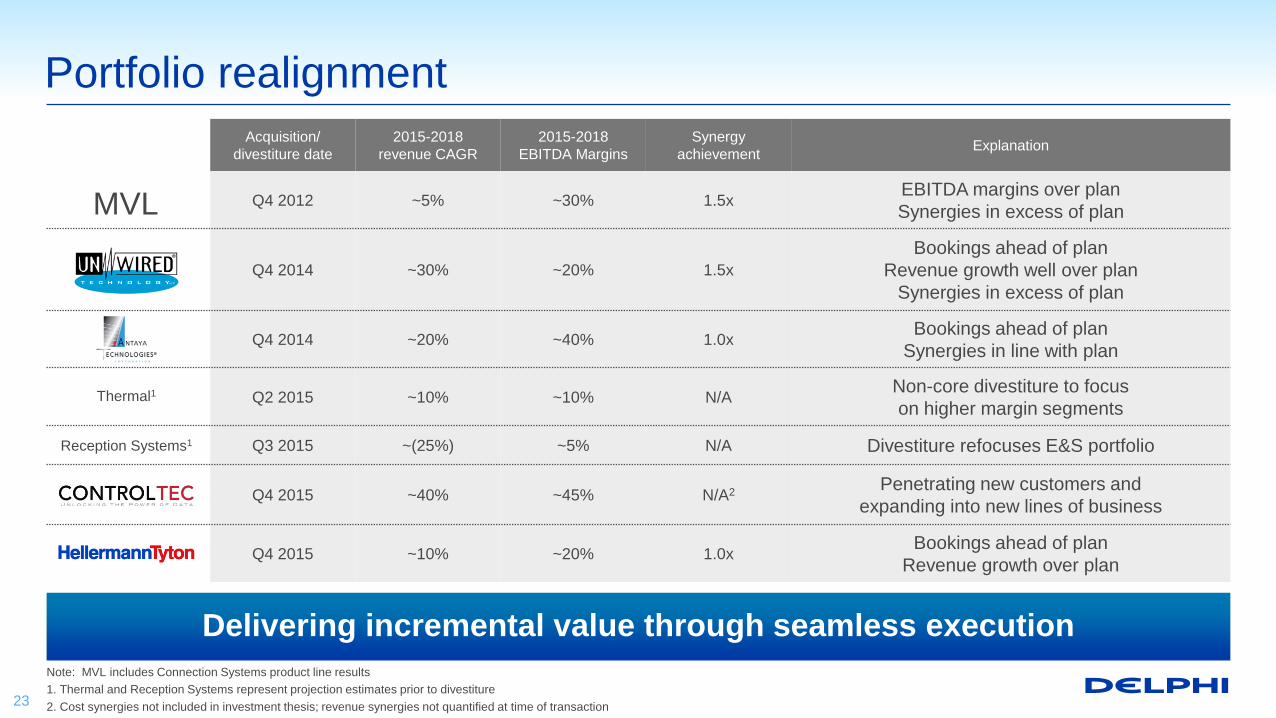
Acquisition/
divestiture date
2015-2018
revenue CAGR
2015-2018
EBITDA Margins
Synergy
achievementExplanation
Q4 2012 ~5% ~30% 1.5xEBITDA margins over plan
Synergies in excess of plan
Q4 2014 ~30% ~20% 1.5x
Bookings ahead of plan
Revenue growth well over plan
Synergies in excess of plan
Q4 2014 ~20% ~40% 1.0xBookings ahead of plan
Synergies in line with plan
Q2 2015 ~10% ~10% N/ANon-core divestiture to focus
on higher margin segments
Q3 2015 ~(25%) ~5% N/A Divestiture refocuses E&S portfolio
Q4 2015 ~40% ~45% N/A2Penetrating new customers and
expanding into new lines of business
Q4 2015 ~10% ~20% 1.0xBookings ahead of plan
Revenue growth over plan
Portfolio realignment
Note: MVL includes Connection Systems product line results
1. Thermal and Reception Systems represent projection estimates prior to divestiture
2. Cost synergies not included in investment thesis; revenue synergies not quantified at time of transaction
Thermal1
Reception Systems1
MVL
Delivering incremental value through seamless execution
23
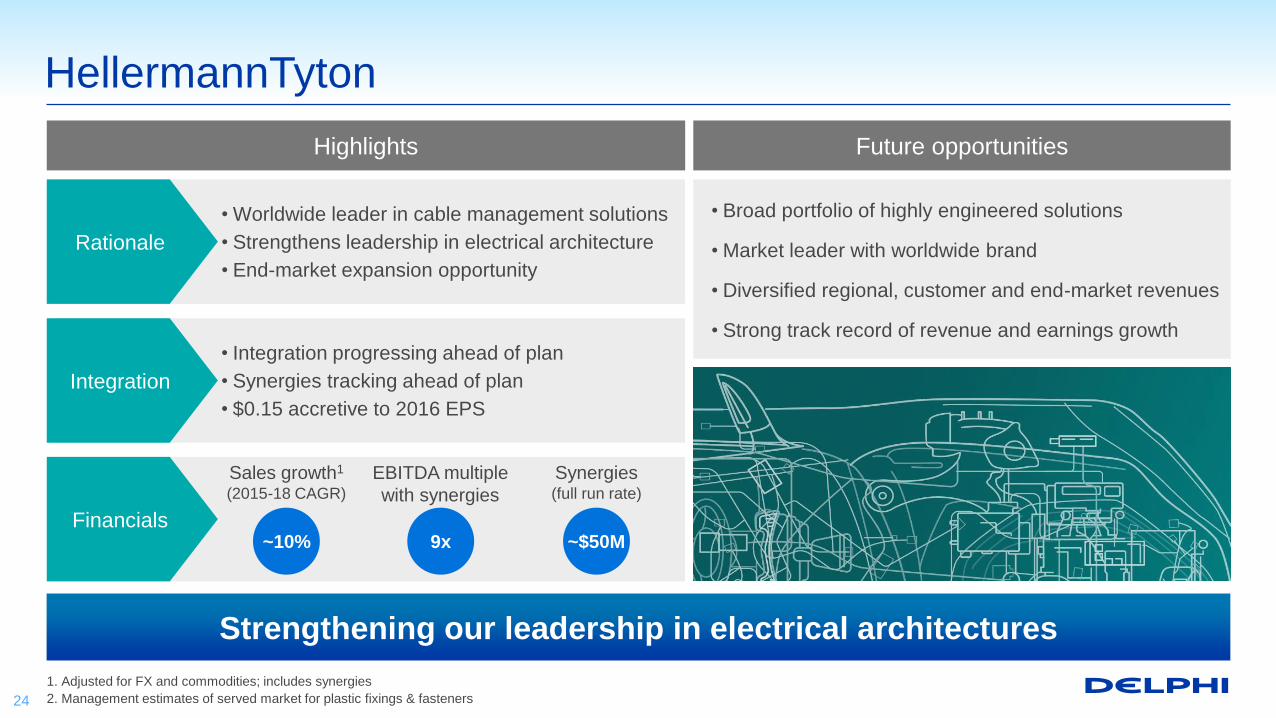
HellermannTyton
1. Adjusted for FX and commodities; includes synergies
2. Management estimates of served market for plastic fixings & fasteners
Future opportunitiesHighlights
Financials
• Broad portfolio of highly engineered solutions
• Market leader with worldwide brand
• Diversified regional, customer and end-market revenues
• Strong track record of revenue and earnings growth
Integration
• Integration progressing ahead of plan
• Synergies tracking ahead of plan
• $0.15 accretive to 2016 EPS
Sales growth1
(2015-18 CAGR)
EBITDA multiple
with synergies
Synergies(full run rate)
~10% 9x ~$50M
Rationale
• Worldwide leader in cable management solutions
• Strengthens leadership in electrical architecture
• End-market expansion opportunity
Strengthening our leadership in electrical architectures
24
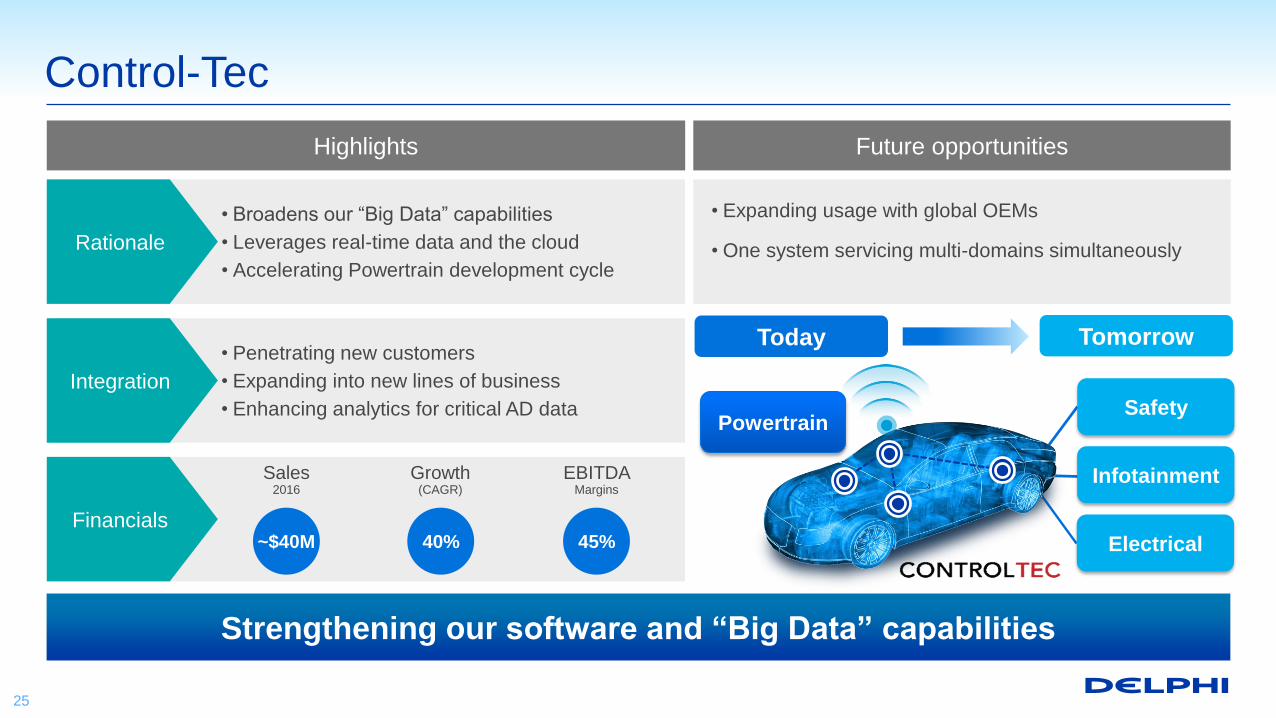
Control-Tec
Future opportunitiesHighlights
Financials
• Expanding usage with global OEMs
• One system servicing multi-domains simultaneously
Integration
• Penetrating new customers
• Expanding into new lines of business
• Enhancing analytics for critical AD data
Sales2016
Growth(CAGR)
EBITDA Margins
~$40M 40% 45%
Rationale
• Broadens our “Big Data” capabilities
• Leverages real-time data and the cloud
• Accelerating Powertrain development cycle
Strengthening our software and “Big Data” capabilities
25
Safety
Infotainment
Electrical
Powertrain
TomorrowToday
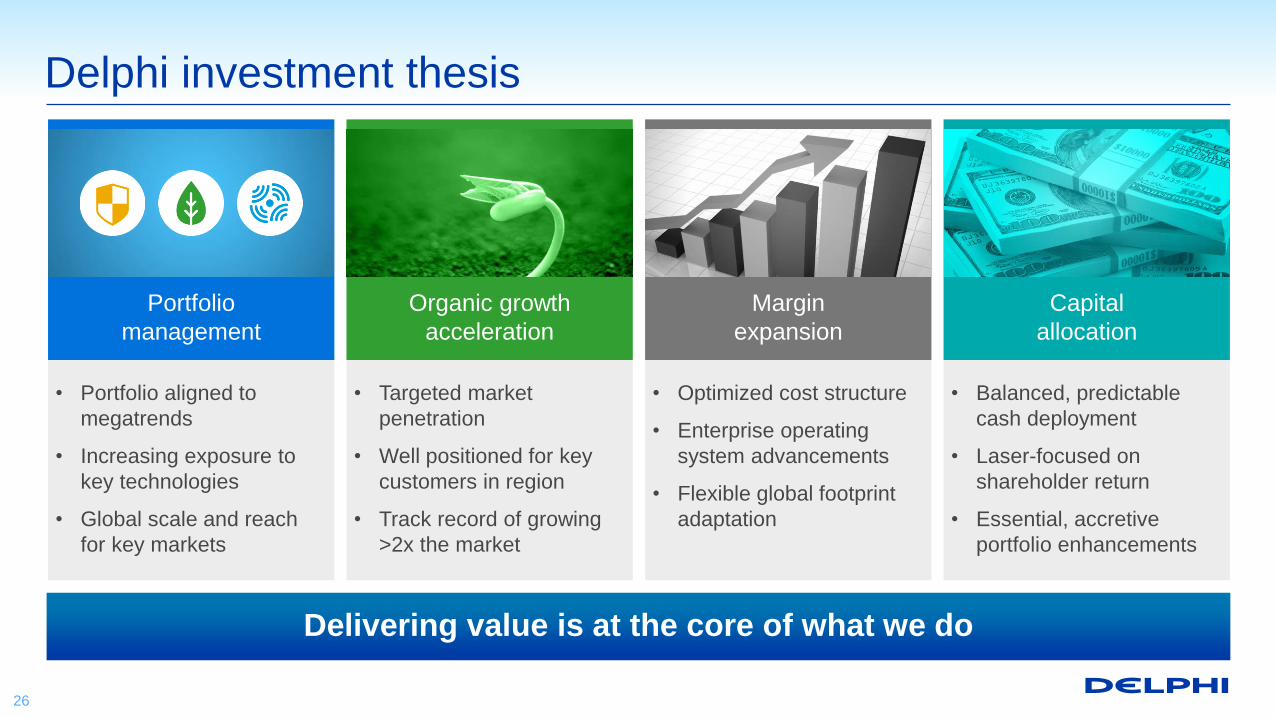
Delphi investment thesis
Organic growth
acceleration
• Targeted market
penetration
• Well positioned for key
customers in region
• Track record of growing
>2x the market
• Optimized cost structure
• Enterprise operating
system advancements
• Flexible global footprint
adaptation
• Balanced, predictable
cash deployment
• Laser-focused on
shareholder return
• Essential, accretive
portfolio enhancements
Margin
expansion
Capital
allocation
• Portfolio aligned to
megatrends
• Increasing exposure to
key technologies
• Global scale and reach
for key markets
Portfolio
management
26
Delivering value is at the core of what we do
Making it possible.

Appendix
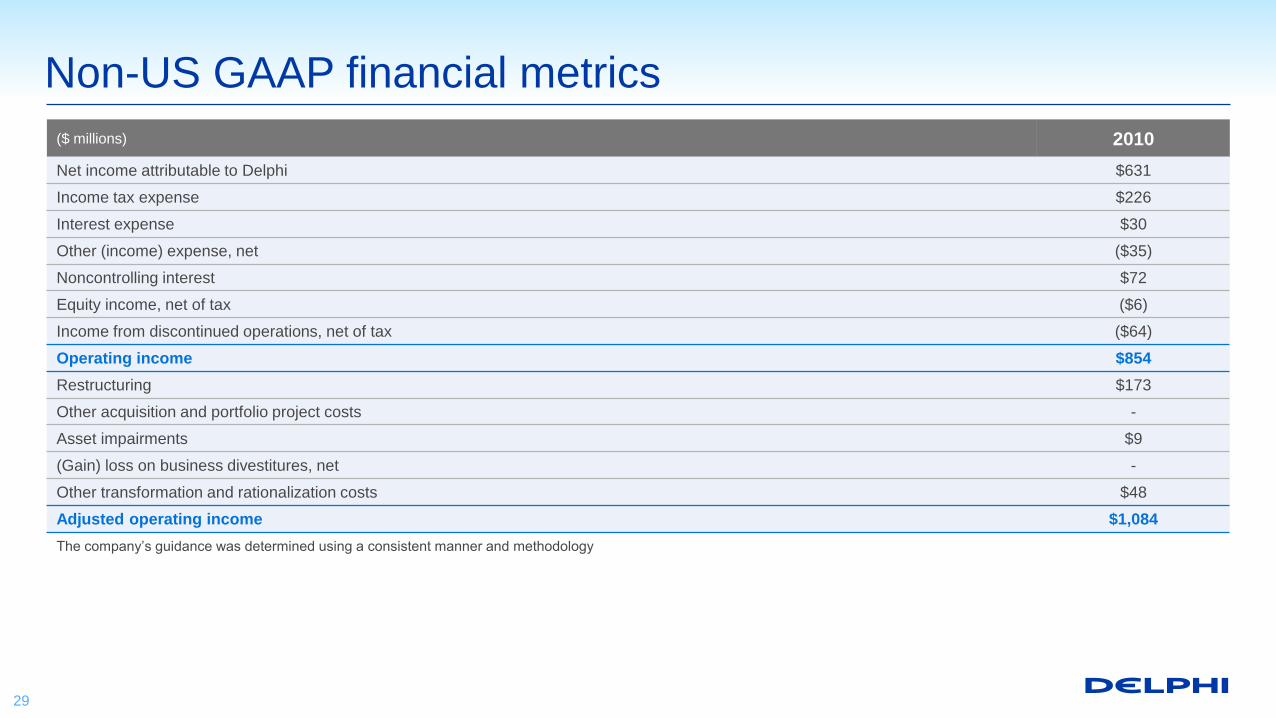
($ millions) 2010
Net income attributable to Delphi $631
Income tax expense $226
Interest expense $30
Other (income) expense, net ($35)
Noncontrolling interest $72
Equity income, net of tax ($6)
Income from discontinued operations, net of tax ($64)
Operating income $854
Restructuring $173
Other acquisition and portfolio project costs -
Asset impairments $9
(Gain) loss on business divestitures, net -
Other transformation and rationalization costs $48
Adjusted operating income $1,084
The company’s guidance was determined using a consistent manner and methodology
Non-US GAAP financial metrics
29

($ millions) 2015
Net income attributable to Delphi $1,450
Income from discontinued operations attributable to Delphi, net of tax ($262)
Income from continuing operations attributable to Delphi $1,188
Adjusting items:
Restructuring $177
Other acquisition and portfolio project costs $47
Asset impairments $16
(Gain) loss on business divestitures, net $8
Debt extinguishment costs $58
Transaction and related costs associated with acquisitions $43
Contingent consideration liability fair value adjustment ($7)
Tax impact of adjusting items (a) ($35)
Adjusted net income attributable to Delphi $1,495
Weighted average number of diluted shares outstanding 286.64
Diluted net income per share from continuing operations attributable to Delphi $4.14
Adjusted net income per share $5.22
(a) Represents the income tax impacts of the adjustments made for restructuring and other special items, as well as the elimination of the net impact of deferred tax asset valuation
allowance changes in estimates of $12 million.
The company’s guidance was determined using a consistent manner and methodology
Non-US GAAP financial metrics
30


![Bank of America Securities 2020 Virtual Health Care Conferences22.q4cdn.com/365241770/files/doc_presentations/... · 5/12/2020 · [ 1 ] Certain statements in this presentation,](https://img.pdfslide.us/doc/110x75/6043ee4ba4137b2fd66588a4/bank-of-america-securities-2020-virtual-health-care-conferences22q4cdncom365241770filesdocpresentations.jpg)