Embed Size (px)
Citation preview

Half-year 2008 Results
August 1, 2008

Schneider Electric 2- Investor Relations – Half-year results – 1 August 2008
Overview03Strategy & Business Update09
20 Financial results34 Outlook

Overview

Schneider Electric 4- Investor Relations – Half-year results – 1 August 2008
Energy production
EnergyManagement
Energy usage
ThermalNuclearGensetHydroSolarWind
AppliancesLightingHVACLifts
Motors MachinesConveyorsIT servers
Schneider ElectricSolutions
Schneider Electric is the global specialistin Energy Management

Schneider Electric 5- Investor Relations – Half-year results – 1 August 2008
Schneider Electric is the global specialistin Energy Management
• Protection to people & assets
We offer…
Help ourcustomers make themost of
their energy
• Ultra secured power forcritical applications
• Energy efficiency• Open & integrated systems for
optimised Capex and Opex
• Automation everywhere• Connectivity everywhere• Services at every phase of
the lifecycle
We make energy…
Reliable
Productive
Safe
Efficient
Green • Renewable energy solutions

Schneider Electric 6- Investor Relations – Half-year results – 1 August 2008
We make energy…
Reliable
Productive
Safe
Efficient
Power & Control
Thanks to leading positions in…
Critical power
Energy Efficiency
Automation
#
#
#
Top
With a unique business portfolio and leading positions worldwide
57%
29%
14%
% of sales
20%

Schneider Electric 7- Investor Relations – Half-year results – 1 August 2008
● 32% of sales in emerging
countries with 10-year
organic CAGR of +13%
● 27% of business now
in Critical Power and
Energy Efficiency
● 33% of exposure to
infrastructure and datacenters end-markets
Attractive & diversified business exposure2001 2007
Residential
Industry
Buildings
Datacenters & Networks
Energy &Infrastructure
EnergyEfficiency
CriticalPower
Industry
Residential
Traditional businesses
Energy &Infrastructure
Buildings
EmergingCountries Emerging
Countries
Schneider Electric 8- Investor Relations – Half-year results – 1 August 2008
Low cost
Low cost
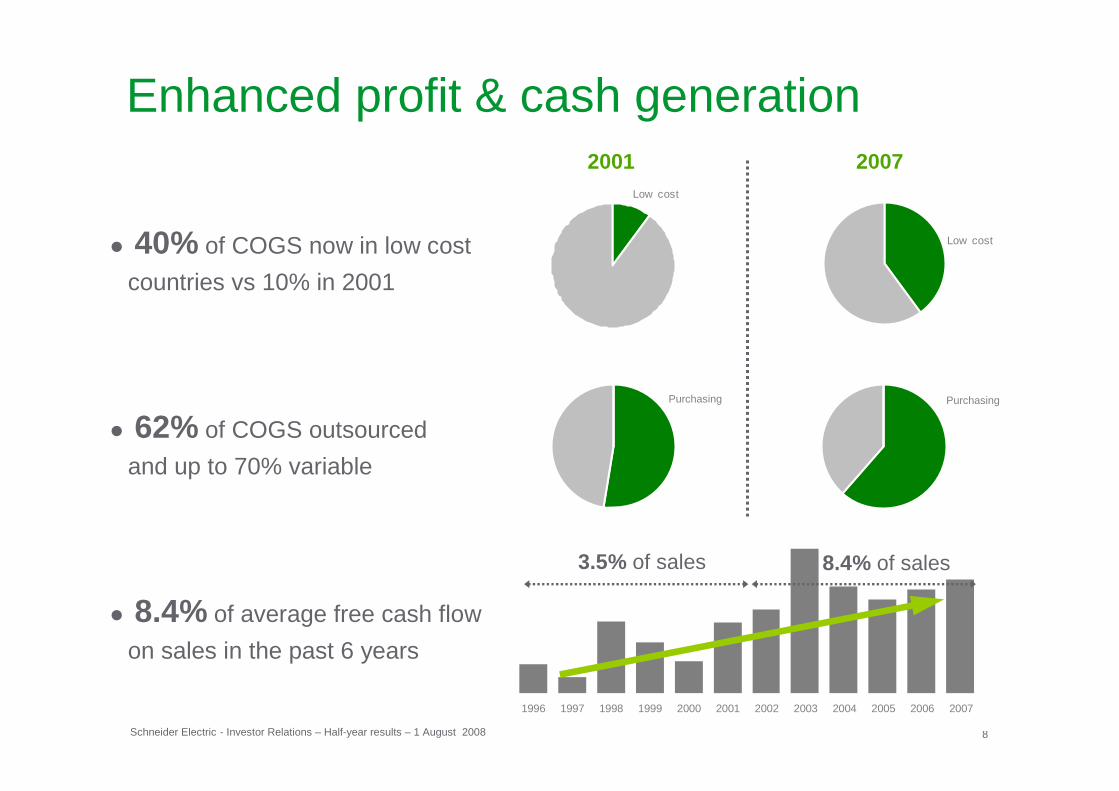
1996 1997 1998 1999 2000 2001 2002 2003 2004 2005 2006 2007
● 40% of COGS now in low cost
countries vs 10% in 2001
● 62% of COGS outsourced
and up to 70% variable
● 8.4% of average free cash flow
on sales in the past 6 years
2001 2007
Enhanced profit & cash generation
3.5% of sales 8.4% of sales
Purchasing Purchasing

Strategy& BusinessUpdate

Schneider Electric 10- Investor Relations – Half-year results – 1 August 2008
Robust first-half results, demonstrating a solid business profile
H1 2008 Change
+10.6%Organic sales growth
x2.4675Free cash flow+16.7%851Net income
15.0%1,346
8,946
+14.6%EBITA+0.8ptEBITA margin
+8.4%Sales
€m
● +10.6% organic growth, continuation
of sustained trend in Q2
● 15.0% all-time high EBITA margin,
improvement by 0.8pt
● +16.7% increase in net income
● x2.4 in free cash flow, thanks to the
low capital intensive model
● +60% increase in APC-MGE EBITA
at 13.3% and successful start for Pelco integration

Schneider Electric 11- Investor Relations – Half-year results – 1 August 2008
Strong organic growth in first-half 2008
Sales organic growth by region
* Emerging countries: Eastern Europe + Asia-Pacific+ Rest of the World
Sales organic growth by business
H1 2008
+18%Emerging countries*+10.6%+21.6%+16.6%+5.7%
+9.0%
Rest of the World
North AmericaAsia-Pacific
Group
Europe
H1 2008
+16%
+17%+4%
+17%
+12%
Services
Building AutomationUltra Terminal
Energy efficiency
Critical Power**
** This figure indicates the sales performance of the Critical Power & Cooling Services “business unit”on a 6-month proforma basis in 2007 (excluding MGE Small Systems)
Schneider Electric 12- Investor Relations – Half-year results – 1 August 2008
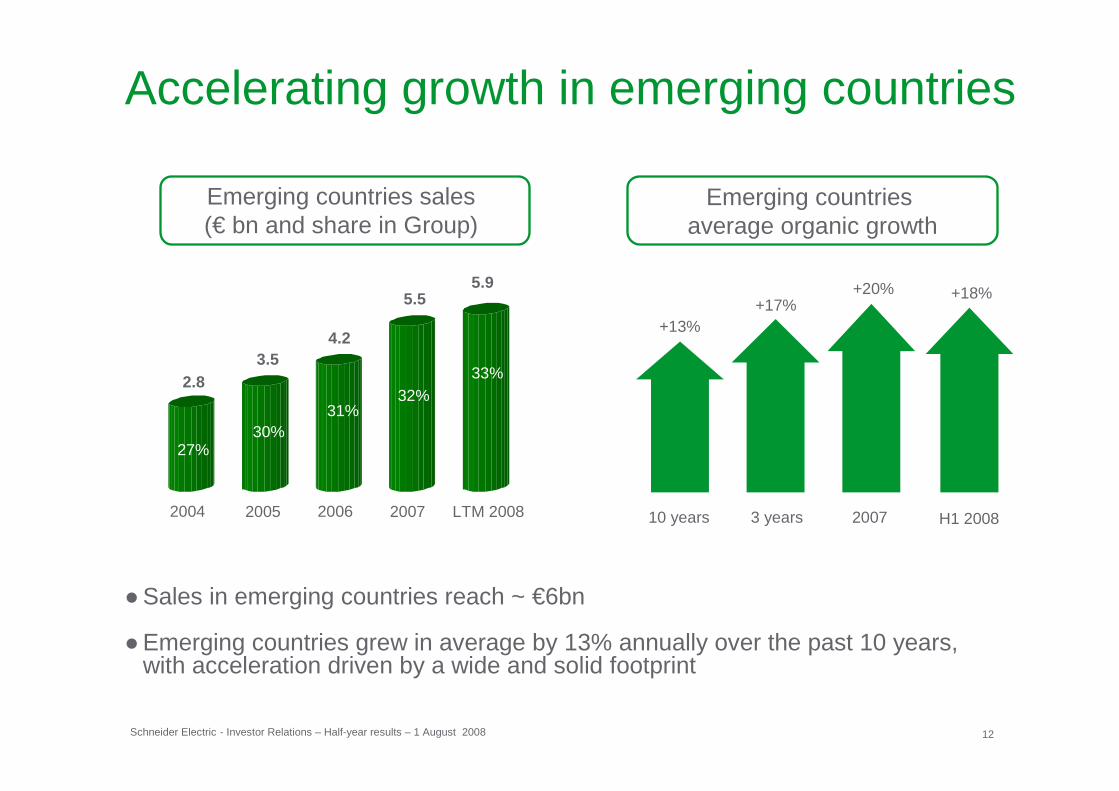
Accelerating growth in emerging countries
●Sales in emerging countries reach ~ €6bn
●Emerging countries grew in average by 13% annually over the past 10 years,with acceleration driven by a wide and solid footprint
Emerging countries sales (€ bn and share in Group)
10 years 3 years 2007
+13%+17%
+20%
2004 2005 2006 2007
2.83.5
4.2
5.5
27%30%
31%32%
Emerging countries average organic growth
H1 2008
+18%
33%
LTM 2008
5.9

Schneider Electric 13- Investor Relations – Half-year results – 1 August 2008
Industry & Infrastructure
Renovation can yield up to 30% of energy savings
EE products may save 10% to 40% in electricity
Lighting controlClimate control
Heating monitoringShutter control
Electric motor systemsPower metering
Energy management systemsAutomation solutions
HVAC & climate controlLighting control
Building management systemsPower factor correction
Average facility can reduceconsumption by 20% to 30%
Buildings Residential
Energy efficiency: a €4 bn business, growing at 15%
Up to 30% energy savings now everywhere
Data centers & networks
Power & cooling can lead to 20% to 30% savings
Critical Power solutionsPrecise cooling
Recommended architecturesSimulation software

Schneider Electric 14- Investor Relations – Half-year results – 1 August 2008
Natural resources
Utilities
Hospitals,Hotels etc.
43%
26%
16%
12%
17%
29%
32%
8%
17%
Strategic repositioning allows a diversified and well balanced end market exposure
Buildings
Industry
Energy & Infrastructure
Residential
Data Centers & Networks
2001 2007
Data centers
Hoisting, Packaging etc.
High growth market segments

Schneider Electric 15- Investor Relations – Half-year results – 1 August 2008
60% of business enjoy >10% structural growth prospects over the coming years
2001 2007
82%
18%
40%
10%
20%
35%60%
growing>10%
82% growing at GDP+
Emergingcountries
Energyefficiency
Key marketssegments*
Overlap (5%)
Othermarkets
* Data centers, natural resources, utilities (€ 5bn in total)

Schneider Electric 16- Investor Relations – Half-year results – 1 August 2008
Tomorrow
Tapping new efficiency reservoirs to generate sustainable productivity
Before
Production mainly in mature countries
Country-based organization
Country-basedintegration and duplications
Rebalancing to emerging countries
Regional logistics, start in purchasing
Accelerated integration of acquisitions
Today
Optimization on a worldwide basis
Full benefits of scale
Lean structure,unified processes & costs reduction
Rebalancing
Globalization(supply chain, IT, administration)
Simplification

Schneider Electric 17- Investor Relations – Half-year results – 1 August 2008
● Cost rebalancing already achieved in 2007, 2008 target to be beaten with 42% of COGS in low-cost countries including APC and Pelco
● € / $ transaction risk eliminated: negligible impact on EBITA margin from 2008
COGS in low cost countries
Production basein low cost countries
2004 2005 2006 2007
Sales inemergingcountries
18%
24%28%
2001 2004 2007
13%
21%
49%
2008Target
42%40%
Deploying a strong sourcing and manufacturing base in emerging countries
32%
39%
55%SourcingManufacturingheadcount

Schneider Electric 18- Investor Relations – Half-year results – 1 August 2008
Delivering on new² efficiency initiatives
Results*Efficiency initiatives
* 2008 forecast** Impact on EBITA as % of sales
● Rebalancing ● 42% of COGS in emerging countries
● Productivity ● 4.5% of products COGS on average
● Logistics costs ● Down 1.6pt **
● IT costs ● Down 1pt **
● Customer service ● On-time delivery rate up 3pts● Customer satisfaction ● Very satisfied customers rate up 20%
● Support function costs ● Down 2.5pts **

Schneider Electric 19- Investor Relations – Half-year results – 1 August 2008
Delivering on new² financial targets
Results*Indicator Targets 2005-2008
* 2008 forecast
● Organic sales growth
● ≥≥≥≥ 5% ● ~10%
● Dividend payout ● ~50% ● 50%
● EBITA margin ● 12.5%-14.5% ● ≥≥≥≥ 15.0%
● ROCE ● up 2pts to 4pts ● up 2pts (including acquisitions)
Sustainable development barometer 8.0/10 7.9/10 (at end-March)

Finance presentation

Schneider Electric 21- Investor Relations – Half-year results – 1 August 2008
Reported figuresIn m€ H1 2007 H1 2008 Change
+10.6%Organic growth
+12.7%3.563.16Earnings per share+16.7%851729Net income
(313)(293)Income tax(119)(107)Net financial expense
+0.8pt15.0%14.2%Margin %1,175
16.8%1,385
40.9%3,378
8,254
+1.3pt18.1%Margin %+16.9%1,619EBITDA
+8.7%3,671Gross profit+0.1pt41.0%Margin %
+14.6%1,346EBITA*
+8.4%8,946Sales
* Before amortization of purchase accounting intangibles of €49m in H1 2008 (€27m in H1 2007) and including restructuring costs & impairment of €53m in H1 2008 (€61m in H1 2007)
All-time high EBITA margin at 15%, net income up 17%
Schneider Electric 22- Investor Relations – Half-year results – 1 August 2008
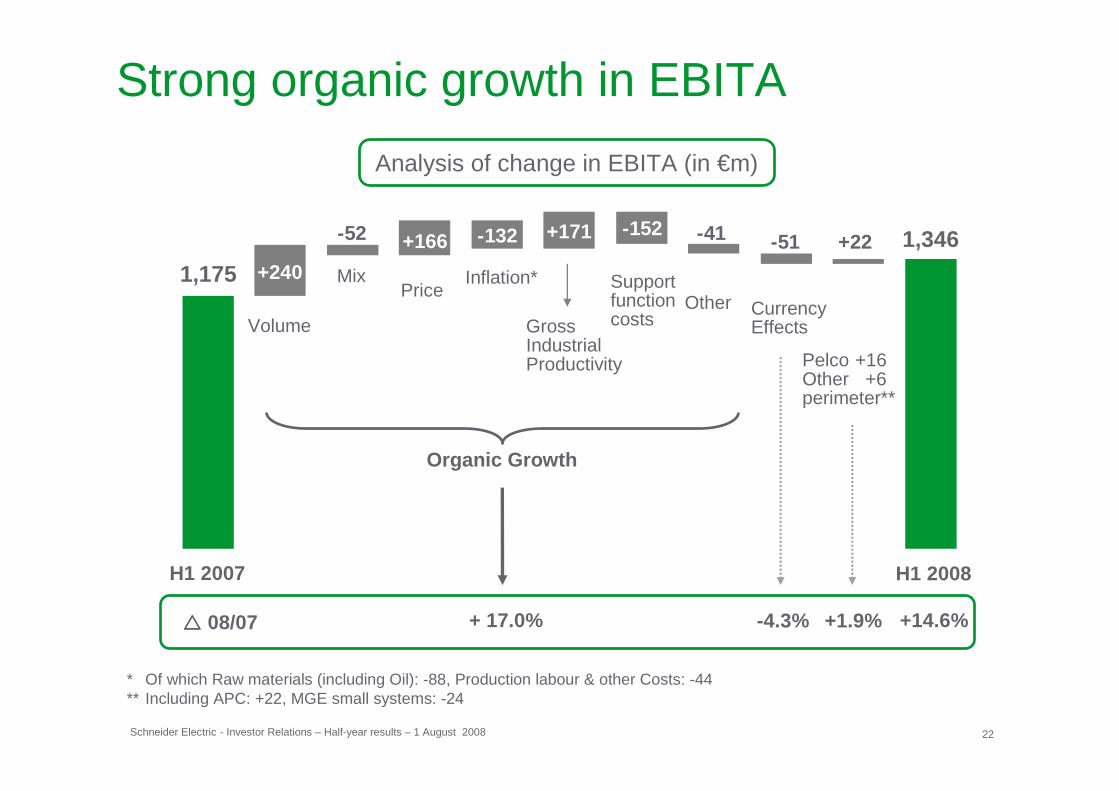
Strong organic growth in EBITA
H1 2008H1 2007
Volume GrossIndustrialProductivity
CurrencyEffects
Other
Organic Growth
* Of which Raw materials (including Oil): -88, Production labour & other Costs: -44** Including APC: +22, MGE small systems: -24
Mix Support functioncosts
Inflation*
Pelco +16Other +6 perimeter**
Price
+ 17.0% -4.3% +1.9%���� 08/07 +14.6%
Analysis of change in EBITA (in €m)
1,175 +240
-52 +171 -152+166 -132 1,346-51 +22-41

Schneider Electric 23- Investor Relations – Half-year results – 1 August 2008
Robust pricing outpaces inflation impact
2007
Pricing in % of Inflation
H1 2008
Inflation & Pricing impact (in €m)
Raw materials
Oil Labour& other
Totalinflation(COGS)
Pricing
78
1044
132
166
Inflation Pricing
126%
109%

Schneider Electric 24- Investor Relations – Half-year results – 1 August 2008
The good level of productivity is driven by purchasing savings
Breakdown of productivity gains (in €m)
* Excluding cost of sales for services and related businesses
H1 2007 H1 2008
3.8%3.6%As % of products’ cost of sales*126193327
47
26Other plans
26Lean Manufacturing34Rebalancing
171Gross industrial productivity
85Purchasing

Schneider Electric 25- Investor Relations – Half-year results – 1 August 2008
* Corporate costs of -1.8% of sales in H1 2008 (-1.7% in H1 2007)
Breakdown by region(before corporate costs*)
All geographies at high margins with Asia-Pacific catching up
17.7%
19.0%
677+1.3 pt
-0.8 pt
+3.1 pts
-0.2 pt
775
345
343
181
252
109
134
14.3%
15.1%
15.4%
12.3%
16.1%
16.3%
Europe
NorthAmerica
Asia-Pacific
Rest of theWorld
H1 2007H1 2008
Europe46%
North America27%
Asia-Pacific18%
Rest of the World
9%
Sales €8,946m

Schneider Electric 26- Investor Relations – Half-year results – 1 August 2008
* Corporate costs of -1.8% of sales in H1 2008 (-1.7% in H1 2007)** Results of the business unit on a 6-month basis (without MGE Small Systems business)
Breakdown by business(before corporate costs*)
Profitability increases across businesses
ElectricalDistribution
Automation & Control
CriticalPower**
+0.8 pt
+1.1 pt
+3.9 pts
930
848
412
341
163
117
17.9%
18.7%
14.2%
15.3%
9.4%
13.3%
Electrical Distribution
56%
Critical Power14%
Automation & Control
30%
Sales €8,946m
H1 2007H1 2008
Schneider Electric 27- Investor Relations – Half-year results – 1 August 2008
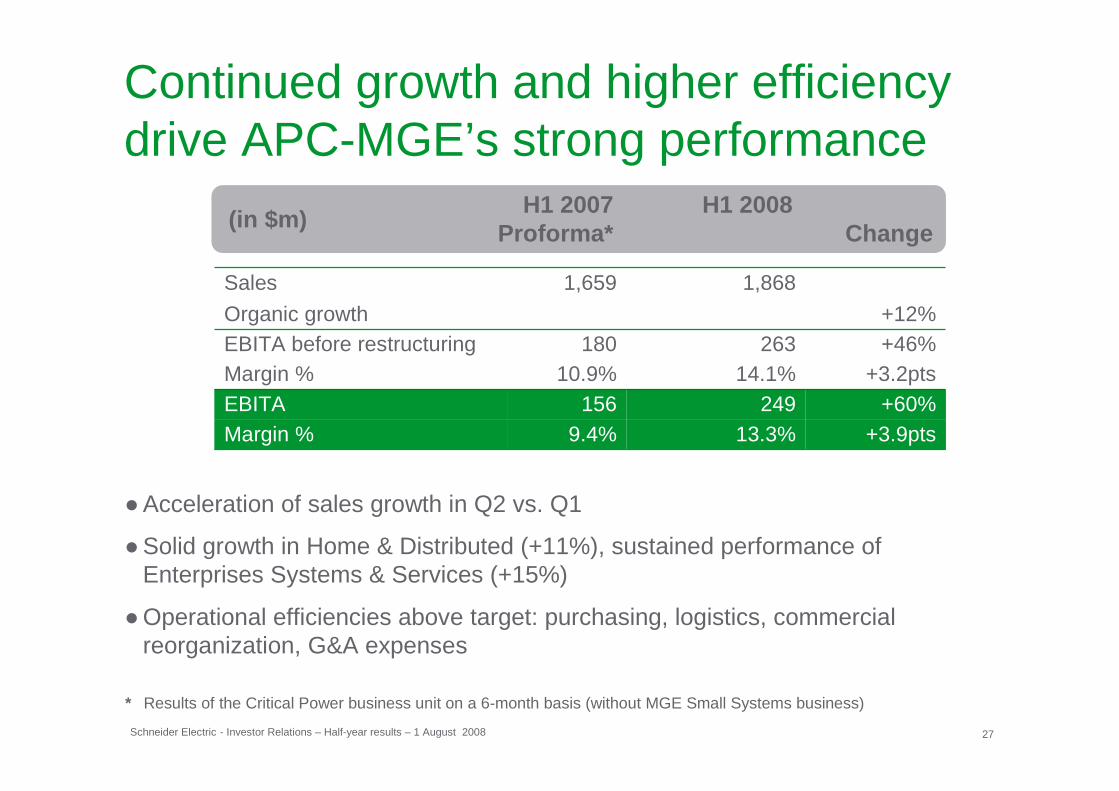
Continued growth and higher efficiency drive APC-MGE’s strong performance
●Acceleration of sales growth in Q2 vs. Q1
●Solid growth in Home & Distributed (+11%), sustained performance of Enterprises Systems & Services (+15%)
●Operational efficiencies above target: purchasing, logistics, commercial reorganization, G&A expenses
* Results of the Critical Power business unit on a 6-month basis (without MGE Small Systems business)
H1 2007 H1 2008 Proforma* Change
+3.9pts13.3%9.4%Margin %+60%249156EBITA
+3.2pts14.1%10.9%Margin %180
1,659
+46%263EBITA before restructuring+12%Organic growth
1,868Sales
(in $m)

Schneider Electric 28- Investor Relations – Half-year results – 1 August 2008
Pelco results confirm the Group’s post-merger integration capabilities
●H1 2008 EBITDA above targetdue to cost savings and synergies & despite soft organic growth
●2011 EBITDA margin target of 19%confirmed
●Based on 2008 EBITDA forecast, acquisition price*** is 11x EV/EBITDA
(in $m) H1 H1 Forecast2007* 2008 2008
16.0%15.5%10.7%Margin %1224831EBITDA**
289 309 761Sales
* Including Integral merged with Pelco** Before restructuring costs*** Adjusted from tax benefits
Synergies
Plan Actual
Revenuesynergies
Cost synergies 236%
127%

Schneider Electric 29- Investor Relations – Half-year results – 1 August 2008
Net debt decrease over 12 months thanks to high free cash flow
Analysis of debt change in €m H1 2007 H1 2008 LTM
(5,658)(3,823)(167)1,057
(4,322)(668)277(4)
(454)(298)1,033
(1,835)
(5,220)(284)2**5
(170)(796)67550
(260)(314)1,199
(4,936)
(5,220)Net debt at June 30438Increase (decrease) in net debt226Other219Capital increase
(1,139)Acquisitions(796)Dividends1,928Free cash flow
(67)Change in operating working capital
2,377Operating cash flow(576)Capital expenditure – net*
194Change in non-operating working capital
(5,658)Net debt at opening
* Including R&D capitalization of €95m (€164m in LTM)** Including share buy backs of €(45)m

Schneider Electric 30- Investor Relations – Half-year results – 1 August 2008
Cash conversion indicators(last 12 months)
58%41%
Continued progress in cash conversion over 12 months
Free cash flow in €m(last 12 months)
H1 2007 H1 2008
1,928
1,094
H1 2007 H1 2008
113%
76%
x1.8
H1 2007 H1 2008
Free cash flow
EBITDA
Free cash flow
Net income

Schneider Electric 31- Investor Relations – Half-year results – 1 August 2008
Significant improvement in working capital
43.1 d -2.2 d
21.6% -2.2pts-8.9 d
-8.8 d
57.1 d
42.6 d
=3.2%
€ 16,749m
+13.7%
* % of LTM sales
Days of receivables
Days of inventories
Days of payables
WCR*
CAPEX*
CAPITALEMPLOYED

Schneider Electric 32- Investor Relations – Half-year results – 1 August 2008
Continued ROCE increase thanks to low capital intensive model
Cash ROCE ROCE
14.7%
+1.6pt +1.1pt€m H1 2008 Change
2,733
3,348
16,749
+24.3%EBITDA (LTM)
+22.0%EBITA (LTM)
+13.7%Capital Employed
12.0%
H1 2007 H1 2008 H1 2007 H1 2008
13.1%10.9%
Schneider Electric 33- Investor Relations – Half-year results – 1 August 2008
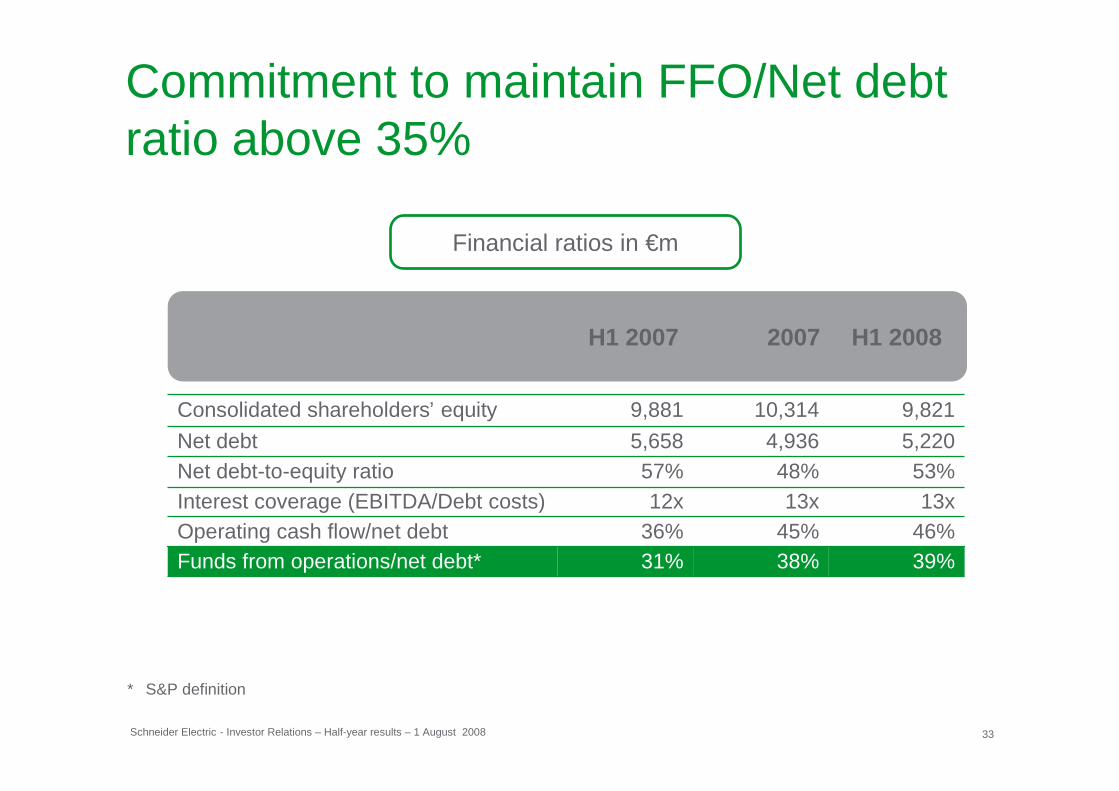
Commitment to maintain FFO/Net debt ratio above 35%
Financial ratios in €m
* S&P definition
H1 2007 2007 H1 2008
31%36%12x
57%5,658
9,881
39%38%Funds from operations/net debt*
13x13xInterest coverage (EBITDA/Debt costs)
5,2204,936Net debt53%48%Net debt-to-equity ratio
46%45%Operating cash flow/net debt
9,82110,314Consolidated shareholders’ equity

Outlook

Schneider Electric 35- Investor Relations – Half-year results – 1 August 2008
Outlook
Assuming current economic conditions, Schneider Electric revises upward
its guidance for 2008 to a minimum of:
● 8% organic sales growth(previously between 6% and 8%)
● 15.0% EBITA margin

Appendices

Schneider Electric 37- Investor Relations – Half-year results – 1 August 2008
Definitions
● EBITDA: EBIT before net depreciation and amortization
● EBITA: EBIT before amortization and depreciation of purchase accounting intangibles
● Capital Employed: Shareholders’ equity + net debt + provisions
● ROCE: After tax EBITA / Capital Employed
● Cash ROCE: After tax EBITDA / Capital Employed

Schneider Electric 38- Investor Relations – Half-year results – 1 August 2008
22 October Q3 2008 SalesConference call9:30am
Alexandre Brunet - Head of IR - alexandre.brunet@sc hneider-electric.comGrégoire Rougnon - IR manager - gregoire.rougnon@schn eider-electric.com
Contacts & agenda

Help people make the most of their energy