Embed Size (px)
Citation preview
1Shaping Watersheds AR Sandbox Facilitator’s Guide
“Shaping WaterShedS”augmented reality SandboxFacilitator’S guide
This material is based upon work supported by the National Science Foundation under Grant No. DRL1114663
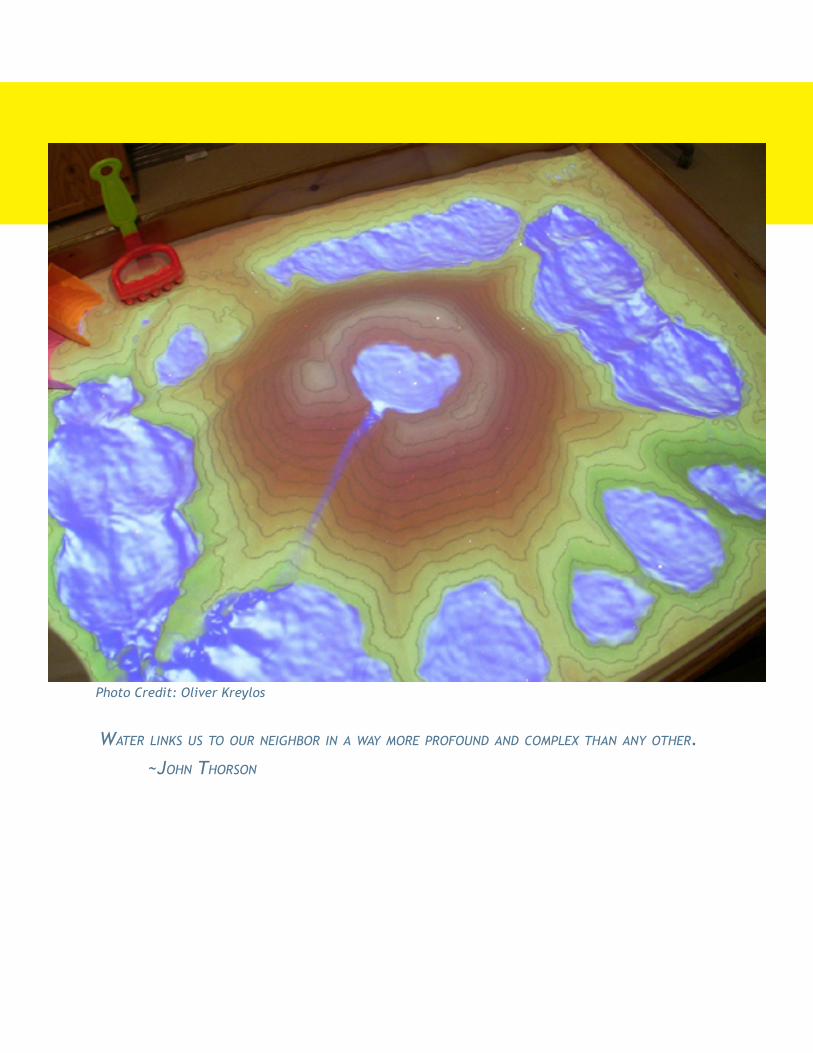
table of contents
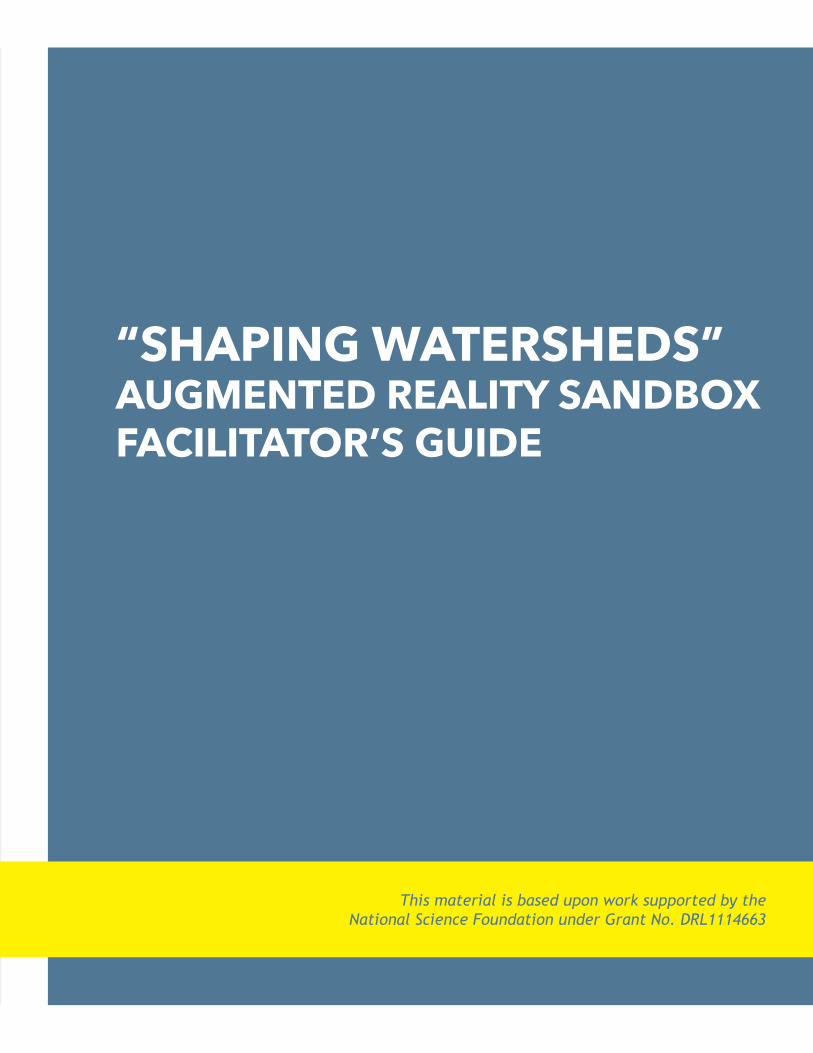
Photo Credit: Oliver Kreylos
Water links us to our neighbor in a Way more profound and complex than any other.
~John thorson
Shaping Watersheds AR Sandbox Facilitator’s Guide 1
table of contents
Facilitation guide for educatorsEx h i b i t Or i E n tat i O n & ba c k g r O u n d
Fr E q u E n t ly as k E d qu E s t i O n s
lE a r n i n g gO a l s
Mat E r i a l s a n d tO O l s
ti p s F O r Vi s i t O r in t E r a c t i O n s
in q u i ry-b a s E d in V E s t i g at i O n s
gl O s s a ry
rE l at E d ME s s a g E s t O cO M M u n i c at E
sc i E n c E O n a sp h E r E Ex t E n s i O n s
sO u r c E s
ac k n O w l E d g E M E n t s
4
6
8
10
11
15
28
30
31
32
33
Shaping Watersheds AR Sandbox Facilitator’s Guide
“Shaping Watersheds” is an interactive augmented reali-ty 3D exhibit. This exhibit was created by a team of sci-entists, computer scientists, science educators, exhibit designers, and evaluation professionals as part of a grant funded by the National Science Foundation (NSF Award No. DRL1114663).
The exhibit was developed as one part of a set of materials, activities and media de-signed to improve public understanding and stewardship of freshwater lake ecosystems using 3D visualizations. As such, the exhibit was called “Shaping Watersheds” and more generally the “AR Sandbox” by the museum community because it uses augmented re-ality a computergenerated sensory input overlayed onto a realworld environment (i.e., a sandbox.)
The team of institutions include the University of California at Davis Keck CAVES , the Tahoe Environmental Research Center (TERC), the UC Berkeley Lawrence Hall of Science (LHS), ECHO Lake Aquarium and Science Center (ECHO), and Audience Viewpoints Con-sulting (AVC).
What is the “shaping Watersheds” augmented reality sandbox?
exhibitorientation & background
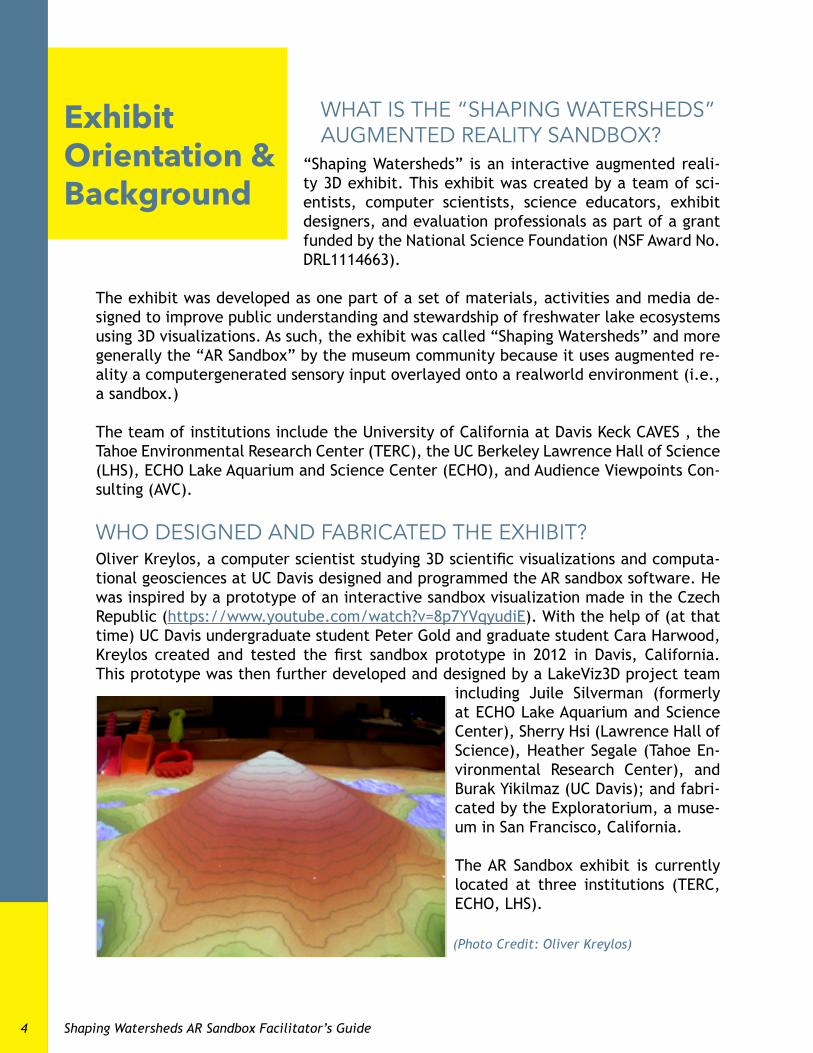
Oliver Kreylos, a computer scientist studying 3D scientific visualizations and computa-tional geosciences at UC Davis designed and programmed the AR sandbox software. He was inspired by a prototype of an interactive sandbox visualization made in the Czech Republic (https://www.youtube.com/watch?v=8p7YVqyudiE). With the help of (at that time) UC Davis undergraduate student Peter Gold and graduate student Cara Harwood, Kreylos created and tested the first sandbox prototype in 2012 in Davis, California. This prototype was then further developed and designed by a LakeViz3D project team
including Juile Silverman (formerly at ECHO Lake Aquarium and Science Center), Sherry Hsi (Lawrence Hall of Science), Heather Segale (Tahoe En-vironmental Research Center), and Burak Yikilmaz (UC Davis); and fabri-cated by the Exploratorium, a muse-um in San Francisco, California.
The AR Sandbox exhibit is currently located at three institutions (TERC, ECHO, LHS).
Who designed and Fabricated the exhibit?
4
(Photo Credit: Oliver Kreylos)
AR Sandbox uses a computer projector and a motionsensing input device (a Ki-nect 3D camera) mounted above a box of sand. The visitor interacts with the ex-hibit by shaping special “kinetic” sand in a basin. The Kinect detects the distance to the sand below, and a visualization an elevation model with contour lines and a color map assigned by elevation is cast from an overhead projector onto the surface of the sand. As visitors move the sand, the Kinect perceives changes in the distance to the sand surface, and the projected colors and contour lines change accordingly.
When an object (for example, a hand) is sensed at a particular height (~2 ft. / 60cm.) above the surface of the sand, virtual rain appears as a blue, shimmer-ing visualization on the surface below. The water appears to flow down the slopes to lower surfaces. The water flow simulation is based on real models of flu-id dynamics (a depthintegrated version of the NavierStokes equations). Visitors can press and hold the button “Drain” to remove the virtual water. (For those in-stitutions using a lid during unfacilitated mode, the hand height required to make it rain is usually set ~0.5 ft. / 15 cm. above the surface of the sand, about the height of the lid.)
The contour lines and colors can be ad-justed to convey different principles and/or to be optimized for different physical setups. The default contour spacing and elevation color mapping were chosen in effort to improve under-standing of how elevation changes re-late to hydrologic process.
This exhibit design uses a concept known as “tangible computing” in which ob-jects in the physical world can be ma-nipulated to alter or operate a computer program, in this case a visualization of a landscape. The camera in the bonnet of the exhibit is a Microsoft Kinect camera, the same camera used in video games. It uses an infrared projector, camera and special microchip to track the move-ment of objects in 3D.
hoW does it Work?
Exhibit Orientation & Background 5
LEARN MORE ABOUT THE LAKEVIZ PROJECT - ONLINE RESOURCES
Project Blog with news about the project: http://lakeviz.org/
Freshwater Ecosystem Learning Resources:http://3dh2o.org/
Designer’s Webpage for more technical information:http://idav.ucdavis.edu/~okreylos/Res-Dev/SARndbox/
Demo Videos and Calibration Guides:http://idav.ucdavis.edu/~okreylos/Res-Dev/SARndbox/
Community Forum - Search the forum for info about sandbox installation, calibra-tion and other technical concerns:http://lakeviz.org/forums/forum/arsand-boxforum/
Shaping Watersheds AR Sandbox Facilitator’s Guide6
FrequentlyaskedQuestions
The sand used in the exhibit is called “kinetic” sand. It was created by WABA
Fun, a company originally located in Swe-den. Kinetic sand is 98% silicon dioxide (regu-
lar sand), mixed with a polymer (a long chained molecule) called polydimethyl siloxane (PDMS). PDMS belongs to a group of polymeric organo-silicon compounds and is most notably used as an antifoaming agent in industrial process liquids.Note: Sandtastic (http://www.sand-tastik.com/100sand/101whiteplaysand)
is also used in some AR sandboxes.W
hat is the sand made from?
The Exploratorium’s Global Studios is planning to fabricate more exhibits
in close partnership with the LakeViz3D team. Roto in Dublin, Ohio also designs AR Sandboxes. To inquire about exhibits, ask visitors to contact the Principal Inves-tigator of the project Geoff Schladow at UC Davis ([email protected]) or contact Penny Jennings (pjennings@
exploratorium.edu).
Where Can i Buy an exhiBit?
According to the manufacturers, “kinetic sand is an actual grain of
sand, coated in a polymer and is com-pletely safe and nontoxic. It is 100% free from wheat, casein and gluten.” In the event that a child eats the sand, WABA Fun suggests giving the child some water and monitoring him or her closely. Read the Kinetic Sand Material Safety Data Sheet here: http://www.pupsikstudio.com/MSDSKineti-
cLQ.pdf
is t
he sand safe?
Frequently Asked Questions 7
Provide feedback & suggestions about the exhibit design, user ex-perience, & facilitation guide here:http://tinyurl.com/SandboxFeedback
The WABA fun sand is sold in the museum store at the Lawrence Hall
of Science. To get the sand in bulk (5lb. bags), please visit the Waba Fun
website.http://wabafun.com/product_info.php/manufacturers_id/6/products_
id/62
Wher
e Can i Buy some sand?
hoW can i suggest improvements?
There are three Shaping Watersheds Ex-hibits that were developed and installed
from 2013 to 2014 as part of the original NSF grant at the Lawrence Hall of Science (LHS), the
Tahoe Environmental Research Center (TERC) (in In-cline Village, NV), and the ECHO Lake Aquarium and
Science Center (in Burlington, VT). The first research prototype lives at UC Davis in Professor Louise Kellogg’s laboratory. A smaller, portable version has been created for use in vans by the MIT Museum and several other versions have been developed in the U.S and around the world: http://idav.ucdavis.edu/~okreylos/ResDev/SARndbox/
LinkExternalInstallations.html
In 2014, there are at least five derivative AR Sand-boxes that have been designed by indepen-
dent developers and design firms.
hoW
man
y exhiBits are there in the World like this?
Shaping Watersheds AR Sandbox Facilitator’s Guide8
big idea
learning goals
The sandbox is a flexible educational tool that can be used to explore the importance of water, via lines of inquiry in hydrology, earth science, and environmental studies. Please note that this guide was written with the intention that facilitators focus on a subset of the activities, based on the background knowledge of the visitor, local geographic context, recent cur-rent events, and relevance to visitors’ lives, experiences and interests. It would be difficult to cover all the topics in one session with the AR Sandbox.
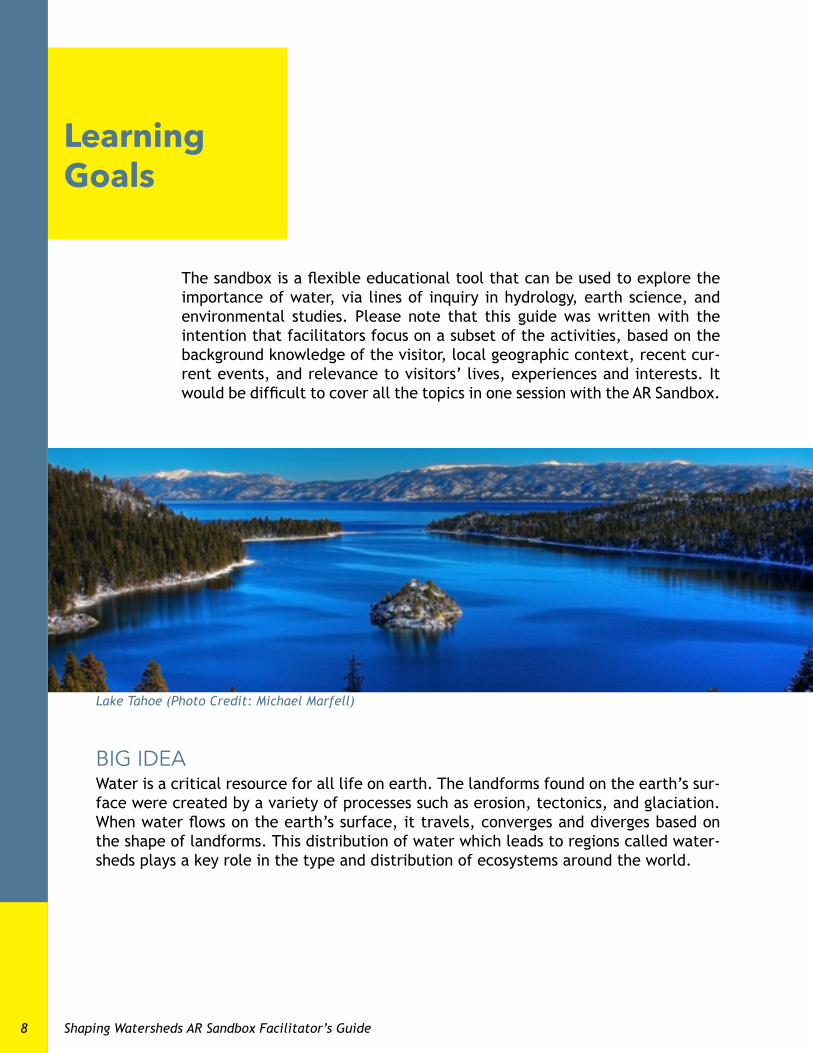
Water is a critical resource for all life on earth. The landforms found on the earth’s sur-face were created by a variety of processes such as erosion, tectonics, and glaciation. When water flows on the earth’s surface, it travels, converges and diverges based on the shape of landforms. This distribution of water which leads to regions called water-sheds plays a key role in the type and distribution of ecosystems around the world.
Lake Tahoe (Photo Credit: Michael Marfell)
9Learning Goals
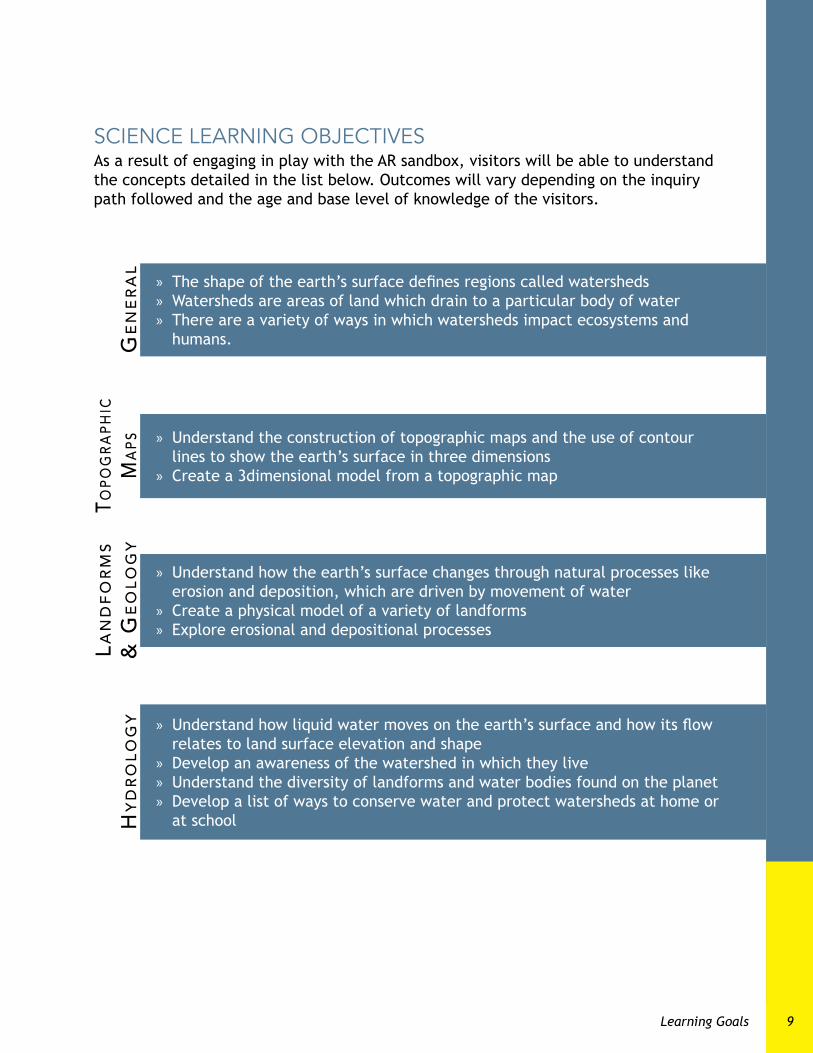
science learning objectivesAs a result of engaging in play with the AR sandbox, visitors will be able to understand the concepts detailed in the list below. Outcomes will vary depending on the inquiry path followed and the age and base level of knowledge of the visitors.
» Understand the construction of topographic maps and the use of contour lines to show the earth’s surface in three dimensions
» Create a 3dimensional model from a topographic map
Topo
gra
phic
Ma
ps
» The shape of the earth’s surface defines regions called watersheds » Watersheds are areas of land which drain to a particular body of water » There are a variety of ways in which watersheds impact ecosystems and humans.g
en
er
al
» Understand how the earth’s surface changes through natural processes like erosion and deposition, which are driven by movement of water
» Create a physical model of a variety of landforms » Explore erosional and depositional processes
lan
dfo
rM
s&
ge
olo
gy
» Understand how liquid water moves on the earth’s surface and how its flow relates to land surface elevation and shape
» Develop an awareness of the watershed in which they live » Understand the diversity of landforms and water bodies found on the planet » Develop a list of ways to conserve water and protect watersheds at home or at schoolh
yd
ro
log
y
Shaping Watersheds AR Sandbox Facilitator’s Guide
materials &tools
10
Use a laser pointer to highlight features without affecting visualization.
Hand sanitizer or sanitized wipes to clean visitor hands before and after use (if desired). Note that the sand can stick if hands are wet.
‘storm on a stick’ for target-ed rainmaking that avoids creating rain in unwanted places.
Large sheet of white poster-board (~3 x 4’) to show visitors a clearer initial depiction of the topo-graphic patterns (colors and contour lines) so that they can better identify the visualizations when projected on the sand.
topograpHic maps to show visitors reallife examples of contour lines and elevation profiles and/or to use as model landforms for visitors to recreate in the sandbox.
a. These are available from United States Geological Survey (USGS)
b. (pdf or paper) here: http://tinyurl.com/TopographicMaps82
Raised relief maps of a local wa-tershed or region of interest to give visitors an example of 3D topographic models. Order raised relief maps here: http://www.geomart.com/products/raisedrelief/usgsquads.html
pHotos of landforms: various landform types and famous land-forms.
Use small props like Lego build-ings or other models depicting human structures. These figures can be used to explore the impact that dams or other land use changes can have on commu-nities.
If your institution has a National Oce-anic and Atmospheric Administration
(NOAA) science on a spHere exhibit, there are several visualizations that can be used to supplement sand-box inquiry (Page 31).
th E s E a r E O p t i O n a l, b u t h E l p F u l t O O l s F O r Fa c i l i tat i n g t h E s a n d b O x.
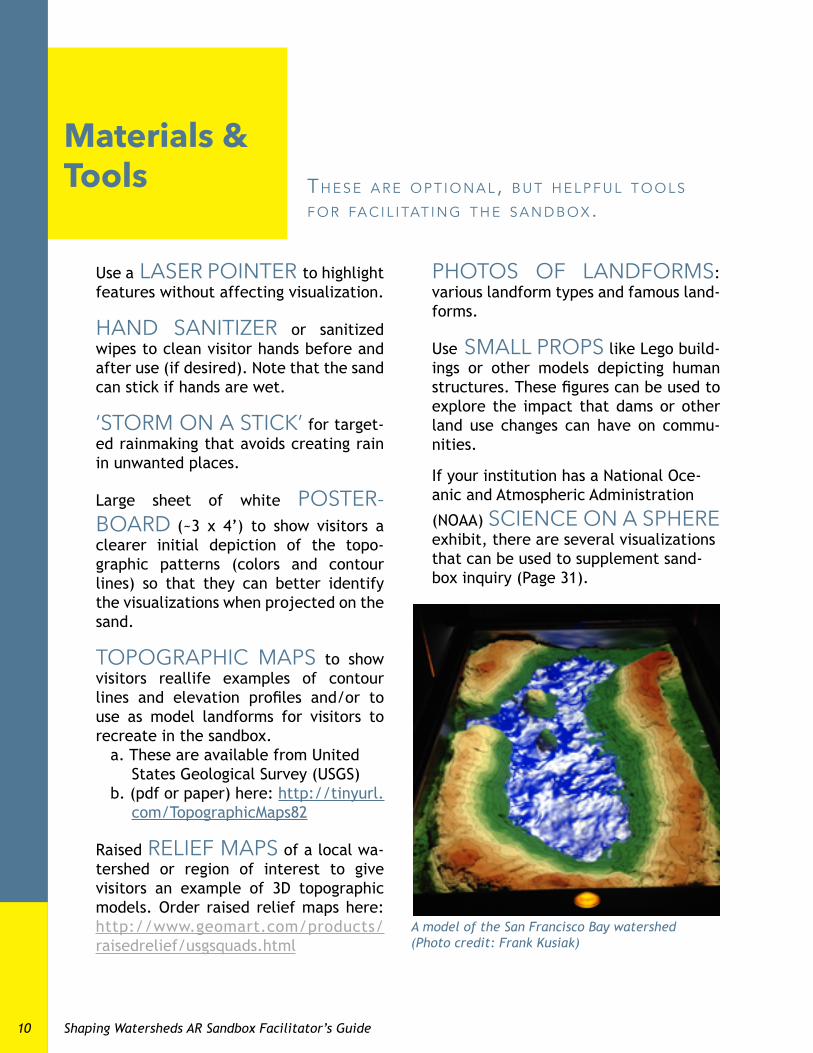
A model of the San Francisco Bay watershed(Photo credit: Frank Kusiak)
Tips for Visitor Interactions 11
tips for Visitor
interactions
greet visitorsSay “hello,” make eye contact, and smile. Simply looking like you’re avail-able and friendly will invite visitors to interact with you.
Ask "Where are you visiting from?" or "Where's home?" This can help you frame your conversation around a specific place and relate landforms and con-cepts to a specific area of the country. For example, if the visitor is from the northeastern United States, flooding might be an issue they are familiar with or if they are from California, drought or mudslides might be of concern. Don't worry if you don't know the local issues. Ask the visitor what's happening in their town, state or region. Then you can help make the connections!
clean handsBefore visitors enter the sandbox area, (1) tell them the "Sandbox Rule”: all sand stays inside the box, and (2) have them apply hand sanitizer or use sani-tized wipes to keep the sandbox hygien-ic, if desired.
mind the stoolsYou may choose to use (stable) step stools to help shorter visitors reach the sandbox.
Provide the stools for small children, but only on the condition that an adult guardian is available to provide individ-ual supervision, to ensure safety and to limit liability in the event of a fall.
let visitors do the talking & playingAs much as possible, let visitors’ inter-ests guide the conversation. You can help them reflect on their own ideas and form their own opinions. If visitors ar-en’t interested in an extended conver-sation, that’s fine. Groups may be ten-tative to start playing at first, but most tend to become highly engaged within a few minutes. Let visitors play until they get stuck or their conversation drifts off topic. Allow time for guests to engage in inquiry discovering and making their own observations.
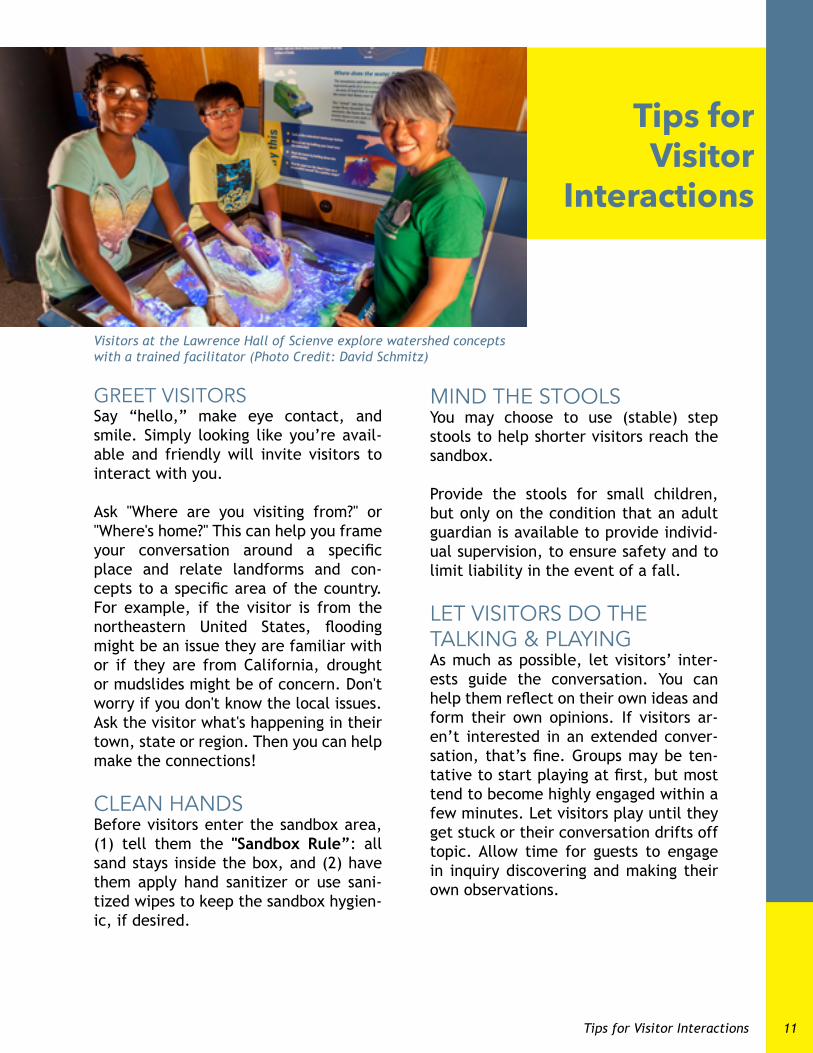
Visitors at the Lawrence Hall of Scienve explore watershed concepts with a trained facilitator (Photo Credit: David Schmitz)
Shaping Watersheds AR Sandbox Facilitator’s Guide12
However, note that while the hands-on play aspect of the sandbox is a strong draw for young visitors, it can also dis-tract from learning. In this case, facili-tators can make extra effort to structure the visitor’s play time with guided inqui-ry. In addition, when young children are playing in the sandbox, adult visitors are often hesitant to experiment with the sandbox. Try to engage older visitors in the experience as well.
Watch For croWdsDepending on the size and energy of the crowd, you may want to limit the number of people at the sandbox and the time of play so each visitor has am-ple access to the sandbox. For instance, during times of high demand, you could schedule sandbox use groups of 46 chil-dren (depending on size) for 10 minute intervals.
Two possible scenarios for facilitation include: 1) a facilitator begins with pre-built landforms and leads a more formal discussion based on specified learning goals or 2) a facilitator stationed near the sandbox is available to help adults engage their children and direct some of the play towards topics/objectives of interest to the visitors.
demonstrate hoW the visualization WorksTo show visitors how the sandbox / soft-ware works, cover the projector lens (avoid touching the glass) so visitors can see that the sand itself is uniform in col-or. Then unblock the projector to show how the software overlays the colors and contour lines on the sand surface. Similarly, laying out a flat sheet onto the sand and letting the software “draw”
the flat landscape, and then taking the sheet quickly away is another way to show how the software dynamically adapts to the sandbox landforms.
use a laser pointerBecause the visualization is continuous-ly updated based on objects and move-ment in the sandbox, it can be difficult to point out features without changing the landscapes or creating spurious vi-sual artifacts. To avoid this issue, use a laser pointer to highlight key featureswithout affecting the sandbox visuals. Of course, be careful not to point the laser into anyone’s eye.
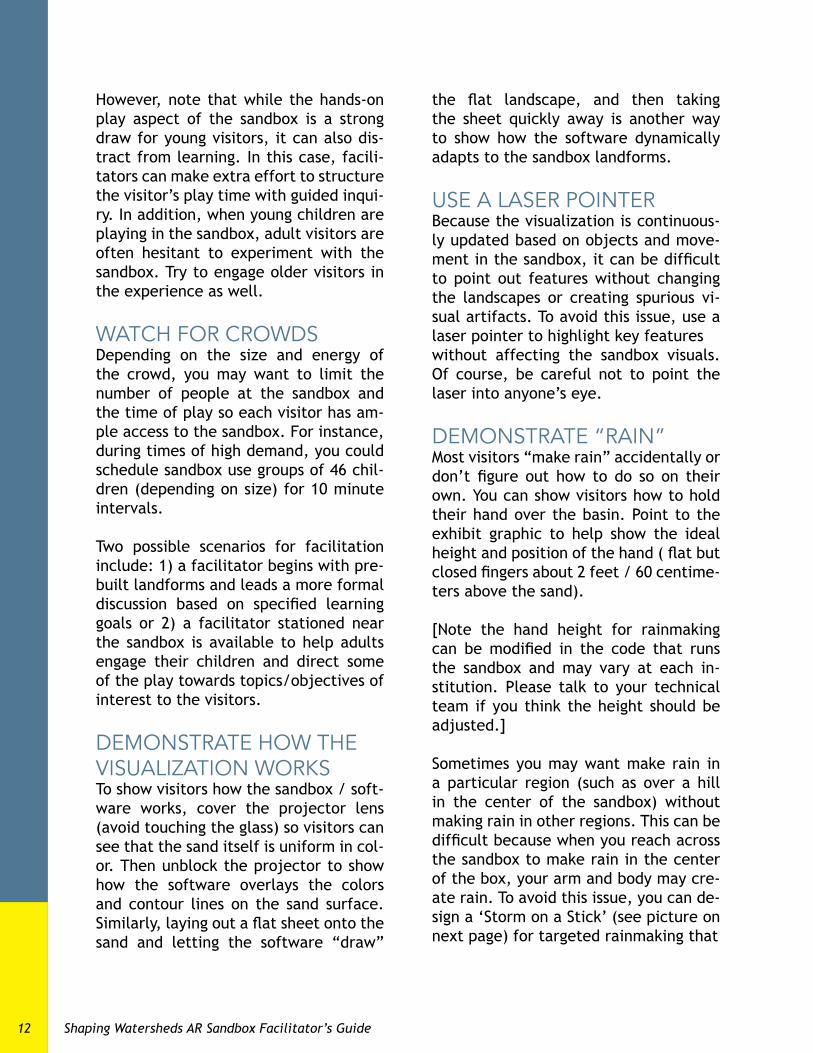
demonstrate “rain”Most visitors “make rain” accidentally or don’t figure out how to do so on their own. You can show visitors how to hold their hand over the basin. Point to the exhibit graphic to help show the ideal height and position of the hand ( flat but closed fingers about 2 feet / 60 centime-ters above the sand).
[Note the hand height for rainmaking can be modified in the code that runs the sandbox and may vary at each in-stitution. Please talk to your technical team if you think the height should be adjusted.]
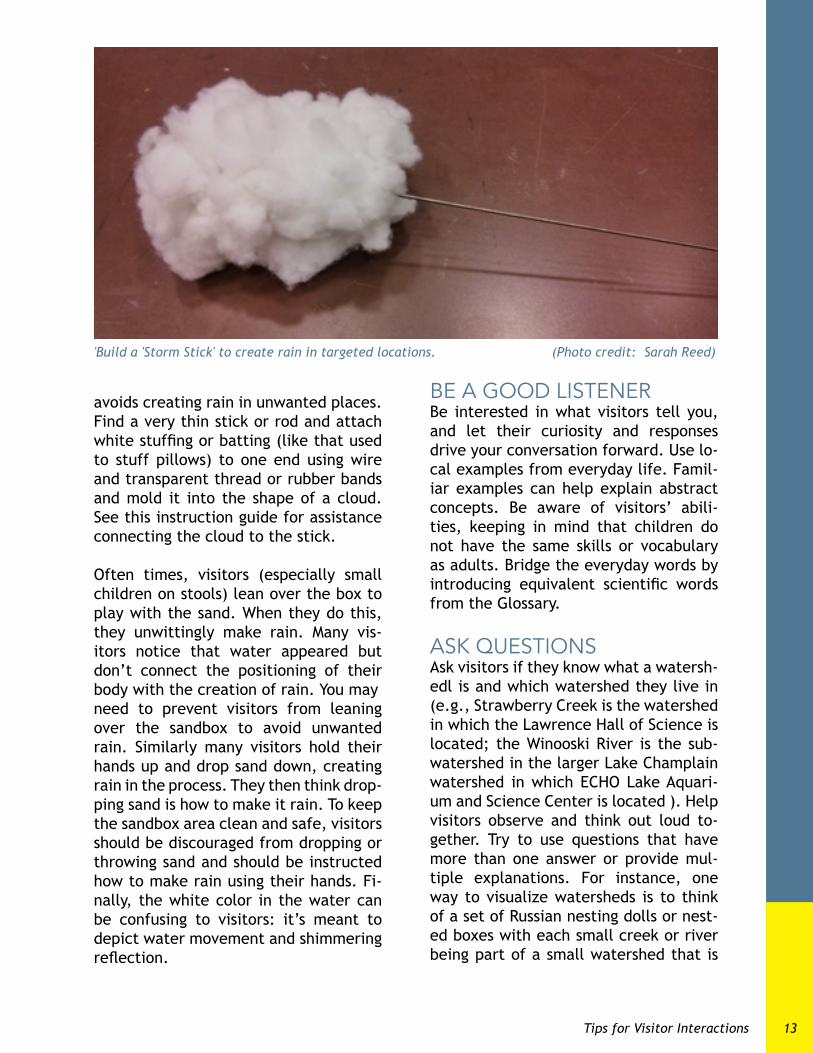
Sometimes you may want make rain in a particular region (such as over a hill in the center of the sandbox) without making rain in other regions. This can be difficult because when you reach across the sandbox to make rain in the center of the box, your arm and body may cre-ate rain. To avoid this issue, you can de-sign a ‘Storm on a Stick’ (see picture on next page) for targeted rainmaking that
13
avoids creating rain in unwanted places. Find a very thin stick or rod and attach white stuffing or batting (like that used to stuff pillows) to one end using wire and transparent thread or rubber bands and mold it into the shape of a cloud. See this instruction guide for assistance connecting the cloud to the stick.
Often times, visitors (especially small children on stools) lean over the box to play with the sand. When they do this, they unwittingly make rain. Many vis-itors notice that water appeared but don’t connect the positioning of their body with the creation of rain. You mayneed to prevent visitors from leaning over the sandbox to avoid unwanted rain. Similarly many visitors hold their hands up and drop sand down, creating rain in the process. They then think drop-ping sand is how to make it rain. To keep the sandbox area clean and safe, visitors should be discouraged from dropping or throwing sand and should be instructed how to make rain using their hands. Fi-nally, the white color in the water can be confusing to visitors: it’s meant to depict water movement and shimmering reflection.
be a good listenerBe interested in what visitors tell you, and let their curiosity and responses drive your conversation forward. Use lo-cal examples from everyday life. Famil-iar examples can help explain abstract concepts. Be aware of visitors’ abili-ties, keeping in mind that children do not have the same skills or vocabulary as adults. Bridge the everyday words by introducing equivalent scientific words from the Glossary.
ask questionsAsk visitors if they know what a watersh-edl is and which watershed they live in (e.g., Strawberry Creek is the watershed in which the Lawrence Hall of Science is located; the Winooski River is the sub-watershed in the larger Lake Champlain watershed in which ECHO Lake Aquari-um and Science Center is located ). Help visitors observe and think out loud to-gether. Try to use questions that have more than one answer or provide mul-tiple explanations. For instance, one way to visualize watersheds is to think of a set of Russian nesting dolls or nest-ed boxes with each small creek or river being part of a small watershed that is
Tips for Visitor Interactions
'Build a 'Storm Stick' to create rain in targeted locations. (Photo credit: Sarah Reed)
Shaping Watersheds AR Sandbox Facilitator’s Guide14
part of a larger and then yet again larger watershed.
Find out information about your institu-tion’s local watershed here: http://cf-pub.epa.gov/surf/locate/index.cfm
*Note that, at least in North America, a watershed is not just the area where water goes when it heads downhill, but the area which drains into a given point.
For instance, the Mississippi River wa-tershed in St. Paul, MN, is much differ-ent from (but a subset of) the Mississippi River watershed in Louisiana. That is, watersheds happen at many different scales, but the terminology remains the same.
encourage visitors to explore Watersheds at homeSuggest that visitors investigate their local watersheds when they get home. Tell them they can get more information
about their local watershed at their local natural resources agencies or links such as http://tinyurl.com/YourWatershed. “Can you find any of the landform shapes that you made in the exhibit today val-leys, lakes, ponds, volcanoes? Can you ‘read the landscape’ and find evidence of flooding, erosion, or drought?” Orig-inal link to above URL is http://cfpub.epa.gov/surf/locate/index.cfm
invite FeedbackEncourage visitors to provide feedback or suggestions about how to enhance the sandbox experience. Note this feed-back from visitors, then enter it using this feedback form at the following link: http://tinyurl.com/SandboxFeedback
thank visitorsDon’t forget to thank visitors for coming to the exhibit and sharing their learning experience with you. Remind visitors not to forget items they put down or hung up around the exhibit.
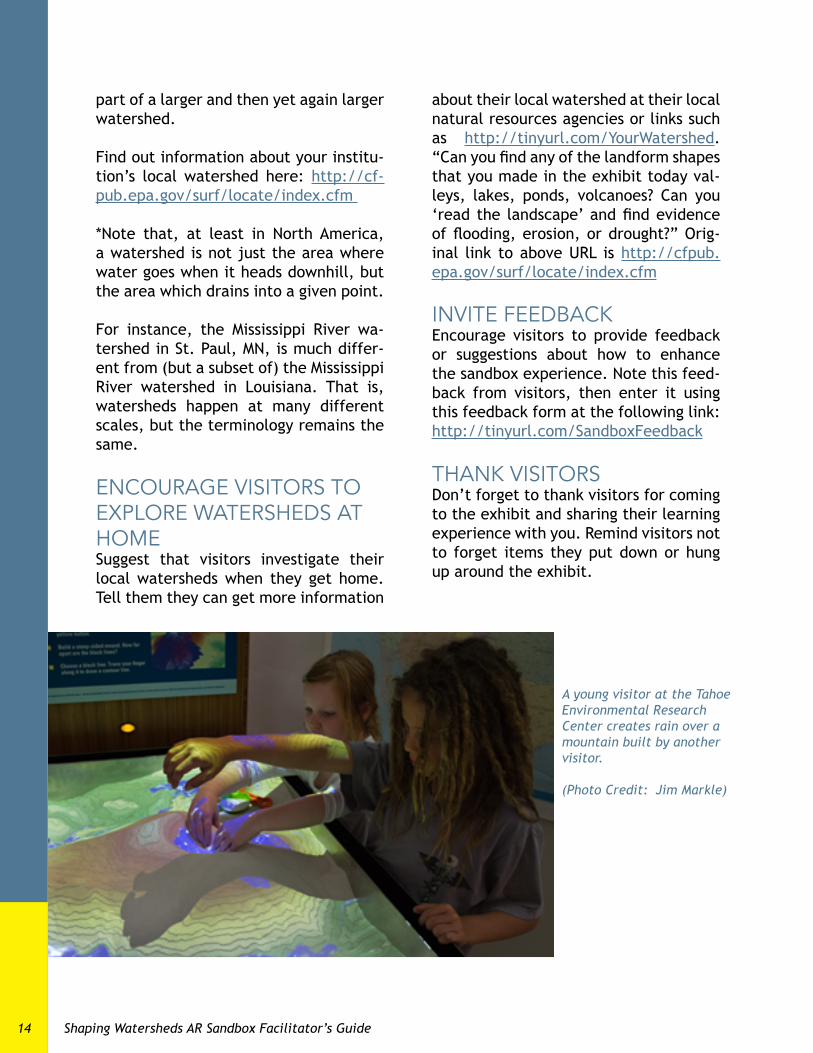
A young visitor at the Tahoe Environmental Research Center creates rain over a mountain built by another visitor.
(Photo Credit: Jim Markle)
Inquiry-based Investigation
inquiry-based
investigation
15
Topographic maps can be difficult for both children and adults to understand. The sand-box can be used to create a model that represents real topography and can help visitors connect an abstract map to actual topography and explore landform evolution and eco-system processes.
Topographic maps provide a way of showing a 3-dimensional landscape on a 2-dimen-sional surface. Contour lines are the main feature of topographic maps. Every point on a single contour line represents the same elevation or height above a reference point (usually sea level). If you were to walk along a contour line, you would not climb up or down, but stay at the same elevation at all times.
The contour interval represents the vertical distance between two adjacent contour lines. Moving from one contour line to the next represents a rise or drop in elevation. The closer together the lines, the steeper the terrain.
Topographic maps are most commonly used for navigation so that hikers and travelers can get a sense of the terrain. They are also used by scientists to explore how earth processes and properties vary with topography.
Activities and suggested dialogue for inquiry investigations are detailed below for a variety of subject areas: topogra-phy and contour lines; geology and landforms; and hydrol-ogy and human impacts. More background information is provided at the beginning of each sectionand in the glos-sary.
This guide was not written with the intention that facili-tators cover all learning goals or activities. Instead, it was designed so that facilitators can focus on a targeted subset of the activities. Choose the focus based on base knowl-edge of the visitors, local geographic context, recent current events, and relevance to visitors’ lives, experiences, and interests.
topography and contour maps
ba c k g r O u n d
Shaping Watersheds AR Sandbox Facilitator’s Guide16
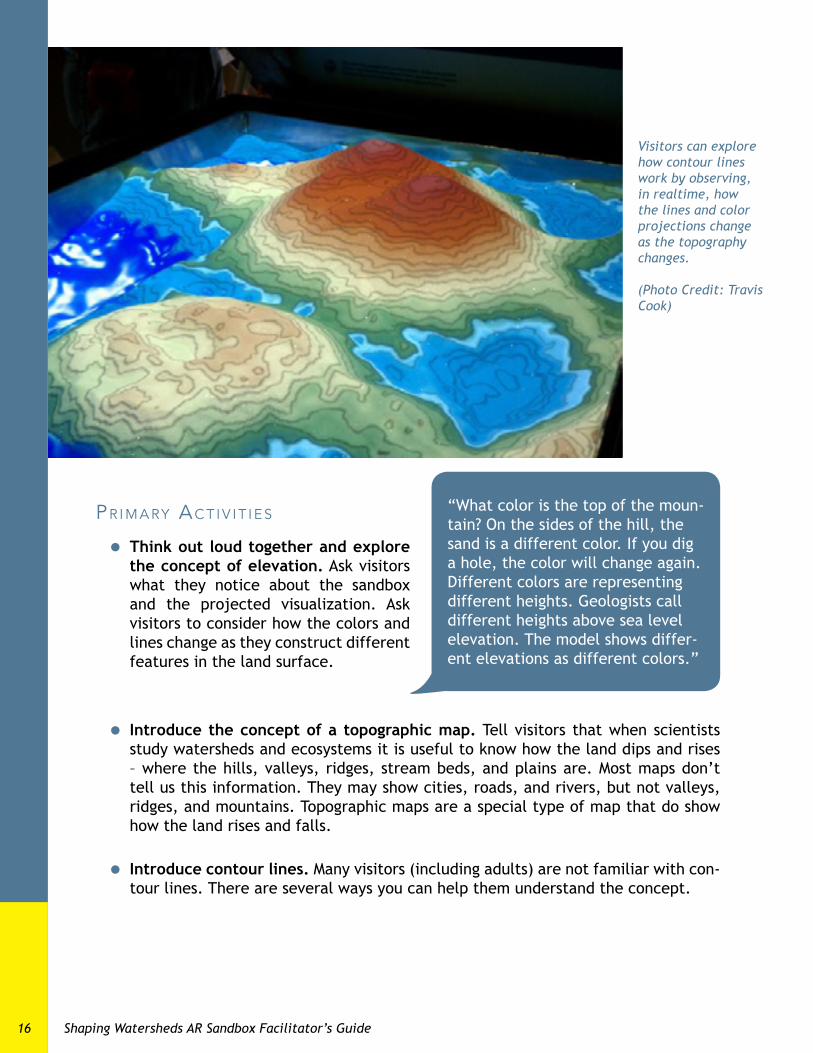
pr i M a ry ac t i V i t i E s “What color is the top of the moun-tain? On the sides of the hill, the sand is a different color. If you dig a hole, the color will change again. Different colors are representing different heights. Geologists call different heights above sea level elevation. The model shows differ-ent elevations as different colors.”
Think out loud together and explore the concept of elevation. Ask visitors what they notice about the sandbox and the projected visualization. Ask visitors to consider how the colors and lines change as they construct different features in the land surface.
Introduce the concept of a topographic map. Tell visitors that when scientists study watersheds and ecosystems it is useful to know how the land dips and rises – where the hills, valleys, ridges, stream beds, and plains are. Most maps don’t tell us this information. They may show cities, roads, and rivers, but not valleys, ridges, and mountains. Topographic maps are a special type of map that do show how the land rises and falls.
Introduce contour lines. Many visitors (including adults) are not familiar with con-tour lines. There are several ways you can help them understand the concept.
Visitors can explore how contour lines work by observing, in realtime, how the lines and color projections change as the topography changes.
(Photo Credit: Travis Cook)
Inquiry-based Investigation 17
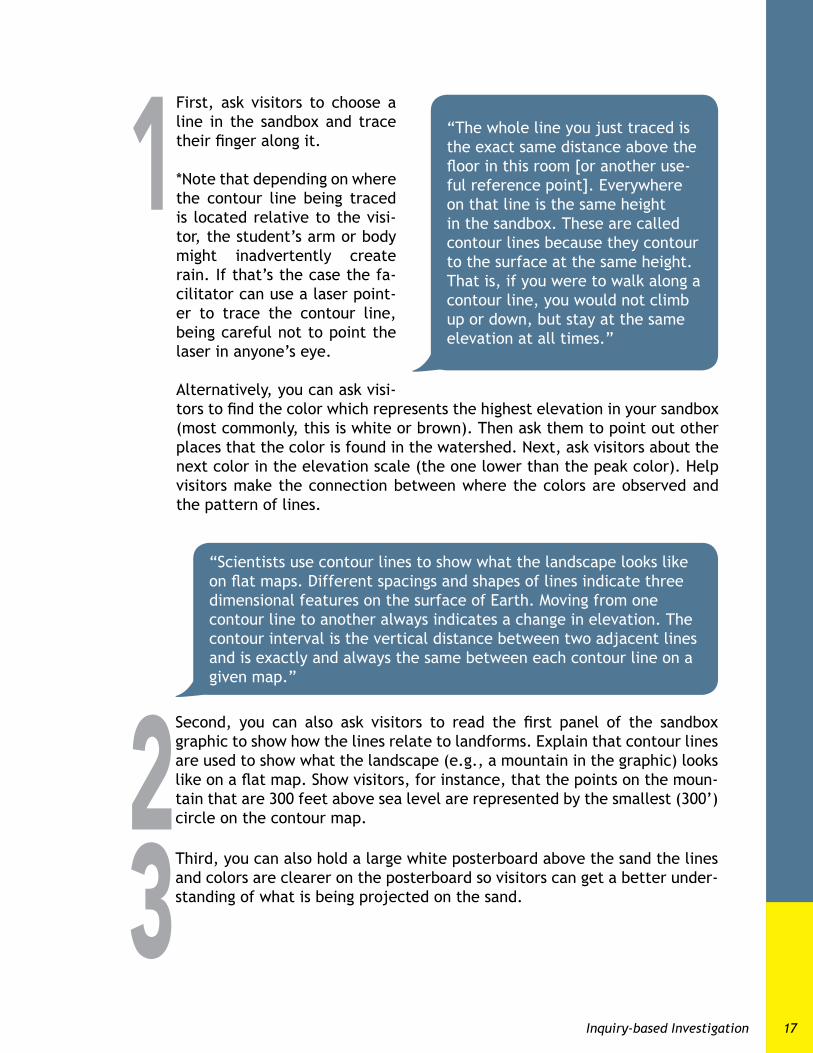
“Scientists use contour lines to show what the landscape looks like on flat maps. Different spacings and shapes of lines indicate three dimensional features on the surface of Earth. Moving from one contour line to another always indicates a change in elevation. The contour interval is the vertical distance between two adjacent lines and is exactly and always the same between each contour line on a given map.”
Third, you can also hold a large white posterboard above the sand the lines and colors are clearer on the posterboard so visitors can get a better under-standing of what is being projected on the sand.
Second, you can also ask visitors to read the first panel of the sandbox graphic to show how the lines relate to landforms. Explain that contour lines are used to show what the landscape (e.g., a mountain in the graphic) looks like on a flat map. Show visitors, for instance, that the points on the moun-tain that are 300 feet above sea level are represented by the smallest (300’) circle on the contour map.2
3
First, ask visitors to choose a line in the sandbox and trace their finger along it.
*Note that depending on where the contour line being traced is located relative to the visi-tor, the student’s arm or body might inadvertently create rain. If that’s the case the fa-cilitator can use a laser point-er to trace the contour line, being careful not to point the laser in anyone’s eye.
Alternatively, you can ask visi-tors to find the color which represents the highest elevation in your sandbox (most commonly, this is white or brown). Then ask them to point out other places that the color is found in the watershed. Next, ask visitors about the next color in the elevation scale (the one lower than the peak color). Help visitors make the connection between where the colors are observed and the pattern of lines.
“The whole line you just traced is the exact same distance above the floor in this room [or another use-ful reference point]. Everywhere on that line is the same height in the sandbox. These are called contour lines because they contour to the surface at the same height. That is, if you were to walk along a contour line, you would not climb up or down, but stay at the same elevation at all times.”
1
Shaping Watersheds AR Sandbox Facilitator’s Guide18
Build different shapes to explore the properties of contour lines.
“Build a mountain with steep sides. Notice the distance between the con-tour lines on your mountain. Now build a low, gentle hill, and notice how the spacing of the lines is different. Which of your landforms would be easier to walk up? What do the lines look like in a valley? What do the lines look like on a flat plain? The closer that contour lines are to one another, the steeper the slope is in the real world (e.g. mountains). Contours that are spaced fur-ther apart represent a shallow to flat slope (e.g. floodplain).
What do you notice about how contour lines interact with one another? Every contour line must eventually connect at its ends. Contour lines can never cross one another; each line represents a separate elevation.”
Explore how water flows in relation to the contour lines. Focus on the rule that contour lines point upstream. Ask visitors to predict which way water will flow based on the pattern of contour lines. Then ask them to make it rain and test their prediction. Point out how the water eventually settles along a contour line.
Ex t E n t i O n ac t i V i t i E s
Compare the sandbox visualization with real topographic maps. Explaining con-tour lines can also be facilitated by showing visitors an actual map to convey how they are used in real life.
Find topographic maps of interest to your visitors and in line with your ed-ucational goals. It can be helpful to trim smaller maps from larger maps or print 8” x 11” maps from the internet so each visitor can look at a map and to avoid the complication of hard-to-manage larger maps. Choose maps with minimal labeled built features (noroads or cities) and possibly present the map next to a photograph of the same area. Visitors often engage with maps of the local area so using a map that includes a region near or encompassing your science center may be also useful.
Order United States Geological Survey (USGS) topographic maps (pdf or paper) here: http://tinyurl.com/TopographicMaps82
Landform shaded relief imagery, 3D geologic features and other visualizations can be ordered here: http://tinyurl.com/TopoViz
1
19Inquiry-based Investigation
Explore the properties of topographic maps. Give visitors sample topograph-ic maps. Ask them what they notice.
Ask them to identify features: a steep slope, a gentle slope, and a valley. Hills can be identified by concentric circles that grow smaller and small-er until you reach the peak of a hill. Topographic maps also show other features in the landscape, includ-ing bodies of water such as streams, rivers, and lakes. Depressions such as a dried out pond or the crater of a volcano are generally shown with hatched contour lines.
Use the maps to review the general rules of contour lines: (1) they do not cross or break apart, (2) close-ly spaced contours repre-sent steep slopes and wide-ly spaced contours indicate gentle slopes, and (3) con-tour lines form a “V” or a “U” where they cross a stream in a valley.
Calculate elevation. Ask vis-itors to find a stream, river, pond or lake on their topo-graphic map.
2“What is its elevation? Compare this with the elevation of a nearby peak. Hint: look at the contour lines nearby to determine the elevation.
The numbers written on contour lines indicate the elevation of the lines. The elevation of unlabeled contour lines can be determined using the contour interval (usually written at the bottom of the map). The contour interval tells the vertical distance between neighboring lines.
By counting the number of contours from a labeled line, and multiplying by the contour interval, you can cal-culate the elevation of any contour line. For points locatedbetween contour lines, you can esti-mate the elevation by examining the distance to the two closest contours.”
Challenge visitors to build sandbox landforms which closely resemble the maps. Ask visitors to predict what their topographic map would look like in 3 dimensions and then encourage them to create a model of their map. For instance the following topographic map of Angel Island (located in the San Francisco Bay) is a relatively easy starting place, with distinct features and clear contour lines. See how similar the sandbox creation can get to the topographic map. http://online.wr.usgs.gov/outreach/images/topo_map_angel_island.pdf
3
Shaping Watersheds AR Sandbox Facilitator’s Guide20
Geomorphology is the science of landforms: the shape, origin, evolution and distribu-tion of formations on the earth’s surface. The Shaping Watersheds sandbox can be used to model the varied landforms found on the planet, explore the processes that create them and think about how the shape of the earth’s surface affects humans and ecosys-tems.
Geomorphic processes are generally considered to be either erosional or depositional. An erosional process is one in which the earth’s surface is worn down by wind, water, and/or ice. A depositional process involves the laying down of material (soil, rock, or organic matter) on the surface of the earth.
Scientists who study geomorphology generally focus on analyzing one or a combination of the main geomorphologic processes: fluvial (rivers and streams), aeolian (wind), hillslope (gravity), glacial, tectonic, and biologic (e.g., burrowing). To study landform history and predict future earth surface changes, researchers use tools such as geochro-nology (dating rocks, fossils and sediments), GPS (global positioning systems), remote sensing, and computer modeling.
ba c k g r O u n d
Additional Resources for Topography Lessons
» Making sense of topographic maps http://learningcenter.nsta.org/product_detail.aspx-?id=10.2505/4/ss05_029_02_34
» 27 ideas for teaching with topographic maps: http://edu-cation.usgs.gov/lessons/teach-ingtopomaps.html
» Linking topographic maps to 3D models: http://www.my-sciencebox.org/map2model
For those on the east coast, try the map of Mount Philo
(located in Vermont):http://i.imgur.com/
hbQxfak.pngOr Pease
Mountain:http://i.imgur.com/vBAlkvZ.
png
For those in the Sierra Neva-
da mountain region, use the map of Herlan
Peak:http://i.imgur.
com/7TnpFNF.jpg
tO
pO
gr
aph ic
Ma p s OF Oth
Er rE
gi O
ns
landForms and geomorphology
21Inquiry-based Investigation
pr i M a ry ac t i V i t i E s
Model a variety of landforms. Visitors often name and/or create a variety oflandforms without prompting. You may also want to suggest landforms to make:mountains, volcanoes, islands, archipelagos, ridges, hills, straits, cliffs, mesas, dunes, buttes, peninsulas, isthmuses, alluvial fans, valleys, deltas, canyons, cra-ters, basins, flood plains, deserts, lakes, rivers, drainage patterns (e.g., dendritic), meanders, creeks, dams. See Wikipedia’s list of landforms for a detailed list and descriptions of landforms. You may want to assemble a collection of photographs and/or topographic maps of these landforms.
Many visitors are also interested in modeling specific geographic features. Somelandforms visitors could build include: mountains such as the Sierra Nevada moun-tain range if you’re on the west coast or the Green Mountains or Adirondacks if you’re on the east coast; local lakes like Lake Tahoe, Lake Champlain, Lake Supe-rior; volcanoes such as Mt. St. Helens, Kilauea, Mt. Fuji, or Mt. Kilimanjaro; other landforms of interest such as Grand Canyon, Mt. Everest, San Francisco Bay water-shed, Mariana Trench, Badlands, Mima mounds, Nile River, Tibetan Plateau, Great Rift Valley, Uluru (Ayers Rock), etc.
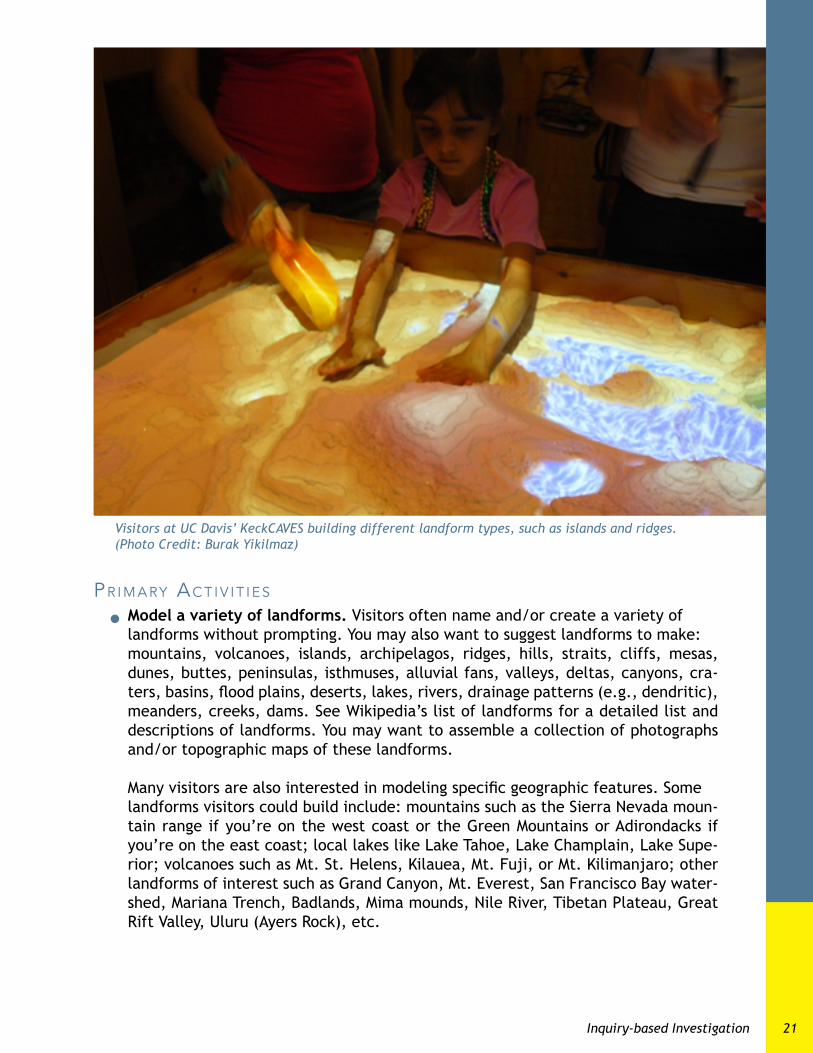
Visitors at UC Davis’ KeckCAVES building different landform types, such as islands and ridges. (Photo Credit: Burak Yikilmaz)
Shaping Watersheds AR Sandbox Facilitator’s Guide22
“When water flows downhill, does anything else flow with it? Water flowing through a water-shed often carries eroded sedi-ment. How does erosion relate to the landforms we have ex-plored?”
Introduce erosion and make connec-tions between erosional processes and landform shape. Ask visitors to make or observe a sandbox landform with steep slopes, along with a landform with gen-tler slopes. Ask them to predict on which landform erosion would be the stron-gest and help them discuss their logic. Steeper slopes result in faster flowing water which has more energy and can carry larger loads of material increasing the amount of erosion and deposition. Relate the concept of erosion back to the landforms you created, e.g., ask visitors why the Grand Canyon is so deep.
Ex t E n s i O n ac t i V i t i E s
“What happens to the sediment carried by the river when it reaches the bottom of the hill?”
Explore depositional processes. Depo-sition happens when the energy need-ed for sediment transport is too little when it is no longer sufficient to over-come the frictional forces on the river bed. Then the soil or sediment is left on the earth’s surface, often while the river or transporting force moves elsewhere. Relate the concept of deposition back to the landforms the visitors created. For example, ask visitors how deposition may lead to the creation of dunes.
Ask visitors to think about how human activities affect erosion and deposi-tion. Construction, road building, and other activities can increase the amount of erosion flowing through the watershed by exposing sediment that was protected under the soil surface. This increased erosion can negatively impact the health of lakes and streams. Climate change is expected to reduce the snowpack in many mountain regions. This would decrease the flow rate of rivers, which would reduce erosion rates and the timing of deposition.
Additional Resources for Landforms Lessons » Wikipedia’s list of landforms: http://en.wikipedia.org/wiki/List_of_landforms
» An introduction to stream geomorphology: http://glaquarium.org/wpcon-tent/uploads/2012/11/AMeanderingStory.pdf
23Inquiry-based Investigation
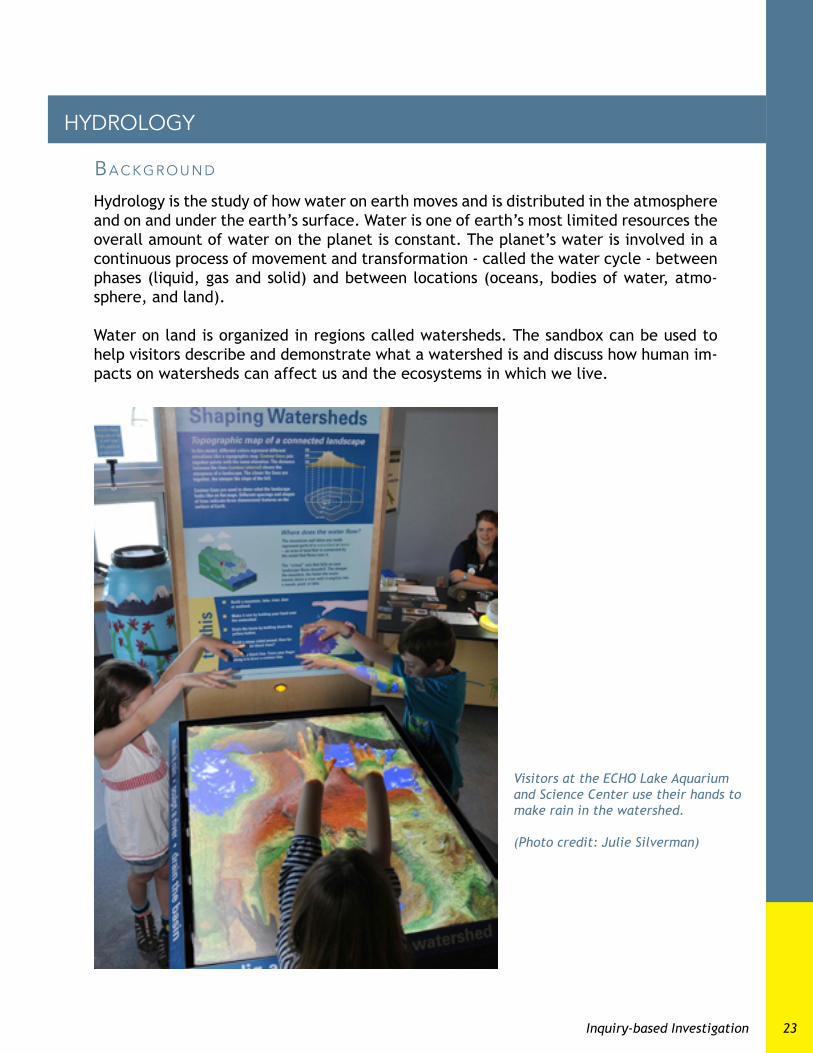
Visitors at the ECHO Lake Aquarium and Science Center use their hands to make rain in the watershed.
(Photo credit: Julie Silverman)
Hydrology is the study of how water on earth moves and is distributed in the atmosphere and on and under the earth’s surface. Water is one of earth’s most limited resources the overall amount of water on the planet is constant. The planet’s water is involved in a continuous process of movement and transformation - called the water cycle - between phases (liquid, gas and solid) and between locations (oceans, bodies of water, atmo-sphere, and land).
Water on land is organized in regions called watersheds. The sandbox can be used to help visitors describe and demonstrate what a watershed is and discuss how human im-pacts on watersheds can affect us and the ecosystems in which we live.
ba c k g r O u n d
hydrology
Shaping Watersheds AR Sandbox Facilitator’s Guide24
“If you make it rain here [motion to a location above the ridge] where do you think the water will travel?”
pr i M a ry ac t i V i t i E s
Ask visitors to hold their hand over the sand box to make virtual rain fall to the surface below. Recall that visitors may need help to hold their hands at the right height. You can remind them by showing them the height of the hand on the sandbox sign.
“What happens to the water each time? Water flows from higher areas to lower areas. In lower areas, the water collects, but in high areas with steep slopes it flows down.”
Encourage visitors to observe the movement of the virtual water with respect to land-forms. Ask them to hold their hand over a steep peak, a gentle hill, and a valley.
“A watershed is the area of land that drains into a lake, river or other body of water. Watersheds are separated from one another by higher parts of the landscape: ridges, hills, mountains, etc.”
Explore what de-fines a watershed. Ask visitors if they know what a wa-tershed is (if you haven’t done so al-ready).
Ask visitors to build a long ridge that divides the sandbox into two separate regions. Once they’ve made their predictions, ask a volunteer to make it rain above the ridge. Explain that the water that flows into the first region is part of one water-shed, while all the water that flows into the second region is part of a separate watershed. Note that there are differ-ent kinds of watersheds. Some involve very steep terrain while others are part of very subtle topography. In all cases, precipitation that falls on the water-shed flows over land to reach the lowest point – an ocean, lake, river, stream, or groundwater source.
“Notice how water appears on the surface below. As you move your hand away, where does the water go?”
25Inquiry-based Investigation
Discuss the water cycle. Ask visitors what they think happens to the water once it travels down over landforms and into bodies of water and the soil. Ask them where they think the rain that they are modeling with their hands comes from. Explain that water is involved in a neverending cycle. Once rainwater runs off into rivers and other bodies of water, energy from the sun evaporates the water into the air. Atmospheric winds move the water vapor around and it eventually forms clouds, water vapor that has cooled and condensed into a collection of liquid water. When those clouds get heavy enough, they produce rain or snow and the whole cycle starts over again.
Ex t E n s i O n ac t i V i t i E s
Model your local watershed. Ask visitors where the water they drink and use comes from. Explain that they live in a watershed and most likely some of their water supply comes from the rain that falls in their watershed.
You can look up the watershed you live in and find out more information about it at the following links:Surf Your Watershed: http://cfpub.epa.gov/surf/locate/index.cfmScience in Your Watershed: https://water.usgs.gov/wsc/map_index.html
Show visitors a topographic map, photograph or raised relief map of the local wa-tershed. Challenge them to build a model of their watershed in the sandbox. When they’re finished, point out a location in the watershed and ask where they think rain that falls on that location might travel. Then ask for a volunteer to make it rain and test the hypotheses. Help visitors locate their homes within the water-shed and solicit observations about the water resources that they might be aware of in their neighborhoods.
Discuss possible sources of pollution and ask guests to think about how pollution occurring in one part of a watershed could affect the entire watershed. As water flows over the land, it picks up sediment, soil chemicals, and pollutants and trans-ports them to lakes, rivers, streams and groundwater.
Dig a lake. Encourage visitors to make lakes of different shapes. Discuss with visi-tors how lakes are formed from glaciers, faulting, or warping of the Earth’s crust. Some lakes are humanmade. There are different lakes around the world with dif-ferent depths, shapes, chemistries, and ecosystems.
Explore the Lakes of the World Google Earth tour to learn about the strik-ing diversity of lakes and the role that they play in their local communities: http://tinyurl.com/jvwhmru
Shaping Watersheds AR Sandbox Facilitator’s Guide26
Simulate drought. Ask visitors to hold down the ‘Drain’ button for a few sec-onds until all the water in the sandbox disappears.
First, discuss reasons for drought. Discuss with visitors that droughts can happen for many reasons and ask them if they know of any. Changes in climate can cause drought – if the way that clouds and moisture move through the atmosphere changes, it can prevent an area from receiving rain. If peo-ple live in a place where most of the water they use comes from a river, a drought can be caused when the land upstream doesn’t receive enough moisture. For instance, when the Sierra Nevadas in California (a region that includes Lake Tahoe) doesn’t get a lot of snow in the winter, it can lead to a drought in the summer because the melting snow supplies much of Califor-nia with its water.
“What happened to all the water? What happens if we can’t make it rain? What is a drought; what does it make you think of? ‘Dry,’ ‘hot’ and ‘dusty’? A drought happens when a region has less precipita-tion (rain or snow) than it usual-ly has for a few months or even longer.”1
“Add virtual water until you ‘break’ the dam. Think about where people build cities, and what risks might there be in building in various different places.”
Make a dam. Instruct visitors to build a dam: build a large sand wall next to a discrete depression and fill up the depression with water. See the following vid-eo for a sandbox dam demonstration: www.youtube.com/watch?v=d_ZHsgKjNNk
Ask visitors to place Lego or other figures representing urban structures (houses, of-fices, roads) in the landscape around the dam.
Discuss floodplains, rivers, and settle-ment.
One example is Omaha, Nebraska on the high west bank of the Missouri River, versus Council Bluffs, Iowa on the floodprone east bank. Omaha grew faster than Council Bluffs and remains the primary city in the region to this day. Discuss the im-portance of a city to be on a floodfree site, higher than the floodplain. Ask visitors if they would change where they build their cities after the discussion. Encourage visitors to share local stories of how floods have affected their communities. How has flooding changed in their community over time?
“How do rivers both encourage (with trade and traffic) and discourage (with flooding) settlement? Why does one bank of a large river aid the growth of a large city, while the other bank is sparsely populated? This might occur if one bank is higher and floodfree, and the other is historically floodprone.”
Inquiry-based Investigation 27
Additional Resources for Hydrology Lessons » San Francisco Bay watershed curriculum: http://www.savesfbay.org/sites/default/files/WatershedCurriculum.pdf
» Find your watershed: http://cfpub.epa.gov/surf/locate/index.cfm » Lakes of the World Tour: http://tinyurl.com/jvwhmru » 4H’s drought for kids guide: http://drought.unl.edu/DroughtforKids.aspx
Third, ask what are some other possible effects of drought? What other ways is water important? Discuss the environmental impacts of drought. All plants and animals need water. Ecosystems are threatened in a drought. Also, wa-ter regulates our climate.
Drought can cause many environmental effects:
Fourth, discuss how we can prevent drought or lessen its impacts. Examples include learning about what causes droughts, conserving water by taking shorter showers, turning off the faucet when you brush your teeth, fixing leaky faucets, xeriscaping, and water recycling.
» more wildfires » soil erosion and poor soil quality » loss of wetlands » increase in disease of wild animals due to reduced food and water sup-plies
» migration of wildlife
34
Second, ask how drought could affect our lives? What are the human impacts of drought? Ask visitors how water is important to them and their families. Possible answers include drinking, food, cleaning, bathing, cooking, energy (hydroelectric), recreation (swimming and boating).
Drought can cause many social effects:2 » people can become sick or die without enough water or food » excess dust can cause health problems » economic losses due to drought (failed crops and businesses)
People can also play a big role in drought. Water is a limited resource in many regions of the world. If humans use too much water during times of normal rainfall, there might not be enough water for everyone in dry years.
Shaping Watersheds AR Sandbox Facilitator’s Guide28
» Bathymetry: the measurement of depth of water in oceans, seas, or lakes, often conducted using SONAR (sound navigation and ranging) technology
» Contour line: a line on a map joining points of equal height above or below sea level
» Contour interval: the height difference from one contour line to the next
» Dam: a structure built across a river to hold back water for a variety of reasons, including protecting areas from floods, storing water, and generating power
» Deposition: material (soil, rock, or organic matter) that is laid down on the earth’s surface after being transported by wind or water
» Divide: the ridge separating two watersheds
» Drought: extended period of time (usually several months or longer) when there is less rainfall than expected
» Elevation: vertical distance above mean sea level
» Erosion: a process that wears down the earth's surface, causing material (soil, rock or organic matter) to move from one place to another. Erosion occurs naturally from wind or water but can be intensified by land use practices related to farming, residential or industrial development, road building, or forestry
» Flood: high streamflow that overtops the natural or artificial banks of a stream
» Floodplain: an area of low, flat ground adjacent to a river, lakes and oceans and subject to periodic flooding
» Geomorphology: the study of the landforms on the earth’s surface and the pro-cesses that shape them. The field of geomorphology seeks to understand why land-scapes look the way they do, to understand landform history and dynamics and to predict future changes
» Ground water: moisture that seeps underground and can be accessed by wells or springs
» Hydrology: the movement, distribution, quality and characteristics of water on and below the surface of the land and in the atmosphere
glossary
Glossary 29
» Lake: a body of fresh or salt water of considerable size, surrounded by land
» Landforms: Features of the earth’s surface. Landforms are categorized by char-acteristic physical attributes such as elevation, slope, orientation, stratification, rock exposure, and soil type. See Wikipedia’s list of landforms for a detailed list and descriptions of landforms
» Precipitation: the amount of rain, snow, hail, etc., that has fallen at a given place within a given period, usually expressed in inches or centimeters
» Relief: total range of elevations within a given area. Mountainous areas have high relief (tall peaks, low valleys), while flat, glaciated landscapes (northern Ohio) have low relief
» River: a natural body of water that is usually larger than a brook, creek, or stream, and flows into an ocean, lake, or another river
» Runoff: water from rain, melting snow, or irrigation that flows over the land and into streams, rivers, lakes and wetlands instead of being absorbed into the ground
» Stream: a small creek or channel of running water
» Topography: (etymology: shape + picture) a representation of the shape of a land-scape, sometimes used to mean relief or the shape of the landscape itself
» Watershed: an area of land which drains to or through a specific point (e.g. the Mississippi River watershed). This point need not be at the end of the waterway; the Mississippi River watershed in St. Paul, MN is a small subset of the Mississippi River watershed from New Orleans, LA
» Wetland: land covered part of the time with fresh or salt water, such as a swamp or marsh
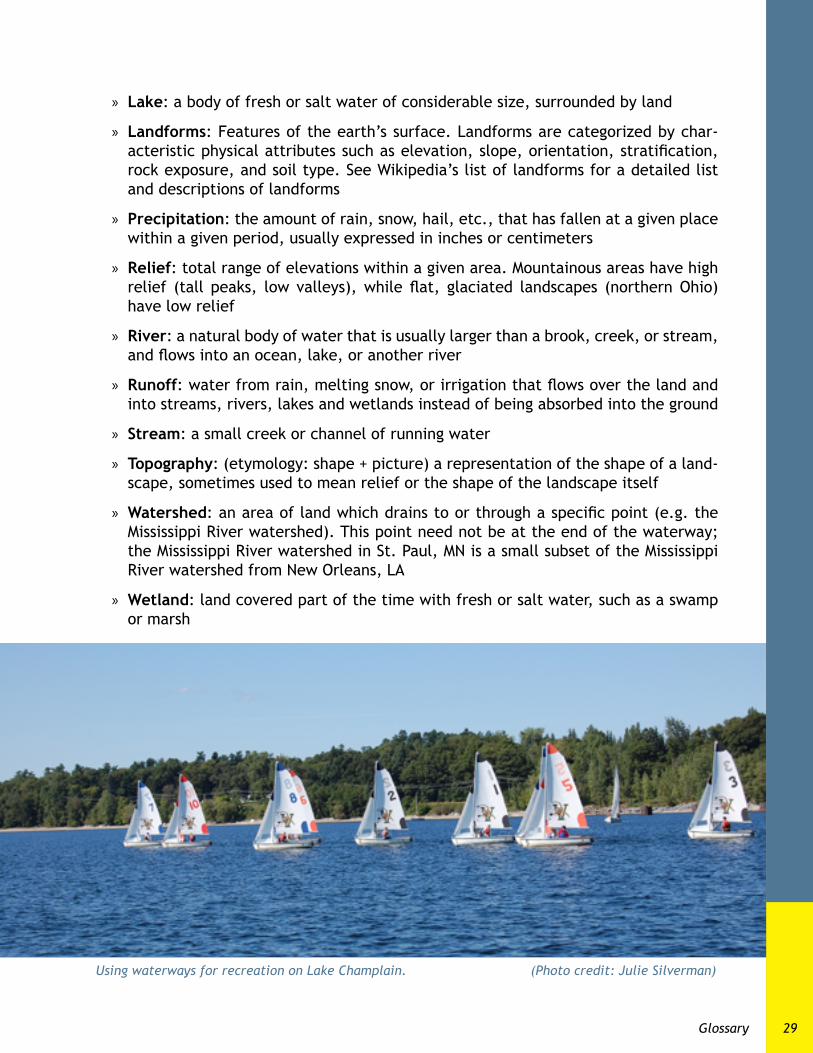
Using waterways for recreation on Lake Champlain. (Photo credit: Julie Silverman)
Shaping Watersheds AR Sandbox Facilitator’s Guide30
relatedmessages tocommunicate
th E F O l l O w i n g a r E k E y p r i n c i p l E s O F wa-t E r s h E d s c i E n c E i d E n t i F i E d b y t h E s c i E n-t i s t s a n d E d u c at O r s i n t h E la k EVi z p r O j-E c t. yO u M ay F i n d t h E M u s E F u l d u r i n g s a n d b O x Fa c i l i tat i O n.
Humans affect fresHwater ecosystems locally and globally » Humans use water in many ways » Humans have both short-term and long-term impacts on freshwater ecosystems at local and global scales
» Land use impacts the watershed (development, agriculture, deforestation/forest health, etc.)
» Pollution impacts freshwater ecosystems (nutrients, sediment, toxins, etc.) » Invasive species are transported and introduced by humans (aquatic invasive spe-cies, terrestrial invasive species)
» There are many ways humans can be stewards of freshwater ecosystems
» All living things need water » The water cycle is central to life on Earth » Freshwater moves through watersheds » Biodiversity is important to the health and sustainability of a freshwater ecosystem » The interface between water and land (lakes, ponds, riverine, wetlands, stormwa-ter) is important
water connects all eartH systems: water, land, air and life
» Freshwater ecosystems are formed by a combination of different geologic and geo-morphologic processes
» There is a wide diversity of freshwater ecosystems » Distinct seasonal changes are observed in lakes » Physical processes (mixing, currents, gyres) affect the state and health of lake ecosystems
» Lakes are a reservoir of history (in sediments)
fresHwater ecosystems are dynamic, complex and diverse
Science on a Sphere Extensions 31
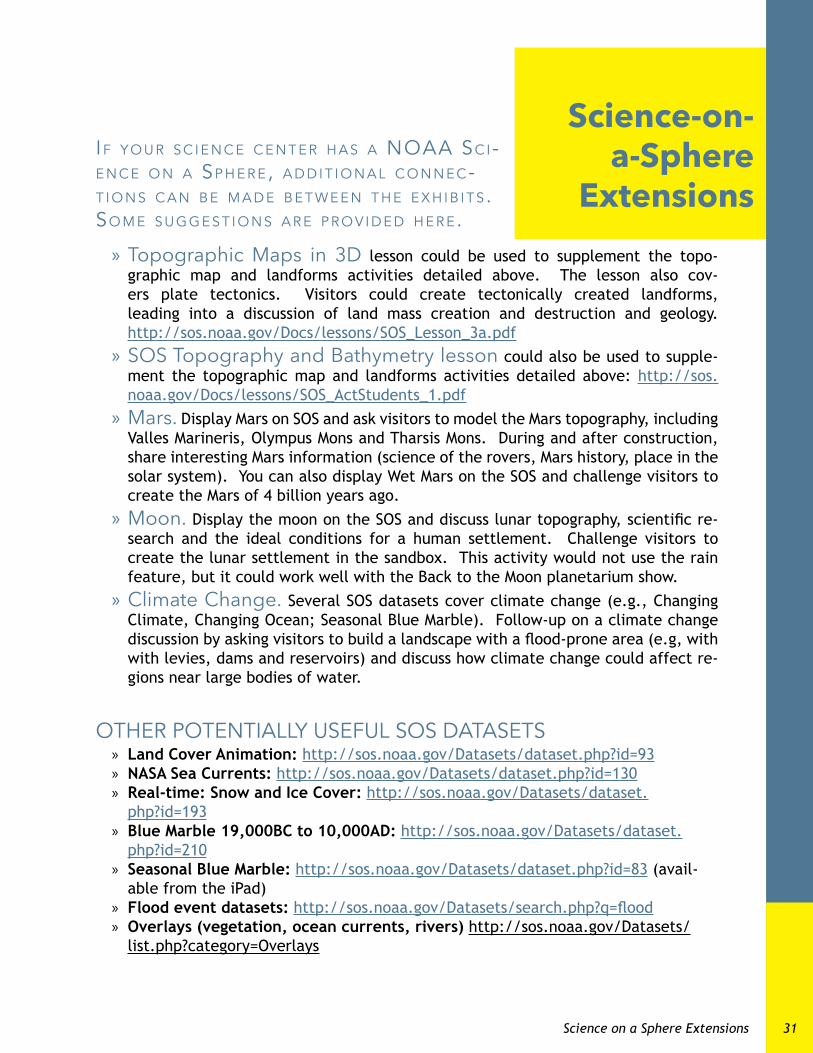
» topographic maps in 3d lesson could be used to supplement the topo-graphic map and landforms activities detailed above. The lesson also cov-ers plate tectonics. Visitors could create tectonically created landforms, leading into a discussion of land mass creation and destruction and geology. http://sos.noaa.gov/Docs/lessons/SOS_Lesson_3a.pdf
» sos topography and bathymetry lesson could also be used to supple-ment the topographic map and landforms activities detailed above: http://sos.noaa.gov/Docs/lessons/SOS_ActStudents_1.pdf
» mars. Display Mars on SOS and ask visitors to model the Mars topography, including Valles Marineris, Olympus Mons and Tharsis Mons. During and after construction, share interesting Mars information (science of the rovers, Mars history, place in the solar system). You can also display Wet Mars on the SOS and challenge visitors to create the Mars of 4 billion years ago.
» moon. Display the moon on the SOS and discuss lunar topography, scientific re-search and the ideal conditions for a human settlement. Challenge visitors to create the lunar settlement in the sandbox. This activity would not use the rain feature, but it could work well with the Back to the Moon planetarium show.
» climate change. Several SOS datasets cover climate change (e.g., Changing Climate, Changing Ocean; Seasonal Blue Marble). Follow-up on a climate change discussion by asking visitors to build a landscape with a flood-prone area (e.g, with with levies, dams and reservoirs) and discuss how climate change could affect re-gions near large bodies of water.
Science-on-a-Sphere
extensionsi F y O u r s c i E n c E c E n t E r h a s a nOaa sc i-E n c E O n a sp h E r E, a d d i t i O n a l c O n n E c-t i O n s c a n b E M a d E b E t w E E n t h E E x h i b i t s . sO M E s u g g E s t i O n s a r E p r O V i d E d h E r E.
» Land Cover Animation: http://sos.noaa.gov/Datasets/dataset.php?id=93 » NASA Sea Currents: http://sos.noaa.gov/Datasets/dataset.php?id=130 » Real-time: Snow and Ice Cover: http://sos.noaa.gov/Datasets/dataset.php?id=193
» Blue Marble 19,000BC to 10,000AD: http://sos.noaa.gov/Datasets/dataset.php?id=210
» Seasonal Blue Marble: http://sos.noaa.gov/Datasets/dataset.php?id=83 (avail-able from the iPad)
» Flood event datasets: http://sos.noaa.gov/Datasets/search.php?q=flood » Overlays (vegetation, ocean currents, rivers) http://sos.noaa.gov/Datasets/list.php?category=Overlays
other potentially useFul sos datasets
Shaping Watersheds AR Sandbox Facilitator’s Guide32
Sourcesth E F O l l O w i n g r E s O u r c E s p r O V i d E d i n-F O r M at i O n a n d i n s p i r at i O n F O r t h i s Fa-c i l i tat O r’s g u i d E
Sandy Stationcreated by Peter Altman and
Robert Eckstein from the Univer-sity of West Bohemia in Pilsen,
Czech Republichttp://en.sandystation.cz/
three WayS to be 3-d
https://www.savesf-bay.org/sites/default/files/Three_Ways_to_
be_3d.pdf
making SenSe oF topographic mapShttp://learningcenter.nsta.org/product_detail.aspx?id=10.2505/4/ss05_029_02_34
SaVe the bay’S Water-Shed curriculum
http://www.savesfbay.org/sites/default/files/WatershedCurricu-
lum.pdf
33Acknowledgements
Dr. Sarah Reed, a science and technology educator at the Lawrence Hall of Science was the lead author of this AR Sandbox Facilitator’s Guide. The exhibit itself was created by a team of scientists, computer scientists, science educators, exhibit designers, and evaluation professionals as part of a grant funded by the National Science Foundation (NSF Award No. DRL-1114663). The exhibit was developed as one part of a set of ma-terials, activities and media designed to improve public understanding and stewardship of freshwater lake ecosystems using 3D visualizations.
The team of institutions include the University of California at Davis Keck CAVES, the Tahoe Environmental Research Center (TERC), the UC Berkeley Lawrence Hall of Sci-ence (LHS), ECHO Lake Aquarium and Science Center (ECHO), and Audience Viewpoints Consulting (AVC).
Annaleigh Yahata, an undergraduate university student, contributed to the AR Sandbox facilitation experience, as well as the editing, layout, and production of this guide. She is supported by the National Science Foundation’s Research Experiences for Undergrad-uates program (NSF Award No. DRL-1114663).
acknowledgements


![[Facilitator’s Name] [Date] [Facilitator’s Affiliation] [Facilitator’s Email Address] Heat & Health in Detroit: A Workshop for Community Leaders](https://img.pdfslide.us/doc/110x75/56649ce45503460f949b0fd0/facilitators-name-date-facilitators-affiliation-facilitators.jpg)