Embed Size (px)
Citation preview

Auditing: A Journal of Practice & Theory American Accounting AssociationVol. 33, No. 4 DOI: 10.2308/ajpt-50783November 2014pp. 119–166
Client-Auditor Supply Chain Relationships,Audit Quality, and Audit Pricing
Karla M. Johnstone, Chan Li, and Shuqing Luo
SUMMARY: We investigate the association between auditors’ supply chain knowledge
and companies’ audit quality and audit pricing. Auditor supply chain knowledge is a
specialized understanding of information and processes regarding accounting and
auditing issues that relates to both a supplier and its major customer, regardless of
industry commonalities, that is particularly useful for understanding complexities
associated with the revenue cycle. We find that auditors’ supply chain knowledge at
the city level is associated with higher audit quality and lower audit fees, compared to
companies employing auditors with supply chain knowledge at the national level or
employing auditors without supply chain knowledge. Such effects are stronger for
supplier companies that derive a high proportion of revenue from their major customers,
and when the revenue cycle for the supplier companies is more important. We obtain
these results while controlling for the usual determinants of audit quality and fees, along
with auditors’ industry specialization.
Keywords: audit pricing; audit quality; supply chain relationships; industry expertise.
INTRODUCTION
Supply chain relationships between suppliers and their major customers are of strategic
importance in the modern economy, and prior research has investigated the effects of these
relationships on partners within the supply chain. However, little is known about how otherconstituents in capital markets, such as auditors, might be affected by, or might respond to, supply
Karla M. Johnstone is a Professor at the University of Wisconsin–Madison, Chan Li is anAssociate Professor at the University of Pittsburgh, and Shuqing Luo is an Assistant Professor atthe National University of Singapore.
We thank participants at research workshops at National University of Singapore, The University of Auckland, TheUniversity of Melbourne, The University of Kansas, and University of Wisconsin–Madison for comments on drafts ofthis paper. We especially appreciate the comments of Jean Bedard, Steven Cahan, Mark DeFond, David Emanuel, DavidHay, W. Robert Knechel, Brian Mayhew, Vic Naiker, Jay Thibodeau, and Terry Warfield. Karla M. Johnstoneacknowledges support through her professorship with EY, as well as the Andersen Center for Financial Reporting at theUniversity of Wisconsin–Madison. We thank the AAA’s Auditing Section for acknowledging this manuscript with the‘‘Best Paper Award’’ for the 2012 Midyear Meeting. Finally, we thank two anonymous reviewers and our editor forexcellent suggestions and positive feedback throughout the review process.
Editor’s note: Accepted by W. Robert Knechel.
Submitted: April 2013Accepted: April 2014
Published Online: April 2014
119

chain relationships. In this study, we investigate whether audit firms’ supply chain knowledge is
associated with differential audit quality and audit pricing. We define auditor supply chain
knowledge as specialized understanding of information and processes regarding accounting and
auditing issues that relates to both a supplier and its major customer, regardless of industry
commonalities, that is particularly useful for understanding complexities associated with the
revenue cycle.
We examine audit quality and pricing implications of auditor supply chain knowledge for
several reasons. First, supply chain relationships are quite common. About 35 percent of Big 4
clients covered in Audit Analytics report having major customer relationships, and there are wealth
transfer and interdependence implications among supply chain partners (e.g., Hertzel, Li, Officer,
and Rodgers 2008). However, most prior studies focus exclusively on financial performance and
operational strategy implications for upstream suppliers or downstream major customers in the
same supply chain relationship (e.g., Baiman and Rajan 2002a; Baiman and Rajan 2002b; Kulp,
Lee, and Ofek 2004). Related issues that have received limited attention are (1) how a company’s
supply chain relationships may affect other constituents in capital markets, such as audit firms,
when they provide audit services to both suppliers and their major customers, and (2) whether the
knowledge derived from such integrated supply chain audit services is associated with higher audit
quality.1
Second, supply chain partners may use earnings management to influence the perception of
their respective supplier or customer partners about their own financial performance, and such
earnings management activity adversely affects the duration of supply chain relationships (Raman
and Shahrur 2008). The supply chain knowledge that an auditor brings may help improve audit
quality and the assurance regarding the reliability of the financial statements of the respective
supply chain partners. However, prior research has not addressed whether auditor supply chain
knowledge is associated with audit quality as proxied by the extent of earnings management in
financial statements of supply chain partners.
Third, while we predict a positive association between auditor supply chain knowledge and
audit quality, it is unclear whether that association leads to fee premia or discounts reflecting
production efficiencies. Auditors with supply chain knowledge may charge a fee premium reflecting
a differentiation strategy in which that knowledge is valued by supply chain partners. On the other
hand, there may be efficiencies for an audit firm in completing the audit engagement for both a
supplier and its major customer(s), thereby yielding a fee discount reflecting such efficiencies.
We advance the literature on the development and transfer of knowledge at the individual and
audit-firm levels (e.g., Libby and Luft 1993; Bonner and Walker 1994; Solomon, Shields, and
Whittington 1999; Thibodeau 2003) by introducing the concept of knowledge redundancy in the
context of auditor supply chain knowledge. Sivakumar and Roy (2004) develop a model explaining
the distribution of private and common knowledge among supply chain partners. We adapt their
model to explain the implications of supply chain knowledge redundancy with respect to common
knowledge available to the supply chain partners and their auditors.
To examine the audit quality and pricing implications of auditor supply chain knowledge, we
use a sample of 4,569 supplier company years, of which about 11 percent employ an auditor with
supply chain knowledge at the city level and about 21 percent of which employ an auditor with
supply chain knowledge at the national level, but not at the city level. We measure auditors’ supply
1 New research is beginning to examine how supply chain relationships affect other constituents. Luo and Nagarajan(2014) and Guan, Wong, and Zhang (2014) examine how analysts benefit from the information shared withinmembers of a supply chain relationship when analysts issue forecasts for both a supplier and one or more of thesupplier’s major customers. Both of these papers find that analysts gain an information advantage and issue moreaccurate earnings forecasts for the supplier when analysts follow both of the supply chain partners.
120 Johnstone, Li, and Luo
Auditing: A Journal of Practice & TheoryNovember 2014

chain knowledge by calculating the number of supplier companies employing the same auditor (at
the city level or national level, respectively) as their major customers, divided by the total number
of supplier companies audited by that audit firm (at the city level or national level, respectively). We
separately examine auditor supply chain knowledge at the city level and at the national level
because we expect supply chain knowledge transfer to be more pronounced within a local audit
office. We focus our sample on supplier companies rather than customer companies because by
construction, supplier companies in our sample are much more dependent on major customers than
vice versa.2
The results show that auditor supply chain knowledge at the city level (but not at the national
level) is associated with higher audit quality for supplier companies, as indicated by lower
discretionary accruals, a lower likelihood of having a restatement, and a lower likelihood of
managing earnings to meet or beat analysts’ forecasts, compared to companies employing an
auditor without supply chain knowledge. Further, we also find that such supply chain knowledge at
the city level (but not at the national level) is associated with lower audit fees paid by supplier
companies compared to those paid by companies employing an auditor without supply chain
knowledge. In addition, we find that these results only hold in situations in which the customer is
highly important to the supplier company, and when the revenue cycle of the supplier company in
the audit engagement is more important, i.e., sales and accounts receivable accounts comprise a
higher percentage of total assets for the supplier company. We obtain these results while controlling
for the usual determinants of audit quality and fees, along with auditors’ industry specialization at
the national and city levels.
We conduct several sensitivity analyses to control for potential selection bias, the effects of
potential omitted variables on the association between auditors’ supply chain knowledge and audit
quality and audit pricing, and the simultaneity of such effects. The main conclusions remain
unchanged. These results contribute to research on audit quality differentiation and audit pricing.
Demand for quality-differentiated audits has long been documented (e.g., Watts and Zimmerman
1986; Simunic and Stein 1987). However, prior literature generally finds that audit firms
differentiate themselves from competitors via either brand name or industry specialization. We
report evidence on a new dimension of auditor knowledge acquisition and transfer and document
evidence consistent with audit firms providing value-added, quality-differentiated services via
supply chain specialization.
Our study also contributes to the supply chain literature that illustrates the importance of the
information shared between supply chain partners. For example, the exchange of detailed customer
demand and inventory information within the supply chain is associated with reduced total supply
chain costs (Chen 1998; Cachon and Fisher 2000) and improved efficiency in the use of resources
(Matsumura and Schloetzer 2014). We extend this literature by exploring how supplier companies
benefit both in terms of enhanced audit quality and more competitively priced auditing services
when they purchase auditing services from the same audit firm as their major customer, but only
when that auditor conducts the two audits out of the same city office.
The remainder of the study proceeds as follows. The second section provides background
information and hypotheses. The third section describes the sample and method. The fourth section
reports empirical results and discusses additional analyses. The fifth section concludes.
2 For example, in our sample, the mean (median) supplier sales dependence on major customer companies is 21.0(16.0) percent (calculated as total sales made to a major customer, divided by total sales of the supplier in the year).The mean supplier dependence on the major customer is comparable to 19.23 percent reported in Fee, Hadlock, andThomas (2006). In contrast, the mean (median) customer purchasing dependence on supplier companies is just 3.2(2.1) percent (calculated as the purchases of a major customer from the supplier, divided by total purchases of themajor customer in the year).
Client-Auditor Supply Chain Relationships, Audit Quality, and Audit Pricing 121
Auditing: A Journal of Practice & TheoryNovember 2014

BACKGROUND AND HYPOTHESES
The Importance of Supply Chain Relationships
A company’s strategic interactions with supply chain partners can have important performance
implications. Major customers influence suppliers’ revenue and earnings realization (e.g., Baiman
and Rajan 2002a; Baiman and Rajan 2002b; Kulp et al. 2004; Hertzel et al. 2008). When a major
customer expects growth, that demand for products and services positively affects the supplier’s
revenue. Similarly, when a major customer experiences financial distress, the customer may take
actions (e.g., decrease purchases, delay or stop payment, or default on long-term contracts) that
reduce the supplier’s revenue and, thus, have negative consequences for the supplier’s financial
performance (Hertzel et al. 2008).
Suppliers can also affect their customers’ expenses and resulting financial performance. For
example, a major customer with a trusted relationship with a supplier will benefit from a dependable
supply source and improved effectiveness of inventory management and operational efficiency,
each of which reduces costs and improves earnings (Gavirneni, Kapuscinski, and Tayur 1999; Lee,
So, and Tang 2000; Fee and Thomas 2004). Alternatively, when a supplier experiences a raw
material shortage or price increase, these adverse events negatively affect a major customer’s
production efficiency, inventory management, and product delivery (Gavirneni et al. 1999; Lee et
al. 2000; Fee and Thomas 2004).
Given the strategic importance of supply chain relationships to company performance, Raman
and Shahrur (2008) document the role of supply chain relationships in financial reporting decisions.
They argue that because the value of supply chain relationships to the suppliers/customers depends
on each company’s future prospects, supply chain partners may use earnings management to inflate
earnings in order to favorably influence the perception of suppliers/customers and their willingness
to undertake continuing relationship-specific investment. Other studies also find that companies
manage earnings to influence other terms of trade with suppliers/customers, such as input/output
prices and terms of trade credit. For example, customers are willing to pay higher prices if they
perceive that their suppliers have superior ability to honor explicit or implicit commitments, which
is likely to be the case for more profitable suppliers (e.g., Bowen, DuCharme, and Shores 1995;
Burgstahler and Dichev 1997).
The Development and Transfer of Auditor Supply Chain Knowledge
From an auditing perspective, supply chain relationships are important to suppliers because
they affect the suppliers’ revenue cycle. The revenue cycle is one of the most important transaction
cycles in any audit (Johnstone, Gramling, and Rittenberg 2013). Improper revenue recognition
practices are the most frequent cause of financial misstatements. In fact, 50–60 percent of the fraud
cases involve overstating revenues (Committee of Sponsoring Organizations of the Treadway
Commission [COSO] 1999, 2010).
By providing integrated supply chain auditing services, we predict that both individual auditors
and audit firms develop knowledge that is useful in understanding the supply chain partners and
assessing their respective risks. Such an effect would be consistent with knowledge gains due to
industry specialization (e.g., Craswell, Francis, and Taylor 1995; Mayhew and Wilkins 2003;
Balsam, Krishnan, and Yang 2003; Reichelt and Wang 2010). However, the nature of this
knowledge is likely different from that captured in studies on industry specialization, since supplier
and customer companies are generally in different industries. Our discussions with audit
practitioners suggest that supply chain knowledge relates to a deep understanding of the risks
inherent in the revenue cycle of supplier companies in their respective industries. In situations in
which there is no audit team overlap between the two engagements, one partner with whom we
122 Johnstone, Li, and Luo
Auditing: A Journal of Practice & TheoryNovember 2014

spoke explained that if a particularly complex issue arose, then consulting the other engagement
team was helpful, particularly in auditing revenue cycle accounts. The partner explained that since
customer incentive payments are often one of the more challenging issues, being able to more fully
understand both sides of the agreement would be important, since revenue recognition is one of the
highest restatement areas. That partner also described a situation in which he served on the
engagement of a major customer whose supplier was also audited by his firm. In that situation, one
client was on the wholesale side and the other on the retail side. He noted that the audit firm has
significant internal knowledge leadership that is gathered from these clients that is shared at an
aggregate basis and that is cleansed of specific client information.
Based on this discussion, we define auditor supply chain knowledge as specialized
understanding of information and processes regarding accounting and auditing issues that relates
to both a supplier and its major customer, regardless of industry commonalities, that is particularly
useful for understanding the complexities associated with the revenue cycle. Supply chain
knowledge exists at both the individual auditor level and at the organizational level through audit
firm knowledge leadership, knowledge management systems, and personal communication
networks. While it is logical to expect that there may be some overlap of auditor industry
knowledge and auditor supply chain knowledge, supply chain knowledge differs in that it can
develop across clients regardless of industry membership, and that it is likely more specialized,
focusing especially on accounting and auditing issues concerning revenue cycle accounts. Further,
it is logical to expect that auditor supply chain knowledge differs from nontransferrable client-
specific knowledge because it is aggregated across clients in a way that ensures client
confidentiality.
The Development of Supply Chain Knowledge at an Individual Level
A variety of factors play a role in the development of supply chain knowledge over the course
of an auditor’s career. Underlying audit task knowledge develops early, including both explicit and
tacit knowledge, and is an important determinant of audit task performance (Libby and Luft 1993).
As the auditor specializes in certain industries, industry expertise grows (Bonner and Walker 1994;
Solomon et al. 1999; Thibodeau 2003). Over time, the auditor establishes personal and professional
contacts in the business community, which enables networking across individuals and organizations
through repeated interactions (Borgatti and Cross 2003). These interactions may yield
enhancements in the acquisition of supply chain knowledge (e.g., relating to accounts receivable,
revenue, and associated contracting complexities). As the auditor gains further experience, the
likelihood increases that the auditor will work on both engagements in a supply chain partnership,
or will have close colleagues within the audit firm that do so. It also increases the likelihood of an
individual auditor working on one client in the supply chain relationship and then transferring to
also working on the other client in the relationship. Ultimately, over time and with experience, the
auditor develops an understanding of commonalities and shared risks/opportunities among supply
chain partners, which constitutes individual auditor-level supply chain knowledge.
The Transfer of Supply Chain Knowledge at an Organizational Level
In addition to developing supply chain knowledge at the individual level, audit firms face the
organizational challenge of ensuring effective transfer of such knowledge among and between
engagement teams. A significant body of the management literature is devoted to knowledge
transfer and organizational learning (e.g., Borgatti and Cross 2003; van Wijk, Jansen, and Lyles
2008). An important construct in that literature is that of knowledge redundancy, which is defined
as ‘‘the degree of overlap in the knowledge base between two or more social actors’’ (Rindfleisch
and Moorman 2001). Knowledge redundancy has been used to understand how individuals and
Client-Auditor Supply Chain Relationships, Audit Quality, and Audit Pricing 123
Auditing: A Journal of Practice & TheoryNovember 2014

organizations manage interpersonal and interorganizational communication of knowledge,
processes, and ideas. Sivakumar and Roy (2004) extend the knowledge redundancy literature
into the supply chain domain, arguing that while in some contexts knowledge redundancy may be
viewed as wasteful, in the supply chain domain it is essential for superior performance of the
partners because they cannot operate effectively unless they have in-depth knowledge of their
supply chain partner. Suppliers and major customers will find it in their mutual best interests to
share knowledge, ideas, and processes with one another to achieve maximum performance. As an
example from our sample, Apache Corporation is in the crude petroleum and natural gas industry
(SIC 1311) and its supplier is OIL States International Inc., which is in the oil and gas field
machinery and equipment industry (SIC 3533). The same audit firm conducts both engagements out
of the Houston, TX office. When the auditor audits both Apache and OIL States, we expect that
knowledge redundancy between the three parties will be enhanced, which should be beneficial from
an auditing perspective.
Auditing standards demand client confidentiality.3 However, it is important to note that
specialized knowledge in a particular field is allowed to transfer among different client
engagements (McAllister and Cripe 2008).4 Audit firm knowledge leadership, knowledge
management systems, and informal knowledge sharing via personal networks enable the capture
and dissemination of broad insights for companies up and down the supply chain. We expect supply
chain-relevant knowledge will help auditors to make more informed judgments and more accurate
risk assessments, especially with regard to the revenue cycle on the audits of the supplier
companies, thus producing a higher-quality audit.
Sivakumar and Roy (2004) develop a model explaining the distribution of private and common
knowledge among supply chain partners. In Figure 1, we adapt their model to explain the implications
of supply chain knowledge redundancy with respect to common knowledge available to the supply
chain partners and their auditors. Each of the scenarios in Figure 1 depicts the knowledge possessed
by only the supplier (denoted Ksupplier), the knowledge possessed by only the customer (denoted
Kcustomer), the common knowledge shared between the supplier and auditor (denoted KC-S, A), the
common knowledge shared between the customer and auditor (denoted KC-C, A), and finally the
common knowledge of all three parties (denoted KC-S, C, A). Following the introduction of our
hypotheses, we discuss the various panels in Figure 1, including implications for differences in the
application of supply chain-relevant knowledge at the city versus national levels, and in situations in
which the supplier is more versus less reliant on the major customer or when the revenue cycle is
more versus less important to the supplier.
3 The AICPA’s (1992) confidentiality rules compel the individual auditor not to reveal private information about eitherpartner in the supply chain relationship to the other client. However, it is routine practice for engagement teams todiscuss information about clients both audited by their firm. One partner that we contacted told us that individualauditors generally do not to talk with other teams about specific client matters that would not otherwise be publiclyknown. That said, he noted that situations do arise when it is appropriate to share knowledge that could benefit theindividual office or the audit firm. Such situations tend to relate to particular accounting or auditing issues, not toconfidential client information. He noted that such communications are usually informal and verbal, which is due tothe need to delicately address a potential issue without compromising confidentiality.
4 McAllister and Cripe (2008, 53) provide a comprehensive discussion of the benefits and risks of knowledge transferacross client engagements. Of most relevance, the authors state, ‘‘paragraph 30 of Rule 301 allows auditors to provide‘knowledge and expertise resulting in a special competence in a particular field’ to clients without violating theconfidence of another client as long as details associated with a particular engagement are not disclosed. Thisindicates that auditors are allowed to apply technical knowledge and experience acquired during current auditengagements to future audit engagements.’’
124 Johnstone, Li, and Luo
Auditing: A Journal of Practice & TheoryNovember 2014

Hypotheses Concerning Supply Chain Knowledge, Audit Quality, and Audit Pricing
As discussed earlier, supply chain-relevant knowledge should help auditors to make more
informed judgments and more accurate risk assessments, especially with regard to the revenue cycle
on the audits of the supplier companies, thus producing a higher-quality audit. Our first set of
hypotheses involves expectations comparing audit quality and audit pricing of supplier companies
audited by auditors with supply chain knowledge (at either the city or the national levels) to those
without such knowledge. Hereafter, we refer to an audit firm that provides audit services to both a
supplier and its major customer out of one office location as a ‘‘supply chain auditor at the city
level’’ and we refer to an audit firm that provides audit services to both a supplier and its major
customer out of two separate audit office locations as a ‘‘supply chain auditor at the national level.’’
H1a: Supplier companies audited by a supply chain auditor receive higher audit quality
compared to supplier companies audited by a non-supply chain auditor.
H1b: Supplier companies audited by supply chain auditors at the national level receive higher
audit quality compared to supplier companies audited by non-supply chain auditors.
As an example from our sample relating to H1a, the same audit firm audits Micron Technology
Inc. and its supplier, Netlogic Microsystems, Inc., both out of the San Jose, CA office. H1a predicts
higher audit quality for Netlogic Microsystems compared to a supplier-customer pair audited by
FIGURE 1Implications of Supply Chain Auditing Knowledge Redundancy
Note: Ksupplier denotes supplier knowledge; Kcustomer denotes customer knowledge; Kc denotes common knowledge withsubscript denoting supplier (S), customer (C), or auditor (A); dashed boarder denotes entire domain of auditorknowledge.
Client-Auditor Supply Chain Relationships, Audit Quality, and Audit Pricing 125
Auditing: A Journal of Practice & TheoryNovember 2014

different audit firms. As an example from our sample relating to H1b, the same audit firm audits
Barnes & Noble Inc. and its supplier, Source Interlink Inc., but out of different offices (Chicago, IL
and New York, NY, respectively). H1b predicts higher audit quality for Source Interlink compared
to a supplier-customer pair audited by different audit firms.
While H1a and H1b predict that supply chain knowledge can be leveraged by auditors at both
the city and national levels, we expect that the effect should be more pronounced at the city level.
Figure 1, Scenarios A and B depict knowledge sharing for city-level versus national-level auditor
supply chain knowledge. When different auditor offices conduct the audits for a supplier and its
major customer, these audits are typically conducted by different audit teams with different audit
partners. At the national level, it is less likely that auditors from different offices have information
communication concerning the related companies in their client portfolio. In such circumstances,
the information advantages and the knowledge that auditors build by providing supply chain
auditing services is likely to be less. In contrast, it is likely that informal communication concerning
these parties within the same city office may help auditors assess the business risk of supplier
companies. In situations in which an individual auditor is involved in the audit of both the supplier
company and the customer company, that individual knowledge is naturally retained. For example,
it would not be unusual to find overlap among members of an audit engagement team on both a
supplier client and a major customer client, especially when the supplier and major customer are
audited by the same city office of the audit firm. The result is that KC-S, C, A in Scenario A is larger
than KC-S, C, A in Scenario B. Thus, our next hypothesis is:
H1c: Supplier companies audited by supply chain auditors at the city level receive higher
audit quality compared to supplier companies audited by supply chain auditors at the
national level.
Continuing prior examples, H1c predicts higher audit quality for Netlogic Microsystems (same
city-level auditor) compared to Source Interlink (same national-level auditor).
Regarding audit pricing, Raman and Shahrur (2008) document an earnings management
motivation in financial reporting for supply chain partners. They argue that because the value of
supply chain relationships to the suppliers/customers depends on each company’s future prospects,
supply chain partners may use earnings management to favorably influence the perception of their
supply chain partner. This motivation creates both a demand for, and supply of, quality and fee
differentiated audit services (e.g., Copley and Doucet 1993; Copley, Doucet, and Gaver 1994).
In addition to a risk-based argument, if supplier companies place value on auditors’ supply
chain knowledge and resulting higher audit quality, auditors with supply chain knowledge may be
able to charge a fee premium reflecting this differentiation strategy. For example, the audit
committee of a supplier company may find it appealing during the bidding process to know that
members of the audit engagement team have experience auditing the company’s major customer,
especially when the supplier and major customer are audited by the same city office of the audit
firm, which may then translate to the auditor being able to negotiate a relatively higher audit fee
than cases if members of the audit engagement team had no such relevant experience.5 One partner
with whom we spoke stated his strategy in these cases is to highlight supplier experience during the
proposal process when he thinks it will be beneficial to demonstrating additional knowledge, and
when the potential client has not indicated concern about the auditor’s relationship with the major
customer.
5 If the audit committee members were uncomfortable with the potential for the supplier’s private information leakageby the auditor with supply chain knowledge, even if it were indirect, to the major customer, then presumably the auditcommittee members simply would not hire the auditor with such knowledge in the first place.
126 Johnstone, Li, and Luo
Auditing: A Journal of Practice & TheoryNovember 2014

A competing argument is that the auditor’s supply chain knowledge and resulting synergies
could yield audit production efficiencies. Production efficiencies associated with auditor supply
chain knowledge would enable the auditor to offer a fee discount reflecting such efficiencies; such
synergies would of course be most pronounced when the supplier and the major customer are
audited by the same city office of the audit firm. One partner with whom we spoke articulated the
process by which this might occur, stating that when there is supply chain knowledge the audit firm,
as a whole, would generally have greater experience, which could lead to efficiencies. He noted that
if both clients were in the same office (even if the audit teams may not directly overlap) there would
be experience in the office and/or an ability to consult on tough issues that otherwise may take
additional time to resolve independently without such consultation. Prior research shows an
association between audit production efficiencies and audit pricing. For example, Gist (1994)
provides empirical evidence that audit firms with a more structured audit approach charge lower
audit fees, although that study acknowledges that without data on audit hours (a direct measure of
audit effort) a definitive link between audit firm structure and production efficiencies is unavailable.
Dopuch, Gupta, Simunic, and Stein (2003, 52) utilize empirical data on audit firm effort and pricing
and show that inefficiencies in audit production hours are associated with reductions in audit firm
realization rates, and they also note that ‘‘efficient production could also lead to fee discounting.’’More recently however, Knechel, Rouse, and Schelleman (2009) report that audit fees are not very
sensitive to audit efficiency, so the results with respect to audit production models are mixed.
Based on these two competing arguments, it remains an empirical question as to whether
providing audit services to supply chain partners is associated with higher or lower audit fees. As
such, we formulate the following research question:
RQ: Do supplier companies audited by supply chain auditors at the national or city level pay
higher or lower audit fees compared to companies audited by non-supply chain auditors?
Hypotheses Concerning Supply Chain Knowledge and Supplier Reliance and SupplierRevenue Cycle Importance
Supplier reliance on a major customer varies across supplier-customer pairs, and the importance
of revenue cycle accounts also varies across individual suppliers. Comparing Scenarios C and D in
Figure 1 helps to explain knowledge redundancy implications when the supplier and customer have
asymmetric overlap of private versus common knowledge. Asymmetric overlap occurs when one
party in the supply chain relationship has greater private knowledge than the other party. Scenario C
represents a situation in which the supplier’s reliance on the customer is higher in terms of the
percentage of revenue they earn through transactions with the customer, or for which the revenue
cycle is relatively more important to the supplier, whereas Scenario D represents a situation in which
the supplier’s reliance is lower or the revenue cycle is relatively less important. Comparing Scenarios
C and D illustrates that when a supplier company is more dependent on the sales made to its major
customer, or when the revenue cycle accounts of the supplier companies are the primary accounts
affected by the supplier-customer relationship, the common knowledge available to an auditor with
integrated supply chain knowledge is greater than when a supplier company is less dependent on its
major customer. Sivakumar and Roy (2004, 245) illustrate the extreme example of supply chain
dependence as one in which a supplier’s only source of revenue is manufacturing steering wheels for
Ford Motor Company. The authors note ‘‘Clearly, such a supplier can be expected to be efficient and
to be almost as internalized and domesticated as a company department . . . knowledge redundancy
will be at a maximum between the supplier and Ford.’’Finally, based on insights gained from comparing Scenarios C and D in Figure 1, we predict
that the associations that we observe relevant to H1 and the research question will be stronger in
two situations: (1) for supplier companies that derive a high proportion of their total revenue from
Client-Auditor Supply Chain Relationships, Audit Quality, and Audit Pricing 127
Auditing: A Journal of Practice & TheoryNovember 2014

sales to their major customers, and (2) when the revenue cycle in the audit engagement for supplier
companies is more important.
H2a: The association between audit quality and auditor supply chain knowledge at the
national or city level is stronger for supplier companies (1) that derive a greater
proportion of their total revenue from sales to their major customers, and (2) when the
revenue cycle in the audit engagement for the supplier companies is more important.
H2b: The association between audit fees and auditor supply chain knowledge at the national
level or city level is stronger for supplier companies (1) that derive a greater proportion
of their total revenue from sales to their major customers, and (2) when the revenue
cycle in the audit engagement for the supplier companies is more important.
SAMPLE AND METHOD
Sample
To determine whether a supplier and its major customer employ the same audit firm in a given
fiscal year, we require identification of each party in a company’s supply chain relationships and the
identity of the auditors of these companies. SFAS No. 14 (FASB 1976) requires companies to
report financial information for any industry segment that comprises more than 10 percent of the
company’s consolidated yearly sales, assets, or profit. In addition, companies must disclose the
name of any customer representing more than 10 percent of the total sales of the company. We
obtain this information from the Compustat customer segment file, a subset of the Compustat
segment database that records the identity of, and sales to, a company’s major customers based on
the company’s 10-K.6
Table 1 shows the sample selection process. We begin with all supplier-major customer
relationships reported in the Compustat customer segment file during the period January 1, 2003
to December 31, 2010. We start in 2003 to avoid issues associated with the collapse of Arthur
Andersen in 2002. We use an algorithm similar to that in Fee and Thomas (2004) that compares
the number and order of the letters for the customer names with the historical company names
listed in the CRSP company name file and retain a list of 8,451 supplier company-years with a
valid GVKEY for both the supplier and its major customer. When a supplier company discloses
more than one major customer, we retain in our sample the customer to whom the supplier makes
the greatest amount of sales. As noted previously, we focus our sample on supplier companies
rather than customer companies because suppliers are much more dependent on the sales made to
major customers than vice versa. We then delete 373 supplier-years in the financial sector (e.g.,
Francis, Reichelt, and Wang 2005; Reichelt and Wang 2010), 471 supplier-years with either the
supplier or the major customer not covered by Audit Analytics, and 504 supplier companies not
headquartered in the U.S. We eliminate 1,136 (1,398) suppliers (major customers) with missing
financial data from Compustat. We require data on major customers because we include the
abnormal audit fee of the major customer as one of the control variables in the regression
analyses. This yields a sample of 4,569 supplier company-year observations. In analyzing audit
quality, we also examine the propensity of companies’ meeting or beating analysts’ earnings
forecasts within one penny of earnings per share (Reichelt and Wang 2010). The additional
6 Therefore, all customer companies included in our sample meet this requirement, i.e., customer companies that makeless than 10 percent of the total sales to the supplier company will not be included in our sample.
128 Johnstone, Li, and Luo
Auditing: A Journal of Practice & TheoryNovember 2014
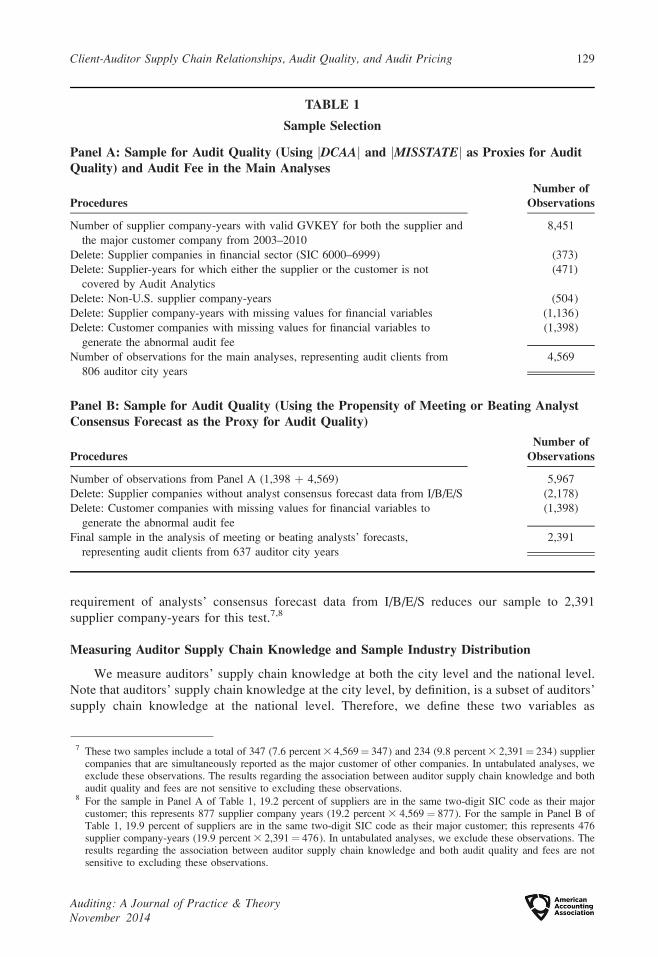
requirement of analysts’ consensus forecast data from I/B/E/S reduces our sample to 2,391
supplier company-years for this test.7,8
Measuring Auditor Supply Chain Knowledge and Sample Industry Distribution
We measure auditors’ supply chain knowledge at both the city level and the national level.
Note that auditors’ supply chain knowledge at the city level, by definition, is a subset of auditors’
supply chain knowledge at the national level. Therefore, we define these two variables as
TABLE 1
Sample Selection
Panel A: Sample for Audit Quality (Using jDCAAj and jMISSTATEj as Proxies for AuditQuality) and Audit Fee in the Main Analyses
ProceduresNumber of
Observations
Number of supplier company-years with valid GVKEY for both the supplier and
the major customer company from 2003–2010
8,451
Delete: Supplier companies in financial sector (SIC 6000–6999) (373)
Delete: Supplier-years for which either the supplier or the customer is not
covered by Audit Analytics
(471)
Delete: Non-U.S. supplier company-years (504)
Delete: Supplier company-years with missing values for financial variables (1,136)
Delete: Customer companies with missing values for financial variables to
generate the abnormal audit fee
(1,398)
Number of observations for the main analyses, representing audit clients from
806 auditor city years
4,569
Panel B: Sample for Audit Quality (Using the Propensity of Meeting or Beating AnalystConsensus Forecast as the Proxy for Audit Quality)
ProceduresNumber of
Observations
Number of observations from Panel A (1,398 þ 4,569) 5,967
Delete: Supplier companies without analyst consensus forecast data from I/B/E/S (2,178)
Delete: Customer companies with missing values for financial variables to
generate the abnormal audit fee
(1,398)
Final sample in the analysis of meeting or beating analysts’ forecasts,
representing audit clients from 637 auditor city years
2,391
7 These two samples include a total of 347 (7.6 percent 3 4,569¼ 347) and 234 (9.8 percent 3 2,391¼ 234) suppliercompanies that are simultaneously reported as the major customer of other companies. In untabulated analyses, weexclude these observations. The results regarding the association between auditor supply chain knowledge and bothaudit quality and fees are not sensitive to excluding these observations.
8 For the sample in Panel A of Table 1, 19.2 percent of suppliers are in the same two-digit SIC code as their majorcustomer; this represents 877 supplier company years (19.2 percent 3 4,569 ¼ 877). For the sample in Panel B ofTable 1, 19.9 percent of suppliers are in the same two-digit SIC code as their major customer; this represents 476supplier company-years (19.9 percent 3 2,391¼ 476). In untabulated analyses, we exclude these observations. Theresults regarding the association between auditor supply chain knowledge and both audit quality and fees are notsensitive to excluding these observations.
Client-Auditor Supply Chain Relationships, Audit Quality, and Audit Pricing 129
Auditing: A Journal of Practice & TheoryNovember 2014

orthogonal to each other. In particular, CHAIN_CITY is a ratio measure of auditors’ supply chain
knowledge at the city level, and it is defined as the number of supplier companies (i.e., companies
that have reported having major customer relationships in Compustat with both the supplier and
the major customer being covered in Audit Analytics) employing the same city-office auditor as
their major customers, divided by the total number of supplier companies from the same auditor
city in the year. For example, assume that Audit Firm X in City A has ten client companies that
have major customer relationships. Further assume that Audit Firm X also audits two of these
supplier companies’ major customers out of the City A office. In this example, CHAIN_CITYequals 20 percent. CHAIN_CITY equals 0 if Audit Firm X does not audit any of the supplier
companies’ major customers out of the City A office. CHAIN_NATION is a ratio measure of
auditors’ supply chain knowledge at the national level, and it is defined as the number of supplier
companies employing the same auditor (but not from the same city) as their major customers,
divided by the total number of supplier companies that the audit firm audits at the national level.
For example, assume that Audit Firm X has 100 client companies that have major customer
relationships nationwide. Further assume that Audit Firm X also audits two of these supplier
companies’ major customers, but that the supplier and customer companies are audited out of
different city offices. In this example, CHAIN_NATION equals 2 percent. Appendix A provides
further illustrations of the calculation of these variables using examples from the sample; our
calculations reflect the convention in the industry specialization literature regarding the use of
relative market share to measure the underlying construct (e.g., Craswell et al. 1995; Balsam et al.
2003).
Table 2 shows that about 11 percent of supplier companies (509/4,569) employ an auditor with
city-level supply chain knowledge, 21 percent (979/4,569) employ an auditor with national-level
TABLE 2
Industry Distribution of Sample Companies
Fama-French’s 12 Industries
CHAIN_CITY . 0 CHAIN_NATION . 0CHAIN_CITY ¼ 0 andCHAIN_NATION ¼ 0
n Percent n Percent n Percent
Consumer nondurables 19 3.7% 120 12.3% 413 13.4%
Consumer durables 7 1.4% 48 4.9% 165 5.4%
Manufacturing 64 12.6% 150 15.3% 473 15.4%
Energy and coal extraction and
products
31 6.1% 35 3.6% 244 7.9%
Chemicals and allied products 11 2.2% 29 3.0% 126 4.1%
Business equipment 200 39.3% 250 25.5% 878 28.5%
Telephone and television
transmission
11 2.2% 28 2.9% 41 1.3%
Utilities 21 4.1% 14 1.4% 48 1.6%
Wholesale, retail, and some
services
10 2.0% 39 4.0% 107 3.5%
Healthcare, medical equipment,
and drugs
86 16.9% 137 14.0% 312 10.1%
Others 49 9.6% 129 13.2% 274 8.9%
Total 509 100% 979 100% 3,081 100%
130 Johnstone, Li, and Luo
Auditing: A Journal of Practice & TheoryNovember 2014
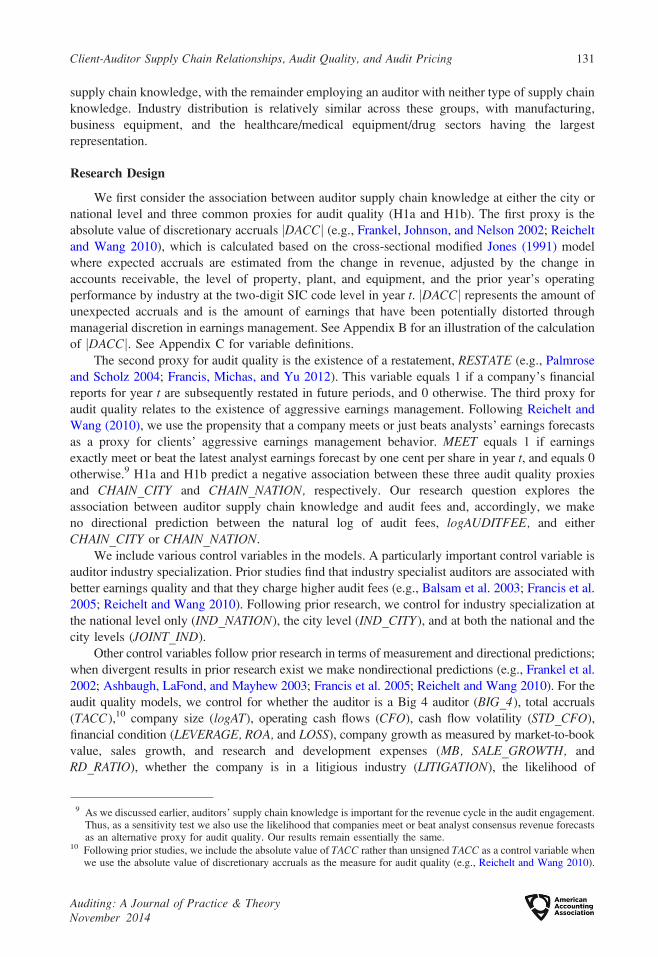
supply chain knowledge, with the remainder employing an auditor with neither type of supply chain
knowledge. Industry distribution is relatively similar across these groups, with manufacturing,
business equipment, and the healthcare/medical equipment/drug sectors having the largest
representation.
Research Design
We first consider the association between auditor supply chain knowledge at either the city or
national level and three common proxies for audit quality (H1a and H1b). The first proxy is the
absolute value of discretionary accruals jDACCj (e.g., Frankel, Johnson, and Nelson 2002; Reichelt
and Wang 2010), which is calculated based on the cross-sectional modified Jones (1991) model
where expected accruals are estimated from the change in revenue, adjusted by the change in
accounts receivable, the level of property, plant, and equipment, and the prior year’s operating
performance by industry at the two-digit SIC code level in year t. jDACCj represents the amount of
unexpected accruals and is the amount of earnings that have been potentially distorted through
managerial discretion in earnings management. See Appendix B for an illustration of the calculation
of jDACCj. See Appendix C for variable definitions.
The second proxy for audit quality is the existence of a restatement, RESTATE (e.g., Palmrose
and Scholz 2004; Francis, Michas, and Yu 2012). This variable equals 1 if a company’s financial
reports for year t are subsequently restated in future periods, and 0 otherwise. The third proxy for
audit quality relates to the existence of aggressive earnings management. Following Reichelt and
Wang (2010), we use the propensity that a company meets or just beats analysts’ earnings forecasts
as a proxy for clients’ aggressive earnings management behavior. MEET equals 1 if earnings
exactly meet or beat the latest analyst earnings forecast by one cent per share in year t, and equals 0
otherwise.9 H1a and H1b predict a negative association between these three audit quality proxies
and CHAIN_CITY and CHAIN_NATION, respectively. Our research question explores the
association between auditor supply chain knowledge and audit fees and, accordingly, we make
no directional prediction between the natural log of audit fees, logAUDITFEE, and either
CHAIN_CITY or CHAIN_NATION.
We include various control variables in the models. A particularly important control variable is
auditor industry specialization. Prior studies find that industry specialist auditors are associated with
better earnings quality and that they charge higher audit fees (e.g., Balsam et al. 2003; Francis et al.
2005; Reichelt and Wang 2010). Following prior research, we control for industry specialization at
the national level only (IND_NATION), the city level (IND_CITY), and at both the national and the
city levels (JOINT_IND).
Other control variables follow prior research in terms of measurement and directional predictions;
when divergent results in prior research exist we make nondirectional predictions (e.g., Frankel et al.
2002; Ashbaugh, LaFond, and Mayhew 2003; Francis et al. 2005; Reichelt and Wang 2010). For the
audit quality models, we control for whether the auditor is a Big 4 auditor (BIG_4), total accruals
(TACC),10 company size (logAT), operating cash flows (CFO), cash flow volatility (STD_CFO),
financial condition (LEVERAGE, ROA, and LOSS), company growth as measured by market-to-book
value, sales growth, and research and development expenses (MB, SALE_GROWTH, and
RD_RATIO), whether the company is in a litigious industry (LITIGATION), the likelihood of
9 As we discussed earlier, auditors’ supply chain knowledge is important for the revenue cycle in the audit engagement.Thus, as a sensitivity test we also use the likelihood that companies meet or beat analyst consensus revenue forecastsas an alternative proxy for audit quality. Our results remain essentially the same.
10 Following prior studies, we include the absolute value of TACC rather than unsigned TACC as a control variable whenwe use the absolute value of discretionary accruals as the measure for audit quality (e.g., Reichelt and Wang 2010).
Client-Auditor Supply Chain Relationships, Audit Quality, and Audit Pricing 131
Auditing: A Journal of Practice & TheoryNovember 2014

bankruptcy (ALTMAN), and auditor tenure (logAUDITOR_TENURE). We expect BIG_4, CFO, and
ROA to be positively associated with audit quality (i.e., negatively associated with jDACCj,RESTATE, or MEET), and TACC, STD_CFO, LEVERAGE, LOSS, MB, SALE_GROWTH,
RD_RATIO, and ALTMAN to be negatively associated with audit quality (i.e., positively associated
with jDACCj, RESTATE, or MEET). We make no directional predictions for logAT or LITIGATION
or logAUDITOR_TENURE due to variation in results in prior studies (e.g., Ashbaugh et al. 2003;
Knechel and Vanstraelen 2007; Reichelt and Wang 2010).
In the audit fee models, we control for whether the auditor is a Big 4 auditor (BIG_4), whether
the company’s year-end is in the busy season (BUSY_SEASON), company size (logAT), long term
debt (LONG_DEBT), current liabilities (CURRENT_LIABILITY), inventory ratio (INVT_RATIO), a
modified auditor opinion (MODIFIED_OPN), financial risk (ROA and LOSS), volatility
(STD_CFO), growth (SALE_GROWTH and RD_RATIO), restructuring (RESTRUCTURE), special
items (SPECIAL_ITEM), foreign transactions (FOREIGN), complexity (NUM_SEG), and auditor
tenure (logAUDITOR_TENURE). We expect ROA to be negatively associated with audit fees, and
the other variables to be positively associated with audit fees.
Finally, because characteristics of suppliers’ major customers may potentially affect supplier
companies’ audit quality and audit fees, we control for such characteristics. To manage the number
of independent variables, we include a variable representing the abnormal audit fee paid by major
customer companies (ABN_CU_logFEE). ABN_CU_logFEE is the residual value from the audit fee
model presented in Appendix D. We make no directional prediction for the association between
ABN_CU_logFEE and audit quality, and expect a positive association between ABN_CU_logFEE
and audit fees.
Below are the regression models that we use to examine the association between auditor supply
chain knowledge and audit quality. Because CHAIN_CITY and CHAIN_NATION are defined at the
auditor-office-year and auditor-year level, respectively, we adjust the standard errors for the
coefficient estimates in the regression analyses by clustering the observations at the supplier-company
level.
jDACCtj ; ðRESTATEtÞ ; ðMEETtÞ ¼ b0 þ b1CHAIN CITYt þ b2CHAIN NATIONt
þ b3IND NATIONt þ b4IND CITYt þ b5JOINT INDt
þ b6BIG 4t þ b7jTACCtjðTACCtÞ þ b8logATt þ b9CFOt
þ b10STD CFOt þ b11LEVERAGEt þ b12ROAt
þ b13LOSSt þ b14MBt þ b15SALE GROWTHt
þ b16RD RATIOt þ b17LITIGATIONt þ b18ALTMANt
þ b19logAUDITOR TENUREt þ b20ABN CU logFEEt
þ fixed industryþ fixed year þ et
ð1Þ
logðAUDITFEEtÞ ¼ b0 þ b1CHAIN CITYt þ b2CHAIN NATIONt þ b3IND NATIONt
þ b4IND CITYt þ b5JOINT INDt þ b6BIG 4t þ b7BUSY SEASONt
þ b8logATt þ b9LONG DEBTt þ b10CURRENT LIABILITYt
þ b11INVT RATIOt þ b12MODIFIED OPNt þ b13ROAt þ b14LOSSt
þ b15STD CFOt þ b16SALE GROWTHt þ b17RESTRUCTUREt
þ b18SPECIAL ITEMt þ b19FOREIGNt þ b20NUM SEGt
þ b21RD RATIOt þ b22logAUDITOR TENUREt þ b23ABN CU logFEEt
þ fixed industryþ fixed year þ et
ð2Þ
132 Johnstone, Li, and Luo
Auditing: A Journal of Practice & TheoryNovember 2014

RESULTS
Descriptive Statistics
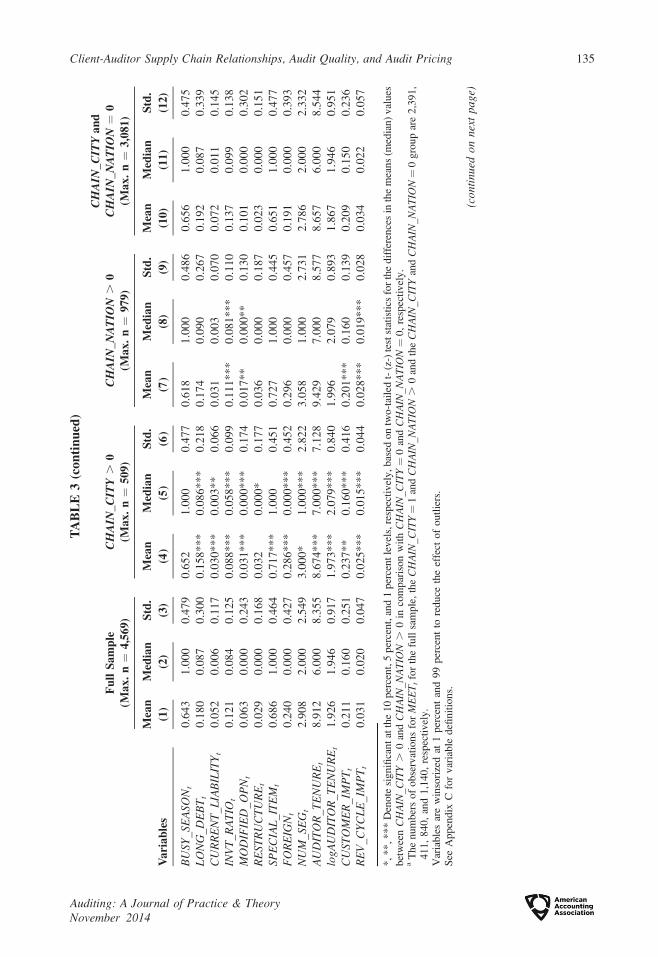
Table 3, Panel A reports descriptive statistics for for the full sample, as well as the three
subsamples of companies, i.e., CHAIN_CITY . 0, CHAIN_NATION . 0, and CHAIN_CITY and
CHAIN_NATION ¼ 0. Using the full sample, the mean jDACCj is 0.097, 15.8 percent of the
companies restated their financial statements (RESTATE), and 12.5 percent of companies have met
or just beat analyst forecasts by one cent (MEET). The mean (median) of logAUDITFEE is 13.130
(13.158), which is equivalent to an unlogged mean (median) value of $1.29 million ($573,000).
Univariate comparisons at the city level show that, compared with companies for which
CHAIN_CITY and CHAIN_NATION ¼ 0, those companies for which CHAIN_CITY . 0 have
marginally lower discretionary accruals (jDACCj; p ¼ 0.08), a lower likelihood of restatement
(RESTATE; p ¼ 0.045), a marginally lower likelihood of meeting or beating the latest analyst
earnings forecast by one cent (MEET; p ¼ 0.08), and no significant difference in audit fees. In
addition, companies for which CHAIN_NATION . 0 also have a marginally lower likelihood of
restatement (RESTATE; p ¼ 0.08) compared with companies for which CHAIN_CITY and
CHAIN_NATION ¼ 0. However, the differences in jDACCj, MEET, and logAUDITFEE between
these two groups are insignificant. When comparing companies for which CHAIN_CITY . 0 to
those companies for which CHAIN_NATION . 0 (untabulated), we find the former companies have
marginally lower discretionary accruals (p¼ 0.06), and lower audit fees (p¼ 0.02) compared to the
latter companies.
The Pearson/Spearman correlation matrix in Table 3, Panel B reveals that jDACCj is negatively
associated with both CHAIN_CITY (p , 0.01) and IND_CITY (p¼ 0.02). RESTATE is negatively
associated with both logAUDITFEE (p , 0.01) and CHAIN_CITY (p¼ 0.04). MEET is positively
associated with logAUDITFEE (p , 0.01). Due to the large number of control variables across
various models, we do not tabulate those correlations. While several correlations among
independent variables exceed 0.35, the highest variance influence factor (VIF) is only 4.60
(2.31) in the model of audit quality using discretionary accruals as the measure and audit fee,
respectively, suggesting multicollinearity is unlikely to be problematic.
Regarding correlations between auditor supply chain knowledge and industry specialization,
the results reveal that CHAIN_CITY is positively associated with both CHAIN_NATION (p , 0.01)
and JOINT_IND (p , 0.01), and is negatively associated with IND_CITY (p , 0.01).
CHAIN_NATION is positively associated with IND_NATION (p , 0.01), IND_CITY (p ,
0.01), and JOINT_IND (p , 0.01). While statistically significant, the correlations between proxies
for auditor supply chain knowledge and industry specialization range from�0.09 to 0.15, so these
constructs appear to be related but distinct.
Hypothesis Testing
Table 4, Columns (1)–(3) report results relevant to testing H1a and H1b. The results show that
CHAIN_CITY is negatively associated with the level of absolute discretionary accruals (p¼ 0.017),
the likelihood of a restatement (p¼ 0.045), and the likelihood of meeting or just beating analysts’
forecasts for supplier companies (p¼ 0.033). These results support H1a. To put these coefficients
into perspective, these results suggest a decrease of 5.2 percent (�0.045 3 0.112)/0.097) in the total
level of absolute discretionary accruals, a decrease in the probability of a restatement from 21.3
percent to 20.6 percent (representing a 3 percent decrease), and a decrease in the propensity to meet
or beat analyst forecasts from 7.6 percent to 6.8 percent (representing a 10.5 percent decrease),
Client-Auditor Supply Chain Relationships, Audit Quality, and Audit Pricing 133
Auditing: A Journal of Practice & TheoryNovember 2014

TA
BL
E3
Des
crip
tiv
eS
tati
stic
sa
nd
Co
rrel
ati
on
s
Pa
nel
A:
Des
crip
tiv
eS
tati
stic
s
Va
ria
ble
s
Fu
llS
am
ple
(Ma
x.
n¼
4,5
69
)C
HA
IN_
CIT
Y.
0(M
ax
.n¼
50
9)
CH
AIN
_N
AT
ION
.0
(Ma
x.
n¼
97
9)
CH
AIN
_C
ITY
an
dC
HA
IN_
NA
TIO
N¼
0(M
ax
.n¼
3,0
81
)
Mea
nM
edia
nS
td.
Mea
nM
edia
nS
td.
Mea
nM
edia
nS
td.
Mea
nM
edia
nS
td.
(1)
(2)
(3)
(4)
(5)
(6)
(7)
(8)
(9)
(10
)(1
1)
(12
)
jDA
CC
tj0
.09
70
.03
80
.17
60
.09
0*
0.0
36
0.1
71
0.1
05
0.0
39
0.1
91
0.1
01
0.0
45
0.1
68
RE
STA
TE
t0
.15
80
.00
00
.36
50
.13
8*
*0
.00
0*
*0
.38
30
.15
3*
0.0
00
*0
.38
60
.17
80
.00
00
.34
4
ME
ET
ta0
.12
50
.00
00
.33
10
.11
2*
0.0
00
0.3
18
0.1
18
0.0
00
0.3
23
0.1
40
0.0
00
0.3
47
logA
UD
ITF
EE
t1
3.1
30
13
.15
82
.36
41
3.2
26
13
.22
12
.22
31
3.1
90
13
.17
12
.23
41
3.0
55
12
.83
42
.37
5
AU
DIT
FE
Et
(in
mil
lio
n$
)1
.28
70
.57
32
.05
41
.65
7*
**
0.8
09
**
*2
.43
81
.61
2*
**
0.7
83
**
*2
.33
60
.94
20
.37
41
.63
5
IND
_NA
TIO
Nt
0.2
42
0.0
00
0.4
28
0.2
63
***
0.0
00
**
*0
.44
10
.31
1*
*0
.00
0*
*0
.46
30
.19
30
.00
00
.39
5
IND
_CIT
Yt
0.1
05
0.0
00
0.3
06
0.0
82
0.0
00
**
*0
.27
50
.12
3*
**
0.0
00
**
*0
.32
80
.10
10
.00
00
.30
2
JOIN
T_I
ND
t0
.27
80
.00
00
.44
80
.52
0*
**
1.0
00
**
*0
.50
00
.34
7*
**
0.0
00
**
*0
.47
60
.16
10
.00
00
.36
7
BIG
_4t
0.7
59
1.0
00
0.4
28
0.9
66
***
1.0
00
**
*0
.06
40
.97
7*
**
1.0
00
**
*0
.15
10
.75
31
.00
00
.49
7
TA
CC
t�
0.0
23�
0.0
09
0.2
61�
0.0
22
�0
.00
6*
**
0.2
33�
0.0
04
*�
0.0
03
0.2
06�
0.0
36
�0
.01
30
.29
7
logA
Tt
5.5
21
5.4
88
2.0
82
6.3
60
***
6.3
28
**
*1
.87
26
.03
4*
**
5.9
28
**
*1
.79
14
.94
64
.87
12
.14
1
AT
t(i
n1
,00
0m
illi
on
s$
)1
.65
50
.24
14
.31
62
.60
1*
**
0.5
60
5.1
62
2.0
77
**
0.3
75
5.2
23
1.1
03
0.1
30
3.1
86
CF
Ot
0.0
04
0.0
70
0.3
78
0.0
16
**
0.0
69
**
*0
.27
10
.03
8*
0.0
79
**
*0
.25
5�
0.0
20
0.0
65
0.4
61
STD
_CF
Ot
0.3
36
0.3
81
8.1
78
0.1
01
0.3
11
6.1
75
0.7
76
*0
.41
7*
**
9.3
83
0.1
42
0.3
69
7.9
18
LE
VE
RA
GE
t0
.23
10
.15
60
.27
90
.18
7*
**
0.1
22
**
*0
.22
10
.20
10
.13
30
.24
60
.26
30
.18
30
.30
9
RO
At
�0
.07
00
.02
30
.28
1�
0.0
66
**
0.0
20
**
*0
.23
6�
0.0
34
***
0.0
34
**
*0
.21
6�
0.0
94
0.0
19
0.3
24
LO
SSt
0.4
14
0.0
00
0.4
93
0.4
35
0.0
00
0.4
96
0.3
73
***
0.0
00
**
*0
.48
40
.43
20
.00
00
.49
5
MB
t1
.96
21
.84
15
.48
72
.02
22
.09
95
.52
02
.40
82
.05
24
.77
41
.66
61
.64
55
.86
9
SAL
E_G
RO
WT
Ht
0.0
98
0.0
63
0.3
19
0.0
97
0.0
73
**
*0
.33
60
.11
60
.07
40
.29
70
.08
80
.05
40
.32
7
RD
_RA
TIO
t0
.08
30
.02
10
.10
40
.13
6*
**
0.1
40
0.1
16
0.0
90
***
0.0
36
**
*0
.10
30
.06
20
.00
90
.09
3
LIT
IGA
TIO
Nt
0.0
77
0.0
00
0.2
67
0.0
85
**
0.0
00
0.2
79
0.1
01
0.0
00
0.3
02
0.0
59
0.0
00
0.2
36
AL
TM
AN
t6
.25
23
.84
26
.51
86
.73
0*
4.3
83
**
6.6
57
6.0
63
**
3.7
95
**
5.9
74
6.2
27
3.7
32
6.7
97
AB
N_C
U_l
ogF
EE
t0
.39
60
.41
20
.60
20
.41
3*
0.4
20
**
*0
.57
50
.43
90
.41
80
.59
90
.36
50
.40
50
.60
9
(con
tinu
edo
nn
ext
pa
ge)
134 Johnstone, Li, and Luo
Auditing: A Journal of Practice & TheoryNovember 2014
TA
BL
E3
(co
nti
nu
ed)
Va
ria
ble
s
Fu
llS
am
ple
(Ma
x.
n¼
4,5
69
)C
HA
IN_
CIT
Y.
0(M
ax
.n¼
50
9)
CH
AIN
_N
AT
ION
.0
(Ma
x.
n¼
97
9)
CH
AIN
_C
ITY
an
dC
HA
IN_
NA
TIO
N¼
0(M
ax
.n¼
3,0
81
)
Mea
nM
edia
nS
td.
Mea
nM
edia
nS
td.
Mea
nM
edia
nS
td.
Mea
nM
edia
nS
td.
(1)
(2)
(3)
(4)
(5)
(6)
(7)
(8)
(9)
(10
)(1
1)
(12
)
BU
SY_S
EA
SON
t0
.64
31
.00
00
.47
90
.65
21
.00
00
.47
70
.61
81
.00
00
.48
60
.65
61
.00
00
.47
5
LO
NG
_DE
BT
t0
.18
00
.08
70
.30
00
.15
8*
**
0.0
86
**
*0
.21
80
.17
40
.09
00
.26
70
.19
20
.08
70
.33
9
CU
RR
EN
T_L
IAB
ILIT
Yt
0.0
52
0.0
06
0.1
17
0.0
30
**
*0
.00
3*
*0
.06
60
.03
10
.00
30
.07
00
.07
20
.01
10
.14
5
INV
T_R
AT
IOt
0.1
21
0.0
84
0.1
25
0.0
88
**
*0
.05
8*
**
0.0
99
0.1
11
**
*0
.08
1*
**
0.1
10
0.1
37
0.0
99
0.1
38
MO
DIF
IED
_OP
Nt
0.0
63
0.0
00
0.2
43
0.0
31
**
*0
.00
0*
**
0.1
74
0.0
17
**
0.0
00
**
0.1
30
0.1
01
0.0
00
0.3
02
RE
STR
UC
TU
RE
t0
.02
90
.00
00
.16
80
.03
20
.00
0*
0.1
77
0.0
36
0.0
00
0.1
87
0.0
23
0.0
00
0.1
51
SPE
CIA
L_I
TE
Mt
0.6
86
1.0
00
0.4
64
0.7
17
**
*1
.00
00
.45
10
.72
71
.00
00
.44
50
.65
11
.00
00
.47
7
FO
RE
IGN
t0
.24
00
.00
00
.42
70
.28
6*
**
0.0
00
**
*0
.45
20
.29
60
.00
00
.45
70
.19
10
.00
00
.39
3
NU
M_S
EG
t2
.90
82
.00
02
.54
93
.00
0*
1.0
00
**
*2
.82
23
.05
81
.00
02
.73
12
.78
62
.00
02
.33
2
AU
DIT
OR
_TE
NU
RE
t8
.91
26
.00
08
.35
58
.67
4*
**
7.0
00
**
*7
.12
89
.42
97
.00
08
.57
78
.65
76
.00
08
.54
4
logA
UD
ITO
R_T
EN
UR
Et
1.9
26
1.9
46
0.9
17
1.9
73
**
*2
.07
9*
**
0.8
40
1.9
96
2.0
79
0.8
93
1.8
67
1.9
46
0.9
51
CU
STO
ME
R_I
MP
Tt
0.2
11
0.1
60
0.2
51
0.2
37
**
0.1
60
**
*0
.41
60
.20
1*
**
0.1
60
0.1
39
0.2
09
0.1
50
0.2
36
RE
V_C
YC
LE
_IM
PT
t0
.03
10
.02
00
.04
70
.02
5*
**
0.0
15
**
*0
.04
40
.02
8*
**
0.0
19
**
*0
.02
80
.03
40
.02
20
.05
7
*,**,***
Den
ote
signifi
cant
atth
e10
per
cent,
5per
cent,
and
1per
cent
level
s,re
spec
tivel
y,
bas
edon
two-t
aile
dt-
(z-)
test
stat
isti
csfo
rth
edif
fere
nce
sin
the
mea
ns
(med
ian)
val
ues
bet
wee
nC
HA
IN_C
ITY
.0
and
CH
AIN
_NA
TIO
N.
0in
com
par
ison
wit
hC
HA
IN_C
ITY¼
0an
dC
HA
IN_N
AT
ION¼
0,
resp
ecti
vel
y.
aT
he
num
ber
sof
obse
rvat
ions
for
ME
ET
tfo
rth
efu
llsa
mple
,th
eC
HA
IN_C
ITY¼
1an
dC
HA
IN_N
AT
ION
.0
and
the
CH
AIN
_C
ITY
and
CH
AIN
_N
AT
ION¼
0gro
up
are
2,3
91,
411,
840,
and
1,1
40,
resp
ecti
vel
y.
Var
iable
sar
ew
inso
rize
dat
1per
cent
and
99
per
cent
tore
duce
the
effe
ctof
outl
iers
.S
eeA
ppen
dix
Cfo
rvar
iable
defi
nit
ions.
(con
tinu
edo
nn
ext
pa
ge)
Client-Auditor Supply Chain Relationships, Audit Quality, and Audit Pricing 135
Auditing: A Journal of Practice & TheoryNovember 2014

TA
BL
E3
(co
nti
nu
ed)
Pan
elB
:P
ears
on
/Sp
earm
an
Corr
elati
on
Matr
ix(m
ax.
n¼
2,3
91
)
Va
ria
ble
s(1
)(2
)(3
)(4
)(5
)(6
)(7
)(8
)(9
)
(1)jD
AC
Ctj
0.0
30
.02
�0
.06
�0
.03
0.0
9�
0.0
60
.03
0.0
6
(0.0
7)
(0.2
2)
(,0
.01
)(0
.08
)(0
.13
)(,
0.0
1)
(0.0
7)
(,0
.01
)
(2)
RE
STA
TE
t�
0.0
10
.02
�0
.08
�0
.02
0.1
50
.03
�0
.02
0.0
1
(0.7
8)
(0.2
8)
(,0
.01
)(0
.04
)(0
.42
)(0
.07
)(0
.13
)(0
.16
)
(3)
ME
ET
t�
0.0
10
.02
0.1
4�
0.0
2�
0.0
2�
0.0
3�
0.0
3�
0.0
1
(0.5
1)
(0.2
8)
(,0
.01
)(�
0.0
2)
(0.4
2)
(0.0
7)
(0.1
3)
(0.7
1)
(4)
logA
UD
ITF
EE
t�
0.0
1�
0.0
70
.15
0.0
70
.07
0.0
50
.04
0.2
0
(0.9
0)
(,0
.01
)(,
0.0
1)
(0.0
8)
(,0
.01
)(,
0.0
1)
(0.0
6)
(,0
.01
)
(5)
CH
AIN
_CIT
Yt
�0
.05
�0
.01
�0
.01
0.0
80
.33
�0
.01
�0
.06
0.2
0
(,0
.01
)(0
.04
)(0
.08
)(0
.10
)(,
0.0
1)
(0.6
5)
(,0
.01
)(,
0.0
1)
(6)
CH
AIN
_NA
TIO
Nt
�0
.04
0.0
1�
0.0
20
.08
0.2
50
.05
0.0
80
.15
(0.1
2)
(0.5
9)
(0.3
8)
(,0
.01
)(,
0.0
1)
(,0
.01
)(,
0.0
1)
(,0
.01
)
(7)
IND
_NA
TIO
Nt
�0
.03
0.0
30
.01
0.0
40
.02
0.0
5�
0.2
3�
0.4
0
(0.1
6)
(0.0
7)
(0.4
6)
(0.0
3)
(0.3
0)
(,0
.01
)(,
0.0
1)
(,0
.01
)
(8)
IND
_CIT
Yt
�0
.04
�0
.03
0.0
10
.04
�0
.09
0.0
8�
0.2
3�
0.2
7
(0.0
2)
(0.1
3)
(0.5
7)
(0.0
5)
(,0
.01
)(,
0.0
1)
(,0
.01
)(,
0.0
1)
(9)
JOIN
T_I
ND
t0
.02
�0
.07
0.0
20
.20
0.1
20
.15
�0
.40
�0
.27
(0.5
1)
(0.7
1)
(0.3
9)
(,0
.01
)(,
0.0
1)
(,0
.01
)(,
0.0
1)
(,0
.01
)
Tw
o-t
aile
dp-v
alues
for
the
Pea
rson
(Spea
rman
)co
rrel
atio
nar
epre
sente
din
par
enth
eses
.T
he
sam
ple
for
this
table
isth
atuse
dto
test
ME
ET
asth
epro
xy
for
audit
qual
ity.
See
Appen
dix
Cfo
rvar
iable
defi
nit
ions.
136 Johnstone, Li, and Luo
Auditing: A Journal of Practice & TheoryNovember 2014
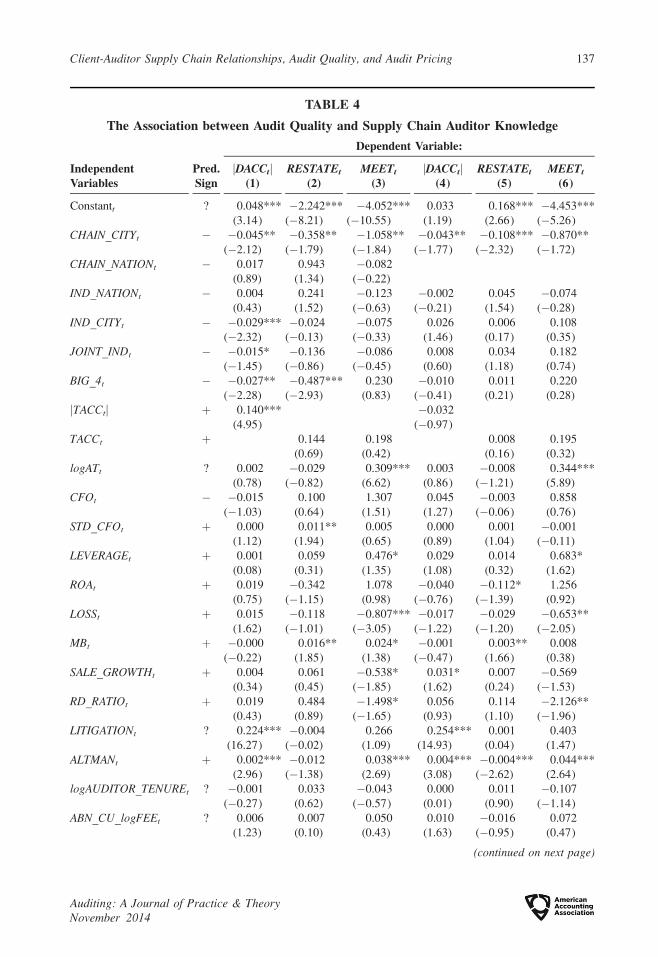
TABLE 4
The Association between Audit Quality and Supply Chain Auditor Knowledge
IndependentVariables
Pred.Sign
Dependent Variable:
jDACCtj(1)
RESTATEt
(2)MEETt
(3)jDACCtj
(4)RESTATEt
(5)MEETt
(6)
Constantt ? 0.048*** �2.242*** �4.052*** 0.033 0.168*** �4.453***
(3.14) (�8.21) (�10.55) (1.19) (2.66) (�5.26)
CHAIN_CITYt � �0.045** �0.358** �1.058** �0.043** �0.108*** �0.870**
(�2.12) (�1.79) (�1.84) (�1.77) (�2.32) (�1.72)
CHAIN_NATIONt � 0.017 0.943 �0.082
(0.89) (1.34) (�0.22)
IND_NATIONt � 0.004 0.241 �0.123 �0.002 0.045 �0.074
(0.43) (1.52) (�0.63) (�0.21) (1.54) (�0.28)
IND_CITYt � �0.029*** �0.024 �0.075 0.026 0.006 0.108
(�2.32) (�0.13) (�0.33) (1.46) (0.17) (0.35)
JOINT_INDt � �0.015* �0.136 �0.086 0.008 0.034 0.182
(�1.45) (�0.86) (�0.45) (0.60) (1.18) (0.74)
BIG_4t � �0.027** �0.487*** 0.230 �0.010 0.011 0.220
(�2.28) (�2.93) (0.83) (�0.41) (0.21) (0.28)
jTACCtj þ 0.140*** �0.032
(4.95) (�0.97)
TACCt þ 0.144 0.198 0.008 0.195
(0.69) (0.42) (0.16) (0.32)
logATt ? 0.002 �0.029 0.309*** 0.003 �0.008 0.344***
(0.78) (�0.82) (6.62) (0.86) (�1.21) (5.89)
CFOt � �0.015 0.100 1.307 0.045 �0.003 0.858
(�1.03) (0.64) (1.51) (1.27) (�0.06) (0.76)
STD_CFOt þ 0.000 0.011** 0.005 0.000 0.001 �0.001
(1.12) (1.94) (0.65) (0.89) (1.04) (�0.11)
LEVERAGEt þ 0.001 0.059 0.476* 0.029 0.014 0.683*
(0.08) (0.31) (1.35) (1.08) (0.32) (1.62)
ROAt þ 0.019 �0.342 1.078 �0.040 �0.112* 1.256
(0.75) (�1.15) (0.98) (�0.76) (�1.39) (0.92)
LOSSt þ 0.015 �0.118 �0.807*** �0.017 �0.029 �0.653**
(1.62) (�1.01) (�3.05) (�1.22) (�1.20) (�2.05)
MBt þ �0.000 0.016** 0.024* �0.001 0.003** 0.008
(�0.22) (1.85) (1.38) (�0.47) (1.66) (0.38)
SALE_GROWTHt þ 0.004 0.061 �0.538* 0.031* 0.007 �0.569
(0.34) (0.45) (�1.85) (1.62) (0.24) (�1.53)
RD_RATIOt þ 0.019 0.484 �1.498* 0.056 0.114 �2.126**
(0.43) (0.89) (�1.65) (0.93) (1.10) (�1.96)
LITIGATIONt ? 0.224*** �0.004 0.266 0.254*** 0.001 0.403
(16.27) (�0.02) (1.09) (14.93) (0.04) (1.47)
ALTMANt þ 0.002*** �0.012 0.038*** 0.004*** �0.004*** 0.044***
(2.96) (�1.38) (2.69) (3.08) (�2.62) (2.64)
logAUDITOR_TENUREt ? �0.001 0.033 �0.043 0.000 0.011 �0.107
(�0.27) (0.62) (�0.57) (0.01) (0.90) (�1.14)
ABN_CU_logFEEt ? 0.006 0.007 0.050 0.010 �0.016 0.072
(1.23) (0.10) (0.43) (1.63) (�0.95) (0.47)
(continued on next page)
Client-Auditor Supply Chain Relationships, Audit Quality, and Audit Pricing 137
Auditing: A Journal of Practice & TheoryNovember 2014

when CHAIN_CITY increases by one standard deviation over its sample mean, holding all other
variables at their sample mean values.11
In contrast to the results for the association between CHAIN_CITY and audit quality, the
coefficients on CHAIN_NATION in the models of audit quality using jDACCj, RESTATE, and
MEET are not significant. This suggests that when the supplier and major customer’s audits are
conducted by different auditor offices, the audit quality benefits of auditing both the supplier and
the major customer are lost. These results are consistent with our expectation that the effects of
supply chain auditing are most pronounced at the city level.
To directly compare audit quality for supplier companies with auditors who have city- versus
national-level supply chain knowledge (H1c), we focus on the subsample of companies with supply
chain auditor knowledge (i.e., those in which CHAIN_CITY . 0 or CHAIN_NATION . 0) and
exclude those in which CHAIN_CITY ¼ 0 and CHAIN_NATION ¼ 0. Table 4, Columns (4)–(6)
present results of these tests. The results support H1c and show that CHAIN_CITY is negatively
associated with levels of absolute discretionary accruals (p¼ 0.039), the likelihood of a restatement
(p¼ 0.010), and the likelihood of meeting or just beating analysts’ forecasts for supplier companies
(p ¼ 0.045). Control variables, when significant, are generally consistent with predicted signs.
Table 5 presents analyses that examine the research question regarding the association between
auditor supply chain knowledge and audit fees. The results in Column (1) show that CHAIN_CITY
is negatively and marginally significantly associated with logAUDITFEE (p¼ 0.08). Economically,
this implies a 1.9 percent decrease in audit fees for a one standard deviation increase of
TABLE 4 (continued)
IndependentVariables
Pred.Sign
Dependent Variable:
jDACCtj(1)
RESTATEt
(2)MEETt
(3)jDACCtj
(4)RESTATEt
(5)MEETt
(6)
Include industry
and year
dummy
Yes Yes Yes Yes Yes Yes
Clustered by
company
Yes Yes Yes Yes Yes Yes
Observations 4,569 4,569 2,391 1,488 1,488 1,251
Model p-value , 0.001 0.02 , 0.001 , 0.001 , 0.001 , 0.001
Adjusted (Pseudo)
R20.21 0.05 0.12 0.27 0.07 0.123
*, **, *** Denote significant at 10 percent, 5 percent, and 1 percent, respectively, based on a one-tailed test for variableswith a directional expectation and two-tailed for variables with no directional expectation.All variables are winsorized at 1 percent and 99 percent to reduce the effect of outliers.One-tailed (two-tailed) t- (z-) test statistics are reported in parentheses for signed (unsigned) predictions.We include industry and year fixed effects, and the standard errors are adjusted based on firm-level clustering.The sample used for the regression models in Columns (4)–(6) excludes the supplier companies in which CHAIN_CITY¼ 0 and CHAIN_NATION ¼ 0.See Appendix C for variable definitions.
11 The probability is calculated based on ebX 0
/(1þ ebX 0
) when we increase each independent variable by one standarddeviation over the sample mean, holding all other variables at their mean values. For example, the coefficient onCHAIN_CITY is �0.358, its mean is 0.037, and it has a standard deviation of 0.113. We calculate the changes inebX 0
/(1þ ebX 0
) when CHAIN_CITY is at the 0.037 level versus at the 0.037þ 0.113¼ 0.15 level, while holding allother variables at their sample mean value.
138 Johnstone, Li, and Luo
Auditing: A Journal of Practice & TheoryNovember 2014

TABLE 5
The Association between Audit Pricing and Supply Chain Auditor Knowledge
Independent VariablesPredicted
Sign
Dependent Variable: logAUDITFEEt
(1) (2)
Constantt ? 9.489*** 9.538***
(184.37) (98.98)
CHAIN_CITYt ? �0.171* �0.155*
(�1.75) (�1.74)
CHAIN_NATIONt ? 0.187
(1.64)
IND_NATIONt þ 0.033 0.074**
(0.96) (1.80)
IND_CITYt þ 0.169*** 0.185***
(4.13) (3.45)
JOINT_INDt þ 0.106*** 0.216***
(3.08) (5.40)
BIG_4t þ 0.041 0.098
(1.08) (1.25)
BUSY_SEASONt þ 0.117*** 0.145***
(4.96) (4.89)
logATt þ 0.496*** 0.467***
(63.30) (48.35)
LONG_DEBTt þ �0.030 �0.059
(�0.79) (�1.03)
CURRENT_LIABILITYt þ �0.016 0.502***
(�0.15) (2.40)
INVT_RATIOt þ 0.240*** 0.602***
(2.48) (4.23)
MODIFIED_OPNt þ 0.114** �0.159*
(2.10) (�1.70)
ROAt � �0.381*** �0.459***
(�6.56) (�5.21)
LOSSt þ 0.075*** 0.074**
(2.57) (1.91)
STD_CFOt þ 0.001 0.003**
(0.49) (2.02)
SALE_GROWTHt þ 0.011 �0.075*
(0.32) (�1.66)
RESTRUCTUREt þ 0.145** 0.243***
(2.26) (3.25)
SPECIAL_ITEMt þ 0.144*** 0.138***
(5.68) (4.26)
FOREIGNt þ 0.229*** 0.180***
(8.49) (5.72)
NUM_SEGt þ 0.109*** 0.048***
(22.59) (6.91)
RD_RATIOt þ 0.274** �0.209
(2.10) (�1.30)
logAUDITOR_TENUREt þ 0.096*** 0.083***
(7.76) (5.02)
(continued on next page)
Client-Auditor Supply Chain Relationships, Audit Quality, and Audit Pricing 139
Auditing: A Journal of Practice & TheoryNovember 2014

CHAIN_CITY over the mean.12 In contrast, the coefficient on CHAIN_NATION is not statistically
significant. We also examine the association between audit fees and auditor supply chain
knowledge at the city level versus the national level by excluding suppliers audited by auditors
without supply chain knowledge. The results in column (2) show that CHAIN_CITY remains
marginally negative (p ¼ 0.08). Taken together, the results in Tables 4 and 5 suggest that the
synergy gained by auditors with supply chain knowledge at the city level not only improves the
effectiveness of auditing (in terms of higher audit quality), but also improves the efficiency of
auditing (in terms of marginally lower audit fees). These results are interesting in the sense that they
imply that auditors are willing to share the efficiency gain from their supply chain knowledge with
their clients via a fee reduction. This result is in contrast with the fee premium on auditors’ industry
specialization, as shown by the positive and significant coefficients on IND_CITY (p , 0.01) and
JOINT_IND (p , 0.01), which are consistent with Francis et al. (2005). Other variables, when
significant, are generally consistent with predicted signs.13
TABLE 5 (continued)
Independent VariablesPredicted
Sign
Dependent Variable: logAUDITFEEt
(1) (2)
ABN_CU_logFEEt þ 0.063*** 0.052**
(3.44) (2.20)
Include industry and
year dummy
Yes Yes
Clustered by company Yes Yes
Observations 4,569 1,488
Adjusted R2 0.75 0.76
*, **, *** Denote significant at 10 percent, 5 percent, and 1 percent, respectively, based on a one-tailed test for variableswith a directional expectation and two-tailed for variables with no directional expectation.All variables are winsorized at 1 percent and 99 percent to reduce the effect of outliers.One-tailed (two-tailed) t- (z-) test statistics are reported in parentheses for signed (unsigned) predictions.We include industry and year fixed effects, and the standard errors are adjusted based on firm-level clustering.The sample used for the regression models in Column (2) excludes the supplier companies in which CHAIN_CITY¼ 0and CHAIN_NATION ¼ 0.See Appendix C for variable definitions.
12 As the dependent variable is the natural log of the audit fee, the fee discount is calculated as a one standard deviation changeof the independent variable on the percentage change of the dependent variable, which is (e(0.171) 3 0.112 (the standard deviation)
� 1)¼ 1.9 percent.13 Regarding the lack of significance on logAUDITOR_TENURE in Table 4, we note that insignificant results for auditor
tenure in audit quality models do exist in the literature (e.g., J. Myers, L. Myers, and Omer 2003). We also exploredwhether there is an interaction between auditor tenure (logAUDITOR_TENURE) and the measures of auditor supplychain knowledge or industry specialization at the city level or the national level. Untabulated results show that themain effects on audit fees, presented in Table 5, for these variables remain essentially the same and there exists apositive association between the interaction of auditor tenure and auditors’ supply chain knowledge at the city level (p, 0.01), and the interaction of auditor tenure with industry specialization at the city level and at the joint industryspecialization level (p , 0.01 and p¼ 0.03, respectively). These results imply that the initial fee discount associatedwith supply chain knowledge is lower for long-tenured engagements, and that the initial pricing premium associatedwith industry specialization is higher for long-tenured engagements.
140 Johnstone, Li, and Luo
Auditing: A Journal of Practice & TheoryNovember 2014

Supplier Reliance and Revenue Cycle Account Importance
Supplier Reliance
We next examine whether the associations between auditor supply chain knowledge and both
audit quality and audit fees differ depending on the extent of the supplier’s sales dependence on the
major customer (H2a and H2b). We measure a supplier company’s sales dependence on the major
customer based on the total amount of sales made to a major customer company, divided by the
total amount of sales for the supplier company in the year. Observations with a value of this
variable greater than the median value are classified in the CUSTOMER_IMPT . Median group
and those with a value of this variable less than or equal to the median value are classified in the
CUSTOMER_IMPT � Median group. Tables 6 and 7 report audit quality and audit fee results,
respectively.14
Supporting H2a in terms of the association between city-level auditor supply chain knowledge
and audit quality, Table 6 shows that for the subsample of companies with CUSTOMER_IMPT .
Median, supplier companies that employ an auditor with supply chain knowledge at the city level
have lower levels of absolute discretionary accruals (p , 0.01), a lower likelihood of a restatement
(p ¼ 0.045), and a lower likelihood of meeting or just beating analysts’ forecasts for supplier
companies (p , 0.01). In contrast, for the subsample of companies with CUSTOMER_IMPT �Median, the association between auditor supply chain knowledge and audit quality is not
statistically significant. Supporting H2b in terms of the association between city-level auditor
supply chain knowledge and audit fees, Table 7 shows that for the subsample of companies for
which CUSTOMER_IMPT . Median, auditor supply chain knowledge at the city level is
associated with lower audit fees (p , 0.01), whereas this association is statistically insignificant
when CUSTOMER_IMPT � Median.
Supplier Revenue Cycle Importance
We also examine whether the associations between auditor supply chain knowledge and both
audit quality and audit fees differ depending on whether the supplier company has a particularly
high level of accounts receivable balances in the revenue cycle. As we cannot directly calculate the
amount of accounts receivable that is attributable to a specific customer, we approximate the
magnitude of the supplier company’s accounts receivable account for a particular major customer
(REV_CYCLE_IMPT) by multiplying the ratio of the supplier’s accounts receivable divided by its
total assets, weighted by the percentage of sales that the supplier company makes to the major
customer. For observations in which the variable value is greater than the median value in the
sample, we classify companies as REV_CYCLE_IMPT . Median, otherwise as REV_CY-CLE_IMPT � Median.
Tables 8 and 9 report audit quality and audit fee results, respectively. Supporting H2a in terms
of the association between city-level auditor supply chain knowledge and audit quality, the results
in Table 8 show that for the subsample of companies for which REV_CYCLE_IMPT . Median,auditors’ supply chain knowledge at the city level is associated with lower levels of absolute
discretionary accruals (p ¼ 0.01), a lower likelihood of a restatement (p ¼ 0.04), and a lower
likelihood of meeting or just beating analysts’ forecasts (p¼ 0.045). In contrast, the coefficients on
CHAIN_CITY for the subsample of companies for which REV_CYCLE_IMPT � Median are
statistically insignificant. Supporting H2b in terms of the association between city-level auditor
14 As a sensitivity test, we partitioned the sample using only the top and the bottom quartile and re-estimated the auditquality and audit pricing models. The results remain essentially the same, indicating that the results we report in thetext are not sensitive to the choice of using the median threshold.
Client-Auditor Supply Chain Relationships, Audit Quality, and Audit Pricing 141
Auditing: A Journal of Practice & TheoryNovember 2014

TA
BL
E6
Th
eIm
po
rta
nce
of
Ma
jor
Cu
sto
mer
so
nth
eA
sso
cia
tio
nb
etw
een
Au
dit
Qu
ali
tya
nd
Su
pp
lyC
ha
inA
ud
ito
rK
no
wle
dg
e
Ind
epen
den
tV
ari
ab
les
Pre
d.
Sig
n
Dep
end
ent
Va
ria
ble
:
jDA
CC
tjR
ES
TA
TE
tM
EE
Tt
jDA
CC
tjR
ES
TA
TE
tM
EE
Tt
CU
ST
OM
ER
_IM
PT
.M
edia
nC
US
TO
ME
R_
IMP
T�
Med
ian
Co
nst
ant t
?0
.10
3*
**
43
3.5
01*
**
�5
.11
1*
**
0.0
54
***
45
0.3
11
**
*�
3.2
40
***
(6.1
3)
(7.3
3)
(�8
.65
)(3
.17
)(7
.15
)(�
5.4
4)
CH
AIN
_CIT
Yt
��
0.0
76
**
*�
1.1
08
**
�2
.23
3*
**
�0
.07
0�
0.7
28
�0
.73
4
(�2
.94
)(�
1.6
8)
(�2
.60
)(�
1.3
0)
(�1
.27
)(�
0.9
1)
CH
AIN
_NA
TIO
Nt
�0
.01
90
.59
20
.03
70
.04
31
.12
1�
0.1
10
(1.5
3)
(1.6
0)
(0.0
7)
(0.8
2)
(0.8
6)
(�0
.16
)
IND
_NA
TIO
Nt
��
0.0
09
�0
.44
5*
*�
0.2
04
0.0
14
0.0
86
�0
.21
5
(�0
.61
)(�
2.2
1)
(�0
.78
)(1
.08
)(0
.37
)(�
0.6
5)
IND
_CIT
Yt
��
0.0
12
�0
.08
6�
0.0
18
0.0
41
0.0
84
�0
.06
3
(�0
.58
)(�
0.3
0)
(�0
.06
)(1
.63
)(0
.34
)(�
0.1
9)
JOIN
T_I
ND
t�
�0
.00
6*
*�
0.1
65
�0
.43
7*
*�
0.0
18
**
�0
.13
1�
0.1
76
(�1
.72
)(�
0.7
9)
(�1
.65
)(�
1.8
5)
(�0
.59
)(�
0.5
6)
BIG
_4t
��
0.0
21
�0
.79
7*
**
0.6
78
�0
.02
4*
�0
.16
8�
0.0
93
(�1
.21
)(�
3.5
1)
(1.6
3)
(�1
.43
)(�
0.7
0)
(�0
.27
)
jTA
CC
tjþ
0.0
47
*0
.19
0*
**
(1.5
1)
(4.0
2)
TA
CC
tþ
�0
.32
9�
0.3
27
0.4
29
0.6
21
(�1
.00
)(�
0.5
5)
(1.5
8)
(1.0
9)
logA
Tt
?�
0.0
01
0.0
28
0.3
55
**
*0
.00
1�
0.0
94
*0
.28
2*
**
(�0
.20
)(0
.65
)(5
.43
)(0
.24
)(�
1.9
3)
(3.4
5)
CF
Ot
��
0.0
56
**
*0
.12
8�
1.9
52
**
�0
.00
10
.15
50
.18
9
(�2
.93
)(0
.47
)(�
1.6
9)
(�0
.09
)(0
.76
)(0
.15
)
STD
_CF
Ot
þ0
.00
0�
0.0
02
0.0
21
**
�0
.00
00
.02
0*
**
�0
.00
8
(1.0
9)
(�0
.25
)(1
.99
)(�
0.1
9)
(3.2
7)
(�0
.76
)
LE
VE
RA
GE
tþ
0.0
21
�0
.04
91
.01
5*
**
0.0
11
0.1
00
0.1
00
(0.5
4)
(�0
18
)(2
.72
)(0
.57
)(0
.38
)(0
.17
)
(con
tinu
edo
nn
ext
pa
ge)
142 Johnstone, Li, and Luo
Auditing: A Journal of Practice & TheoryNovember 2014

TA
BL
E6
(co
nti
nu
ed)
Ind
epen
den
tV
ari
ab
les
Pre
d.
Sig
n
Dep
end
ent
Va
ria
ble
:
jDA
CC
tjR
ES
TA
TE
tM
EE
Tt
jDA
CC
tjR
ES
TA
TE
tM
EE
Tt
CU
ST
OM
ER
_IM
PT
.M
edia
nC
US
TO
ME
R_
IMP
T�
Med
ian
RO
At
þ0
.03
90
.13
30
.45
00
.02
4�
0.7
74
**
1.5
48
(0.9
9)
(0.2
7)
(0.3
0)
(1.0
9)
(�2
.00
)(1
.19
)
LO
SSt
þ0
.01
20
.00
9�
1.0
51
***
0.0
16
**
�0
.24
2�
0.6
02
*
(1.3
0)
(0.0
5)
(�2
.74
)(2
.02
)(�
1.4
6)
(�1
.69
)
MB
tþ
�0
.00
10
.02
9*
**
0.0
33
**
0.0
00
0.0
03
0.0
22
(�0
.58
)(2
.38
)(1
.79
)(0
.02
)(0
.32
)(0
.83
)
SAL
E_G
RO
WT
Ht
þ0
.01
80
.05
3�
0.7
94
*0
.02
0�
0.0
19
�0
.41
0
(0.9
5)
(0.2
4)
(�1
.83
)(0
.93
)(�
0.1
1)
(�0
.91
)
RD
_RA
TIO
tþ
0.0
35
0.8
81
�0
.02
2�
0.0
71
0.4
35
�1
.99
1*
**
(0.4
5)
(1.1
4)
(�1
.59
)(�
0.8
6)
(0.5
8)
(�2
.60
)
LIT
IGA
TIO
Nt
�0
.24
6*
*�
0.0
82
�0
.09
10
.20
6*
*0
.21
80
.52
6*
(2.0
7)
(�0
.29
)(�
0.2
2)
(1.9
8)
(0.8
4)
(1.8
1)
AL
TM
AN
tþ
0.0
02
�0
.00
60
.05
0*
**
0.0
04
**
*�
0.0
26
**
0.0
26
*
(1.0
6)
(�0
.51
)(2
.60
)(3
.27
)(�
2.0
9)
(1.5
8)
logA
UD
ITO
R_T
EN
UR
Et
?�
0.0
06
0.0
06
�0
.00
10
.00
40
.04
1�
0.1
48
(�1
.33
)(0
.09
)(�
0.0
1)
(0.8
4)
(0.5
4)
(�1
.23
)
AB
N_C
U_l
ogF
EE
t?
0.0
02
0.1
65
0.1
00
�0
.00
0�
0.1
87
*�
0.0
38
(0.1
8)
(1.6
4)
(0.6
4)
(�0
.04
)(�
1.7
7)
(�0
.22
)
Incl
ud
ein
du
stry
and
yea
rd
um
my
Yes
Yes
Yes
Yes
Yes
Yes
Clu
ster
edb
yco
mp
any
Yes
Yes
Yes
Yes
Yes
Yes
Ob
serv
atio
ns
2,2
70
2,2
70
1,2
15
2,2
99
2,2
99
1,1
76
Mo
del
p-v
alu
e,
0.0
01
,0
.00
1,
0.0
01
,0
.00
1,
0.0
01
,0
.00
1
Ad
just
ed(P
seu
do
)R
20
.13
0.0
50
.14
0.1
10
.06
0.1
1
(con
tinu
edo
nn
ext
pa
ge)
Client-Auditor Supply Chain Relationships, Audit Quality, and Audit Pricing 143
Auditing: A Journal of Practice & TheoryNovember 2014

TA
BL
E6
(co
nti
nu
ed)
*,
**,
***
Den
ote
signifi
cant
at10
per
cent,
5per
cent,
and
1per
cent,
resp
ecti
vel
y,
bas
edon
aone-
tail
edte
stfo
rvar
iable
sw
ith
adir
ecti
onal
expec
tati
on
and
two-t
aile
dfo
rvar
iable
sw
ith
no
dir
ecti
onal
expec
tati
on.
One-
tail
ed(t
wo-t
aile
d)
t-(z
-)te
stst
atis
tics
are
report
edin
par
enth
eses
for
signed
(unsi
gned
)pre
dic
tions.
All
var
iable
sar
ew
inso
rize
dat
1per
cent
and
99
per
cent
tore
duce
the
effe
ctof
outl
iers
.W
ein
clude
indust
ryan
dyea
rfi
xed
effe
cts,
and
the
stan
dar
der
rors
are
adju
sted
bas
edon
firm
-lev
elcl
ust
erin
g.
The
sam
ple
use
dfo
rth
ere
gre
ssio
nm
odel
sin
Colu
mns
(4)–
(6)
excl
udes
the
suppli
erco
mpan
ies
inw
hic
hC
HA
IN_C
ITY¼
0an
dC
HA
IN_N
AT
ION¼
0.
See
Appen
dix
Cfo
rvar
iable
defi
nit
ions.
144 Johnstone, Li, and Luo
Auditing: A Journal of Practice & TheoryNovember 2014

TABLE 7
The Importance of Major Customers on the Association between Audit Pricing and SupplyChain Auditor Knowledge
Independent VariablesPred.Sign
Dependent Variable: logAUDITFEEt
CUSTOMER_IMPT. Median
CUSTOMER_IMPT� Median
Constantt ? 9.432*** 9.627***
(63.30) (58.01)
CHAIN_CITYt ? �0.504*** 0.226
(�3.04) (1.24)
CHAIN_NATIONt ? 0.296* 0.090
(1.95) (0.77)
IND_NATIONt þ 0.023 0.042
(0.42) (0.65)
IND_CITYt þ 0.176*** 0.166***
(3.15) (3.06)
JOINT_INDt þ 0.125*** 0.071*
(2.45) (1.35)
BIG_4t þ �0.036 0.169**
(�0.39) (2.20)
BUSY_SEASONt þ 0.102** 0.105*
(1.68) (1.46)
logATt þ 0.502*** 0.482***
(26.14) (23.03)
LONG_DEBTt þ 0.050 �0.063
(0.68) (�1.00)
CURRENT_LIABILITYt þ 0.052 �0.039
(0.27) (�0.24)
INVT_RATIOt þ 0.402*** 0.094
(2.86) (0.50)
MODIFIED_OPNt þ 0.085 0.139**
(1.08) (1.91)
ROAt � �0.454*** �0.367***
(�5.85) (�4.32)
LOSSt þ 0.083** 0.049
(2.27) (1.20)
STD_CFOt þ 0.001 0.001
(0.38) (0.54)
SALE_GROWTHt þ 0.032 0.024
(0.49) (0.28)
RESTRUCTUREt þ 0.169* 0.150**
(1.37) (1.89)
SPECIAL_ITEMt þ 0.177*** 0.103***
(3.56) (2.94)
FOREIGNt þ 0.209*** 0.242***
(3.94) (4.45)
NUM_SEGt þ 0.105*** 0.105***
(5.02) (4.36)
RD_RATIOt þ 0.488** 0.107
(2.35) (0.35)
(continued on next page)
Client-Auditor Supply Chain Relationships, Audit Quality, and Audit Pricing 145
Auditing: A Journal of Practice & TheoryNovember 2014

supply chain knowledge and audit fees, the results in Table 9 show that for the subsample of
companies for which REV_CYCLE_IMPT . Median, auditor supply chain knowledge at the city
level is associated with lower audit fees (p ¼ 0.027), whereas such an association is statistically
insignificant when REV_CYCLE_IMPT � Median.
Additional Analyses
Self-Selection of Auditor Choice
The empirical analyses are subject to two self-selection issues. The first is due to the fact that
the analyses focus on a subset of potential audit clients, i.e., those supplier companies that report
having a major customer relationship. A substantial number of companies that do not have major
customer relationships are necessarily excluded from the sample. Supplier companies might
demand higher audit quality to reduce the potential agency/information costs associated with their
supply chain relationships relative to other companies that do not have such relationships. To
address this self-selection bias, we conduct a Heckman two-stage model by using the general
population from the intersection of Audit Analytics and Compustat from 2003–2010. In the first-
stage model, we predict the likelihood that a company will have a major customer relationship on a
combination of company-level and industry-level characteristics.15 We then include the inverse
Mills ratio generated from the probit regression model as the first stage in the second-stage models
examining the association between auditor supply chain knowledge and both audit quality and fees.
TABLE 7 (continued)
Independent VariablesPred.Sign
Dependent Variable: logAUDITFEEt
CUSTOMER_IMPT. Median
CUSTOMER_IMPT� Median
logAUDITOR_TENUREt þ 0.108*** 0.075**
(3.43) (1.82)
ABN_CU_logFEEt þ 0.068** 0.058
(2.14) (1.00)
Include industry and year dummy Yes Yes
Clustered by company Yes Yes
Observations 2,305 2,264
Adjusted R2 0.769 0.740
*, **, *** Denote significant at 10 percent, 5 percent, and 1 percent, respectively, based on a one-tailed test for variableswith a directional expectation and two-tailed for variables with no directional expectation.One-tailed (two-tailed) t- (z-) test statistics are reported in parentheses for signed (unsigned) predictions.All variables are winsorized at 1 percent and 99 percent to reduce the effect of outliers.We include industry and year fixed effects, and the standard errors are adjusted based on firm-level clustering.See Appendix C for variable definitions.
15 Untabulated results of the first-stage model show that the likelihood of having a major customer relationship ispositively associated with suppliers’ industry-level operational risk and expansion (proxied by industry-levelmeasures of intangibles, research and development expenses, growth, and product market competition), and isnegatively associated with industry-level financial risk (as proxied by industry-level measures of leverage andbankruptcy likelihood). At an individual company level, the likelihood of having a major customer relationship ispositively associated with suppliers’ size, inventory levels, research and development expenses, and presence in themanufacturing and electronics industries, and is negatively associated with ratios of market-to-book and accountspayables. The industry-level characteristics variables serve as the instrumental variables in the Heckman two-stageselection model.
146 Johnstone, Li, and Luo
Auditing: A Journal of Practice & TheoryNovember 2014

TABLE 8
The Importance of Accounts Receivable for the Supplier Company on the Associationbetween Audit Quality and Supply Chain Auditor Knowledge
IndependentVariables
Pred.Sign
Dependent Variable:
jDACCtj RESTATEt MEETt jDACCtj RESTATEt MEETt
REV_CYCLE_IMPT . Median REV_CYCLE_IMPT � Median
Constantt ? 19.20 348.774* �6.166*** 13.03 555.737*** �3.002***
(1.34) (6.49) (�8.95) (1.05) (7.92) (�5.88)
CHAIN_CITYt � �0.093** �0.750** �1.912** �0.035 �0.142 0.000
(�2.30) (�1.73) (�1.70) (�0.93) (�0.18) (0.23)
CHAIN_NATIONt � 0.057 1.092 �0.461 0.016 �0.444 0.255
(1.17) (1.33) (�0.69) (0.47) (�1.20) (0.45)
IND_NATIONt � �0.018 �0.181 �0.268 �0.016* 0.320 �0.014
(�0.78) (�1.02) (�0.89) (�1.87) (1.44) (�0.05)
IND_CITYt � �0.035* �0.051 �0.343 �0.019** �0.041 0.136
(�1.37) (�0.23) (�0.96) (�1.98) (�0.16) (0.45)
JOINT_INDt � �0.002 0.228 �0.713*** �0.022** �0.012 �0.468**
(�0.09) (1.25) (�2.49) (�2.17) (�0.06) (�1.65)
BIG_4t � �0.027* �0.468*** 0.697 �0.027** �0.451** �0.066
(�1.53) (�2.47) (1.46) (�1.86) (�1.80) (�0.20)
jTACCtj þ 0.161*** 0.108***
(5.09) (3.01)
TACCt þ 0.174 �0.697 0.317 1.480***
(0.54) (�1.19) (1.10) (2.37)
logATt ? 0.004 �0.039 0.459*** �0.001 0.017 0.233***
(1.02) (�1.00) (5.67) (�0.39) (0.30) (3.30)
CFOt � �0.014 �0.088 0.757 �0.026* 0.407 2.438**
(�0.90) (�0.36) (0.69) (�1.61) (1.21) (2.01)
STD_CFOt þ �0.000 0.012** 0.035*** 0.000 �0.003 �0.010
(�0.45) (2.21) (3.21) (0.64) (�0.26) (�1.24)
LEVERAGEt þ 0.034 0.401** 1.140*** �0.025* �0.366 0.195
(1.22) (1.87) (2.53) (�1.67) (�1.38) (0.39)
ROAt þ 0.032 �0.163 2.092 0.023 �0.846** �1.149
(0.81) (�0.35) (1.29) (0.66) (�1.99) (�0.77)
LOSSt þ 0.004 �0.235 �0.765* 0.023* 0.058 �1.050***
(0.31) (�1.52) (�1.82) (1.57) (0.31) (�2.81)
MBt þ 0.001 0.017* 0.044** �0.002** 0.013 0.001
(1.14) (1.44) (2.29) (�2.34) (1.10) (0.05)
SALE_GROWTHt þ �0.006 �0.015 �0.419 0.042** 0.016 �0.857*
(�0.27) (�0.07) (�1.08) (2.30) (0.09) (�1.77)
RD_RATIOt þ 0.145* �0.043 �0.041*** �0.222*** 1.468** �1.359*
(1.50) (�0.05) (�3.26) (�3.95) (1.93) (�1.67)
LITIGATIONt � 0.228* �0.227 0.250 0.227** 0.243 0.189
(1.85) (�1.00) (0.68) (2.18) (1.08) (0.61)
ALTMANt þ 0.002** �0.017 0.060*** 0.005** �0.016 0.028*
(1.74) (�1.43) (3.09) (1.71) (�1.32) (1.58)
logAUDITOR_TENUREt ? 0.001 �0.059 0.096 0.001 0.171** �0.238**
(0.17) (�1.00) (0.75) (0.20) (2.07) (�2.37)
(continued on next page)
Client-Auditor Supply Chain Relationships, Audit Quality, and Audit Pricing 147
Auditing: A Journal of Practice & TheoryNovember 2014

Untabulated results show that after controlling for the self-selection of companies that have a major
customer relationship, the results for hypotheses and the research question remain unchanged.
The second concern regarding self-selection arises from suppliers’ choice to employ an auditor
with supply chain knowledge versus an auditor without supply chain knowledge. To address this
concern, we conduct another Heckman two-stage model. We use the same sample as in the first
self-selection test described previously, but model companies’ choice to employ an auditor with
supply chain knowledge at the city level as the first stage. The independent variables include
auditors’ industry specialization (IND_NATION, IND_CITY, JOINT_IND) and company
characteristics, including asset turnover (ASSET_TURNOVER), company size (logAT), current
liability (CURRENT_LIABILITY), noncurrent debt outstanding (LONG_DEBT), and profitability
(ROA and LOSS).16 We then include the inverse Mills ratio generated from this probit regression
model in the second-stage models examining the association between auditor supply chain
knowledge and both audit quality and fees. The untabulated results show that after controlling for
the self-selection of companies that choose to employ an auditor with supply chain knowledge, the
results for hypotheses and the research question remain unchanged.
Change in Supply Chain Knowledge and Change in Audit Quality and Audit Fees
Supplier companies audited by auditors with supply chain knowledge may have some innate
characteristics that are associated with audit quality and audit fees, and those characteristics may not
be controlled in our regression models, which may cause omitted variable problems. We conduct a
change analysis to address this concern. Our main variable of interest, change in city-level supply
chain knowledge, DCHAIN_CITY, can be driven by (1) supplier companies changing their auditors,
or (2) customer companies changing their auditors. To isolate the change in our variable of interest,
DCHAIN_CITY, which results from supplier companies switching to an auditor that has already
TABLE 8 (continued)
IndependentVariables
Pred.Sign
Dependent Variable:
jDACCtj RESTATEt MEETt jDACCtj RESTATEt MEETt
REV_CYCLE_IMPT . Median REV_CYCLE_IMPT � Median
ABN_CU_logFEEt ? �0.004 �0.014 0.109 0.008 0.024 �0.034
(�0.29) (�0.15) (0.67) (1.64) (0.22) (�0.20)
Include industry and
year dummy
Yes Yes Yes Yes Yes Yes
Clustered by company Yes Yes Yes Yes Yes Yes
Observations 2,471 2,471 1,215 2,098 2,098 1,176
Model p-values , 0.001 , 0.001 , 0.001 , 0.001 , 0.001 , 0.001
Adjusted (Pseudo) R2 0.15 0.04 0.09 0.10 0.07 0.15
*, **, *** Denote significant at 10 percent, 5 percent, and 1 percent, respectively, based on a one-tailed test for variableswith a directional expectation and two-tailed for variables with no directional expectation.One-tailed (two-tailed) t- (z-) test statistics are reported in parentheses for signed (unsigned) predictions.All variables are winsorized at 1 percent and 99 percent to reduce the effect of outliers.We include industry and year fixed effects, and the standard errors are adjusted based on firm-level clustering.See Appendix C for variable definitions.
16 Untabulated results of the first-stage model show that the choice to employ a supply chain auditor is positivelyassociated with IND_NATION, JOINT_IND, CURRENT_LIABILITY, ROA, and LOSS. The choice to employ a supplychain auditor is negatively associated with ASSET_TURNOVER, logAT, and LONG_DEBT.
148 Johnstone, Li, and Luo
Auditing: A Journal of Practice & TheoryNovember 2014

TABLE 9
The Importance of Accounts Receivable for the Supplier Company on the Associationbetween Audit Pricing and Auditor Supply Chain Knowledge
Independent VariablesPred.Sign
Dependent Variable: logAUDITFEEt
REV_CYCLE_IMPT. Median
REV_CYCLE_IMPT� Median
Constantt ? 9.521*** 9.451***
(63.93) (48.60)
CHAIN_CITYt ? �0.369** 0.114
(�1.93) (0.91)
CHAIN_NATIONt ? 0.408 �0.110
(1.23) (�0.93)
IND_NATIONt þ �0.020 0.091**
(�0.34) (1.73)
IND_CITYt þ 0.186*** 0.172***
(3.23) (3.00)
JOINT_INDt þ 0.108** 0.083*
(2.03) (1.36)
BIG_4t þ �0.025 0.128*
(�0.36) (1.33)
BUSY_SEASONt þ 0.112** 0.107*
(1.94) (1.42)
logATt þ 0.537*** 0.475***
(29.04) (22.32)
LONG_DEBTt þ 0.141* �0.064
(1.46) (�0.76)
CURRENT_LIABILITYt þ �0.327 0.300**
(�1.21) (2.19)
INVT_RATIOt þ �0.272* 0.587**
(�1.83) (1.91)
MODIFIED_OPNt þ 0.147** 0.140*
(1.98) (1.43)
ROAt � �0.383*** �0.329***
(�3.11) (�3.84)
LOSSt þ 0.117*** 0.028
(2.53) (0.77)
STD_CFOt þ 0.000 0.004
(0.02) (1.04)
SALE_GROWTHt þ �0.018 0.068
(�0.34) (0.92)
RESTRUCTUREt þ 0.094 0.200***
(0.85) (2.94)
SPECIAL_ITEMt þ 0.067** 0.200***
(2.12) (4.52)
FOREIGNt þ 0.189*** 0.209***
(4.75) (3.40)
NUM_SEGt þ 0.094*** 0.100***
(4.51) (3.80)
(continued on next page)
Client-Auditor Supply Chain Relationships, Audit Quality, and Audit Pricing 149
Auditing: A Journal of Practice & TheoryNovember 2014
been providing auditing services to the major customer, we exclude the subsample of supplier
companies whose major customers have switched to an auditor with supply chain knowledge at the
national level or the city level in any given year. As an example, suppose that Supplier X switched
from Deloitte in City A to PwC in City A in year t, and this PwC city office was already auditing
Supplier X’s Major Customer Y; in this case, DCHAIN_CITY is driven by Supplier X switching to
an auditor with supply chain knowledge at the city level in year t. In another example, Supplier X’s
Major Customer Y switched from Deloitte to PwC in City A in year t, and this PwC city office was
already auditing the Supplier Company X; in this case, DCHAIN_CITY is driven by Major
Customer Y’s auditor switching. Observations similar to the latter example are excluded from our
change analysis. Therefore, DCHAIN_CITY for this analysis is driven by supplier companies
switching to/away from an auditor who provides integrated supply chain auditing services to both
the suppliers and their major customers. This reduces the sample to 3,637 supplier company-years
in the audit quality analyses using jDACCj and RESTATE, and to 2,182 supplier company-years
using MEET.
Prior studies suggest that client companies may experience changes in auditor quality or audit
fees when they change from one auditor to another auditor. In our study, supplier companies may
switch their auditor at the national level or city level without necessarily switching to an auditor
with supply chain knowledge. As our earlier example illustrates, DCHAIN_CITY reflects Supplier X
switching from Deloitte in City A to PwC in City A. However, changes in audit quality can also be
driven by the fact that Supplier X switched from one auditor (Deloitte) to another auditor (PwC).
Therefore, we include a dummy variable, DAUDITOR, which equals 1 if a supplier company
switched their auditor in a given year between nonsupply chain auditors, and 0 otherwise to control
for the effect of supplier companies’ auditor switching behavior on audit quality and audit fees. All
other variables are yearly change variables.
Tables 10 and 11 include results of the change analyses for audit quality and audit fees,
respectively. The results in Table 10 continue to show that city-level auditor supply chain
TABLE 9 (continued)
Independent VariablesPred.Sign
Dependent Variable: logAUDITFEEt
REV_CYCLE_IMPT. Median
REV_CYCLE_IMPT� Median
RD_RATIOt þ 0.474** 0.868***
(2.24) (3.76)
logAUDITOR_TENUREt þ 0.107*** 0.085**
(4.02) (1.75)
ABN_CU_logFEEt þ 0.074** 0.017
(2.18) (0.43)
Include industry and year
dummy
Yes Yes
Clustered by company Yes Yes
Observations 2,471 2,098
Adjusted R2 0.777 0.752
*, **, *** Denote significant at 10 percent, 5 percent, and 1 percent, respectively, based on a one-tailed test for variableswith a directional expectation and two-tailed for variables with no directional expectation.One-tailed (two-tailed) t- (z-) test statistics are reported in parentheses for signed (unsigned) predictions.All variables are winsorized at 1 percent and 99 percent to reduce the effect of outliers.We include industry and year fixed effects, and the standard errors are adjusted based on firm-level clustering.See Appendix C for variable definitions.
150 Johnstone, Li, and Luo
Auditing: A Journal of Practice & TheoryNovember 2014

TABLE 10
Change Analyses on the Association between Audit Quality and Auditor Supply ChainKnowledge
Independent VariablesPred.Sign
Dependent Variable:
DjDACCtj DRESTATEt DMEETt
Constantt ? �0.087 �0.022** �13.672
(�0.66) (�2.30) (�0.24)
DCHAIN_CITYt � �0.529*** �0.049** �0.197**
(�3.39) (�1.77) (�1.70)
DCHAIN_NATIONt � �0.335 0.094 �1.295
(�0.62) (0.25) (�0.85)
DIND_NATIONt � �0.148 �0.005 �0.121
(�1.24) (�0.15) (�0.56)
DIND_CITYt � �0.318*** �0.033 �0.199
(�2.57) (�0.66) (�0.82)
DJOINT_INDt � �0.043 0.032 0.337
(�0.36) (0.70) (1.41)
DAUDITORt ? 0.375*** �0.029 0.427
(3.10) (�0.38) (1.06)
DjTACCtj þ 0.047
(0.56)
DTACCt þ �0.023 �0.145
(�0.60) (�0.58)
DlogATt ? �0.097 �0.042 1.010***
(�1.20) (�1.30) (4.55)
DCFOt � 0.104 0.010 �0.326
(1.32) (0.30) (�0.98)
DSTD_CFOt þ 0.002 0.001** �0.005
(1.55) (1.89) (�0.83)
DLEVERAGEt þ �0.003 �0.091 �1.134**
(�0.02) (�0.98) (�2.12)
DROAt � �0.357** 0.018 �0.464
(�1.94) (0.44) (�0.96)
DLOSSt þ 0.135** �0.018 0.033
(2.33) (�0.56) (0.23)
DMBt þ �0.007 �0.002 0.001
(�1.09) (�0.58) (0.03)
DSALE_GROWTHt þ �0.099 0.014 �0.004
(�1.20) (0.47) (�0.02)
DRD_RATIOt þ �0.487 0.126 0.015
(�0.48) (0.58) (0.76)
DALTMANt þ 0.002 0.000 �0.017
(0.33) (0.11) (�1.01)
DlogAUDITOR_TENUREt ? 0.057 �0.002 �0.011
(1.16) (�0.13) (�0.08)
DABN_CU_logFEEt ? �0.076 0.023 0.171
(�1.13) (1.12) (1.21)
(continued on next page)
Client-Auditor Supply Chain Relationships, Audit Quality, and Audit Pricing 151
Auditing: A Journal of Practice & TheoryNovember 2014

knowledge is positively associated with audit quality. The coefficients on DCHAIN_CITY reveal a
negative association with absolute discretionary accruals (p , 0.01), the likelihood of a restatement
(p¼ 0.04), and the likelihood of meeting or just beating analysts’ forecasts (p¼ 0.045). Consistent
with our main findings, none of the corresponding coefficients on DCHAIN_NATION are
significant.
Table 11 reports on the association between changes in auditor supply change knowledge and
changes in audit fees. The results reveal that DCHAIN_CITY is negatively associated with a change
in logAUDITFEE (p¼ 0.03), whereas the coefficient estimate on DCHAIN_NATION continues to
be insignificant. These results indicate that auditors with an increased level of supply chain
knowledge at the city level are able to pass along the efficiency gain from the integrated supply
chain services to supplier companies. However, such effects are not significant when the increased
supply chain knowledge is at the national level.
Simultaneity of the Effect on Audit Quality and Audit Fees
The auditing literature suggests simultaneity of the association between auditor supply chain
knowledge, audit quality, and audit fees. To address this concern, we estimate simultaneous
regressions to examine the association of auditor supply chain knowledge and both audit quality
and audit fees. Table 12 presents results consistent with those reported earlier, so our main
conclusions remain unchanged using this alternative model specification.
Taken together, these various additional analyses suggest that our documented association
between auditor supply chain knowledge and audit quality and audit pricing is driven by the
underlying economics of the audit market rather than model specifications.17
CONCLUSIONS
This study examines audit quality and pricing implications of auditor supply chain knowledge.
The results show that auditors’ supply chain knowledge at the city level is associated with higher
TABLE 10 (continued)
Independent VariablesPred.Sign
Dependent Variable:
DjDACCtj DRESTATEt DMEETt
Include industry and year dummy Yes Yes Yes
Clustered by company Yes Yes Yes
Observations 3,637 3,637 2,182
Model p-value , 0.001 , 0.001 , 0.001
Adjusted (Pseudo) R2 0.07 0.06 0.02
*, **, *** Denote significant at 10 percent, 5 percent, and 1 percent, respectively, based on a one-tailed test for variableswith a directional expectation and two-tailed for variables with no directional expectation.One-tailed (two-tailed) t- (z-) test statistics are reported in parentheses for signed (unsigned) predictions.All variables are winsorized at 1 percent and 99 percent to reduce the effect of outliers.We include industry and year fixed effects, and the standard errors are adjusted based on firm-level clustering.See Appendix C for variable definitions.
17 In an additional sensitivity test, we address the fact that companies audited by Big 4 auditors may differ from thoseaudited by non-Big 4 auditors. When we limit our sample to only companies with only Big 4 auditors, all of theresults remain essentially the same.
152 Johnstone, Li, and Luo
Auditing: A Journal of Practice & TheoryNovember 2014

TABLE 11
Change Analyses on the Association between Audit Pricing and Auditor Supply ChainKnowledge
Independent VariablesPred.Sign
Dependent Variable:DlogAUDITFEEt
Constantt ? 0.138***
(13.35)
DCHAIN_CITYt ? �0.098**
(1.85)
DCHAIN_NATIONt ? 0.941
(1.35)
DIND_NATIONt þ 0.006
(0.16)
DIND_CITYt þ 0.156***
(4.08)
DJOINT_INDt þ 0.110***
(2.78)
DAUDITORt þ �0.437***
(�7.79)
DBUSY_SEASONt þ 0.032
(0.57)
DlogATt þ 0.352***
(10.11)
DLONG_DEBTt þ 0.152**
(1.83)
DCURRENT_LIABILITYt þ �0.045
(�1.25)
DINVT_RATIOt þ 0.915***
(4.33)
DMODIFIED_OPNt þ 0.104**
(2.17)
DROAt � �0.222***
(�4.14)
DLOSSt þ �0.025
(�1.13)
DSTD_CFOt þ �0.000
(�0.56)
DSALE_GROWTHt þ 0.047**
(1.82)
DRESTRUCTUREt þ 0.036
(0.66)
DSPECIAL_ITEMt þ 0.019
(1.00)
DFOREIGNt þ 0.081**
(2.24)
DNUM_SEGt þ �0.001
(�0.23)
DRD_RATIOt þ �0.343
(�1.06)
(continued on next page)
Client-Auditor Supply Chain Relationships, Audit Quality, and Audit Pricing 153
Auditing: A Journal of Practice & TheoryNovember 2014

audit quality and lower audit fees for supplier companies, compared to companies employing
auditors with supply chain knowledge at the national level, or compared to companies without
supply chain knowledge. To understand these associations more fully, we consider a supplier
company’s sales dependence on the major customer and find that the association between city-level
auditor supply chain knowledge and audit quality is present only for suppliers that are highly
dependent on their major customer; such supplier companies have lower levels of absolute
discretionary accruals, a lower likelihood of a restatement, and a lower likelihood of meeting or just
beating analysts’ forecasts. In contrast, for the subsample of companies that are not heavily
dependent on their major customer, we observe no such association between auditor supply chain
knowledge and audit quality. Further, we find that the negative association between city-level
auditor supply chain knowledge is present only for suppliers that are highly dependent on their
major customer.
We also examine whether the associations between auditor supply chain knowledge and both
audit quality and audit fees differ depending on whether the supplier company has a particularly
high level of accounts receivable balances in the revenue cycle. The results show that for the
subsample of companies for which revenue cycle accounts are particularly important, supply chain
knowledge at the city level is significantly associated with lower levels of absolute discretionary
accruals, a lower likelihood of a restatement, a lower likelihood of meeting or just beating analysts’
forecasts, and lower audit fees.
We attribute these results to knowledge redundancy at the city level for supplier-major
customer pairs and their common auditor. When the supplier is particularly dependent on the major
customer for its revenue stream, and when the revenue cycle accounts of the supplier companies are
particularly important, the common knowledge available to an auditor with supply chain knowledge
is likely greater than in other situations. Taken together, the results reveal that the effect of supply
chain knowledge on audit quality and audit fees is very targeted in terms of city-level information
transfer, the importance of the customer to the supplier, and in terms of the accounts where supply
chain knowledge is critical to risk assessment and response.
TABLE 11 (continued)
Independent VariablesPred.Sign
Dependent Variable:DlogAUDITFEEt
DlogAUDITOR_TENUREt þ 0.118***
(5.60)
DABN_CU_logFEEt þ 0.047**
(2.14)
Include industry and year dummy Yes
Clustered by company Yes
Observations 3,637
Adjusted R2 0.07
*, **, *** Denote significant at 10 percent, 5 percent, and 1 percent, respectively, based on a one-tailed test for variableswith a directional expectation and two-tailed for variables with no directional expectation.One-tailed (two-tailed) t- (z-) test statistics are reported in parentheses for signed (unsigned) predictions.All variables are winsorized at 1 percent and 99 percent to reduce the effect of outliers.We include industry and year fixed effects, and the standard errors are adjusted based on firm-level clustering.See Appendix C for variable definitions.
154 Johnstone, Li, and Luo
Auditing: A Journal of Practice & TheoryNovember 2014

TA
BL
E1
2
Sim
ult
an
eou
sE
qu
ati
on
so
nth
eA
sso
cia
tio
nb
etw
een
Au
dit
or
Su
pp
lyC
ha
inK
no
wle
dg
ea
nd
Au
dit
Qu
ali
tya
nd
Pri
cin
g
Ind
epen
den
tV
ari
ab
les
jDA
CC
tjlo
gA
UD
ITF
EE
tR
ES
TA
TE
tlo
gA
UD
ITF
EE
tM
EE
Tt
log
AU
DIT
FE
Et
Co
nst
ant t
0.0
82
**
*9
.52
4*
**
0.2
36
**
*9
.48
9*
**
0.2
96
**
*9
.69
5*
**
(5.6
2)
(20
0.3
7)
(8.9
1)
(18
4.9
3)
(6.9
8)
(12
8.7
8)
CH
AIN
_CIT
Yt
�0
.07
2*
**
�0
.18
7*
*�
0.0
64
**
�0
.17
1*
�0
.05
8*
*�
0.0
68
*
(�2
.44
)(�
2.0
0)
(�1
.74
)(�
1.6
5)
(�1
.90
)(�
1.6
8)
CH
AIN
_NA
TIO
Nt
0.0
44
0.1
80
0.1
78
0.1
87
**
*0
.05
00
.09
8
(1.3
4)
(2.0
4)
(1.5
2)
(2.8
5)
(1.0
9)
(1.2
3)
IND
_NA
TIO
Nt
0.0
00
0.0
37
0.0
30
0.0
33
0.0
29
0.0
13
(0.0
3)
(1.1
6)
(1.5
8)
(0.9
6)
(1.2
0)
(0.3
2)
IND
_CIT
Yt
�0
.02
7*
*0
.17
1*
**
�0
.00
30
.16
9*
**
�0
.02
40
.13
6*
**
(�2
.28
)(4
.56
)(�
0.1
4)
(4.1
4)
(�0
.87
)(2
.86
)
JOIN
T_I
ND
t0
.01
00
.10
3*
**
0.0
20
0.1
06
**
*0
.00
70
.13
5*
**
(1.0
5)
(3.2
4)
(1.0
8)
(3.0
9)
(0.3
1)
(3.3
7)
BIG
_4t
�0
.01
9*
*0
.07
0*
*�
0.0
41
**
0.0
41
�0
.01
4�
0.0
04
(�1
.74
)(2
.02
)(�
1.9
9)
(1.0
8)
(�0
.47
)(�
0.0
7)
logA
Tt
�0
.00
10
.49
1*
**
�0
.01
2*
**
0.4
96
**
*�
0.0
15
**
0.4
83
**
*
(�0
.54
)(6
8.2
7)
(�2
.86
)(6
3.5
0)
(�2
.46
)(4
5.9
9)
RO
At
0.0
25
�0
.38
4*
**
�0
.05
8�
0.3
81
**
*�
0.0
17
�0
.59
5*
**
(1.1
0)
(�7
.10
)(�
1.3
1)
(�6
.58
)(�
0.2
2)
(�6
.44
)
LO
SSt
0.0
12
*0
.07
7*
**
�0
.01
70
.07
5*
*�
0.0
05
0.0
07
(1.3
6)
(2.8
8)
(�1
.08
)(2
.57
)(�
0.2
1)
(0.1
8)
STD
_CF
Ot
0.0
00
0.0
01
0.0
01
**
0.0
01
0.0
01
0.0
02
(0.1
0)
(0.6
2)
(1.9
8)
(0.4
9)
(0.7
3)
(1.1
2)
SAL
E_G
RO
WT
Ht
0.0
20
**
0.0
28
�0
.01
80
.01
1�
0.0
15
0.0
23
(1.9
0)
(0.8
6)
(�0
.92
)(0
.32
)(�
0.5
7)
(0.5
1)
RD
_RA
TIO
t�
0.0
17
0.3
20
**
*0
.04
30
.27
4*
*0
.08
9�
0.1
34
(�0
.43
)(2
.70
)(0
.58
)(2
.11
)(0
.93
)(�
0.8
2)
logA
UD
ITO
R_T
EN
UR
Et
�0
.00
20
.09
2*
**
�0
.00
70
.09
6*
**
�0
.01
10
.11
3*
**
(�0
.48
)(8
.07
)(�
1.0
6)
(7.7
9)
(�1
.23
)(6
.94
)
AB
N_C
U_l
ogF
EE
t0
.00
30
.06
6*
**
�0
.00
00
.06
3*
**
�0
.00
30
.04
8*
*
(0.5
6)
(3.6
9)
(�0
.03
)(3
.46
)(�
0.2
1)
(2.0
2)
(con
tinu
edo
nn
ext
pa
ge)
Client-Auditor Supply Chain Relationships, Audit Quality, and Audit Pricing 155
Auditing: A Journal of Practice & TheoryNovember 2014

TA
BL
E1
2(c
on
tin
ued
)
Ind
epen
den
tV
ari
ab
les
jDA
CC
tjlo
gA
UD
ITF
EE
tR
ES
TA
TE
tlo
gA
UD
ITF
EE
tM
EE
Tt
log
AU
DIT
FE
Et
jTA
CC
tj/T
AC
Ct
0.1
36
**
*0
.02
4�
0.0
04
(7.2
7)
(0.8
1)
(�0
.10
)
CF
Ot
�0
.01
40
.02
5�
0.0
03
(�1
.14
)(1
.04
)(�
0.0
6)
LE
VE
RA
GE
t0
.00
80
.02
70
.03
6
(0.5
9)
(1.1
4)
(0.9
4)
MB
t�
0.0
00
0.0
02
**
0.0
01
(�0
.26
)(2
.17
)(0
.54
)
LIT
IGA
TIO
Nt
0.2
21
**
*0
.00
60
.03
2
(18
.14
)(0
.27
)(1
.09
)
AL
TM
AN
t0
.00
3*
**
�0
.00
2*
*�
0.0
04
**
(4.9
1)
(�2
.03
)(�
2.4
9)
BU
SY_S
EA
SON
t0
.09
9*
**
0.1
17
**
*0
.14
0*
**
(4.6
1)
(4.9
9)
(4.6
7)
LO
NG
_DE
BT
t�
0.0
31
�0
.03
0�
0.0
63
(�0
.86
)(�
0.7
9)
(�0
.98
)
CU
RR
EN
T_L
IAB
ILIT
Yt
0.0
25
�0
.01
60
.27
5
(0.2
5)
(�0
.15
)(1
.20
)
INV
T_R
AT
IOt
0.2
60
**
*0
.24
1*
*0
.45
6*
**
(2.9
2)
(2.5
0)
(3.2
4)
MO
DIF
IED
_OP
Nt
0.1
05
**
0.1
14
**
0.1
30
(2.0
8)
(2.1
0)
(1.1
0)
RE
STR
UC
TU
RE
t0
.15
0*
**
0.1
45
**
0.0
33
(2.5
2)
(2.2
7)
(0.4
2)
SPE
CIA
L_I
TE
Mt
0.1
43
**
*0
.14
4*
**
0.1
14
**
*
(6.1
3)
(5.7
0)
(3.5
4)
FO
RE
IGN
t0
.22
5*
**
0.2
29
**
*0
.20
0*
**
(9.2
2)
(8.5
2)
(6.3
5)
NU
M_S
EG
t0
.10
5*
**
0.1
09
**
*0
.10
6*
**
(24
.39
)(2
2.6
3)
(19
.30
)
(con
tinu
edo
nn
ext
pa
ge)
156 Johnstone, Li, and Luo
Auditing: A Journal of Practice & TheoryNovember 2014

TA
BL
E1
2(c
on
tin
ued
)
Ind
epen
den
tV
ari
ab
les
jDA
CC
tjlo
gA
UD
ITF
EE
tR
ES
TA
TE
tlo
gA
UD
ITF
EE
tM
EE
Tt
log
AU
DIT
FE
Et
Incl
ud
ein
du
stry
and
yea
rd
um
my
Yes
Yes
Yes
Yes
Yes
Yes
Obse
rvat
ions
4,5
69
4,5
69
4,5
69
4,5
69
2,3
91
2,3
91
Ad
just
ed(P
seu
do
)R
20
.11
80
.75
10
.05
10
.75
10
.01
10
.70
6
*,**,***
Den
ote
signifi
cant
at10
per
cent,
5per
cent,
and
1per
cent,
resp
ecti
vel
y,
bas
edon
aone-
tail
edte
stfo
rvar
iable
sw
ith
adir
ecti
onal
expec
tati
on
and
two-t
aile
dfo
rvar
iable
sw
ith
no
dir
ecti
onal
expec
tati
on.
One-
tail
ed(t
wo-t
aile
d)
t-(z
-)te
stst
atis
tics
are
report
edin
par
enth
eses
for
signed
(unsi
gned
)pre
dic
tions.
All
var
iable
sar
ew
inso
rize
dat
1per
cent
and
99
per
cent
tore
duce
the
effe
ctof
outl
iers
.W
ein
clude
indust
ryan
dyea
rfi
xed
effe
cts,
and
the
stan
dar
der
rors
are
adju
sted
bas
edon
firm
-lev
elcl
ust
erin
g.
See
Appen
dix
Cfo
rvar
iable
defi
nit
ions.
Client-Auditor Supply Chain Relationships, Audit Quality, and Audit Pricing 157
Auditing: A Journal of Practice & TheoryNovember 2014

These results extend the literature on audit quality differentiation, audit pricing, and industry
knowledge. Prior literature shows that audit firms use an industry specialization differentiation
strategy to distinguish themselves from competitors. Our empirical evidence yields insight on a new
dimension of auditor knowledge that is highly targeted in terms of city-level, supplier-customer
dependence, and revenue-cycle account sizes. Overall, the results provide evidence consistent with
audit firms providing value-added, quality-differentiated services via supply chain specialization.
The results also extend prior literature that explores information sharing among supply chain
partners. We provide anecdotal evidence from discussions with audit partners and empirical
evidence that supplier companies benefit both in terms of enhanced audit quality and lower audit
fees when they purchase supply chain integrated auditing services, but only when the auditor
conducts the two audits out of the same city office. While auditing standards demand client
confidentiality, our results suggest that informal information communication concerning supply
chain partners assists auditors in assessing and responding to supply chain-relevant risks, and that
this communication or commonality of audit engagement team member assignments yields audit
production efficiencies that are shared with the supplier client. Future research that would help to
clarify the exact manner in which auditors achieve these benefits of providing supply chain
integrated auditing services would require data on engagement team personnel assignments. Data
on audit partner assignments across the supply chain partnership would also enable interesting
extensions of our research.
An important incremental contribution of this paper includes our adaptation of the knowledge
distribution framework posited in Sivakumar and Roy (2004). We use that foundation and adapt it
to the auditing context. Our resulting city- and national-level supply chain knowledge framework
may be helpful to researchers who seek to explain the results in studies on the various effects of
city- and national-level industry specialization (e.g., Fung, Gul, and Krishnan 2012). That literature
measures specialization, but is currently unclear as to how, exactly, industry specialization actually
accumulates. Our findings may therefore be useful in interpreting the results of such studies or
motivating analysis of the causal mechanisms underlying the development of industry
specialization in auditing.
Like any empirical study, this study has certain limitations. First, to identify whether an auditor
has supply chain knowledge, we focus only on supplier companies that report having major
customer relationships and the customers that are reported by the supplier companies in the
Compustat customer file. To the extent that these disclosures may be biased (e.g., Ellis, Fee, and
Thomas 2012), such bias will introduce error in our measures of supply chain knowledge. Second,
our proxies for audit quality obviously measure this construct only indirectly. Understanding the
association between employing an auditor with supply chain knowledge and direct measures of
audit effort would be informative.
REFERENCES
Altman, E. I. 1983. Corporate Financial Distress: A Complete Guide to Predicting, Avoiding, and Dealingwith Bankruptcy. New York, NY: John Wiley & Sons.
American Institute of Certified Public Accountants (AICPA). 1992. Confidential Client Information. Code
of Professional Conduct Rule 301. Available at: http://www.aicpa.org/InterestAreas/
ForensicAndValuation/Resources/Standards/Pages/Code%20of%20Professional%20Conduct.aspx
Ashbaugh, H., R. LaFond, and B. Mayhew. 2003. Do non-audit services compromise auditor
independence? Further evidence. The Accounting Review 78: 611–639.
Baiman, S., and M. Rajan. 2002a. The role of information and opportunism in the choice of buyer-supplier
relationships. Journal of Accounting Research 40: 247–278.
158 Johnstone, Li, and Luo
Auditing: A Journal of Practice & TheoryNovember 2014

Baiman, S., and M. Rajan. 2002b. Incentive issues in inter-firm relationships. Accounting, Organizationsand Society 27: 213–238.
Balsam, S., J. Krishnan, and J. S. Yang. 2003. Auditor industry specialization and earnings quality.
Auditing: A Journal of Practice & Theory 22: 71–97.
Bonner, S., and P. Walker. 1994. The effects of instruction and experience on the acquisition of auditing
knowledge. The Accounting Review 69 (January): 157–178.
Borgatti, S. P., and R. Cross. 2003. A relational view of information seeking and learning in social
networks. Management Science 49 (4): 432–445.
Bowen, R., L. DuCharme, and D. Shores. 1995. Stakeholders implicit claims and accounting method
choice. Journal of Accounting & Economics 20: 255–295.
Burgstahler, D., and I. Dichev. 1997. Earnings management to avoid earnings decreases and losses. Journal
of Accounting & Economics 24: 99–126.
Cachon, G., and M. Fisher. 2000. Supply chain inventory management and the value of information shared.
Management Science 46: 1032–1048.
Chen, F. 1998. Echelon reorder points, installation reorder points, and the value of centralized demand
information. Management Science 44: 221–234.
Committee of Sponsoring Organizations of the Treadway Commission (COSO). 1999. FraudulentFinancial Reporting: 1987–1997: An Analysis of U.S. Public Companies. Available at: http://www.
coso.org/publications/ffr_1987_1997.pdf
Committee of Sponsoring Organizations of the Treadway Commission (COSO). 2010. FraudulentFinancial Reporting: 1998–2007: An Analysis of U.S. Public Companies. Available at: http://www.
coso.org/documents/COSOFRAUDSTUDY2010_001.PDF
Copley, P. A., and M. S. Doucet. 1993. The impact of competition on the quality of governmental audits.
Auditing: A Journal of Practice & Theory 12 (Spring): 88–98.
Copley, P. A., M. S. Doucet, and K. M. Gaver. 1994. A simultaneous equations analysis of quality control
review outcomes and engagement fees for audits of recipient of federal financial assistance. TheAccounting Review 69 (1): 244–256.
Craswell, A. T., J. R. Francis, and S. L. Taylor. 1995. Auditor brand name reputations and industry
specializations. Journal of Accounting & Economics 20: 297–322.
Dechow, P. M., R. G. Sloan, and A. P. Sweeney. 1995. Detecting earnings management. The AccountingReview 70: 193–225.
Dopuch, N., M. Gupta, D. A. Simunic, and M. T. Stein. 2003. Production efficiency and the pricing of audit
services. Contemporary Accounting Research 20 (1): 47–77.
Ellis, J. A., C. E. Fee, and S. E. Thomas. 2012. Proprietary costs and the disclosure of information about
customers. Journal of Accounting Research 50: 685–727.
Fee, C. E., and S. Thomas. 2004. Sources of gains in horizontal mergers: Evidence from customer, supplier,
and rival firms. Journal of Financial Economics 74: 423–460.
Fee, C. E., C. Hadlock, and S. Thomas. 2006. Corporate equity ownership and the governance of product
market relationships. Journal of Finance 61 (3): 1217–1251.
Financial Accounting Standards Board (FASB). 1976. Financial Reporting for Segments of a BusinessEnterprise. SFAS No. 14. Norwalk, CT: FASB.
Francis, J. R., K. Reichelt, and D. Wang. 2005. The pricing of national and city-specific reputations for
industry expertise in the U.S. audit market. The Accounting Review 80: 113–136.
Francis, J. R., P. Michas, and M. Yu. 2012. Office Size of Big 4 Auditors and Client Restatements. Working
paper, University of Missouri–Columbia and Washington State University.
Frankel, R., M. Johnson, and K. Nelson. 2002. The relationship between auditors’ fees for nonaudit services
and earnings management. The Accounting Review 77 (Supplement): 71–105.
Fung, S. Y. K., F. A. Gul, and J. Krishnan. 2012. City-level auditor industry specialization, economies of
scale, and audit pricing. The Accounting Review 87 (4): 1281–1307.
Gavirneni, S., R. Kapuscinski, and S. Tayur. 1999. Value of information in capacitated supply chains.
Management Science 45: 16–24.
Client-Auditor Supply Chain Relationships, Audit Quality, and Audit Pricing 159
Auditing: A Journal of Practice & TheoryNovember 2014

Gist, W. E. 1994. Empirical evidence on the effect of audit structure on audit pricing. Auditing: A Journal ofPractice & Theory 13 (2): 25–40.
Guan, Y., F. Wong, and Y. Zhang. 2014. Analysts following along the supply chain. Review of AccountingStudies (forthcoming).
Hertzel, M. G., Z. Li, M. S. Officer, and K. J. Rodgers. 2008. Inter-firm linkages and the wealth effects of
financial distress along the supply chain. Journal of Financial Economics 87: 374–387.
Johnstone, K. M., A. Gramling, and L. E. Rittenberg. 2013. Auditing: A Risk-Based Approach toConducting a Quality Audit. Mason, OH: Cengage Learning.
Jones, J. 1991. Earnings management during import relief investigations. Journal of Accounting Research29: 193–228.
Knechel, R. W., and A. Vanstraelen. 2007. The relationship between auditor tenure and audit quality
implied by going concern opinions. Auditing: A Journal of Practice & Theory 26 (1): 113–131.
Knechel, R. W., P. Rouse, and C. Schelleman. 2009. A modified audit production framework: Evaluating
the relative efficiency of audit engagements. The Accounting Review 84 (5): 1607–1638.
Kothari, S. P., A. J. Leone, and C. E. Wasley. 2005. Performance matched discretionary accrual measures.
Journal of Accounting and Economics 39 (1): 163–197.
Kulp, S., H. Lee, and E. Ofek. 2004. Manufacturer benefits from information integration with retail
customers. Management Science 50: 431–444.
Lee, H., K. So, and C. Tang. 2000. The value of information sharing in a two-level supply chain.
Management Science 46: 626–643.
Libby, R., and J. Luft. 1993. Determinants of judgment performance in accounting settings: Ability,
knowledge, motivation, and environment. Accounting, Organizations and Society 18 (July): 425–
450.
Luo, S, and N. Nagarajan. 2014. Information Complementaries and Supply Chain Analysts. Working
paper, National University of Singapore and University of Pittsburgh.
Matsumura, E. M., and J. D. Schloetzer. 2014. Source of Customer-Base Concentration and SupplierPerformance. Working paper, University of Wisconsin–Madison and Georgetown University.
Mayhew, B., and M. S. Wilkins. 2003. Audit firm industry specialization as a differentiation strategy:
Evidence from fees charges to firms going public. Auditing: A Journal of Practice & Theory 22: 33–
52.
McAllister, B., and B. Cripe. 2008. Improper release of proprietary information. The CPA Journal (March):
52–55.
Myers, J., L. Myers, and T. Omer. 2003. Exploring the term of the auditor-client relationship and the quality
of earnings: A case for mandatory auditor rotation? The Accounting Review 78 (3): 779–799.
Palmrose, Z-V., and S. Scholz. 2004. The circumstances and legal consequences of non-GAAP reporting:
Evidence from restatements. Contemporary Accounting Research 21: 139–180.
Raman, K., and H. Shahrur. 2008. Relationship-specific investments and earnings management: Evidence
on corporate suppliers and customers. The Accounting Review 83: 1041–1081.
Reichelt, K., and D. Wang. 2010. National versus office-specific measures of auditor industry expertise and
effects on client earnings quality. Journal of Accounting Research 48: 647–686.
Rindfleisch, A., and C. Moorman. 2001. The acquisition and utilization of information in new product
alliances: A strength-of-ties perspective. Journal of Marketing 65 (2): 1–18.
Simunic, D. A., and M. Stein. 1987. Product Differentiation in Auditing: Auditor Choice in the Market ofUnseasoned New Issues. Vancouver, BC: Canadian Certified General Accountants Research
Foundation.
Sivakumar, K., and S. Roy. 2004. Knowledge redundancy in supply chains: A framework. Supply ChainManagement: An International Journal 9 (3): 241–249.
Solomon, I., M. Shields, and O. Whittington. 1999. What do industry-specialist auditors know? Journal ofAccounting Research 37 (Spring): 191–208.
Thibodeau, J. C. 2003. The development and transferability of task knowledge. Auditing: A Journal ofPractice & Theory 22 (1): 47–67.
160 Johnstone, Li, and Luo
Auditing: A Journal of Practice & TheoryNovember 2014

van Wijk, R., J. P. Jansen, and M. A. Lyles. 2008. Inter- and intra-organizational knowledge transfer: A
meta-analytic review and assessment of its antecedents and consequences. Journal of ManagementStudies 45 (4): 830–853.
Watts, R. L., and J. L. Zimmerman. 1986. Positive Accounting Theory. Englewood Cliffs, NJ: Prentice Hall
Inc.
APPENDIX A
Illustration of Calculation of CHAIN_CITY and CHAIN_NATION
Example of Calculation of CHAIN_CITY
EY San Jose office has 39 client companies that are publicly listed in the fiscal year of 2005.
Among these 39 clients, 15 clients (supplier companies) have reported having major customer
relationships (and both the supplier companies and their reported major customers are covered in
Audit Analytics). EY San Jose office audited six out of 15 suppliers and their reported major
customers’ annual financial statements for the year 2005. In this case, CHAIN_CITY is calculated as
6/15 ¼ 40 percent.
Example of Calculation of CHAIN_NATION
EY has 1,776 client companies that are publicly listed in the fiscal year of 2005 nationwide in
the U.S. Among these 1,776 clients, 217 clients (supplier companies) have reported having major
customer relationships (and both the supplier companies and their reported major customers are
covered in Audit Analytics). EY is the auditor for 122 of the 217 suppliers and these suppliers’
major customers, with only 11 by the same auditor office of EY. In this case, we orthogonalize
CHAIN_CITY with CHAIN_NATION, and calculate CHAIN_NATION as (122 � 11)/217 ¼ 51.2
percent.
APPENDIX B
Illustration of Calculation of jDACCtj
Our discretionary accruals measure jDACCj is calculated based on the cross-sectional modified
Jones (1991) model. We first estimate the Equation (1) below from the change in revenue, the level
of property, plant, and equipment, and the prior year’s operating performance (Kothari, Leone, and
Wasley 2005) by industry at the two-digit SIC code level, and year:
TACCt ¼ b0ð1=TAt�1Þ þ b1DREVt þ b2PPEt þ b3ROAt�1 þ et; ð1Þ
where:
TACC1¼ total accruals (net income from continuing operations (IB) minus operating cash flow
(OANCF � XIDOC) for year t divided by total assets (AT) at the end of the year t;
TAt�1 ¼ total assets at the end of year t�1;
DREVt¼ change in revenue (SALE) from year t�1 to year t, divided by total assets at the end of
year t�1;
PPEt¼ gross value of property, plant, and equipment (PPEGT) at the end of year t divided by
total assets at the end of year t�1;
ROAt�1¼ return on assets, calculated as net income (NI) for year t�1 divided by average total
assets for year t�1; and
et ¼ error term.
Client-Auditor Supply Chain Relationships, Audit Quality, and Audit Pricing 161
Auditing: A Journal of Practice & TheoryNovember 2014

Following Dechow, Sloan, and Sweeney (1995), we obtain our expected level of accruals from
the coefficients estimates from Equation (1) with an adjustment for the change in accounts
receivable:
TACC ¼ b0ð1=TAt�1Þ þ b1ðDREVt � DRECtÞ þ b2PPEt þ b3ROAt�1 þ et; ð2Þ
where:
TACCt ¼ the expected total accruals in year t;b0 to b3 ¼ coefficient estimates from equation (1); and
DRECt¼ change in accounts receivable (RECT) from year t�1 to year t, divided by total assets
at the end of year t�1.
Our discretionary accruals are the absolute difference between total accruals and expected total
accruals:
jDACCtj ¼ jTACCt � TACCtj:
jDACCj represents the amout f unexpected accruals and is the amount of earnings that have
been potentially distorted through managerial discretion in earnings management.
APPENDIX C
Variable Definitions
Variable Name Variable Measurement
jDACCtj ¼ The absolute value of abnormal accruals based on the cross-sectional modified
Jones (1991) model where expected accruals are estimated from the change
in revenue, adjusted by the change in account receivable, the level of
property, plant, and equipment, and the prior year’s operating performance
by industry at the two-digit SIC code level in year t. See Appendix B for
an illustration of the calculation of this variable.
RESTATEt ¼ 1 if a company’s financial reports for year t are subsequently restated in
future periods; 0 otherwise.
MEETt ¼ 1 if earnings exactly meet or beat the latest analyst earnings forecast by one
cent per share in year t; 0 otherwise.
logAUDITFEEt ¼ Log value of audit fee (dollars) in year t.
CHAIN_CITYt ¼ A ratio measure of auditors’ supply chain knowledge at the city level. It is
calculated at the auditor-city office level based on the total number of
supplier companies in year t at an auditor office that share the same auditor
with one or more of the supplier’s major customers, divided by the
maximum possible total number of supplier companies for the auditor
office in the same year t.
CHAIN_NATIONt ¼ A ratio measure of auditors’ supply chain knowledge at the national level. It
is calculated at the audit-firm level based on the total number of supplier
companies in year t at an audit firm that share the same auditor with one or
more of the supplier’s major customer at the national level but not at the
city level, divided by the maximum possible total number of supplier
companies for the audit firm in the same year t.
(continued on next page)
162 Johnstone, Li, and Luo
Auditing: A Journal of Practice & TheoryNovember 2014

APPENDIX C (continued)
Variable Name Variable Measurement
IND_NATIONt ¼ 1 if a company is audited by an audit firm that has industry expertise at the
national level (but not at the city level); 0 otherwise. An audit firm is
defined as an industry specialist at the national level if the auditor has the
largest market share in an industry at the national level based on the two-
digit SIC code.
IND_CITYt ¼ 1 if a company is audited by an audit firm that has industry expertise at the
city level (but not at the national level); 0 otherwise. An audit firm is defined
as an industry specialist at the city level if the auditor has the largest market
share in an industry at the city level based on the two-digit SIC code.
JOINT_INDt ¼ 1 if a company is audited by an audit firm that is both an industry specialist
both at the national level and the city level; 0 otherwise.
BIG_4t ¼ 1 if the auditor is a Big 4 auditor in the year; 0 otherwise.
TACCt ¼ Total accruals in year t, scaled by total assets in year t. The absolute value of
this variable is jTACCtj.logATt ¼ Log value of total assets in year t.
CFOt ¼ Cash flow from operations, divided by lagged total assets in year t.
STD_CFOt ¼ The standard deviation of operating cash flow (scaled by total assets at the
beginning of the fiscal year) in the past four years from t�4 to t�1.
LEVERAGEt ¼ Total liabilities divided by total assets in year t.
ROAt ¼ Net income divided by total assets in year t.
LOSSt ¼ 1 if the earnings before extraordinary items is less than zero in year t; 0
otherwise.
MBt ¼ Market value of equity divided by book value of equity at the end of year t.
SALE_GROWTHt ¼ Sales growth in year t. It is defined as the total sales at year t minus total
sales in year t�1, divided by the total sales in year t�1.
RD_RATIOt ¼ Research and development expense divided by sales in year t.
LITIGATIONt ¼ 1 if the company’s main operations are in a high-litigation industry including
biotechnology (2833–2836 and 8731–8734), computers (3570–3577 and
7370–7374), electronics (3600–3674), and retail (5200–5961) in year t; and
0 otherwise (based on Reichelt and Wang 2010).
ALTMANt ¼ Altman’s (1983) z-scores in year t to measure the likelihood of company
survival.
ABN_CU_logFEEt ¼ Client companies’ abnormal logged audit fee. It is the audit fee residual value
for the supplier’s principal major customer based on the audit fee
prediction model generated using the entire sample in the intersection of
Audit Analytics and Compustat during the 2003–2010 period. See
Appendix D for an illustration of the calculation of this variable.
BUSY_SEASONt ¼ 1 if a company has a December 31 year-end in year t; 0 otherwise.
LONG_DEBTt ¼ Long term debt, divided by total assets in year t.
CURRENT_LIABILITYt ¼ Current liabilities, divided by total assets in year t.
INVT_RATIOt ¼ Total inventory, divided by total assets in year t.
MODIFIED_OPNt ¼ 1 if the audit firm issued a modified auditor opinion in year t; 0 otherwise.
RESTRUCTUREt ¼ 1 if the company incurred restructuring charges in year t; 0 otherwise.
SPECIAL_ITEMt ¼ 1 if the company reported special items in year t; 0 otherwise.
(continued on next page)
Client-Auditor Supply Chain Relationships, Audit Quality, and Audit Pricing 163
Auditing: A Journal of Practice & TheoryNovember 2014

APPENDIX C (continued)
Variable Name Variable Measurement
FOREIGNt ¼ 1 if a company reported having nonzero foreign exchange income/loss in year
t; 0 otherwise.
NUM_SEGt ¼ Number of business segments in year t.
logAUDITOR_TENUREt ¼ The natural logarithm of 1 plus the number of years that the auditor has
audited the company’s financial statements prior to year t.
ASSET_TURNOVERt ¼ Asset turnover ratio, which is calculated based on total assets, divided by total
sales in year t.
CUSTOMER_IMPTt ¼ The importance of the major customer company to the supplier company,
calculated using the total amount of sales made to a major customer
company, divided by the total amount of sales for the supplier company in
year t. Observations in which the variable value is greater than or equal to
the median value in the sample are classified as CUSTOMER_IMPT ¼ 1
and observations in which the variable value is less than the median value
are classified as CUSTOMER_IMPT ¼ 0.
REV_CYCLE_IMPTt ¼ The product of two ratios, including CUSTOMER_IMPT, which represents a
ratio of the sales dependence for a supplier company over the supplier’s
major customer (calculated as the total sales made to a major customer/total
sales of the supplier company in the year) and AR_RATIO, which is the
percentage of accounts receivable of the supplier company over the total
assets for the supplier company in year t. Observations in which the
variable value is greater than or equal to the median value in the sample
are classified as REV_CYCLE_IMPT ¼1 and observations in which the
variable value is less than the median value are classified as
REV_CYCLE_IMPT ¼ 0.
164 Johnstone, Li, and Luo
Auditing: A Journal of Practice & TheoryNovember 2014

APPENDIX D
Audit Fee Model Using All Companies in Audit Analytics from 2003–2010
VariablesDependent Variable:
logAUDIT_FEEt
Constantt 9.539***
(72.21)
IND_NATIONt 0.083**
(2.13)
IND_CITYt �0.029
(�1.70)
JOINT_INDt 0.122**
(2.43)
BIG_4t 0.229***
(4.43)
BUSY_SEASONt 0.113**
(1.99)
logATt 0.515***
(53.02)
LONG_DEBTt �0.066**
(�1.97)
CURRENT_LIABILITYt �0.001
(�0.04)
INVT_RATIOt 0.070
(1.42)
MODIFIED_OPNt 0.048**
(2.10)
ROAt �0.103***
(�6.41)
LOSSt 0.130***
(11.59)
STD_CFOt �0.003
(�1.29)
SALE_GROWTHt 0.048***
(4.09)
RESTRUCTUREt 0.110***
(2.74)
SPECIAL_ITEMt 0.191***
(15.66)
FOREIGNt 0.248***
(11.16)
NUM_SEGt 0.078***
(4.52)
RD_RATIOt 1.066***
(11.70)
logAUDITOR_TENUREt 0.036**
(2.24)
(continued on next page)
Client-Auditor Supply Chain Relationships, Audit Quality, and Audit Pricing 165
Auditing: A Journal of Practice & TheoryNovember 2014

APPENDIX D (continued)
VariablesDependent Variable:
logAUDIT_FEEt
Include industry and year dummy Yes
Clustered by company Yes
Observations 31,049
Adjusted R2 0.800
*, **, *** Denote significant at 10 percent, 5 percent, and 1 percent, respectively, based on two-tailed t- (z-) teststatistics.Two-tailed t-test statistics are reported in parentheses and are adjusted by company-level clustering.All variables are winsorized at 1 percent and 99 percent to reduce the effect of outliers.The sample includes the intersection of all companies from the Audit Analytics and Compustat customer segment filefrom 2003 to 2010.See Appendix C for variable definitions.
166 Johnstone, Li, and Luo
Auditing: A Journal of Practice & TheoryNovember 2014