Embed Size (px)
Citation preview
Audited Group Results
For the year ended 30 November 2012
Agenda
Introduction to Hudaco
Results summary
Business model
Operating segments and acquisitions update
Financial review and tax status of BEE structure
Outlook
Trading conditions were good in H1 but slowed in H2
Mining strikes had a significant impact
Volatile exchange rates made pricing difficult
Global political and economic landscape keeps prospects uncertain but
increasingly there are positive signs
SARS is challenging the BEE structure
The 2012 financial year

Introduction to Hudaco
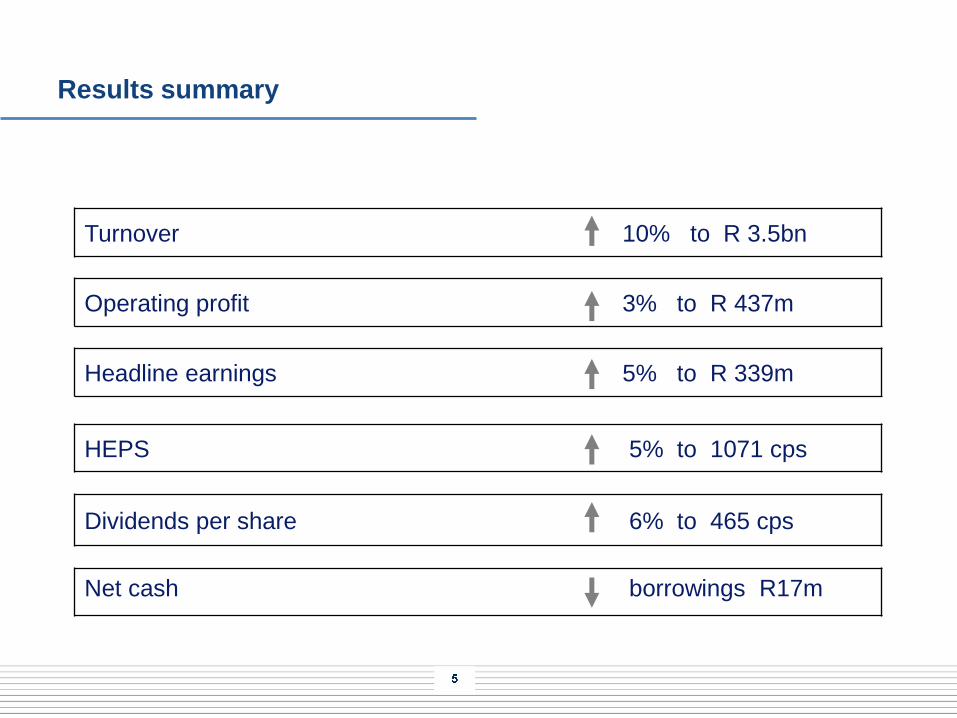
Results summary
Turnover 10% to R 3.5bn
Operating profit 3% to R 437m
Headline earnings 5% to R 339m
HEPS 5% to 1071 cps
Dividends per share 6% to 465 cps
Net cash borrowings R17m
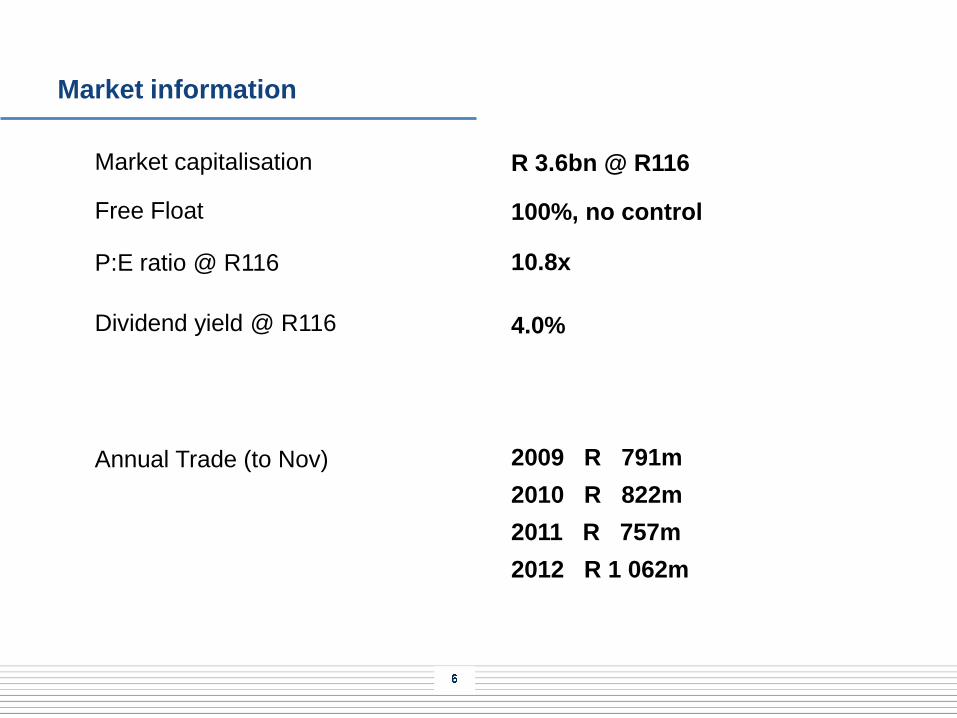
Market information
Market capitalisation
Free Float
P:E ratio @ R116
Dividend yield @ R116
Annual Trade (to Nov)
R 3.6bn @ R116
100%, no control
10.8x
4.0%
2009 R 791m
2010 R 822m
2011 R 757m
2012 R 1 062m
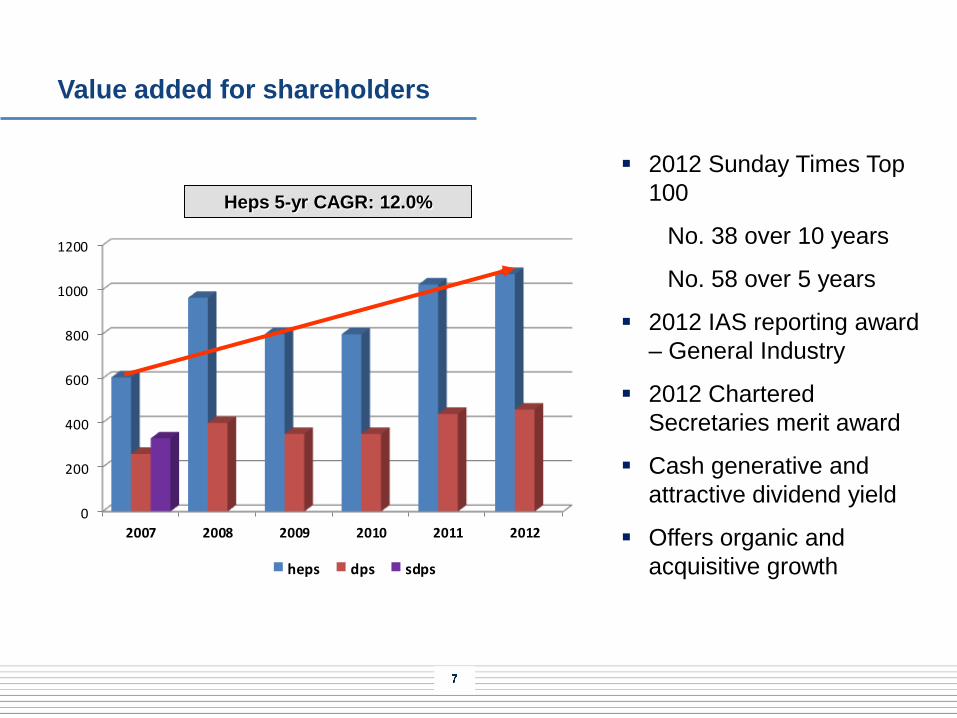
Value added for shareholders
0
200
400
600
800
1000
1200
2007 2008 2009 2010 2011 2012
heps dps sdps
2012 Sunday Times Top
100
No. 38 over 10 years
No. 58 over 5 years
2012 IAS reporting award
– General Industry
2012 Chartered
Secretaries merit award
Cash generative and
attractive dividend yield
Offers organic and
acquisitive growth
Heps 5-yr CAGR: 12.0%
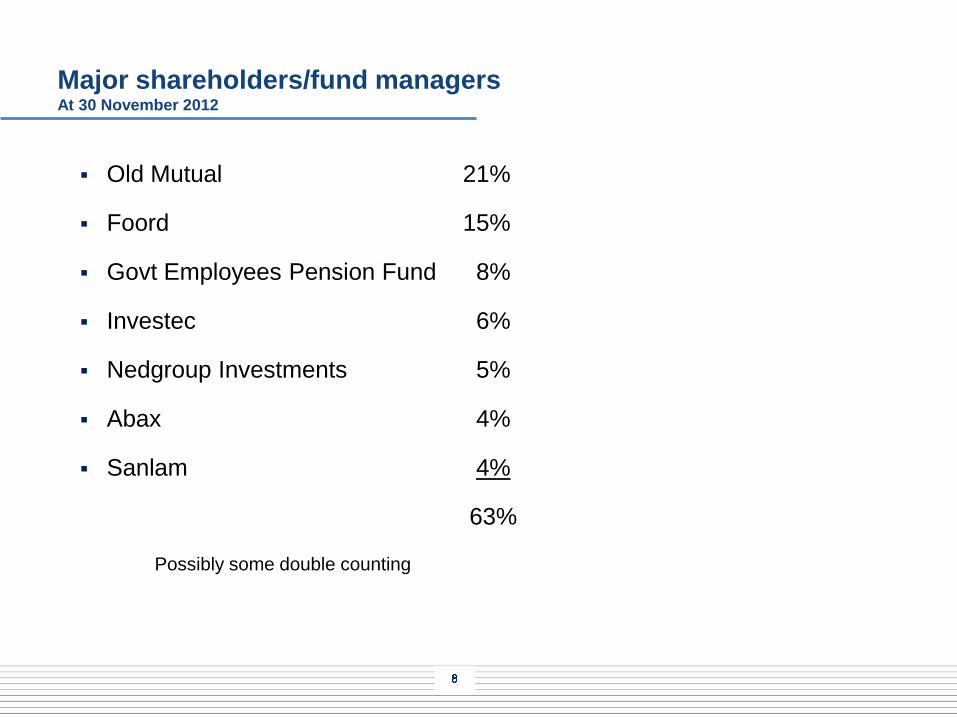
Major shareholders/fund managers At 30 November 2012
Old Mutual 21%
Foord 15%
Govt Employees Pension Fund 8%
Investec 6%
Nedgroup Investments 5%
Abax 4%
Sanlam 4%
63%
Possibly some double counting
The Hudaco business model
The Hudaco business model
Hudaco’s business is the importation and distribution of branded
industrial consumable products generally used in the repair and
maintenance of machines
The concept of “value added distribution” is core to our business model
Agency agreements generally restricted our activities to Africa south of
the equator
Features of value added distribution
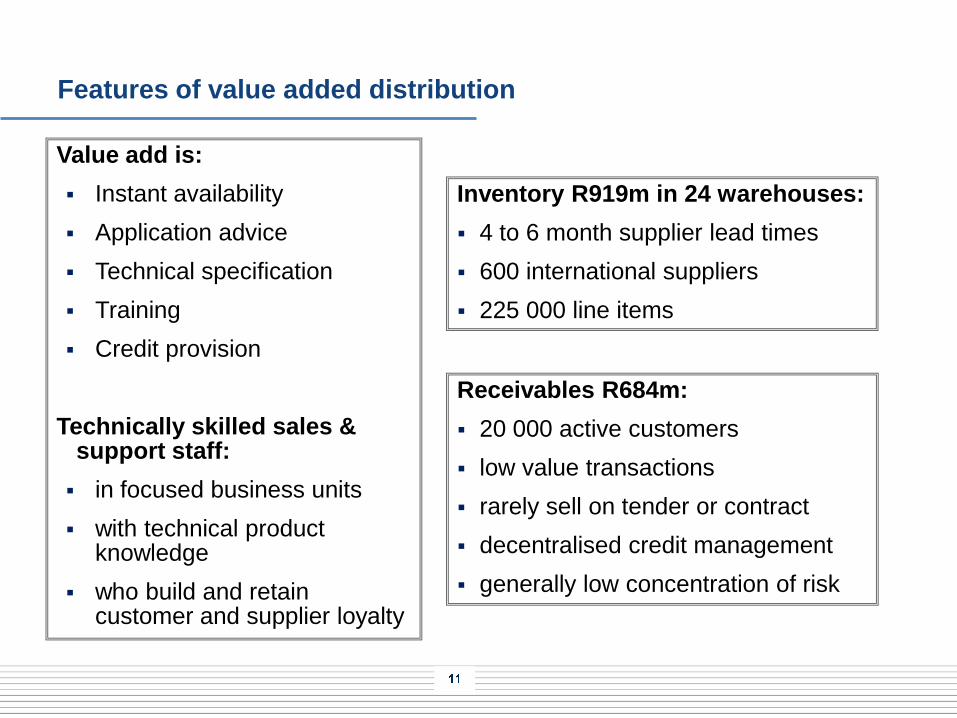
Value add is:
Instant availability
Application advice
Technical specification
Training
Credit provision
Technically skilled sales & support staff:
in focused business units
with technical product knowledge
who build and retain customer and supplier loyalty
Inventory R919m in 24 warehouses:
4 to 6 month supplier lead times
600 international suppliers
225 000 line items
Receivables R684m:
20 000 active customers
low value transactions
rarely sell on tender or contract
decentralised credit management
generally low concentration of risk
Operating segments and acquisitions
update
Operating segments
Largest segment imports and distributes branded engineering
consumables generally used in the repair and maintenance of
machines
About one third of our business is distribution of consumer related
products generally sold to installers
Operating segments
Engineering consumables
Bearings
Power transmission products
Diesel engines and spares
Consumer related products
Power tools
Security equipment
Professional communication equipment
Automotive aftermarket products
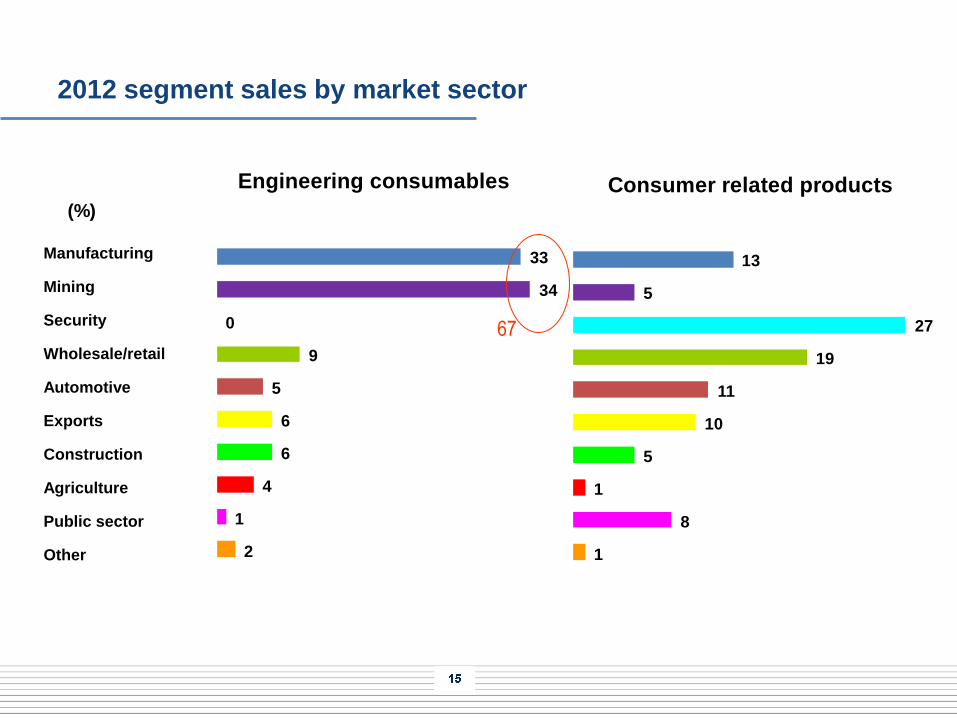
2012 segment sales by market sector
2
1
4
6
6
5
9
0
34
33
Engineering consumables
Manufacturing
Mining
Security
Wholesale/retail
Automotive
Exports
Construction
Agriculture
Public sector
Other 1
8
1
5
10
11
19
27
5
13
Consumer related products(%)
67
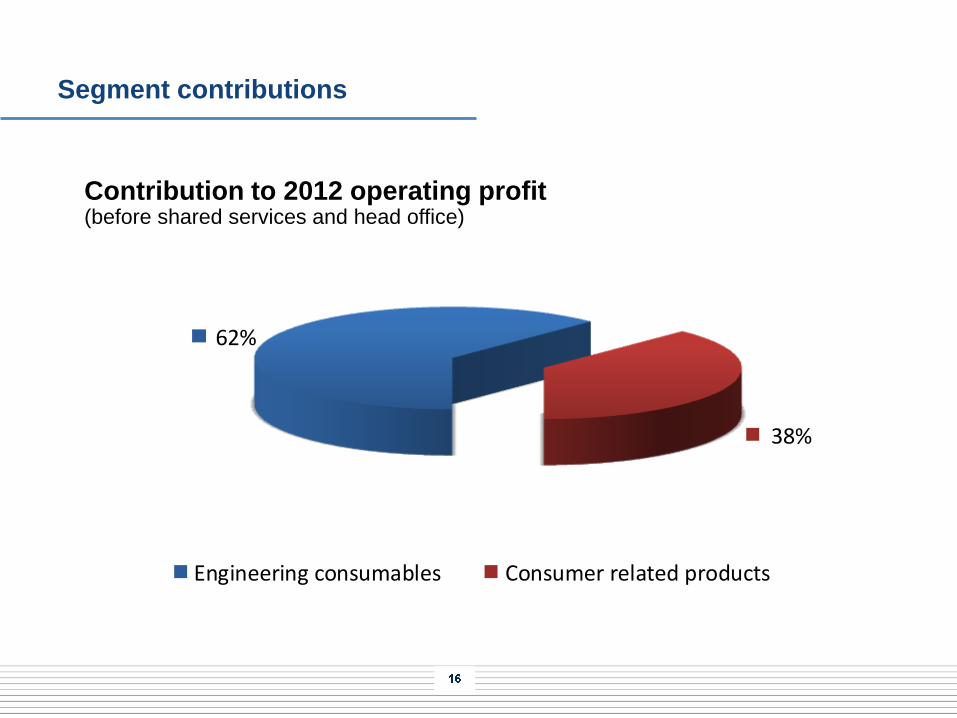
Segment contributions
Contribution to 2012 operating profit (before shared services and head office)
62%
38%
Engineering consumables Consumer related products
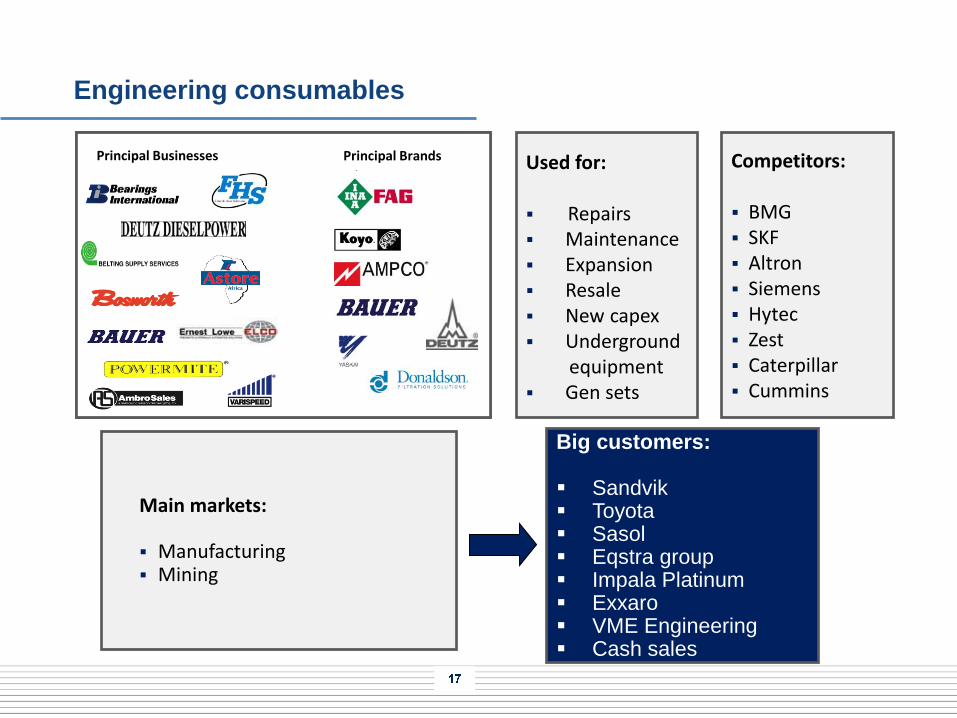
Big customers: Sandvik Toyota Sasol Eqstra group Impala Platinum Exxaro VME Engineering Cash sales
Used for: Repairs Maintenance Expansion Resale New capex Underground equipment Gen sets
Main markets: Manufacturing Mining
Principal Businesses Principal Brands
Engineering consumables
Competitors: BMG SKF Altron Siemens Hytec Zest Caterpillar Cummins
17
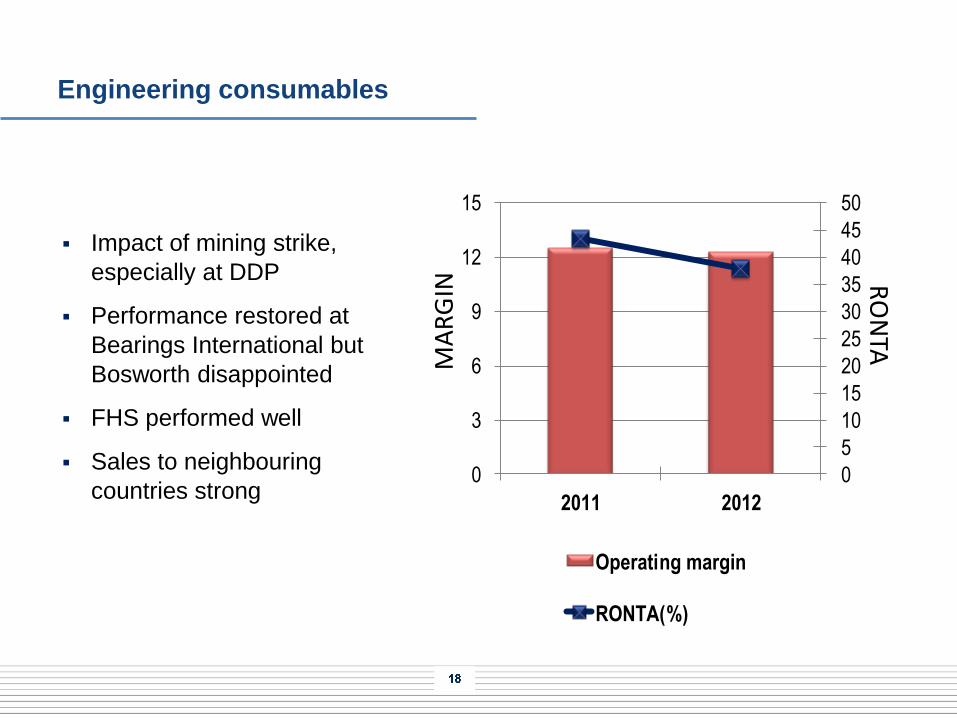
Engineering consumables
Impact of mining strike,
especially at DDP
Performance restored at
Bearings International but
Bosworth disappointed
FHS performed well
Sales to neighbouring
countries strong
0
5
10
15
20
25
30
35
40
45
50
0
3
6
9
12
15
2011 2012
RO
NTA
MA
RG
IN
Operating margin
RONTA(%)
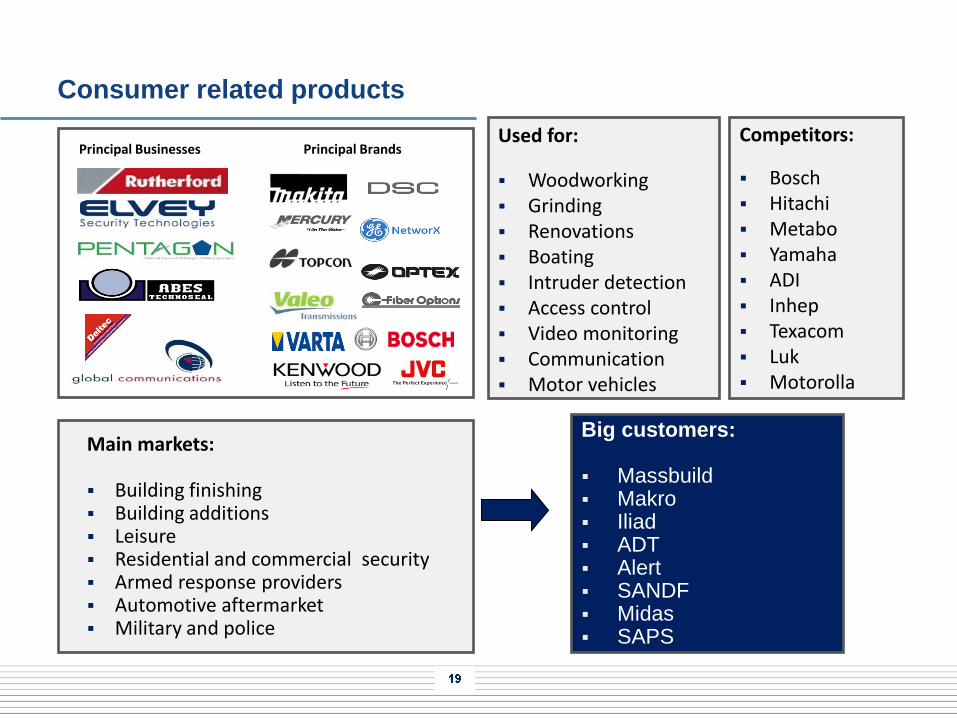
Consumer related products
Big customers: Massbuild Makro Iliad ADT Alert SANDF Midas SAPS
Used for:
Woodworking Grinding Renovations Boating Intruder detection Access control Video monitoring Communication Motor vehicles
Main markets: Building finishing Building additions Leisure Residential and commercial security Armed response providers Automotive aftermarket Military and police
Principal Businesses Principal Brands
Competitors:
Bosch Hitachi Metabo Yamaha ADI Inhep Texacom Luk Motorolla
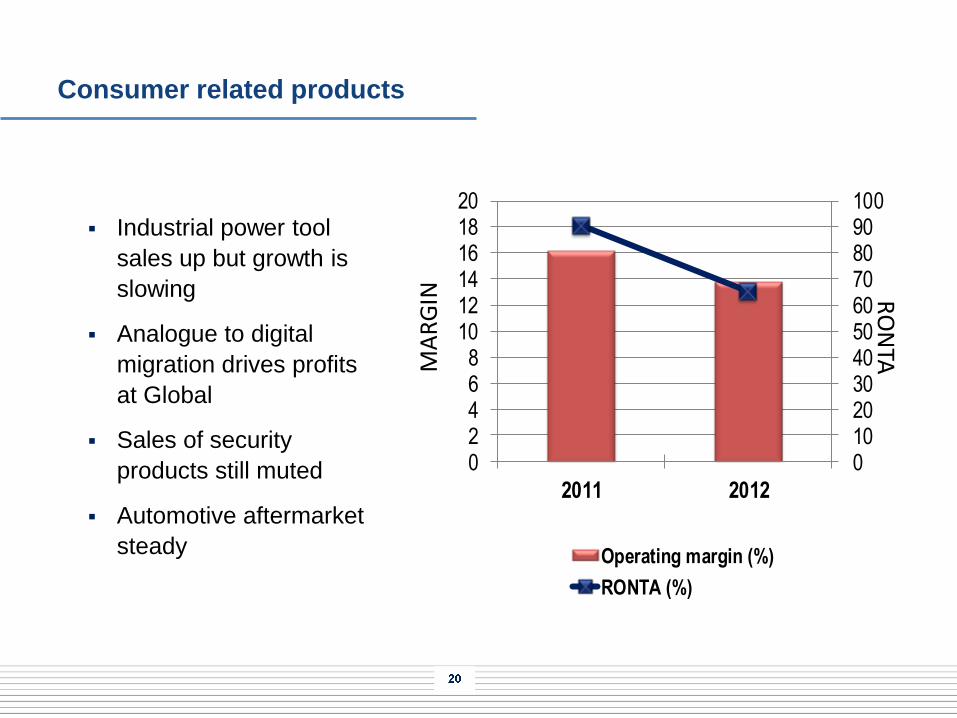
Consumer related products
0102030405060708090100
02468
101214161820
2011 2012
RO
NTAM
AR
GIN
Operating margin (%)
RONTA (%)
Industrial power tool
sales up but growth is
slowing
Analogue to digital
migration drives profits
at Global
Sales of security
products still muted
Automotive aftermarket
steady
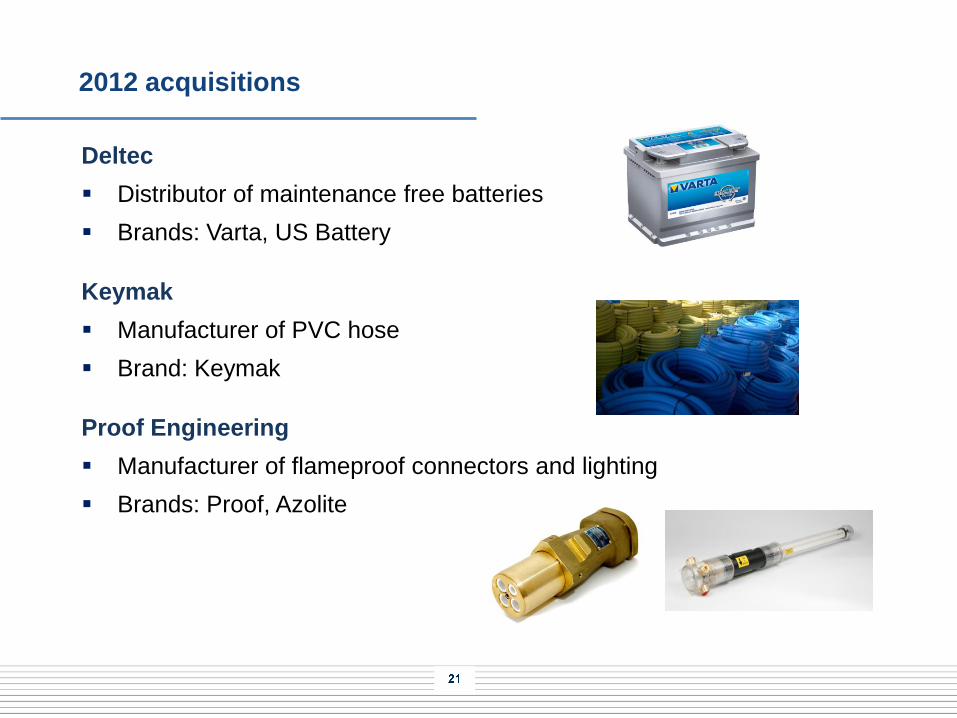
2012 acquisitions
Deltec
Distributor of maintenance free batteries
Brands: Varta, US Battery
Keymak
Manufacturer of PVC hose
Brand: Keymak
Proof Engineering
Manufacturer of flameproof connectors and lighting
Brands: Proof, Azolite
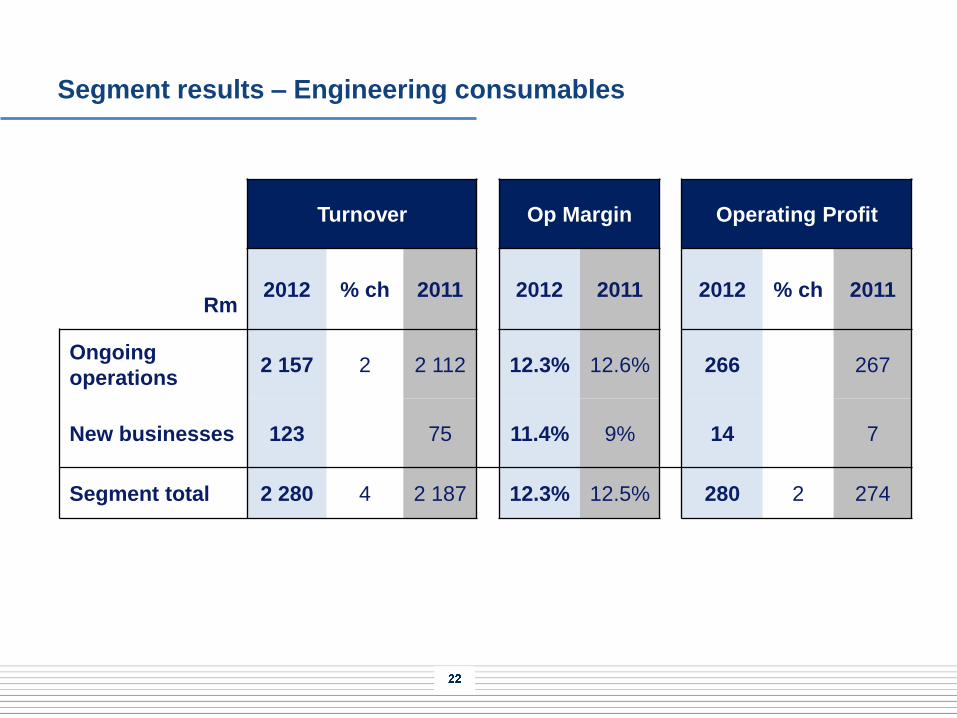
Segment results – Engineering consumables
Turnover Op Margin Operating Profit
Rm 2012 % ch 2011 2012 2011 2012 % ch 2011
Ongoing
operations 2 157 2 2 112 12.3% 12.6% 266 267
New businesses 123 75 11.4% 9% 14 7
Segment total 2 280 4 2 187 12.3% 12.5% 280 2 274
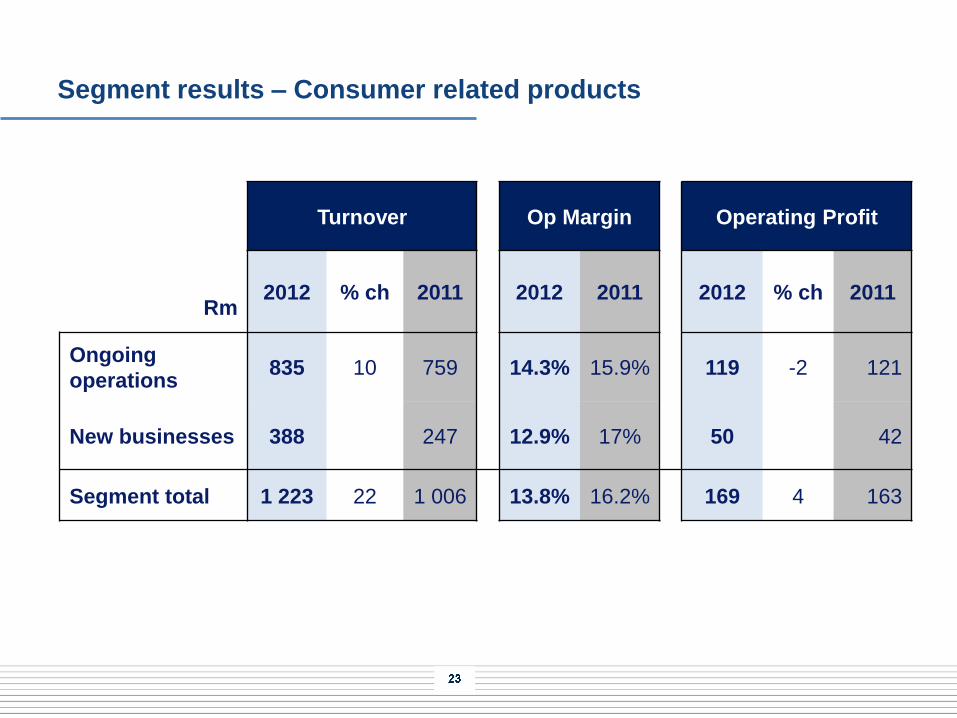
Segment results – Consumer related products
Turnover Op Margin Operating Profit
Rm 2012 % ch 2011 2012 2011 2012 % ch 2011
Ongoing
operations 835 10 759 14.3% 15.9% 119 -2 121
New businesses 388 247 12.9% 17% 50 42
Segment total 1 223 22 1 006 13.8% 16.2% 169 4 163
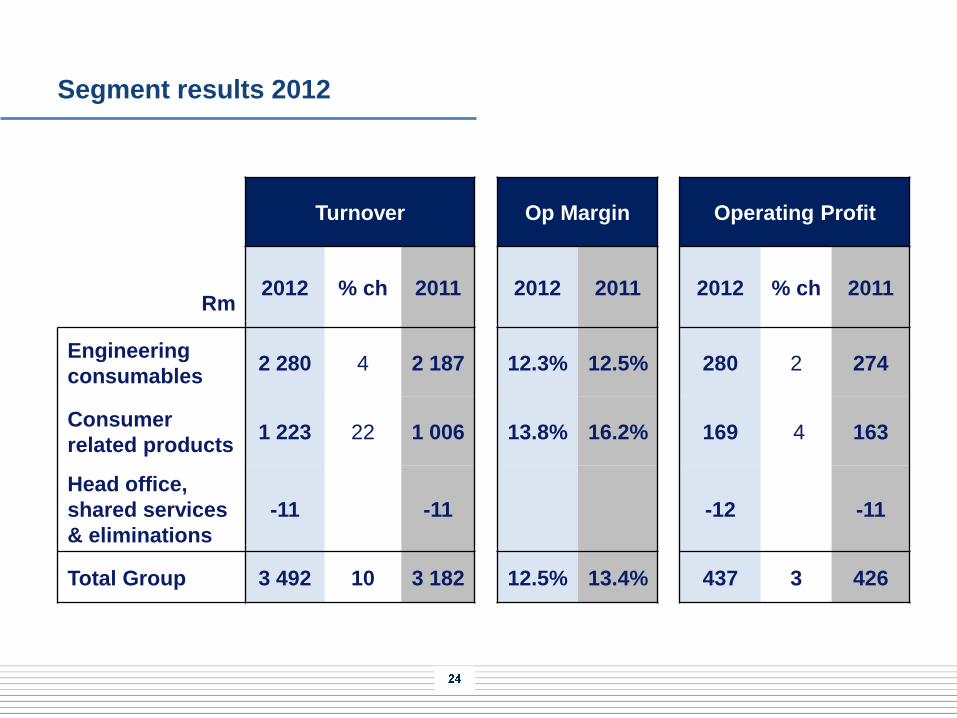
Segment results 2012
Turnover Op Margin Operating Profit
Rm 2012 % ch 2011 2012 2011 2012 % ch 2011
Engineering
consumables 2 280 4 2 187 12.3% 12.5% 280 2 274
Consumer
related products 1 223 22 1 006 13.8% 16.2% 169 4 163
Head office,
shared services
& eliminations
-11 -11 -12 -11
Total Group 3 492 10 3 182 12.5% 13.4% 437 3 426
Financial review
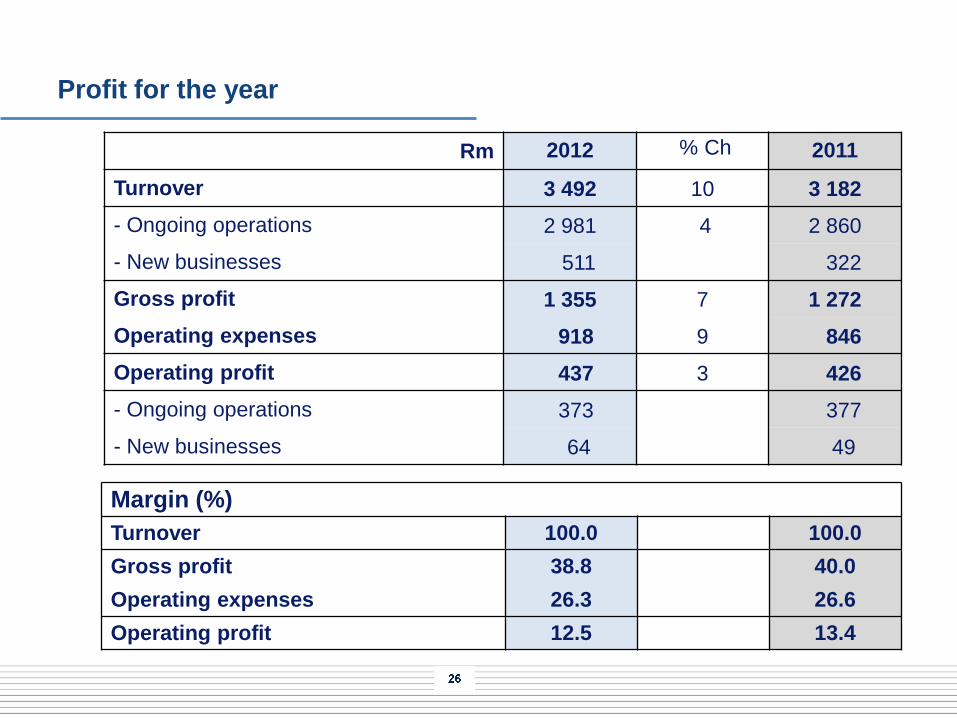
Profit for the year
Rm 2012 % Ch 2011
Turnover 3 492 10 3 182
- Ongoing operations 2 981 4 2 860
- New businesses 511 322
Gross profit 1 355 7 1 272
Operating expenses 918 9 846
Operating profit 437 3 426
- Ongoing operations 373 377
- New businesses 64 49
Margin (%)
Turnover 100.0 100.0
Gross profit 38.8 40.0
Operating expenses 26.3 26.6
Operating profit 12.5 13.4
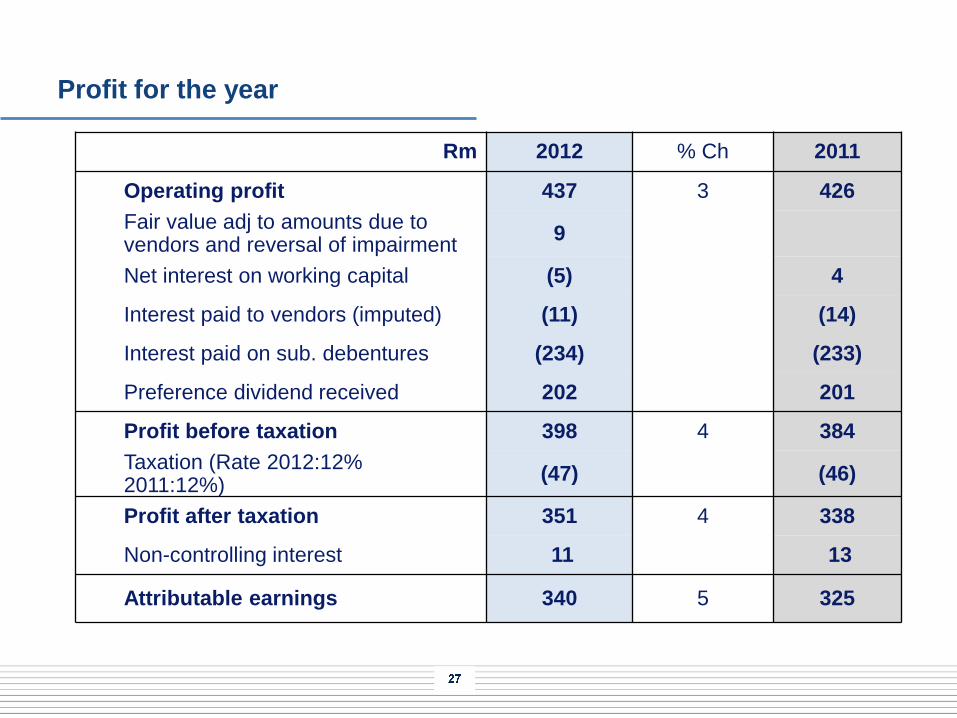
Profit for the year
Rm 2012 % Ch 2011
Operating profit 437 3 426
Fair value adj to amounts due to vendors and reversal of impairment
9
Net interest on working capital (5) 4
Interest paid to vendors (imputed) (11) (14)
Interest paid on sub. debentures (234) (233)
Preference dividend received 202 201
Profit before taxation 398 4 384
Taxation (Rate 2012:12% 2011:12%)
(47) (46)
Profit after taxation 351 4 338
Non-controlling interest 11 13
Attributable earnings 340 5 325
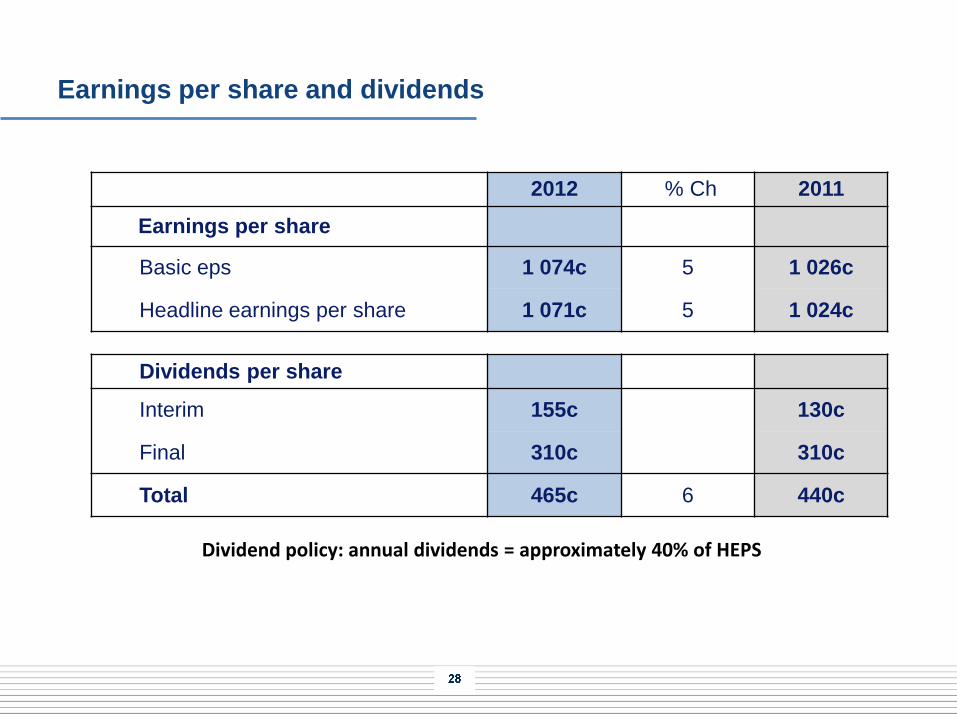
Earnings per share and dividends
2012 % Ch 2011
Earnings per share
Basic eps 1 074c 5 1 026c
Headline earnings per share 1 071c 5 1 024c
Dividends per share
Interim 155c 130c
Final 310c 310c
Total 465c 6 440c
Dividend policy: annual dividends = approximately 40% of HEPS
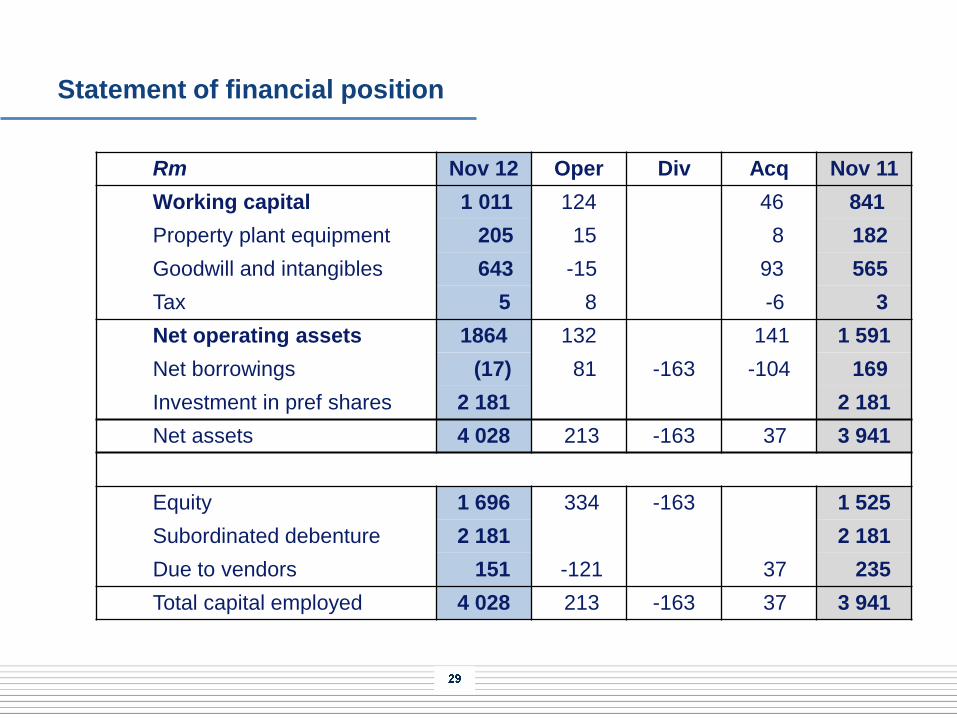
Statement of financial position
Rm Nov 12 Oper Div Acq Nov 11
Working capital 1 011 124 46 841
Property plant equipment 205 15 8 182
Goodwill and intangibles 643 -15 93 565
Tax 5 8 -6 3
Net operating assets 1864 132 141 1 591
Net borrowings (17) 81 -163 -104 169
Investment in pref shares 2 181 2 181
Net assets 4 028 213 -163 37 3 941
Equity 1 696 334 -163 1 525
Subordinated debenture 2 181 2 181
Due to vendors 151 -121 37 235
Total capital employed 4 028 213 -163 37 3 941
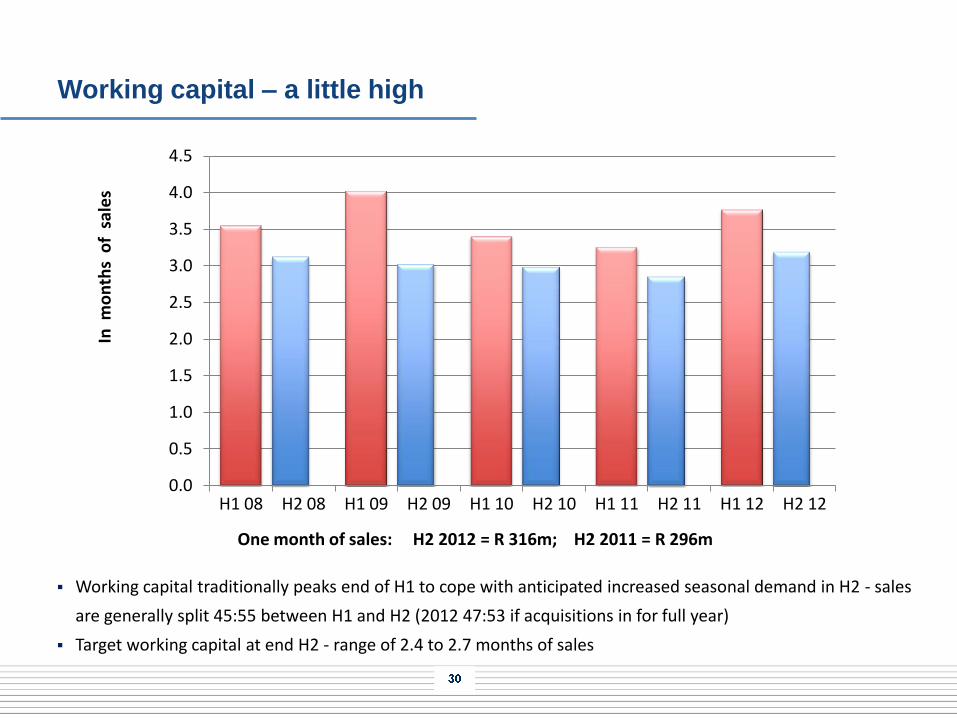
Working capital – a little high
0.0
0.5
1.0
1.5
2.0
2.5
3.0
3.5
4.0
4.5
H1 08 H2 08 H1 09 H2 09 H1 10 H2 10 H1 11 H2 11 H1 12 H2 12
In m
on
ths
of
sal
es
One month of sales: H2 2012 = R 316m; H2 2011 = R 296m
Working capital traditionally peaks end of H1 to cope with anticipated increased seasonal demand in H2 - sales
are generally split 45:55 between H1 and H2 (2012 47:53 if acquisitions in for full year)
Target working capital at end H2 - range of 2.4 to 2.7 months of sales
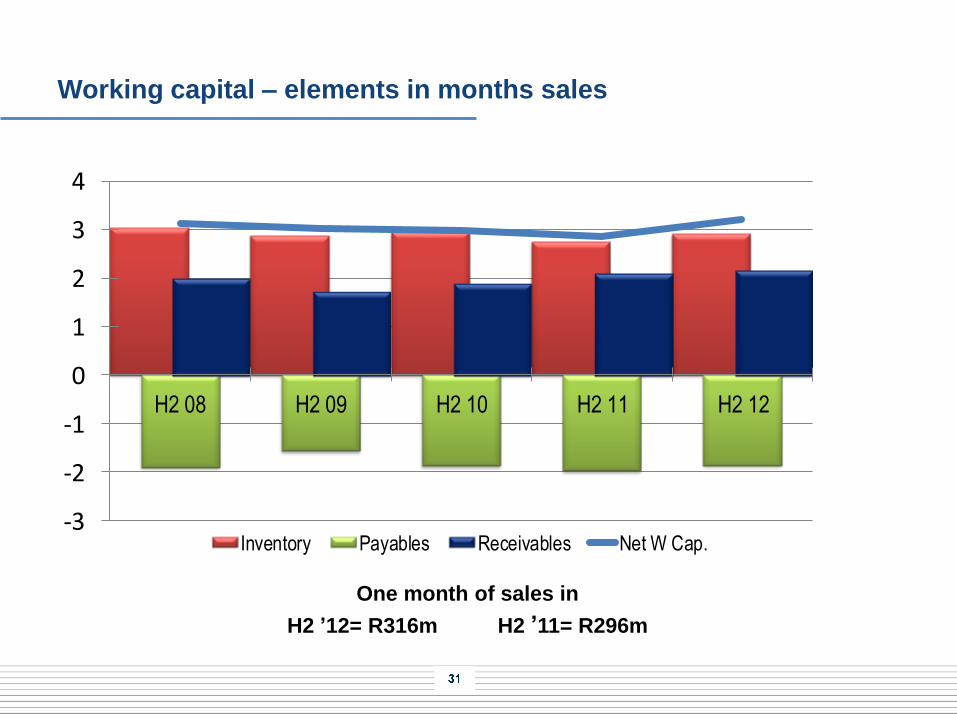
Working capital – elements in months sales
-3
-2
-1
0
1
2
3
4
H2 08 H2 09 H2 10 H2 11 H2 12
Inventory Payables Receivables Net W Cap.
One month of sales in
H2 ’12= R316m H2 ’11= R296m
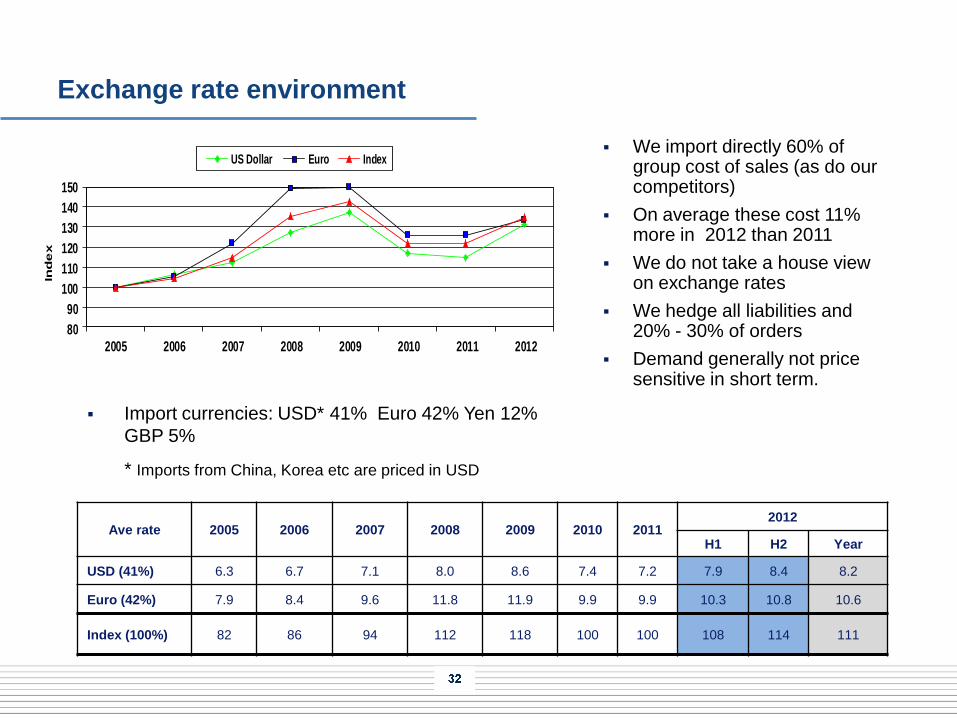
Exchange rate environment
80
90
100
110
120
130
140
150
2005 2006 2007 2008 2009 2010 2011 2012
Ind
ex
US Dollar Euro Index
Ave rate 2005 2006 2007 2008 2009 2010 2011 2012
H1 H2 Year
USD (41%) 6.3 6.7 7.1 8.0 8.6 7.4 7.2 7.9 8.4 8.2
Euro (42%) 7.9 8.4 9.6 11.8 11.9 9.9 9.9 10.3 10.8 10.6
Index (100%) 82 86 94 112 118 100 100 108 114 111
We import directly 60% of group cost of sales (as do our competitors)
On average these cost 11% more in 2012 than 2011
We do not take a house view on exchange rates
We hedge all liabilities and 20% - 30% of orders
Demand generally not price sensitive in short term.
Import currencies: USD* 41% Euro 42% Yen 12%
GBP 5%
* Imports from China, Korea etc are priced in USD
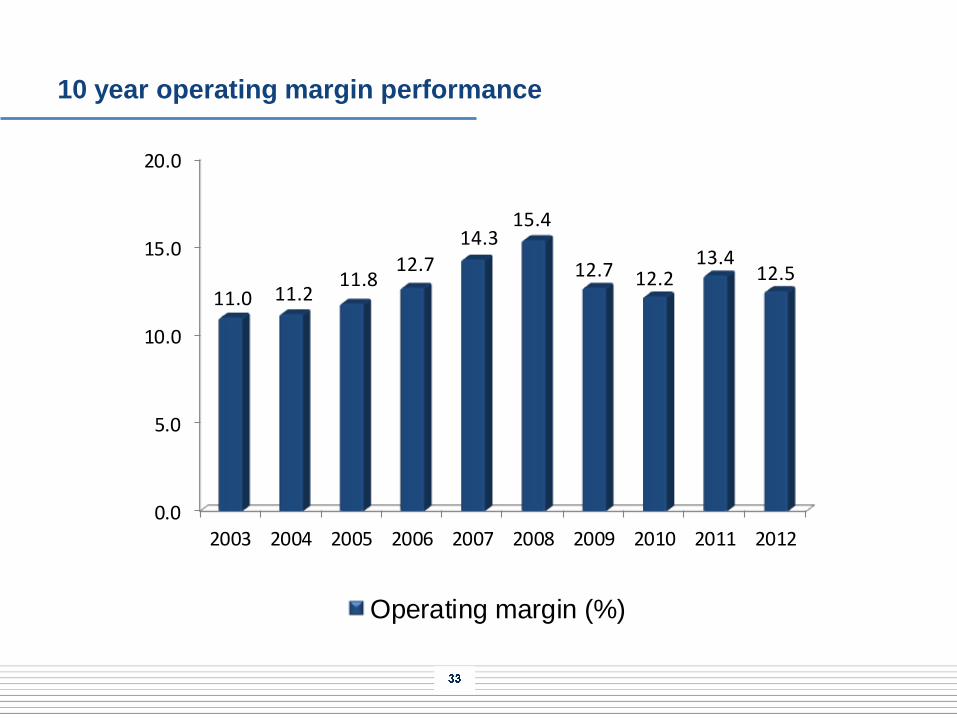
10 year operating margin performance
0.0
5.0
10.0
15.0
20.0
2003 2004 2005 2006 2007 2008 2009 2010 2011 2012
11.0 11.211.8
12.714.3
15.4
12.7 12.213.4
12.5
Operating margin (%)
BEE structure
In response to the BEE imperative, Hudaco restructured in 2007
Through a fully geared structure, introduced BEE shareholders at
negligible cost to the BEE partners
Hudaco Trading (held 15% by BEE partners) borrowed R2.2bn from
Morgan Stanley – pay debenture interest of R234m pa
Money was used to purchase the businesses from old Hudaco
Old Hudaco (through BRI) invested the proceeds in Cadiz preference
shares – receive preference dividends of R202m pa
BEE structure (continued)
Ownership score key in achieving level 4 BEE scorecard rating
Ownership is main criterion in mining industry BEE charter
BEE credentials have been instrumental in:
retaining business
drawing new customers
Attracting acquisitions that needed better BEE credentials
Economic empowerment of new entrant black shareholders
Bursary programme running for 4 years for black staff and their families
“Old” shareholders gave up 15% in perpetuity
Initial IFRS charge in income statement of R43m
Pref dividends less after tax cost of debenture interest is R33m pa
S8E and S8EA: Cadiz preference dividend becomes taxable
On a “tax event”:
Hudaco can:
Do nothing
Ask Cadiz to gross up dividend
Then Cadiz can:
Gross up as requested (ideal but probably out of reach)
Redeem the preference share
If Cadiz redeem, Morgan Stanley lose security so can:
Do nothing ie keep the debentures in place (Hudaco will need a
new investment)
Put the debentures to Hudaco (Hudaco could seek a new funder or
finance internally)
If this goes to debentures being put to Hudaco, effect on profit after tax
is R33m pa
Whatever happens, BEE shareholders remain in place
BEE structure and taxation
SARS have issued a notice under S80J indicating that they believe the
purpose was a scheme to avoid tax
They intend assessing BRI on the interest paid by Hudaco Trading to
Morgan Stanley and disallowing STC credits on the preference
dividends
Potential exposure 2007-2012:
On interest – R345m
STC credit effect – R92m
Estimated interest – R65m
SARS also likely to seek penalties
Totally disproportionate to the tax portion of the benefits of the BEE
structure
BEE structure and taxation (continued)
The notice was issued over the holiday season which gave us no time
to consult counsel and respond adequately by deadline and an
adequate extension of time to do so was not granted
Last week, counsel reviewed all the documentation and reconfirmed
that we have a very strong case
SARS have not yet seen our case and supporting evidence
SARS has prescription deadline so assessments will probably follow
soon
We plan to contest vigorously any assessment issued.
Summary
Earnings are solid
Working capital (inventories) a little high
Healthy financial position
Cash continues to be deployed successfully into new businesses
Capacity remains for more acquisitions
Rand weakness positive for Hudaco in 2013
inventory to increase
Gross profit to increase
Tax changes likely to normalise tax rate

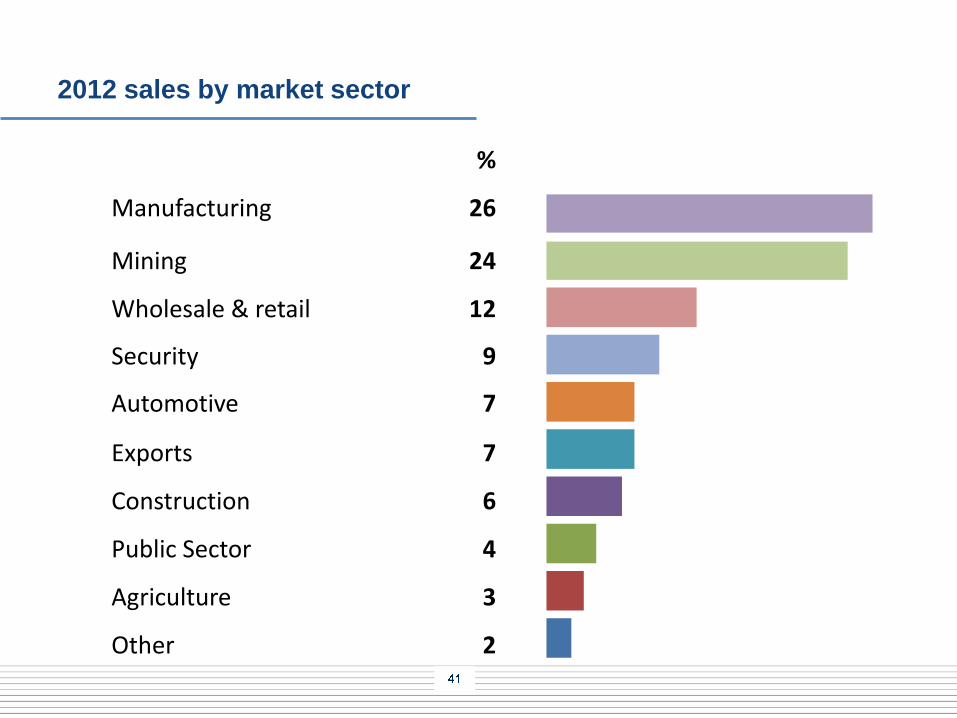
2012 sales by market sector
%
Manufacturing 26
Mining 24
Wholesale & retail 12
Security 9
Automotive 7
Exports 7
Construction 6
Public Sector 4
Agriculture 3
Other 2
Outlook - reminders
Hudaco sales are predominantly driven by GDP activity
GDFI adds capacity for future GDP activity
Rand exchange rate has a big impact on pricing
Hudaco has balance sheet investment capacity of about R500m
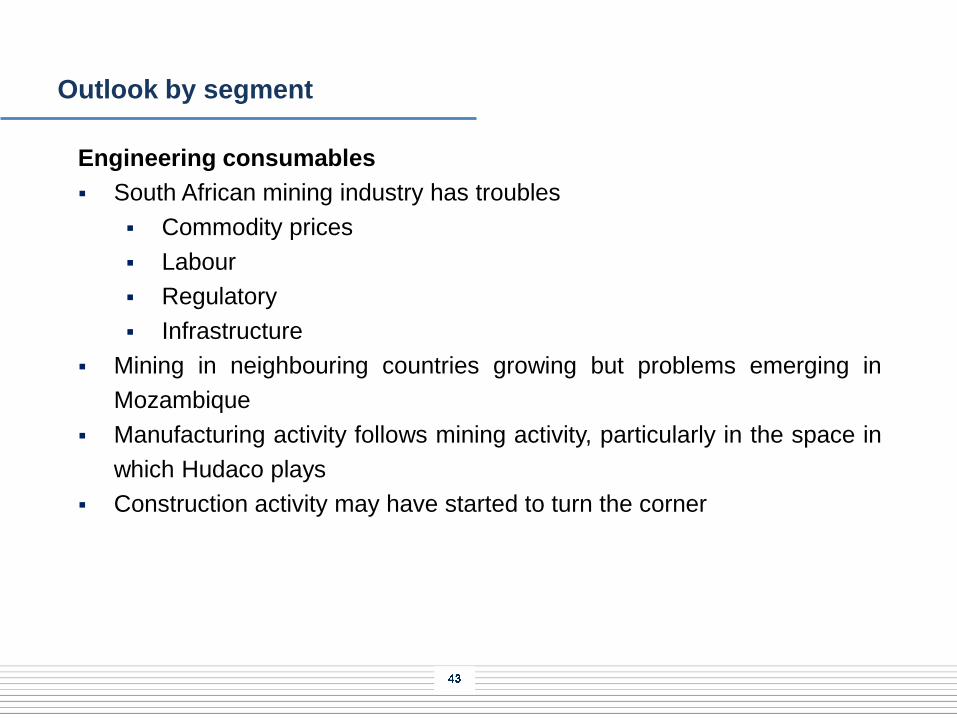
Outlook by segment
Engineering consumables
South African mining industry has troubles
Commodity prices
Labour
Regulatory
Infrastructure
Mining in neighbouring countries growing but problems emerging in
Mozambique
Manufacturing activity follows mining activity, particularly in the space in
which Hudaco plays
Construction activity may have started to turn the corner
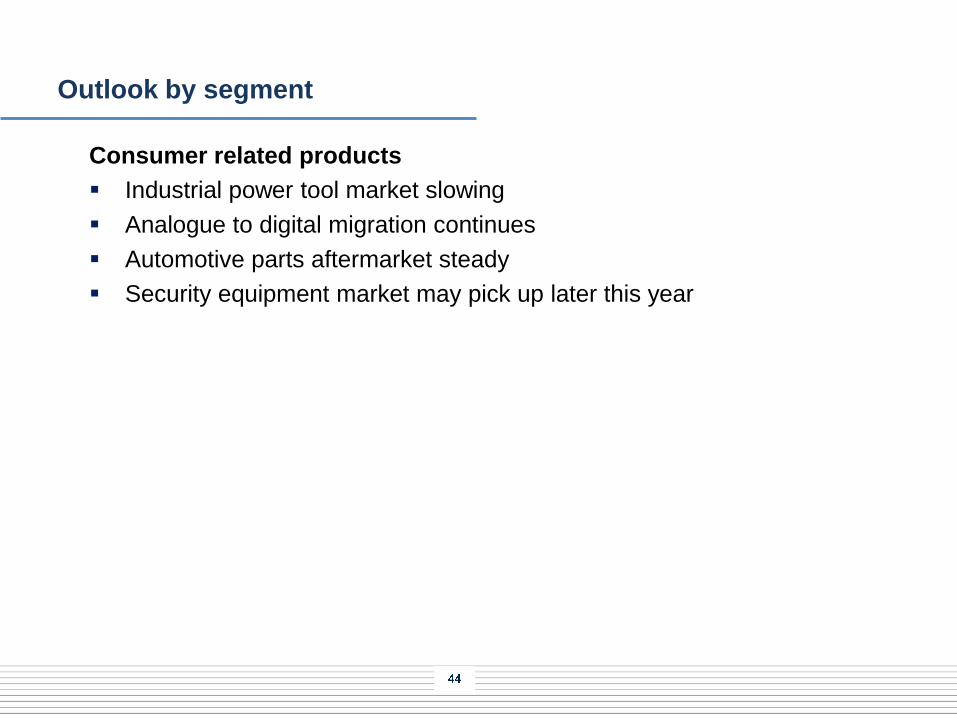
Outlook by segment
Consumer related products
Industrial power tool market slowing
Analogue to digital migration continues
Automotive parts aftermarket steady
Security equipment market may pick up later this year
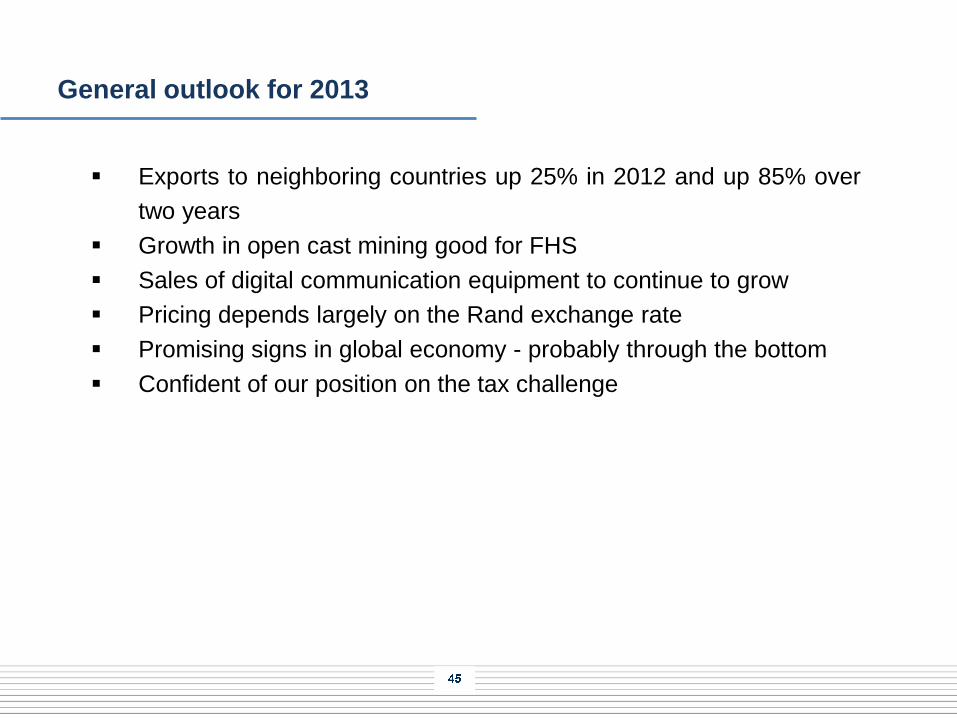
General outlook for 2013
Exports to neighboring countries up 25% in 2012 and up 85% over
two years
Growth in open cast mining good for FHS
Sales of digital communication equipment to continue to grow
Pricing depends largely on the Rand exchange rate
Promising signs in global economy - probably through the bottom
Confident of our position on the tax challenge
Disclaimer
The preceding presentation contains forward looking statements about the
Hudaco Group’s operations and financial position. They are prepared in good
faith and are based on Hudaco’s best estimates and information at the time of
preparing the presentation. They are nonetheless subject to significant
uncertainties and contingencies many of which are understandably beyond
Hudaco’s control. Unanticipated events will occur and actual future events
may differ materially from current expectations for many reasons including
new business opportunities, as well as many other internal and external
factors. Any of these factors may materially affect Hudaco's future business
activities and financial results. None of the forward looking statements has
been reported on by Hudaco’s auditors.
Contact details
Stephen Connelly
Chief executive
Tel +27 (11) 657 5001
Fax +27 (86) 532 9524
Clifford Amoils
Financial director
Tel +27 (11) 657 5002
Fax +27 (86) 681 7862
www.hudaco.co.za