Embed Size (px)
Citation preview

©2017 National Association of Insurance Commissioners. All rights reserved.SM Insure U and Stop. Call. Con�rm. are registered service marks of the National Associations of Insurance Commissioners.
AUDITED FINANCIAL REPORTSDECEMBER 31, 2016
National Association of Insurance Commissioners Financial Report December 31, 2016

Contents
Independent auditor’s report 10
Financial statements
Statements of financial position 11
Statements of activities 12
Statements of cash flows 13
Notes to financial statements 14-25
10
Independent Auditor’s Report
Honorable MembersNational Association of Insurance CommissionersKansas City, Missouri
Report on the Financial Statements We have audited the accompanying financial statements of the National Association of InsuranceCommissioners, which comprise the statements of financial position as of December 31, 2016 and 2015,the related statements of activities and cash flows for the years then ended, and the related notes to thefinancial statements.
Management’s Responsibility for the Financial Statements Management is responsible for the preparation and fair presentation of these financial statements inaccordance with accounting principles generally accepted in the United States of America; this includes thedesign, implementation and maintenance of internal controls relevant to the preparation and fairpresentation of financial statements that are free from material misstatement, whether due to fraud or error.
Auditor’s Responsibility Our responsibility is to express an opinion on these financial statements based on our audits. We conductedour audits in accordance with auditing standards generally accepted in the United States of America. Thosestandards require that we plan and perform the audit to obtain reasonable assurance about whether thefinancial statements are free of material misstatement.
An audit involves performing procedures to obtain audit evidence about the amounts and disclosures in thefinancial statements. The procedures selected depend on the auditor’s judgment, including the assessmentof the risks of material misstatement of the financial statements, whether due to fraud or error. In makingthose risk assessments, the auditor considers internal control relevant to the entity’s preparation and fairpresentation of the financial statements in order to design audit procedures that are appropriate in thecircumstances, but not for the purpose of expressing an opinion on the effectiveness of the entity’s internalcontrol. Accordingly, we express no such opinion. An audit also includes evaluating the appropriateness ofaccounting policies used and the reasonableness of significant accounting estimates made bymanagement, as well as evaluating the overall presentation of the financial statements.
We believe that the audit evidence we have obtained is sufficient and appropriate to provide a basis for ouraudit opinion.
Opinion In our opinion, the financial statements referred to above present fairly, in all material respects, the financialposition of the National Association of Insurance Commissioners as of December 31, 2016 and 2015, andthe changes in its net assets and its cash flows for the years then ended in conformity with accountingprinciples generally accepted in the United States of America.
Kansas City, MissouriFebruary 16, 2017
11
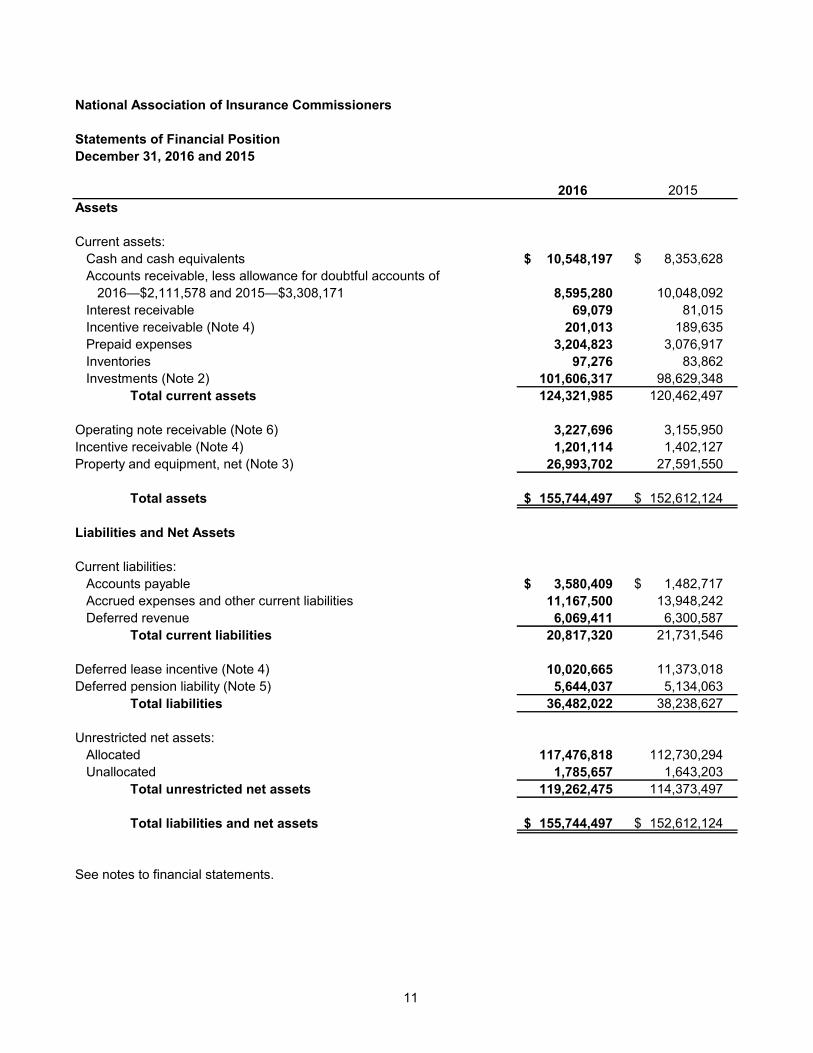
National Association of Insurance Commissioners
Statements of Financial PositionDecember 31, 2016 and 2015
2016 2015Assets
Current assets:Cash and cash equivalents 10,548,197 $ 8,353,628$ Accounts receivable, less allowance for doubtful accounts of
2016—$2,111,578 and 2015—$3,308,171 8,595,280 10,048,092Interest receivable 69,079 81,015Incentive receivable (Note 4) 201,013 189,635Prepaid expenses 3,204,823 3,076,917Inventories 97,276 83,862Investments (Note 2) 101,606,317 98,629,348
Total current assets 124,321,985 120,462,497
Operating note receivable (Note 6) 3,227,696 3,155,950Incentive receivable (Note 4) 1,201,114 1,402,127Property and equipment, net (Note 3) 26,993,702 27,591,550
Total assets 155,744,497 $ 152,612,124$
Liabilities and Net Assets
Current liabilities:Accounts payable 3,580,409 $ 1,482,717$ Accrued expenses and other current liabilities 11,167,500 13,948,242Deferred revenue 6,069,411 6,300,587
Total current liabilities 20,817,320 21,731,546
Deferred lease incentive (Note 4) 10,020,665 11,373,018Deferred pension liability (Note 5) 5,644,037 5,134,063
Total liabilities 36,482,022 38,238,627
Unrestricted net assets:Allocated 117,476,818 112,730,294Unallocated 1,785,657 1,643,203
Total unrestricted net assets 119,262,475 114,373,497
Total liabilities and net assets 155,744,497 $ 152,612,124$
See notes to financial statements.
12
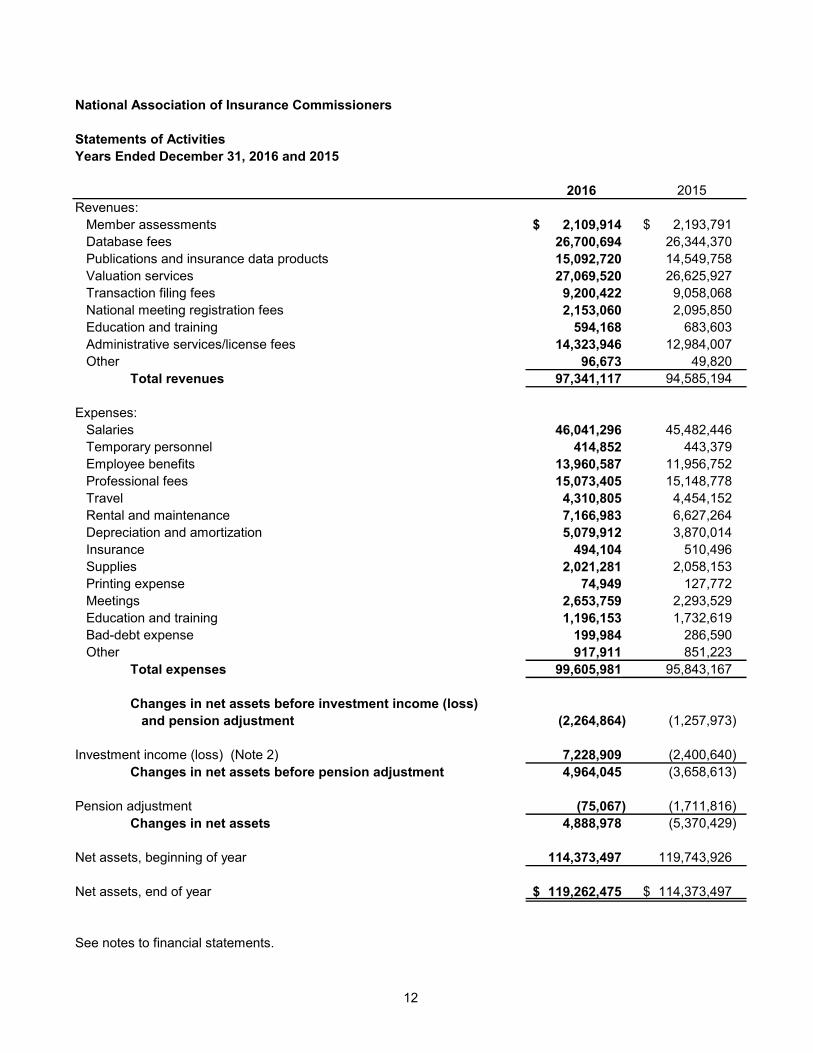
National Association of Insurance Commissioners
Statements of ActivitiesYears Ended December 31, 2016 and 2015
2016 2015Revenues:
Member assessments 2,109,914 $ 2,193,791$ Database fees 26,700,694 26,344,370Publications and insurance data products 15,092,720 14,549,758Valuation services 27,069,520 26,625,927Transaction filing fees 9,200,422 9,058,068National meeting registration fees 2,153,060 2,095,850Education and training 594,168 683,603Administrative services/license fees 14,323,946 12,984,007Other 96,673 49,820
Total revenues 97,341,117 94,585,194
Expenses:Salaries 46,041,296 45,482,446Temporary personnel 414,852 443,379Employee benefits 13,960,587 11,956,752Professional fees 15,073,405 15,148,778Travel 4,310,805 4,454,152Rental and maintenance 7,166,983 6,627,264Depreciation and amortization 5,079,912 3,870,014Insurance 494,104 510,496Supplies 2,021,281 2,058,153Printing expense 74,949 127,772Meetings 2,653,759 2,293,529Education and training 1,196,153 1,732,619Bad-debt expense 199,984 286,590Other 917,911 851,223
Total expenses 99,605,981 95,843,167
Changes in net assets before investment income (loss) and pension adjustment (2,264,864) (1,257,973)
Investment income (loss) (Note 2) 7,228,909 (2,400,640) Changes in net assets before pension adjustment 4,964,045 (3,658,613)
Pension adjustment (75,067) (1,711,816) Changes in net assets 4,888,978 (5,370,429)
Net assets, beginning of year 114,373,497 119,743,926
Net assets, end of year 119,262,475 $ 114,373,497$
See notes to financial statements.
13
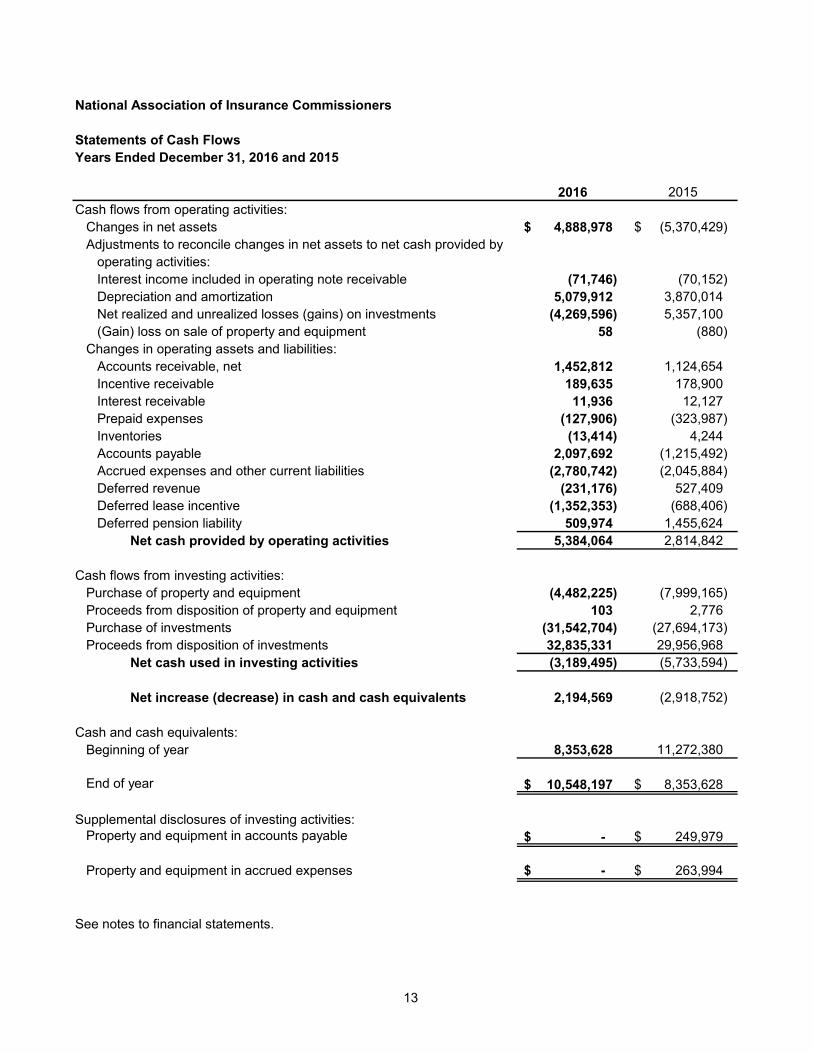
National Association of Insurance Commissioners
Statements of Cash FlowsYears Ended December 31, 2016 and 2015
2016 2015Cash flows from operating activities:
Changes in net assets 4,888,978 $ (5,370,429)$ Adjustments to reconcile changes in net assets to net cash provided by
operating activities:Interest income included in operating note receivable (71,746) (70,152) Depreciation and amortization 5,079,912 3,870,014Net realized and unrealized losses (gains) on investments (4,269,596) 5,357,100(Gain) loss on sale of property and equipment 58 (880)
Changes in operating assets and liabilities:Accounts receivable, net 1,452,812 1,124,654Incentive receivable 189,635 178,900Interest receivable 11,936 12,127Prepaid expenses (127,906) (323,987) Inventories (13,414) 4,244Accounts payable 2,097,692 (1,215,492) Accrued expenses and other current liabilities (2,780,742) (2,045,884) Deferred revenue (231,176) 527,409Deferred lease incentive (1,352,353) (688,406) Deferred pension liability 509,974 1,455,624
Net cash provided by operating activities 5,384,064 2,814,842
Cash flows from investing activities:Purchase of property and equipment (4,482,225) (7,999,165) Proceeds from disposition of property and equipment 103 2,776Purchase of investments (31,542,704) (27,694,173) Proceeds from disposition of investments 32,835,331 29,956,968
Net cash used in investing activities (3,189,495) (5,733,594)
Net increase (decrease) in cash and cash equivalents 2,194,569 (2,918,752)
Cash and cash equivalents:Beginning of year 8,353,628 11,272,380
End of year 10,548,197 $ 8,353,628$
Supplemental disclosures of investing activities:Property and equipment in accounts payable -$ 249,979$
Property and equipment in accrued expenses -$ 263,994$
See notes to financial statements.
National Association of Insurance Commissioners
Notes to Financial Statements
14
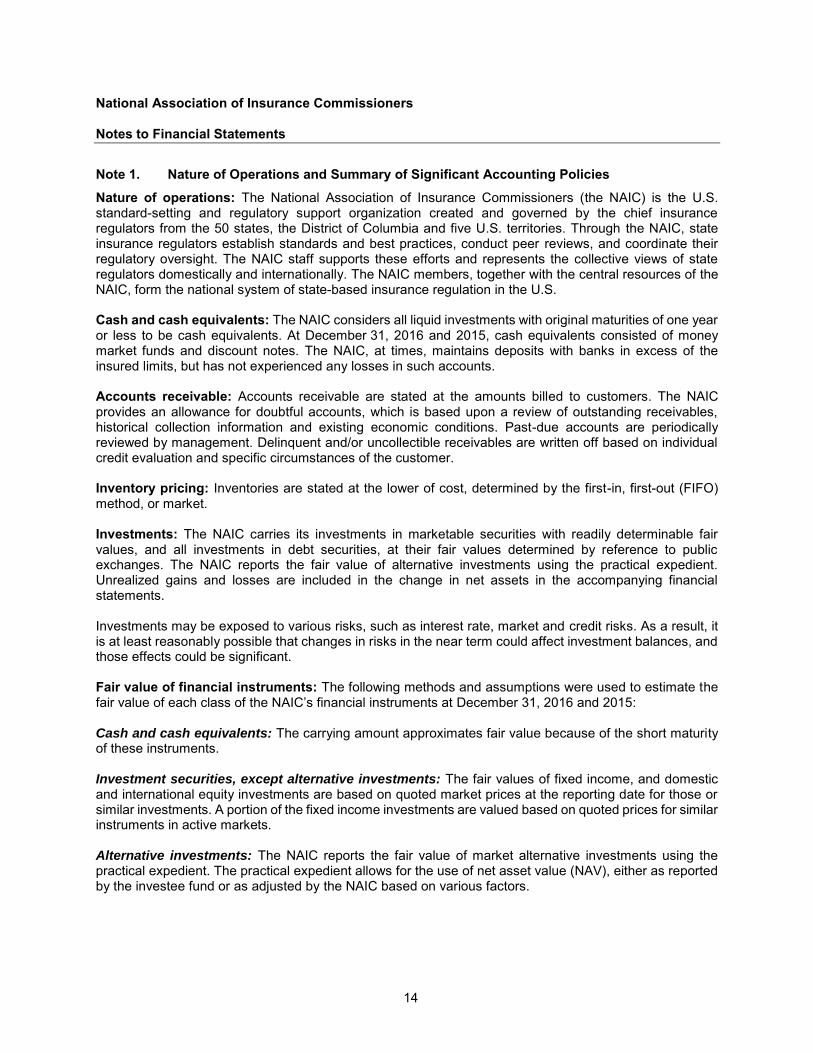
Note 1. Nature of Operations and Summary of Significant Accounting Policies
Nature of operations: The National Association of Insurance Commissioners (the NAIC) is the U.S.standard-setting and regulatory support organization created and governed by the chief insuranceregulators from the 50 states, the District of Columbia and five U.S. territories. Through the NAIC, stateinsurance regulators establish standards and best practices, conduct peer reviews, and coordinate theirregulatory oversight. The NAIC staff supports these efforts and represents the collective views of stateregulators domestically and internationally. The NAIC members, together with the central resources of theNAIC, form the national system of state-based insurance regulation in the U.S.
Cash and cash equivalents: The NAIC considers all liquid investments with original maturities of one yearor less to be cash equivalents. At December 31, 2016 and 2015, cash equivalents consisted of moneymarket funds and discount notes. The NAIC, at times, maintains deposits with banks in excess of theinsured limits, but has not experienced any losses in such accounts.
Accounts receivable: Accounts receivable are stated at the amounts billed to customers. The NAICprovides an allowance for doubtful accounts, which is based upon a review of outstanding receivables,historical collection information and existing economic conditions. Past-due accounts are periodicallyreviewed by management. Delinquent and/or uncollectible receivables are written off based on individualcredit evaluation and specific circumstances of the customer.
Inventory pricing: Inventories are stated at the lower of cost, determined by the first-in, first-out (FIFO)method, or market.
Investments: The NAIC carries its investments in marketable securities with readily determinable fairvalues, and all investments in debt securities, at their fair values determined by reference to publicexchanges. The NAIC reports the fair value of alternative investments using the practical expedient.Unrealized gains and losses are included in the change in net assets in the accompanying financialstatements.
Investments may be exposed to various risks, such as interest rate, market and credit risks. As a result, itis at least reasonably possible that changes in risks in the near term could affect investment balances, andthose effects could be significant.
Fair value of financial instruments: The following methods and assumptions were used to estimate thefair value of each class of the NAIC’s financial instruments at December 31, 2016 and 2015:
Cash and cash equivalents: The carrying amount approximates fair value because of the short maturityof these instruments.
Investment securities, except alternative investments: The fair values of fixed income, and domesticand international equity investments are based on quoted market prices at the reporting date for those orsimilar investments. A portion of the fixed income investments are valued based on quoted prices for similarinstruments in active markets.
Alternative investments: The NAIC reports the fair value of market alternative investments using thepractical expedient. The practical expedient allows for the use of net asset value (NAV), either as reportedby the investee fund or as adjusted by the NAIC based on various factors.

National Association of Insurance Commissioners
Notes to Financial Statements
15
Note 1. Nature of Operations and Summary of Significant Accounting Policies (Continued)
Fair value measurements: Fair value is defined as the price that would be received to sell an asset orpaid to transfer a liability in an orderly transaction between market participants at the measurement date inits principal market, or in the absence of a principal market, the most advantageous market for theinvestment or liability. The NAIC accounts for its investments at fair value. In accordance with the guidance,the NAIC has categorized its investments based on the priority of the inputs to the valuation technique,which gives the highest priority to unadjusted quoted prices in active markets for identical assets (Level 1measurements) and the lowest priority to unobservable inputs (Level 3 measurements). The three levels ofthe fair value hierarchy are described below:
Level 1: Quoted prices for identical instruments traded in active markets
Level 2: Quoted prices for similar instruments in active markets; quoted prices for identical or similarinstruments in inactive markets; or derived from inputs that are observable
Level 3: Valuations for assets and liabilities that are derived from other valuation methodologies, includingoption pricing models, discounted cash flow models and similar techniques, and not based onmarket exchange, dealer or broker trade transactions. Level 3 valuations incorporate certainassumptions and projections in determining the fair value assigned to such assets or liabilities
Investments and concentrations of credit risk: Financial instruments that potentially subject the NAICto significant concentrations of credit risk consist principally of cash and investments. The NAIC maintainsdeposits in financial institutions in excess of federally insured limits. Management monitors the soundnessof these financial institutions and believes the NAIC’s risk is negligible.
Alternative investments are redeemable with the fund at net asset value under the original terms of thepartnership and/or subscription agreements. However, it is possible that these redemption rights may berestricted or eliminated by the funds in the future, in accordance with the fund agreements. Due to thenature of the investments held by the funds, changes in market conditions and the economic environmentmay significantly impact the net asset value of the funds and, consequently, the fair value of the NAIC’sinterests in the funds. Although a secondary market exists for these investments, it is not active andindividual transactions are typically not observable. When transactions do occur in this limited secondarymarket, they may occur at discounts to the reported net asset value. It is therefore reasonably possible thatif the NAIC were to sell these investments in the secondary market, a buyer may require a discount to thereported net asset value, and the discount could be significant.
Property and equipment: Property and equipment are stated at cost. Depreciation is computed using thestraight-line method over the estimated useful life of each asset. Leasehold improvements are depreciatedover the shorter of the lease term or their respective estimated useful lives.
The cost of internally developed software is expensed until the technological feasibility of the software hasbeen established. Thereafter, all software development costs are capitalized until such time as the productis available for general release to customers. The development costs of enhancements that extend the lifeor improve the marketability of the original product are capitalized. The establishment of technologicalfeasibility and the ongoing assessment of recoverability of capitalized software development costs requireconsiderable judgment by management with respect to certain external factors, including, but not limitedto, anticipated future revenues, estimated economic life and changes in software and hardwaretechnologies. The cost of capitalized software is amortized on the straight-line method over the products’estimated useful lives.
National Association of Insurance Commissioners
Notes to Financial Statements
16
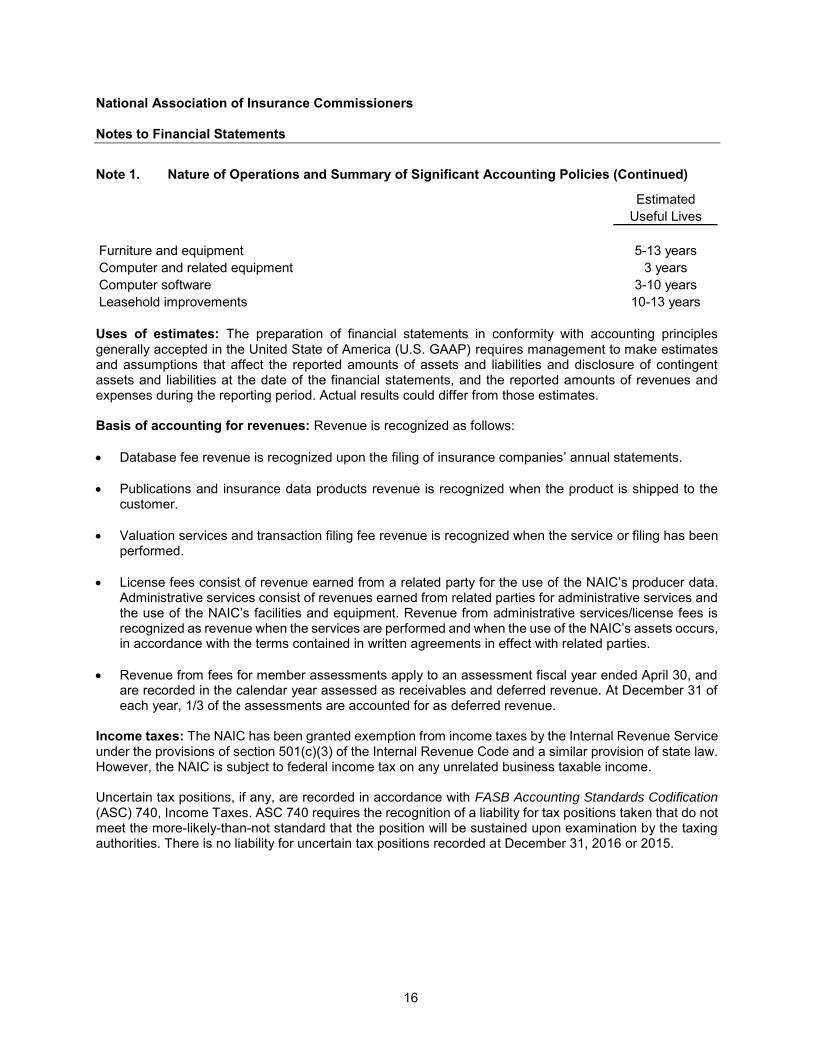
Note 1. Nature of Operations and Summary of Significant Accounting Policies (Continued)
EstimatedUseful Lives
Furniture and equipment 5-13 yearsComputer and related equipment 3 yearsComputer software 3-10 yearsLeasehold improvements 10-13 years
Uses of estimates: The preparation of financial statements in conformity with accounting principlesgenerally accepted in the United State of America (U.S. GAAP) requires management to make estimatesand assumptions that affect the reported amounts of assets and liabilities and disclosure of contingentassets and liabilities at the date of the financial statements, and the reported amounts of revenues andexpenses during the reporting period. Actual results could differ from those estimates.
Basis of accounting for revenues: Revenue is recognized as follows:
Database fee revenue is recognized upon the filing of insurance companies’ annual statements.
Publications and insurance data products revenue is recognized when the product is shipped to thecustomer.
Valuation services and transaction filing fee revenue is recognized when the service or filing has beenperformed.
License fees consist of revenue earned from a related party for the use of the NAIC’s producer data.Administrative services consist of revenues earned from related parties for administrative services andthe use of the NAIC’s facilities and equipment. Revenue from administrative services/license fees isrecognized as revenue when the services are performed and when the use of the NAIC’s assets occurs,in accordance with the terms contained in written agreements in effect with related parties.
Revenue from fees for member assessments apply to an assessment fiscal year ended April 30, andare recorded in the calendar year assessed as receivables and deferred revenue. At December 31 ofeach year, 1/3 of the assessments are accounted for as deferred revenue.
Income taxes: The NAIC has been granted exemption from income taxes by the Internal Revenue Serviceunder the provisions of section 501(c)(3) of the Internal Revenue Code and a similar provision of state law.However, the NAIC is subject to federal income tax on any unrelated business taxable income.
Uncertain tax positions, if any, are recorded in accordance with FASB Accounting Standards Codification
(ASC) 740, Income Taxes. ASC 740 requires the recognition of a liability for tax positions taken that do notmeet the more-likely-than-not standard that the position will be sustained upon examination by the taxingauthorities. There is no liability for uncertain tax positions recorded at December 31, 2016 or 2015.
National Association of Insurance Commissioners
Notes to Financial Statements
17
Note 1. Nature of Operations and Summary of Significant Accounting Policies (Continued)
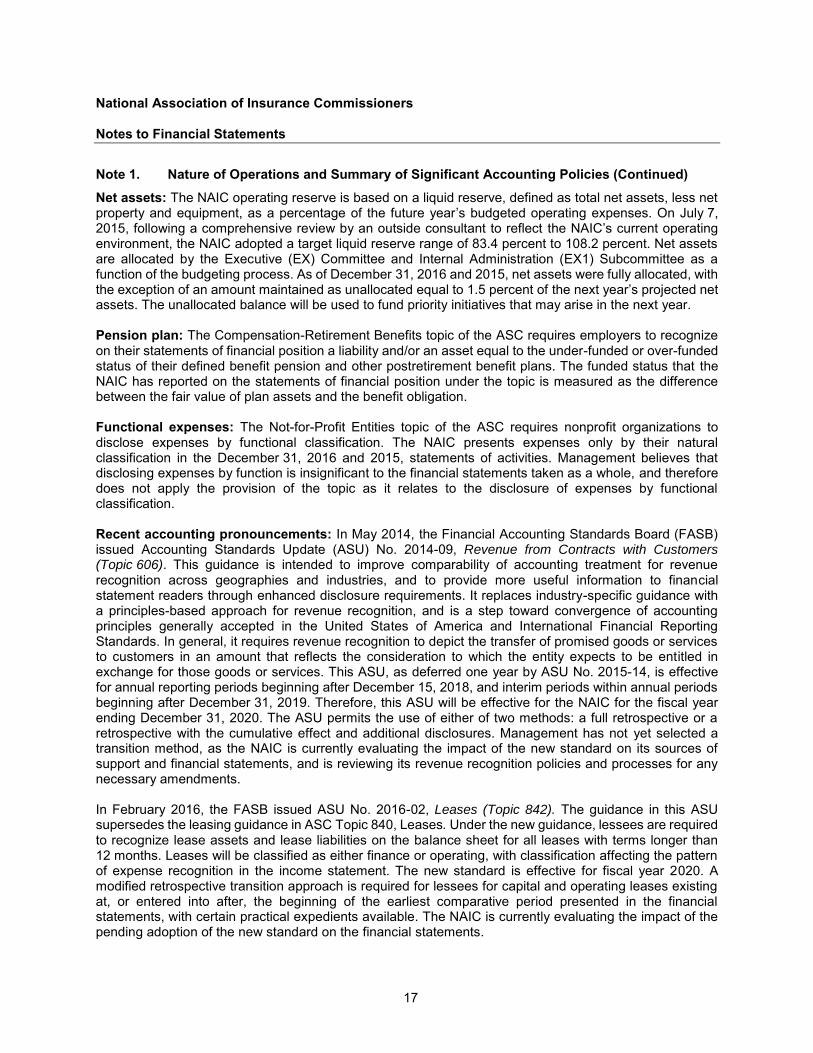
Net assets: The NAIC operating reserve is based on a liquid reserve, defined as total net assets, less netproperty and equipment, as a percentage of the future year’s budgeted operating expenses. On July 7,2015, following a comprehensive review by an outside consultant to reflect the NAIC’s current operatingenvironment, the NAIC adopted a target liquid reserve range of 83.4 percent to 108.2 percent. Net assetsare allocated by the Executive (EX) Committee and Internal Administration (EX1) Subcommittee as afunction of the budgeting process. As of December 31, 2016 and 2015, net assets were fully allocated, withthe exception of an amount maintained as unallocated equal to 1.5 percent of the next year’s projected netassets. The unallocated balance will be used to fund priority initiatives that may arise in the next year.
Pension plan: The Compensation-Retirement Benefits topic of the ASC requires employers to recognizeon their statements of financial position a liability and/or an asset equal to the under-funded or over-fundedstatus of their defined benefit pension and other postretirement benefit plans. The funded status that theNAIC has reported on the statements of financial position under the topic is measured as the differencebetween the fair value of plan assets and the benefit obligation.
Functional expenses: The Not-for-Profit Entities topic of the ASC requires nonprofit organizations todisclose expenses by functional classification. The NAIC presents expenses only by their naturalclassification in the December 31, 2016 and 2015, statements of activities. Management believes thatdisclosing expenses by function is insignificant to the financial statements taken as a whole, and thereforedoes not apply the provision of the topic as it relates to the disclosure of expenses by functionalclassification.
Recent accounting pronouncements: In May 2014, the Financial Accounting Standards Board (FASB)issued Accounting Standards Update (ASU) No. 2014-09, Revenue from Contracts with Customers (Topic 606). This guidance is intended to improve comparability of accounting treatment for revenuerecognition across geographies and industries, and to provide more useful information to financialstatement readers through enhanced disclosure requirements. It replaces industry-specific guidance witha principles-based approach for revenue recognition, and is a step toward convergence of accountingprinciples generally accepted in the United States of America and International Financial ReportingStandards. In general, it requires revenue recognition to depict the transfer of promised goods or servicesto customers in an amount that reflects the consideration to which the entity expects to be entitled inexchange for those goods or services. This ASU, as deferred one year by ASU No. 2015-14, is effectivefor annual reporting periods beginning after December 15, 2018, and interim periods within annual periodsbeginning after December 31, 2019. Therefore, this ASU will be effective for the NAIC for the fiscal yearending December 31, 2020. The ASU permits the use of either of two methods: a full retrospective or aretrospective with the cumulative effect and additional disclosures. Management has not yet selected atransition method, as the NAIC is currently evaluating the impact of the new standard on its sources ofsupport and financial statements, and is reviewing its revenue recognition policies and processes for anynecessary amendments.
In February 2016, the FASB issued ASU No. 2016-02, Leases (Topic 842). The guidance in this ASUsupersedes the leasing guidance in ASC Topic 840, Leases. Under the new guidance, lessees are requiredto recognize lease assets and lease liabilities on the balance sheet for all leases with terms longer than12 months. Leases will be classified as either finance or operating, with classification affecting the patternof expense recognition in the income statement. The new standard is effective for fiscal year 2020. Amodified retrospective transition approach is required for lessees for capital and operating leases existingat, or entered into after, the beginning of the earliest comparative period presented in the financialstatements, with certain practical expedients available. The NAIC is currently evaluating the impact of thepending adoption of the new standard on the financial statements.
National Association of Insurance Commissioners
Notes to Financial Statements
18
Note 1. Nature of Operations and Summary of Significant Accounting Policies (Continued)
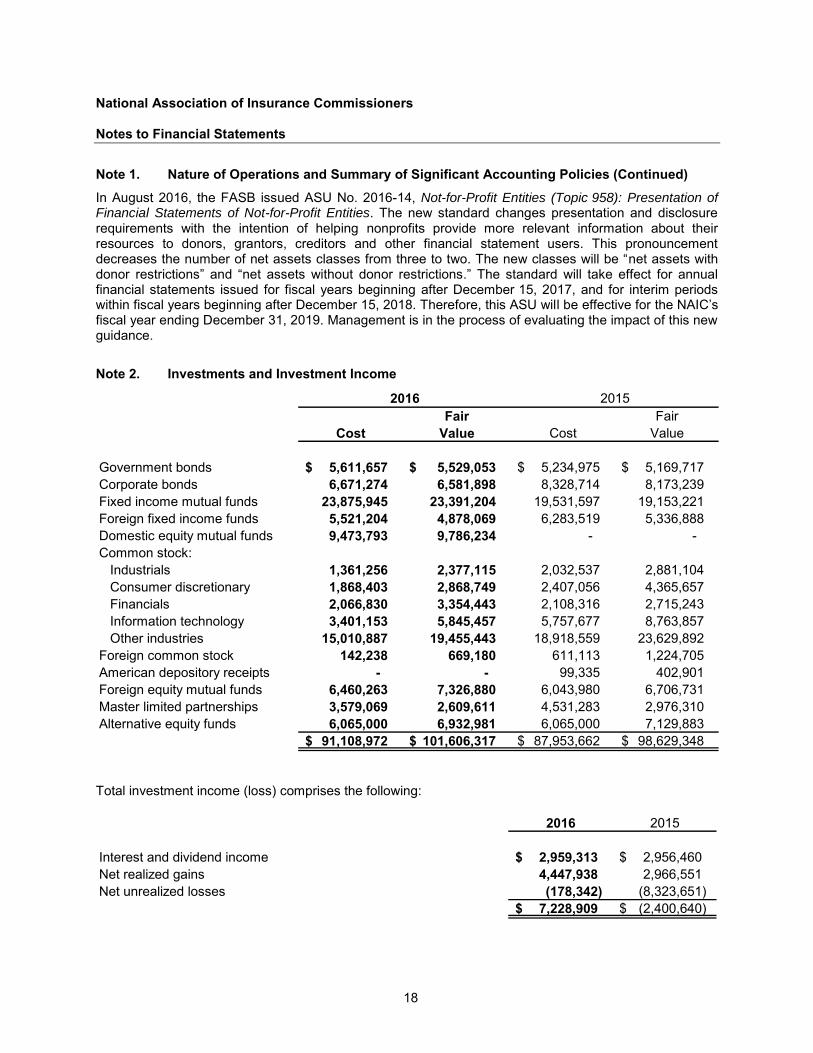
In August 2016, the FASB issued ASU No. 2016-14, Not-for-Profit Entities (Topic 958): Presentation of Financial Statements of Not-for-Profit Entities. The new standard changes presentation and disclosurerequirements with the intention of helping nonprofits provide more relevant information about theirresources to donors, grantors, creditors and other financial statement users. This pronouncementdecreases the number of net assets classes from three to two. The new classes will be “net assets withdonor restrictions” and “net assets without donor restrictions.” The standard will take effect for annual financial statements issued for fiscal years beginning after December 15, 2017, and for interim periodswithin fiscal years beginning after December 15, 2018. Therefore, this ASU will be effective for the NAIC’s fiscal year ending December 31, 2019. Management is in the process of evaluating the impact of this newguidance.
Note 2. Investments and Investment Income
Fair FairCost Value Cost Value
Government bonds 5,611,657 $ 5,529,053 $ 5,234,975$ 5,169,717$ Corporate bonds 6,671,274 6,581,898 8,328,714 8,173,239Fixed income mutual funds 23,875,945 23,391,204 19,531,597 19,153,221Foreign fixed income funds 5,521,204 4,878,069 6,283,519 5,336,888Domestic equity mutual funds 9,473,793 9,786,234 - - Common stock:
Industrials 1,361,256 2,377,115 2,032,537 2,881,104Consumer discretionary 1,868,403 2,868,749 2,407,056 4,365,657Financials 2,066,830 3,354,443 2,108,316 2,715,243Information technology 3,401,153 5,845,457 5,757,677 8,763,857Other industries 15,010,887 19,455,443 18,918,559 23,629,892
Foreign common stock 142,238 669,180 611,113 1,224,705American depository receipts - - 99,335 402,901Foreign equity mutual funds 6,460,263 7,326,880 6,043,980 6,706,731Master limited partnerships 3,579,069 2,609,611 4,531,283 2,976,310Alternative equity funds 6,065,000 6,932,981 6,065,000 7,129,883
91,108,972 $ 101,606,317 $ 87,953,662$ 98,629,348$
2016 2015
Total investment income (loss) comprises the following:
2016 2015
Interest and dividend income 2,959,313 $ 2,956,460$ Net realized gains 4,447,938 2,966,551 Net unrealized losses (178,342) (8,323,651)
7,228,909 $ (2,400,640)$
National Association of Insurance Commissioners
Notes to Financial Statements
19
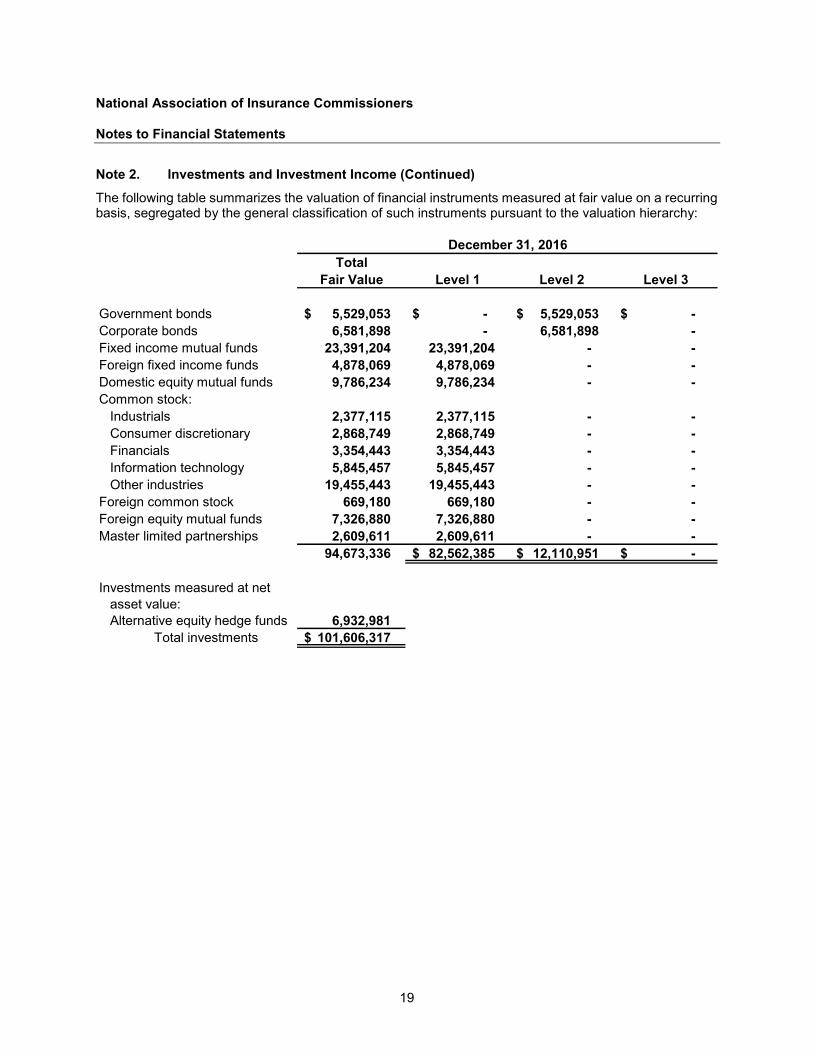
Note 2. Investments and Investment Income (Continued)
The following table summarizes the valuation of financial instruments measured at fair value on a recurringbasis, segregated by the general classification of such instruments pursuant to the valuation hierarchy:
TotalFair Value Level 1 Level 2 Level 3
Government bonds 5,529,053 $ -$ 5,529,053$ -$ Corporate bonds 6,581,898 - 6,581,898 - Fixed income mutual funds 23,391,204 23,391,204 - - Foreign fixed income funds 4,878,069 4,878,069 - - Domestic equity mutual funds 9,786,234 9,786,234 - - Common stock:
Industrials 2,377,115 2,377,115 - - Consumer discretionary 2,868,749 2,868,749 - - Financials 3,354,443 3,354,443 - - Information technology 5,845,457 5,845,457 - - Other industries 19,455,443 19,455,443 - -
Foreign common stock 669,180 669,180 - - Foreign equity mutual funds 7,326,880 7,326,880 - - Master limited partnerships 2,609,611 2,609,611 - -
94,673,336 82,562,385 $ 12,110,951 $ -$
Investments measured at netasset value:Alternative equity hedge funds 6,932,981
Total investments 101,606,317 $
December 31, 2016
National Association of Insurance Commissioners
Notes to Financial Statements
20
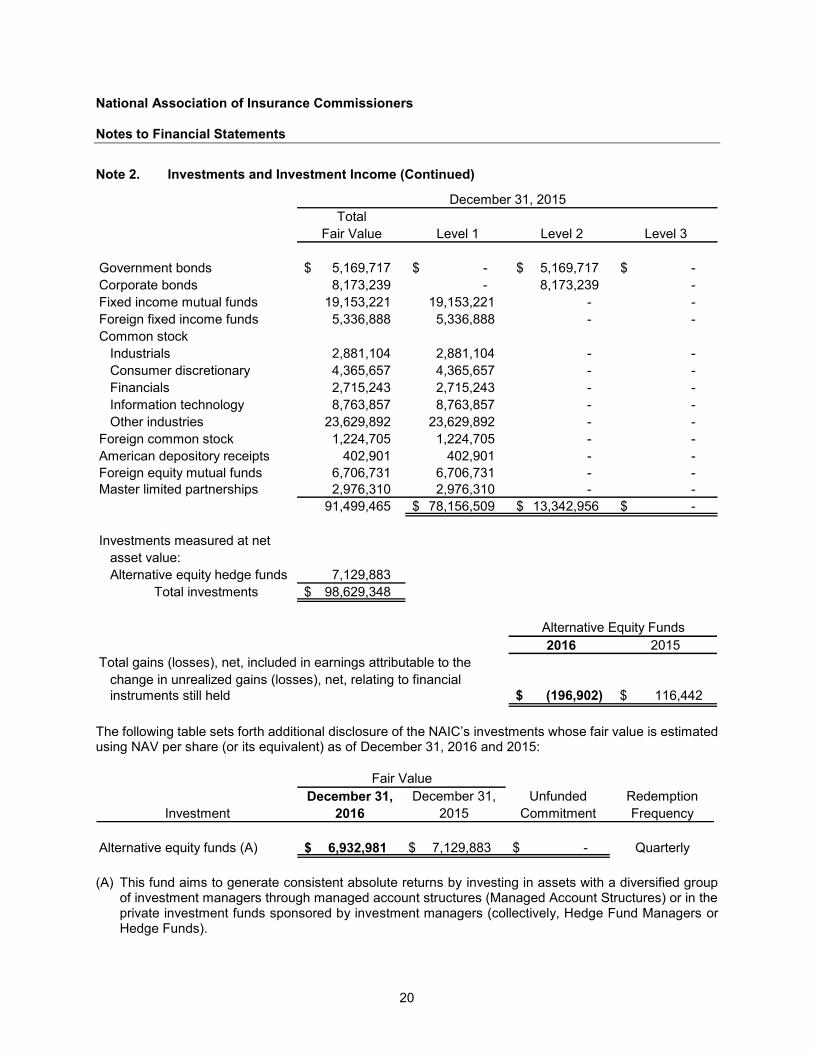
Note 2. Investments and Investment Income (Continued)
TotalFair Value Level 1 Level 2 Level 3
Government bonds 5,169,717$ -$ 5,169,717$ -$ Corporate bonds 8,173,239 - 8,173,239 - Fixed income mutual funds 19,153,221 19,153,221 - - Foreign fixed income funds 5,336,888 5,336,888 - - Common stock
Industrials 2,881,104 2,881,104 - - Consumer discretionary 4,365,657 4,365,657 - - Financials 2,715,243 2,715,243 - - Information technology 8,763,857 8,763,857 - - Other industries 23,629,892 23,629,892 - -
Foreign common stock 1,224,705 1,224,705 - - American depository receipts 402,901 402,901 - - Foreign equity mutual funds 6,706,731 6,706,731 - - Master limited partnerships 2,976,310 2,976,310 - -
91,499,465 78,156,509$ 13,342,956$ -$
Investments measured at netasset value:Alternative equity hedge funds 7,129,883
Total investments 98,629,348$
December 31, 2015
2016 2015Total gains (losses), net, included in earnings attributable to the
change in unrealized gains (losses), net, relating to financialinstruments still held (196,902) $ 116,442$
Alternative Equity Funds
The following table sets forth additional disclosure of the NAIC’s investments whose fair value is estimatedusing NAV per share (or its equivalent) as of December 31, 2016 and 2015:
December 31, December 31, Unfunded RedemptionInvestment 2016 2015 Commitment Frequency
Alternative equity funds (A) 6,932,981 $ 7,129,883$ -$ Quarterly
Fair Value
(A) This fund aims to generate consistent absolute returns by investing in assets with a diversified groupof investment managers through managed account structures (Managed Account Structures) or in theprivate investment funds sponsored by investment managers (collectively, Hedge Fund Managers orHedge Funds).

National Association of Insurance Commissioners
Notes to Financial Statements
21
Note 3. Property and Equipment
Property and equipment at December 31 consisted of the following:
2016 2015
Furniture and equipment 5,410,732 $ 5,971,484$ Computer and related equipment 11,289,661 15,382,275 Computer software 35,237,705 32,254,237 Leasehold improvements 18,293,345 17,781,277
70,231,443 71,389,273 Less accumulated depreciation and amortization 43,237,741 43,797,723
26,993,702 $ 27,591,550$
Note 4. Operating Leases
The NAIC leases its office space in Kansas City, New York, and Washington, D.C. under noncancellableoperating leases. Certain parts of the agreements contain escalation clauses providing increased rentalsbased on maintenance, utility and tax increases. The NAIC also leases certain office equipment undernoncancellable operating leases, which expire at various dates through 2016. The accompanying financialstatements reflect rent expense on the straight-line method over the terms of the leases. Total rentalexpenses under all leases for the years ended December 31, 2016 and 2015, were $2,723,047 and$2,503,132, respectively.
The Kansas City office space lease includes various lease incentives, free rent and scheduled rentincreases. The lessor agreed to pay the NAIC base rental differential payments totaling $2,390,571 plus6 percent interest over the course of the initial lease term. Annual payments of $285,140 are being madeto the NAIC through fiscal year 2022. The outstanding noncurrent principal balance of this receivable isreported as an incentive receivable on the statements of financial position and had a balance of $1,201,114and $1,402,127 as of December 31, 2016 and 2015, respectively. This outstanding receivable is beingrecognized in the statements of activities on a straight-line basis over the life of the lease and is includedin the deferred lease incentive described below.
Deferred lease incentives consist primarily of reimbursements for leasehold improvements, parking costsand moving costs. U.S. GAAP requires that the above items be recognized as a reduction of rental expenseover the term of the lease. The unamortized balance in deferred lease incentive was $10,020,665 and$11,373,018 as of December 31, 2016 and 2015, respectively.
Future minimum lease payments at December 31, 2016, are as follows:
Years ending December 31:2017 3,711,196$ 2018 3,730,102 2019 3,750,093 2020 3,769,956 2021 3,780,816 Thereafter 10,222,873
Total future minimum lease payments 28,965,036$

National Association of Insurance Commissioners
Notes to Financial Statements
22
Note 5. Employee Retirement Plans
The NAIC has a noncontributory defined benefit plan covering all employees with a hire date prior toJanuary 1, 2000. As of December 31, 2012, accrued benefits for all active participants were frozen. Thebenefits are based on years of service and the employee’s compensation prior to January 1, 2013.
The following table sets forth the plan’s funding status, amount recognized in the NAIC’s financialstatements, and other required disclosures:
2016 2015
Projected benefit obligation (48,846,489) $ (46,176,278)$ Fair value of plan assets 43,202,452 41,042,215
Funded status of plan (5,644,037) $ (5,134,063)$
Accrued benefit cost recognized in the statements of financialposition (5,644,037) $ (5,134,063)$
Accumulated benefit obligation 48,846,489 $ 46,176,278$
Employer contributions -$ -$
Plan settlements -$ -$
Benefits paid (1,624,458) $ (2,089,846)$
Interest cost 1,863,934 $ 1,729,456$ Return on plan assets (2,420,076) (2,716,600) Amortization of net loss 991,049 730,952
Net pension (benefit) cost 434,907 $ (256,192)$
Weighted average assumptions used to determine benefit obligations are as follows:
2016 2015
Discount rate 3.95% 4.25%Salary rate N/A N/AMeasurement date December 31, 2016 December 31, 2015
Weighted average assumptions used to determine net pension costs are as follows:
2016 2015
Discount rate 4.25% 3.80%Salary rate N/A N/AExpected return on plan assets 6.25% 6.50%Measurement date December 31, 2016 December 31, 2015

National Association of Insurance Commissioners
Notes to Financial Statements
23
Note 5. Employee Retirement Plans (Continued)
The expected rate of return on plan assets is determined by those assets’ historical long-term investmentperformance, current asset allocation and estimates of future long-term returns by asset class.
The following is the plan’s weighted average asset allocation by asset category as of December 31, 2016and 2015 (the measurement date of the plan assets):
2016 2015
Equity securities 51.90% 48.46%Debt securities 48.10% 51.54%
Plan assets are held by an insurance company, which invests the plan assets in accordance with theprovisions of the plan agreement. The plan agreement permits investment in common stocks, corporatebonds, U.S. government securities and other specified investments, based on certain target allocationpercentages. Asset allocation is primarily based on a strategy to provide stable earnings while stillpermitting the plan to recognize potentially higher returns through a limited investment in equity securities.Plan assets are rebalanced as necessary based upon the minimum and maximum restrictions set forth inthe plan’s investment policy statement. Plan assets are valued using Level 1 inputs and are based onunadjusted quoted market prices within active markets.
The benefits expected to be paid to participants over the next 10 years, as of December 31, 2016, are asfollows:
Years ending December 31:2017 3,273,902$ 2018 3,690,213 2019 4,054,101 2020 4,182,903 2021 3,937,732 2022-2026 17,209,974
Total 36,348,825$
The annual amount is actuarially calculated by the NAIC’s independent consultant firm and represents theamount necessary to fully fund the actuarial accrued liability and normal cost of the plan.
The NAIC provides a defined contribution 401(a) plan (Plan B) that covers substantially all employees withone year or more of service. Each year, the Executive Committee and (EX1) Internal AdministrationSubcommittee determine the contribution for the next year. The NAIC matched up to 5.5 and 4.5 percentof compensation of employees who contributed to Plan B and contributed 3.0 percent of all employees’compensation in 2016 and 2015, respectively. The pension expense related to Plan B for the years endedDecember 31, 2016 and 2015, was $3,066,114 and $2,567,998, respectively.
National Association of Insurance Commissioners
Notes to Financial Statements
24
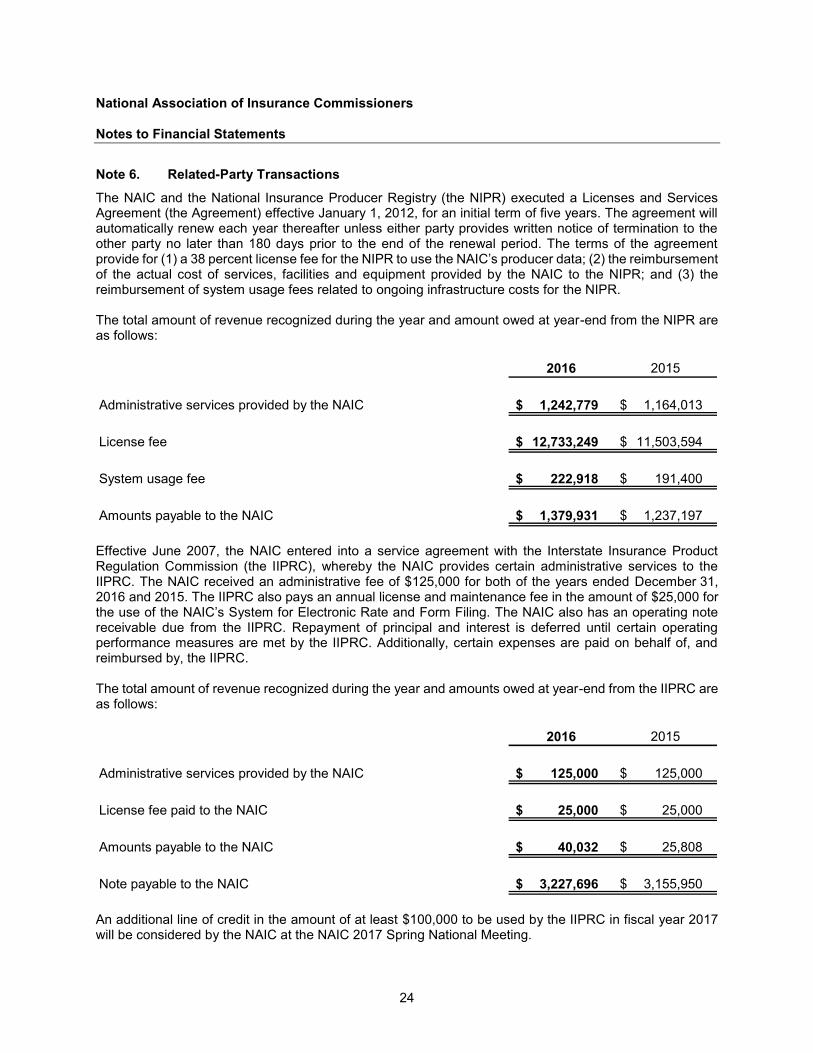
Note 6. Related-Party Transactions
The NAIC and the National Insurance Producer Registry (the NIPR) executed a Licenses and ServicesAgreement (the Agreement) effective January 1, 2012, for an initial term of five years. The agreement willautomatically renew each year thereafter unless either party provides written notice of termination to theother party no later than 180 days prior to the end of the renewal period. The terms of the agreementprovide for (1) a 38 percent license fee for the NIPR to use the NAIC’s producer data; (2) the reimbursementof the actual cost of services, facilities and equipment provided by the NAIC to the NIPR; and (3) thereimbursement of system usage fees related to ongoing infrastructure costs for the NIPR.
The total amount of revenue recognized during the year and amount owed at year-end from the NIPR areas follows:
2016 2015
Administrative services provided by the NAIC 1,242,779 $ 1,164,013$
License fee 12,733,249 $ 11,503,594$
System usage fee 222,918 $ 191,400$
Amounts payable to the NAIC 1,379,931 $ 1,237,197$
Effective June 2007, the NAIC entered into a service agreement with the Interstate Insurance ProductRegulation Commission (the IIPRC), whereby the NAIC provides certain administrative services to theIIPRC. The NAIC received an administrative fee of $125,000 for both of the years ended December 31,2016 and 2015. The IIPRC also pays an annual license and maintenance fee in the amount of $25,000 forthe use of the NAIC’s System for Electronic Rate and Form Filing. The NAIC also has an operating notereceivable due from the IIPRC. Repayment of principal and interest is deferred until certain operatingperformance measures are met by the IIPRC. Additionally, certain expenses are paid on behalf of, andreimbursed by, the IIPRC.
The total amount of revenue recognized during the year and amounts owed at year-end from the IIPRC areas follows:
2016 2015
Administrative services provided by the NAIC 125,000 $ 125,000$
License fee paid to the NAIC 25,000 $ 25,000$
Amounts payable to the NAIC 40,032 $ 25,808$
Note payable to the NAIC 3,227,696 $ 3,155,950$
An additional line of credit in the amount of at least $100,000 to be used by the IIPRC in fiscal year 2017will be considered by the NAIC at the NAIC 2017 Spring National Meeting.

National Association of Insurance Commissioners
Notes to Financial Statements
25
Note 7. Contingencies
The NAIC is, from time to time, subject to claims and lawsuits arising in the ordinary course of business.Although the ultimate disposition of such proceedings is not presently determinable, management does notcurrently believe the ultimate resolution of these matters will have a material adverse effect on the financialcondition, results of operations or cash flows of the NAIC.
Note 8. Subsequent Events
Management has performed an evaluation of events that have occurred subsequent to December 31, 2016,through February 16, 2017, which is the date the financial statements were available to be issued. Nosignificant matters were identified for disclosure during this evaluation.