Embed Size (px)
Citation preview
Audited annual financial statements 2018
ArcelorMittal South Africa Audited Annual Financial Statem
ents 2018

Contents
FeedbackWe value feedback from our stakeholders and use it to ensure that we are reporting appropriately on the issues that are most relevant to them.Please take the time to give us your feedback on this report. Visit the web link: https://southafrica.arcelormittal.com/InvestorRelations/Emailus.aspx
View this report onlinehttps://southafrica.arcelormittal.com/InvestorRelations/AnnualFinancialStatements.aspx
View the integrated annual reporthttps://southafrica.arcelormittal.com/InvestorRelations/IntegratedAnnualReport.aspx
Contents to financial report
1 Directors’ responsibility and approval of the group and company annual financial statements
1 Certificate by the company secretary 2 Directors’ report5 Audit and risk committee report7 Report of the independent auditor
12 Group and company statements of comprehensive income13 Group and company statements of financial position14 Group and company statements of cash flows15 Group and company statements of changes in equity18 Notes to the group and company annual financial statementsIBC Corporate information
Our business
Directors’ responsibility and approval of the group and company annual financial statements
Certificate by the company secretary
To the shareholders of ArcelorMittal South Africa LtdThe board of directors (directors) is required to maintain adequate accounting records and is responsible for the content and integrity of the consolidated (group) and company annual financial statements (annual financial statements) and related financial information included in this report. It is their responsibility to ensure that the annual financial statements, comprising the statements of financial position as at 31 December 2018, the statements of comprehensive income, cash flows, changes in equity for the year then ended, and the notes to the annual financial statements, which include a summary of significant accounting policies and other explanatory notes, are prepared in accordance with International Financial Reporting Standards (IFRS), SAICA Financial Reporting Guides as issued by the Accounting Practices Committee and Financial Pronouncements as issued by the Financial Reporting Standards Council, audited in accordance with International Standards on Auditing, the requirements of the Companies Act No 71 of 2008, as amended (Companies Act) and JSE Listings Requirements. The annual financial statements have been prepared by the finance staff of ArcelorMittal South Africa Ltd headed and supervised by AD Maharaj CA(SA), the group’s chief financial officer.
In order for the directors to discharge their responsibilities, management has developed and continues to maintain a system of internal control aimed at reducing the risk of error or loss in a cost-effective manner. The directors, primarily through the audit and risk committee, which consists of independent non-executive directors, meet periodically with the external and internal auditors, as well as executive management to evaluate matters concerning accounting policies, internal control, auditing and financial reporting. The group’s internal auditors independently evaluate the internal controls. The external auditors are responsible for reporting on the financial statements. The external and internal auditors have unrestricted access to all records, property and personnel as well as to the audit and risk committee. The directors are not aware of any material breakdown in the functioning of these controls and systems during the period under review.
The directors are of the opinion, based on the information and explanations given by management and the internal auditors, that the system of internal control provides reasonable assurance that the financial records may be relied on for the preparation of the group and company annual financial statements. However, any system of internal financial control can provide only reasonable and not absolute assurance against material misstatement or loss.
The directors have reviewed the group and company’s financial budgets for the year to 31 December 2019. In light of their review of the current financial position and existing borrowing facilities, they consider it appropriate that the group and company annual financial statements continue to be prepared on the going concern basis. Refer to note 38 and the directors’ report for further details.
The annual financial statements for the year ended 31 December 2018 have been audited by Deloitte & Touche, the company’s independent external auditors, whose report can be found on pages 7 to 11.
The directors of the company accept responsibility for the annual financial statements which were approved by the board of directors on 27 March 2019 and are signed on its behalf by:
HJ Verster AD MaharajChief executive officer Chief financial officer
In terms of section 88(2)(e) of the Companies Act, I certify that, to the best of my knowledge and belief, the company has, in respect of the financial year reported upon, lodged with the Companies Intellectual Property Commission all returns and notices required of a public company and that all such returns are true, correct and up to date.
NB BamCompany secretary27 March 2019
ArcelorMittal South Africa Audited Annual Financial Statements 2018 1
Audited Annual Financial Statements
Directors’ report
The directors submit their report for the year ended 31 December 2018.
Nature of businessArcelorMittal South Africa Ltd (ArcelorMittal South Africa) and its subsidiaries (together, the group) manufacture and sell long and flat steel products and beneficiated by-products. The group’s operations are primarily concentrated in South Africa with a sales focus domestically and internationally, with specific emphasis on sub-Saharan Africa.
The company is a public company incorporated and domiciled in South Africa. The address of the registered office is detailed on the inside of the back cover of this report.
The company is listed on the main board of the Johannesburg Stock Exchange Ltd (JSE Ltd) in Johannesburg, South Africa, and is a subsidiary of ArcelorMittal Holdings AG, which is part of the ArcelorMittal group, and the functional and reporting currency is the South African rand (ZAR).
Financial results and activitiesThe contents of the annual financial statements adequately reflect the financial performance of the group for the financial year ended 31 December 2018.
Further detailed reports on the activities and performance of the group and the various segments of the group are contained in the integrated annual report.
At 31 December 2018 the group had a net asset value per share of 728 cents (2017: 737 cents). The net asset value per share was calculated using a net asset value of R7 961 million (2017: R8 058 million), and total number of shares outstanding of 1 093 509 570 (2017: 1 093 509 570).
Refer to note 12 of the annual financial statements for information on profit/(loss) and headline earnings/(loss) per share.
DividendsConsistent with the group’s dividend policy payment of dividends are subject to the discretion of the board. No dividends were declared for the 2018 and 2017 financial years.
Sale of MacsteelThe group sold its 50% interest in Macsteel International Holdings BV (MIHBV) to Macsteel Holdings Luxembourg SARL (MacHold) for USD220 million (R3 221 million). MIHBV was a long-standing joint venture between MacHold and ArcelorMittal South Africa which is largely focused on international steel trading and shipping. While it remains an important source of steel products, ArcelorMittal South Africa supplies less than 20% of the total tonnage traded and less than 2% of volumes shipped by MIHBV.
The commercial relationship between MIHBV and ArcelorMittal South Africa will continue through a new, four-year marketing agreement. The sale of shares and marketing agreements were effective on 1 November 2018 when all the conditions precedent were fulfilled. The proceeds of this sale significantly strengthened the statement of financial position and cash flow position. This is an important achievement as part of the group’s strategy to improve the sustainability of the business. Refer to note 11 for details of this transaction.
Regulatory mattersThe Carbon Tax Bill was approved by the National Assembly in February 2019. The announced implementation date is from 1 June 2019. The estimated financial impact on the group and company is approximately R300 million annually. However, two sets of related regulations, currently being prepared by authorities and likely to be published in the second quarter of 2019, could have an effect of slightly lessening this liability.
The group has been informed that there is an intention to institute criminal proceedings against the group on account of three alleged transgressions of its atmospheric admission licence at its Vanderbijlpark operations. The prosecution has agreed that the group would first be afforded an opportunity to meet and to make representations before proceeding with the prosecution. This process has not been concluded. In the event that the matter proceeds, and if there is an adverse finding regarding all these transgressions, insofar as the financial exposure in terms of a fine is concerned, the maximum fine payable is up to R15 million in terms of the legislation.
The group remains firmly committed to minimising its impact on the environment and, to this end, has invested and continues to invest in various initiatives and projects to improve the group’s environmental performance and standards.
Property, plant and equipmentDetails of capital expenditure are provided in note 29.
Compliance with Competition Commission settlement agreementThe CEO hereby confirms in respect of 2018, that ArcelorMittal South Africa has in all material respects complied with the settlement agreement entered into with the Competition Commission.
2 ArcelorMittal South Africa Audited Annual Financial Statements 2018

Directors’ report continued
Authorised and issued share capitalDetails of the authorised and issued share capital are set out in note 23 of the annual financial statements.
ShareholdersArcelorMittal Holdings AG, as controlling shareholder, held 53.1% (2017: 53.1%) of the ordinary shares in issue and an effective shareholding of 69.2% (2017: 69.2%). Details of beneficial shareholders in excess of 5% are disclosed in note 23.
Directors’ interestsThe details of the beneficial direct and indirect interests of executive directors in the shares of the company are set out in note 34 of these annual financial statements.
Details of the direct and indirect interests of non-executive directors, including their associates, in the shares of the company are set out below:
2017
Direct Indirect Total
JRD Modise 85 025 – 85 025 5 025 – 5 025NF Nicolau 100 000 – 100 000 – – –NP Gosa* – 68 566 674 68 566 674 – 97 296 110 97 296 110GS Gouws – 292 292 – 292 292
Total 185 025 68 566 966 68 751 991 5 025 97 296 402 97 301 427* Effective interest via Likamva Resources reduced from 16.73% to 11.79%. Refer to note 23 for details.
Ms NP Mnxasana declared her interest regarding the relationship between Noma Namuhla Trading and Projects (Pty) Ltd (Noma), a company owned by NP Mnxasana, and ArcelorMittal South Africa. In terms of the arrangement, Noma will participate in ArcelorMittal South Africa’s enterprise and supplier development initiatives and supplied products and services to ArcelorMittal South Africa totalling R449 000 (2017: R133 000). An interest-free loan of R350 000 with no fixed repayment terms was granted under the terms of the supplier development initiative to Noma in fiscal year 2016 and is still outstanding.
There were no further changes to the non-executive directors’ direct or indirect beneficial interests of the company since the financial year ended 31 December 2018 and the date of this report.
Investments in joint ventures, associates and subsidiariesThe financial information in respect of interests in jointly controlled entities, associates and subsidiaries of the company is disclosed in notes 16 and 17 of the annual financial statements.
Borrowing powersIn terms of clause 35 of the Memorandum of Incorporation, the borrowing powers of the company and its subsidiaries are subject to any limitations imposed by the directors on the borrowing powers of the company.
DirectorateThe names of the directors who presently hold office and served on the various committees of the board are set out in the integrated annual report.
The following changes in directorate have taken place:–– Mr HJ Verster was appointed as chief executive officer and executive director with effect from 1 February 2018–– Mr WA de Klerk retired as chief executive officer and executive director effective 31 January 2018–– Mr HMA Blaffart retired as non-executive director with effect from 31 March 2018–– Mr BE Aranha was appointed as non-executive director with effect from 31 March 2018–– Mr D Subramanian resigned as chief financial officer and executive director with effect from 31 July 2018–– Mr AD Maharaj was appointed as chief financial officer and executive director with effect from 1 October 2018–– Mr RK Kothari resigned as non-executive director with effect from 30 November 2018–– Mr R Karol was appointed as non-executive director with effect from 1 December 2018
Retirement by rotationDirectors are appointed on a three-year term. In the circumstances, where the three-year term has expired, in terms of clause 27 of the Memorandum of Incorporation, all directors are required to retire by rotation and, being eligible, offer themselves for re-election at the forthcoming annual general meeting.
2018
Non-executive director Direct Indirect Total
ArcelorMittal South Africa Audited Annual Financial Statements 2018 3
Audited Annual Financial Statements
Directors’ report continued
Shareholders will be requested to ratify the following directors’ appointments as directors at the forthcoming annual general meeting, as they were appointed by the board in accordance with the Memorandum of Incorporation after the last annual general meeting:–– Mr AD Maharaj–– Mr R Karol
Company secretaryMs NB Bam was appointed as company secretary with effect from 1 November 2018, replacing Premium Corporate Consulting (Pty) Ltd that was appointed as interim company secretary on 26 January 2018.
Going concernThe financial statements have been prepared on a going-concern basis. Based on the group and company’s 12-month funding plan, together with available banking facilities, the directors believe that the group and company will be able to comply with their financial covenants and be able to meet their obligations as they fall due, and accordingly have concluded that the group and company remain going concerns.
The group and company recognised a net profit of R1 370 million (2017: loss of R5 128 million) and R3 584 million (2017: loss of R5 591 million) for the year ended 31 December 2018 respectively. Current assets exceed current liabilities by R3 901 million (2017: 785 million) for group and R3 606 million (2017: R636 million) for company.
During 2018 the group and company returned to profitability on the back of higher international steel prices, lower costs and higher sale volumes. The group and company embarked upon a business transformation programme towards the end of 2017. This programme has been initiated to address cost reduction, improve efficiencies and debottleneck steel production at all sites. The success of some of these initiatives are visible in the results for the year ended 31 December 2018, noticeable the capacity utilisation improvement from 81% to 84% as a result of this programme. The group and company continue to drive these initiatives to further improve on the performance of the plants in the coming year.
As detailed in note 11, the group realised proceeds on the sale of investment in MIHBV at R3 221 million. This further strengthened the statement of financial position and cash flow of the group by reducing the net debt from R3 262 million to R475 million. The group generated sufficient cash from operating activities to cover capital expenditure and interest during 2018.
The group has completed the renegotiations and the resetting of the level of the tangible net worth covenant on the borrowing-based facility (BBF). As at 31 December 2018, the group was in compliance with all covenants. At 31 December 2018 the balance of the borrowing-based facility was R300 million (2017: R3 700 million) with R4 200 million (2017: R800 million) remaining undrawn. The group continues to work closely with all lenders to ensure the required facilities remain in place.
The directors are not aware of any other matters of circumstances that the group and company face and concluded that there are no other material matters that may impact the group and company’s ability to continue as a going concern.
The financial performance of the group and company are dependent upon the wider economic environment in which the group and company operate. Factors which are outside the control of management can have an impact on the business, specifically volatility of the rand/US dollar exchange rate as well as commodity and steel prices. The directors and management continue to monitor, develop and improve business plans and liquidity models in order to effectively deal with the effects of these factors.
Independent auditorsDeloitte & Touche continued in office as auditors of the group for the year.
Subsequent eventsDuring January 2019 the group has been informed that there is an intention to institute criminal proceedings against the group on account of three alleged transgressions of its atmospheric emission licence at its Vanderbijlpark operations. The prosecution has agreed that the group would first be afforded an opportunity to meet and to make representations before proceeding with the prosecution. This process has not been concluded. In the event that the matter proceeds, and if there is an adverse finding regarding all these transgressions, insofar as the financial exposure in terms of a fine is concerned, the maximum fine payable is up to R15 million in terms of the legislation. The group remains firmly committed to minimising its impact on the environment and, to this end, has invested and continues to invest in various initiatives and projects to improve the group’s environmental performance and standards.
The Carbon Tax Bill was approved by the National Assembly in February 2019. The announced implementation date is from 1 June 2019. The estimated financial impact on the group and company is approximately R300 million annually. However, two sets of related regulations, currently being prepared by authorities and likely to be published in the second quarter of 2019, could have an effect of slightly lessening this liability.
The directors are not aware of any other matter or circumstances arising since the end of the financial year to the date of this report, not otherwise dealt with in this report or in the group and company annual financial statements that would significantly affect the operations, the results and the financial position of the group and company.
4 ArcelorMittal South Africa Audited Annual Financial Statements 2018

Audit and risk committee report
The audit and risk committee (the committee) has pleasure in submitting its report to the shareholders as required in terms of section 94(7) of the Companies Act.
Membership of the committeeThe committee comprised the following members at the date of this report:–– Mr JRD Modise–– Ms LC Cele–– Ms NP Mnxasana
Each member is an independent director and has the adequate relevant knowledge, the financial expertise and experience to equip the committee to properly execute its duties and responsibilities.
The experience and qualifications of the members are set out on pages 6 to 10 of the notice of annual general meeting 2018.
Functions of the committeeDuring the year under review, eight meetings were held. Details of attendance are set out on pages 20 and 21 of the integrated annual report.
The committee reports that it has adopted appropriate formal terms of reference as its mandate, and has regulated its affairs in compliance with this mandate, and has discharged all of the responsibilities set out therein. During the financial year under review, the committee reviewed the following matters:–– The quarterly and half-yearly financial reports, the integrated annual report, the annual financial statements and accounting policies for the company and all subsidiaries–– The effectiveness of the combined assurance model–– The reports of the internal audit function on the state of internal control including its forensic reports regarding fraud prevention and detection–– The effectiveness of the internal audit function–– The auditor’s findings and recommendations–– Statements on ethical standards for the company and considered how they are promoted and enforced–– Significant cases of unethical activity by employees or by the company itself–– Reports on the risk management process in the company and assessed the company’s exposure to the following risks:(i) Top strategic risks (including credit and market risks, human resources risks and compliance risks)(ii) Operational risks(iii) Information technology risks
Independence of auditorThe committee reviewed a presentation by the external auditor and, after conducting its own review, is satisfied with the independence and objectivity of Deloitte & Touche as external auditors in terms of section 22.15(h) of the JSE Listings Requirements and SI Rajcoomar as the designated auditor. The committee further approved the fees to be paid to Deloitte & Touche and their terms of engagement and pre-approved each proposed contract with Deloitte & Touche for the provision of non-audit services to the company. During the year the committee reviewed and approved all non-audit services to the group and company.
Statutory reportingThe committee has evaluated the annual financial statements of ArcelorMittal South Africa and the group for the year ended 31 December 2018 and, based on the information provided to the committee, considers that the company and group comply, in all material respects, with the requirements of the Companies Act of South Africa, the International Financial Reporting Standards (IFRS), the SAICA Financial Reporting Guides as issued by the Accounting Practices Committee, and applicable legislation and financial pronouncements as issued by the Financial Reporting Standards Council.
ArcelorMittal South Africa Audited Annual Financial Statements 2018 5
Audited Annual Financial Statements
Audit and risk committee report continued
Internal financial controlsThe committee agendas provide for confidential meetings between committee members and both the internal and independent external auditors.
The committee has oversight of the group’s financial statements and reporting process, including the system of internal financial control. It is responsible for ensuring that the group’s internal audit function is independent and has the necessary resources, standing and authority in the organisation to discharge its duties. The committee oversees cooperation between internal and external auditors, and serves as a link between the board of directors and these functions. The head of internal audit reports administratively to the chief executive officer and functionally to the chairman of the committee and head of group internal audit of the holding company, ArcelorMittal Holdings AG.
The committee is of the opinion, after having considered the assurance provided by the internal audit function, that the group’s system of internal financial controls in all key material aspects is effective and provides reasonable assurance that the financial records may be relied upon for the preparation of the annual financial statements. This is based on the information and explanations given by management and the group internal audit function.
Combined assuranceThe committee is responsible for monitoring the appropriateness of the company’s combined assurance model and ensuring that significant risks facing the company are adequately addressed as well as monitoring the relationship between the external assurance providers and the company. The committee further ensured that the combined assurance provided by the internal and external assurance providers and management were sufficient to satisfy the committee that significant risk areas with the company have been adequately addressed and suitable controls exist to mitigate and reduce these risks.
Expertise and experience of the chief financial officer and the finance functionThe committee has satisfied itself that the chief financial officers during 2018 had the appropriate expertise and experience to carry out their duties. The skills of the current chief financial officer, AD Maharaj, were deemed appropriate at the date of his appointment.
The committee has assessed the competency, skills and resourcing of the group’s finance function, and is satisfied as to the overall adequacy and appropriateness of the finance function, and further ensured that the company has established appropriate financial reporting procedures and that these procedures are operating.
Expertise and experience of the company secretaryThe committee has satisfied itself that the company secretary, NB Bam, has the appropriate competence and experience and has maintained an arm’s length relationship with directors. Her skills were deemed appropriate at the date of appointment.
Recommendation of the annual financial statements and integrated annual reportThe committee, having fulfilled the oversight role regarding the reporting process for both the annual financial statements and the integrated annual report and having regard to material factors that may impact the integrity of these reports, recommends the integrated annual report and the annual financial statements for approval by the board of directors.
Auditor and designated individual partnerThe committee notes that Deloitte & Touche has been the auditor of the group and company for 14 years. SI Rajcoomar was appointed as the designated individual partner in 2018. The committee agendas provide for confidential meetings between committee members and both the internal and independent external auditors.
Key audit mattersThe key audit matters as disclosed in the report of the independent auditor was communicated and reviewed by the committee.
JRD ModiseChairman 27 March 2019
6 ArcelorMittal South Africa Audited Annual Financial Statements 2018
Report of the independent auditor
To the shareholders of ArcelorMittal South AfricaReport on the audit of the consolidated and separate financial statements
OpinionWe have audited the consolidated and separate financial statements of ArcelorMittal South Africa and its subsidiaries (the group) set out on pages 12 to 96, which comprise the statements of financial position as at 31 December 2018, the statements of comprehensive income, the statements of changes in equity, the statements of cash flows for the year then ended, and the notes to the financial statements, including a summary of significant accounting policies.
In our opinion, the consolidated and separate financial statements present fairly, in all material respects, the consolidated and separate financial position of the group as at 31 December 2018, and its consolidated and separate financial performance and its consolidated and separate cash flows for the year then ended in accordance with International Financial Reporting Standards (IFRS) and the requirements of the Companies Act of South Africa.
Basis for opinionWe conducted our audit in accordance with International Standards on Auditing (ISAs). Our responsibilities under those standards are further described in the Auditor’s Responsibilities for the Audit of the Consolidated and Separate Financial Statements section of our report. We are independent of the group in accordance with the Independent Regulatory Board for Auditors Code of Professional Conduct for Registered Auditors (IRBA Code) and other independence requirements applicable to performing audits of financial statements in South Africa. We have fulfilled our other ethical responsibilities in accordance with the IRBA Code and in accordance with other ethical requirements applicable to performing audits in South Africa. The IRBA Code is consistent with the International Ethics Standards Board for Accountants Code of Ethics for Professional Accountants (Parts A and B). We believe that the audit evidence we have obtained is sufficient and appropriate to provide a basis for our opinion.
Key audit mattersKey audit matters are those matters that, in our professional judgement, were of most significance in our audit of the consolidated and separate financial statements of the current period. These matters were addressed in the context of our audit of the consolidated and separate financial statements as a whole, and in forming our opinion thereon, and we do not provide a separate opinion on these matters.
ArcelorMittal South Africa Audited Annual Financial Statements 2018 7
Audited Annual Financial Statements

Report of the independent auditor continued
Key audit matter How the matter was addressed in the audit
As disclosed in note 14 of the consolidated and separate financial statements, an impairment assessment was performed on property, plant and equipment based on the assumptions disclosed in the note.
Judgement is required by the directors in assessing the impairment of the group of assets or the cash-generating unit (CGU), which is determined with reference to fair value less cost to sell or the value-in-use, based on the cash flow forecast for each CGU.
The discounted cash flow model used to determine the recoverable amount of the CGU is detailed and complex. Certain key inputs specifically:–– Revenue growth (including market share and forecast sales volumes)–– The discount rate, which is based on the weighted average cost of capital. The determination of the weighted average cost of capital is highly complex–– The company-specific risk premium applied to the discount rate to address the forecasting risk identified in the CGUs–– Exchange rate forecasts–– Projected sales and input cost prices, as both are linked to volatile commodity prices are subject to volatility and require significant estimation and judgement
The complexity of the above results in complex accounting considerations and this was determined as a key audit matter.
In evaluating the impairment of property, plant and equipment within the applicable CGUs, we reviewed the value-in-use calculations prepared by the directors, with a particular focus on the assumptions with the most significant impact.
We performed various procedures, including the following:–– Testing of the key entity’s controls relating to the preparation and review of the cash flow forecasts–– Testing of inputs into the cash flow forecast, including the assumptions relating to revenue growth, in particular the forecasted sales volumes and input prices, against historical performance and in comparison to the directors’ strategic plans in respect of the applicable CGUs–– Consideration of the directors’ ability to accurately forecast, based on a comparison of historical actual performance against previous respective forecasts–– We engaged our internal valuation experts to perform the following:
• Critically evaluated whether the value-in-use calculation used by the directors to calculate the value-in-use of the individual cash-generating units complies with the requirements of IAS 36 Impairment of Assets (IAS 36)
• Compared the growth rates used to historical data regarding economic growth rates for the regions included in the CGUs
• Assessed the weighted average cost of capital including the company specific risk premium (discount rate) and the determination of this rate
• Assessed the exchange rates used in the model to ensure that they comply with the requirements of IAS 36 in relation to the valuation method used
• Analysed the future projected cash flows used in the models to determine whether they are reasonable and supportable given the current macro-economic climate and expected future performance of the applicable CGUs, against external market data, historical performance and forecasts
–– Compared the forecast commodity prices (iron ore and coking coal) used in determining the sales prices and input costs against independent third-party sources–– Subjecting the key assumptions to sensitivity analysis–– Recalculated the value-in-use of all CGUs
We assessed most of the assumptions to be balanced with the exception of the long-term forecast export volumes and forecast prices for the Newcastle and Vanderbijlpark CGUs which were determined to be mildly optimistic.
The discount rate was within an independently determined acceptable range.
We considered the related disclosures to be appropriate.
Impairment of property, plant and equipment
8 ArcelorMittal South Africa Audited Annual Financial Statements 2018
Report of the independent auditor continued
Key audit matter How the matter was addressed in the audit
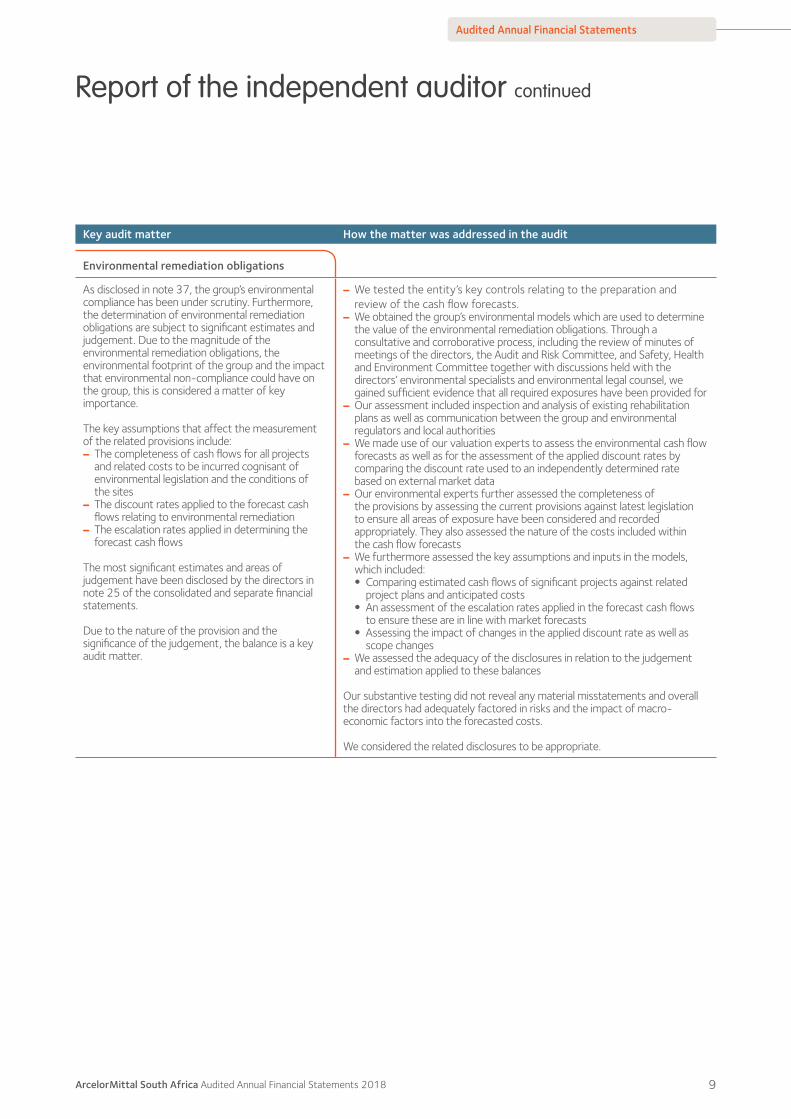
As disclosed in note 37, the group’s environmental compliance has been under scrutiny. Furthermore, the determination of environmental remediation obligations are subject to significant estimates and judgement. Due to the magnitude of the environmental remediation obligations, the environmental footprint of the group and the impact that environmental non-compliance could have on the group, this is considered a matter of key importance.
The key assumptions that affect the measurement of the related provisions include:–– The completeness of cash flows for all projects and related costs to be incurred cognisant of environmental legislation and the conditions of the sites–– The discount rates applied to the forecast cash flows relating to environmental remediation–– The escalation rates applied in determining the forecast cash flows
The most significant estimates and areas of judgement have been disclosed by the directors in note 25 of the consolidated and separate financial statements.
Due to the nature of the provision and the significance of the judgement, the balance is a key audit matter.
–– We tested the entity’s key controls relating to the preparation and review of the cash flow forecasts.–– We obtained the group’s environmental models which are used to determine the value of the environmental remediation obligations. Through a consultative and corroborative process, including the review of minutes of meetings of the directors, the Audit and Risk Committee, and Safety, Health and Environment Committee together with discussions held with the directors’ environmental specialists and environmental legal counsel, we gained sufficient evidence that all required exposures have been provided for–– Our assessment included inspection and analysis of existing rehabilitation plans as well as communication between the group and environmental regulators and local authorities–– We made use of our valuation experts to assess the environmental cash flow forecasts as well as for the assessment of the applied discount rates by comparing the discount rate used to an independently determined rate based on external market data–– Our environmental experts further assessed the completeness of the provisions by assessing the current provisions against latest legislation to ensure all areas of exposure have been considered and recorded appropriately. They also assessed the nature of the costs included within the cash flow forecasts–– We furthermore assessed the key assumptions and inputs in the models, which included: • Comparing estimated cash flows of significant projects against related project plans and anticipated costs
• An assessment of the escalation rates applied in the forecast cash flows to ensure these are in line with market forecasts
• Assessing the impact of changes in the applied discount rate as well as scope changes
–– We assessed the adequacy of the disclosures in relation to the judgement and estimation applied to these balances
Our substantive testing did not reveal any material misstatements and overall the directors had adequately factored in risks and the impact of macro- economic factors into the forecasted costs.
We considered the related disclosures to be appropriate.
Environmental remediation obligations
ArcelorMittal South Africa Audited Annual Financial Statements 2018 9
Audited Annual Financial Statements
Report of the independent auditor continued
Key audit matter How the matter was addressed in the audit
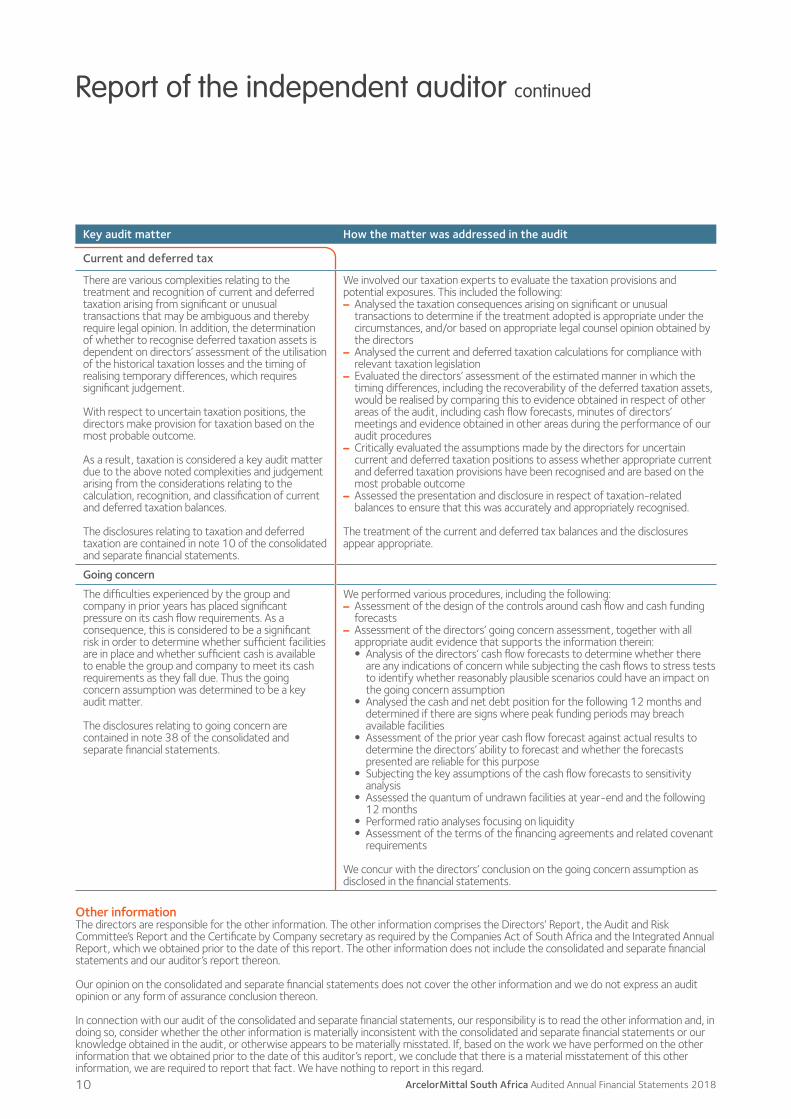
There are various complexities relating to the treatment and recognition of current and deferred taxation arising from significant or unusual transactions that may be ambiguous and thereby require legal opinion. In addition, the determination of whether to recognise deferred taxation assets is dependent on directors’ assessment of the utilisation of the historical taxation losses and the timing of realising temporary differences, which requires significant judgement.
With respect to uncertain taxation positions, the directors make provision for taxation based on the most probable outcome.
As a result, taxation is considered a key audit matter due to the above noted complexities and judgement arising from the considerations relating to the calculation, recognition, and classification of current and deferred taxation balances.
The disclosures relating to taxation and deferred taxation are contained in note 10 of the consolidated and separate financial statements.
We involved our taxation experts to evaluate the taxation provisions and potential exposures. This included the following:–– Analysed the taxation consequences arising on significant or unusual transactions to determine if the treatment adopted is appropriate under the circumstances, and/or based on appropriate legal counsel opinion obtained by the directors–– Analysed the current and deferred taxation calculations for compliance with relevant taxation legislation–– Evaluated the directors’ assessment of the estimated manner in which the timing differences, including the recoverability of the deferred taxation assets, would be realised by comparing this to evidence obtained in respect of other areas of the audit, including cash flow forecasts, minutes of directors’ meetings and evidence obtained in other areas during the performance of our audit procedures–– Critically evaluated the assumptions made by the directors for uncertain current and deferred taxation positions to assess whether appropriate current and deferred taxation provisions have been recognised and are based on the most probable outcome–– Assessed the presentation and disclosure in respect of taxation-related balances to ensure that this was accurately and appropriately recognised.
The treatment of the current and deferred tax balances and the disclosures appear appropriate.
Going concern
The difficulties experienced by the group and company in prior years has placed significant pressure on its cash flow requirements. As a consequence, this is considered to be a significant risk in order to determine whether sufficient facilities are in place and whether sufficient cash is available to enable the group and company to meet its cash requirements as they fall due. Thus the going concern assumption was determined to be a key audit matter.
The disclosures relating to going concern are contained in note 38 of the consolidated and separate financial statements.
We performed various procedures, including the following:–– Assessment of the design of the controls around cash flow and cash funding forecasts–– Assessment of the directors’ going concern assessment, together with all appropriate audit evidence that supports the information therein: • Analysis of the directors’ cash flow forecasts to determine whether there are any indications of concern while subjecting the cash flows to stress tests to identify whether reasonably plausible scenarios could have an impact on the going concern assumption
• Analysed the cash and net debt position for the following 12 months and determined if there are signs where peak funding periods may breach available facilities
• Assessment of the prior year cash flow forecast against actual results to determine the directors’ ability to forecast and whether the forecasts presented are reliable for this purpose
• Subjecting the key assumptions of the cash flow forecasts to sensitivity analysis
• Assessed the quantum of undrawn facilities at year-end and the following 12 months
• Performed ratio analyses focusing on liquidity • Assessment of the terms of the financing agreements and related covenant requirements
We concur with the directors’ conclusion on the going concern assumption as disclosed in the financial statements.
Other informationThe directors are responsible for the other information. The other information comprises the Directors’ Report, the Audit and Risk Committee’s Report and the Certificate by Company secretary as required by the Companies Act of South Africa and the Integrated Annual Report, which we obtained prior to the date of this report. The other information does not include the consolidated and separate financial statements and our auditor’s report thereon.
Our opinion on the consolidated and separate financial statements does not cover the other information and we do not express an audit opinion or any form of assurance conclusion thereon.
In connection with our audit of the consolidated and separate financial statements, our responsibility is to read the other information and, in doing so, consider whether the other information is materially inconsistent with the consolidated and separate financial statements or our knowledge obtained in the audit, or otherwise appears to be materially misstated. If, based on the work we have performed on the other information that we obtained prior to the date of this auditor’s report, we conclude that there is a material misstatement of this other information, we are required to report that fact. We have nothing to report in this regard.
Current and deferred tax
10 ArcelorMittal South Africa Audited Annual Financial Statements 2018

Report of the independent auditor continued
Responsibilities of the directors for the consolidated and separate financial statementsThe directors are responsible for the preparation and fair presentation of the consolidated and separate financial statements in accordance with International Financial Reporting Standards (IFRS) and the requirements of the Companies Act of South Africa, and for such internal control as the directors determine is necessary to enable the preparation of consolidated and separate financial statements that are free from material misstatement, whether due to fraud or error.
In preparing the consolidated and separate financial statements, the directors are responsible for assessing the group and company’s ability to continue as a going concern, disclosing, as applicable, matters related to going concern and using the going concern basis of accounting unless the directors either intend to liquidate the group and/or the company or to cease operations, or have no realistic alternative but to do so.
Auditor’s responsibilities for the audit of the consolidated and separate financial statementsOur objectives are to obtain reasonable assurance about whether the consolidated and separate financial statements as a whole are free from material misstatement, whether due to fraud or error, and to issue an auditor’s report that includes our opinion. Reasonable assurance is a high level of assurance, but is not a guarantee that an audit conducted in accordance with ISAs will always detect a material misstatement when it exists. Misstatements can arise from fraud or error and are considered material if, individually or in the aggregate, they could reasonably be expected to influence the economic decisions of users taken on the basis of these consolidated and separate financial statements.
As part of an audit in accordance with ISAs, we exercise professional judgement and maintain professional scepticism throughout the audit. We also:–– Identify and assess the risks of material misstatement of the consolidated and separate financial statements, whether due to fraud or error, design and perform audit procedures responsive to those risks, and obtain audit evidence that is sufficient and appropriate to provide a basis for our opinion. The risk of not detecting a material misstatement resulting from fraud is higher than for one resulting from error, as fraud may involve collusion, forgery, intentional omissions, misrepresentations, or the override of internal control–– Obtain an understanding of internal control relevant to the audit in order to design audit procedures that are appropriate in the circumstances, but not for the purpose of expressing an opinion on the effectiveness of the group and company’s internal control–– Evaluate the appropriateness of accounting policies used and the reasonableness of accounting estimates and related disclosures made by the director–– Conclude on the appropriateness of directors’ use of the going concern basis of accounting and based on the audit evidence obtained, whether a material uncertainty exists related to events or conditions that may cast significant doubt on the group and company’s ability to continue as a going concern. If we conclude that a material uncertainty exists, we are required to draw attention in our auditor’s report to the related disclosures in the consolidated and separate financial statements or, if such disclosures are inadequate, to modify our opinion. Our conclusions are based on the audit evidence obtained up to the date of our auditor’s report. However, future events or conditions may cause the group and/or the company to cease to continue as a going concern–– Evaluate the overall presentation, structure and content of the consolidated and separate financial statements, including the disclosures, and whether the consolidated and separate financial statements represent the underlying transactions and events in a manner that achieves fair presentation–– Obtain sufficient appropriate audit evidence regarding the financial information of the entities or business activities within the group to express an opinion on the consolidated financial statements. We are responsible for the direction, supervision and performance of the group audit. We remain solely responsible for our audit opinion
We communicate with the directors regarding, among other matters, the planned scope and timing of the audit and significant audit findings, including any significant deficiencies in internal control that we identify during our audit.
We also provide the directors with a statement that we have complied with relevant ethical requirements regarding independence, and to communicate with them all relationships and other matters that may reasonably be thought to bear on our independence, and where applicable, related safeguards.
From the matters communicated with the directors, we determine those matters that were of most significance in the audit of the consolidated and separate financial statements of the current period and are therefore the key audit matters. We describe these matters in our auditor’s report unless law or regulation precludes public disclosure about the matter or when, in extremely rare circumstances, we determine that a matter should not be communicated in our report because the adverse consequences of doing so would reasonably be expected to outweigh the public interest benefits of such communication.
Report on other legal and regulatory requirementsIn terms of the IRBA Rule published in Government Gazette Number 39475 dated 4 December 2015, we report that Deloitte & Touche has been the auditor of ArcelorMittal South Africa Ltd for 14 years.
Deloitte & ToucheRegistered auditorsPer: SI RajcoomarPartner
27 March 2019Deloitte & ToucheDeloitte PlaceThe Woodlands, Woodlands Drive Woodmead, Sandton
ArcelorMittal South Africa Audited Annual Financial Statements 2018 11
Audited Annual Financial Statements

Group and company statements of comprehensive incomefor the year ended 31 December 2018
Group Company
2017Rm
2017Rm
Revenue 4 45 274 39 022 38 783 33 860Raw materials and consumables used (25 965) (24 763) (22 997) (22 689)Employee costs (4 493) (4 164) (4 483) (4 164)Energy (4 262) (4 233) (2 966) (2 898)Movement in inventories of finished goods and
work-in-progress 574 346 496 394Depreciation (817) (953) (807) (890)Amortisation of intangible assets (14) (23) (14) (20)Impairment of trade receivables (25) 1 (25) 1Other operating expenses (7 495) (6 453) (5 758) (5 007)
Profit/(loss) from operations 6 2 777 (1 220) 2 229 (1 413)
Finance and investment income 7 387 74 3 487 65Finance costs 8 (2 400) (1 515) (2 208) (1 434)Impairment of other assets 9 (10) (10) (62) (721)Impairment of property, plant and equipment and
intangible assets 14, 15 – (2 594) – (2 088)Income after tax from equity-accounted investments 138 139 – –Fair value adjustment on investment held-for-sale 11 (1 652) – – –Reclassification of foreign currency differences on sale
of foreign investment 11 2 067 – – –
Profit/(loss) before taxation 1 307 (5 126) 3 446 (5 591)Income taxation credit/(expense) 10 63 (2) 74 –
Profit/(loss) for the year 1 370 (5 128) 3 520 (5 591)
Other comprehensive incomeItems that will not be reclassified to profit or loss:Equity investments at FVTOCI – net change in fair value 11 – 21 –Items that may be reclassified subsequently to profit
or loss:Exchange differences on translation of foreign operations 513 (392) – –Reclassification of foreign currency differences on sale of
foreign investment 11 (2 067) – – –Cash flow hedges – effective portion of changes in fair
value 92 – 92 –Cash flow hedges – reclassified to profit or loss (49) – (49) –Income on available-for-sale investment taken to equity – (25) – (26)Share of other comprehensive income of equity-
accounted investments 25 2 – –
Total comprehensive (loss)/income for the year (105) (5 543) 3 584 (5 617)
Profit/(loss) attributable to:Owners of the company 1 370 (5 128) 3 520 (5 591)
Total comprehensive (loss)/profit attributable to:Owners of the company (105) (5 543) 3 584 (5 617)
Attributable profit/(loss) per share (cents)– Basic 12 125 (469) – –– Diluted 12 125 (469) – –
Notes2018
Rm2018
Rm
12 ArcelorMittal South Africa Audited Annual Financial Statements 2018

Group and company statements of financial positionas at 31 December 2018
Group Company
2017Rm
2017Rm
AssetsNon-current assetsProperty, plant and equipment 14 8 995 8 474 8 847 8 479Intangible assets 15 73 82 73 82Equity-accounted investments 16 220 4 424 172 171Investments in subsidiaries 17 – – 240 474Investments held by environmental trust 18 332 – – –Non-current receivables 21 10 30 10 30Other financial assets 19 66 55 66 46
Total non-current assets 9 696 13 065 9 408 9 282
Current assetsInventories 20 12 179 11 519 10 929 10 491Trade and other receivables 21 3 972 2 988 3 376 2 465Taxation 132 58 132 58Other financial assets 19 56 428 56 428Cash and cash equivalents 22 2 525 3 138 2 506 3 130Total current assets 18 864 18 131 16 999 16 572
Total assets 28 560 31 196 26 407 25 854
Equity and liabilitiesEquityStated capital 23 4 537 4 537 4 537 4 537Reserves (3 659) 363 985 924Retained income/(accumulated loss) 7 083 3 158 2 266 (1 265)
Total equity 7 961 8 058 7 788 4 196
Non-current liabilitiesFinance lease obligations 24 46 54 – 2Provisions 25 1 774 1 826 1 410 1 808Borrowings 27 2 700 2 700 2 700 2 700Other financial liabilities 28 544 813 544 813Other payables 26 572 399 572 399
Total non-current liabilities 5 636 5 792 5 226 5 722
Current liabilitiesTrade payables 26 12 304 11 300 10 856 10 008Taxation 91 82 – –Other financial liabilities 28 372 906 372 906Borrowings 27 300 3 700 300 3 700Finance lease obligations 24 15 70 2 57Provisions 25 406 304 398 299Other payables 26 1 475 984 1 465 966Total current liabilities 14 963 17 346 13 393 15 936
Total equity and liabilities 28 560 31 196 26 407 25 854
Notes2018
Rm2018
Rm
ArcelorMittal South Africa Audited Annual Financial Statements 2018 13
Audited Annual Financial Statements

Group and company statements of cash flowsfor the year ended 31 December 2018
Group Company
2017Rm
2017Rm
Cash flows from operating activitiesCash generated from/(utilised in) operations 29.1 2 282 (712) 1 911 (934)Interest income 93 65 86 65 Finance cost (574) (741) (536) (684)Income tax (paid)/received 29.2 (2) 80 – (5)Realised foreign exchange movements (912) (210) (788) (167)
Net cash generated from/(utilised in) operating activities 887 (1 518) 673 (1 725)
Cash flows from investing activitiesInvestment to maintain operations 29.3 (950) (1 002) (847) (901)Investment to expand operations 29.4 (306) (322) (285) (318)Investment in associates, joint ventures and
cell captive – (11) (1) –Proceeds on disposal of joint venture 11 3 221 – – –Proceeds on disposal or scrapping of assets 12 13 12 9 Interest income from investments – 9 1 –Dividend from equity-accounted investments/
subsidiaries 7 – 3 115 –
Net cash generated by/(utilised in) investing activities 1 984 (1 313) 1 995 (1 210)
Cash flows from financing activitiesBorrowings (repaid)/raised 29.5 (3 400) 4 450 (3 400) 4 450 Finance lease obligation repaid 29.5 (85) (70) (65) (49)Transaction costs on BBF – (61) – (61)Cash settlement on management share trust (2) (9) (2) (9)Decrease in loans to subsidiaries – – 172 82
Net cash (utilised in)/generated by financing activities (3 487) 4 310 (3 295) 4 413
Net (decrease)/increase in cash and cash equivalents (616) 1 479 (627) 1 478
Effect of foreign exchange rate changes on cash and cash equivalents 3 (1) 3 1
Cash and cash equivalents at the beginning of the year 3 138 1 660 3 130 1 651
Cash and cash equivalents at the end of the year 22 2 525 3 138 2 506 3 130
Notes2018
Rm2018
Rm
14 ArcelorMittal South Africa Audited Annual Financial Statements 2018

Group and company statements of changes in equityfor the year ended 31 December 2018
Stated capital1
Rm
Retained earnings
Rm
Treasury share
equity reserve2
Rm
Management share trust
reserve3
Rm
Share-based
payment reserve4
Rm
Attributable reserves
of equity-accounted
investmentsRm
Other reserves5
Rm
Total equity
Rm
GROUPBalance at 31 December 2016 4 537 8 425 (3 918) (317) 1 187 1 606 2 023 13 543 Total comprehensive (loss)/
income for year – (5 128) – – – 2 (417) (5 543)Loss – (5 128) – – – – – (5 128)Other comprehensive income/
(loss) – – – – – 2 (417) (415)Transfer between reserves – (139) – – – 139 – –Share-based payment expense – – – (1) 68 – – 67 Cash settlement on
management share trust/long-term incentive plan – – – – (9) – – (9)
Balance at 31 December 2017 4 537 3 158 (3 918) (318) 1 246 1 747 1 606 8 058
Total comprehensive income/(loss) for the year – 1 370 – – – 25 (1 500) (105)
Profit – 1 370 – – – – – 1 370 Other comprehensive income/
(loss) – – – – – 25 (1 500) (1 475)
Transfers between reserves – 2 555 (1) 16 (25) (2 573) 28 –
Share-based payment expense – – – – 10 – – 10 Cash settlement on
management share trust/long-term incentive plan – – – – (2) – – (2)
Balance at 31 December 2018 4 537 7 083 (3 919) (302) 1 229 (801) 134 7 961
ArcelorMittal South Africa Audited Annual Financial Statements 2018 15
Audited Annual Financial Statements

Group and company statements of changes in equity continuedfor the year ended 31 December 2018
Stated capital1
Rm
Retained earnings
Rm
Treasury share
equity reserve2
Rm
Management share trust
reserve3
Rm
Share-based
payment reserve4
Rm
Other reserves5
Rm
Total equity
Rm
COMPANYBalance at 31 December 2016 4 537 4 326 – (317) 1 187 22 9 755 Total comprehensive loss for the year – (5 591) – – – (26) (5 617)
Loss – (5 591) – – – – (5 591)Other comprehensive loss – – – – – (26) (26)
Share-based payment expense – – – (1) 68 – 67 Cash settlement on management share
trust/long-term incentive plan – – – – (9) – (9)
Balance at 31 December 2017 4 537 (1 265) – (318) 1 246 (4) 4 196
Total comprehensive income for the year – 3 520 – – – 64 3 584Profit – 3 520 – – – – 3 520 Other comprehensive income – – – – – 64 64 Transfers between reserves – 11 – 16 (25) (2) –Share-based payment expense – – – – 10 – 10 Cash settlement on management share
trust/long-term incentive plan – – – – (2) – (2)
Balance at 31 December 2018 4 537 2 266 – (302) 1 229 58 7 788
16 ArcelorMittal South Africa Audited Annual Financial Statements 2018

Group and company statements of changes in equity continuedfor the year ended 31 December 2018
In the context of the statement of changes in equity, the following equity reserves are of relevance:
1. Stated capitalA successful rights offer for R4 500 million was concluded and implemented on 18 January 2016. The company issued 692 307 693 new ordinary shares. These shares were issued at a value of R6.50 per share.
At the special general meeting (SGM) of the shareholders of ArcelorMittal South Africa held on 18 November 2016, the shareholders approved the increase in the authorised share capital of ArcelorMittal South Africa through the creation of new class ordinary shares (ArcelorMittal South Africa empowerment shares) for the purposes of the broad-based black economic empowerment (B-BBEE) ownership scheme.
The scheme is part of ArcelorMittal South Africa’s initiatives to transform the company and achieve sustainable ownership by black people. In terms of the scheme, ArcelorMittal South Africa issued empowerment shares to Amandla we Nsimbi (Pty) Ltd (A1 ordinary shares) and Isabelo Employee Empowerment Share Trust (A2 ordinary shares) representing 17% and 5.1% respectively of the voting rights in ArcelorMittal South Africa through a notional loan. These shares were issued at a nominal value of R0.0000001 per share for both the A1 and A2 shares.
2. Treasury share equity reserveIn 2009 the company implemented a share buy-back arrangement and acquired 9.995% of the shareholding of each shareholder. During 2016 the Ikageng Broad-Based Employee Share Trust was created to hold in trust, the shares for the employee share ownership plan, and purchased 4.7% of the shareholding through a contribution from ArcelorMittal South Africa. The trust is controlled by ArcelorMittal South Africa and, therefore, the trust is consolidated in accordance with IFRS 10 Consolidated Financial Statements. The shares will continue to remain in issue as treasury shares.
3. Management share trust reserveThe management share trust reserve represents the net outflow from the purchase of treasury shares in order to meet obligations in terms of the ArcelorMittal South Africa equity-settled share option plan housed in the management share trust. The trust is consolidated as a consolidated structured entity in compliance with IFRS 10 Consolidated Financial Statements.
4. Share-based payment reserveThe share-based payment reserve represents the accumulated charge for share options and long-term incentive plan units in terms of IFRS 2 Share-Based Payments, which are all equity-settled. Included in 2016 was an IFRS 2 charge of R800 million and R1 million relating to the issue of ArcelorMittal South Africa A1 and A2 ordinary shares under the B-BBEE ownership scheme.
5. Other reservesOther reserves consist of the following:
Capital redemption reserve of R24 million (2017: R23 million) for the group and company. The capital redemption reserve was created in terms of the South African Companies Act No 61 of 1973, following the redemption of shares during the year ended 30 June 2000, out of profits that would otherwise be available for distribution to ordinary shareholders.
Equity instruments carried at fair value through other comprehensive income (FVTOCI) (2017: Available-for-sale investment) reserve of R13 million debit (2017: R24 million debit) for the group. This reserve relates to the unrealised fair value gains/(losses) relating to the group’s investment in Hwange Colliery Company Ltd and MC Mining Ltd.
Translation of the foreign operation reserve of R80 million (2017: R1 607 million) for the group. The net movement in the reserve relates to an increase of R513 million through translation of foreign operations and investments, a decrease of R2 067 million relating to a release in profit or loss after the sale of MIHBV and a transfer between reserves of R27 million. Refer to note 11 on this sale. The remaining other reserve relates to a hedging reserve of R43 million.
ArcelorMittal South Africa Audited Annual Financial Statements 2018 17
Audited Annual Financial Statements

Notes to the group and company annual financial statementsfor the year ended 31 December 2018
1. General informationArcelorMittal South Africa Ltd (the company) and its subsidiaries consolidated in these annual financial statements to reflect “the group”, is one of the largest steel producers on the African continent. The company is domiciled in South Africa and it is a public limited company listed on the Johannesburg Stock Exchange.
2. Application of new and revised International Financial Reporting Standards (IFRS) 2.1 Changes in significant accounting policies due to new IFRS standards
The group and company have applied IFRS 9, Financial Instruments, and IFRS 15, Revenue from Contracts with Customers, from 1 January 2018.
Due to the transition methods chosen by the group and company in applying these standards, comparative information throughout these financial statements has not been restated to reflect the requirements of the standards, except for separately presenting impairment loss on trade receivables.
The effect of applying these standards have no material impact on these financial statements.
2.1.1 IFRS 9 Financial InstrumentsIFRS 9 sets out requirements for recognising and measuring financial assets, financial liabilities and some contracts to buy or sell non-financial items. This standard replaces IAS 39 Financial Instruments: Recognition and Measurement.
As a result of the adoption of IFRS 9, the group and company have adopted consequential amendments to IAS 1 Presentation of Financial Statements, which requires impairment of financial assets to be presented in a separate line item in the statement of profit or loss and other comprehensive income (OCI). Previously, the group and company’s approach were to include the impairment of trade receivables in other operating expenses. Consequently, the group and company reclassified a reversal of impairment amounting to R1 million, recognised under IAS 39, from ‘other operating expenses’ to ‘impairment loss on trade receivables’ in the statement of profit or loss and OCI for the year ended 31 December 2018.
The group and company assessed the impact of R9 million of transition to IFRS 9 on the opening balance of retained earnings as immaterial to the results.
Classification and measurement of financial assets and financial liabilitiesIFRS 9 contains three principal classification categories for financial assets: measured at amortised cost, fair value through other comprehensive income (FVTOCI) and fair value through profit or loss (FVTPL). The classification of financial assets under IFRS 9 is generally based on the business model in which a financial asset is managed and its contractual cash flow characteristics. IFRS 9 eliminates the previous IAS 39 categories of held to maturity, loans and receivables and available-for-sale. Under IFRS 9, derivatives embedded in contracts where the host is a financial asset in the scope of the standard are never separated. Instead, the hybrid financial instrument as a whole is assessed for classification.
IFRS 9 largely retains the existing requirements in IAS 39 for the classification and measurement of financial liabilities, however there are differences in the requirements regarding the recognition of an entity’s own credit risk for financial liabilities designated as FVTPL.
The adoption of IFRS 9 has not had a significant effect on the group and company’s accounting policies related to financial liabilities.
Additionally, the group and company have adopted consequential amendments to IFRS 7 Financial Instruments: Disclosures that are applied to disclosures in 2018 but have not been generally applied to comparative information.
18 ArcelorMittal South Africa Audited Annual Financial Statements 2018

Notes to the group and company annual financial statements continuedfor the year ended 31 December 2018
2. Application of new and revised International Financial Reporting Standards (IFRS) continued2.1 Changes in significant accounting policies due to new IFRS standards continued
The following table and the accompanying notes below explain the original measurement categories under IAS 39 and the new measurement categories under IFRS 9 for each class of the group and company’s financial assets and financial liabilities as at 1 January 2018.
Financial assets Note
Original classification
under IAS 39
New classification
under IFRS 9
Original carrying amount
under IAS 39
Rm
New carrying amount
under IFRS 9
Rm
Other forward exchange contracts Held-for-trading Mandatorily at FVTPL 4 4Equity instruments a Available-for-sale FVTOCI 55 55Other financial asset Loans and receivables Amortised cost 424 424Trade and other receivables b Loans and receivables Amortised cost 2 988 2 988Trade and other receivables subject to TSR programme c Loans and receivables FVTOCI 35 35Cash and cash equivalents Loans and receivables Amortised cost 3 138 3 138Total financial assets 6 644 6 644
Financial liabilities
Other forward exchange Held-for-tradingMandatorily at
FVTPL 384 384
Borrowings Other financial liabilitiesOther financial
liabilities 6 400 6 400
Trade payables Other financial liabilitiesOther financial
liabilities 11 300 11 300
Finance lease liabilities Other financial liabilitiesOther financial
liabilities 124 124
Other payables Other financial liabilitiesOther financial
liabilities 814 814
Competition Commission penalty Other financial liabilitiesOther financial
liabilities 1 335 1 335Total financial liabilities 20 357 20 357a. These equity securities represent investments that the group and company intends to hold for the long term for strategic purposes. As permitted
by IFRS 9, the group and company have designated these investments at the date of initial application as measured at FVTOCI. Unlike IAS 39, the accumulated fair value reserve related to these investments will never be reclassified to profit or loss.
b. Trade and other receivables that were classified as loans and receivables under IAS 39 are now classified at amortised cost.c. The group and company have a programme for sales without recourse of trade accounts receivable, referred to as true sale of receivables (TSR).
Through the TSR programme, the group and company surrender the control, risks and benefits associated with the accounts receivable sold. Therefore, the amount of receivables sold is recorded as a sale of financial assets and the balances are derecognised from the statements of financial position at the moment of sale. Upon adoption of IFRS 9, the group and company classified trade receivables subject to TSR programmes as financial assets that are held to collect or to sell and recognised them at FVTOCI. The fair value measurement was determined based on the invoice amount net of TSR expense payable, a Level 3 unobservable input. The TSR expense is insignificant due to the rate applicable and the short timeframe between the time of sale and the invoice due date.
Impairment of financial assetsIFRS 9 replaces the ‘incurred loss’ model in IAS 39 with an ‘expected credit loss’ (ECL) model. The new impairment model applies to financial assets measured at amortised cost, contract assets and debt investments at FVTOCI, but not to investments in equity instruments. Under IFRS 9, credit losses are recognised earlier than under IAS 39.
For assets in the scope of the IFRS 9 impairment model, impairment losses are generally expected to increase and become more volatile. The group and company have determined that the application of IFRS 9’s impairment requirements at 1 January 2018 resulted in an immaterial additional allowance for impairment.Additional information about how the group and company measures the allowance for impairment is described in note 21.
Hedge accountingIFRS 9 introduces a new hedge accounting model that is designed to more closely align with how entities undertake risk management activities when hedging financial and non-financial risk exposures, which may result in the increased application of hedge accounting.
The group and company did not apply hedge accounting under IAS 39, therefore no adjustments or changes are required. Hedge accounting was applied in the current financial year using IFRS 9 principles.
ArcelorMittal South Africa Audited Annual Financial Statements 2018 19
Audited Annual Financial Statements

Notes to the group and company annual financial statements continuedfor the year ended 31 December 2018
2. Application of new and revised International Financial Reporting Standards (IFRS) continued2.1 Changes in significant accounting policies due to new IFRS standards continued
TransitionChanges in accounting policies resulting from the adoption of IFRS 9 have been applied retrospectively, except as described below.
The group and company have used an exemption not to restate comparative information for prior periods with respect to classification and measurement (including impairment) requirements. Accordingly, the information presented for 2017 does not generally reflect the requirements of IFRS 9, but rather those of IAS 39.
The following assessments have been made on the basis of the facts and circumstances that existed at the date of initial application:–– The determination of the business model within which a financial asset is held–– The designation and revocation of previous designations of certain financial assets and financial liabilities as measured at FVTPL–– The designation of certain investments in equity instruments not held for trading as at FVTOCI
2.1.2 IFRS 15 Revenue from Contracts with CustomersIFRS 15 establishes a comprehensive framework for determining whether, how much and when revenue is recognised. It replaced IAS 18 Revenue, IAS 11 Construction Contracts and related interpretations. Under IFRS 15, revenue is recognised as performance obligations are met and when a customer obtains control of the goods or services. Determining the timing of the completion of performance obligations and transfer of control – at a point in time or over time – requires judgement.
Under IAS 18, revenue from the sale of long and flat steel products as well as beneficiated by-products in the ordinary course of the group and company’s activities were recognised when the amount of revenue can be reliably measured and when it is probable that future economic benefits will flow to the entity. Sales of goods are recognised based on the relevant delivery terms at which point the risks of obsolescence and loss have been transferred to the customer and either the customer has accepted the products in accordance with the sales contract or the group and company have objective evidence that all criteria for acceptance have been satisfied.
Under IFRS 15, revenue is recognised to the extent that it is highly probable that a significant reversal in the amount of cumulative revenue recognised will not occur and when the customer obtains control of the goods. The group and company’s revenue are predominantly derived from a single performance obligation to transfer products under arrangements in which the transfer on control of the products and the fulfilment of the group and company’s performance obligation occur at the same time.
Therefore, there is no change in when revenue is recognised under IAS 18 or IFRS 15. However there is a new asset for the right to recover returned goods, which is presented as part of inventory.
2.2 Standards and interpretations not yet effective for December 2018A number of new standards, amendments to standards and interpretations are effective for annual periods beginning on or after 1 January 2019, and earlier application is permitted. However, the group and company have not early adopted the new or amended standards in preparing these consolidated financial statements. Those which may be relevant to the group and company are set out below. These will be adopted in the period that they become mandatory unless otherwise indicated:
2.2.1 Effective for the financial year commencing 1 January 2019IFRS16 LeasesIFRS 16 Leases supersedes IAS 17 Leases; IFRIC 4 Determining whether an Arrangement contains a Lease; SIC 15 Operating Leases – Incentives; and SIC 27 Evaluating the Substance of Transactions Involving the Legal Form of a Lease.
IFRS 16 introduces a single lessee accounting model and requires all entities to reassess whether a contract is, or contains, a lease at the date of initial application. Lessees will have to recognise assets and liabilities for all leases with a term of more than 12 months, unless the underlying asset is of low value. A lessee is required to recognise a right-of-use asset representing its right to use the underlying leased asset and a lease liability representing its obligation to make lease payments. A lessee measures right-of-use assets similarly to other non-financial assets (such as property, plant and equipment) and lease liabilities similarly to other financial liabilities. As a consequence, a lessee recognises depreciation of the right-of-use asset and interest on the lease liability, and also classifies cash repayments of the lease liability into a principal portion and an interest portion and presents them in the statement of cash flows applying IAS 7 Statement of Cash Flows.
The group and company assessed the standard and the extent to which contracts currently accounted for as operating leases will result in additional assets and liabilities amounting to approximately R60 million being recognised in the statement of financial position.
Other standardsThe following amended standards and interpretations are not expected to have a significant impact on the group and company’s financial statements–– IFRIC 23 Uncertainty over Tax Treatments–– Prepayment Features with Negative Compensation (Amendments to IFRS 9)–– Long-term Interests in Associates and Joint Ventures (Amendments to IAS 28) –– Plan Amendment, Curtailment or Settlement (Amendments to IAS 19) –– Annual Improvements to IFRS Standards 2015–2017 Cycle –– Amendments to References to Conceptual Framework in IFRS Standards –– IFRS 17 Insurance Contracts
20 ArcelorMittal South Africa Audited Annual Financial Statements 2018

Notes to the group and company annual financial statements continuedfor the year ended 31 December 2018
3. Significant accounting policiesThe principal accounting policies applied in the preparation of the group and company financial statements are set out on the following pages. These policies have been consistently applied from the comparative year presented, unless otherwise indicated. Refer to note 2 for changes in significant accounting policies.
3.1 Statement of complianceThe annual financial statements are prepared in compliance with International Financial Reporting Standards (IFRS), the Companies Act No 71 of 2008, SAICA Financial Reporting Guides as issued by the Accounting Practices Committee and Financial Pronouncements as issued by the Financial Reporting Standards Council relevant to its operations and effective for annual reporting periods beginning on or after 1 January 2018.
3.2 Basis of preparationThe annual financial statements have been prepared under the historical cost convention, as modified by the revaluation of investments in equity instruments classified as fair value through other comprehensive income.
3.3 Investments in subsidiaries, joint ventures and associates by the companyThe company accounts for all investments in subsidiaries, jointly controlled entities and associates at cost less impairment.
Dividends received from subsidiaries, jointly controlled entities and associates are recognised in profit or loss when the company has the right to receive the dividend.
3.4 Basis of consolidationThe group’s annual financial statements incorporate financial statements of the company and its subsidiaries.
Subsidiaries are all investees (including structured entities) over which the group has control. The group controls an investee when it is exposed or has rights to variable returns from its involvement with the investee and has the ability to affect those returns through its power over the investee.
Subsidiaries are fully consolidated from the date on which control is transferred to the group. They are deconsolidated from the date that control ceases.
Intercompany transactions, balances and unrealised gains and losses on transactions between group companies are eliminated.
3.5 Interest in equity-accounted investeesA joint venture is a contractual arrangement whereby the parties that have joint control over the arrangement have rights to the net assets of the joint arrangement. Joint control is the contractually agreed sharing of control of an arrangement which exists only when the decision about the relevant activities requires the unanimous consent of the parties sharing control.
Joint venture arrangements that involve the establishment of a separate entity in which each venturer has an interest are referred to as jointly controlled entities.
An associate is an entity over which the group has significant influence and that is neither a subsidiary nor an interest in a joint venture. Significant influence is the power to participate in the financial and operating policy decisions of the investee, but is not control or joint control over those policies.
The assets and liabilities of jointly controlled entities and associates are incorporated in the group’s annual financial statements using the equity method of accounting, except when the investment is classified as held-for-sale, in which case it is accounted for in accordance with IFRS 5 Non-current Assets Held-for-Sale and Discontinued Operations.
Under the equity method, investments in joint ventures and associates are carried in the consolidated statement of financial position at cost and adjusted for post-acquisition changes in the group’s share of the net assets of the joint venture and associate, less any impairment in the value of individual investments.
The group’s share of its jointly controlled entities’ post-acquisition profits or losses and other comprehensive income is recognised in the statement of comprehensive income and statement of other comprehensive income respectively and its share of post-acquisition movements in reserves is recognised as reserves of the group. The cumulative post-acquisition movements are adjusted against the carrying amounts of the investment.
Losses of a jointly controlled entity and associate in excess of the group’s interest in that entity (which includes any long-term interests that, in substance, form part of the group’s net investment in the jointly controlled entity and associate) are recognised only to the extent that the group has incurred legal or constructive obligations or made payments on behalf of the jointly controlled entity and associate.
Where a group entity transacts with a jointly controlled entity and associate of the group, profits and losses are eliminated to the extent of the group’s interest in the relevant jointly controlled entity and associate.
ArcelorMittal South Africa Audited Annual Financial Statements 2018 21
Audited Annual Financial Statements
Notes to the group and company annual financial statements continuedfor the year ended 31 December 2018
3. Significant accounting policies continued3.6 Segment reporting
Operating segments are reported in a manner consistent with the internal reporting provided to the chief operating decision-maker (CODM). The CODM, who is responsible for allocating resources and assessing performance of the operating segments, has been identified as the executive committee of the group.
3.7 Foreign currency translationFunctional and presentation currency items included in the annual financial statements of each of the group’s entities are measured using the currency of the primary economic environment in which the entity operates (its functional currency). The consolidated financial statements are presented in ZAR, which is the company’s functional and presentation currency.
Transactions and balancesForeign currency transactions are translated into the functional currency using the exchange rates prevailing at the dates of the transactions. Foreign exchange gains and losses resulting from the settlement of such transactions and from the translation at year-end exchange rates of monetary assets and liabilities denominated in foreign currencies are recognised as gains or losses in the statement of comprehensive income, except when deferred in equity as qualifying cash flow hedges.
For fair value through other comprehensive income assets, changes in the fair value of such monetary securities denominated in foreign currency are analysed between translation differences resulting from changes in the amortised cost of the security, and other changes in the carrying amount of the security. Translation differences are recognised in the statement of comprehensive income. Changes in carrying amounts on non-monetary securities are recognised in equity.
Group companiesThe results and financial position of all the group entities that have a functional currency different from the presentation currency are translated into the presentation currency of the group as follows:–– Assets and liabilities for each reporting date presented are translated at the closing rate at the date of the statement of financial position–– Income and expenses for each reporting period are translated at average exchange rates for the reporting period–– All resulting exchange differences are recognised as a separate component of equity, within the translation of foreign operations reserve
On consolidation, exchange differences arising from the translation of the net investment in foreign operations are disclosed in the statement of comprehensive income and are taken to shareholders’ equity.
22 ArcelorMittal South Africa Audited Annual Financial Statements 2018
Notes to the group and company annual financial statements continuedfor the year ended 31 December 2018
3. Significant accounting policies continued3.8 Property, plant and equipment
Property, plant and equipment are recorded at cost less accumulated depreciation and impairment. Cost includes professional fees and, for assets constructed by the group and company, any related works to the extent that these are directly attributable to the acquisition or construction of the asset. Property, plant and equipment, except land, are depreciated using the straight-line method over the useful lives of the related assets. Depreciation, gains and losses on disposal and impairment losses are recognised in the statement of comprehensive income when incurred.
Major improvements, which are expected to generate future economic benefits over more than one reporting period, are capitalised, while repairs and maintenance are charged as an expense when incurred. Where a tangible fixed asset comprises major components having different useful lives, these components are accounted for as separate items.
Property, plant and equipment under construction are recorded as assets under construction until they are ready for their intended use; thereafter they are transferred to the related category of property, plant and equipment and depreciated over their estimated useful lives. Qualifying borrowing costs incurred during construction are capitalised. Gains and losses on retirement or disposal of assets are reflected in the statement of comprehensive income.
3.9 Accounting for finance leases as lesseeFinance lease arrangements consist of those transactions that are:–– Leases in both economic substance and legal form–– Those that arise out of commercial arrangements that in economic substance represent leases, though not in legal form
The group and company lease certain property, plant and equipment. Finance leases are capitalised at the lower of the fair value of the leased property, plant and equipment and the present value of the future minimum lease payments of the lease.
Each lease payment is allocated between the liability and finance charges so as to achieve a constant rate on the capital balance outstanding, using the effective interest rate method. The corresponding rental obligations, net of finance charges, are shown as finance lease obligations. The interest element of the finance cost is charged to the statement of comprehensive income over the lease period. The property, plant and equipment acquired under finance leases are depreciated over the shorter of the useful life of the asset and the lease term.
Finance lease obligations with settlement tenures greater than 12 months after the statement of financial position date, are classified as non-current finance lease obligations, while those to be settled within 12 months of the statement of financial position date are classified as current finance lease obligations.
3.10 Intangible assets3.10.1 Internally-generated intangible assets – research and development
Research expenditure is recognised as an expense when incurred. Costs incurred on development projects (relating to the design and testing of new or improved products) are recognised if the expenditure can be measured reliably, the product or process is technically and commercially feasible, future economic benefits are probable and the group intends to and has sufficient resources to complete development and to use or sell the asset.
Other development expenditures that do not meet these criteria are recognised as an expense when incurred.
Development assets are tested for impairment annually, in accordance with IAS 36 Impairment of Assets.
ArcelorMittal South Africa Audited Annual Financial Statements 2018 23
Audited Annual Financial Statements
Notes to the group and company annual financial statements continuedfor the year ended 31 December 2018
3. Significant accounting policies continued3.10 Intangible assets continued
3.10.2 Purchased intangible assets other than goodwillPatentsThe cost of acquisition of patents are capitalised at their historical cost as intangible assets, and amortised over the right-of-use period. This period is reviewed at least annually. Amortisation, gains and losses on disposal and impairment losses are reflected in the statement of comprehensive income.
Non-integrated computer softwareAcquired computer software licences are capitalised on the basis of the costs incurred to acquire and bring into use the specific software. These costs are amortised over their estimated useful lives.
Computer software development costs recognised as assets are amortised over their estimated useful lives, typically not exceeding seven years.
3.11 Impairment of tangible and intangible assetsAt each statement of financial position date, the group and company review the carrying amounts of tangible and intangible assets to determine whether there is any indication that those assets have suffered an impairment loss. If any such indication exists, the recoverable amount of the asset is estimated in order to determine the extent of the impairment loss (if any). In order to ensure completeness of the impairment assessment of individual assets, all tangible assets and intangible assets are allocated to the cash-generating unit to which they belong. An impairment assessment is then undertaken on the individual cash-generating units.
In assessing value-in-use, the estimated future cash flows are discounted to their present value using a post-tax discount rate that reflects the weighted average cost of capital of the company.
Where an impairment loss subsequently reverses, the carrying amount of the asset (cash-generating unit) is increased to the revised estimate of its recoverable amount, but so that the increased carrying amount does not exceed the carrying amount that would have been determined had no impairment loss been recognised for the asset (cash-generating unit) in prior years. A reversal of an impairment loss is recognised immediately in the statement of comprehensive income.
3.12 Financial assets Applicable after 1 January 2018Financial assets are recognised and derecognised on the trade date where the purchase or sale of the asset is under a contract whose terms require delivery within the timeframe established by the market concerned. These assets are initially measured at fair value, net of transaction costs except for those financial assets classified as fair value through profit or loss (FVTPL), which are initially measured at fair value.
Financial assets are classified into the following specified categories:–– Amortised cost–– Fair value through other comprehensive income–– Fair value through profit and loss
3.12.1 Measured at amortised costTrade receivables, loans and other receivables held to collect contractual cash flows that are solely payments of principal and interest on specified dates are classified as measured at amortised cost. These assets are subsequently measured at amortised cost using the effective interest method. The amortised cost is reduced by impairment losses. Interest income, foreign exchange gains and losses and impairment are recognised in profit and loss. Any gain or loss on derecognition is recognised in profit and loss.
3.12.2 FVTOCI financial assetsListed shares and similar securities held by the group and company that are traded in an active market are classified as being FVTOCI and are subsequently measured at fair value.
Dividends are recognised as income in profit or loss unless the dividend clearly represents a recovery of part of the cost of the investment. Other net gains and losses are recognised in OCI and are never reclassified to profit or loss.
24 ArcelorMittal South Africa Audited Annual Financial Statements 2018
Notes to the group and company annual financial statements continuedfor the year ended 31 December 2018
3. Significant accounting policies continuedFinancial assets continued3.12.3 FVTPL financial assets
All other financial assets that are neither classified as measured at amortised cost nor FVTOCI are classified as FVTPL. These assets are subsequently measured at fair value. Net gains and losses, including any interest or dividend income, are recognised in profit or loss.
3.12.4 Impairment of financial assets The group and company recognise loss allowance for estimated credit losses on financial assets measured at amortised cost and debt investments measured at FVTOCI.
The group and company measure loss allowances at an amount equal to lifetime estimated credit losses, except for the following, which are measured at 12-month estimated credit losses–– debt securities that are determined to have low credit risk at the reporting date–– other debt securities and bank balances for which credit risk (ie the risk of default occurring over the expected life of the financial instrument) has not increased significantly since initial recognition
Twelve-month estimated credit losses are the portion of estimated credit losses that result from default events that are possible within the 12-months after the reporting date.
Loss allowances for trade receivables, loans and other receivables are always measured at an amount equal to lifetime estimated credit losses. Lifetime estimated credit losses are the estimated credit losses that result from all possible default events over the expected life of a financial instrument.
An impairment loss related to financial assets is reversed if and to the extent that there has been a change in the estimates used to determine the recoverable amount. The loss is reversed only to the extent that the asset’s carrying amount does not exceed the carrying amount that would have been determined if no impairment loss had been recognised. Reversals of impairment are recognised in the statement of comprehensive income except for reversals of impairment of FVTOCI equity securities, which are recognised in equity.
Applicable before 1 January 2018Financial assets are recognised and derecognised on the trade date where the purchase or sale of the asset is under a contract whose terms require delivery within the timeframe established by the market concerned. These assets are initially measured at fair value, net of transaction costs except for those financial assets classified as fair value through profit or loss (FVTPL), which are initially measured at fair value.
Financial assets are classified into the following specified categories: –– Financial assets at FVTPL–– Available-for-sale (AFS) financial assets–– Loans and receivables
Financial assets at FVTPLFinancial assets at FVTPL are stated at fair value, with any resultant gain or loss recognised in the statement of comprehensive income.
AFS financial assets Listed shares and similar securities held by the group and company that are traded in an active market are classified as being AFS and are stated at fair value.
Loans and receivablesTrade receivables, loans and other receivables that have fixed or determinable payments that are not quoted in an active market are classified as loans and receivables.
Loans and receivables are measured at amortised cost using the effective interest method less any impairment.
ArcelorMittal South Africa Audited Annual Financial Statements 2018 25
Audited Annual Financial Statements

Notes to the group and company annual financial statements continuedfor the year ended 31 December 2018
3. Significant accounting policies continued3.12 Financial assets continued
Impairment of financial assetsA financial asset is considered to be impaired if there is objective evidence that one or more events has/have had a negative effect on the estimated future cash flows of that asset.
Estimated future cash flows are determined using various assumptions and techniques, including comparisons with published prices in an active market, comparative price-earnings multiples and discounted cash flow projections using projected growth rates, weighted average cost of capital and inflation rates.
In the case of AFS listed equity instruments, a significant or prolonged decline in the fair value of the security below its cost is considered an indicator that the securities are impaired. If any such evidence exists for these financial assets, the cumulative loss measured as the difference between the acquisition cost and the current fair value less any impairment loss on that financial asset previously recognised in the statement of comprehensive income, is removed from equity and recognised in the statement of comprehensive income.
If objective evidence indicates that cost method investments need to be tested for impairment, calculations are based on information derived from business plans and other information available for estimating their value-in-use. Any impairment loss is charged to the statement of comprehensive income.
An impairment loss related to financial assets is reversed if and to the extent that there has been a change in the estimates used to determine the recoverable amount. The loss is reversed only to the extent that the asset’s carrying amount does not exceed the carrying amount that would have been determined if no impairment loss had been recognised. Reversals of impairment are recognised in the statement of comprehensive income except for reversals of impairment of AFS equity securities, which are recognised in equity.
3.13 Financial liabilities and equity instruments issued by the group and company3.13.1 Classification as debt or equity
Debt and equity instruments are classified as either financial liabilities or as equity in accordance with the substance of the contractual arrangement.
3.13.2 Equity instruments An equity instrument is any contract that evidences a residual interest in the assets of an entity after deducting all of its liabilities. Equity instruments issued by a group entity are recognised at the proceeds received, net of direct issue costs.
3.13.3 Financial liabilities Financial liabilities are classified as either financial liabilities at FVTPL or measured at amortised cost. A financial liability is classified as a FVTPL if it is a derivative or it is designated as such on initial recognition.
Financial liabilities at FVTPL are stated at fair value, with any resultant gain or loss recognised in profit or loss. The net gain or loss recognised in profit or loss incorporates any interest paid on the financial liability.
3.13.4 Other financial liabilitiesOther financial liabilities, including borrowings and finance lease obligations, are initially measured at fair value, net of transaction costs. Subsequently these are measured at amortised cost using the effective interest method, with interest expense recognised on an effective yield basis. Interest expense and foreign exchange gains and losses are recognised in profit and loss. Any loss or gain on derecognition is also recognised in profit and loss.
26 ArcelorMittal South Africa Audited Annual Financial Statements 2018

Notes to the group and company annual financial statements continuedfor the year ended 31 December 2018
3. Significant accounting policies continued3.14 Derivative financial instruments
Derivatives are initially recognised at fair value at the date a derivative contract is entered into and are subsequently remeasured to their fair value at each statement of financial position date. The resulting gain or loss is recognised in profit or loss immediately unless the derivative is designated and effective as a hedging instrument, in which event the timing of the recognition in profit or loss depends on the nature of the hedge relationship.
The group and company designate certain derivatives as either hedges of the fair value of recognised assets, liabilities or firm commitments (fair value hedges), or hedges of highly probable forecast transactions or hedges of foreign currency risk of firm commitments (cash flow hedges). Hedges are accounted for as prescribed in IFRS 9 Financial Instruments. The group and company did not apply hedge accounting under IAS 39. Hedge accounting was applied in the current financial year using IFRS 9 principles.
At inception of designated hedging relationships, the group documents the risk management objective and strategy for undertaking the hedge. The group also documents the economic relationship between the hedged item and the hedging instrument, including whether the changes in cash flows of the hedged item and hedging instrument are expected to offset each other.
3.14.1 Cash flow hedgesWhen a derivative is designated as a cash flow hedging instrument, the effective portion of changes in the fair value of the derivative is recognised in OCI and accumulated in the hedging reserve. The effective portion of changes in the fair value of the derivative that is recognised in OCI is limited to the cumulative change in fair value of the hedged item, determined on a present value basis, from inception of the hedge. Any ineffective portion of changes in the fair value of the derivative is recognised immediately in profit or loss.
When the hedged forecast transaction subsequently results in the recognition of a non-financial item such as inventory, the amount accumulated in the hedging reserve is included directly in the initial cost of the non-financial item when it is recognised. For all other hedged forecast transactions, the amount accumulated in the hedging reserve is reclassified to profit or loss in the same period during which the hedged expected future cash flows affecting profit or loss.
3.15 InventoriesInventories are carried at the lower of cost and net realisable value. Cost is determined using the weighted average cost method. Work-in-progress and finished goods include the purchase costs of raw materials and conversion costs such as direct labour and an allocation of fixed and variable production overheads. Raw materials, qualifying spare parts and consumables are valued at cost inclusive of freight, shipping and handling costs.
Net realisable value represents the estimated selling price at which the inventories can be realised in the normal course of business after allowing for the cost of conversion from their existing state to a finished condition and for the cost of marketing, selling and distribution.
Costs incurred when production levels are abnormally low are partially capitalised as inventories and partially recorded as a component of cost of sales in the statement of comprehensive income.
3.16 Cash and cash equivalentsCash and cash equivalents include cash on hand, deposits held on call with banks, and other short-term highly liquid investments with original maturities of three months or less, which are subject to an insignificant risk of changes in value.
3.17 Restricted cashRestricted cash includes cash held in ceded bank accounts relating to environmental obligations and the true sale of receivables (TSR) facility.
ArcelorMittal South Africa Audited Annual Financial Statements 2018 27
Audited Annual Financial Statements
Notes to the group and company annual financial statements continuedfor the year ended 31 December 2018
3. Significant accounting policies continued3.18 Stated capital
Equity instruments issued by the company and group are classified according to the substance of the contractual arrangements entered into and the definition of an equity instrument. An equity instrument is any contract that evidences a residual interest in the assets of the company and group after deducting all liabilities.
Ordinary shares are classified as equity.
Incremental costs directly attributable to the issue of new shares or options are shown in equity as a deduction, net of tax effects, from the proceeds.
Where any group company purchases the company’s equity share capital (treasury shares), the consideration paid, including any directly attributable incremental costs (net of income taxes), is recognised in an equity reserve attributable to the company’s equity holders until the shares are cancelled or reissued. Where such shares are subsequently reissued, any consideration received (net of any directly attributable incremental transaction costs and the related income tax effects) is included in equity attributable to the company’s equity holders.
Capital distributions to shareholders through capital reduction programmes are credited against stated capital.
Income tax consequences of such and similar transactions are charged to profit or loss and not stated capital.
3.19 BorrowingsBorrowings are recognised initially at cost, which typically reflects the fair value of the funding transaction. Borrowings are subsequently measured at amortised cost.
Borrowings are classified as current liabilities unless the group and company have an unconditional right to defer settlement of the liability for at least 12 months after the statement of financial position date.
3.20 Deferred income taxDeferred income tax is provided in full, using the liability method, on temporary differences arising between the tax bases of assets and liabilities and their carrying amounts in the group and company annual financial statements. Deductible temporary differences are therefore recognised to the extent that taxable temporary differences exist or it is probable that taxable economic benefits will flow to the entity.
Deferred income tax assets are recognised to the extent that it is probable that future taxable profit will be available against which the temporary differences can be utilised.
3.21 Employee benefits 3.21.1 Short-term employee benefits
Services rendered by employees during a reporting period are recognised as the undiscounted amount of short-term employee benefits expected to be paid in exchange for that service as a liability, after deducting any amount already paid; and as an expense, unless included in the cost of inventory or property, plant and equipment. The cost of all short-term employee benefits, such as salaries, bonuses, housing allowances, medical and other contributions, is recognised during the period in which the employee renders the related service.
3.21.2 Short-term compensated absences (leave pay benefits)The expected cost of short-term employee benefits in the form of compensated absences are recognised (i) in the case of accumulating compensated absences, when the employees render service that increase their entitlement to future compensated absences; and (ii) in the case of non-accumulating compensated absences, when the absences occur. The leave pay benefits of the group and company are accumulative in nature.
28 ArcelorMittal South Africa Audited Annual Financial Statements 2018
Notes to the group and company annual financial statements continuedfor the year ended 31 December 2018
3. Significant accounting policies continued3.21 Employee benefits continued
3.21.3 Retirement benefitsContributions are paid in return for services rendered by the employees during the period. Such payments are expensed as they are incurred in line with the treatment of short-term employee benefits. No provisions are established in respect of defined contribution plans, as they do not generate future commitments.
Defined benefit plans are those plans that provide guaranteed benefits to certain categories of employees, by way of contractual obligations. The group’s net obligation in respect of defined benefit plans is calculated separately for each plan by estimating the amount of future benefit that employees have earned in the current and prior periods, discounting that amount and deducting the fair value of any plan assets.
The calculation of significant defined benefit obligations is performed annually by a qualified actuary using the projected unit credit method. When the calculation results in a potential asset for the group, the recognised asset is limited to the present value of economic benefits available in the form of any future refunds from the plan or reductions in future contributions to the plan. To calculate the present value of economic benefits, consideration is given to any applicable minimum funding requirements.
Remeasurements of the net defined benefit liability, which comprise actuarial gains and losses, the return on plan assets (excluding interest) and the effect of the asset ceiling are recognised immediately in other comprehensive income. The group determines the net interest expense (income) on the net defined benefit liability (asset) for the period by applying the discount rate used to measure the defined benefit obligation at the beginning of the annual period to the net defined benefit liability (asset) during the period as a result of contributions and benefit payments. Net interest expense and other expenses related to defined benefit plans are recognised in comprehensive income.
When the benefits of a plan are changed or when a plan is curtailed, the resulting change in benefit that relates to past service or the gain or loss on curtailment is recognised immediately in comprehensive income. The group recognises gains and losses on the settlement of a defined plan when the settlement occurs.
3.21.4 Medical benefitsNo contributions are made to the medical aid of retired employees, except for a closed group of early retirees in respect of whom contributions are made. The present value of the post-retirement medical aid obligation for such early retirements is actuarially determined annually on the projected unit credit method and any deficit or surplus is immediately recognised in profit or loss.
3.21.5 Termination benefitsTermination benefits are payable whenever an employee’s employment is terminated before the normal retirement date or whenever an employee accepts voluntary redundancy in exchange for these benefits.
The group and company recognise termination benefits when demonstrably committed to either:–– Terminate the employment of current employees according to a detailed formal plan without possibility of withdrawal or–– Provide termination benefits as a result of an accepted offer made to encourage voluntary redundancy in exchange for these benefits
3.22 Provisions and contingent liabilities3.22.1 Provisions
Provisions for asset retirement obligations, environmental remediation obligations, onerous contracts, restructuring costs, legal claims and similar obligations are recognised when:–– A present legal or constructive obligation exists as a result of past events–– It is probable that an outflow of resources will be required to settle the obligation–– The amount has been reliably estimated
Provisions are measured at the present value of the expenditures expected to be required to settle the obligation using a pre-tax discount rate that reflects current market assessments of the time value of money and the risks specific to the obligation.
The increase in provisions due to the passage of time is recognised as accretion expenses within finance charges. Changes in the discount rate are recognised as finance charges, except for asset retirement obligations which are capitalised to property, plant and equipment.
ArcelorMittal South Africa Audited Annual Financial Statements 2018 29
Audited Annual Financial Statements
Notes to the group and company annual financial statements continuedfor the year ended 31 December 2018
3. Significant accounting policies continued3.22 Provisions and contingent liabilities continued
3.22.2 Contingent liabilitiesLegal claims are assessed to determine whether a present obligation exists and whether the obligations are measurable.
A present obligation, classified as a provision, is recognised as probable and is measured at the estimated loss of the outcome if it is more than 50% likely to occur.
For claims that are reasonably possible, being between 20% and 50% likely, the facts and circumstances of the possible loss and an estimate of the amount, if determinable, are disclosed.
3.23 Revenue recognitionApplicable after 1 January 2018Sale of goodsThe group and company generate revenue primarily from the sale of long and flat steel products as well as beneficiated by-products in the ordinary course of the group and company’s activities.
Revenue is measured based on the consideration specified in a contract with a customer. Revenue is recognised at a point in time and to the extent that it is highly probable that a significant reversal in the amount of cumulative revenue recognised will not occur. Revenue is presented net of value added tax, returns, rebates, discounts and, in the case of the group accounts, after eliminating sales within the group. The group and company base such estimates on historical results, taking into consideration the type of customer, the type of transaction and the specifics of each arrangement. All amounts invoiced to a customer in a sale transaction related to distribution and handling costs are classified as revenue, with the costs related thereto shown as distribution and handling costs within other operating expenses.
For contracts that permit the customer to return an item, the amount of revenue recognised is adjusted for expected returns, which are estimated based on the historical data. In these circumstances, a refund liability and a right to recover returned goods asset are recognised. The right to recover returned goods asset is measured at the former carrying amount of the inventory less any expected costs to recover goods. The refund liability is included in other payables and the right to recover returned goods is included in inventory. The group and company review its estimate of expected returns at each reporting date and updates the amounts of the asset and liability accordingly.
The group and company recognise revenue when it transfers control over goods to a customer. Sales of goods are recognised based on the relevant delivery terms at which point the performance obligation are met and control of goods have been transferred to the customer. Control of goods transfer either when the customer has accepted the products in accordance with the sales contract or the group and company have objective evidence that all criteria for acceptance have been satisfied.
Applicable before 1 January 2018Sale of goodsRevenue comprises the fair value of the consideration received or receivable for the sale of long and flat steel products as well as beneficiated by-products in the ordinary course of the group and company’s activities. Revenue is shown net of value added tax, returns, rebates, discounts and, in the case of the group accounts, after eliminating sales within the group.
All amounts invoiced to a customer in a sale transaction related to distribution and handling costs are classified as revenue, with the costs related thereto shown as distribution and handling costs within other operating expenses.
The group and company recognise revenue when the amount of revenue can be reliably measured, when it is probable that future economic benefits will flow to the entity and when specific criteria have been met for each of the group and company’s activities as described below.
The amount of revenue is not considered to be reliably measurable until all contingencies relating to the sale have been resolved. The group and company base such estimates on historical results, taking into consideration the type of customer, the type of transaction and the specifics of each arrangement.
Sales of goods are recognised based on the relevant delivery terms at which point the risks of obsolescence and loss have been transferred to the customer and either the customer has accepted the products in accordance with the sales contract or the group and company have objective evidence that all criteria for acceptance have been satisfied.
30 ArcelorMittal South Africa Audited Annual Financial Statements 2018

Notes to the group and company annual financial statements continuedfor the year ended 31 December 2018
3. Significant accounting policies continued3.24 Operating leases
Operating lease payments are recognised as an expense on a straight-line basis over the lease term, except where another systematic basis is more representative of the time pattern in which economic benefits from the leased asset are consumed. Contingent rentals arising under operating leases are recognised as an expense in the period in which they are incurred and are not straight-lined.
3.25 Borrowing costsQualifying borrowing costs calculated in accordance with the effective interest rate method and directly attributable to the acquisition, construction or production of qualifying assets, for those assets that necessarily take a substantial period of time to get ready for their intended use or sale, are added to the cost of those assets, until such time as the assets are substantially ready for their intended use or sale.
All other borrowing costs are recognised in the statement of comprehensive income in the period incurred.
3.26 Share-based payments3.26.1 Equity-settled share-based payments
Equity-settled share-based payments to employees and others providing similar services are measured at the fair value of the equity instruments at the grant date.
Fair value determination of equity-settled share-based transactions is measured using the share price as reference point.
The fair value determined at the grant date of the equity-settled share-based payments is expensed on a straight-line basis over the vesting period, based on the group and company’s estimate of the number of equity instruments that will eventually vest. At each statement of financial position date, the group and company revise their estimate of the number of equity instruments expected to vest. The impact of the revision of the original estimates, if any, is recognised in profit or loss over the remaining vesting period, with a corresponding adjustment to the equity-settled employee benefits reserve.
3.26.2 Cash-settled share-based paymentsFor cash-settled share-based payments, a liability equal to the portion of goods or services received is recognised as the current fair value at each date of the statement of financial position.
3.26.3 Vesting conditionsVesting conditions are service conditions and performance conditions only. Other features of a share-based payment are not vesting conditions. Features of a share-based payment that are not vesting conditions are included in the grant date fair value of the share-based payment. The fair value also includes market-related vesting conditions.
3.27 TaxationIncome tax expense represents the sum of the tax currently payable and deferred tax (refer to note 3.20).
3.27.1 Normal taxThe current tax is based on taxable income or loss for the year. Taxable income or loss differs from income or loss as reported in the statement of comprehensive income because it excludes items of income or expense that are taxable or deductible in other years and it further excludes items that are never taxable or deductible (deferred tax). The liability for current tax is calculated using tax rates that have been enacted or substantively enacted by the date of the statement of financial position.
3.27.2 Withholding tax on dividendsWhere a legally enforceable right to offset exists for recognised financial assets and financial liabilities, and there is an intention to settle the liability and realise the asset simultaneously or to settle on a net basis, all related financial effects are offset.
ArcelorMittal South Africa Audited Annual Financial Statements 2018 31
Audited Annual Financial Statements

Notes to the group and company annual financial statements continuedfor the year ended 31 December 2018
4. Revenue The group and company generate revenue primarily from the sale of long and flat steel products as well as beneficiated by-products in the ordinary course of the group and company’s activities.
Group Company
2017Rm
2017Rm
Revenue from major products and servicesFlat steel productsHot rolled 21 848 18 107 15 357 12 945 Uncoated 2 981 2 924 2 981 2 924 Coated 6 183 6 195 6 183 6 195
31 012 27 226 24 521 22 064 Long steel productsMerchant bars 7 833 6 248 7 833 6 248 Wire rod 4 232 3 473 4 232 3 473 Seamless 854 723 854 723
12 919 10 444 12 919 10 444 Coke and chemicalsCoke and tar 1 269 1 259 1 269 1 259 Other 74 93 74 93
1 343 1 352 1 343 1 352 Total 45 274 39 022 38 783 33 860 Revenue to external customers Local 35 276 31 706 32 964 29 246 Export 9 998 7 316 5 819 4 614 Africa 7 967 5 673 3 788 2 971 Asia 1 425 1 003 1 425 1 003 Other 606 640 606 640
Total 45 274 39 022 38 783 33 860
5. Segment reportOperating segments are identified on the basis of internal reports about components of the group that are regularly reviewed by the CODM, in order to allocate resources to the segment and to assess its performance. Segments are identified based on major product categories. These segments offer different products and are managed separately because they require different investment and marketing strategies. The segment report discloses revenue disaggregation in terms of IFRS 15.
The group’s reportable segments are:–– Flat steel products consisting of Vanderbijlpark Works, Saldanha Works and ArcelorMittal South Africa Distribution–– Long steel products consisting of Newcastle Works, Vereeniging Works and the decommissioned Maputo Works–– Coke and Chemicals undertaking the processing and marketing of by-products and the production and marketing of commercial grade coking coal–– Corporate and other, consisting of sales and marketing functions, procurement and logistics activities, shared services, centres of excellence, the decommissioned Pretoria Works site, investments carried at FVTOCI (2017: Available-for-sale investments) and the results of the non-trading consolidated subsidiaries and consolidated structured entities
Segment profit/(loss) from operations represents the profit/(loss) earned/(incurred) by each segment without the allocation of after-tax profits of equity-accounted investments, net interest income, income from investments and income tax expenses.
All assets and liabilities are allocated to the operating segments, other than for the following items that are allocated exclusively to the corporate and other segment, reflecting the manner in which resource allocation is measured.
Assets not allocated to operating segments:–– Results of consolidated subsidiaries and consolidated structured entities, other than for Saldanha Works which is a subsidiary allocated to the flat steel products segment–– Investments in equity-accounted entities–– Investments carried at FVTOCI (2017: Available-for-sale investments)–– Cash and cash equivalents–– Income tax, capital gains tax and value added tax-related assets, as applicable
Liabilities not allocated to operating segments are income tax, capital gains tax and value added tax-related liabilities, as applicable.
2018Rm
2018Rm
32 ArcelorMittal South Africa Audited Annual Financial Statements 2018

Notes to the group and company annual financial statements continuedfor the year ended 31 December 2018
Flat steel products
Rm
Long steel
productsRm
Coke and Chemicals
Rm
Corporate and other
Rm
Adjustments and
eliminationsRm
Total reconciling
to the consolidated
amountsRm
5. Segment report continuedFor the year ended 31 December 2018RevenueExternal customers 31 012 12 919 1 343 – – 45 274 Intersegment customers 907 1 986 33 – (2 926) –
Total revenue 31 919 14 905 1 376 – (2 926) 45 274
Revenue to external customers distributed as:
Local 23 621 10 312 1 343 – – 35 276 Africa 6 062 1 905 – – – 7 967 Asia 1 139 286 – – – 1 425 Other 190 416 – – – 606
Total 31 012 12 919 1 343 – – 45 274
ResultsEarnings before interest, tax,
depreciation and amortisation 2 670 808 370 (243) 3 3 608 Depreciation and amortisation (393) (334) (82) (22) – (831)
Profit/(loss) from operations 2 277 474 288 (265) 3 2 777 Gain on sale of investment – – – 2 452 (2 037) 415 Impairments – – – (72) 62 (10)Finance and investment income 12 2 – 373 – 387 Finance costs (255) (213) (8) (1 817) (107) (2 400)Income after tax from equity-
accounted investments – – – 138 – 138
Profit/(loss) before taxation 2 034 263 280 809 (2 079) 1 307 Income taxation (expense)/credit (9) – – 72 – 63
Profit/(loss) for the year 2 025 263 280 881 (2 079) 1 370
Segment assets (excluding investments in equity-accounted entities) 15 208 8 631 1 287 3 966 (752) 28 340
Investments in equity-accounted entities – – – 220 – 220
Segment liabilities 6 361 2 564 174 11 872 (372) 20 599 Cash generated from operations 1 889 82 255 56 – 2 282 Capital expenditure 785 363 25 83 – 1 256 Number of employees at the end of
the year 4 834 2 497 249 1 257 – 8 837
ArcelorMittal South Africa Audited Annual Financial Statements 2018 33
Audited Annual Financial Statements

Notes to the group and company annual financial statements continuedfor the year ended 31 December 2018
Flat steel products
Rm
Long steel
productsRm
Coke and Chemicals
Rm
Corporate and other
Rm
Adjustments and
eliminationsRm
Total reconciling
to the consolidated
amountsRm
5. Segment report continuedFor the year ended 31 December 2017RevenueExternal customers 27 226 10 444 1 352 – – 39 022 Intersegment customers 569 1 347 52 – (1 968) –
Total revenue 27 795 11 791 1 404 – (1 968) 39 022 Revenue to external customers
distributed as:Local 22 246 8 108 1 352 – – 31 706 Africa 4 214 1 459 – – – 5 673 Asia 733 270 – – – 1 003 Other 33 607 – – – 640
Total 27 226 10 444 1 352 – – 39 022
ResultsEarnings before interest, tax,
depreciation and amortisation 264 (945) 365 13 (12) (315)Depreciation and amortisation (570) (383) (48) (21) 46 (976)Thabazimbi mine closure costs 95 44 – (98) – 41 Competition Commission settlement – – – 30 – 30
(Loss)/profit from operations (211) (1 284) 317 (76) 34 (1 220)Impairments (1 587) (1 007) – (10) – (2 604)Finance and investment income 20 40 2 12 – 74 Finance costs (247) (185) (12) (1 071) – (1 515)Income after tax from equity-
accounted investments – – – 139 – 139
(Loss)/profit before taxation (2 025) (2 436) 307 (1 006) 34 (5 126)Income taxation expense – – – (2) – (2)
(Loss)/profit for the year (2 025) (2 436) 307 (1 008) 34 (5 128)
Segment assets (excluding investments in equity-accounted entities) 13 900 7 911 1 266 4 585 (890) 26 772
Investments in equity-accounted entities – – – 4 424 – 4 424
Segment liabilities 5 975 2 686 203 14 272 2 23 138 Cash (utilised in)/generated from
operations (1 159) (1 118) 364 1 201 – (712)Capital expenditure 858 253 276 (63) – 1 324 Number of employees at the end of
the year 5 084 2 696 254 879 – 8 913
34 ArcelorMittal South Africa Audited Annual Financial Statements 2018

Notes to the group and company annual financial statements continuedfor the year ended 31 December 2018
2017Rm
5. Segment report continued5.1 Revenue from major products and services
The group’s revenue from its major products sold to external customers was:Flat steel productsHot rolled 21 848 18 107Uncoated 2 981 2 924Coated 6 183 6 195
31 012 27 226
Long steel productsMerchant Bars 7 833 6 248Wire rod 4 232 3 473Seamless 854 723
12 919 10 444
Coke and ChemicalsCoke and tar 1 269 1 259Other 74 93
1 343 1 352
Total consolidated revenue 45 274 39 022
5.2 Geographical informationThe group operates principally in South Africa. Export sales are primarily sold into sub-Saharan Africa and Asia.
5.3 Information about major customers
Flat steel products
Rm
Long steel products
Rm
Total revenue
Rm% of group
revenue
2018Revenue of major customersMacsteel Services Centres SA (Pty) Ltd 3 948 1 843 5 791 12.79Macsteel International Trading BV 5 829 1 739 7 568 16.72
Total 9 777 3 582 13 359 29.51
2017Revenue of major customersMacsteel Services Centres SA (Pty) Ltd 3 615 1 498 5 113 13.10Macsteel International Trading BV 3 753 1 552 5 305 13.60
Total 7 368 3 050 10 418 26.70
2018Rm
ArcelorMittal South Africa Audited Annual Financial Statements 2018 35
Audited Annual Financial Statements
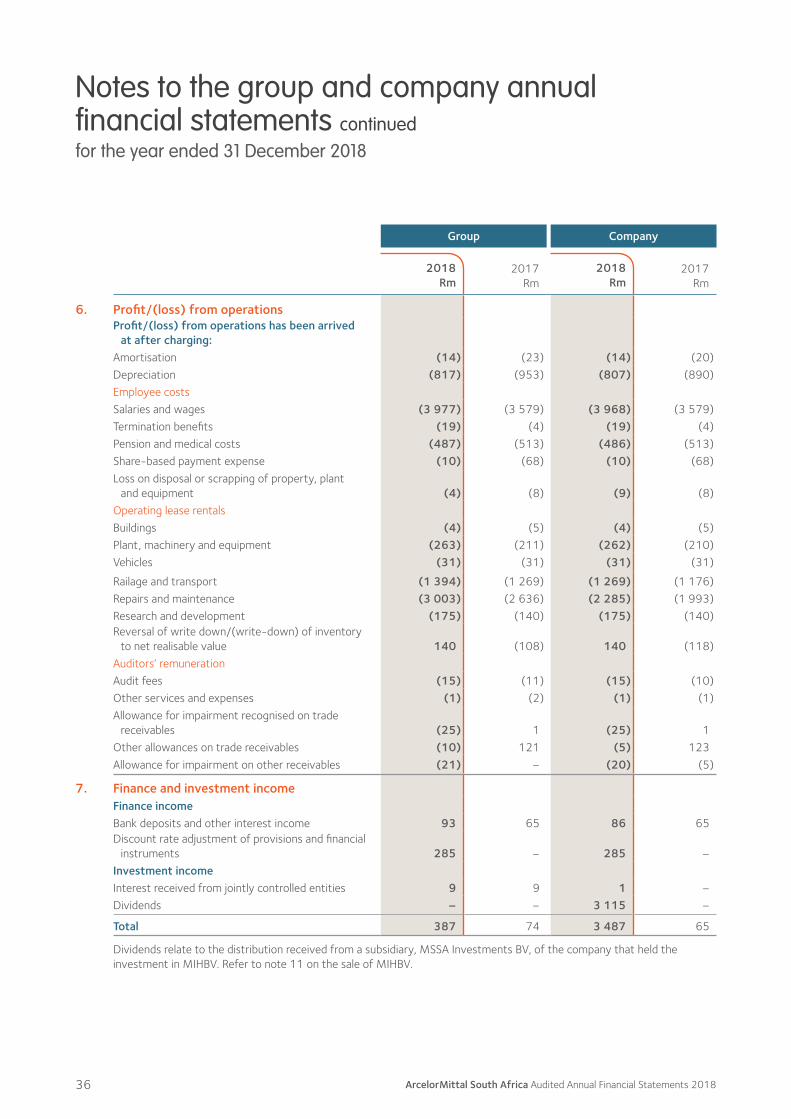
Notes to the group and company annual financial statements continuedfor the year ended 31 December 2018
Group Company
2017Rm
2017Rm
6. Profit/(loss) from operationsProfit/(loss) from operations has been arrived
at after charging:Amortisation (14) (23) (14) (20)Depreciation (817) (953) (807) (890)Employee costsSalaries and wages (3 977) (3 579) (3 968) (3 579)Termination benefits (19) (4) (19) (4)Pension and medical costs (487) (513) (486) (513)Share-based payment expense (10) (68) (10) (68)Loss on disposal or scrapping of property, plant
and equipment (4) (8) (9) (8)Operating lease rentalsBuildings (4) (5) (4) (5)Plant, machinery and equipment (263) (211) (262) (210)Vehicles (31) (31) (31) (31)
Railage and transport (1 394) (1 269) (1 269) (1 176)Repairs and maintenance (3 003) (2 636) (2 285) (1 993)Research and development (175) (140) (175) (140)Reversal of write down/(write-down) of inventory
to net realisable value 140 (108) 140 (118)Auditors’ remunerationAudit fees (15) (11) (15) (10)Other services and expenses (1) (2) (1) (1)Allowance for impairment recognised on trade
receivables (25) 1 (25) 1 Other allowances on trade receivables (10) 121 (5) 123 Allowance for impairment on other receivables (21) – (20) (5)
7. Finance and investment incomeFinance incomeBank deposits and other interest income 93 65 86 65Discount rate adjustment of provisions and financial
instruments 285 – 285 –Investment incomeInterest received from jointly controlled entities 9 9 1 –Dividends – – 3 115 –
Total 387 74 3 487 65
Dividends relate to the distribution received from a subsidiary, MSSA Investments BV, of the company that held the investment in MIHBV. Refer to note 11 on the sale of MIHBV.
2018Rm
2018Rm
36 ArcelorMittal South Africa Audited Annual Financial Statements 2018

Notes to the group and company annual financial statements continuedfor the year ended 31 December 2018
Group Company
2017Rm
2017Rm
8. Finance costsInterest expense on loans (976) (870) (937) (838)Interest expense on finance lease obligations (15) (24) (6) (12)Net foreign exchange losses on financing activities (1 112) (218) (971) (185)Discount rate adjustment of provisions and financial
liabilities – (76) – (215)Unwinding of discounting effect on provisions and
financial liabilities (297) (327) (294) (184)
Total (2 400) (1 515) (2 208) (1 434)
Transaction costs relating to the BBF of R61 million were capitalised in 2017. These costs are amortised on a monthly basis over a period of 36 months. No costs were capitalised during 2018.
Group Company
2017Rm
2017Rm
9. Impairment of other assetsImpairment of equity-accounted investments (10) (10) – –Impairment of investment in subsidiaries – – (62) (721)
Total (10) (10) (62) (721)
Impairment of equity-accounted investmentsThe group impairment relates to the write off of loans advanced to Coza Mining (Pty) Ltd that were not recoverable.
Impairment of investment in subsidiariesMSSA Investment BV held the investment in MIHBV. After the sale of MIHBV, the investment of R241 million was impaired. Refer to note 11 for the sale of MIHBV.
A reversal of impairment on the investment in Saldanha Steel (Pty) Ltd of R197 million was made in 2018 (2017: impairment of R541 million). This reversal was made after taking into account the shareholders’ loan and the intercompany balances in favour of Saldanha Steel (Pty) Ltd. The intercompany balances in favour of Saldanha Steel (Pty) Ltd increased resulting in the reversal of the impairment of this investment. This reversal was recognised in “Impairment of other assets” on the statement of comprehensive income and relates to “Investments in subsidiaries” on the statement of financial position.
An impairment of R14 million (2017: R176 million impairment reversal) relates to the investment in Vicva Investments and Trading Nine (Pty) Ltd that was measured at fair value. Fair value is based on the share price of ArcelorMittal South Africa. Vicva Investments and Trading Nine (Pty) Ltd is a beneficial shareholder of ArcelorMittal South Africa and holds 1.6% (2017: 1.6%) of the issued shares.
The remaining impairment losses of R4 million (2017: R4 million) relate to the impairment of the loan to the subsidiary Oakwood Trading (Pty) Ltd that is not recoverable.
2018Rm
2018Rm
2018Rm
2018Rm
ArcelorMittal South Africa Audited Annual Financial Statements 2018 37
Audited Annual Financial Statements

Notes to the group and company annual financial statements continuedfor the year ended 31 December 2018
Group Company
2017Rm
2017Rm
10. Income taxation credit/(expense)10.1 Income tax recognised in profit or loss
Current income tax charge 22 (1) 33 –Adjustments for current tax of prior periods 41 (1) 41 –
Total 63 (2) 74 –
The total charge for the year can be reconciled to the accounting profit as follows:
Profit/(loss) before tax 1 307 (5 126) 3 446 (5 591)
Income tax credit calculated at 28% (366) 1 436 (965) 1 565 Effect of income that is non-taxable/exempt
– dividend received – – 870 –Effect of income that is non-taxable/exempt
– Ferrosure Isle of Man (Cell captive) (45) – (45) –Competition Commission administrative
penalty (34) (31) (34) (31)Impairment of investments in subsidiaries (3) (6) (17) (54)Other non-deductible expenses (4) (21) (4) (21)Effect of timing differences not recognised in
the current year in relation to unrecognised deferred tax asset 322 (1 411) 195 (1 459)
Effect of (i) equity-accounted investments disclosed net of tax on the statement of comprehensive income and (ii) the effect of different tax rates of subsidiaries operating in other jurisdictions 129 39 – –
Adjustments recognised in the current year in relation to the current tax and deferred tax of prior years 41 (1) 41 –
SARS interest expense and penalties (10) (7) – –SARS interest income 33 – 33 –
Total income tax credit/(expense) 63 (2) 74 –
Although the corporate tax rate is 28%, the actual average tax rate for the group and company was negative 5% (2017: 0%) and negative 2% (2017: 0%) respectively. The negative tax rate was as a result of an income tax receivable due to a settlement with the South African Revenue Services during 2018 as well as utilising previously accumulated assessed losses.
2018Rm
2018Rm
38 ArcelorMittal South Africa Audited Annual Financial Statements 2018

Notes to the group and company annual financial statements continuedfor the year ended 31 December 2018
10. Income taxation credit/(expense) continued10.2 Deferred income tax liability
The following is the analysis of deferred tax assets/(liabilities) presented in the consolidated statement of financial position:
Property, plant,
equip-ment
and intangible
assetsRm
Employee costs
RmProvisions
Rm
Impair-ments oftrade and
otherreceivables
Rm
Finance lease
obligationsRm
OtherRm
Unused tax
losses and
creditsRm
Closing balance
Rm
GROUP2018Temporary differencesAt the beginning
of the year 1 208 (147) (648) (12) (35) (520) 154 –Charged to
statement of comprehensive income 11 (4) 78 (10) 18 (5) (88) –
At the end of the year 1 219 (151) (570) (22) (17) (525) 66 –
2017Temporary differencesAt the beginning
of the year 1 582 (160) (442) (12) (54) (578) (336) –Charged to
statement of comprehensive income (374) 13 (206) – 19 58 490 –
At the end of the year 1 208 (147) (648) (12) (35) (520) 154 –
COMPANY2018Temporary differencesAt the beginning
of the year 1 270 (148) (641) (13) (16) (459) 7 –Charged to
statement of comprehensive income 131 (2) 82 (9) 16 (2) (216) –
At the end of the year 1 401 (150) (559) (22) – (461) (209) –
2017Temporary differencesAt the beginning
of the year 1 555 (160) (434) (12) (30) (511) (408) –Charged to
statement of comprehensive income (285) 12 (207) (1) 14 52 415 –
At the end of the year 1 270 (148) (641) (13) (16) (459) 7 –
ArcelorMittal South Africa Audited Annual Financial Statements 2018 39
Audited Annual Financial Statements
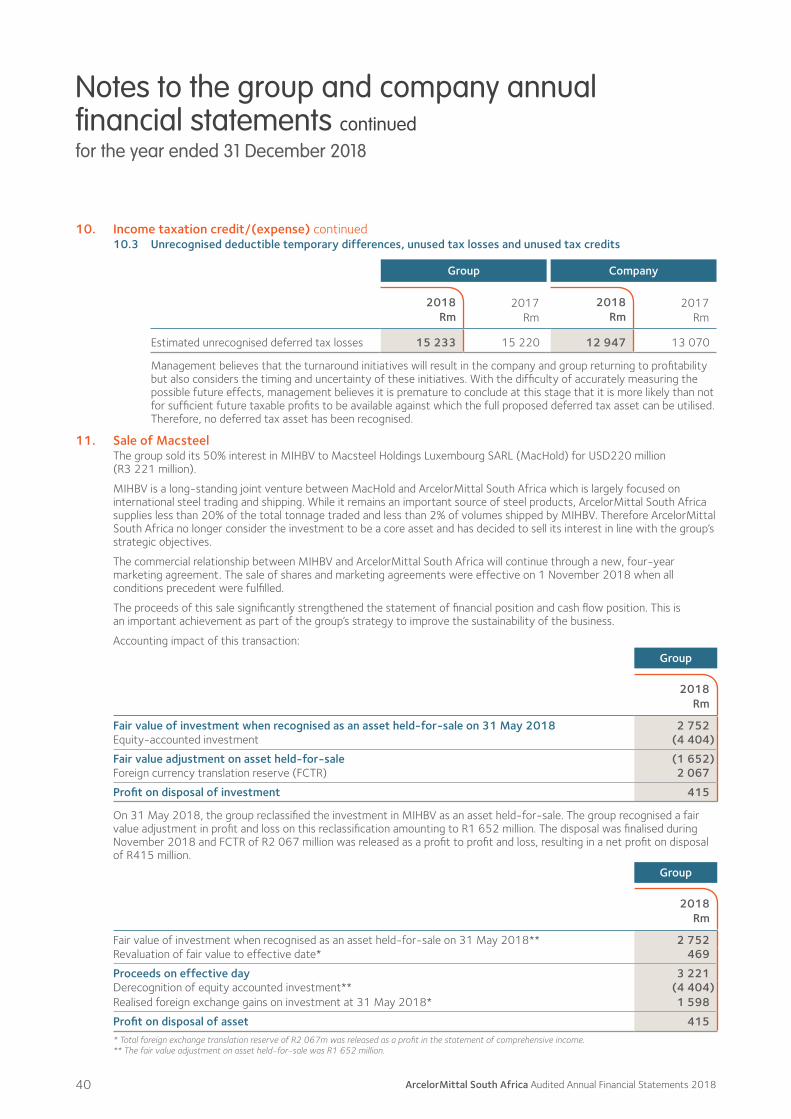
Notes to the group and company annual financial statements continuedfor the year ended 31 December 2018
10. Income taxation credit/(expense) continued10.3 Unrecognised deductible temporary differences, unused tax losses and unused tax credits
Group Company
2017Rm
2017Rm
Estimated unrecognised deferred tax losses 15 233 15 220 12 947 13 070
Management believes that the turnaround initiatives will result in the company and group returning to profitability but also considers the timing and uncertainty of these initiatives. With the difficulty of accurately measuring the possible future effects, management believes it is premature to conclude at this stage that it is more likely than not for sufficient future taxable profits to be available against which the full proposed deferred tax asset can be utilised. Therefore, no deferred tax asset has been recognised.
11. Sale of MacsteelThe group sold its 50% interest in MIHBV to Macsteel Holdings Luxembourg SARL (MacHold) for USD220 million (R3 221 million).
MIHBV is a long-standing joint venture between MacHold and ArcelorMittal South Africa which is largely focused on international steel trading and shipping. While it remains an important source of steel products, ArcelorMittal South Africa supplies less than 20% of the total tonnage traded and less than 2% of volumes shipped by MIHBV. Therefore ArcelorMittal South Africa no longer consider the investment to be a core asset and has decided to sell its interest in line with the group’s strategic objectives.
The commercial relationship between MIHBV and ArcelorMittal South Africa will continue through a new, four-year marketing agreement. The sale of shares and marketing agreements were effective on 1 November 2018 when all conditions precedent were fulfilled.
The proceeds of this sale significantly strengthened the statement of financial position and cash flow position. This is an important achievement as part of the group’s strategy to improve the sustainability of the business.
Accounting impact of this transaction:Group
Fair value of investment when recognised as an asset held-for-sale on 31 May 2018 2 752Equity-accounted investment (4 404)
Fair value adjustment on asset held-for-sale (1 652)Foreign currency translation reserve (FCTR) 2 067
Profit on disposal of investment 415
On 31 May 2018, the group reclassified the investment in MIHBV as an asset held-for-sale. The group recognised a fair value adjustment in profit and loss on this reclassification amounting to R1 652 million. The disposal was finalised during November 2018 and FCTR of R2 067 million was released as a profit to profit and loss, resulting in a net profit on disposal of R415 million.
Group
Fair value of investment when recognised as an asset held-for-sale on 31 May 2018** 2 752Revaluation of fair value to effective date* 469
Proceeds on effective day 3 221Derecognition of equity accounted investment** (4 404)Realised foreign exchange gains on investment at 31 May 2018* 1 598
Profit on disposal of asset 415* Total foreign exchange translation reserve of R2 067m was released as a profit in the statement of comprehensive income.** The fair value adjustment on asset held-for-sale was R1 652 million.
2018Rm
2018Rm
2018Rm
2018Rm
40 ArcelorMittal South Africa Audited Annual Financial Statements 2018

Notes to the group and company annual financial statements continuedfor the year ended 31 December 2018
12. Earnings per shareBasic profit/(loss) per share is calculated by dividing profit/(loss) attributable to the owners of the company by the weighted average number of ordinary shares, after taking the effects the B-BBEE transaction into account. Where appropriate adjustments are made in calculating diluted profit/(loss), headline and diluted headline earnings/(loss) per share.
Group
2017
Weighted average number of shares 1 093 509 570 1 093 509 570Weighted average number of diluted shares 1 093 509 570 1 093 509 570Weighted average number of diluted shares are calculated by adjusting the weighted average number of ordinary shares with additional ordinary shares held by third parties that would have been outstanding assuming the conversion of all outstanding share options representing dilutive potential ordinary shares. Based on the current share price of ArcelorMittal South Africa, the B-BBEE transaction does not have a dilutive impact on the shareholding. No other outstanding shares had a dilutive impact.
Profit/(loss) attributable to the owners of the company per shareBasicProfit/(loss) attributable to owners of the company (Rm) 1 370 (5 128)Weighted average number of shares 1 093 509 570 1 093 509 570Basic profit/(loss) per share (cents) 125 (469)
DilutedProfit/(loss) attributable to owners of the company (Rm) 1 370 (5 128)Weighted average number of diluted shares 1 093 509 570 1 093 509 570Diluted profit/(loss) per share (cents) 125 (469)
Headline earnings/(loss) per shareThe calculation for headline earnings/(loss) per share is based on the basic
profit/(loss) per share calculation, reconciled as follows:GrossProfit/(loss) before tax (Rm) 1 307 (5 126)Add: Impairment charges of property, plant and equipment (Rm) – 2 594Add: Impairment of investments in joint ventures and associates (Rm) 10 10Add: Loss on disposal or scrapping of property, plant and equipment (Rm) 4 8Add: Fair value adjustment on investment held-for-sale (Rm) 1 652 –Less: Reclassification of foreign currency differences on sale of foreign investment (Rm) (2 067) –
Headline earnings/(loss) before tax (Rm) 906 (2 514)
Net of taxProfit/(loss) attributable to owners of the company (Rm) 1 370 (5 128)Add: Impairment charges of property, plant and equipment (Rm) – 2 594Add: Impairment of investments in joint ventures and associates (Rm) 10 10Add: Loss on disposal or scrapping of property, plant and equipment (Rm) 3 6Add: Fair value adjustment on investment held-for-sale (Rm) 1 652 –Less: Reclassification of foreign currency differences on sale of foreign investment (Rm) (2 067) –
Headline earnings/(loss) net of tax (Rm) 968 (2 518)
BasicHeadline earning/(loss) (Rm) 968 (2 518)Weighted average number of shares 1 093 509 570 1 093 509 570
Basic headline earnings/(loss) per share (cents) 89 (230)
DilutedHeadline earning/(loss) (Rm) 968 (2 518)Weighted average number of diluted shares 1 093 509 570 1 093 509 570
Diluted headline earnings/(loss) per share (cents) 89 (230)
13. Dividend per shareConsistent with the group’s dividend policy, payment of any dividends is subject to the discretion of the board. It will depend on the earnings, financial condition, cash availability and any capital requirements necessary to sustain the business and support future growth. No dividends were declared for the 2018 and 2017 financial years.
2018
ArcelorMittal South Africa Audited Annual Financial Statements 2018 41
Audited Annual Financial Statements

Notes to the group and company annual financial statements continuedfor the year ended 31 December 2018
Land Rm
Buildingsand
infra-structure
Rm
Machinery, plant
and equipment
Rm
Site prep-
arationRm
Asset retirement obligation
Rm
Leased assets*
Rm
Con-struction
in progress
RmTotal
Rm
14. Property, plant and equipmentGROUPFor the year ended
31 December 2018Carrying amount at the
beginning of the year 41 368 7 533 17 3 83 429 8 474 Additions – 1 865 – – – 495 1 361 Disposals – – (21) – – – – (21)Depreciation – (52) (719) (2) 5 (49) – (817)Reallocations – – 302 – – – (302) –Other movements** (4) – 28 – (8) 7 (25) (2)
Carrying amount at the end of the year 37 317 7 988 15 – 41 597 8 995
At 31 December 2018Cost 68 2 430 35 083 93 200 1 684 602 40 160 Accumulated depreciation
and impairment (31) (2 113) (27 095) (78) (200) (1 643) (5) (31 165)
Net carrying value 37 317 7 988 15 – 41 597 8 995
For the year ended 31 December 2017
Carrying amount at the beginning of the year 52 554 8 587 19 4 134 1 320 10 670
Additions – – 1 294 – – – 81 1 375 Disposals (4) – (18) – – – – (22)Depreciation – (45) (854) (2) (1) (51) – (953)Impairment (7) (140) (2 449) – – – – (2 596)Reallocations – (1) 973 – – – (972) –
Carrying amount at the end of the year 41 368 7 533 17 3 83 429 8 474
As at 31 December 2017
Cost 67 2 080 34 768 98 207 5 047 429 42 696 Accumulated depreciation
and impairment (26) (1 712) (27 235) (81) (204) (4 964) – (34 222)
Balance at 31 December 2017 41 368 7 533 17 3 83 429 8 474
* During the year, fully depreciated leased assets relating to Thabazimbi mine were derecognised.** During the year property, plant and equipment were reclassified within categories to reflect the appropriate classification.
42 ArcelorMittal South Africa Audited Annual Financial Statements 2018
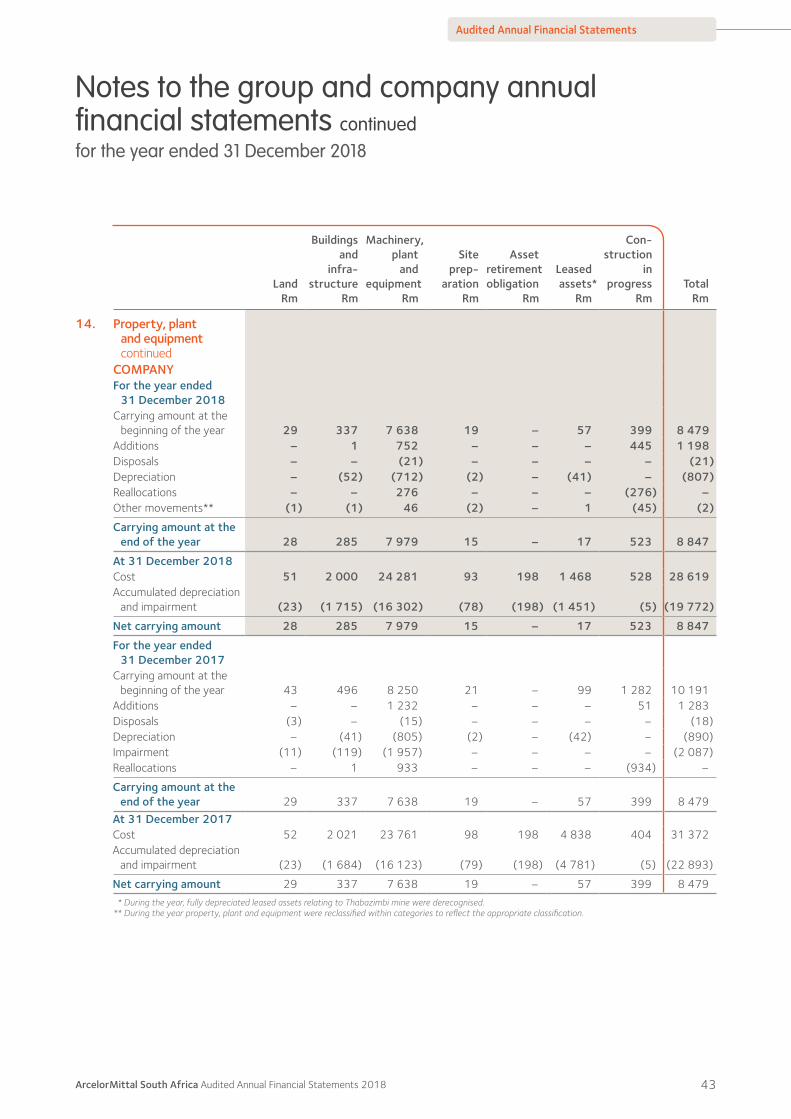
Notes to the group and company annual financial statements continuedfor the year ended 31 December 2018
Land Rm
Buildingsand
infra-structure
Rm
Machinery, plant
and equipment
Rm
Site prep-
arationRm
Asset retirement obligation
Rm
Leased assets*
Rm
Con-struction
in progress
RmTotal
Rm
14. Property, plant and equipment continued
COMPANYFor the year ended
31 December 2018Carrying amount at the
beginning of the year 29 337 7 638 19 – 57 399 8 479 Additions – 1 752 – – – 445 1 198 Disposals – – (21) – – – – (21)Depreciation – (52) (712) (2) – (41) – (807)Reallocations – – 276 – – – (276) –Other movements** (1) (1) 46 (2) – 1 (45) (2)
Carrying amount at the end of the year 28 285 7 979 15 – 17 523 8 847
At 31 December 2018Cost 51 2 000 24 281 93 198 1 468 528 28 619 Accumulated depreciation
and impairment (23) (1 715) (16 302) (78) (198) (1 451) (5) (19 772)
Net carrying amount 28 285 7 979 15 – 17 523 8 847
For the year ended 31 December 2017
Carrying amount at the beginning of the year 43 496 8 250 21 – 99 1 282 10 191
Additions – – 1 232 – – – 51 1 283 Disposals (3) – (15) – – – – (18)Depreciation – (41) (805) (2) – (42) – (890)Impairment (11) (119) (1 957) – – – – (2 087)Reallocations – 1 933 – – – (934) –
Carrying amount at the end of the year 29 337 7 638 19 – 57 399 8 479
At 31 December 2017Cost 52 2 021 23 761 98 198 4 838 404 31 372 Accumulated depreciation
and impairment (23) (1 684) (16 123) (79) (198) (4 781) (5) (22 893)
Net carrying amount 29 337 7 638 19 – 57 399 8 479 * During the year, fully depreciated leased assets relating to Thabazimbi mine were derecognised.
** During the year property, plant and equipment were reclassified within categories to reflect the appropriate classification.
ArcelorMittal South Africa Audited Annual Financial Statements 2018 43
Audited Annual Financial Statements
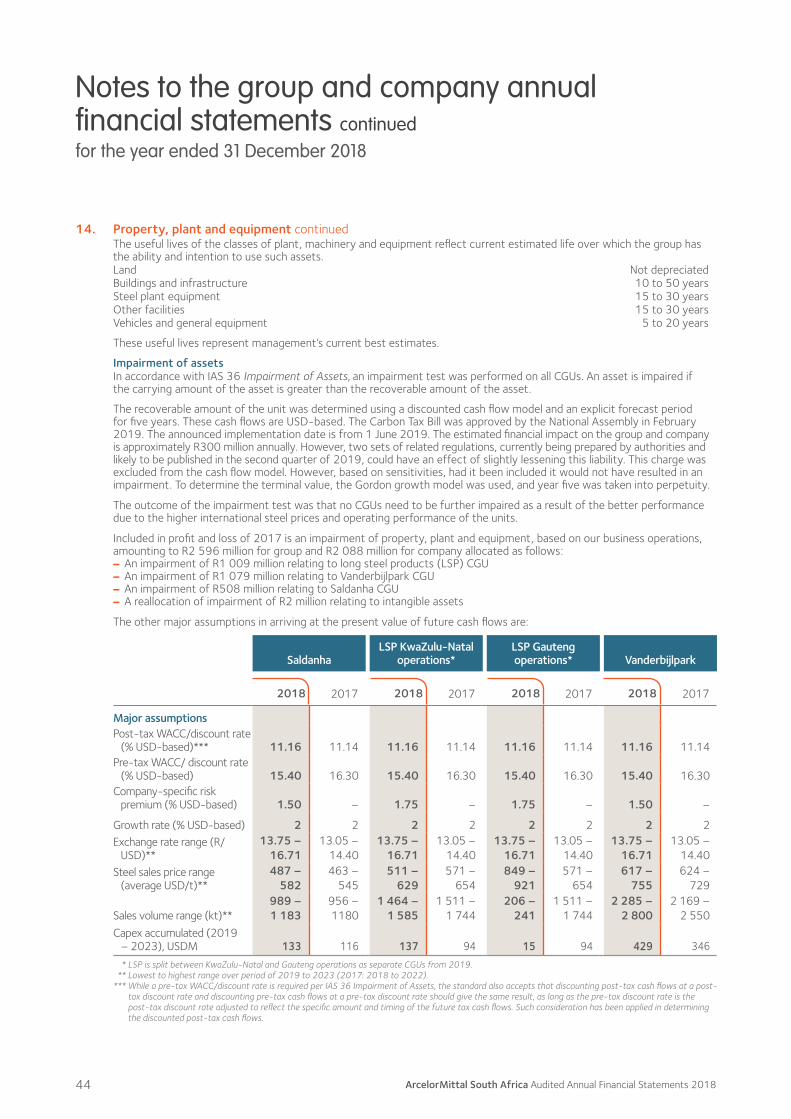
Notes to the group and company annual financial statements continuedfor the year ended 31 December 2018
14. Property, plant and equipment continuedThe useful lives of the classes of plant, machinery and equipment reflect current estimated life over which the group has the ability and intention to use such assets.Land Not depreciatedBuildings and infrastructure 10 to 50 yearsSteel plant equipment 15 to 30 yearsOther facilities 15 to 30 yearsVehicles and general equipment 5 to 20 years
These useful lives represent management’s current best estimates.
Impairment of assetsIn accordance with IAS 36 Impairment of Assets, an impairment test was performed on all CGUs. An asset is impaired if the carrying amount of the asset is greater than the recoverable amount of the asset.
The recoverable amount of the unit was determined using a discounted cash flow model and an explicit forecast period for five years. These cash flows are USD-based. The Carbon Tax Bill was approved by the National Assembly in February 2019. The announced implementation date is from 1 June 2019. The estimated financial impact on the group and company is approximately R300 million annually. However, two sets of related regulations, currently being prepared by authorities and likely to be published in the second quarter of 2019, could have an effect of slightly lessening this liability. This charge was excluded from the cash flow model. However, based on sensitivities, had it been included it would not have resulted in an impairment. To determine the terminal value, the Gordon growth model was used, and year five was taken into perpetuity.
The outcome of the impairment test was that no CGUs need to be further impaired as a result of the better performance due to the higher international steel prices and operating performance of the units.
Included in profit and loss of 2017 is an impairment of property, plant and equipment, based on our business operations, amounting to R2 596 million for group and R2 088 million for company allocated as follows:–– An impairment of R1 009 million relating to long steel products (LSP) CGU–– An impairment of R1 079 million relating to Vanderbijlpark CGU–– An impairment of R508 million relating to Saldanha CGU–– A reallocation of impairment of R2 million relating to intangible assets
The other major assumptions in arriving at the present value of future cash flows are:
SaldanhaLSP KwaZulu-Natal
operations*LSP Gauteng operations* Vanderbijlpark
2017 2017 2017 2017
Major assumptionsPost-tax WACC/discount rate
(% USD-based)*** 11.16 11.14 11.16 11.14 11.16 11.14 11.16 11.14Pre-tax WACC/ discount rate
(% USD-based) 15.40 16.30 15.40 16.30 15.40 16.30 15.40 16.30Company-specific risk
premium (% USD-based) 1.50 – 1.75 – 1.75 – 1.50 –
Growth rate (% USD-based) 2 2 2 2 2 2 2 2Exchange rate range (R/
USD)**13.75 –
16.7113.05 –
14.4013.75 –
16.7113.05 –
14.4013.75 –
16.7113.05 –
14.4013.75 –
16.7113.05 –
14.40Steel sales price range
(average USD/t)**487 –
582463 –
545511 –
629571 –
654849 –
921571 –
654617 –
755624 –
729
Sales volume range (kt)**989 – 1 183
956 – 1180
1 464 – 1 585
1 511 –1 744
206 – 241
1 511 –1 744
2 285 – 2 800
2 169 – 2 550
Capex accumulated (2019 – 2023), USDM 133 116 137 94 15 94 429 346* LSP is split between KwaZulu-Natal and Gauteng operations as separate CGUs from 2019.
** Lowest to highest range over period of 2019 to 2023 (2017: 2018 to 2022).*** While a pre-tax WACC/discount rate is required per IAS 36 Impairment of Assets, the standard also accepts that discounting post-tax cash flows at a post-
tax discount rate and discounting pre-tax cash flows at a pre-tax discount rate should give the same result, as long as the pre-tax discount rate is the post-tax discount rate adjusted to reflect the specific amount and timing of the future tax cash flows. Such consideration has been applied in determining the discounted post-tax cash flows.
2018 2018 2018 2018
44 ArcelorMittal South Africa Audited Annual Financial Statements 2018
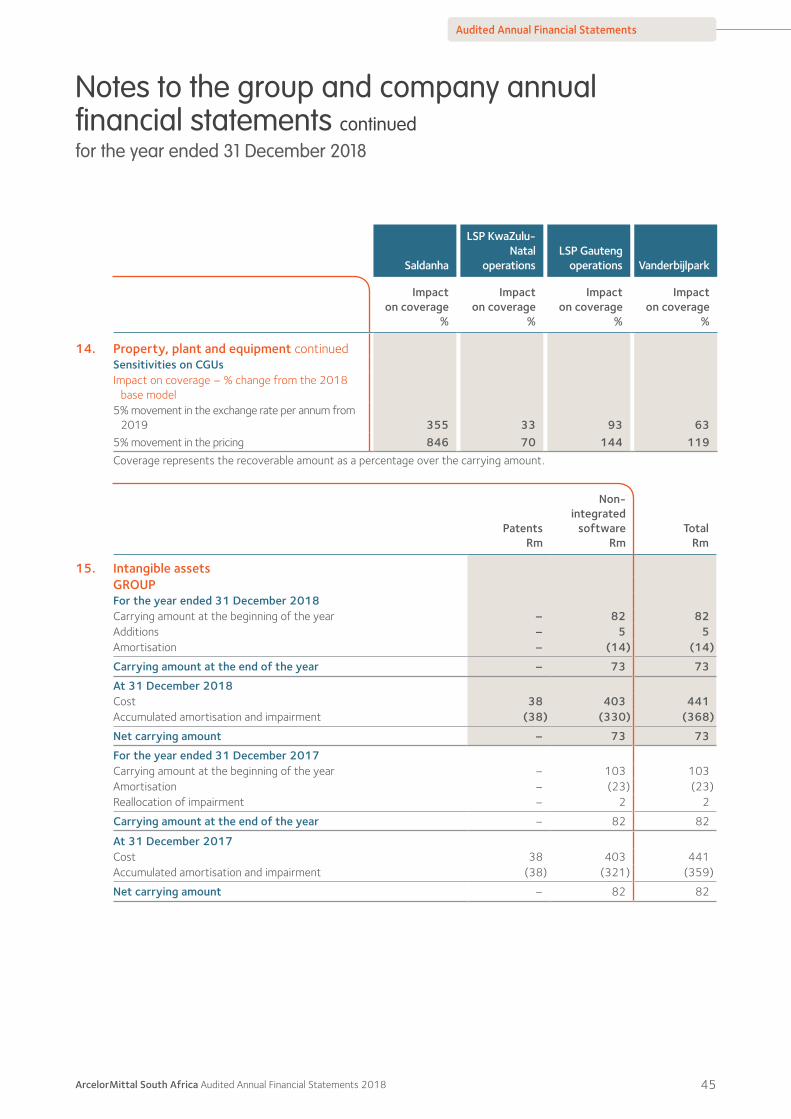
Notes to the group and company annual financial statements continuedfor the year ended 31 December 2018
Saldanha
LSP KwaZulu-Natal
operationsLSP Gauteng
operations Vanderbijlpark
Impact on coverage
%
Impact on coverage
%
Impact on coverage
%
Impact on coverage
%
14. Property, plant and equipment continuedSensitivities on CGUsImpact on coverage – % change from the 2018
base model5% movement in the exchange rate per annum from
2019 355 33 93 635% movement in the pricing 846 70 144 119Coverage represents the recoverable amount as a percentage over the carrying amount.
PatentsRm
Non-integrated
softwareRm
TotalRm
15. Intangible assetsGROUPFor the year ended 31 December 2018Carrying amount at the beginning of the year – 82 82 Additions – 5 5 Amortisation – (14) (14)
Carrying amount at the end of the year – 73 73
At 31 December 2018Cost 38 403 441 Accumulated amortisation and impairment (38) (330) (368)
Net carrying amount – 73 73
For the year ended 31 December 2017Carrying amount at the beginning of the year – 103 103 Amortisation – (23) (23)Reallocation of impairment – 2 2
Carrying amount at the end of the year – 82 82
At 31 December 2017Cost 38 403 441Accumulated amortisation and impairment (38) (321) (359)
Net carrying amount – 82 82
ArcelorMittal South Africa Audited Annual Financial Statements 2018 45
Audited Annual Financial Statements
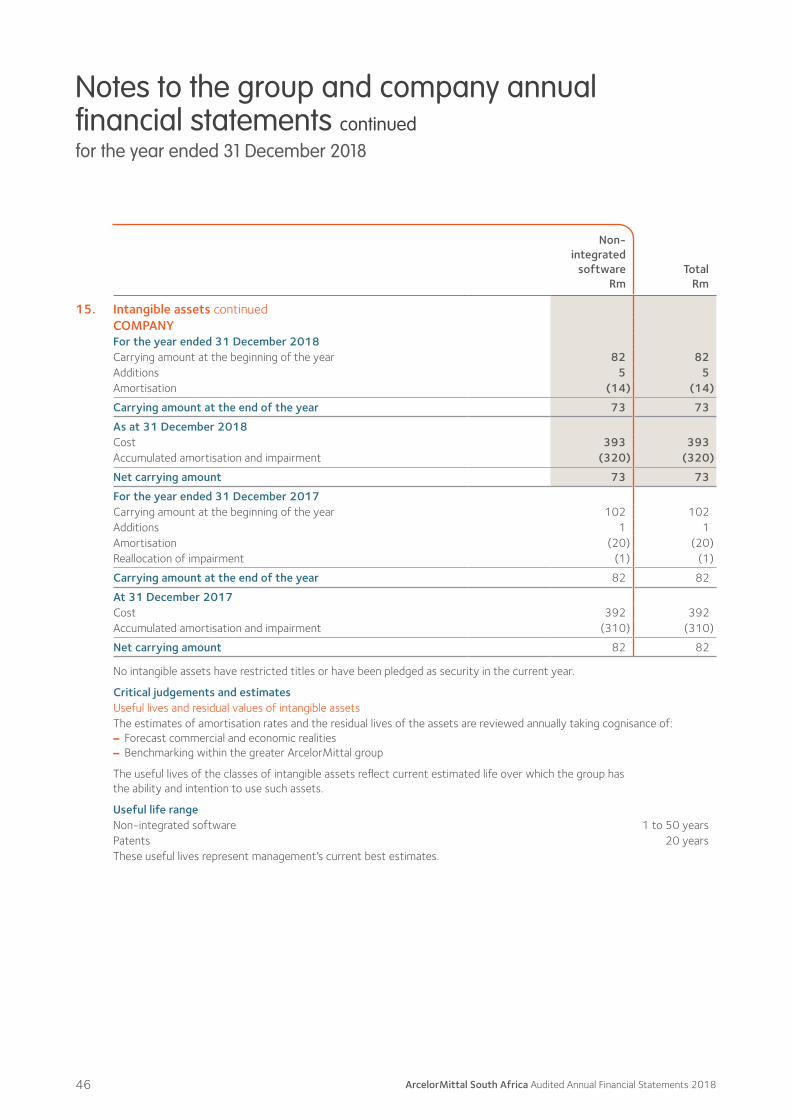
Notes to the group and company annual financial statements continuedfor the year ended 31 December 2018
Non-integrated
softwareRm
TotalRm
15. Intangible assets continuedCOMPANYFor the year ended 31 December 2018Carrying amount at the beginning of the year 82 82 Additions 5 5 Amortisation (14) (14)
Carrying amount at the end of the year 73 73
As at 31 December 2018Cost 393 393 Accumulated amortisation and impairment (320) (320)
Net carrying amount 73 73
For the year ended 31 December 2017Carrying amount at the beginning of the year 102 102 Additions 1 1 Amortisation (20) (20)Reallocation of impairment (1) (1)
Carrying amount at the end of the year 82 82
At 31 December 2017Cost 392 392 Accumulated amortisation and impairment (310) (310)
Net carrying amount 82 82
No intangible assets have restricted titles or have been pledged as security in the current year.
Critical judgements and estimatesUseful lives and residual values of intangible assetsThe estimates of amortisation rates and the residual lives of the assets are reviewed annually taking cognisance of:–– Forecast commercial and economic realities–– Benchmarking within the greater ArcelorMittal group
The useful lives of the classes of intangible assets reflect current estimated life over which the group has the ability and intention to use such assets.
Useful life rangeNon-integrated software 1 to 50 yearsPatents 20 yearsThese useful lives represent management’s current best estimates.
46 ArcelorMittal South Africa Audited Annual Financial Statements 2018

Notes to the group and company annual financial statements continuedfor the year ended 31 December 2018
16. Equity-accounted investmentsDetails of the company’s material associates and jointly controlled entities are as follows:
Proportion of ownership interest and voting power
Name of the entity Principal activity Place of incorporation 2017
Macsteel International Holdings BV Steel trading and shipping Netherlands N/A 50%
16.1 Summarised financial informationAssociates
Other associates
2017Rm
Aggregate information of associates not individually materialProfit after tax 5 4Share of other comprehensive income – –
Share of total comprehensive income 5 4
Aggregate carrying amount of the Group’s interest in these associatesGroup 37 42Company 16 16
Joint ventureThe summarised financial information below is in respect of the group’s only material joint venture. During the year the group sold its 50% interest in MIHBV. Refer to note 11 for detail on this transaction. This investment was classified as an asset held-for-sale on 31 May 2018. The summarised financial information below represents amounts shown in the entity’s annual financial statements for the five months ending 31 May 2018 (2017: for the year ending 31 December 2017).
Macsteel International Holdings BV
2017Rm
Current assets – 9 166 Non-current assets – 4 821 Current liabilities – (5 016)Non-current liabilities – (531)
Net assets – 8 440
The above amounts of assets and liabilities include the following:Cash and cash equivalents – 1 172Current financial liabilities (excluding trade and other payables and provisions) – (2 096)Non-current financial liabilities (excluding trade and other payables and provisions) – (497)Income for the year includes the following:Revenue 15 782 36 661Profit after tax 240 405Other comprehensive income – 31
Total comprehensive income 240 436
2018Rm
2018Rm
ArcelorMittal South Africa Audited Annual Financial Statements 2018 47
Audited Annual Financial Statements
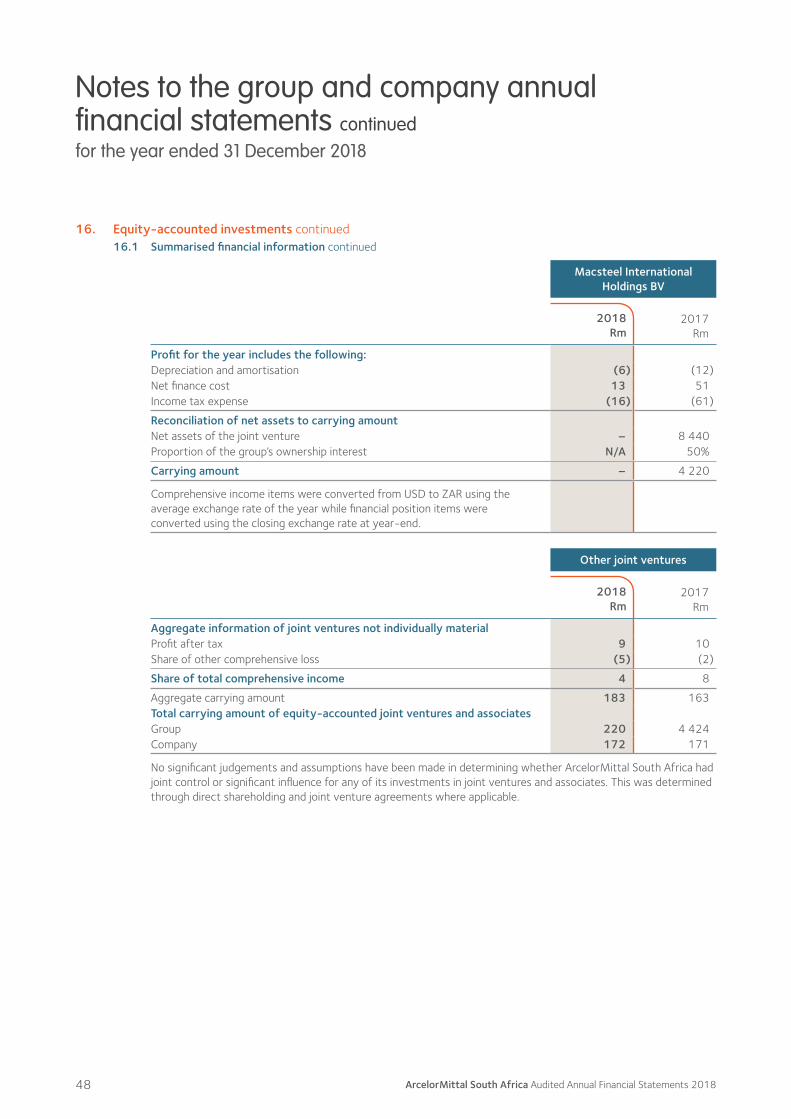
Notes to the group and company annual financial statements continuedfor the year ended 31 December 2018
16. Equity-accounted investments continued16.1 Summarised financial information continued
Macsteel International Holdings BV
2017Rm
Profit for the year includes the following:Depreciation and amortisation (6) (12)Net finance cost 13 51Income tax expense (16) (61)
Reconciliation of net assets to carrying amountNet assets of the joint venture – 8 440Proportion of the group’s ownership interest N/A 50%
Carrying amount – 4 220
Comprehensive income items were converted from USD to ZAR using the average exchange rate of the year while financial position items were converted using the closing exchange rate at year-end.
Other joint ventures
2017Rm
Aggregate information of joint ventures not individually materialProfit after tax 9 10Share of other comprehensive loss (5) (2)
Share of total comprehensive income 4 8
Aggregate carrying amount 183 163Total carrying amount of equity-accounted joint ventures and associatesGroup 220 4 424Company 172 171
No significant judgements and assumptions have been made in determining whether ArcelorMittal South Africa had joint control or significant influence for any of its investments in joint ventures and associates. This was determined through direct shareholding and joint venture agreements where applicable.
2018Rm
2018Rm
48 ArcelorMittal South Africa Audited Annual Financial Statements 2018

Notes to the group and company annual financial statements continuedfor the year ended 31 December 2018
Company
2017Rm
17. Investments in subsidiariesShares at cost – 241Indebtedness – by subsidiaries 240 233
Total 240 474
Aggregate attributable after tax losses (451) (433)
The carrying value of the company’s investment in subsidiaries consists largely of its investment in Saldanha Steel (Pty) Ltd, being the cost of shares and indebtedness, at the initial and subsequent acquisition dates.
Critical judgements and estimatesConsolidation of structured entitiesCertain non-core services and corporate social development activities of the company are managed via two associations not for gain, namely the Vesco group and Vesco Community Enterprises. While the company has de facto control over both entities, these entities are not consolidated within the group accounts because they are not material to the group.
Likewise, the results of the ArcelorMittal Foundation Trust, a public benefit organisation, are not included in the consolidated results of the group.
ArcelorMittal South Africa Management Share Fund is consolidated into the group results, with the cost of open-market share purchases being included as a debit to the group’s equity.
The effect if these entities were consolidated by the group would be immaterial on the results and/or disclosure.
Ikageng Broad-Based Employee Share TrustThe Ikageng Broad-Based Employee Share Trust (Ikageng) was created in 2015 to give effect to the employee share ownership plan (ESOP). Ikageng holds the investment in shares in ArcelorMittal South Africa for the benefit of the company’s employees, until such time that they vest. The ESOP was created by ArcelorMittal South Africa to facilitate black economic empowerment and meaningful wealth for its employees. The trust is controlled by the ArcelorMittal South Africa and is therefore consolidated in accordance with IFRS 10 Consolidated Financial Statements.
During 2015, the shares in ArcelorMittal South Africa were obtained from the treasury shares (4.7%) held by Vicva Trading Nine Investments (Pty) Ltd (Vicva), through a contribution from the company. Ikageng, subsequent to the rights issue, owns 1.45% of ArcelorMittal South Africa.
Isabelo Employee Empowerment Share Trust and Amandla we Nsimbi (Pty) LtdDuring 2016 the Isabelo Employee Empowerment Share Trust and Amandla we Nsimbi (Pty) Ltd were created as part of the company’s initiative to transform ArcelorMittal South Africa in order to achieve sustainable ownership by black people. In terms of the scheme ArcelorMittal South Africa issued empowerment shares to Amandla we Nsimbi (Pty) Ltd, and the Isabelo Employee Empowerment Share Trust (representing 17% and 5.1%, respectively, of the voting rights in ArcelorMittal South Africa through a notional loan. Both the trust and company are controlled by ArcelorMittal South Africa and are therefore consolidated in terms of IFRS 10 Consolidated Financial Statements.
Thabazimbi iron ore mineDuring the year the Thabazimbi iron ore mine was acquired from Sishen Iron Ore Company (Pty) Ltd. This acquisition is not classified as a business combination in terms of IFRS 3 Business Combinations. The mine is non-operational and do not have inputs, processes or outputs. The acquisition was classified as an asset acquisition and accounted for at cost. This company is 100% owned by ArcelorMittal South Africa and is therefore consolidated in terms of IFRS 10 Consolidated Financial Statements.
2018Rm
ArcelorMittal South Africa Audited Annual Financial Statements 2018 49
Audited Annual Financial Statements

Notes to the group and company annual financial statements continuedfor the year ended 31 December 2018
17. Investments in subsidiaries continued
Interest of the company
Shares at cost Indebtedness
Name of subsidiaryCountry of incorporation1
Reporting currency
Number of
ordinary shares issued
2017R
2017Rm
ManufacturingIscor Building Systems
(Pty) Ltd RSA ZAR 100 100 100 – –Saldanha Steel
(Pty) Ltd2 RSA ZAR 2 000 1 009 1 009 150 139MiningOakwood Trading
21 (Pty) Ltd RSA ZAR 100 100 100 – –Thabazimbi Iron Ore
Mine (Pty) Ltd RSA ZAR 1 1 1 10 –ServicesMSSA Investments BV3 NEH USD 134 669 – 241 105 200 – –Pybus Fifty-Seven
(Pty) Ltd RSA ZAR 1 1 000 1 000 – –Vicva Investments and
Trading Nine (Pty) Ltd RSA ZAR 1 1 000 1 000 80 94Dombotema Mining
Investments (Pty) Ltd RSA ZAR 100 100 100 – –ArcelorMittal South
Africa Distribution (Pty) Ltd RSA ZAR 100 – 100 – –
ArcelorMittal African Investments Mauritius USD 100 716 716 – –
4 026 241 109 326 240 2331 RSA - Republic of South Africa and NEH – the Netherlands.2 The indebtedness amount includes the shareholders’ loan of R3 257 million (2017: R3 060 million) and intercompany balances in favour of Saldanha Steel
(Pty) Ltd of R3 107 million (2017: R2 921 million).3 The investment in MSSA Investments BV was impaired following the sale of MIHBV.
All listed subsidiaries are wholly owned.
Group
2017Rm
18. Investments held by environmental trustBalance at the beginning of the year – –Acquisition – comprising of equity 332 –
Balance at end of year 332 –
As part of the acquisition of the Thabazimbi mine, the group acquired an asset in the form of an environmental trust which holds equity investments.
The trust’s investment activities are managed by Old Mutual Investment Group (South Africa) Proprietary Limited. It aims to achieve its objectives by investing in a diversified portfolio of equity (predominantly South African listed companies).
These investments may only be utilised for the purposes of settling decommissioning and rehabilitation obligations relating to Thabazimbi’s mining operations. The investment returns are re-invested by the trust. Refer to note 25 for the environmental rehabilitation provisions. The trust is consolidated in terms of IFRS 10 Consolidated Financial Statements.
2018Rm
2018R
2018Rm
50 ArcelorMittal South Africa Audited Annual Financial Statements 2018

Notes to the group and company annual financial statements continuedfor the year ended 31 December 2018
19. Other financial assets
Group Company
2017Rm
2017Rm
Non-currentEquity instruments – FVTOCI 66 55 66 46
Total 66 55 66 46
CurrentFinancial assets carried at FVTPLOther forward exchange contracts 3 4 3 4Financial assets carried at FVTOCIForward exchange contracts and options used
for hedging 53 – 53 –Other financial assets carried at amortised costFerrosure Isle of Man Insurance Captive – 424 – 424
Total 56 428 56 428
Critical judgements and estimatesEquity instruments carried at FVTOCIHwange Colliery Company LtdThe company holds 10% of the ordinary share capital of Hwange Colliery Company Ltd, a coal, coke and by-products producer in Zimbabwe. The shares of Hwange Colliery Company Ltd are traded on the dollarised Zimbabwe Stock Exchange. The Zimbabwean miner was placed under administration in October 2018, resulting in the carrying amount of the investment reducing to R0 million (2017: R8 million).
MC Mining LtdThe company holds 6 306 672 (4%) shares in MC Mining Ltd. MC Mining Ltd is listed on the Australian Stock Exchange, Johannesburg Stock Exchange and London Stock Exchange. MC Mining Ltd share price increased following the announcement on 11 December 2018 that the South African Department of Mineral Resources (DMR) granted a mining right for its 74% owned Chapudi coking and thermal coal project in the Limpopo province. The granting of the mining right for the Chapudi Project is a key step in unlocking value from MC Mining’s significant coking and thermal coal assets. The shares are valued at a fair value of R10.50 per share and therefore are valued at the market value of R66 million (2017: R46 million).
Financial assets carried at FVTPLForeign exchange contractsFinancial instruments carried at FVTPL represents gains on foreign exchange contracts (FECs).
Financial assets carried at FVTOCIForward exchange contracts and options used for hedgingFinancial instruments carried at FVTOCI represents gains on the revaluation of options designated in a hedging relationship.
Other financial assets carried at amortised costFerrosure Isle of ManThe investment in Ferrosure Isle of Man represents the company’s insurance captive situated in the Isle of Man. In 2018, the insurance captive cell was liquidated/dissolved based on ArcelorMittal group’s decision. ArcelorMittal South Africa is now insured directly with an insurance captive located in Luxembourg.
2018Rm
2018Rm
ArcelorMittal South Africa Audited Annual Financial Statements 2018 51
Audited Annual Financial Statements
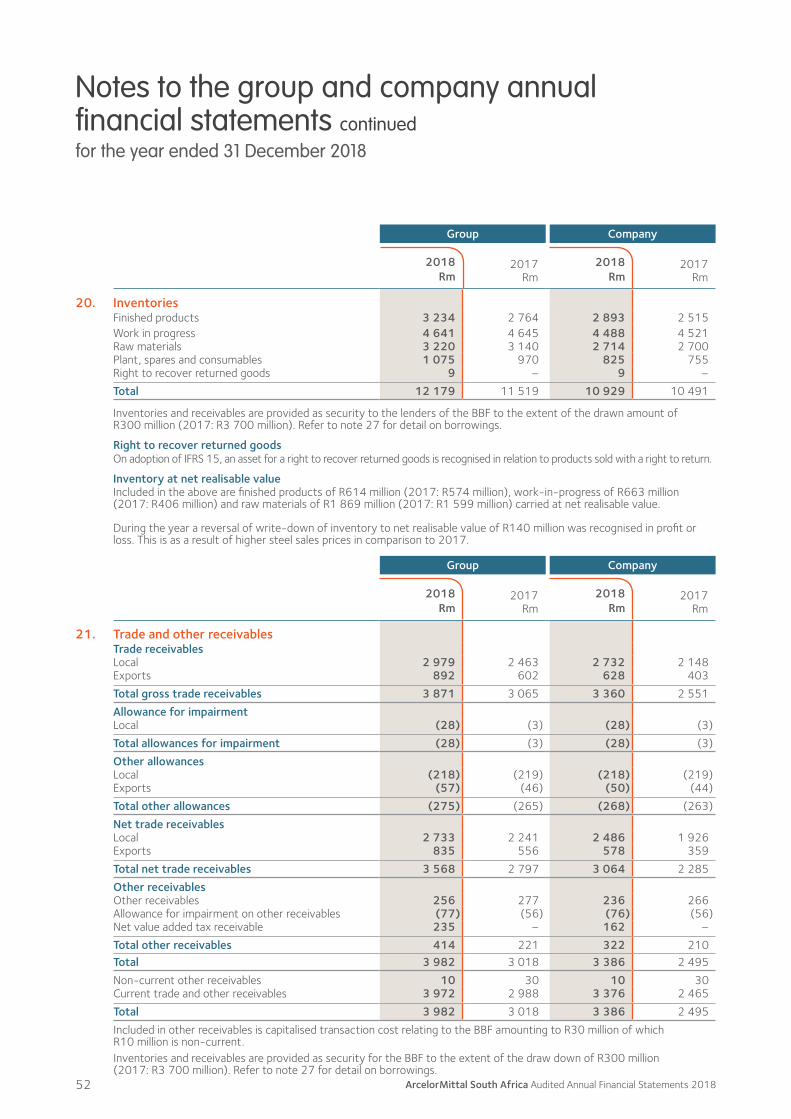
Notes to the group and company annual financial statements continuedfor the year ended 31 December 2018
Group Company
2017Rm
2017Rm
20. InventoriesFinished products 3 234 2 764 2 893 2 515Work in progress 4 641 4 645 4 488 4 521Raw materials 3 220 3 140 2 714 2 700Plant, spares and consumables 1 075 970 825 755Right to recover returned goods 9 – 9 –
Total 12 179 11 519 10 929 10 491
Inventories and receivables are provided as security to the lenders of the BBF to the extent of the drawn amount of R300 million (2017: R3 700 million). Refer to note 27 for detail on borrowings.
Right to recover returned goodsOn adoption of IFRS 15, an asset for a right to recover returned goods is recognised in relation to products sold with a right to return.
Inventory at net realisable valueIncluded in the above are finished products of R614 million (2017: R574 million), work-in-progress of R663 million (2017: R406 million) and raw materials of R1 869 million (2017: R1 599 million) carried at net realisable value.
During the year a reversal of write-down of inventory to net realisable value of R140 million was recognised in profit or loss. This is as a result of higher steel sales prices in comparison to 2017.
Group Company
2017Rm
2017Rm
21. Trade and other receivablesTrade receivablesLocal 2 979 2 463 2 732 2 148 Exports 892 602 628 403
Total gross trade receivables 3 871 3 065 3 360 2 551
Allowance for impairmentLocal (28) (3) (28) (3)
Total allowances for impairment (28) (3) (28) (3)
Other allowancesLocal (218) (219) (218) (219)Exports (57) (46) (50) (44)
Total other allowances (275) (265) (268) (263)
Net trade receivablesLocal 2 733 2 241 2 486 1 926 Exports 835 556 578 359
Total net trade receivables 3 568 2 797 3 064 2 285
Other receivablesOther receivables 256 277 236 266 Allowance for impairment on other receivables (77) (56) (76) (56)Net value added tax receivable 235 – 162 –
Total other receivables 414 221 322 210 Total 3 982 3 018 3 386 2 495
Non-current other receivables 10 30 10 30Current trade and other receivables 3 972 2 988 3 376 2 465
Total 3 982 3 018 3 386 2 495
Included in other receivables is capitalised transaction cost relating to the BBF amounting to R30 million of which R10 million is non-current.Inventories and receivables are provided as security for the BBF to the extent of the draw down of R300 million (2017: R3 700 million). Refer to note 27 for detail on borrowings.
2018Rm
2018Rm
2018Rm
2018Rm
52 ArcelorMittal South Africa Audited Annual Financial Statements 2018

Notes to the group and company annual financial statements continuedfor the year ended 31 December 2018
21. Trade and other receivables continuedTransfer of trade receivablesThe group and company sold, with no recourse, trade receivables with a carrying amount of R1 278 million (2017: R1 147 million) to the bank for cash proceeds. This amount represents the outstanding receivables that were sold at 31 December 2018. This is referred to as the true sales of receivables (TSR) programme. These trade receivables have been derecognised from the statement of financial position at the date of sale to the bank because the group and company have not retained substantially all of the risks and rewards – primarily credit risk. The amount received on transfer has been recognised as cash. Expenses incurred under the TSR programmes (reflecting the discount granted to the acquirers of the accounts receivable) recognised in the statement of comprehensive income for the year ended 31 December 2018 is R82 million (2017: R77 million).
Credit riskCredit risk is the risk of financial loss to the group and company if a customer or counterparty to a financial instrument fails to meet its contractual obligations, and arises principally from the group and company’s receivables from customers, defined as trade receivables.
The carrying amounts of financial assets represent the maximum credit exposure.
The credit risk management policy sets out the framework within which the customer credit risk is managed.
The objectives of the credit risk management policy are to:–– Increase sales through investing in the customer base–– Avoid extensions that could lead to financial distress and default by customers–– Maintain productive customer relationships within the framework of prudent risk management–– Optimising cash collection periods–– Diversifying credit exposure over a broad client base
The credit policy risk management is enacted by the credit management department. Credit management ensures that credit extension and management are conducted within the approved frameworks, and adequately assesses and reports all credit exposures, which include the maintenance of appropriate collateral, financial guarantees and credit insurance. The credit management’s review includes the review of financial statements, credit insurers’ information and industry information.
The group and company’s exposure to credit risk is influenced mainly by the individual characteristics of each customer. Each customer’s credit profile is determined by taking into account the customer’s financial position, payment record, guarantees and other relevant information. Credit limits are monitored regularly and credit exposures are monitored on a daily basis. Any sales exceeding those limits either requires additional credit cover, collateral or guarantees. Where these are not available it requires the approval of the executive directors and above certain threshold that of ArcelorMittal group. This decision will be based on past payment history, size of the customer and the strategic nature of the customer.
Credit insurance is mainly underwritten by Credit Guarantee Insurance Corporation of South Africa Ltd under five different policies with a maximum liability of R1.4 billion on the largest policy. The insurance excess ranges from 0% to 10%. Credit insurance is also underwritten by Santam under one policy with a maximum liability of R1.2 billion. The insurance excess in relation to this is 10%. Hollard was added as an additional credit insurer in 2018 for a specific customer. The excess in relation to the policy is 15%.
The group and company are exposed to three main customers. The table below details the cumulative credit limit and balances (both inclusive of value added tax) of the top three customers at the statement of financial position date for the group and company:
Credit limit exclusive of VAT Balance
Rating 2017 2017
Outstanding balance of the top three customers by sales for the year (Rm)
Group Rating B 1 977 2 185 1 319 919Company Rating B 1 977 2 185 1 055 707Percentage of net trade receivables (%)Group 37 33Company 34 31
The most significant export customer is Macsteel International Trading BV (Rating A). Macsteel International Trading BV does not have a credit limit and is not insured due to the short-term nature of this receivable. The group and company have an exclusive distribution management agreement with this company for all Blue Water sales. The outstanding customer balance as at 31 December 2018 was R735 million (2017: R436 million).
2018 2018
ArcelorMittal South Africa Audited Annual Financial Statements 2018 53
Audited Annual Financial Statements

Notes to the group and company annual financial statements continuedfor the year ended 31 December 2018
Group Company
2017%
2017%
21. Trade and other receivables continuedCredit risk exposure by class for the group and company is:Local 77 80 81 84Exports 23 20 19 16
Total 100 100 100 100
Group Company
2017Days
2017Days
Average credit period for trade receivablesLocal 39 38 36 38Exports 21 18 23 20
No interest is charged on trade receivables for the first 30 days from date of statement. Thereafter, interest is charged at prime +3% per annum on the outstanding balance.
Other receivables relate primarily to by-product sales, site rental due, prepayments, staff education and bursary loans. In determining the recoverability of trade and other receivables, the group considers any change in the credit quality of the trade receivable from the date credit was initially granted up to the reporting date.
An analysis of the credit quality of the trade receivables that were past due but not impaired at 31 December is as follows:
Group Company
2017Rm
2017Rm
Age of receivables past due and not impairedPast due 1 – 30 days 445 263 445 263Past due 30 – 60 days 38 33 38 33Past due 60 – 90 days 11 1 11 1Past due 90 – 180 days 6 3 6 3Past due >180 days 1 10 1 10
Total 501 310 501 310
These receivables have not been impaired as the overdue position is considered temporary in nature.
2018%
2018%
2018Days
2018Days
2018Rm
2018Rm
54 ArcelorMittal South Africa Audited Annual Financial Statements 2018

Notes to the group and company annual financial statements continuedfor the year ended 31 December 2018
21. Trade and other receivables continuedAllowancesThe following allowances exist:Allowance for impairment, which is based on the ageing and recoverability of receivables. Customers handed over for collection are fully provided for unless insured in which case the participation percentage of the insurer is deducted. Overdue customers without cover are fully provided for.
Movement in the allowance for impairment in respect of trade receivablesThe movement in the allowance for impairment in respect of trade receivables during the year was as follows (Comparative information amounts of 2017 represent the allowance account for impairment losses under IAS 39):
Group Company
2018Rm
2017Individual
impairmentsRm
2017Collective
impairmentsRm
2018Rm
2017Individual
impairmentsRm
2017Collective
impairmentsRm
Balance at 1 January under IAS 39 (3) – (4) (3) – (4)Adjustment on initial application of IFRS 9 – – – – – –Balance at 1 January under IFRS 9 (3) – (4) (3) – (4) Amounts written off 11 3 – 11 3 –Net remeasurement of loss allowance (36) – (2) (36) – (2)Balance at 31 December (28) 3 (6) (28) 3 (6)
Group Company
2017Rm
2017Rm
Age of impaired trade receivables1 – 30 days (9) (3) (9) (3)31 – 60 days (4) – (4) –61 – 90 days (7) – (7) –91 – 120 days (3) – (3) –121 – 180 + days (5) – (5) –
Total (28) (3) (28) (3)
Movement in other allowancesOther allowances relate to settlement discounts, price, quality, dispatch and related claims for which credit notes still have to be issued.
Group Company
2017Rm
2017Rm
Movement in other allowancesBalance at beginning of the year (265) (386) (263) (386)Allowances raised (1 574) (1 296) (1 544) (1 278)Allowances utilised 1 564 1 417 1 539 1 401
Closing balance (275) (265) (268) (263)
An allowance is also made for impairment on other receivables that are more than 90 days overdue.
2018Rm
2018Rm
2018Rm
2018Rm
ArcelorMittal South Africa Audited Annual Financial Statements 2018 55
Audited Annual Financial Statements
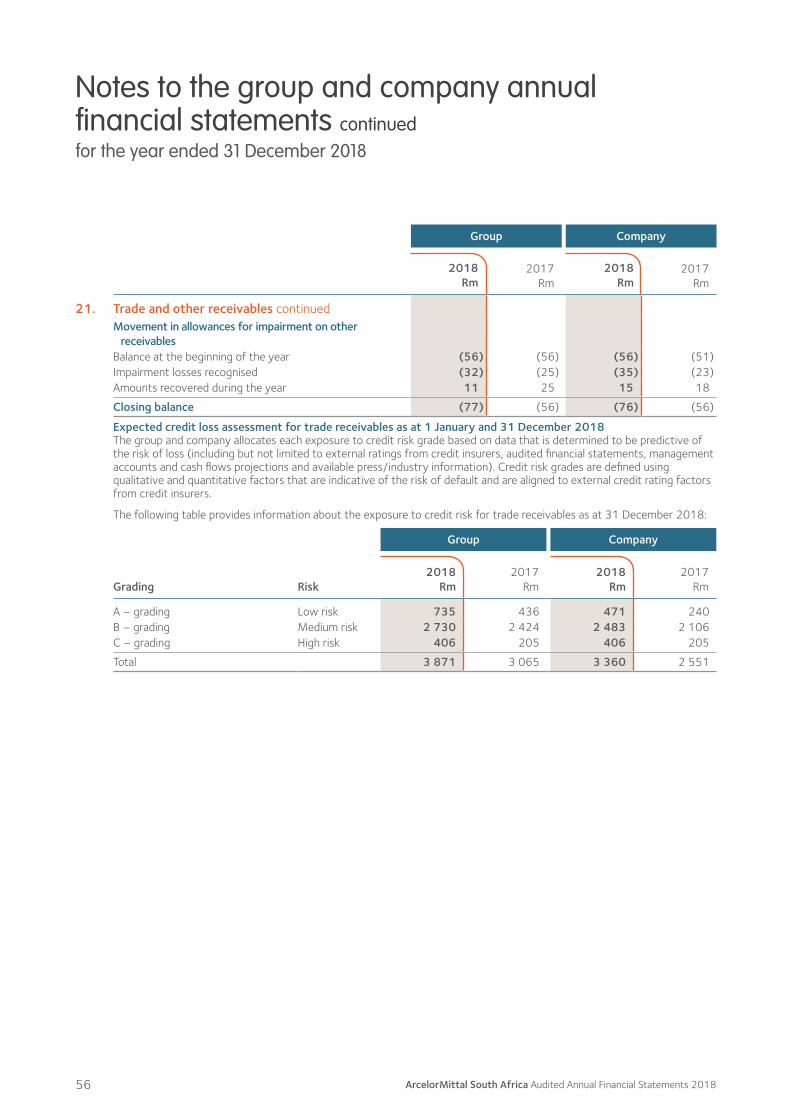
Notes to the group and company annual financial statements continuedfor the year ended 31 December 2018
Group Company
2017Rm
2017Rm
21. Trade and other receivables continuedMovement in allowances for impairment on other
receivablesBalance at the beginning of the year (56) (56) (56) (51)Impairment losses recognised (32) (25) (35) (23)Amounts recovered during the year 11 25 15 18
Closing balance (77) (56) (76) (56)
Expected credit loss assessment for trade receivables as at 1 January and 31 December 2018The group and company allocates each exposure to credit risk grade based on data that is determined to be predictive of the risk of loss (including but not limited to external ratings from credit insurers, audited financial statements, management accounts and cash flows projections and available press/industry information). Credit risk grades are defined using qualitative and quantitative factors that are indicative of the risk of default and are aligned to external credit rating factors from credit insurers.
The following table provides information about the exposure to credit risk for trade receivables as at 31 December 2018:
Group Company
Grading Risk2018
Rm2017
Rm2018
Rm2017
Rm
A – grading Low risk 735 436 471 240B – grading Medium risk 2 730 2 424 2 483 2 106C – grading High risk 406 205 406 205
Total 3 871 3 065 3 360 2 551
2018Rm
2018Rm
56 ArcelorMittal South Africa Audited Annual Financial Statements 2018
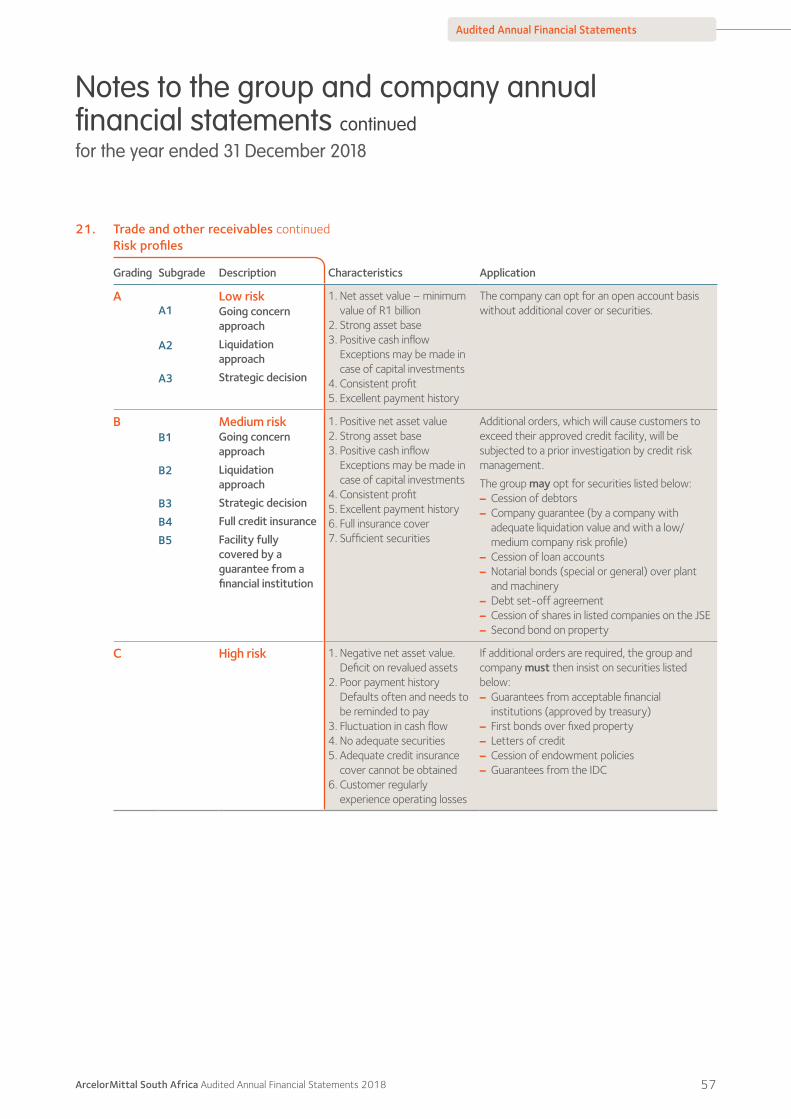
Notes to the group and company annual financial statements continuedfor the year ended 31 December 2018
21. Trade and other receivables continuedRisk profiles
Grading Subgrade Description Characteristics Application
AA1
A2
A3
Low riskGoing concern approachLiquidation approachStrategic decision
1. Net asset value – minimum value of R1 billion
2. Strong asset base3. Positive cash inflow
Exceptions may be made in case of capital investments
4. Consistent profit5. Excellent payment history
The company can opt for an open account basis without additional cover or securities.
BB1
B2
B3B4B5
Medium riskGoing concern approachLiquidation approachStrategic decisionFull credit insuranceFacility fully covered by a guarantee from a financial institution
1. Positive net asset value2. Strong asset base3. Positive cash inflow
Exceptions may be made in case of capital investments
4. Consistent profit5. Excellent payment history6. Full insurance cover7. Sufficient securities
Additional orders, which will cause customers to exceed their approved credit facility, will be subjected to a prior investigation by credit risk management.
The group may opt for securities listed below:–– Cession of debtors–– Company guarantee (by a company with adequate liquidation value and with a low/medium company risk profile)–– Cession of loan accounts–– Notarial bonds (special or general) over plant and machinery–– Debt set-off agreement–– Cession of shares in listed companies on the JSE–– Second bond on property
C High risk 1. Negative net asset value. Deficit on revalued assets
2. Poor payment history Defaults often and needs to be reminded to pay
3. Fluctuation in cash flow4. No adequate securities5. Adequate credit insurance
cover cannot be obtained6. Customer regularly
experience operating losses
If additional orders are required, the group and company must then insist on securities listed below:–– Guarantees from acceptable financial institutions (approved by treasury)–– First bonds over fixed property–– Letters of credit–– Cession of endowment policies–– Guarantees from the IDC
ArcelorMittal South Africa Audited Annual Financial Statements 2018 57
Audited Annual Financial Statements
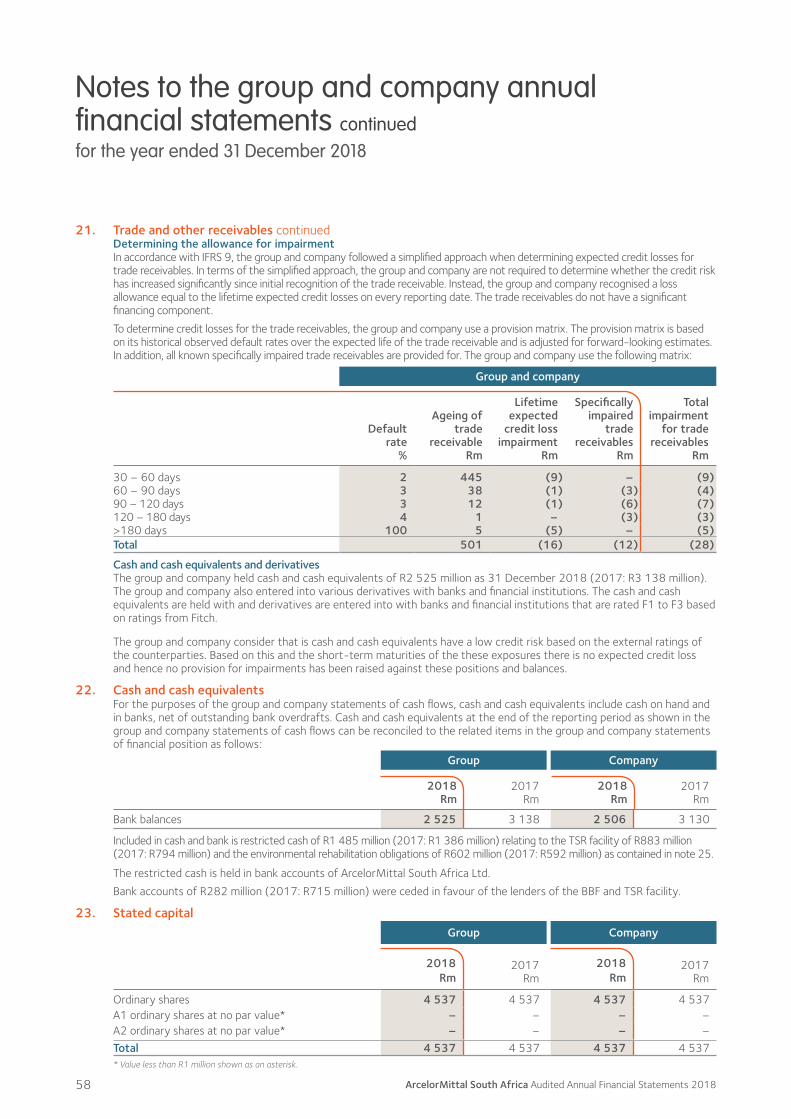
Notes to the group and company annual financial statements continuedfor the year ended 31 December 2018
21. Trade and other receivables continued Determining the allowance for impairment In accordance with IFRS 9, the group and company followed a simplified approach when determining expected credit losses for
trade receivables. In terms of the simplified approach, the group and company are not required to determine whether the credit risk has increased significantly since initial recognition of the trade receivable. Instead, the group and company recognised a loss allowance equal to the lifetime expected credit losses on every reporting date. The trade receivables do not have a significant financing component.
To determine credit losses for the trade receivables, the group and company use a provision matrix. The provision matrix is based on its historical observed default rates over the expected life of the trade receivable and is adjusted for forward-looking estimates. In addition, all known specifically impaired trade receivables are provided for. The group and company use the following matrix:
Group and company
Default rate
%
Ageing of trade
receivable Rm
Lifetime expected
credit loss impairment
Rm
Specifically impaired
trade receivables
Rm
Total impairment
for trade receivables
Rm
30 – 60 days 2 445 (9) – (9)60 – 90 days 3 38 (1) (3) (4)90 – 120 days 3 12 (1) (6) (7)120 – 180 days 4 1 – (3) (3)>180 days 100 5 (5) – (5)Total 501 (16) (12) (28)
Cash and cash equivalents and derivativesThe group and company held cash and cash equivalents of R2 525 million as 31 December 2018 (2017: R3 138 million). The group and company also entered into various derivatives with banks and financial institutions. The cash and cash equivalents are held with and derivatives are entered into with banks and financial institutions that are rated F1 to F3 based on ratings from Fitch.
The group and company consider that is cash and cash equivalents have a low credit risk based on the external ratings of the counterparties. Based on this and the short-term maturities of the these exposures there is no expected credit loss and hence no provision for impairments has been raised against these positions and balances.
22. Cash and cash equivalentsFor the purposes of the group and company statements of cash flows, cash and cash equivalents include cash on hand and in banks, net of outstanding bank overdrafts. Cash and cash equivalents at the end of the reporting period as shown in the group and company statements of cash flows can be reconciled to the related items in the group and company statements of financial position as follows:
Group Company
2017Rm
2017Rm
Bank balances 2 525 3 138 2 506 3 130
Included in cash and bank is restricted cash of R1 485 million (2017: R1 386 million) relating to the TSR facility of R883 million (2017: R794 million) and the environmental rehabilitation obligations of R602 million (2017: R592 million) as contained in note 25.
The restricted cash is held in bank accounts of ArcelorMittal South Africa Ltd.
Bank accounts of R282 million (2017: R715 million) were ceded in favour of the lenders of the BBF and TSR facility.
23. Stated capitalGroup Company
2017Rm
2017Rm
Ordinary shares 4 537 4 537 4 537 4 537 A1 ordinary shares at no par value* – – – –A2 ordinary shares at no par value* – – – –Total 4 537 4 537 4 537 4 537 * Value less than R1 million shown as an asterisk.
2018Rm
2018Rm
2018Rm
2018Rm
58 ArcelorMittal South Africa Audited Annual Financial Statements 2018

Notes to the group and company annual financial statements continuedfor the year ended 31 December 2018
Group Company
2017Number
of shares
2017Number
of shares
23. Stated capital continuedReconciliation of authorised sharesOrdinary shares at no par value 1 200 000 000 1 200 000 000 1 200 000 000 1 200 000 000 A1 ordinary shares at no par value 243 240 276 243 240 276 243 240 276 243 240 276 A2 ordinary shares at no par value 72 972 083 72 972 083 72 972 083 72 972 083 “C” redeemable preference shares 2 357 584 2 357 584 2 357 584 2 357 584
1 518 569 943 1 518 569 943 1 518 569 943 1 518 569 943 Issued sharesOrdinary shares of no par value 1 138 059 825 1 138 059 825 1 138 059 825 1 138 059 825 A1 ordinary shares of no par value 243 240 276 243 240 276 243 240 276 243 240 276 A2 ordinary shares of no par value 72 972 083 72 972 083 72 972 083 72 972 083 Total shares in issue 1 454 272 184 1 454 272 184 1 454 272 184 1 454 272 184 Reconciliation of shares issued to shares outstandingTotal shares issued 1 454 272 184 1 454 272 184 1 454 272 184 1 454 272 184 Amandla we Nsimbi (Pty) Ltd (243 240 276) (243 240 276) (243 240 276) (243 240 276)Isabelo Employee Empowerment Share Trust (72 972 083) (72 972 083) (72 972 083) (72 972 083)Ordinary shares 1 138 059 825 1 138 059 825 1 138 059 825 1 138 059 825Vicva Investments and Trading Nine (Pty) Ltd (23 447 036) (23 447 036) (23 447 036) (23 447 036)Ikageng Broad-Based Employee Share Trust (21 103 219) (21 103 219) (21 103 219) (21 103 219)
Total shares outstanding 1 093 509 570 1 093 509 570 1 093 509 570 1 093 509 570
The unissued ordinary shares are not under the control of the directors.
A1 and A2 sharesIn 2016, a successful B-BBEE transaction was completed. This transaction was part of ArcelorMittal South Africa’s initiatives to transform the group and achieve sustainable ownership by black people. In terms of the scheme ArcelorMittal South Africa issued empowerment shares to Amandla we Nsimbi (Pty) Ltd and Isabelo Employee Empowerment Share Trust (representing 17% and 5.1% respectively of the voting rights in ArcelorMittal South Africa) through a notional loan.
The shareholders approved the issue of A1 and A2 ordinary shares. Amandla we Nsimbi (Pty) Ltd whose shares are owned by broad-based black consortium, Likamva Resources, subscribed for 243 240 276 A1 ordinary shares in ArcelorMittal South Africa. A1 ordinary shares were issued at a nominal value through a notional loan structure. Likamva was initially the only shareholder, but has introduced a broad-based party in the form of a community trust during November 2018. The trusts hold 29.53% of the shares in Amandla we Nsimbi (Pty) Ltd, reducing Likamva’s shareholding to 70.47%. Therefore, an indirect effective shareholding of 5% is achieved by the community trust.
The Isabelo Employee Empowerment Share Trust was established to facilitate B-BBEE ownership in compliance with the B-BBEE codes and to create meaningful wealth for qualifying employees in order to ensure their long-term dedication and the retention of skills, while enhancing the transformation of ArcelorMittal South Africa. The trust was set up for permanently employed management and non-management employees of all job grades of ArcelorMittal South Africa. The Isabelo Employee Empowerment Share Trust subscribed for 72 972 083 A2 ordinary shares in ArcelorMittal South Africa, representing 5.1% of the voting rights in ArcelorMittal South Africa. A2 ordinary shares are also issued at a nominal value through a notional loan structure.
The B-BBEE employee share ownership scheme is equity-settled. The ArcelorMittal South Africa empowerment shares will receive notional dividends during the “lock-in” period. From the first business day following the seventh anniversary of the issue date until the expiry of the lock-in period, Amandla we Nsimbi and the Isabelo Employee Empowerment Share Trust are entitled to receive cash dividends on the ArcelorMittal South Africa empowerment shares amounting to 5% of the ordinary dividend paid on ArcelorMittal South Africa shares. This is applicable to the extent that a dividend is declared and shall not create any obligation on ArcelorMittal South Africa to declare a dividend.
The “A” class shares granted to Amandla we Nsimbi (Pty) Ltd and the Isabelo Employee Empowerment Trust will convert into ArcelorMittal South Africa ordinary shares upon expiry of the “lock-in” period. The number of shares that will convert will be the equivalent of the value of the shares in surplus of the balance of the notional loan upon expiry of the “lock-in” period. There is a 10-year vesting period for the share-based payment benefit provided to the Isabelo Employee Empowerment Share Trust and no vesting period for the share-based payment benefit provided to Amandla we Nsimbi (Pty) Ltd. There are no performance targets for vesting for both ownership schemes.
2018Number
of shares
2018Number
of shares
ArcelorMittal South Africa Audited Annual Financial Statements 2018 59
Audited Annual Financial Statements

Notes to the group and company annual financial statements continuedfor the year ended 31 December 2018
23. Stated capital continuedAnalysis of shareholdingThe analysis of ordinary shareholders below represents a summary of beneficial shareholders with a holding greater than 5% of issued shares as at 31 December 2018:
2018 2017 Number
of shares% of shares
in issueNumber
of shares% of shares
in issue
ArcelorMittal Holdings AG 771 489 400 53.05 771 489 400 53.05 Amandla we Nsimbi (Pty) Ltd 243 240 276 16.73 243 240 276 16.73 Industrial Development Corporation 93 044 068 6.40 93 044 068 6.40 Isabelo Employee Empowerment Share Trust 72 972 083 5.02 72 972 083 5.02 Shareholding more than 5% 1 180 745 827 81.20 1 180 745 827 81.20 Shareholding less than 5% 273 526 357 18.80 273 526 357 18.80Total 1 454 272 184 100 1 454 272 184 100
Of the issued shares, Ikageng Broad-Based Employee Share Trust holds 1.5% (2017: 1.5%) and Vicva Investments and Trading Nine (Pty) Ltd owns 1.6% (2017: 1.6%). Amandla we Nsimbi (Pty) Ltd and the Isabelo Employee Empowerment Share Trust hold 100% of the A1 ordinary and A2 ordinary shares representing 17% and 5.1% shareholding respectively. Ikageng Broad-based Employee Share Trust holds the shares in the company for the benefit of the employees until such time that they vest. Vicva Investments and Trading Nine (Pty) Ltd, Ikageng Broad-Based Employee Share Trust, Amandla we Nsimbi (Pty) Ltd and Isabelo Employee Empowerment Share Trust are considered to be controlled by the company and the shares held by them are treated as treasury shares for accounting purposes.
Group Company
2017Rm
2017Rm
24. Finance lease obligationsSecured – at amortised costNon-current 46 54 – 2Current 15 70 2 57
Total 61 124 2 59
The finance leases are embedded within supply arrangements with suppliers and have been assessed in terms of IFRIC 4 Determining whether an Arrangement Contains a Lease.
Group Company
2017Rm
2017Rm
Maturity profileAt 31 DecemberMinimum lease paymentsNot later than one year 23 86 2 62Later than one year and not later than five years 57 71 – 2Total 80 157 2 64Future finance charges (19) (33) – (5)
Present value of minimum lease payments 61 124 2 59
The lease liabilities are effectively secured, as the rights to the leased assets are embedded in the supply agreements would generally revert to the lessor or supplier in the event of defaults.
There were no breaches or defaults in contracts during the current or comparative year.
Functional category Term expiry
Effective interest rate (fixed)
%
Gases 2019 10.41 – 11.09Electricity and transport utilities 2018 – 2022 15.80 – 18.25Steel processing and foundry services 2022 8.16
2018Rm
2018Rm
2018Rm
2018Rm
60 ArcelorMittal South Africa Audited Annual Financial Statements 2018

Notes to the group and company annual financial statements continuedfor the year ended 31 December 2018
Asset retirement obligation
Rm
Environ-mental
Rm
Onerous contracts
RmOther
RmTotal
Rm
25. ProvisionsGROUPFor the year ended 31 December
2018At the beginning of the year 204 1 901 3 22 2 130 Charge to the statement of
comprehensive income 3 (250) – – (247)Additions and scope changes (29) (104) – – (133)Discount rate change 7 (292) – – (285)Unwinding of the discount effect 25 146 – – 171
Utilised during the year (3) (29) (3) – (35)Acquisition of Environmental Trust – 332 – – 332
At the end of the year 204 1 954 – 22 2 180
Non-current 172 1 598 – 4 1 774 Current 32 356 – 18 406
204 1 954 – 22 2 180
COMPANYFor the year ended 31 December
2018At the beginning of the year 186 1 901 – 20 2 107 Charge to the statement of
comprehensive income 14 (290) – – (276)Additions and scope changes (14) (145) – – (159)Discount rate change 5 (290) – – (285)Unwinding of the discount effect 23 145 – – 168
Utilised during the year (8) (15) – – (23)
At the end of the year 192 1 596 – 20 1 808
Non-current 160 1 246 – 4 1 410 Current 32 350 – 16 398
192 1 596 – 20 1 808
ArcelorMittal South Africa Audited Annual Financial Statements 2018 61
Audited Annual Financial Statements

Notes to the group and company annual financial statements continuedfor the year ended 31 December 2018
Asset retirement obligation
Rm
Environ-mental
Rm
Onerous contracts
RmOther
RmTotal
Rm
25. Provisions continuedGROUPFor the year ended 31 December
2017At the beginning of the year 197 1 928 13 35 2 173 Charge to the statement of
comprehensive income 28 (6) 1 (12) 11Additions and scope changes (10) (228) – (12) (250)Discount rate change 5 68 – – 73 Unwinding of the discount effect 33 154 1 – 188
Utilised during the year (21) (21) (11) (1) (54)
At the end of the year 204 1 901 3 22 2 130
Non-current 168 1 654 4 1 826 Current 36 247 3 18 304
204 1 901 3 22 2 130
COMPANYFor the year ended 31 December
2017At the beginning of the year 181 1 928 – 34 2 143 Charge to the statement of
comprehensive income 25 (6) – (12) 7Additions and scope changes (10) (228) – (12) (250)Discount rate change 5 68 – – 73 Unwinding of the discount effect 30 154 – – 184
Utilised during the year (20) (21) – (2) (43)
At the end of the year 186 1 901 – 20 2 107
Non-current 150 1 654 – 4 1 808 Current 36 247 – 16 299
186 1 901 – 20 2 107
62 ArcelorMittal South Africa Audited Annual Financial Statements 2018
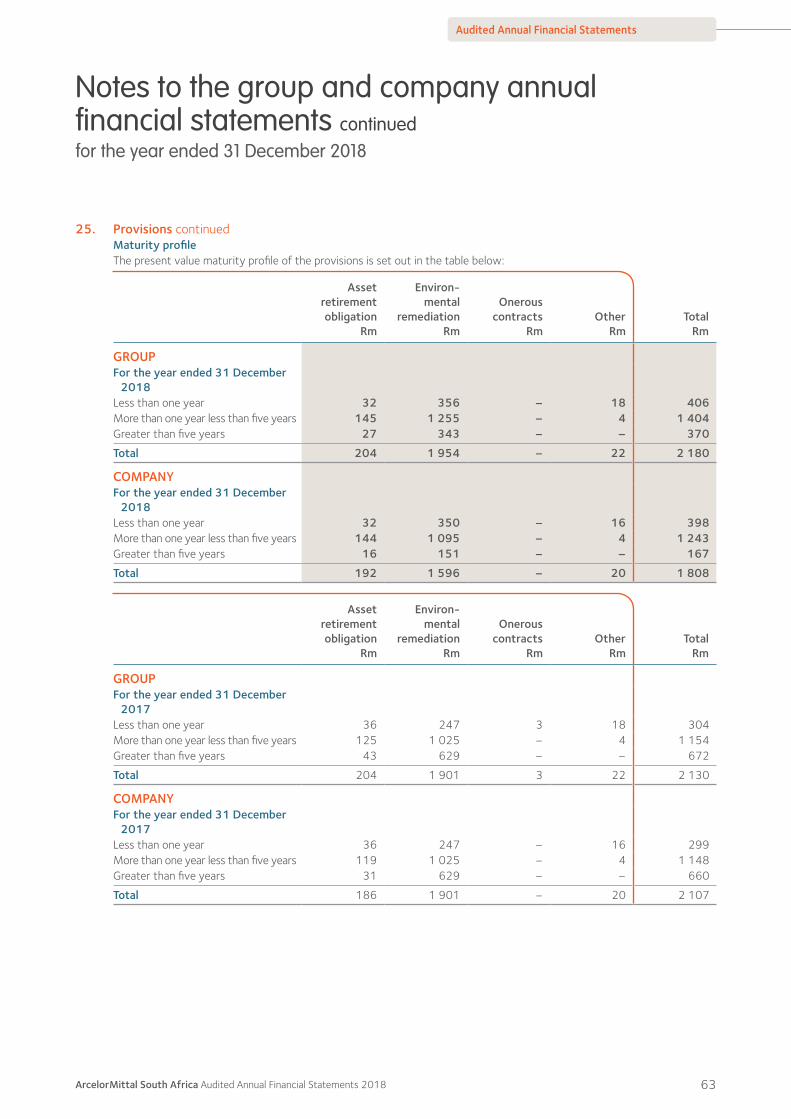
Notes to the group and company annual financial statements continuedfor the year ended 31 December 2018
25. Provisions continuedMaturity profileThe present value maturity profile of the provisions is set out in the table below:
Asset retirement obligation
Rm
Environ-mental
remediationRm
Onerous contracts
RmOther
RmTotal
Rm
GROUPFor the year ended 31 December
2018Less than one year 32 356 – 18 406 More than one year less than five years 145 1 255 – 4 1 404Greater than five years 27 343 – – 370
Total 204 1 954 – 22 2 180
COMPANYFor the year ended 31 December
2018Less than one year 32 350 – 16 398More than one year less than five years 144 1 095 – 4 1 243 Greater than five years 16 151 – – 167
Total 192 1 596 – 20 1 808
Asset retirement obligation
Rm
Environ-mental
remediationRm
Onerous contracts
RmOther
RmTotal
Rm
GROUPFor the year ended 31 December
2017Less than one year 36 247 3 18 304 More than one year less than five years 125 1 025 – 4 1 154 Greater than five years 43 629 – – 672
Total 204 1 901 3 22 2 130
COMPANYFor the year ended 31 December
2017Less than one year 36 247 – 16 299 More than one year less than five years 119 1 025 – 4 1 148 Greater than five years 31 629 – – 660
Total 186 1 901 – 20 2 107
ArcelorMittal South Africa Audited Annual Financial Statements 2018 63
Audited Annual Financial Statements

Notes to the group and company annual financial statements continuedfor the year ended 31 December 2018
25. Provisions continuedAsset retirement obligation and environmental remediation obligation provisionsEnvironmental obligations consist of asset retirement obligations and environmental remediation obligations.
Environmental remediation obligations represent the present value of the cost of remedial action to clean up and secure a site. These actions are primarily attributable to legacy waste disposal activities. Legal obligations exist to remediate these facilities.
Estimating the future cash flows associated with these obligations and the related asset components is complex. In particular, judgement is required in distinguishing between asset retirement obligations and environmental remediation obligations.
Existing laws and guidelines are not always clear as to the required end-state situation. The provisions are also affected by changing technologies, environmental, safety, business and legal considerations.
The directors assess the long-term operational plans, technological and legislative developments, guidelines issued by the authorities, advice from external environmental experts, and computations provided by quantity surveyors in order to derive an estimated future cash flow profile to serve as basis for the computation of the obligations and related assets.
The asset retirement obligations represent management’s best estimate of the present value of costs that will be required to retire plant and equipment. The majority of the obligation relates to ancillary plant and equipment that will be retired as part of the clean up and closure of those facilities to be remediated via the environmental remediation obligation. The net carrying amount of the asset retirement obligation, asset component, included in note 14, amounts to R3 million (2017: R3 million) for the group and Rnil (2017: Rnil) for the company.
The term of the obligation assessment varies according to the site. The maximum term is 18 years.
Thabazimbi Iron Ore mine environmental rehabilitationOn 1 November 2018, the Thabazimbi Iron Ore mine was acquired from Sishen Iron Ore Company (Pty) Ltd at a price of R1, enabling the group to control the environmental rehabilitation process. In terms of the sales agreement, the group is liable for all environmental remediation obligations. The acquisition did not have a significant impact on the environmental obligations of the group as the group has always been contractually responsible for the majority of the rehabilitation cost relating to the Thabazimbi Iron Ore mine. As part of the acquisition the group acquired an asset in the form of an environmental trust which holds investments to the value of R332 million. These investments will be used for rehabilitation purposes. Thabazimbi mine is 100% owned by ArcelorMittal South Africa and therefore consolidated in terms of IFRS10 Consolidated Financial Statements.
2018 %
2017 %
Average discount ratesAsset retirement obligation 12.20 12.69 Environmental remediation obligation 13.23 13.14 Onerous contracts – 10.35
The average escalation factor applied to the current cash flow estimates is 5.11% (2017: 5.52%).
64 ArcelorMittal South Africa Audited Annual Financial Statements 2018

Notes to the group and company annual financial statements continuedfor the year ended 31 December 2018
25. Provisions continuedOnerous contractThe onerous contract related to a take-or-pay contract for burnt dolomite and coal fines sourced from PPC Ltd. The take-or-pay obligation arose historically due to lower off-take by Saldanha on account of efficiency improvements and method changes at the Saldanha plant. This contract expired during 2018.
The sensitivity of the carrying amount of the obligations at 31 December 2018 in response to changes in key inputs is:
Asset retirement obligation
Environmental remediation obligations
Carrying amount at 31 December 2018
Increase/(decrease)
Rm
Increase/(decrease)
Rm
Percentage change in all cash flows+10% 20 195 -10% (20) (195)Percentage change in cash flows in first five years+10% 18 160 -10% (18) (160)Basis point change in discount rate+100 bps (2) (17)-100 bps 2 17 Basis point change in discount rate in first five years+100 bps (6) (14)-100 bps 6 14
ArcelorMittal South Africa Audited Annual Financial Statements 2018 65
Audited Annual Financial Statements

Notes to the group and company annual financial statements continuedfor the year ended 31 December 2018
Group Company
2018Rm
2017Rm
2018Rm
2017Rm
26. Trade and other payablesTrade payablesTrade payables 11 421 10 506 9 973 9 214TSR programme 883 794 883 794
Total 12 304 11 300 10 856 10 008
Other payablesLeave pay 430 355 429 355Net value added tax payable – 11 – –Sundry 1 602 1 017 1 593 1 010Refund liabilities 15 – 15 –
Total 2 047 1 383 2 037 1 365
Non-current other payables 572 399 572 399Current other payables 1 475 984 1 465 966
2 047 1 383 2 037 1 365
TSR programmeThe TSR programme is the sale of receivables balances to third parties. At the date of sale, ArcelorMittal South Africa transfers control and substantially all risks and rewards normally associated with ownership of these receivables. Therefore these trade receivables were derecognised at the date of sale. The debtors, however, will settle the balance due to ArcelorMittal South Africa Ltd and thereafter the company is obligated to transfer those amounts to the third parties.
Leave pay benefits accrualIn terms of group and company policy, employees are entitled to accumulate vested leave benefits not taken within a leave cycle. The obligation is reviewed annually.
SundrySundry payables comprise primarily of accruals for corporate fees, other general accruals and payroll-related payables.
Thabazimbi Iron Ore mine running costIncluded in current other payables are costs of R118 million (2017: R102 million) relating to the Thabazimbi Iron Ore mine interim period running costs prior to purchase of the mine.
Refund liabilitiesOn adoption of IFRS 15, a refund liability was reclassified to other payable in relation to customers with a right to return goods.
66 ArcelorMittal South Africa Audited Annual Financial Statements 2018

Notes to the group and company annual financial statements continuedfor the year ended 31 December 2018
Group Company
2018Rm
2017Rm
2018Rm
2017Rm
27. BorrowingsSecured – at amortised costBank 300 3 700 300 3 700Loans from holding company 2 700 2 700 2 700 2 700Loans 3 000 6 400 3 000 6 400
During 2017, the group entered into a revolving BBF with various financial institutions for a three-year tenor. At 31 December 2018, R300 million (2017: R3 700 million) was drawn down on the facility and R4 200 million (2017: R800 million) was still available. Eligible inventories and receivables are provided as securities for the BBF to the extent of the draw down. The group currently has no intention to replace any portion of the BBF.
The loan from the holding company has been subordinated in favour of the lenders of the BBF. This loan attracts interest at the South African prime lending rate.
The weighted average interest rate payable on borrowings is 10.31% (2017: 10.39%).
The BBF available to the group is subject to financial covenants. During the year the group successfully renegotiated the level of the tangible net worth covenant. At year-end, the group is in compliance with all covenants.
28. Other financial liabilitiesGroup Company
2018Rm
2017Rm
2018Rm
2017Rm
Non-currentFinancial liabilities carried at amortised costCompetition Commission administrative penalty 544 813 544 813
Total 544 813 544 813
CurrentFinancial liabilities carried at FVTPLOther forward exchange contracts 6 384 6 384Financial liabilities carried at FVTOCIForward exchange contracts used for hedging 10 – 10 –Financial liabilities carried at amortised costCompetition Commission administrative penalty 356 522 356 522
Total 372 906 372 906
Financial liabilities carried at FVTPLCompetition Commission administrative penaltyIn 2015 a final settlement agreement was reached with the Competition Commission for an imposed administrative penalty of R1 500 million to be settled over a five-year period, and subsequently accepted by the Tribunal on the outstanding competition matters regarding anti-competitive behaviour. The balance represents the present value of the repayment of the administrative penalty over the remaining period at the prevailing interest rate on debt owing to the State prescribed by the Minister of Finance in terms of section 80(1)(b) of the Public Finance Management Act No 1 of 1999, as amended.
In addition, ArcelorMittal South Africa is subject to an earnings before interest and tax (EBIT) cap on flat products produced at Vanderbijlpark and sold into the local market as well as spending R4 600 million on capital expenditure projects (refer to note 36), subject to certain conditions. Both commitments will apply for five years.
The CEO hereby confirms in respect of 2018, that ArcelorMittal South Africa has in all material respects complied with the settlement agreement entered into with the Competition Commission.
Financial liabilities carried at FVTPLForward exchange contractsFinancial liabilities carried at FVTPL represent losses on forward exchange contracts (FECs).
Financial liabilities carried at FVTOCIForward exchange contracts used for hedgingFinancial liabilities carried at FVTOCI represent losses on forward exchange contracts designated in a hedging relationship.
ArcelorMittal South Africa Audited Annual Financial Statements 2018 67
Audited Annual Financial Statements

Notes to the group and company annual financial statements continuedfor the year ended 31 December 2018
Group Company
2018Rm
2017Rm
2018Rm
2017Rm
29. Notes to the statement of cash flows29.1 Cash generated from operations
Profit/(loss) from operations 2 777 (1 220) 2 229 (1 413)Adjusted for:Depreciation and amortisation 831 976 821 910 Unrealised profit on sales to joint ventures (3) – – –Share option and participation costs 10 68 10 68 Non-cash movement in provisions and
financial liabilities (125) (279) (159) (279)(Reversal of write-down)/write-down of
inventory to net realisable value (140) 108 (140) 118 Movements in trade and other receivable
allowances 46 (1) 45 4 Reconditionable spares usage 5 1 1 1 Loss on disposal or scrapping of property,
plant and equipment 4 8 9 8 Changes in:Increase in inventories (520) (353) (298) (413)Increase in trade and other receivables (1 005) (1 207) (943) (888)Increase in trade and other payables 497 1 373 425 1 124 Utilisation of provisions (35) (54) (23) (43)Changes in financial liabilities or assets (142) (252) (142) (250)Other payables raised, released and utilised
relating to employee benefit 82 120 76 119
2 282 (712) 1 911 (934)
29.2 Income tax (paid)/receivedNormal taxation (payable)/recoverable at the
beginning of the year (24) 58 58 53 Amounts charged to the statement of
comprehensive income 63 (2) 74 –Normal taxation (recoverable)/payable at
the end of the year (41) 24 (132) (58)
(2) 80 – (5)
29.3 Investment to maintain operationsReplacement of property, plant and equipment (807) (876) (729) (789)Intangible assets (4) – (4) (1)Environmental (80) (39) (78) (39)Reconditionable spares (59) (87) (36) (72)
(950) (1 002) (847) (901)
29.4 Investment to expand operationsProperty, plant and equipment for expansion (306) (322) (285) (318)
Total capital expenditure (1 256) (1 324) (1 132) (1 219)
68 ArcelorMittal South Africa Audited Annual Financial Statements 2018
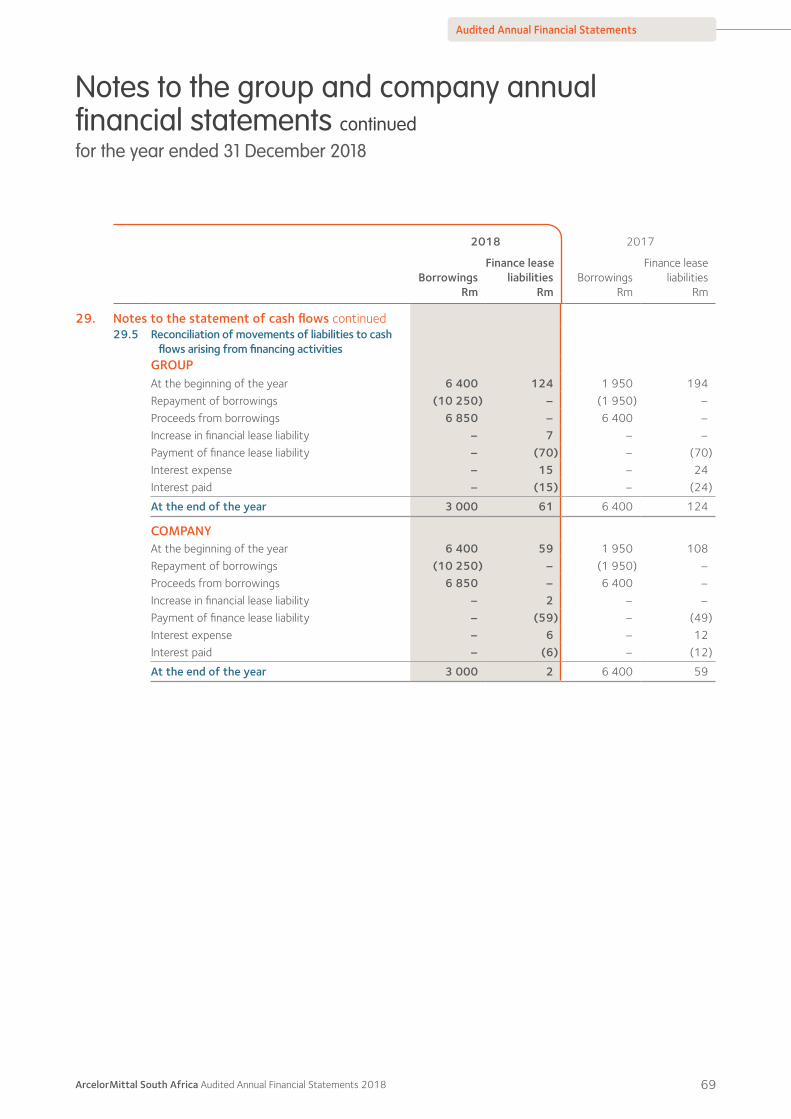
Notes to the group and company annual financial statements continuedfor the year ended 31 December 2018
2018 2017
BorrowingsRm
Finance lease liabilities
RmBorrowings
Rm
Finance lease liabilities
Rm
29. Notes to the statement of cash flows continued29.5 Reconciliation of movements of liabilities to cash
flows arising from financing activitiesGROUPAt the beginning of the year 6 400 124 1 950 194 Repayment of borrowings (10 250) – (1 950) –Proceeds from borrowings 6 850 – 6 400 –Increase in financial lease liability – 7 – –Payment of finance lease liability – (70) – (70)Interest expense – 15 – 24 Interest paid – (15) – (24)
At the end of the year 3 000 61 6 400 124
COMPANYAt the beginning of the year 6 400 59 1 950 108 Repayment of borrowings (10 250) – (1 950) –Proceeds from borrowings 6 850 – 6 400 –Increase in financial lease liability – 2 – –Payment of finance lease liability – (59) – (49)Interest expense – 6 – 12Interest paid – (6) – (12)
At the end of the year 3 000 2 6 400 59
ArcelorMittal South Africa Audited Annual Financial Statements 2018 69
Audited Annual Financial Statements
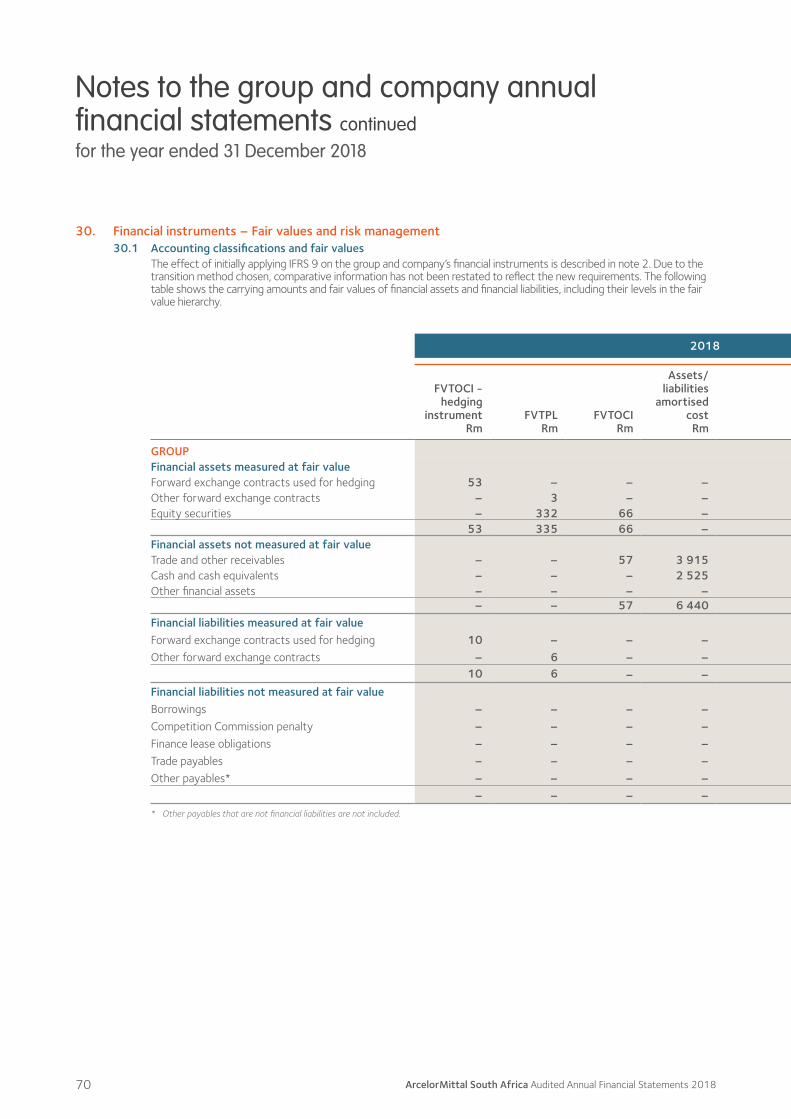
Notes to the group and company annual financial statements continuedfor the year ended 31 December 2018
30. Financial instruments – Fair values and risk management30.1 Accounting classifications and fair values
The effect of initially applying IFRS 9 on the group and company’s financial instruments is described in note 2. Due to the transition method chosen, comparative information has not been restated to reflect the new requirements. The following table shows the carrying amounts and fair values of financial assets and financial liabilities, including their levels in the fair value hierarchy.
It does not include fair value information for financial assets and financial liabilities not measured at fair value if the carrying amount is a reasonable approximation of fair value. Trade and other receivables and trade and other payables classified as held-for-sale are not included in the table below. Their carrying amount is a reasonable approximation of fair value.
2018 2017
FVTOCI -hedging
instrumentRm
FVTPL Rm
FVTOCIRm
Assets/liabilities
amortised cost
Rm
Non- financial assets/
liabilitiesRm
TotalRm
FVTOCIhedging
instrumentRm
FVTPL held for trading
Rm
Available-for-sale
Rm
Held-to-maturity
Rm
Non-financialassets/
liabilitiesRm
TotalRm
Fair valuehierarchy
GROUPFinancial assets measured at fair valueForward exchange contracts used for hedging 53 – – – – 53 – – – – – – Level 2Other forward exchange contracts – 3 – – – 3 – 4 – – – 4 Level 2Equity securities – 332 66 – – 398 – – 55 – – 55 Level 1
53 335 66 – – 454 – 4 55 – – 59 Financial assets not measured at fair value Trade and other receivables – – 57 3 915 – 3 972 – – – 3 138 – 3 138 Level 3Cash and cash equivalents – – – 2 525 – 2 525 – – – 2 988 – 2 988 Other financial assets – – – – – – – – – 424 – 424
– – 57 6 440 – 6 497 – – – 6 550 – 6 550Financial liabilities measured at fair valueForward exchange contracts used for hedging 10 – – – – 10 – – – – – – Level 2Other forward exchange contracts – 6 – – – 6 – 384 – – – 384 Level 2
10 6 – – – 16 – 384 – – – 384
Financial liabilities not measured at fair valueBorrowings – – – – 3 000 3 000 – – – – 6 400 6 400 Level 2Competition Commission penalty – – – – 900 900 – – – – 1 335 1 335 Level 2Finance lease obligations – – – – 61 61 – – – – 124 124 Level 2Trade payables – – – – 12 304 12 304 – – – – 11 300 11 300Other payables* – – – – 1 388 1 388 – – – – 814 814
– – – – 17 653 17 653 – – – – 19 973 19 973* Other payables that are not financial liabilities are not included.
70 ArcelorMittal South Africa Audited Annual Financial Statements 2018
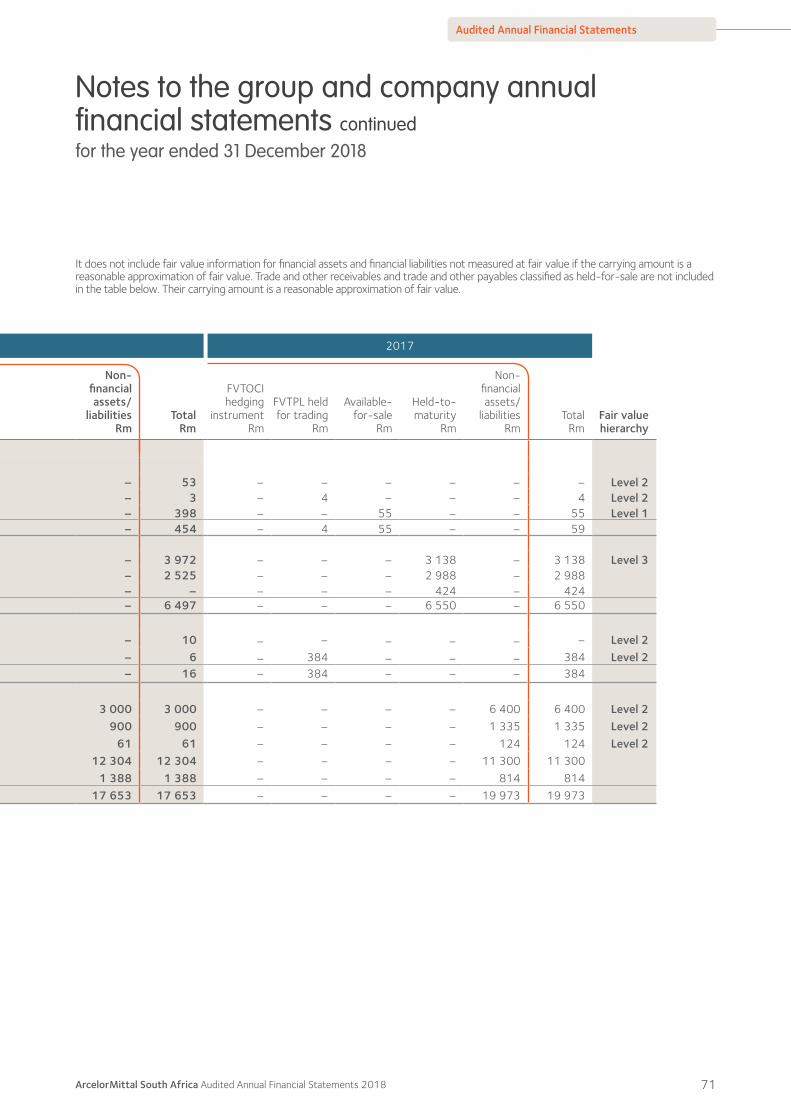
Notes to the group and company annual financial statements continuedfor the year ended 31 December 2018
30. Financial instruments – Fair values and risk management30.1 Accounting classifications and fair values
The effect of initially applying IFRS 9 on the group and company’s financial instruments is described in note 2. Due to the transition method chosen, comparative information has not been restated to reflect the new requirements. The following table shows the carrying amounts and fair values of financial assets and financial liabilities, including their levels in the fair value hierarchy.
It does not include fair value information for financial assets and financial liabilities not measured at fair value if the carrying amount is a reasonable approximation of fair value. Trade and other receivables and trade and other payables classified as held-for-sale are not included in the table below. Their carrying amount is a reasonable approximation of fair value.
2018 2017
FVTOCI -hedging
instrumentRm
FVTPL Rm
FVTOCIRm
Assets/liabilities
amortised cost
Rm
Non- financial assets/
liabilitiesRm
TotalRm
FVTOCIhedging
instrumentRm
FVTPL held for trading
Rm
Available-for-sale
Rm
Held-to-maturity
Rm
Non-financialassets/
liabilitiesRm
TotalRm
Fair valuehierarchy
GROUPFinancial assets measured at fair valueForward exchange contracts used for hedging 53 – – – – 53 – – – – – – Level 2Other forward exchange contracts – 3 – – – 3 – 4 – – – 4 Level 2Equity securities – 332 66 – – 398 – – 55 – – 55 Level 1
53 335 66 – – 454 – 4 55 – – 59 Financial assets not measured at fair value Trade and other receivables – – 57 3 915 – 3 972 – – – 3 138 – 3 138 Level 3Cash and cash equivalents – – – 2 525 – 2 525 – – – 2 988 – 2 988 Other financial assets – – – – – – – – – 424 – 424
– – 57 6 440 – 6 497 – – – 6 550 – 6 550Financial liabilities measured at fair valueForward exchange contracts used for hedging 10 – – – – 10 – – – – – – Level 2Other forward exchange contracts – 6 – – – 6 – 384 – – – 384 Level 2
10 6 – – – 16 – 384 – – – 384
Financial liabilities not measured at fair valueBorrowings – – – – 3 000 3 000 – – – – 6 400 6 400 Level 2Competition Commission penalty – – – – 900 900 – – – – 1 335 1 335 Level 2Finance lease obligations – – – – 61 61 – – – – 124 124 Level 2Trade payables – – – – 12 304 12 304 – – – – 11 300 11 300Other payables* – – – – 1 388 1 388 – – – – 814 814
– – – – 17 653 17 653 – – – – 19 973 19 973* Other payables that are not financial liabilities are not included.
ArcelorMittal South Africa Audited Annual Financial Statements 2018 71
Audited Annual Financial Statements
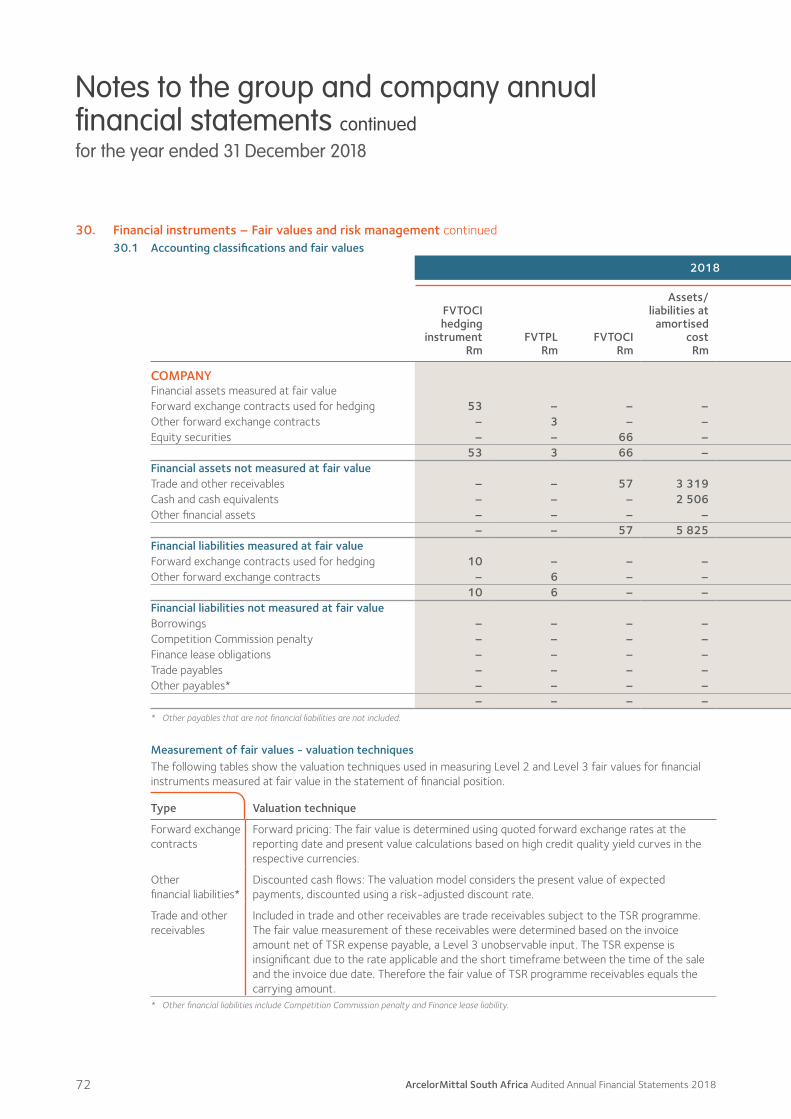
Notes to the group and company annual financial statements continuedfor the year ended 31 December 2018
30. Financial instruments – Fair values and risk management continued30.1 Accounting classifications and fair values
2018 2017
FVTOCIhedging
instrumentRm
FVTPLRm
FVTOCIRm
Assets/liabilities at
amortised cost
Rm
Non- financial assets/
liabilitiesRm
TotalRm
FVTOCIhedging
instrumentRm
FVTPL held
for tradingRm
Available-for-sale
Rm
Held-to-maturity
Rm
Non-financialassets/
liabilitiesRm
TotalRm
Fair valuehierarchy
COMPANYFinancial assets measured at fair valueForward exchange contracts used for hedging 53 – – – – 53 – – – – – – Level 2Other forward exchange contracts – 3 – – – 3 – 4 – – – 4 Level 2Equity securities – – 66 – – 66 – – 46 – – 46 Level 1
53 3 66 – – 122 – 4 46 – – 50Financial assets not measured at fair value Trade and other receivables – – 57 3 319 – 3 376 – – – 3 130 – 3 130 Level 3Cash and cash equivalents – – – 2 506 – 2 506 – – – 2 465 – 2 465 Other financial assets – – – – – – – – – 424 – 424
– – 57 5 825 – 5 882 – – – 6 019 – 6 019Financial liabilities measured at fair value Forward exchange contracts used for hedging 10 – – – – 10 – – – – – – Level 2Other forward exchange contracts – 6 – – – 6 – 384 – – – 384 Level 2
10 6 – – – 16 – 384 – – – 384Financial liabilities not measured at fair valueBorrowings – – – – 3 000 3 000 – – – – 6 400 6 400 Level 2Competition Commission penalty – – – – 900 900 – – – – 1 335 1 335 Level 2Finance lease obligations – – – – 2 2 – – – – 59 59 Level 2Trade payables – – – – 10 856 10 856 – – – – 10 008 10 008Other payables* – – – – 1 388 1 388 – – – – 810 810
– – – – 16 146 16 146 – – – – 18 612 18 612* Other payables that are not financial liabilities are not included.
Measurement of fair values - valuation techniquesThe following tables show the valuation techniques used in measuring Level 2 and Level 3 fair values for financial instruments measured at fair value in the statement of financial position.
Type Valuation technique
Forward exchange contracts
Forward pricing: The fair value is determined using quoted forward exchange rates at the reporting date and present value calculations based on high credit quality yield curves in the respective currencies.
Other financial liabilities*
Discounted cash flows: The valuation model considers the present value of expected payments, discounted using a risk-adjusted discount rate.
Trade and other receivables
Included in trade and other receivables are trade receivables subject to the TSR programme. The fair value measurement of these receivables were determined based on the invoice amount net of TSR expense payable, a Level 3 unobservable input. The TSR expense is insignificant due to the rate applicable and the short timeframe between the time of the sale and the invoice due date. Therefore the fair value of TSR programme receivables equals the carrying amount.
* Other financial liabilities include Competition Commission penalty and Finance lease liability.
72 ArcelorMittal South Africa Audited Annual Financial Statements 2018

Notes to the group and company annual financial statements continuedfor the year ended 31 December 2018
30. Financial instruments – Fair values and risk management continued30.1 Accounting classifications and fair values
2018 2017
FVTOCIhedging
instrumentRm
FVTPLRm
FVTOCIRm
Assets/liabilities at
amortised cost
Rm
Non- financial assets/
liabilitiesRm
TotalRm
FVTOCIhedging
instrumentRm
FVTPL held
for tradingRm
Available-for-sale
Rm
Held-to-maturity
Rm
Non-financialassets/
liabilitiesRm
TotalRm
Fair valuehierarchy
COMPANYFinancial assets measured at fair valueForward exchange contracts used for hedging 53 – – – – 53 – – – – – – Level 2Other forward exchange contracts – 3 – – – 3 – 4 – – – 4 Level 2Equity securities – – 66 – – 66 – – 46 – – 46 Level 1
53 3 66 – – 122 – 4 46 – – 50Financial assets not measured at fair value Trade and other receivables – – 57 3 319 – 3 376 – – – 3 130 – 3 130 Level 3Cash and cash equivalents – – – 2 506 – 2 506 – – – 2 465 – 2 465 Other financial assets – – – – – – – – – 424 – 424
– – 57 5 825 – 5 882 – – – 6 019 – 6 019Financial liabilities measured at fair value Forward exchange contracts used for hedging 10 – – – – 10 – – – – – – Level 2Other forward exchange contracts – 6 – – – 6 – 384 – – – 384 Level 2
10 6 – – – 16 – 384 – – – 384Financial liabilities not measured at fair valueBorrowings – – – – 3 000 3 000 – – – – 6 400 6 400 Level 2Competition Commission penalty – – – – 900 900 – – – – 1 335 1 335 Level 2Finance lease obligations – – – – 2 2 – – – – 59 59 Level 2Trade payables – – – – 10 856 10 856 – – – – 10 008 10 008Other payables* – – – – 1 388 1 388 – – – – 810 810
– – – – 16 146 16 146 – – – – 18 612 18 612* Other payables that are not financial liabilities are not included.
Measurement of fair values - valuation techniquesThe following tables show the valuation techniques used in measuring Level 2 and Level 3 fair values for financial instruments measured at fair value in the statement of financial position.
Type Valuation technique
Forward exchange contracts
Forward pricing: The fair value is determined using quoted forward exchange rates at the reporting date and present value calculations based on high credit quality yield curves in the respective currencies.
Other financial liabilities*
Discounted cash flows: The valuation model considers the present value of expected payments, discounted using a risk-adjusted discount rate.
Trade and other receivables
Included in trade and other receivables are trade receivables subject to the TSR programme. The fair value measurement of these receivables were determined based on the invoice amount net of TSR expense payable, a Level 3 unobservable input. The TSR expense is insignificant due to the rate applicable and the short timeframe between the time of the sale and the invoice due date. Therefore the fair value of TSR programme receivables equals the carrying amount.
* Other financial liabilities include Competition Commission penalty and Finance lease liability.
When measuring the fair value of an asset or a liability, the group and company use observable market data as far as possible. Fair values are categorised into different levels in a fair value hierarchy based on the inputs used in the valuation techniques as follows:
Level Valuation technique
Level 1: Quoted prices (unadjusted) in active markets for identical assets or liabilities.
Level 2: Inputs other than quoted prices included in Level 1 that are observable for the asset or liability, either directly (ie as prices) or indirectly (ie derived from prices).
Level 3: Inputs for the asset or liability that are not based on observable market data (unobservable inputs).
ArcelorMittal South Africa Audited Annual Financial Statements 2018 73
Audited Annual Financial Statements
Notes to the group and company annual financial statements continuedfor the year ended 31 December 2018
30. Financial instruments – Fair values and risk management continued30.2 Financial risk management overview and objectives
The group and company’s board of directors has overall responsibility for the establishment and oversight of the group and company’s risk management framework. The Audit and Risk Committee is responsible for developing and monitoring the group and company’s risk management policies. The committee reports regularly to the board of directors on its activities.
The group and company’s risk management policies are established to identify and analyse the risks faced by it, to set appropriate risk limits and controls and to monitor risks and adherence to limits. Risk management policies and systems are reviewed regularly to reflect changes in market conditions and the group and company’s activities. The group and company, through its training and management standards and procedures, aims to maintain a disciplined and constructive control environment in which all employees understand their roles and obligations.
The group and company’s audit and risk committee oversee how management monitors compliance with the group and company’s risk management policies and procedures, and reviews the adequacy of the risk management framework in relation to the risks faced by the group and company. The group and company’s audit committee is assisted in its oversight role by internal audit. Internal audit undertakes both regular and ad hoc reviews of risk management controls and procedures, the results of which are reported to the audit committee.
The group’s financial risk management programme focuses on the unpredictability of financial markets and seeks to minimise potential adverse effects on financial performance.
Financial risks to which the group and company are exposed consist of:
Financial market risk, consisting of:–– Foreign currency risk–– Commodity price risks–– Interest rate risk–– Liquidity risk, being
• Cash flow volatility • Fair value and cash flow interest rate risk
Capital management and gearing riskCustomer credit risk as detailed in note 21The treasury and financial risk management policy (treasury policy) details the framework within which financial risk (other than customer credit risk) of the group is managed. The policy is approved by the board of directors and is reviewed annually.
The treasury policy addresses market, liquidity, capital management and gearing risk through the direction of the following activities:Financing facilitiesFinancial guarantees and letters of creditMarket risk management through:–– Foreign currency risk management–– Commodity risk management–– Interest rate management
Cash management through liquidity managementThe treasury policy is enacted by the treasury department (treasury). Treasury identifies, evaluates and mitigates financial risks in close cooperation with the group and company’s operating units. Board-approved written policies cover the specific activities noted above and address risk limits, the use of derivative and non-derivative financial instruments to hedge certain exposures, and the approval framework governing transaction levels.
30.3 Financial market riskThrough its activities, the group is exposed primarily to the financial risks of changes in commodity prices, foreign currency exchange rates, interest rates and potential liquidity constraints.
The group manages currency risk through economic hedging of foreign exchange rates primarily relating to capital procurement, trade imports and exports exposures. During 2018 some of the derivatives were designated within hedge accounting relationships.
74 ArcelorMittal South Africa Audited Annual Financial Statements 2018

Notes to the group and company annual financial statements continuedfor the year ended 31 December 2018
30. Financial instruments – Fair values and risk management continued30.4 Foreign currency risk management
The carrying amount in ZAR, as translated at the closing exchange rate, of the foreign denominated monetary assets and monetary liabilities at the reporting date is:
Group Company
2018Rm
2017Rm
2018Rm
2017Rm
Monetary assetsUnited States dollar (USD)Cash and cash equivalents 78 23 78 23Trade and other receivables (unrelated parties) 1 227 325 740 16Trade and other receivables (related parties) – 513 – 315Forward exchange contracts used hedging 53 53Other forward exchange contracts – 3 – 3Euro (EUR)Cash and cash equivalents 4 27 4 27Other forward exchange contracts 3 1 3 1Metical (MZN)Cash and cash equivalents 8 7 – –
Total foreign denominated monetary assets 1 373 899 878 385
Monetary liabilitiesUSDTrade and other payables (related parties) (5 177) (5 108) (4 720) (4 704)Trade and other payables (unrelated parties) (100) (70) (65) (65)Forward exchange contracts used hedging (10) – (10) –Other forward exchange contracts (6) (367) (6) (367)EURTrade and other payables (related parties) (78) (231) (78) (231)Trade and other payables (unrelated parties) (244) (349) (231) (118)Other forward exchange contracts – (17) – (17)
Total foreign denominated monetary liabilities (5 615) (6 142) (5 110) (5 502)
Total net foreign denominated monetary liabilities (4 242) (5 243) (4 232) (5 117)
Only notable currency holdings are disclosed.
ArcelorMittal South Africa Audited Annual Financial Statements 2018 75
Audited Annual Financial Statements
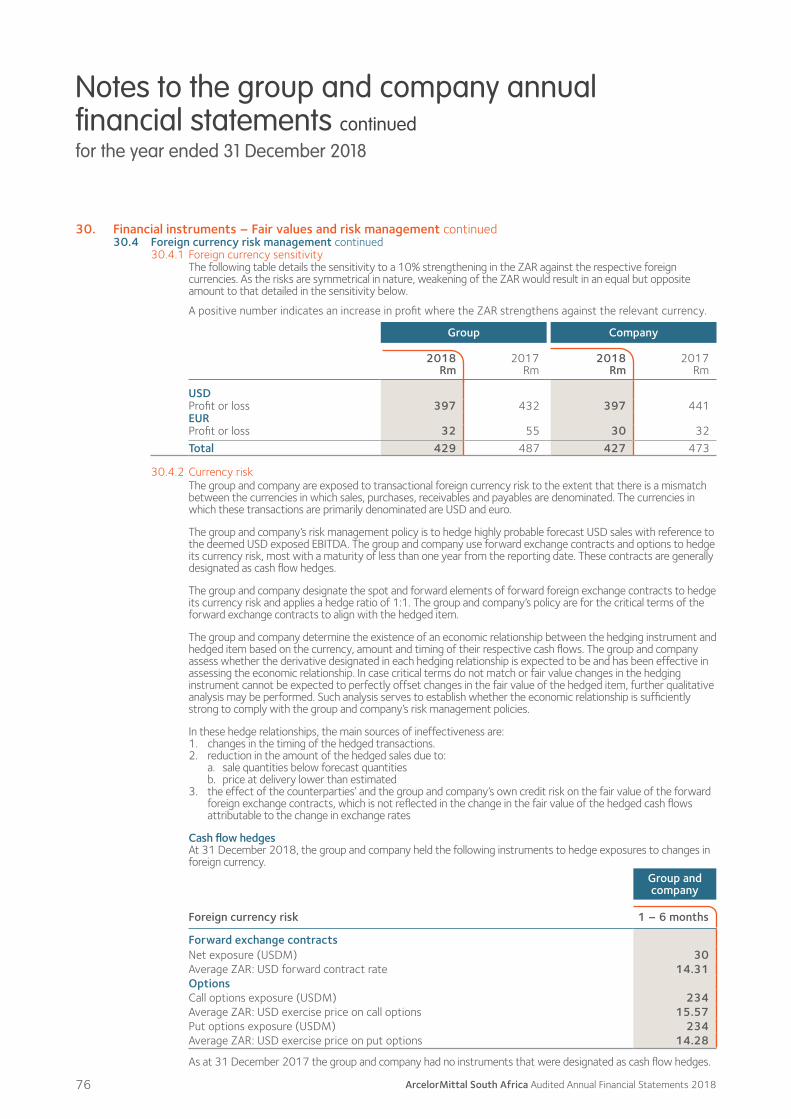
Notes to the group and company annual financial statements continuedfor the year ended 31 December 2018
30. Financial instruments – Fair values and risk management continued30.4 Foreign currency risk management continued
30.4.1 Foreign currency sensitivityThe following table details the sensitivity to a 10% strengthening in the ZAR against the respective foreign currencies. As the risks are symmetrical in nature, weakening of the ZAR would result in an equal but opposite amount to that detailed in the sensitivity below.
A positive number indicates an increase in profit where the ZAR strengthens against the relevant currency.
Group Company
2018Rm
2017Rm
2018Rm
2017Rm
USDProfit or loss 397 432 397 441EURProfit or loss 32 55 30 32Total 429 487 427 473
30.4.2 Currency riskThe group and company are exposed to transactional foreign currency risk to the extent that there is a mismatch between the currencies in which sales, purchases, receivables and payables are denominated. The currencies in which these transactions are primarily denominated are USD and euro.
The group and company’s risk management policy is to hedge highly probable forecast USD sales with reference to the deemed USD exposed EBITDA. The group and company use forward exchange contracts and options to hedge its currency risk, most with a maturity of less than one year from the reporting date. These contracts are generally designated as cash flow hedges.
The group and company designate the spot and forward elements of forward foreign exchange contracts to hedge its currency risk and applies a hedge ratio of 1:1. The group and company’s policy are for the critical terms of the forward exchange contracts to align with the hedged item.
The group and company determine the existence of an economic relationship between the hedging instrument and hedged item based on the currency, amount and timing of their respective cash flows. The group and company assess whether the derivative designated in each hedging relationship is expected to be and has been effective in assessing the economic relationship. In case critical terms do not match or fair value changes in the hedging instrument cannot be expected to perfectly offset changes in the fair value of the hedged item, further qualitative analysis may be performed. Such analysis serves to establish whether the economic relationship is sufficiently strong to comply with the group and company’s risk management policies.
In these hedge relationships, the main sources of ineffectiveness are:1. changes in the timing of the hedged transactions.2. reduction in the amount of the hedged sales due to: a. sale quantities below forecast quantities b. price at delivery lower than estimated3. the effect of the counterparties’ and the group and company’s own credit risk on the fair value of the forward
foreign exchange contracts, which is not reflected in the change in the fair value of the hedged cash flows attributable to the change in exchange rates
Cash flow hedgesAt 31 December 2018, the group and company held the following instruments to hedge exposures to changes in foreign currency.
Group and company
Foreign currency risk 1 – 6 months
Forward exchange contractsNet exposure (USDM) 30Average ZAR: USD forward contract rate 14.31OptionsCall options exposure (USDM) 234Average ZAR: USD exercise price on call options 15.57Put options exposure (USDM) 234Average ZAR: USD exercise price on put options 14.28
As at 31 December 2017 the group and company had no instruments that were designated as cash flow hedges.
76 ArcelorMittal South Africa Audited Annual Financial Statements 2018

Notes to the group and company annual financial statements continuedfor the year ended 31 December 2018
30. Financial instruments – Fair values and risk management continued30.4 Foreign currency risk management continued
The following table provides a reconciliation of equity and analysis of OCI items for group and company, resulting from cash flow hedge accounting.
Group and company
Cash flow hedges
Hedging reserve
Rm
Line item in profit or loss
affected by the
reclassification
Balance at 1 January 2018 –Changes in fair value:Foreign currency risk – revenueForward exchange contracts (59)Options 53Amount reclassified to profit or loss:Forward exchange contracts 49 RevenueOptions –
Balance at 31 December 2018 43
30.4.3 Economic hedging using derivative contractsThe foreign exchange hedging derivative contracts not designated within hedge accounting relationships, outstanding at the end of the reporting period are:Unmatured instrumentsFC: foreign currency
AveragepriceFC/R
ContractvalueFCm
Fair value favourable
Rm
Profit orlossRm
GROUP2018Other forward contractsBuy EUR 16.48 7 3 3
2017Other forward contractsBuy EUR 15.50 45 (16) (16)Buy USD 13.42 323 (65) (365)Sell USD 13.49 (1) 1 1
COMPANY2018Other forward contracts
Buy EUR 16.48 7 3 3
2017Forward contracts held-for-
trading at FVTPLBuy EUR 15.5 45 (16) (16)Buy USD 13.42 323 (365) (365)Sell USD 13.49 (1) 1 1
ArcelorMittal South Africa Audited Annual Financial Statements 2018 77
Audited Annual Financial Statements

Notes to the group and company annual financial statements continuedfor the year ended 31 December 2018
30. Financial instruments – Fair values and risk management continued30.5 Interest rate risk management continued
Sources of interest rate risk are:–– Interest expenses, on drawn financing facilities, and promissory notes issued to trade vendors as well as arrangements to fund the construction of assets either in the form of bona fide borrowing arrangements or through supply arrangements containing financial lease structures at fixed interest rates–– Interest income, due to the group and company’s net cash position and the investment thereof at variable interest rates
30.6 Liquidity risk managementUltimate responsibility for liquidity risk management rests with the board of directors, which has built an appropriate liquidity risk management framework for the management of the group and company’s short-, medium- and long-term funding and liquidity management requirements.
The objectives of the liquidity management policy are:–– Maintenance of adequate reserves, banking facilities and reserve borrowing facilities by monitoring forecast and actual cash flows and matching the maturity profiles of financial assets and liabilities–– Optimise the account and domestic cash pool structures–– Minimise bank charges–– Optimise the availability and use of short-term liquidity positions across the group without compromising the day-to-day cash needs–– Optimise the net interest result–– Minimise the number of bank accounts
Details of additional undrawn financing facilities that the group and company have at their disposal to reduce liquidity risk are:
Group Company
2018Rm
2017Rm
2018Rm
2017Rm
Facilities at the end of the reporting period– amount undrawn 4 200 800 4 200 800
The BBF available to the group is subject to financial covenants. As at 31 December 2018, the group is in compliance with all covenants.
78 ArcelorMittal South Africa Audited Annual Financial Statements 2018
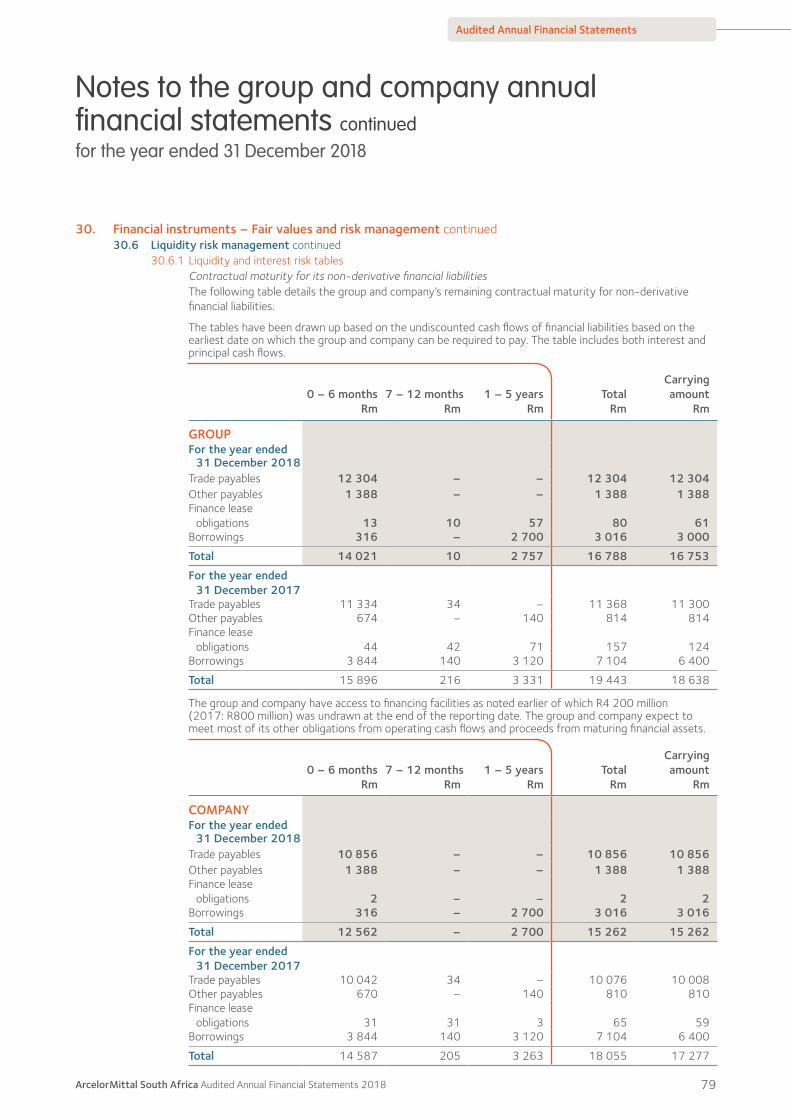
Notes to the group and company annual financial statements continuedfor the year ended 31 December 2018
30. Financial instruments – Fair values and risk management continued30.6 Liquidity risk management continued
30.6.1 Liquidity and interest risk tablesContractual maturity for its non-derivative financial liabilitiesThe following table details the group and company’s remaining contractual maturity for non-derivative financial liabilities.
The tables have been drawn up based on the undiscounted cash flows of financial liabilities based on the earliest date on which the group and company can be required to pay. The table includes both interest and principal cash flows.
0 – 6 monthsRm
7 – 12 monthsRm
1 – 5 yearsRm
TotalRm
Carrying amount
Rm
GROUPFor the year ended
31 December 2018Trade payables 12 304 – – 12 304 12 304Other payables 1 388 – – 1 388 1 388Finance lease
obligations 13 10 57 80 61Borrowings 316 – 2 700 3 016 3 000
Total 14 021 10 2 757 16 788 16 753
For the year ended 31 December 2017
Trade payables 11 334 34 – 11 368 11 300Other payables 674 – 140 814 814Finance lease
obligations 44 42 71 157 124Borrowings 3 844 140 3 120 7 104 6 400
Total 15 896 216 3 331 19 443 18 638
The group and company have access to financing facilities as noted earlier of which R4 200 million (2017: R800 million) was undrawn at the end of the reporting date. The group and company expect to meet most of its other obligations from operating cash flows and proceeds from maturing financial assets.
0 – 6 monthsRm
7 – 12 monthsRm
1 – 5 yearsRm
TotalRm
Carrying amount
Rm
COMPANYFor the year ended
31 December 2018Trade payables 10 856 – – 10 856 10 856Other payables 1 388 – – 1 388 1 388Finance lease
obligations 2 – – 2 2Borrowings 316 – 2 700 3 016 3 016
Total 12 562 – 2 700 15 262 15 262
For the year ended 31 December 2017
Trade payables 10 042 34 – 10 076 10 008Other payables 670 – 140 810 810Finance lease
obligations 31 31 3 65 59Borrowings 3 844 140 3 120 7 104 6 400
Total 14 587 205 3 263 18 055 17 277
ArcelorMittal South Africa Audited Annual Financial Statements 2018 79
Audited Annual Financial Statements
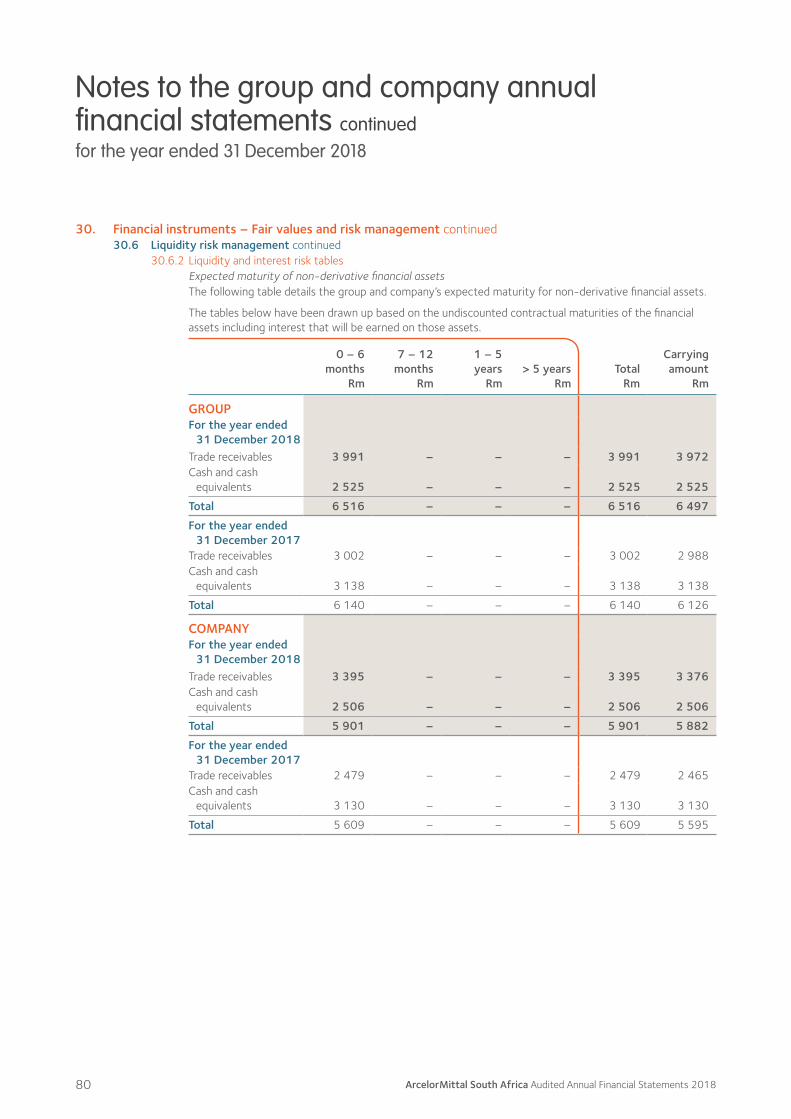
Notes to the group and company annual financial statements continuedfor the year ended 31 December 2018
30. Financial instruments – Fair values and risk management continued30.6 Liquidity risk management continued
30.6.2 Liquidity and interest risk tablesExpected maturity of non-derivative financial assetsThe following table details the group and company’s expected maturity for non-derivative financial assets.
The tables below have been drawn up based on the undiscounted contractual maturities of the financial assets including interest that will be earned on those assets.
0 – 6 months
Rm
7 – 12 months
Rm
1 – 5 years
Rm> 5 years
RmTotal
Rm
Carrying amount
Rm
GROUPFor the year ended
31 December 2018Trade receivables 3 991 – – – 3 991 3 972Cash and cash
equivalents 2 525 – – – 2 525 2 525
Total 6 516 – – – 6 516 6 497
For the year ended 31 December 2017
Trade receivables 3 002 – – – 3 002 2 988Cash and cash
equivalents 3 138 – – – 3 138 3 138
Total 6 140 – – – 6 140 6 126
COMPANYFor the year ended
31 December 2018Trade receivables 3 395 – – – 3 395 3 376Cash and cash
equivalents 2 506 – – – 2 506 2 506
Total 5 901 – – – 5 901 5 882
For the year ended 31 December 2017
Trade receivables 2 479 – – – 2 479 2 465Cash and cash
equivalents 3 130 – – – 3 130 3 130
Total 5 609 – – – 5 609 5 595
80 ArcelorMittal South Africa Audited Annual Financial Statements 2018
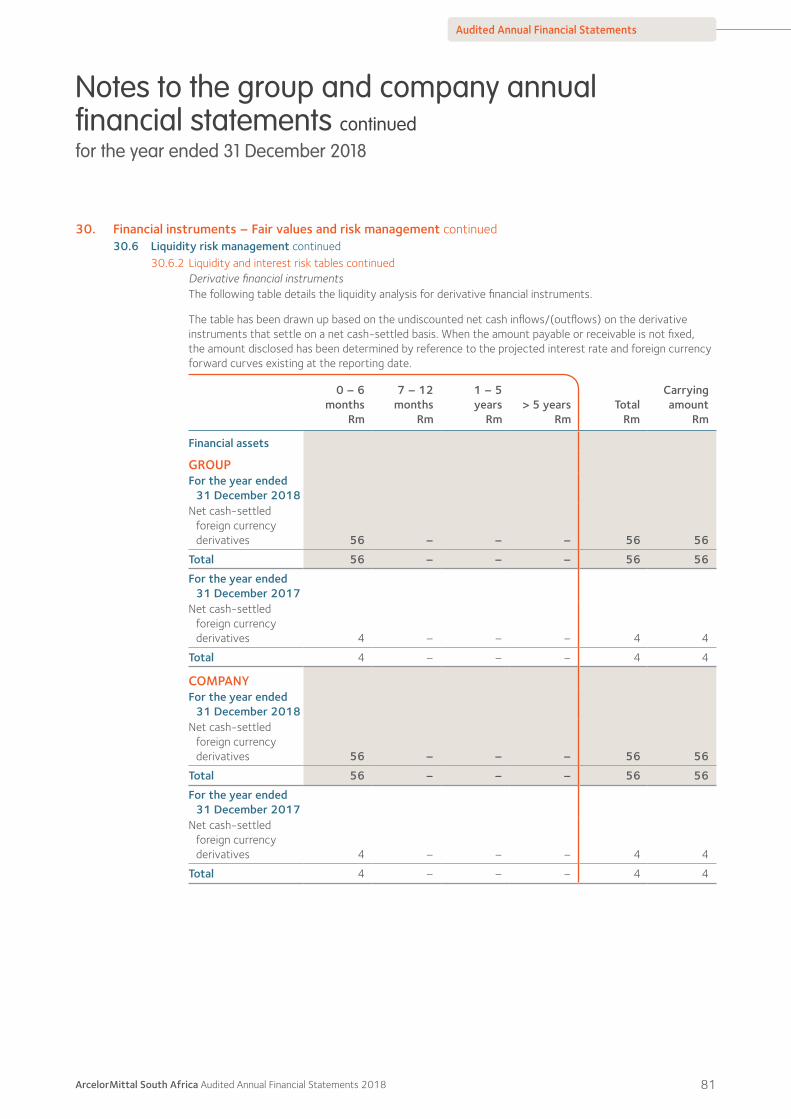
Notes to the group and company annual financial statements continuedfor the year ended 31 December 2018
30. Financial instruments – Fair values and risk management continued30.6 Liquidity risk management continued
30.6.2 Liquidity and interest risk tables continuedDerivative financial instrumentsThe following table details the liquidity analysis for derivative financial instruments.
The table has been drawn up based on the undiscounted net cash inflows/(outflows) on the derivative instruments that settle on a net cash-settled basis. When the amount payable or receivable is not fixed, the amount disclosed has been determined by reference to the projected interest rate and foreign currency forward curves existing at the reporting date.
0 – 6 months
Rm
7 – 12 months
Rm
1 – 5 years
Rm> 5 years
RmTotal
Rm
Carrying amount
Rm
Financial assets
GROUPFor the year ended
31 December 2018Net cash-settled
foreign currency derivatives 56 – – – 56 56
Total 56 – – – 56 56
For the year ended 31 December 2017
Net cash-settled foreign currency derivatives 4 – – – 4 4
Total 4 – – – 4 4
COMPANYFor the year ended
31 December 2018Net cash-settled
foreign currency derivatives 56 – – – 56 56
Total 56 – – – 56 56
For the year ended 31 December 2017
Net cash-settled foreign currency derivatives 4 – – – 4 4
Total 4 – – – 4 4
ArcelorMittal South Africa Audited Annual Financial Statements 2018 81
Audited Annual Financial Statements

Notes to the group and company annual financial statements continuedfor the year ended 31 December 2018
30. Financial instruments – Fair values and risk management continued30.6 Liquidity risk management continued
30.6.2 Liquidity and interest risk tables continued
0 – 6 months
Rm
7 – 12 months
Rm
1 – 5 years
Rm> 5 years
RmTotal
Rm
Carrying amount
Rm
Financial liabilities
GROUPFor the year ended
31 December 2018Net cash-settled
foreign currency derivatives 16 – – – 16 16
Total 16 – – – 16 16
For the year ended 31 December 2017
Net cash-settled foreign currency derivatives 381 3 – – 384 384
Total 381 3 – – 384 384
COMPANYFor the year ended
31 December 2018Net cash-settled
foreign currency derivatives 16 – – – 16 16
Total 16 – – – 16 16
For the year ended 31 December 2017
Net cash-settled foreign currency derivatives 381 3 – – 384 384
Total 381 3 – – 384 384
30.7 Capital risk managementThe group and company objectives when managing capital are:–– To safeguard the ability to continue as a going concern, so as to be able to continue to provide returns for shareholders and benefits for other stakeholders–– To provide an adequate return to shareholders by pricing products and services commensurate with the level of risk
The amount of capital is set in proportion to risk. The capital structure is managed and adjusted in light of changes in economic conditions within the domestic and global steel industry and the risk characteristics of the underlying assets.
The group and company overall strategy remained unchanged in 2018.
Consistent with others in the industry, the group and company monitor capital on a debt-to-total shareholders’ equity basis.
Net debt is total interest-bearing borrowings less cash and cash equivalents. Total shareholders’ equity is as per the statement of financial position.
82 ArcelorMittal South Africa Audited Annual Financial Statements 2018

Notes to the group and company annual financial statements continuedfor the year ended 31 December 2018
30. Financial instruments – Fair values and risk management continued30.7 Capital risk management continued
30.6.2 Liquidity and interest risk tables continued
Group Company
2018Rm
2017Rm
2018Rm
2017Rm
Cash and cash equivalents 2 525 3 138 2 506 3 130Interest-bearing borrowings (3 000) (6 400) (3 000) (6 400)Net debt (475) (3 262) (494) (3 270)Total shareholders’ equity 7 961 8 058 7 832 4 196
Gearing ratio (%) 5.97 40.48 6.31 77.93
Estimated impact on profit or loss based on a 100 basis point change in interest rate:100 basis point increase (4.75) (32.62) (4.94) (32.7)100 basis point decrease 4.75 32.62 4.94 32.7
31. Related party disclosuresDuring the year the company and its subsidiaries, in the ordinary course of business, entered into various sales and purchase transactions with its jointly controlled entities, its associates and other entities within the greater ArcelorMittal group. These transactions occurred under terms that are no less favourable to the company than those arranged with third parties.
Companies within the greater ArcelorMittal groupThe group purchased products and services to the value of R8 062 million (2017: R8 605 million) from, and sold goods to the value of R63 million (2017: R46 million) to other companies in the ArcelorMittal group.
The outstanding balances at year-end are:–– Included in trade receivables, R24 million (2017: R25 million)–– Included in trade payables, R6 337 million (2017: R5 315 million)
Included in trade payables is the corporate service fee of R334 million (2017: R248 million) payable to ArcelorMittal group for corporate services rendered and a fee for research and development of R607 million (2017: R383 million).
Included in borrowings (refer to note 27) is a loan of R2 700 million (2017: R2 700 million) with the holding company. Interest is payable at the South African prime lending rate and an amount of R272 million (2017: R281 million) was incurred for 2018.
Jointly controlled entities and associatesInterest income for the group from jointly controlled entities of R9 million (2017: R9 million) is included in note 7.
The group purchased goods and services to the value of R67 million (2017: R92 million) from, and sold goods to the value of R6 634 million (2017: R6 082 million) to its equity-accounted entities.
The outstanding balances at year-end are:–– Included in trade receivables, R90 million (2017: R465 million)–– Included in trade payables, Rnil (2017: Rnil)
Included in the carrying value of jointly controlled entities are non-current loans of R138 million (2017: R138 million).
ArcelorMittal South Africa Audited Annual Financial Statements 2018 83
Audited Annual Financial Statements

Notes to the group and company annual financial statements continuedfor the year ended 31 December 2018
31. Related party disclosures continuedSubsidiariesDetails of income from investments and indebtedness in subsidiaries are disclosed in note 17.
ArcelorMittal South Africa received a management fee of R272 million (2017: R261 million) from Saldanha Steel (Pty) Ltd for ArcelorMittal South Africa employees employed at Saldanha Works.
DirectorsDetails relating to directors’ remuneration and shareholdings (including LTIP units) in the company are disclosed in note 34. In 2017, Noma Namuhla Trading and Projects (Pty) Ltd, a company owned by Nomavuso Mnxasana, made sales to ArcelorMittal South Africa totalling R449 000 (2017: R133 000). In 2016, an interest-free loan of R350 000 under the terms of the supplier development initiative was granted to Noma Namuhla Trading and Projects (Pty) Ltd. This loan is still outstanding and has no fixed repayment terms.
Senior employees and prescribed officersDetails relating to option and share transactions are disclosed in note 33.
32. Post-employment benefits32.1 Pensions
Independent funds provide pension and other benefits for all permanent employees and their dependants. At the end of the financial year the following funds were in existence:–– ArcelorMittal South Africa Selector Pension Fund (registration number 12/8/35421) and ArcelorMittal South Africa Selector Provident Fund (registration number 12/8/35423), both operating as defined contribution plans–– Iscor Employees’ Umbrella Provident Fund (registration number 12/8/27484), operating as a defined contribution plan
The assets of these plans are held separately from those of the group and are in funds under the control of the trustees. All funds are governed by the South African Pension Funds Act of 1956 as amended.
Defined contribution plans Membership of each fund and employer contributions to each fund recognised in the statement of comprehensive income were:
Working members Employer contributions
2018Rm
2017Rm
2018Rm
2017Rm
ArcelorMittal South Africa Selector Pension and Provident Funds 5 437 5 379 115 111
Iscor Employees’ Umbrella Provident Fund 3 512 3 713 54 54
Total 8 949 9 092 169 165
84 ArcelorMittal South Africa Audited Annual Financial Statements 2018
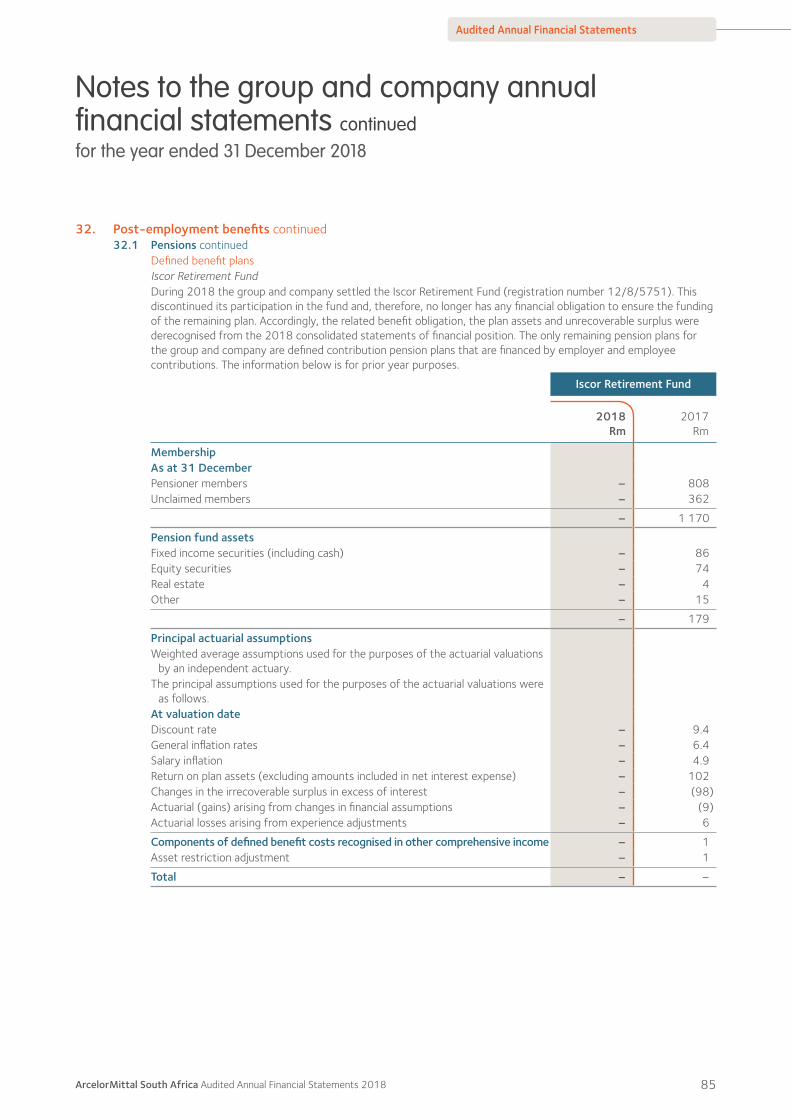
Notes to the group and company annual financial statements continuedfor the year ended 31 December 2018
32. Post-employment benefits continued32.1 Pensions continued
Defined benefit plans Iscor Retirement FundDuring 2018 the group and company settled the Iscor Retirement Fund (registration number 12/8/5751). This discontinued its participation in the fund and, therefore, no longer has any financial obligation to ensure the funding of the remaining plan. Accordingly, the related benefit obligation, the plan assets and unrecoverable surplus were derecognised from the 2018 consolidated statements of financial position. The only remaining pension plans for the group and company are defined contribution pension plans that are financed by employer and employee contributions. The information below is for prior year purposes.
Iscor Retirement Fund
2018Rm
2017Rm
MembershipAs at 31 DecemberPensioner members – 808Unclaimed members – 362
– 1 170
Pension fund assetsFixed income securities (including cash) – 86Equity securities – 74Real estate – 4Other – 15
– 179
Principal actuarial assumptionsWeighted average assumptions used for the purposes of the actuarial valuations
by an independent actuary.The principal assumptions used for the purposes of the actuarial valuations were
as follows.At valuation dateDiscount rate – 9.4General inflation rates – 6.4Salary inflation – 4.9Return on plan assets (excluding amounts included in net interest expense) – 102Changes in the irrecoverable surplus in excess of interest – (98)Actuarial (gains) arising from changes in financial assumptions – (9)Actuarial losses arising from experience adjustments – 6
Components of defined benefit costs recognised in other comprehensive income – 1Asset restriction adjustment – 1
Total – –
ArcelorMittal South Africa Audited Annual Financial Statements 2018 85
Audited Annual Financial Statements

Notes to the group and company annual financial statements continuedfor the year ended 31 December 2018
32. Post-employment benefits continued32.1 Pensions continued
Reconciliation of the funded status to amounts recognised in the statement of financial position
Iscor Retirement Fund
2018Rm
2017Rm
As at 31 DecemberProjected benefit obligation – 155 Fair value of plan assets – (179)
Surplus – (24)Asset restriction adjustment – 24
Net (asset)/liability recognised – –
Asset restriction adjustment – Fund rules do not give the employer an unconditional right to the surplus in the fund.
Movement in present value of benefit obligationFor the year ended 31 DecemberProjected benefit obligation at the beginning of the year – 181 Interest cost – 16 Benefits paid – (39)Remeasurement (gains)/losses– Actuarial gains arising from changes in financial assumptions – (9)– Actuarial losses/(gains) arising from experience adjustments – 6
Projected benefit obligation at the end of the year – 155
Movement in present value of plan assetsFair value of plan assets at the beginning of the year – 302 Interest income on plan assets – 18 Expected return – (9)Benefits paid – (39)Actuarial (losses)/gains – (93)
Fair value of plan assets at the end of the year – 179
The Iscor Retirement Fund has no direct shareholding in ArcelorMittal South Africa Ltd.
86 ArcelorMittal South Africa Audited Annual Financial Statements 2018

Notes to the group and company annual financial statements continuedfor the year ended 31 December 2018
32. Post-employment benefits continued32.2 Medical benefits
The company contributes to medical aid schemes for the benefit of retired employees and their dependants, where those qualifying retirees accepted early retirement in 1994. At 31 December 2018 there were 18 qualifying retirees (2017: 20).On the basis of current practice, which is reviewed annually, the group provides for the actuarially determined present value of post-retirement medical aid obligations. These obligations are unfunded. The group has no further post-retirement medical aid obligations for current or retired employees.
33. Share-based paymentsEquity-settled share plan – local employeesLong-term incentive planThe long-term incentive plan (LTIP) was adopted for the first time in 2012. The LTIP scheme was designed to replace the equity-settled share option plan. An LTIP is a conditional award of company shares offered to eligible senior employees. The shares vest only after a predetermined period over which certain grant conditions must be met. The extent to which these grant conditions are met, governs the number of shares that vest.
The number of LTIP shares granted is calculated in accordance with the employees’ grading within the group and is approved by the board, remuneration, social and ethics committee.
Designated members of the executive committee and senior management are eligible for participation in the scheme. LTIP shares granted to senior management will vest after three years. LTIP to the executive committee members only vest after three years provided that the prescribed performance conditions are met. Senior management receives shares subject to ongoing employment and individual performance. New grants to senior management from 2015 also vest depending on ongoing employment, prescribed performance conditions and individual performance conditions. Proportionate awards are made in the event of change of effective control of the company, retrenchment, retirement or death.
Upon vesting of the award, the company shall deliver the number of shares that have vested to the participating employee. The unvested units carry neither rights to dividends nor voting rights until the date of vesting.
The fair value of each equity-settled unit is determined using the market value at measurement date.
ArcelorMittal South Africa Audited Annual Financial Statements 2018 87
Audited Annual Financial Statements

Notes to the group and company annual financial statements continuedfor the year ended 31 December 2018
33. Share-based payments continuedArcelorMittal South Africa share option planThe group and company operate the management share trust, consisting of an option share plan for the benefit of the group and company’s senior management including executive directors.
This scheme was effective from 12 December 2005 to 2014. Share options are offered at market prices on the grant date and are released in three annual tranches of 33.3%, 33.3% and 33.4% respectively, commencing on the first anniversary of the offer date and expiring after 10 years. This is an open plan.
The option plans are equity-settled as each share option converts into one ordinary share of ArcelorMittal South Africa on exercise. The options carry neither rights to dividends nor voting rights. Options may be exercised at any time from the date of vesting to the date of their expiry.
The number of options granted is calculated in accordance with employees’ role grading within the company and group as approved by the remuneration committee of ArcelorMittal South Africa and as incorporated within the trust deed of the management share trust. Upon resignation, the share options lapse immediately. Upon death, the options lapse within six months.
In 2016, the successful rights issue resulted in an additional 4 782 957 share options granted. The effect of this transaction resulted in a IFRS 2 charge of R26 million being recognised in profit and loss.
Employee share ownership plan (ESOP)The ESOP became effective in 2015. Qualifying employees were granted 21 103 219 shares that vest after five years of continued service in the company. In 2017, total outstanding shares of 2 632 091 of the granted shares have not yet become effective. All permanent employees who do not qualify for the company’s LTIP programme qualify to participate in the ESOP.
The ESOP is equity-settled. The relevant employees will during the life span of the scheme benefit proportionately in the dividends earned from the ArcelorMittal South Africa shares that will be the subject of the scheme.
There are no performance targets for vesting and qualifying employees are not required to pay any consideration to participate in the scheme. The only vesting requirement is five years of continued employment in the company.
The administration of participant transactions of both the share option and the LTIPs are outsourced to EOH Human Capital Solutions (Pty) Ltd, an external service provider.
Isabelo Employee Empowerment Share Trust (B-BBEE)During 2016 the Isabelo Employee Empowerment Share Trust and Amandla we Nsimbi (Pty) Ltd were created as part of the company’s initiative to transform ArcelorMittal South Africa in order to achieve sustainable ownership by black people. In terms of the scheme ArcelorMittal South Africa issued empowerment shares to Amandla we Nsimbi (Pty) Ltd, and the Isabelo Employee Empowerment Share Trust – (representing 17% and 5.1%, respectively, of the voting rights in ArcelorMittal South Africa through a notional loan.
Key assumptionsFor the purposes of valuing the different grants the following assumptions were made:
Isabelo ESOP LTIP Share options
2018 2017 2018 2017 2018 2017 2018 2017
Weighted average fair value on grant date (R/unit)* 3.30 3.30 9.13 9.13 2.90 9.76 – –
Expected attrition rate over the life of the scheme (%) 33.47 36.47 12.50 16.33 11.90 15.07 11.90 15.07
Charge to statement of comprehensive income (Rm) 14 15 29 31 19 22 – –
* Market value of ArcelorMittal South Africa shares (which takes dividends into account) is used as the fair value.
88 ArcelorMittal South Africa Audited Annual Financial Statements 2018

Notes to the group and company annual financial statements continuedfor the year ended 31 December 2018
33. Share-based payments continuedKey assumptions continued
2018million
2017million
Shares available for distributionOpening balance 35.8 44.5Utilisation (22.4) (8.5)Revision of shares available – (3.1)Releases, forfeitures, resignations 6 2.9
Closing balance 19.4 35.8
Reconciliation of outstanding LTIP units/share options/shares
Isabelo ESOP LTIP Share options
2018 2017 2018 2017 2018 2017 2018 2017
Outstanding at the beginning of the year (million) 69 72.6 18.5 19.0 18.4 12.1 2.9 3.5
Granted/reinstatement (million) – – – – 22.4 8.5 – –
Expired/cancelled/forfeited/exercised (million) (4) (3.6) (0.6) (0.5) (6.6) (2.2) (0.2) (0.6)
Outstanding at the end of the year (million) 65 69.0 17.9 18.5 34.2 18.4 2.7 2.9
Exercisable options/units
Weighted average remaining contractual life in days at year-end
Average days until fully vested/until expiry (days) 2 890 3 255 639 1 004 752 756 716 1 394
Weighted average prices applicable per transaction type
Granted (R/unit) 3.30 3.30 9.13 9.13 2.39 7.62 – –Exercised strike price
(R/unit) N/A N/A N/A N/A 2.53 5.30 – –Lapsed/cancelled
(R/unit) N/A N/A N/A N/A 20.52 7.25 53.49 62.00Outstanding (R/unit) 3.30 3.30 9.13 9.13 5.41 12.51 55.27 56.69
ArcelorMittal South Africa Audited Annual Financial Statements 2018 89
Audited Annual Financial Statements

Notes to the group and company annual financial statements continuedfor the year ended 31 December 2018
33. Share-based payments continuedKey assumptions continuedDetails of outstanding options/LTIP units as at 31 December are:
Isabelo ESOP LTIP Share options
2018 2017 2018 2017 2018 2017 2018 2017
Latest expiry date N/A N/A N/A N/A N/A N/A 2021 2021Exercise price range
(R/unit) N/A N/A N/A N/A N/A N/A 6.50 – 182 6.50 – 250Number of
outstanding units/options 65 150 908 69 083 946 17 860 534 18 471 128 34 213 547 18 359 658 2 718 984 2 864 753
Total proceeds to employees if exercised immediately (Rm)* 221 267 61 71 116 71 – –
Total intrinsic value of out-of-the-money options (Rm)** N/A N/A N/A N/A N/A N/A (140) (108)
ArcelorMittal South Africa closing price at 31 December (R/unit) 3.39 3.87 3.39 3.87 3.39 3.87 3.39 3.87
* Proceeds to employees should all options vest on 31 December.** Hypothetically if all options were to vest on 31 December, all options are out-of-the-money with the exception of the options granted as a result of the
rights issue.
Terms of the options outstanding at the reporting date are:
Options
Exercise price range2018
R/units
Outstanding numbers
2018Units
Exercise price range2017
R
Outstanding numbers
2017Units
For the year ended 31 DecemberExpiry date details2017 0 – 140 3 5702018 6.50 – 182.00 512 640 6.50 – 250 640 1392019 6.50 –106.50 572 701 6.50 – 106.50 577 7512020 6.50 – 87.20 125 605 6.50 – 87.20 125 6052021 6.50 –87.20 1 508 038 6.50 – 87.20 1 517 688
Total 2 718 984 2 864 753
Restricted/performance stock unit planThe ArcelorMittal group commenced with the restricted/performance stock unit plan in 2011. The stock units are issued for the benefit of senior executives of the group. The restricted stock unit entitles the holder of the unit to receive one ArcelorMittal group share on or after the vesting date of the restricted stock unit, subject to the vesting conditions being met. Restricted stock units vest after three years of continued employment within the group. Performance stock units vest upon continued employment as well as specific performance conditions being met. This plan replaces the Executive International Mobility Share Option Plan.
90 ArcelorMittal South Africa Audited Annual Financial Statements 2018
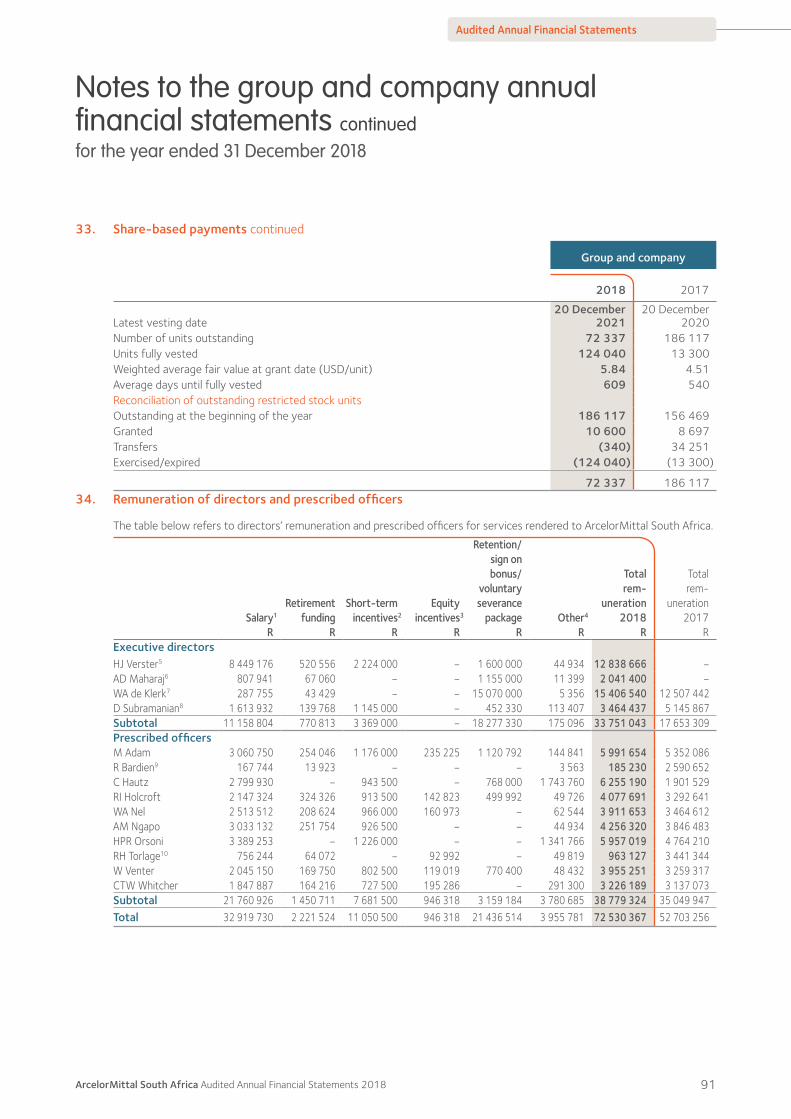
Notes to the group and company annual financial statements continuedfor the year ended 31 December 2018
33. Share-based payments continued
Group and company
2018 2017
Latest vesting date20 December
202120 December
2020Number of units outstanding 72 337 186 117Units fully vested 124 040 13 300Weighted average fair value at grant date (USD/unit) 5.84 4.51Average days until fully vested 609 540Reconciliation of outstanding restricted stock unitsOutstanding at the beginning of the year 186 117 156 469Granted 10 600 8 697Transfers (340) 34 251Exercised/expired (124 040) (13 300)
72 337 186 11734. Remuneration of directors and prescribed officers
The table below refers to directors’ remuneration and prescribed officers for services rendered to ArcelorMittal South Africa.
Salary1
R
Retirement funding
R
Short-term incentives2
R
Equityincentives3
R
Retention/sign on bonus/
voluntaryseverance
packageR
Other4
R
Total rem-
uneration 2018
R
Total rem-
uneration2017
RExecutive directorsHJ Verster5 8 449 176 520 556 2 224 000 – 1 600 000 44 934 12 838 666 –AD Maharaj6 807 941 67 060 – – 1 155 000 11 399 2 041 400 –WA de Klerk7 287 755 43 429 – – 15 070 000 5 356 15 406 540 12 507 442D Subramanian8 1 613 932 139 768 1 145 000 – 452 330 113 407 3 464 437 5 145 867Subtotal 11 158 804 770 813 3 369 000 – 18 277 330 175 096 33 751 043 17 653 309Prescribed officersM Adam 3 060 750 254 046 1 176 000 235 225 1 120 792 144 841 5 991 654 5 352 086R Bardien9 167 744 13 923 – – – 3 563 185 230 2 590 652C Hautz 2 799 930 – 943 500 – 768 000 1 743 760 6 255 190 1 901 529RI Holcroft 2 147 324 324 326 913 500 142 823 499 992 49 726 4 077 691 3 292 641WA Nel 2 513 512 208 624 966 000 160 973 – 62 544 3 911 653 3 464 612AM Ngapo 3 033 132 251 754 926 500 – – 44 934 4 256 320 3 846 483HPR Orsoni 3 389 253 – 1 226 000 – – 1 341 766 5 957 019 4 764 210RH Torlage10 756 244 64 072 – 92 992 – 49 819 963 127 3 441 344W Venter 2 045 150 169 750 802 500 119 019 770 400 48 432 3 955 251 3 259 317CTW Whitcher 1 847 887 164 216 727 500 195 286 – 291 300 3 226 189 3 137 073Subtotal 21 760 926 1 450 711 7 681 500 946 318 3 159 184 3 780 685 38 779 324 35 049 947Total 32 919 730 2 221 524 11 050 500 946 318 21 436 514 3 955 781 72 530 367 52 703 256
ArcelorMittal South Africa Audited Annual Financial Statements 2018 91
Audited Annual Financial Statements

Notes to the group and company annual financial statements continuedfor the year ended 31 December 2018
34. Remuneration of directors and prescribed officers continued
Directors’ fees
R
Committee fees
ROther4
R
Total remuneration
2018R
Totalremuneration
2017R
Non-executive directorsPM Makwana 1 411 320 – – 1 411 320 1 356 840L Cele 181 625 279 601 1 871 463 097 431 105G Gouws11 181 625 120 388 – 302 013 –NP Mnxasana 181 625 474 131 1 239 656 995 737 562JRD Modise12 181 625 511 148 888 693 661 701 015NF Nicolau 181 625 419 128 6 402 607 155 498 758NP Gosa 181 625 211 694 160 393 479 348 978KMM Musonda 181 625 164 833 – 346 458 181 761LM Khangala (Ikageng) – 58 160 – 58 160 14 540MS Tonjeni (Ikageng) – 43 620 – 43 620 14 540LP Mondi – – – – 145 408
Total 2 682 695 2 282 703 10 560 4 975 958 4 430 5071 Cash salary includes basic salary (cash component).2 The short-term incentive relates to bonus earned for the 2017 and first six months of the year.3 Value earned in respect of performance period 2016 to 2018, vesting in 2019. Further detail on the equity incentives can be found under LTIPs in the
table that follows. 4 Other includes UIF, COID, monthly leave structuring, leave encashment, travel claims, international mobility, telephone costs, death benefit, employer
contribution to medical aid and travel allowance.5 HJ Verster commenced as CEO designate on 2 January 2018 and CEO on 1 February 2018.6 AD Maharaj was appointed CFO on 1 October 2018.7 WA de Klerk resigned as CEO effective 31 January 2018. He received a voluntary severance package of R13 470 000 and the balance of his sign on
bonus of R1 600 000.8 D Subramanian resigned as CFO effective 31 July 2018.9 R Bardien resigned as General Manager Human Resources and Transformation effective 31 January 2018.10 RH Torlage resigned as General Manager Special Projects and Strategy effective 30 April 2018.11 G Gouws’ fees were paid to the IDC.12 JRD Modise’s fees were paid to Batsomi Enterprises (Pty) Ltd.
92 ArcelorMittal South Africa Audited Annual Financial Statements 2018

Notes to the group and company annual financial statements continuedfor the year ended 31 December 2018
34. Remuneration of directors and prescribed officers continued34.1 ArcelorMittal South Africa long-term incentive plans
Names of executives
Award type
Award date
Number of
allocations outstanding
at the start of the
year
Number of
allocations made
during the year
Adjustment for units not expected to
vest
Number of allocations
vested during the year
Number of allocations at the end
of the year
Issue price
R
Present value of
unvested share units at the end of the year
RHJ Verster LTIP 20/06/2018 – 2 845 185 658 998 – 2 186 187 2.39 5 224 987
– 2 845 185 658 998 – 2 186 187 5 224 987M Adam LTIP 18/05/2015 147 387 – 134 299 13 088 – –
10/10/2016 390 407 – 299 745 – 90 662 9.75 883 95008/05/2017 333 203 – 63 762 – 269 441 7.62 2 053 13920/06/2018 – 1 061 776 245 927 – 815 849 2.39 1 949 879
870 997 1 061 776 743 733 13 088 1 175 952 4 886 968RI Holcroft LTIP 08/05/2015 83 629 – 76 203 7 426 – –
10/10/2016 237 046 – 181 998 – 55 048 9.75 536 71408/05/2017 202 313 – 38 715 – 163 598 7.62 1 246 61820/06/2018 836 823 193 824 – 642 999 2.39 1 536 767
522 988 836 823 490 740 7 426 861 645 3 320 099WA Nel LTIP 18/05/2015 104 733 – 95 433 9 300 – –
10/10/2016 267 170 – 205 127 – 62 043 9.75 604 92008/05/2017 273 628 – 52 362 – 221 266 7.62 1 686 04820/06/2018 – 871 937 201 957 – 669 980 2.39 1 601 253
645 531 871 937 554 879 9 300 953 289 3 892 221AM Ngapo LTIP 08/05/2017 553 624 – 105 942 – 447 682 7.62 3 411 335
LTIP 20/06/2018 540 050 125 086 – 414 964 2.39 991 765553 624 540 050 231 028 – 862 646 4 403 100
RH Torlage LTIP 08/05/2015 99 887 – 91 017 8 870 – –10/10/2016 154 340 – 118 499 – 35 841 9.75 349 45308/05/2017 80 499 – 15 404 – 65 095 7.62 496 021
334 726 – 224 920 8 870 100 936 845 474W Venter LTIP 08/05/2015 20 255 – 9 228 11 027 – –
10/10/2016 197 538 – 151 665 – 45 873 9.75 447 26108/05/2017 202 313 – 38 715 – 163 598 7.62 1 246 61820/06/2018 – 644 686 149 321 – 495 365 2.39 1 183 921
420 106 644 686 348 929 11 027 704 836 2 877 800CTW Whitcher LTIP 08/05/2015 24 211 – 11 031 13 180 – –
10/10/2016 81 030 – 41 235 – 39 795 9.75 387 99908/05/2017 217 980 – 41 713 – 176 267 7.62 1 343 15520/06/2018 536 636 124 295 – 412 341 2.39 985 495
323 221 536 636 218 274 13 180 628 403 2 716 649Note: LTIP shares vest within three to five years.
ArcelorMittal South Africa Audited Annual Financial Statements 2018 93
Audited Annual Financial Statements

Notes to the group and company annual financial statements continuedfor the year ended 31 December 2018
34. Remuneration of directors and prescribed officers continued34.2 Restricted stock unit (RSU)/performance stock unit (PSU) plans
The following table reflects the number of restricted and performance stock units allocated to executive directors, prescribed officers and the highest paid senior employees who belong to the ArcelorMittal group share-based payment scheme:
Names of executives
Award type
Award date
Number ofallocations
at the start of the year
Number of allocations
made during the year
Number of allocations
vested at the
end of the year
Number of allocations at the end
of the year
Issue price
USD
Present value of
unvested share units
at the end of the year
USD
HPR Orsoni RSU 18/12/2015 5 000 – 5 000 – – –PSU 17/12/2014 5 000 – 5 000 – – –
18/12/2015 5 000 – 5 000 – – –30/06/2016 107 280 – 71 520 35 760 4.66 166 64220/12/2017 4 480 – – 4 480 32.17 144 12220/12/2018 – 5 550 – 5 550 18.61 103 308
126 760 5 550 86 520 45 790 414 072
C Hautz RSU 18/12/2015 1 500 – 1 500 – – –PSU 18/12/2015 1 500 – 1 500 – – –
30/06/2016 51 480 – 34 320 17 160 4.66 79 96620/12/2017 4 097 – – 4 097 32.17 131 80020/12/2018 – 5 050 – 5 050 18.61 94 001
58 577 5 050 37 320 26 307 305 767
94 ArcelorMittal South Africa Audited Annual Financial Statements 2018

Notes to the group and company annual financial statements continuedfor the year ended 31 December 2018
Group Company
2018Rm
2017Rm
2018Rm
2017Rm
35. Contingent liabilitiesOther guaranteesThe value of guarantee contracts issued in the normal
course of business from which it is anticipated that no material liabilities will arise are: 771 24 747 24
Total 771 24 747 24
The company has issued guarantees to the value of R438 million (2017: R761 million) for which all liabilities have been raised on the statement of financial position.
36. CommitmentsCapital expenditure commitments on property,
plant and equipmentCapital expenditure authorised and contracted for 655 754 537 685Capital expenditure authorised but not contracted for 2 459 2 634 2 137 2 634
Total 3 114 3 388 2 674 3 319Operating lease commitmentsPlant, equipment, vehicles and buildingsThe future minimum payments under non-cancellable
standalone and embedded operating leases are:– Less than one year 98 309 97 308– More than one year and less than five years 63 136 59 133– More than five years – – – –
161 445 156 441
Capital commitmentsIn accordance with the Competition Commission settlement agreement concluded in 2016, ArcelorMittal South Africa is committed to spend additional capital expenditure on qualifying projects of R4 600 million over five years subject to affordability and feasibility. In total, R2 171 million (2017: R1 635 million) has been invested in various projects to date.
Included in the capital expenditure above is an amount of R677 million to address emissions at Vanderbijlpark operations over the next three years.
37. Subsequent eventsDuring January 2019 the group has been informed that there is an intention to institute criminal proceedings against it on account of three alleged transgressions of its atmospheric emission licence at its Vanderbijlpark operations. The prosecution has agreed that the group would first be afforded an opportunity to meet and to make representations before proceeding with the prosecution. This process has not been concluded. In the event that the matter proceeds, and if there is an adverse finding regarding all these transgressions, insofar as the financial exposure in terms of a fine is concerned, the maximum fine payable is up to R15 million in terms of the legislation. The group remains firmly committed to minimising its impact on the environment and, to this end, has invested and continues to invest in various initiatives and projects to improve the group’s environmental performance and standards.
The Carbon Tax Bill was approved by the National Assembly in February 2019. The announced implementation date is from 1 June 2019. The estimated financial impact on the group and company is approximately R300 million annually. However, two sets of related regulations, currently being prepared by authorities and likely to be published in the second quarter of 2019, could have an effect of slightly lessening this liability.
The directors are not aware of any other matter or circumstances arising since the end of December 2018 to the date of this report that would significantly affect the operations, the results or financial position of the group.
ArcelorMittal South Africa Audited Annual Financial Statements 2018 95
Audited Annual Financial Statements

Notes to the group and company annual financial statements continuedfor the year ended 31 December 2018
38. Going concernThe financial statements have been prepared on a going-concern basis. Based on the group and company’s 12-month funding plan, together with available banking facilities, the directors believe that the group and company will be able to comply with their financial covenants and be able to meet their obligations as they fall due, and accordingly have concluded that the group and company remain going concerns.
The group and company recognised a net profit of R1 370 million (2017: loss of R5 128 million) and R3 584 million (2017: loss of R5 591 million) for the year ended 31 December 2018 respectively. Current assets exceeds current liabilities by R3 901 million (2017: R785 million) for group and R3 606 million (2017: R636 million) for company.
During 2018 the group and company returned to profitability on the back of higher international steel prices, lower costs and higher sale volumes. The group and company embarked upon a business transformation programme towards the end of 2017. This programme has been initiated to address cost reduction, improve efficiencies and debottleneck steel production at all sites. The success of some of these initiatives are visible in the results for the year ended 31 December 2018, noticeable the capacity utilisation improvement from 81% to 84% as a result of this programme. The group and company continue to drive these initiatives to further improve on the performance of the plants in the coming year.
As detailed in note 11, the group realised proceeds on the sale of investment in MIHBV at R3 221 million. This further strengthened the statement of financial position and cash flow of the group by reducing the net debt from R3 262 million to R475 million. The group generated sufficient cash from operating activities to cover capital expenditure and interest during 2018.
The group has completed the renegotiations and the resetting of the level of the tangible net worth covenant on the borrowing-based facility. As at 31 December 2018, the group is in compliance with all covenants. At 31 December 2018 the balance of the borrowing-based facility was R300 million (2017: R3 700 million) with R4 200 million (2017: R800 million) remaining undrawn. The group continues to work closely with all lenders to ensure the required facilities remain in place.
The directors are not aware of any other matters or circumstances that the group and company face and concluded that there are no other material matters that my impact the group and company’s ability to continue as a going concern.
The financial performance of the group and company are dependent upon the wider economic environment in which the group and company operate. Factors which are outside the control of management can have an impact on the business, specifically volatility an the rand/US dollar exchange rate as well as commodity and steel prices. The directors and management continue to monitor, develop and improve business plans and liquidity models in order to effectively deal with the effects of these factors.
96 ArcelorMittal South Africa Audited Annual Financial Statements 2018
Corporate information
Company registrationArcelorMittal South Africa LtdRegistration number 1989/002164/06Share code: ACLISIN: ZAE000134961
Registered officeVanderbijlpark WorksRoom N3-5, Main BuildingDelfos BoulevardVanderbijlpark1911
Postal addressPO Box 2Vanderbijlpark, 1900Telephone: +27 (0) 16 889 9111Facsimile: +27 (0) 16 889 2079
Internet addresshttp://southafrica.arcelormittal.com
Company secretaryMs NB BamCorporate OfficeDelfos Boulevard, VanderbijlparkTelephone: +27 (0) 16 889 4195Facsimile: +27 (0) 16 889 2517Email: [email protected]
SponsorAbsa Bank Limited (acting through its corporate and investment banking division)Alice Lane North15 Alice Lane, Sandton, 2196Telephone: +27 (0) 11 895 6843Email: [email protected]
AuditorsDeloitte & ToucheDeloitte Place, Building 1, The Woodlands20 Woodlands Drive, Woodmead, 2052, South AfricaTelephone: +27 (0) 11 806 5000Facsimile: +27 (0) 11 806 5118
Transfer secretariesComputershare Investor Services (Pty) LtdRosebank Towers, 15 Biermann Avenue, RosebankPO Box 61051, Marshalltown, 2107Telephone: +27 0861 100 950Facsimile: +27 (0) 11 688 5217Email: [email protected]
United States ADR depositaryThe Bank of New York MellonADR Department101 Barclay Street, 22nd Floor, New York, NY 10286United States of AmericaInternet: www.bnymellon.com

66 ArcelorMittal South Africa Integrated Annual Report 2018
ArcelorMittal South Africa Corporate OfficeDelfos BoulevardVanderbijlparkPhone: +27 (0) 16 889 9111Fax: +27 (0) 16 889 4318GPS coordinates: E 27° 48’ 19.6” S 26° 40’ 22.3”
https://southafrica.arcelormittal.com
https://southafrica.arcelormittal.com/InvestorRelations/AnnualFinancialStatements.aspx
http://www.youtube.com//arcelormittal
https://www.linkedin.com/company/arcelormittal-south-africa/
ArcelorMittal South Africa Audited Annual Financial Statem
ents 2018
Our business