Embed Size (px)
Citation preview
Audit Quality: Earnings Management in the Context of the
1997 Asian Crisis
by
Shireenjit Johl* Multimedia University
Christine A Jubb Monash University
Keith A. Houghton Australian National University
January 2003
Draft only: Please do not quote without permission
Address for Correspondence: Associate Professor Christine Jubb, Department of Accounting and Finance, Faculty of Business and Economics, Monash University, Berwick. Vic. 3806. Phone +61 3 9904 7102. Fax
+63 3 9904 7100, email: [email protected]
2
Audit Quality: Earnings Management in the Context of the 1997 Asian Crisis
ABSTRACT
This study assumes that evidence regarding audit quality can be derived from the level of earnings management reflected in reported abnormal or discretionary accruals. Given this assumption, audit quality is examined in the context of the 1997 Asian financial crisis using data from Malaysia. Examining audit quality in its association with earnings management across differential macroeconomic periods provides insights that may be otherwise masked. The period of the crisis is partitioned between pre-crisis (1994-1996), crisis (1997-1998) and post-crisis (1999). Using a robust approach to the measurement of abnormal accruals, the association of Big 5/non-Big 5 and Industry Specialist/Industry non-specialist auditors with both the levels of, and change in levels of, abnormal accruals is investigated across and within the crisis sub-periods from 1994-1999. Audit quality is found to be associated with abnormal accruals, and differentially so across macroeconomic period with greater constraint evident post-crisis. Key Words: Audit quality, Earnings management, Auditor size, Auditor industry specialization, Asian financial crisis.
3
Audit Quality: Earnings Management in the Context of
the 1997 Asian Crisis
1.0 Introduction
In any capital market auditors play a vital role in the issuance of high quality financial reports.
The question of whether auditors adequately play this role in enhancing credible reporting
received much attention in Asia during and after the 1997 Asian Crisis, and more recently with
the very public collapses of major corporations both in the United States (US) (eg Enron and
WorldCom) and elsewhere (eg HIH in Australia). Against this backdrop, this study investigates
audit quality by examining earnings management behaviour of auditees during periods of
discernibly different macroeconomic condition – the pre and post 1997 Asian Crisis as
experienced in Malaysia.
During economic crisis, auditors are placed under heightened strain and public scrutiny since the
likelihood of corporate failure increases. During the Asian Crisis, the World Bank questioned the
quality of audits by Big 5 auditors operating in Asia . Many East Asian corporations, having
received clean audit reports from Big 5 auditors, subsequently demonstrated that those opinions
may not have been appropriate (Accountancy, 1998). This study hypothesises that clients of
quality auditors (Big 5 and/or Industry Specialist auditors) report lower earnings management
compared to clients of other auditors both across the Asian economic crisis and within
identifiable sub-periods of pre- and post- crisis. Regulators, the accounting and auditing
profession, standard setters, and the business community at large will benefit from better
understanding the mechanisms of earnings management and differential audit quality within clear
periods of economic upturn and downturn. The Malaysian economy during the period 1994-1999
provides an opportunity to examine this audit quality issue within a macroeconomic environment
that exhibits distinguishable pre-crisis, crisis and post-crisis sub-periods.
2.0 Motivation
2.1 Macroeconomic risk-incentives
Asare and Davidson (1995) point out the need to investigate the effect of macreconomic
information on auditors’ judgement, but few studies attempt to do this. Cohen, Krishnamoorthy
and Wright (2000) find that auditors generally concentrate on financial trends as opposed to non-
financial trends in establishing the overall level of audit scope, whilst non-financial information is
4
generally used as corroborating evidence. In addition, they find that when financial information
indicates a decline and is substantiated by non-financial information, auditors appear to extend
the level of audit scope beyond the normal level.
Within the existing earnings management-audit quality literature, to date no published study
examines the effects of macroeconomic condition on auditor behaviour. Yet macroeconomic
condition affects other commercial behaviour. For instance, Matolcsy (2001) finds no relation
between changes in management cash compensation and changes in measures of corporate
performance during periods of economic downturn, but a significant positive association during
periods of economic growth.
2.2 Gaps within the existing audit quality differentiation-earnings management literature
Examining evidence from a period in which managers are likely to engage differentially in
manipulation of accounting accruals provides a robust setting for investigating whether better
quality auditors ‘see through’ accounting distortions and constrain this activity. Prior results of
both experimental (eg Hirst 1994; Hackenbrack and Nelson 1996; Phillips 1999) and archival (eg
Becker, DeFond, Jiambalvo and Subramanyam 1998; Francis, Maydew and Sparks 1999; Francis
and Krishnan 1999) studies suggest auditors are alert to aggressive earnings management and that
Big 5 auditors are associated systematically with lower levels of accruals. It is important to
investigate whether this apparent influence on earnings management is robust across
macroeconomic condition (upturn, downturn and recovery). Additionally some of these cited
studies find evidence consistent with auditors being more conservative in circumstances
favouring income-increasing accounting methods. However, it is unclear whether auditors exert
similar levels of audit attention in situations favouring income-decreasing methods. In a period
of economic decline, some companies are likely to favour income-decreasing accruals and so this
study provides evidence in relation to this important issue also.
2.3 Audit Quality Proxies Used in Prior Studies
Prior studies investigating the relationship between audit quality and earnings management use
auditor size as a proxy for audit quality. This study extends prior research by examining the
relationship between industry specialist auditors, a finer measure of audit quality than auditor size
alone (Craswell, Francis and Taylor 1995), and earnings management. The differential level of
audit quality exhibited by industry specialist auditors is expected to be more pronounced during
periods of economic downturn as these auditors compared to non-specialists are expected to have
5
heightened insight into the industry implications and to be more efficient in identifying errors and
misstatements.
2.4 Regulatory and Environmental Factors
Ball, Kothari and Robin (2000) argue that and provide evidence for differences in the demand for
accounting earnings information in different institutional environments causing its properties –
timeliness and conservatism - to vary internationally. They find that code-law reported income
(France, Germany and Japan) is substantially less timely and less conservative than common-law
reported income (Australia, Canada, UK and US). In a related study of four East Asian countries
(Malaysia, Hong Kong, Singapore and Thailand), Ball, Robin and Wu (2000) show that reported
earnings in these countries generally lack transparency with respect to timeliness in incorporating
economic income, particularly negative economic income or “bad news”.
Given Ball, Kothari and Robin’s (2000) findings, earnings management can be expected to be
more pronounced in environments that have more rather than less flexibility in choice of
accounting policies. It has been argued that flexibility in accounting standards leads to ambiguity
in implementation (Bayless, Cochrane, Harris, Leisenring, McLaughlin and Wirtz 1996). The
practice by many South East Asian countries, including Malaysia, of modifying International
Accounting Standards (IASs) to suit local conditions (known as creating ‘IASC-lite’), has lead to
questioning of the ‘credibility’ of those standards (Ravlic, 1999: 49). The existence of flexibility
and subjectivity in accounting procedures and policy choices provides greater room for earnings
management and heightens pressure for negotiation between management and the auditor on the
application of appropriate Generally Accepted Accounting Principles (GAAP). Additionally the
public sanctioning auditors face for alleged audit failure is virtually non-existent in South East
Asia compared with the West (Favere-Marchesi 2000). Understanding whether factors found
important to the level of earnings management and audit quality provided in the West translate to
the East provides additional motivation for this study.
The remainder of this paper is organised as follows. The next section discusses briefly the
Malaysian corporate and regulatory background, followed by discussion of the relevant audit
quality and earnings management literature, and then by hypotheses development. Model
development, the selection and measurement of variables, sample selection and information
regarding data collection follow next. Results are then reported with conclusions, implications
and suggestions for future research appearing in the last section.
6
3.0 Background
Malaysia is argued to provide an opportune setting in which to test and compare the propensity of
auditors to limit earnings management during economic upturn and downturn periods. It is a
country where reporting and auditing practices are heavily influenced by common-law sources
given their historical influence in the setting of International Accounting Standards (IASs) and
International Standards on Auditing (ISAs), facilitating comparison with research results in the
Western World. Additionally, the accounting and auditing standards are considered amongst the
highest quality in East Asia
However, although there has been much emphasis in strengthening the accounting and disclosure
standards in Malaysia, the same perhaps cannot be said with respect to auditing practices
(Thillainathan, 1999). Effort is being made by the International Federation of Accountants
(IFAC) to improve the uniformity of auditing practices and related services throughout the world.
This is evidenced by the formation of the IFAC Forum of Firms (FOF) and the Transnational
Auditors Committee (TAC) in January 2001. The FOF is a voluntary body made up of
international audit firms performing audits across national borders. These firms agree to meet
certain requirements and undergo a global independent quality review1.
With respect to the market for audit services in Malayasia, as of 1998, about 80% (83%) of the
total number of companies (total audit fees) was audited (earned) by the Big 5. An important
feature of the Big 5 operating in Malaysia is the existence of link-ups with local counterparts. It
is important to note here, that for the purposes of this study, these local affiliated firms are
categorised as Big 5 auditors.
The Financial Statements Review Committee established under the Malaysian Institute of
Accountants (MIA) undertakes annual review of published accounts to ensure compliance with
legal and professional requirements. However, the work of this committee is said to be very
limited with it reviewing no more than 25 annual reports in any one year (Tay 1995). Further, the
results of the review are not made public and so are without scrutiny by legal, financial or public
oversight. To date there are no reported cases of disciplinary action against members by the MIA
(Tay 1995).
Also, there has been no lit igation against auditors within Malaysia. Favere-Marchesi (2000)
analyses audit quality in ASEAN countries based on the legal environment faced by auditors in
7
those countries. The study notes the existence of differential audit quality among the ASEAN
countries, with auditor independence seriously compromised in some countries (eg. Brunei,
Vietnam and Philippines) and the lack of a liability regime faced by auditors. With respect to
Malaysia, the study notes improvements for statutory auditors are required, including the
mandating of a proficiency examination and the expansion of civil liability.
Hence reputational damage resulting from publicity with respect to either litigation or malpractice
is not of the same importance in Malaysia as in Western countries. Given this lower external
discipline and monitoring of auditors, it is of importance to investigate whether Western
indications that auditors constrain earnings management activity (eg Becker et al., 1998; Francis
et. al., 1999; Gaver and Paterson, 2001) continue to hold absent high-level public scrutiny.
4.0 Literature Review and Hypothesis Development
4.1 Big 5 vs non-Big 5 and Industry Specialist vs Industry non-Specialist
Empirical findings of a positive association between auditor size and audit quality are systemic in
the literature (eg Teoh and Wong, 1993; Craswell et. al., 1995; Becker, et. al., 1998; Francis and
Krishnan, 1999; Francis, et. al., 1999; Gul, Lyn and Tsui 2001). Similarly, it is well
acknowledged that accounting firms (in particular the large firms) are structured along industry
lines (refer Gramling and Stone 2001 for a review). Like large auditors (Big 5/non-Big 5)
investing in brand name capital, industry specialists too make investments in industry specific
accounting technology to differentiate themselves from other auditors (Craswell, et. al., 1995) and
thus have more quasi-rents at risk in that industry. Consistent with these arguments, prior studies
find industry specialist auditors are associated with (1) audit fee premia (Craswell et. al., 1995,
Ferguson and Stokes 2002); and (2) higher client reporting quality.
4.2 Earnings Management and Macroeconomic Condition
The Asian Crisis within the Malaysian context may be viewed as a debt crisis (being the
combined outcome of the property market crash, the stock market crash and massive capital
outflows), resulting from a sudden liquidity squeeze, which led to a sharp increase in non-
performing loans (NPLs) within the banking system. Industries in all sectors in 1997/1998 were
affected, but some companies within the same industry were more affected than others.
Prior earnings management studies predict managers will, contingent on their position within
bonus boundaries, increase earnings in order to: (a) increase their compensation via formal and
8
informal compensation plans (eg. Healy 1985); or (b) reduce the likelihood of debt covenant
violation (eg. Sweeney 1994; DeFond and Jiambalvo 1994); or (c) reduce the likelihood of job
loss (eg. DeAngelo, 1988; Pourciau, 1993). Evidence with regard to the incidence and direction
of earnings management from previous studies (Liberty and Zimmerman 1986; DeAngelo 1988;
DeAngelo and DeAngelo 1991; Healy and Palepu 1990; Sweeney 1994; DeFond and Jiambalvo
1994; Jones 1991) is mixed. No evidence of earnings management was found in Healy and
Palepu or in Liberty and Zimmerman. DeAngelo and Sweeney found systematic income-
increasing earnings management, while DeAngelo and DeAngelo, and Jones, find managers use
income-decreasing accounting choices. Results reported by DeFond and Jiambalvo are mixed.
For troubled companies, the literature also reports mixed results. For example, managers increase
reported earnings in an attempt to avoid/postpone regulatory attention (Petroni, 1992), and/or to
retain their employment (Pourciau, 1993). Sweeney (1994) finds companies close to debt
covenant violation increase income to avoid or defer the cost of violation. DeAngelo, DeAngelo
and Skinner (1994) find income-decreasing earnings management related to the level of debt.
The economic crisis in Malaysia cannot necessarily be viewed as mirroring the circumstances of
any of these prior studies. The Asian Crisis can be viewed as a debt crisis in that the Malaysian
economy-wide experience demonstrated a substantial rise in NPLs within the banking system2
(Bank Negara, 1999) and in winding-up petitions filed3 (Thillainathan, 1999). The large increase
in corporate leverage in both the crisis and post-crisis periods pre-supposes heightened levels of
corporate distress and increased likelihood of corporate failure. Due to extreme financial
pressures, managers choosing to manage earnings may react by engaging in income-increasing or
income-decreasing earnings management, contingent on the extent of financial difficulty.
This study argues that post-crisis, companies facing the possibility of imminent failure and those
seeking debt restructuring (due to inadequate cash flow to cover current and future debt
obligations) are highly unlikely to engage in earnings increasing strategies to show a rosier (than
warranted) financial picture, but rather will indulge in income-decreasing techniques. This is
because during economic crisis, regulators and lenders are alerted to the prospect of financial
difficulties and, as such, are more likely to be motivated to “see through” income -increasing
earnings management. Additionally, if managers try/attempt to evade their covenants or hide
their companies’ difficulties, they stand to lose their credibility with investors and lenders and
risk their position with respect to debt renegotiations or obtaining financing.
9
Companies with any likelihood of qualifying for the Malayasian government aid mechanisms put
in place post-crisis (eg through the national asset management companies, Danaharta or CDRC)
can be expected to report earnings as low as possible to maximise their case for acceptance and/or
obtain looser refinancing terms. Those companies with no chance of qualifying for aid can be
expected similarly to reduce earnings in an attempt to signal their seriousness with respect to
streamlining operations and maximising future earnings. Companies close to failure for which
any aid would be too late are expected to income-decrease for ex-post rationalisation reasons
(Smith, Kestel and Robinson 2001). In addition, during economic crisis, managers of companies
face an immediate threat to their job security. This threat combined with a job market slump
suggests that managers main concern is to retain employment. Each of these situations leads to
the likelihood of use of net income-decreasing accounting techniques. Companies that are less
affected are likely also to engage in income-decreasing activity but to a lesser extent than those
seriously affected, since this action will increase future earnings whilst the current low earnings
can be blamed on the economic downturn (taking a “bath”). It is acknowledged here also that
management may not engage in any discernible level of earnings management.
In summary, although opportunism may exist, efficiency may be arguably a more important and
plausible explanation for managers’ actions in a situation of distress, with incentive to implement
discretionary write-offs. Such action can signal to lenders and investors a willingness to
acknowledge and deal with the company’s problems and, as such, may save the company from
liquidation with consequential job loss.
On the other hand, prior to the crisis (pre-crisis) the Malaysian economy was registering
consecutively high growth (GD P) of about 8.5% yearly (BNM, 1999), implying that companies
on average experienced positive earnings. Given the then comparative economic upturn, it is
likely that managers, on average, engage in earnings management activities that increase rather
than decrease earnings to either sustain prior year’s earnings, or to avoid losses and/or meet/beat
analyst forecasts. Guay et. al. (1996) point out that the nature of accruals means they will have to
reverse some time in the future, some reverting in the following period with others over several
periods. Thus, over a period of time, these accruals tend to cancel each other out. Guay et. al.
propose that it is possible that managers may try to avoid immediate reversal, but it is also likely
that a company may run out of such opportunities and, as such, will have to permit reversal.
Based on this reasoning, it is doubtful companies will systematically, over time, utilise devices to
only increase or only decrease income. In other words, over the examined period (in this case the
10
pre-crisis period) it is expected that companies will report positive accruals in some years and
negative accruals in others. However, given the strong economic condition prior to the crisis, it is
likely that, on average, companies report positive net abnormal accruals.
In summary for the reasons explained above, in the pre-crisis period of economic upturn,
managers are likely to indulge in income-increasing rather income- decreasing earnings
management as measured by abnormal accruals to either sustain prior year performance, avoid
losses, or meet analysts’ forecasts. On the other hand, during the post-crisis economic downturn
it is predicted that managers are more likely to use income-decreasing accruals (or take an
earnings bath). Thus, taking both of these arguments together, it is predicted the magnitude of
income-decreasing (and absolute) abnormal accruals will be higher during the post-crisis
compared with the pre-crisis period. However, this magnitude is hypothesised to be mitigated by
the level of audit quality supplied by the auditor.
4.3 Audit Quality and Earnings Management
There is a growing number of archival (Heninger, 20001; Gul, et. al., 2001; Bartov, Gul and Tsui,
2001; Bradshaw, et. al., 2001; Gaver and Paterson, 2001; Francis et. al., 1999; Francis and
Krishnan, 1999; Becker et. al., 1998) and experimental (eg. Hirst, 1994; Phillips, 1999) studies
that examine the relationship between audit quality and the level of accruals. Evidence from
these studies seems to suggest that: (a) high accrual companies engage Big 6 auditors; (b) Big 6
auditors have a lower threshold than the non-Big 6 for issuing modified audit reports; (c) Big 6
auditors are associated with lower client abnormal accruals; and (d) auditors are sensitive to
managers’ incentives to manage accruals. This evidence can be interpreted in two ways, alone or
in combination: (a) quality auditors constrain earnings management and/or (b) clients hiring Big 5
auditors themselves constrain earnings management regardless of audit quality. However,
distinguishing between these two interpretations is extremely difficult. The fact that pre-audited
data is not available presents a limitation in the investigation of the propensity and or ability of
auditors to constrain earnings management. Whilst acknowledging this problem, this archival
study cannot attempt to disentangle these interpretations, but assumes that auditors play at least a
role in any restraint in accruals management demonstrated by their clients.
4.4 Constraining Income-Increasing versus Income-Decreasing Accruals
Earlier it has been argued that the ability of managers to influence earnings is facilitated with the
nature of accounting standards that require higher levels of judgemental interpretation4, however,
11
the extent to which aggressive earnings management occurs is dependent on the quality of audit
performed (eg. DeAngelo, 1981; Becker et. al., 1998; Francis and Krishnan, 1999; Francis, et. al.,
2000). Specifically, contingent on audit quality, macroeconomic conditions are expected to affect
the behaviour of earnings management where during economic downturn managers are expected
to manage earnings downwards, while during economic upturn, on average, managers are
expected manage earnings upwards.
High audit quality is most likely to reduce earnings manipulation outside the relevant accounting
standard (Jiambalvo, 1996). However, the extent to which a high quality audit reduces income-
increasing and decreasing manipulations that fall within the standard itself is also of interest. An
effective audit can be expected to reduce the magnitude of earnings management and will differ
between a high and low-quality auditor (Becker et. al., 1998). However, the degree of quality
exerted by auditors is dependent in part upon auditors’ reporting decision incentives
(Hackenbrack and Nelson, 1996; Zhang, 1999). Archival (eg Krishnan and Krishnan, 1996) and
experimental (eg Hackenbrack and Nelson, 1996; Braun, 2001) studies propose and find evidence
consistent with competing incentives faced by auditors in the their opinion formulation. These
competing incentives involve: (a) engagement risks, including auditors’ vulnerability to financial
and reputational loss if found to be negligent with respect to, amongst other things, aggressive
financial reporting, and (b) quasi-rent risks associated with auditors’ need to retain clients.
Several studies suggest disagreements over accounting methods and issuance of qualified audit
reports5 lead to auditor dismissal or resignation (auditor switching), thus creating client specific
quasi-rents pressure on the auditor (eg Schwartz and Menon, 1985; Krishnan and Krishnan,
1997). Managers dislike and try to avoid qualified audit reports as they signal potentially to
investors: (a) a management slack in company stewardship, (b) management’s attempt to portray
an ‘untrue’ view of the company’s underlying performance, or (c) the probability that the
company may be in financial distress. These adverse signals in turn may cause share-prices to
fall (Chen and Church, 1996)6.
Financial irregularities (Carcello and Palmrose, 1994) including accrual-based errors and
irregularities have been found to be positively related to litigation against auditors (Lys and
Watts, 1994). St. Pierre and Anderson (1984) argue that auditors are more frequently sued for
allowing income overstatement compared to income understatement. Further, Lys and Watts
(1994) argue and find that income-increasing accounting methods are associated more with audit
12
lit igation compared to income-decreasing methods. This tendency to sue auditors for allowing
income overstatement may lead auditors to concentrate more on overstatement (this does not
mean that auditors do not concentrate on understatements). Kinney and Martin’s (1994) review
of relevant studies shows that the overall effect of recommended audit adjustments is a material
aggregate decrease in recorded earnings.
This study is fortuitously placed to examine earnings management behaviour in a time
period in which it is argued that constraint of income -decreasing accounting methods is
as important to auditors’ reputations as is constraint of income-increasing accounting
methods in periods of relative economic normalcy. The pressure from the Transnational
Audit Committee and the World Bank on achieving a consistent standard of auditing
globally is likely to have been most keenly felt by those auditors with most to lose from
lost reputation – the Big 5, and even more so by Big 5 industry specialists (DeAngelo,
1981; Mayhew, 2001). Thus although the Malaysian environment is different from that
of the U.S, U.K. or Australia in that, to date, there has been no litigation against auditors
(Md. Ali, 1999; Che Ahmad and Houghton, 2001) it is argued that in the post crisis
period global forces rather than domestic litigation created reputational incentives.
Hence the prior received wisdom that auditors are virtually unconcerned with regard to
constraint of income-decreasing abnormal accruals is able to be tested. These arguments
lead to the following hypotheses:
H1: The level of income-increasing, income-decreasing and absolute abnormal accruals,
both irrespective of and within distinct macroeconomic periods of upturn and downturn, is
lower for auditees of quality auditors (Big 5/ Industry Specialist) compared to other auditees.
H2: Audit quality (Big 5 /Industry Specialist) is negatively associated with the change in
level of absolute abnormal accruals between post-crisis and pre-crisis periods.
Establishing that income-decreasing (and absolute), but not income-increasing, abnormal
accruals increase post- compared to pre-crisis is an essential pre-condition to testing Hypotheses
1 and 2.
13
5.0 Methodology
Pre-requisite to the testing of hypotheses is the determination of the variable ‘earnings
management’. This study utilises the modified(m) Jones (1991) (Dechow et. al, 1995)7 model in
decomposing total accruals into non-discretionary (expected) and discretionary (unexpected or
abnormal) accruals. However, this model has been criticised for its inability to perform in
circumstances of extreme financial performance (Dechow et. al., 1995, see Mc Nichols 2000 for a
review), so the frequency distribution approach (eg. Degeorge, Patel and Heckhauser, 1999) is
used to complement the results of the primary analysis.
Since, this study involves periods of economic upturn and downturn, it is likely that companies in
the sample will experience extreme negative earnings in periods of downturn. The Jones (1991)
model has reduced reliability in such a situation, so a second methodology for calculating
abnormal accruals is used to provide confirmatory evidence and increase the robustness of results
achieved from application of the m-Jones model. In this alternative design, each non-Big 5
auditee is matched to a Big 5 auditee from the same year, industry, and with comparable earnings
performance (return on sales). This approach is used by Teoh et. al. (1998) and with a slight
variation, by Kothari, Leone and Wasley (2001). As with most prior research involving earnings
management, this study, utilises the cross-sectional method rather than the time -series version of
the Jones model (eg. Francis, et. al., 1999; Becker et. al., 1998; DeFond and Jiambalvo, 1994)8.
5.1 Modified Jones (1991) Model
The cross-sectional version of the m-Jones model is estimated separately for all firms in each
same industry. An advantage of using the cross-sectional approach, since the models are re -
estimated each year, is that specific year changes in economic conditions affecting expected
accruals are filtered out. This filtering is vital since the period of examination covers changes in
firm and macroeconomic condition (Teoh, et. al., 1998). The total accruals model, with company
(i) and year (t) subscripts, is
TAit/A i,t-1 = α(1/A i,t -1) + β1({ ∆REVit - ∆RECit}/Ai,t -1) + β2(PPEit/A i,t-1) +εit (1)
where:
TAit = total accruals at time t is calculated as: [(∆current assetsit - ∆cashit) - (∆current liabilitiesit - ∆short-term debtit) - (depreciation and amortisation expenseit), where ∆ denotes the change between t and t-19;
Ai,t -1 = lagged (one year) total assets; ∆REVit= change in operating revenues between t and t-1; ∆RECit = change in net receivables between t and t-1;
14
PPEit = gross property, plant and equipment; and εit = error term (known as discretionary, unexpected or abnormal accruals [DA])
5.2 Frequency Distribution Approach
Since earnings management is generally unobservable and to address some of the problems in
estimating the level of abnormal accruals, this study also utilises an indirect, simple but powerful
test by examining the frequency distribution of reported earnings. Prior studies suggest that
managers manage earnings to meet or beat certain simple earnings benchmarks. Specifically this
study, as an adjunct to application of the m-Jones model, replicates the Degeorge, et. al., (1999)10
methodology by exploring the extent to which managers manage earnings to meet two simple
thresholds, namely to:
1) avoid losses – this involves examining the distribution frequency of firms achieving
‘zero’ or ‘one cent’ or more in earnings per share (EPS); and
2) sustaining previous years’ profits – this involves examining the distribution frequency of
firms achieving ‘zero’ or one cent or more in change in EPS from the prior year.
In essence, the methodology used in this approach is to examine the density function of the
distribution surrounding the chosen thresholds. If there are signs of earnings management, it is
expected that there will be an unusually large number of companies with EPS at or slightly above
the threshold, but an unusually low number below the threshold. In order to test the significance
of any discontinuities at the chosen thresholds, a univariate statistical test that approximates a t-
test is conducted11. Consistent with Degeorge, et. al. (1999) and Plummer and Mest (2000), a
discontinuity is evident if the value of τ is greater than 2.0. In addition to testing for a significant
discontinuity, for the purpose of hypotheses testing using multivariate analysis, firms
meeting/beating either one of the benchmark(s) are coded 1, whilst those not meeting/beating the
benchmark(s) are coded 0, and this dummy variable is used as the dependent variable to
categorically proxy the presence of earnings management in a supplementary logistic model.
5.3 The Model
In order to examine the association of Quality Auditors (Big 5/Industry Specialist) with earnings
management for hypotheses H1 and H2, an adapted Becker et. al. (1998) abnormal accruals
model is applied. To the original Becker et al (1998) model, variables are included to control for
the effect of the three stages of the Asian economic crisis (PRECRI ) and (CRI). As per Becker
(1998) industry sectors are included to account for possible industry differences in the level of
15
earnings management present, but these are adapted for the Malaysian context. None of the
observations exhibit a decrease of at least 10% in the total outstanding shares during the year, and
as such this variable, included in Becker et al (1998), is omitted. The model takes the following
form:
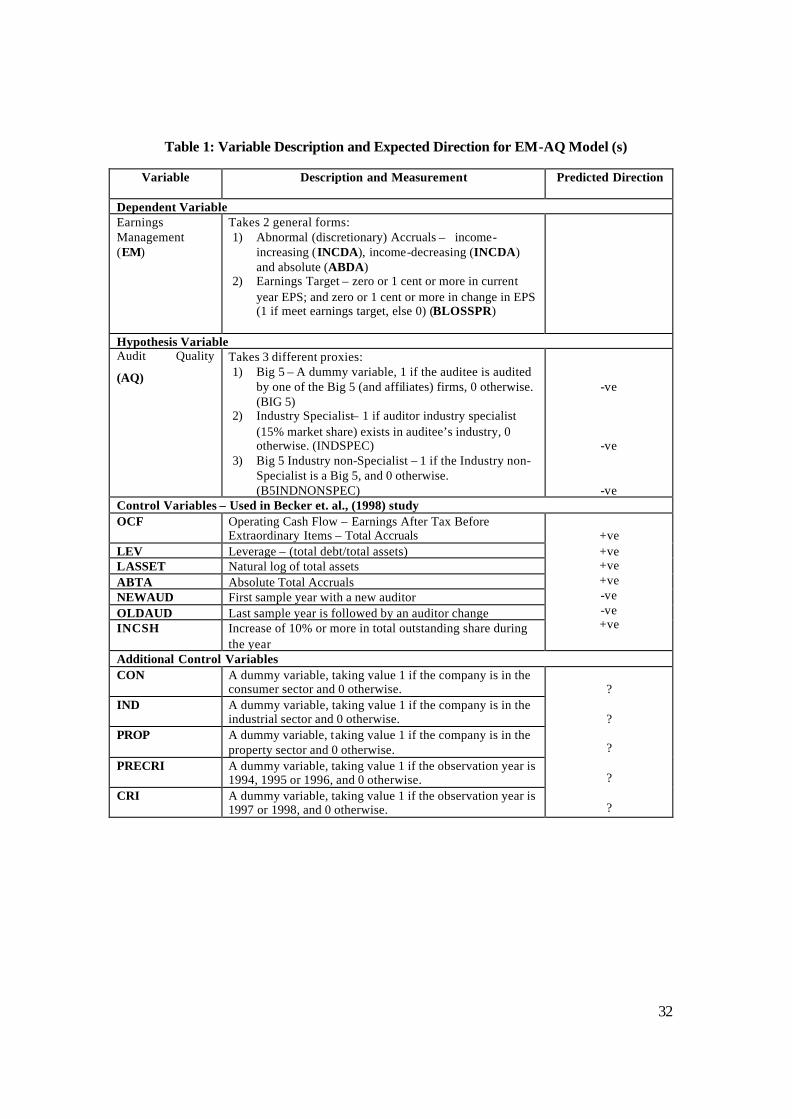
EM = α + β1AQ + β2OCF + β3LEV + β4LASSET +β5ABTA + β6NEWAUD + β7OLDAUD + β8INCSHLD + β9CON + β10IND + β11PROP + β12PRECRI + β13CRI + εt
Where the variables are defined in Table 1 and explained in the next section.
__________________
TABLE 1 ABOUT HERE
__________________
5.4 Selection and Measurement of Variables
5.4.1 Dependent Variable(s)
Earnings management (EM) is the dependent variable for testing of H1 and H2. Two different
(but complimentary) proxies are employed in testing H1, whilst testing of H2 utilises one proxy –
abnormal accruals. The proxies are:
1) Abnormal accruals – the residual obtained from the m-Jones model. The income-
increasing (INCDA), income decreasing (DECDA), and absolute value of abnormal
accruals (ABDA) are used in testing both H1 and H2;
2) Earnings target benchmarks (BLOSSPR) – this variable takes two forms:
a. loss avoidance - zero, 1 cent, or more in EPS; and
b. sustain prior year profit - zero, 1 cent, or more in change in EPS.
The EM – meet or beat earnings target variable - is a dichotomous variable and is given a
value of 1 if the firm meets/beats each of these benchmarks, and 0 otherwise and is used
in testing only H1 (refer Degeorge, et. al. 1999).
5.4.2 Hypothesis Variables
Audit Quality (AQ)
Differential audit quality level represents the hypothesis variable in testing both
hypotheses. In order to operationalise this variable, two different proxies for audit
quality- Big 512 and Industry Specialist INDSPEC - as identified in the auditing research
literature, are used separately to account for differing levels of expertise and reputation.
Big 5 is a dichotomous variable if the auditor is from the first tier, and 0 otherwise.
16
INDSPEC is defined as a dichotomous variable, which takes the value of 1 if the firm is
audited by an industry specialist (15% market share), and 0 if it is audited by a non-
industry specialist. An inverse relationship is expected between both these measures of
audit quality and earnings management.
5.4.3 Control Variables
Operating Cash Flow (OCF)
It is hypothesised that companies with high cash flows (and hence probable high profits) engage
in income-decreasing abnormal accruals to smooth earnings. Becker, et. al. (1998) find that cash
flow has a negative association with discretionary accruals (DA). Because IAS 7 (Revised
1996)13 – ‘Cash Flow Statement’ was operative mid- rather than pre- the period examined in this
study (1994-1999), to achieve consistency an indirect measurement approach is taken for all
years, subtracting Net Income Before Extraordinary Items from Total Accruals to derive OCF14.
Leverage (LEV)
Evidence (although mixed) from the earnings management literature indicates that, managers
indulge in income-increasing accruals to delay or avoid the costs of debt covenant violations
(Press and Weintrop, 1990; Defond and Jiambalvo, 1994). Consistent with Becker et. al. (1998),
a measure of leverage (LEV) is included as a variable to control for the possible effects of
leverage on earnings management. A positive relationship is expected between absolute abnormal
accruals (ABDA ) and leverage (LEV).
Total Accruals (ABTA)
Francis, et. al. (1996) argue that firms with greater endogeneous accrual-generating potential
have greater uncertainty about reported earnings because of the greater difficulty for outside
parties to unravel abnormal accruals from total accruals. Thus as in Becker, et.al. (1998), the
absolute value of total accruals is included in the model to control for the possibility that firms
with larger absolute total accruals also have greater inherent earnings management potential. A
positive relationship is expected between EM and ABTA.
Equity Offerings (INSHLD)
Prior studies argue that equity offerings provide increased incentive for managers to increase
reported earnings during the offering period due to the potential existence of information
asymmetry during this time. These studies (eg. Teoh, et. al., 1998; Rangan, 1998) find companies
17
undertaking equity offerings show evidence of significant income-increasing abnormal accruals.
Thus, consistent with the findings and as used in Beneish et. al. (1998), a dummy variable in
included in the model to indicate whether outstanding shares have increased by 10% or more15
from prior year outstanding shares. This INSHLD dummy variable takes a value of 1 if the
outstanding shares have increased by 10% or more, else 0.
Auditor Change (OLDAUD and NEWAUD)
Amongst other factors, the occurrence of client-initiated auditor change may be motivated by
auditors’ preference for conservative accounting choices. DeFond and Subramanyam (1998)
argue that firms with a change in auditor are expected to report more negative abnormal accruals
in their last year with their predecessor auditor (OLDAUD). However on the grounds that the
successor auditor (NEWAUD) may be willing to adopt a less conservative stance than the
predecessor, they argue that abnormal accruals should be less negative in the first year with the
successor than those in the last year with the predecessor. Thus, as in Beneish et. al. (1998), to
control for any possible auditor change effect, a dummy variable NEWAUD (OLDAUD ) is
included and given a value of 1 if the company is experiencing a year (last sample year) with a
new auditor (old auditor).
Industry Sector
In addition, the Becker et. al. (1999) model controls for industry sector, which helps account for
expected inter-industry differences in earnings management (Francis et. al., 1999). KLSE listed
firms are generally highly diversified and so the industry categories are collapsed from the KLSE
suggested nine to four: namely construction and property development PROP, consumer and
trading CON, industrial products IND , and natural resources (plantation and mining).
Macroeconomic Effect
Indicator variables PRECRI and CRI, control for macroeconomic effects – pre-crisis, crisis and
post-crisis. No directional signs are predicted for these control variables.
6.0 Sample Selection and Data Collection
The data is primarily hand-collected from annual reports of companies listed on the Kuala
Lumpur Stock Exchange (KLSE)16 covering financial periods between 1994-1999, where 1994-
1996 is deemed the pre-crisis period, 1997-1998 the crisis, and 1999 post-crisis. Annual reports
are available in the KLSE and the Securities Commission (SC) library. In addition, incomplete
18
and other required data were supplemented from other sources including: (a) KLSE on disk; (b)
KLSE handbook; (c) Corporate Handbook ; (d) KLSE-RIAM online database; (e) Worldscope
database17 (f) Che Ahmad’s (2001) dataset18 and (g) Investor Digest.
The initial data set comprises companies listed on the KLSE for years 1993 to 1999 since lagged
variables are required. To be included companies had to be listed, report in Malaysian Ringgit
and be audited by a Malaysian-based auditor; in an industry other than finance related and unit
trust sectors19; in existence in all or any of the years 1993 through 1999 with all financial report
data available; not newly listed (IPO) (since differential levels of earnings management are
expected within these companies); and without a change in financial year-end. In addition, all
auditor data had to be available.
For the performance matched-pair sample (matched on Big5/non-big 5, year, industry and return
on sales), 1512 observations meeting the data requirements are reduced to 298 pairs (596
observations) as a consequence of the comparatively small number of non-big 5 auditors present
in the data. The sample size at various stages of data collection is presented in Table 2.
_______________
TABLE 2 ABOUT HERE
________________
7.0 Results
7.1 Descriptive Statistics
The representation of industry sector in the 596 observation matched-pair sample varies, with the
consumer and trading sector representing about 31%, industrial sector 27%, construction/property
sector 36%, whilst natural resources represents about 5% of the sample. These frequencies are
39%, 26%, 24% and 10% respectively over all 1512 observations, and so the matched–pair
industry representation is broadly appropriate, perhaps with the exception of the
construction/property sector.
________________
TABLE 3 ABOUT HERE
________________
From Table 3, mean total assets over the period 1994-1999 for the matched pair (total) sample is
RM1291 (RM1547) million respectively. As can be expected, matching Big 5 with non-Big 5
19
auditees to calculate performance-matched discretionary accruals results in analysis of, on
average, smaller companies than for the full sample and so, where possible, results for the full
sample are footnote reported. Partitioning by macroeconomic period, the mean total assets for the
matched pair (total) sample is RM1238 (RM1367) million pre-crisis (1994-1996), RM1303
(RM1632) million crisis (1997-1998), and RM1369 (RM1746) post-crisis (1999).
The mean market capitalisation for the matched pair (total) sample is RM 799 (RM1324) million
over the period 1994-1999. Pre-crisis market capitalisation is RM1149 (RM1804) million, crisis
RM517 (RM895) million, and post-crisis RM 779 (RM1243) million. Although size in terms of
total assets of sample companies rises over the pre-, crisis and post-crisis periods (with the
exception of 1998 – an indication of pos sible asset write-downs during that year), the market
capitalisation varies greatly. A decline of about 50% is witnessed between the pre- and crisis
periods (indicating the severity of the crisis) and a recovery of about 38% between the crisis and
post-crisis periods.
Leverage (debt/assets) for the matched pair (total) sample displays a mean of 0.357 (0.324) over
the study period. By macroeconomic condition, these matched pair (total) sample companies
have mean leverage of 0.262 (0.223) pre-crisis, 0.325 (0.338) crisis, and 0.634 (0.523) post-crisis.
It is evident that large debt built up prior to the crisis led to an increase in leverage levels during
the crisis period as asset values fell and more debt financing was sought. Although smaller in
terms of total assets and market capitalisation, the leverage for the matched-pair sample is higher
(not in crisis period) than for the total sample.
In terms of performance, the mean revenue of matched pair (total) sample companies over the
study period is RM242 (RM709) million. Partitioning by macroeconomic period, the mean
turnover is RM661 (RM714) million pre-crisis, RM586 (RM703) million crisis, and RM531
(RM712) million post-crisis. Revenues declined in the crisis period and recovery in the post-
crisis period occurred only for the total sample. The mean net earnings after tax and before
extraordinary items of matched pair (total) sample companies over the six years is RM17 (RM33)
million, with a mean of RM52 (73) million pre-crisis, RM2 (RM - 3) million crisis, and RM-6
(RM14) million post-crisis. Profitability declined in the crisis period and recovery in the post-
crisis period occurred only for the total sample. For return on assets, matched pair (total) sample
companies had a mean of 0.015 (0.019). By macroeconomic periods, the mean return on assets
for the matched pair (total) sample was 0.063 (0.070) pre-crisis, -0.000 (-0.009) crisis, and -0.041
20
(–0.021) post-crisis.
The sample firm descriptive characteristics reported in Table 3 and their distributions are
consistent with prior studies in a Malaysian context (eg Eichenseher, 1995; Che Ahmad and
Derashid, 1996; Che Ahmad and Houghton, 2001). In addition, as expected, companies on
average were affected by the 1997/98 Asian Financial Crisis, in that they registered negative
profits, negative return on assets and higher levels of leverage during the crisis and post-crisis
periods compared to pre-crisis. However, clearly the impact and duration of the crisis was felt
more keenly in the matched-pair sample (596 observations) compared with the full sample (1512
observations).
7.2 Univariate Tests
7.2.1 Are Abnormal Accruals Lower for Quality Audited Auditees?
Table 4 reports descriptive statistics and correlations for the 596 matched pair sample companies
used to test the hypotheses. The highest correlation is 0.746 between ABTA and LEV. Tables 5
and 6 present the univariate analysis for the earnings management proxies pooled across years
and by macroeconomic period.
______________________________
TABLES 4, 5 AND 6 ABOUT HERE
_______________________________
The descriptive and univariate analyses provide four main findings.
1) As argued and hypothesised, Table 5 shows the pre-crisis period is associated with mean
income-increasing abnormal accruals and the post-crisis period with mean income-decreasing
abnormal accruals. Mean INCDA decreases from 0.116 to 0.096 for Big 5 auditees and
0.189 to 0.096 for non-Big 5 between pre-and post-crisis periods. However, across the same
period, mean DECDA increases from –0.108 to –0.156 for Big 5 auditees and –0.123 to –
0.144 for non-Big 5 auditees. More markedly, between the pre-and post-crisis periods mean
INCDA decreases from 0.148 to 0.088 for specialists’ auditees and from 0.178 to 0.099 for
non-specialists’ auditees, with mean DECDA increasing from –0.072 to -0.107 for
specialists’ auditees and from –0.119 to –0.187 for non-specialists’ auditees.
2) The means in Table 5 for each of INCDA, DECDA, DA and ABDA reported by clients of
Big 5 / Industry Specia lists are lower than for those of the non-Big 5 / Industry non-
Specialist, however significance for the differences is infrequent. The mean difference in
21
DECDA for auditees of industry non-specialists versus specialists across the whole period is
significant (p=.052), with that for the post-crisis period contributing most (p=.079).
3) The frequency of companies engaging in meeting/beating earnings target behaviour is higher
during the pre-crisis compared to post-crisis - a period where companies are more likely to
take an earnings bath for various possible reasons. Table 6 shows that of the 76 companies
meeting or beating the earnings target (prior year profit or avoidance of loss), 38 or 50% do
so in the pre-crisis period compared with 8 or 10% post-crisis.
4) The meet/beat specific earnings targets proxies provide significant evidence of differential
audit quality, in that the frequency of Big 5 / Industry Specialist auditees meeting or beating
the earnings target is lower than for non-Big 5 / Industry non-Specialist auditees. The
significance of the difference in frequency for all measures of abnormal accruals, reported in
Table 6, is p<.05 overall and in the pre- and crisis periods for the BIG5 proxy and p<.01 for
the for the INDSPEC audit quality proxy over the same macroeconomic periods. The
difference in the post-crisis period tends not to be significant.
7.3 Multivariate Results: Hypothesis 1
Table 7 reports the results for two OLS regressions across the entire examined time period 1994-
1999 using income-increasing (INCDA) and income-decreasing (DECDA) abnormal accruals as
the dependent variable respectively. The variable of interest, BIG5 , is significant in constraining
income-increasing abnormal accruals (p<0.05) as opposed to income -decreasing abnormal
accruals. On the other hand, while industry specialist do not appear any different from non-Big 5
Industry non-Specialists in constraining INCDA, they seem to constrain DECDA (INDSPEC is
negative and significant at p<0.01). Overall the result indicates that Big 5 auditors tend to
constrain income-increasing abnormal accruals but it is only the segment of the Big 5 auditors
that specialise along industry lines that also constrain income-decreasing abnormal accruals. This
finding is interesting since many argue that auditors are well satisfied with conservatism, which a
preponderance of negative abnormal accruals might suggest. The next tests examine the
association between both income-increasing and income-decreasing abnormal accruals by sub-
periods. However, in interpreting these results it must be remembered that the sample sizes
become much reduced compared to the analysis for the overall period.
_________________
TABLE 7 ABOUT HERE
__________________
22
Table 8 documents the OLS regression when the model is tested on INCDA by macroeconomic
period. The variable of interest BIG5 is insignificant in the pre-crisis and the post-crisis periods
but significant in the crisis period at p<0.10. When the model is retested using INDSPEC as the
audit quality proxy, the variable is insignificant in all periods, whilst the B5INDNONSPEC is
negative and significant in the crisis and post-crisis periods at p<0.10 and p<0.05 level
respectively. Taking both of these results together, the result indicates that the Big 5 quality
differentiation may not have been in existence prior to the crisis. However, perhaps due to
various international pressures for heightened quality and more ‘even’ quality transnationally,
there is evidence of such quality differentiation during the crisis and post-crisis periods.
_________________
TABLE 8 ABOUT HERE
__________________
Table 9 reports the OLS regression for the period dependent model when income -decreasing
abnormal accruals (DECDA) is used as the dependent variable. The BIG5 variable is significant
only in the pre-crisis and is weakly associated with DECDA at p<0.10. On the other hand, when
INDSPEC is used as the audit quality proxy, it is negative and significant at p<0.05, but only in
the post-crisis period. Some inconsistency is found with regards to constraining DECDA in that
the B5INDNONSPEC variable is significant but in the opposite direction (positive) to that
expected at p<0.05, indicating that this group of auditors appears unconcerned about high
negative abnormal accruals. Taking these results jointly, there is mixed evidence of product
differentiation when auditors are faced with income-decreasing abnormal accruals. On one hand,
industry specialist auditors appear to constrain income-decreasing earnings management, but on
the other a segment of Big 5 non-Industry Specialist auditors appear to tolerate income -
decreasing accounting choices20.
_________________
TABLE 9 ABOUT HERE
__________________
The models are all significant and explanatory power of the var ious models varies between a low
of 48% and a high of 88% for the model using DECDA as the dependent variable in various
macroeconomic periods. The control variables display various levels of significance with the
DECDA model in the post-crisis period with only the industry category IND not significant in
any of the regressions.
23
In summary, testing H1 with respect to whether quality auditors constrain earnings management
irrespective of macroeconomic condition, reveals two important findings: 1) consistent with prior
studies (Becker, et. al., 1998; Francis, et. al., 1999; Gul, et. al., 2001), Big 5 auditees report lower
abnormal accruals than non-Big 5 auditees; 2) industry specialist audit clients report lower
abnormal accruals than other clients, evidence of differential quality amongst top tier auditors.
When analysed by macroeconomic period, overall the results are consistent with the World Bank
and the IMF concerns with respect to the role of Big 5 auditors in Asia. In general it appears that
prior to the Asian crisis there is no significant difference in quality between the Big 5 (Industry
Specialist) / non-Big 5 (Industry non-Specialist) auditors – a finding contrary to that in the U.S
and Australian environments.
7.3.1 Logistic Regression – BLOSSPR as Dependent Variable
Table 10 also documents the coefficients, their predicted signs, standard errors, significance and
the goodness of fit statistics for the logistic regression. The model is significant (Wald Chi2 =
42.99, p<0.01) with a Chi2 of 0.68 and a Pseudo R2 of 6.6%. However, although overall about
86% of the companies are correctly classified by the logistic model, the model is not successful in
distinguishing between those that meet/beat earnings target and those that do not.
_____________________
TABLE 10 ABOUT HERE
______________________
BLOSSPR is used as a second proxy for earnings management to investigate whether Big 5
auditors exert a higher level of audit quality than non-Big 5 auditors in constraining possible
earnings management to achieve meeting an earnings target. The variable of interest, BIG5, is
significant at p<0.10, indicating a lower incidence of earnings management to meet/beat the
earnings target when the auditee is of a Big 5 auditor. When INDSPEC is the dependent
variable, the INDSPEC coefficient remains negative and significant at the p<0.10 level. The
second variable of interest is the B5INDNONSPEC variable. This variable is not significant.
Overall the results continue to support H1. Control variables found sign ificant are ABTA (as
predicted) and PRECRI (as predicted) is significant at p<0.01. In summary, the results in this
section confirm the results in the previous section with respect to differential audit quality.
7.3.3 Further Test
24
A further test is conducted (not reported) by applying the Becker et al (1998) regression to only
the sub-sample of observations (N=76) that meet/beat the earnings targets (ie prior year profit or
loss avoidance). This technique reconfirms the earlier findings that Big 5 and Industry Specialist
auditors exhibit higher audit quality than non-Big 5 and Industry non-Specialist auditors in terms
of constraining earnings management. Specifically, the BIG5 and the INDSPEC variables are
negative and significant at p<0.01 level whilst B5INDNONSPEC is negative and significant at
p<0.05. Overall this model for this smaller, more directed sample, explains about 64% of the
variation in the BLOSSPR*ABDA through Audit Quality and other control variables. The
model is highly significant at p<.001.
7.4 Multivariate Results: Hypothesis 2
Testing Hypothesis 2 utilises the same model as that for Hypothesis 1, but for the dependent
variable and where possible for the control variables, adopts “changes” in instead of “levels” of
variables. The technique utilises observations in 1996 and 1999 to represent the pre-crisis and
post-crisis periods respectively, requiring survival of the company over that period for inclusion
in the analysis. To maximise the number of observations the total sample of 1512 rather than the
matched pair sample is used. As previously, the BIG5 and INDSPEC variables are expected to
be significantly negative.
_____________________
TABLE 11 ABOUT HERE
______________________
Table 11 documents the results for the OLS “change” model regression for both the original and
extended Becker et al (1998) model using each proxy for audit quality. The first variable of
interest, BIG5, is not significant at any conventional level whilst INDSPEC is negative and
significant at p<0.01. The negative coefficient implies that auditors specialising along industry
lines are better able to constrain earnings management, in that their presence is inversely
associated with change in absolute abnormal accruals across the pre- and post-crisis periods.
Also, the results indicate a heightened general level of audit quality is observed post-crisis
compared with pre-crisis and particularly so if a Big 5 – Industry Specialist auditor is selected.
Control variables, CHABTA, CON and PROP are significant at p<0.05, p<0.01 and p<0.01
respectively for all regressions, whilst IND is significant at p<0.10 level for regressions 3 and 4.
The CHABTA variable is positive and significant at p<0.05 level, indicating a positive change in
25
absolute total accrua ls is associated with a positive change in absolute abnormal accruals. The
negative coefficients for the CON, IND and PROP variables imply that the consumer and
property industry sectors are negatively associated with change in absolute abnormal accruals.
The models are significant at p<0.02 level and explain between 18% to 19% of the variation in
change in absolute abnormal accruals.
8.0 Conclusion, Implications and Future Research
This paper seeks to provide evidence on audit quality differentiation with respect to one outcome
of auditing –management of reported accounting numbers in an emerging market, Malaysia.
Also, given that this study is set in an Asian Crisis context, it examines the impact of one form of
non-financial information, economic condition - in particular the pre-crisis (1994-1996), crisis
(1997-1998), and post-crisis (1999) periods - on the behaviour of auditors with respect to
constraining earnings management. Related prior studies (eg. Becker, et. al., 1998; Francis et. al.,
1999; Gul, et. al., 2001; Gaver and Paterson, 2001) in the US and Australia, without conditioning
on macroeconomic condition, find evidence of Big 5 auditors supplying higher quality. Clients of
this tier of auditors report significantly lower abnormal accruals than those of non-Big 5 auditors.
When economic condition is not considered, the results of this study are consistent with those
studies, in that clients of Big 5 auditors reflect higher quality levels by reporting lower absolute
discretionary accruals and lower incidence of loss avoidance and sustenance of prior year’s profit.
Similarly, this auditor quality differentiation finding is consistent (and the association stronger)
when the Big 5 auditor quality is measured in a finer way, recognising industry specialisation.
However, the results do not hold across all macroeconomic periods as was expected. In fact prior
to the crisis, Big 5 auditors in Malaysia appear to be no different from the non-Big 5 auditors with
respect to constraining earnings management. This finding is consistent with the concerns raised
by various international bodies such as the World Bank and the IMF regarding the quality
standards of the Big 5 operating in Asia. Although not directly related, the results also seem to be
consistent with the findings of Ball et. al., (2000b). That study reports for four South East Asian
countries (Hong Kong, Singapore, Malaysia and Thailand) a lack transparency with respect to
timeliness in incorporating economic income, particularly negative economic income or “bad
news”, in comparison to UK, US, Canada and Australia. Ball et. al. argue that the underlying
economic and political factors influence the incentives of managers and auditors in those
countries to supply highly transparent financial statements.
26
However, the finding is inconsistent with audit fee premium studies (eg. Che Ahmad and
Houghton, 2001; Rose, 1999) which suggest differential Big 5 quality in Malaysia. It is possible
that fee premium is a poor proxy for auditor quality, reflecting perhaps instead market power.
Alternatively it may be because this study does not control for differential auditor effort based on
auditor-auditee ethnicity (Che Ahmad and Houghton, 2001) or number of multinational clients
(Rose, 1999). Che Ahmad and Houghton (2001) find for Malaysia that Chinese controlled
companies pay the least audit fee, followed by Bumiputra controlled companies, with controlled
companies paying significantly higher audit fees. Similarly Rose (1999) finds a fee premium
only for multinational companies in Malaysia.
Remembering that the Asian crisis led to various pressures (in particular from the IMF and World
Bank) to enhance corporate governance in the affected countries, the results show significant
change in the level of audit quality supplied by quality auditors during the post- compared to pre-
crisis period. Specifically, Industry Specialist auditees report lower abnormal accruals during the
post-crisis period than non-Industry specialist auditees.
In terms of limitations, it is probable that pressures exist on both auditor and auditee to supply
quality information. That is, this study cannot distinguish between companies that voluntarily
restrain their level of earnings management and those, which happen to choose a Big 5
(Specialist) auditor and those where auditor influence creates the restraint. Another limitation lies
in the ability to accurately calculate abnormal accruals, despite the robust approach to that
measurement taken in calculating performance-matched abnormal accruals.
Additionally, this study is undertaken using Malaysian data and may not be generalisable to other
economies. Future research in other settings, and using other non-financial indicators to replicate
this finding is important. Other potential for research lies in investigating the sub-set of
companies that actually applied for and received government aid in terms of earnings
management. Additionally, investigating whether appropriate audit opinions were provided will
help substantiate the results reported here. However, this study contributes to the audit quality
and earnings management literature by providing evidence consistent with macroeconomic
condition and external pressure for quality playing a role in auditors’ deliberations. As such it
will be of interest to the audit profession and regulators of the profession.
27
References
Accountancy. 1998. Barking at the watchdogs. 122:6-7 Accountancy. 1998. Big Five’s key role. 122: 10. Asare, S.K., and R.A. Davidson. 1995. Expectation of Errors in Unaudited Book Values: The Effect of Control Procedures and Financial Condition. Auditing: A Journal of Practice & Theory 14:1-18. Ball, R., A. Robin, and J. S. Wu. 2000. Incentives Versus Standards: Properties of Accounting Income in Four East Asian Countries, and Implications for Acceptance of IAS. Working Paper. University of Rochester. Ball, R., S.P. Kothari, and A. Robin. 2000. The effect of international institutional factors on properties of accounting earnings. Journal of Accounting and Economics 29:1-51. Bank Negara Malaysia (BNM). 1999. Quarterly Bulletin. Second Quarter.[WWW document] Available from: http://www.bnm.gov.my/pub/index.htm Bank Negara Malaysia (BNM). 1999. The Central Bank and the Financial System in Malaysia - A Decade of Change. Kuala Lumpur. Bartov, E., F.A. Gul, and J.S. Tsui. 2001. Discretionary-accruals models and audit qualification. Journal of Accounting and Economics 30:421-452. Bayless, R., J. Cochrane, T. Harris, J. Leisenring, J. McLaughlin and J.P. Wirtz. 1996. International Access to U.S. Capital Markets – An AAA Forum on Accounting Policy. Accounting Horizons 10(1): 75-94. Becker, C.L., M.L. DeFond, J. Jiambalvo and K.R. Subramanyam. 1998. The Effect of Audit Quality on Earnings Management. Contemporary Accounting Research 15 (1) Spring: 1-24. Bradshaw, M. T., S.A. Richardson, and R.G. Sloan. 2001. Do Analysts and Auditors Use Information in Accruals? Journal of Accounting Research 39(1): 45-73. Braun, K. W. 2001. The disposition of audit-detected misstatements: An examination of risks and reward factors and aggregation effects. Contemporary Accounting Research 18: 71-100. Carcello, J. and Z. Palmrose. 1994. Auditor Litigation and Modified Reporting on Bankrupt Clients. Journal of Accounting Research 32 (Supplement): 1-30. Che Ahmad, A. and C. Derashid. 1996. The Pricing of Audit Services: Evidence from the KLSE Listed Companies. Jurnal Analisis. Che Ahmad, A. and K.A. Houghton. 2001. Audit Markets: The Effects of Ethnicity on Pricing. Working Paper. University of Melbourne. Chen, K.C.W. and B.K. Church. 1996. Going concern opinions and the market’s reaction to bankruptcy filings. The Accounting Review 71:117-128.
28
Cohen, R.C., G. Krishnamoorthy, and A.M. Wright. 2000. Evidence on the Effects of Financial and Nonfinancial Trends on Analytical Review. Auditing: A Journal of Practice & Theory 19:27-48. Craswell, A.T., J.R. Francis and S.L. Taylor. 1995. Auditor Brand Name Reputations and Industry Specializations. Journal of Accounting and Economics. 20: 297-322. DeAngelo, L. E. 1981. Auditor Size and Audit Quality. Journal of Accounting and Economics 3. 183-199. DeAngelo 1988. Managerial Competition, Information Costs, and Corporate Governance: The Use of Accounting Performance Measures in Proxy Contests. Journal of Accounting and Economics: 3-36. DeAngelo H. and L. DeAngelo.1991. Union Negotiations and Corporate Policy. Journal of Financial Economics 30: 3-43. DeAngelo H., L. DeAngelo and D.J. Skinner. 1994. Accounting Choice in Troubled Companies. Journal of Accounting and Economics: 113-143. Dechow P., R. Sloan and A. Sweeney. 1995. Detecting Earnings Management. The Accounting Review 70(2): 193-225. DeFond M.L. and J. Jiambalvo. 1994. Debt Covenant Violation and Manipulation of Accruals. Journal of Accounting and Economics 17: 145-176. DeFond M.L. and K.R. Subramanyam. 1998. Auditor Changes and Discretionary Accruals. Journal of Accounting and Economics 25: 35-67. Degeorge, F., J. Patel, and R. Zeckhauser. 1999. Earnings Management to Exceed Thresholds. Journal of Business 72:1-33. Eichenseher, J.W. 1995. Additional Factors in Audit Pricing - New Evidence From Malaysia. Accounting Business Review 2(1):1-26. Entwistle, G., and D. Lindsay. 1994. An Archival Study of the Existence, Cause, and Discovery of Income-Affecting Financial Statement Misstatement. Contemporary Accounting Research : 271-296. Favere-Marchesi, M. 2000. Audit Quality in ASEAN. The International Journal of Accounting 35: 121-149. Ferguson, A. and D., Stokes. 2002. Brand Name Audit Pricing, Industry Specialization, and Leadership Premiums post-Big 8 and Big 6 Mergers. Contemporary Accounting Research 19(1):77-110. Francis, J.R. and J. Krishnan. 1999. Accounting Accruals and Auditor Reporting Conservatism. Contemporary Accounting Research v16:135-165.
29
Francis, J.R., E.L. Maydew and H.C. Sparks. 1999. The Role of Big 6 Auditors in the Credible Reporting of Accruals. Auditing: A Journal of Practice and Theory v18:17-34. Gaver, J.J., and J.S. Paterson. 2001. The Association between External Monitoring and Earnings Management in the Property-Casualty Insurance Industry. Journal of Accounting Research 39(2): 269-282. Gramling, A., and D. N. Stone. 2001. Audit Firm Industry Expertise: A Review and Synthesis of the Archival Literature. Journal of Accounting Literature 20: 1-29. Guay, W., S.P. Kothari and R.L. Watts. 1996. A Market-Based Evaluation of Discretionary-Accruals Models. Journal of Accounting Research (Supplement) 34: 83-116. Gul, F. A., S. G. Lyn, and J.S. Tsui. 2001. Audit Quality, Management Ownership, and the Informativeness of Accounting Earnings. Journal of Accounting, Auditing and Finance 17(1): 25-49. Hackenbrack, K. and M.W. Nelson. 1996. Auditors’ Incentives and Their Application of Financial Accounting Standards. The Accounting Review v.71:43-59. Healy, P. 1985. The Effect of Bonus Schemes on Accounting Decisions. Journal of Accounting and Economics 7: 85-107. Healy, P. and K. Palepu. 1990. The Effectiveness of Accounting-Based Dividend Covenants. Journal of Accounting and Economics 12: 97-123. Heninger, W.G. 2001. The Association between Auditor Litigation and Abnormal Accruals. The Accounting Review 76(1): 111-126. Hirst, D.E. 1994. Auditor Sensitivity to Earnings Management. Contemporary Accounting Research v.11:405-422. Hribar, P., and D.W. Collins. Errors in Estimating Accruals: Implications for Empirical Research. Journal of Accounting Research 40(1):105-134. Jones, J. 1991. Earnings Management During Import Relief Investigations. Journal of Accounting Research 29: 193-228. Kinney, W. and R. Martin. 1994. Does Auditing Reduce Bias in Financial Reporting? A Review of Audit-Related Adjustment Studies. Auditing: A Journal of Practice and Theory 13: 149-156. Kothari, S.P., A.J. Leone and C.E. Wasley. 2001. Performance Matched Discretionary Accruals. Working Paper. University of Rochester. Krishnan, J and J. Krishnan. 1997. Litigation Risk and Auditor Resignations. The Accounting Review 72:539-560. Liberty, S. and J. Zimmerman. 1986. Labor Union Negotiations and Contract Choice. Journal of Accounting and Economics : 692-712.
30
Lys, T. and R.L. Watts. 1994. Lawsuits Against Auditors. Journal of Accounting Research (Supplement): 65-93. Matolcsy, Z. 2000. Executive Cash Compensation and Corporate Performance During Different Economic Cycles. Contemporary Accounting Research 17:671-692. Mayhew, B.W. 2001. Auditor Reputation Building. Journal of Accounting Research 39:599. McNichols, M.F. 2000. Research design issues in earnings management studies, Journal of Accounting and Public Policy 19(4-5): 313-345. Md. Ali, A. 1999. The Political Economy of External Auditing in Malaysia 1957 -1997. University Utara Malaysia Press. Sintok. Palmrose, Z. 1984. The Demand for Quality-Differentiated Audit Services in an Agency-Cost Setting: An Empirical Investigation. Auditing Research Symposium. University of Illinois. Urbana, IL: 229-252. Palmrose, Z.V.1988. An Analysis of Auditor Litigation and Audit Service Quality. The Accounting Review: 55-73. Petroni, K.R.. 1992.Optimistic reporting in the property casualty insurance industry. Journal of Accounting and Economics 15. 485-508. Phillips, F. 1999. Auditor Attention to and Judgements of Aggressive Financ ial Reporting. Journal of Accounting Research v.37:167-189. Plummer, E., and D. P. Mest. 2000. Evidence on the Earnings Management of Earnings Components. Journal of Accounting, Auditing and Finance 16(4): 301-323. Pourciau, S., 1993. Earnings management and nonroutine executive changes. Journal of Accounting and Economics 16. 317-336. Rangan, S. 1998. Earnings management and the performance of seasoned equity offerings. Journal of Financial Economics 50:101-122. Ravlic, T. 1999. Japan Looks to Higher Standards. Australian CPA. Nov: 48-49. Rose, A. M. 1999. Audit Pricing and The Role of Multinational Factors: A Study of the Hong Kong and Malaysian Markets. Advances in International Accounting 12:129-135. Schwartz, K. B and K. Menon. 1985. Auditor Switches by Failing Firms. The Accounting Review 2: 248-261. Shu, S.Z. 2000. Auditor Resignations: Clientele Effects and Legal Liability. Journal of Accounting and Economics 29(2000): 173-205. Smith, M., J. Kestel, and P. Robinson. 2001. Economic recession, corporate distress and income increasing accounting policy choice. Accounting Forum 25(4):334-352.
31
St. Pierre, K. and J. Anderson. 1984. An Analysis of Factors Associated with Lawsuits Against Public Accountants. The Accounting Review 59: 242-263. Sweeney, A. 1994. Debt-Covenant violations and managers’ responses. Journal of Accounting and Economics 17: 281-308. Tay, J. 1995. The Regulation of Financial Reporting and Quality of Information: A Comparative Analysis of Singapore, Malaysia and Thailand. In Contemporary Issues in Accounting. edited by H. Y. Pang. Addison-Wesley. Singapore. Teoh, S. and T. Wong. 1993. Perceived Auditor Quality and the Earnings Response Coefficient. The Accounting Review. 68(2): 346-366. Teoh, S. H., I. Welch, and T.J. Wong. 1998. Earnings Management and the Underperformance of Seasoned Equity Offerings. Journal of Financial Economics 50: 63-99. Teoh, S. H., Welch, I., and T.J. Wong. 1998. Earnings Management and the Long-term Market Performance of Initial Public Offerings. Journal of Finance LIII:1935-1974. Teoh, S.H., T.J. Wong and G.R. Rao. 1998. Are Accruals during Initial Public Offerings Opportunistic? Review of Accounting Studies 3: 175-208. Thillainathan, R. 1999. Corporate Governance and Restructuring in Malaysia – A Review of Markets, Mechanisms, Agents and The Legal Infrastructure. Working Paper. World Bank/OECD Survey of Corporate Governance. Warfield, T.D., J.J. Wild, and K.L. Wild. 1995. Managerial Ownership, Accounting Choices, and Informativeness of Earnings. Journal of Accounting and Economics 20:61-91. Zhang, P. 1999. A Bargaining Model of Auditor Reporting. Contemporary Accounting Research 16:167-184.
32
Table 1: Variable Description and Expected Direction for EM-AQ Model (s)
Variable Description and Measurement Predicted Direction
Dependent Variable Earnings Management (EM)
Takes 2 general forms: 1) Abnormal (discretionary) Accruals – income-
increasing (INCDA), income-decreasing (INCDA) and absolute (ABDA)
2) Earnings Target – zero or 1 cent or more in current year EPS; and zero or 1 cent or more in change in EPS (1 if meet earnings target, else 0) (BLOSSPR)
Hypothesis Variable Audit Quality
(AQ)
Takes 3 different proxies: 1) Big 5 – A dummy variable, 1 if the auditee is audited
by one of the Big 5 (and affiliates) firms, 0 otherwise. (BIG 5)
2) Industry Specialist– 1 if auditor industry specialist (15% market share) exists in auditee’s industry, 0 otherwise. (INDSPEC)
3) Big 5 Industry non-Specialist – 1 if the Industry non-Specialist is a Big 5, and 0 otherwise. (B5INDNONSPEC)
-ve
-ve
-ve Control Variables – Used in Becker et. al., (1998) study OCF Operating Cash Flow – Earnings After Tax Before
Extraordinary Items – Total Accruals LEV Leverage – (total debt/total assets) LASSET Natural log of total assets ABTA Absolute Total Accruals NEWAUD First sample year with a new auditor OLDAUD Last sample year is followed by an auditor change INCSH Increase of 10% or more in total outstanding share during
the year
+ve +ve +ve +ve -ve -ve +ve
Additional Control Variables CON A dummy variable, taking value 1 if the company is in the
consumer sector and 0 otherwise. IND A dummy variable, taking value 1 if the company is in the
industrial sector and 0 otherwise. PROP A dummy variable, taking value 1 if the company is in the
property sector and 0 otherwise. PRECRI A dummy variable, taking value 1 if the observation year is
1994, 1995 or 1996, and 0 otherwise. CRI A dummy variable, taking value 1 if the observation year is
1997 or 1998, and 0 otherwise.
? ? ? ? ?
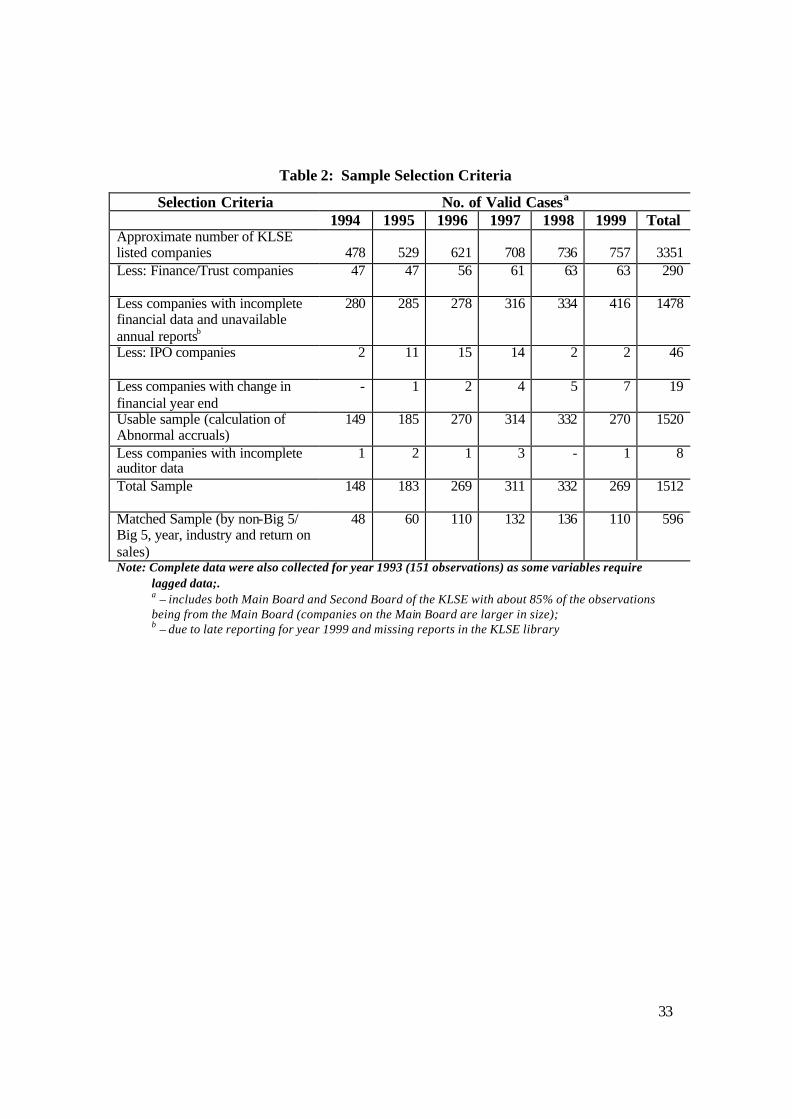
33
Table 2: Sample Selection Criteria
Selection Criteria No. of Valid Casesa 1994 1995 1996 1997 1998 1999 Total
Approximate number of KLSE listed companies
478
529
621
708
736
757
3351
Less: Finance/Trust companies
47 47 56 61 63 63 290
Less companies with incomplete financial data and unavailable annual reportsb
280 285 278 316 334 416 1478
Less: IPO companies
2 11 15 14 2 2 46
Less companies with change in financial year end
- 1 2 4 5 7 19
Usable sample (calculation of Abnormal accruals)
149 185 270 314 332 270 1520
Less companies with incomplete auditor data
1 2 1 3 - 1 8
Total Sample
148 183 269 311 332 269 1512
Matched Sample (by non-Big 5/ Big 5, year, industry and return on sales)
48 60 110 132 136 110 596
Note: Complete data were also collected for year 1993 (151 observations) as some variables require lagged data;. a – includes both Main Board and Second Board of the KLSE with about 85% of the observations being from the Main Board (companies on the Main Board are larger in size); b – due to late reporting for year 1999 and missing reports in the KLSE library
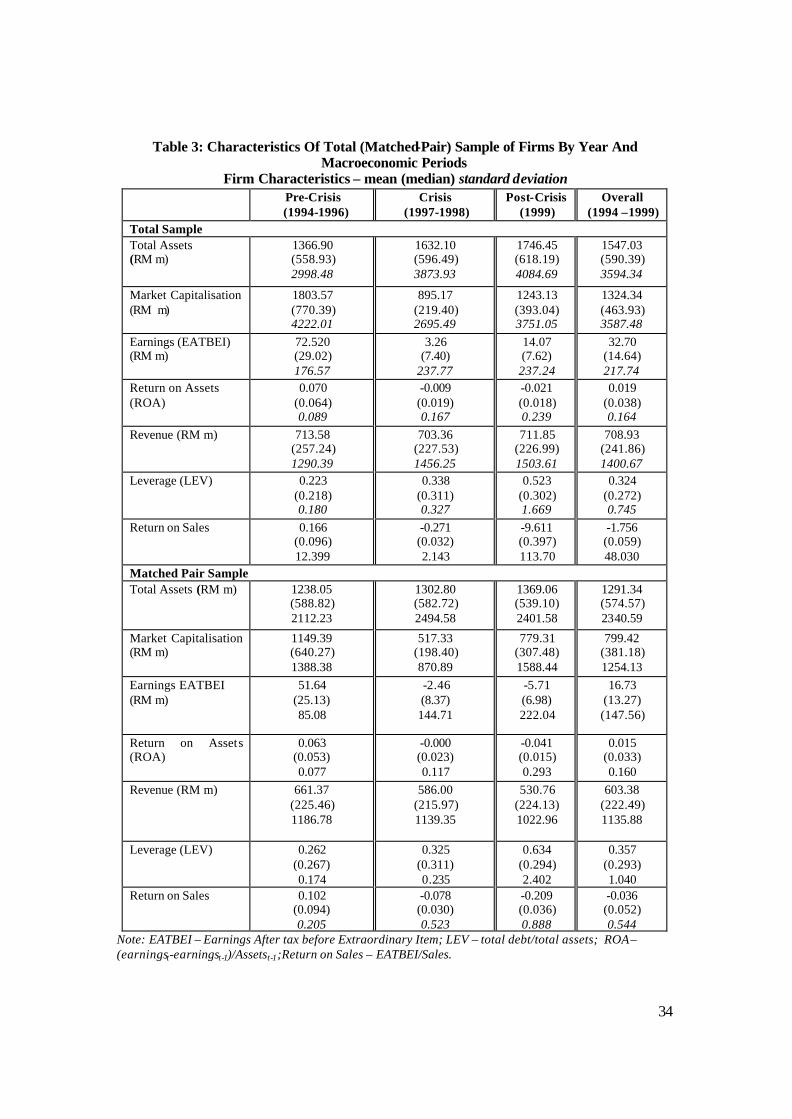
34
Table 3: Characteristics Of Total (Matched-Pair) Sample of Firms By Year And Macroeconomic Periods
Firm Characteristics – mean (median) standard deviation Pre-Crisis
(1994-1996) Crisis
(1997-1998) Post-Crisis
(1999) Overall
(1994 –1999) Total Sample Total Assets (RM m)
1366.90 (558.93) 2998.48
1632.10 (596.49) 3873.93
1746.45 (618.19) 4084.69
1547.03 (590.39) 3594.34
Market Capitalisation (RM m)
1803.57 (770.39) 4222.01
895.17 (219.40) 2695.49
1243.13 (393.04) 3751.05
1324.34 (463.93) 3587.48
Earnings (EATBEI) (RM m)
72.520 (29.02) 176.57
3.26 (7.40)
237.77
14.07 (7.62) 237.24
32.70 (14.64) 217.74
Return on Assets (ROA)
0.070 (0.064) 0.089
-0.009 (0.019) 0.167
-0.021 (0.018) 0.239
0.019 (0.038) 0.164
Revenue (RM m)
713.58 (257.24) 1290.39
703.36 (227.53) 1456.25
711.85 (226.99) 1503.61
708.93 (241.86) 1400.67
Leverage (LEV) 0.223 (0.218) 0.180
0.338 (0.311) 0.327
0.523 (0.302) 1.669
0.324 (0.272) 0.745
Return on Sales 0.166 (0.096) 12.399
-0.271 (0.032) 2.143
-9.611 (0.397) 113.70
-1.756 (0.059) 48.030
Matched Pair Sample Total Assets (RM m)
1238.05 (588.82) 2112.23
1302.80 (582.72) 2494.58
1369.06 (539.10) 2401.58
1291.34 (574.57) 2340.59
Market Capitalisation (RM m)
1149.39 (640.27) 1388.38
517.33 (198.40) 870.89
779.31 (307.48) 1588.44
799.42 (381.18) 1254.13
Earnings EATBEI (RM m)
51.64 (25.13) 85.08
-2.46 (8.37) 144.71
-5.71 (6.98) 222.04
16.73 (13.27) (147.56)
Return on Assets (ROA)
0.063 (0.053) 0.077
-0.000 (0.023) 0.117
-0.041 (0.015) 0.293
0.015 (0.033) 0.160
Revenue (RM m) 661.37 (225.46) 1186.78
586.00 (215.97) 1139.35
530.76 (224.13) 1022.96
603.38 (222.49) 1135.88
Leverage (LEV) 0.262 (0.267) 0.174
0.325 (0.311) 0.235
0.634 (0.294) 2.402
0.357 (0.293) 1.040
Return on Sales 0.102 (0.094) 0.205
-0.078 (0.030) 0.523
-0.209 (0.036) 0.888
-0.036 (0.052) 0.544
Note: EATBEI – Earnings After tax before Extraordinary Item; LEV – total debt/total assets; ROA – (earningst-earningst-1)/Assetst-1;Return on Sales – EATBEI/Sales.
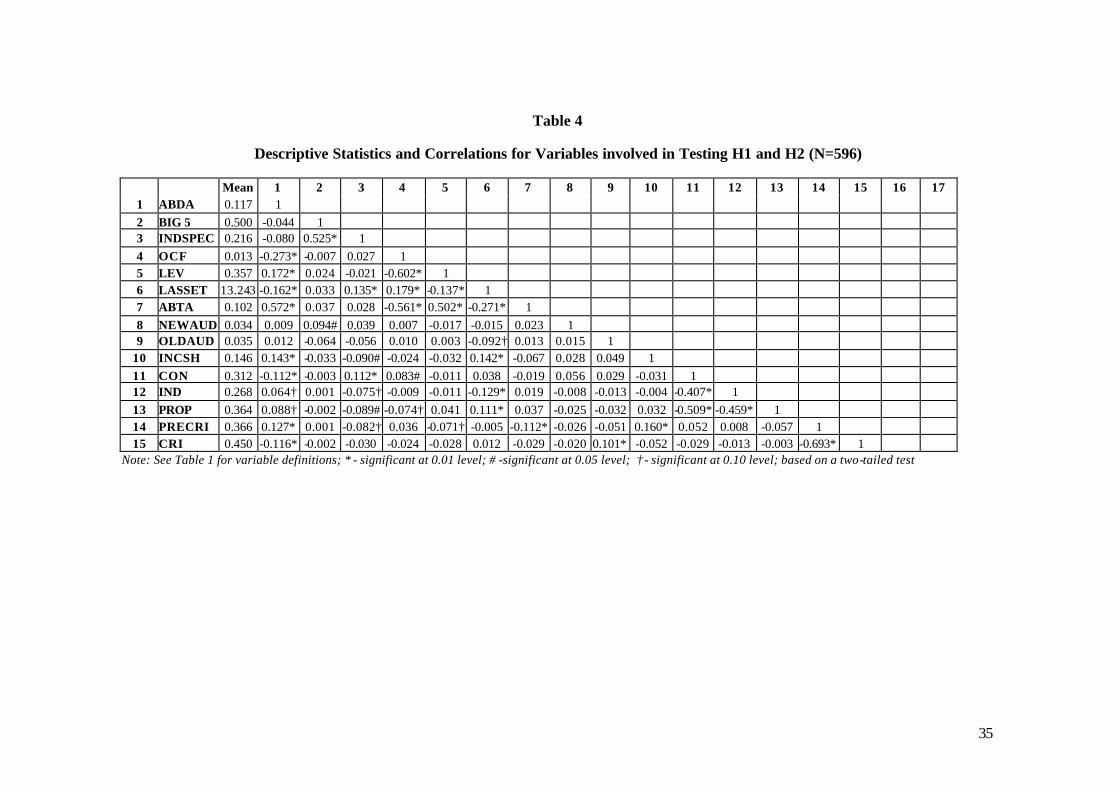
35
Table 4
Descriptive Statistics and Correlations for Variables involved in Testing H1 and H2 (N=596)
Mean 1 2 3 4 5 6 7 8 9 10 11 12 13 14 15 16 17 1 ABDA 0.117 1 2 BIG 5 0.500 -0.044 1 3 INDSPEC 0.216 -0.080 0.525* 1 4 OCF 0.013 -0.273* -0.007 0.027 1 5 LEV 0.357 0.172* 0.024 -0.021 -0.602* 1 6 LASSET 13.243 -0.162* 0.033 0.135* 0.179* -0.137* 1 7 ABTA 0.102 0.572* 0.037 0.028 -0.561* 0.502* -0.271* 1 8 NEWAUD 0.034 0.009 0.094# 0.039 0.007 -0.017 -0.015 0.023 1 9 OLDAUD 0.035 0.012 -0.064 -0.056 0.010 0.003 -0.092† 0.013 0.015 1
10 INCSH 0.146 0.143* -0.033 -0.090# -0.024 -0.032 0.142* -0.067 0.028 0.049 1 11 CON 0.312 -0.112* -0.003 0.112* 0.083# -0.011 0.038 -0.019 0.056 0.029 -0.031 1 12 IND 0.268 0.064† 0.001 -0.075† -0.009 -0.011 -0.129* 0.019 -0.008 -0.013 -0.004 -0.407* 1 13 PROP 0.364 0.088† -0.002 -0.089# -0.074† 0.041 0.111* 0.037 -0.025 -0.032 0.032 -0.509* -0.459* 1 14 PRECRI 0.366 0.127* 0.001 -0.082† 0.036 -0.071† -0.005 -0.112* -0.026 -0.051 0.160* 0.052 0.008 -0.057 1 15 CRI 0.450 -0.116* -0.002 -0.030 -0.024 -0.028 0.012 -0.029 -0.020 0.101* -0.052 -0.029 -0.013 -0.003 -0.693* 1
Note: See Table 1 for variable definitions; * - significant at 0.01 level; # -significant at 0.05 level; † - significant at 0.10 level; based on a two-tailed test
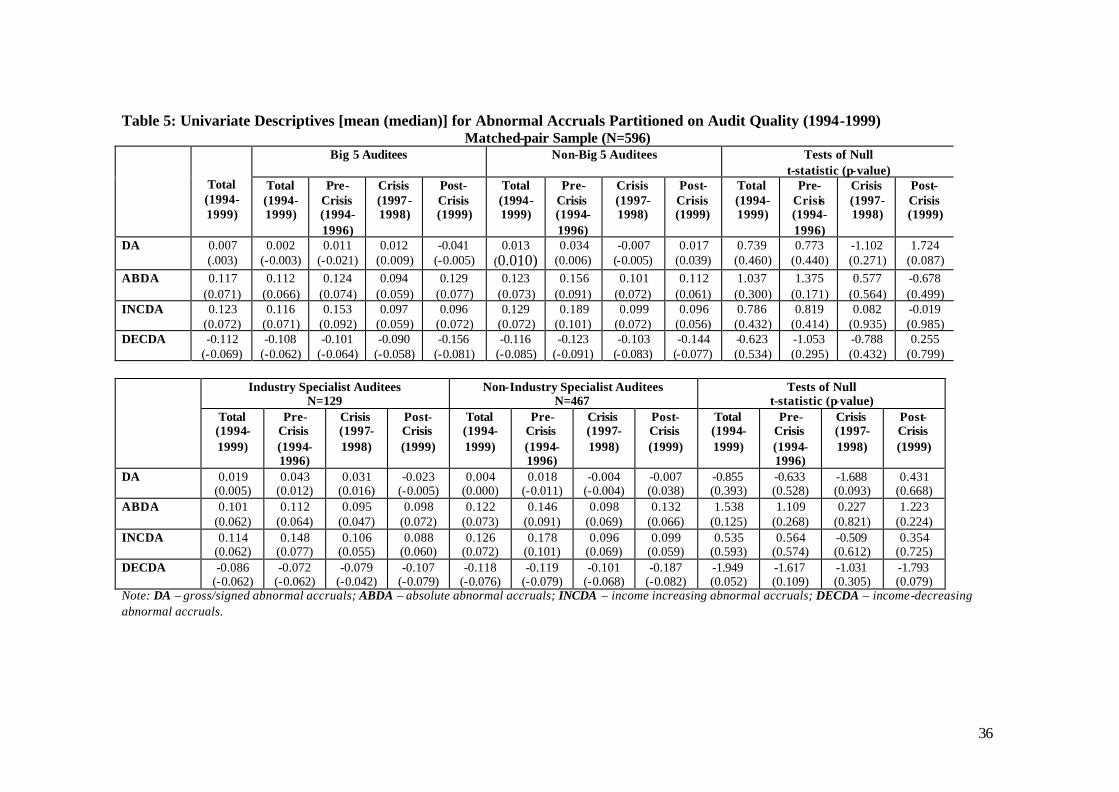
36
Table 5: Univariate Descriptives [mean (median)] for Abnormal Accruals Partitioned on Audit Quality (1994-1999) Matched-pair Sample (N=596)
Big 5 Auditees Non-Big 5 Auditees
Tests of Null t-statistic (p-value)
Total (1994-1999)
Total (1994-1999)
Pre-Crisis (1994-1996)
Crisis (1997- 1998)
Post-Crisis (1999)
Total (1994-1999)
Pre-Crisis (1994-1996)
Crisis (1997- 1998)
Post-Crisis (1999)
Total (1994-1999)
Pre-Crisis (1994-1996)
Crisis (1997- 1998)
Post-Crisis (1999)
DA 0.007 (.003)
0.002 (-0.003)
0.011 (-0.021)
0.012 (0.009)
-0.041 (-0.005)
0.013 (0.010)
0.034 (0.006)
-0.007 (-0.005)
0.017 (0.039)
0.739 (0.460)
0.773 (0.440)
-1.102 (0.271)
1.724 (0.087)
ABDA 0.117 (0.071)
0.112 (0.066)
0.124 (0.074)
0.094 (0.059)
0.129 (0.077)
0.123 (0.073)
0.156 (0.091)
0.101 (0.072)
0.112 (0.061)
1.037 (0.300)
1.375 (0.171)
0.577 (0.564)
-0.678 (0.499)
INCDA 0.123 (0.072)
0.116 (0.071)
0.153 (0.092)
0.097 (0.059)
0.096 (0.072)
0.129 (0.072)
0.189 (0.101)
0.099 (0.072)
0.096 (0.056)
0.786 (0.432)
0.819 (0.414)
0.082 (0.935)
-0.019 (0.985)
DECDA -0.112 (-0.069)
-0.108 (-0.062)
-0.101 (-0.064)
-0.090 (-0.058)
-0.156 (-0.081)
-0.116 (-0.085)
-0.123 (-0.091)
-0.103 (-0.083)
-0.144 (-0.077)
-0.623 (0.534)
-1.053 (0.295)
-0.788 (0.432)
0.255 (0.799)
Industry Specialist Auditees
N=129 Non-Industry Specialist Auditees
N=467 Tests of Null
t-statistic (p-value)
Total (1994-1999)
Pre-Crisis (1994-1996)
Crisis (1997- 1998)
Post-Crisis (1999)
Total (1994-1999)
Pre-Crisis (1994-1996)
Crisis (1997- 1998)
Post-Crisis (1999)
Total (1994-1999)
Pre-Crisis (1994-1996)
Crisis (1997- 1998)
Post-Crisis (1999)
DA 0.019 (0.005)
0.043 (0.012)
0.031 (0.016)
-0.023 (-0.005)
0.004 (0.000)
0.018 (-0.011)
-0.004 (-0.004)
-0.007 (0.038)
-0.855 (0.393)
-0.633 (0.528)
-1.688 (0.093)
0.431 (0.668)
ABDA 0.101 (0.062)
0.112 (0.064)
0.095 (0.047)
0.098 (0.072)
0.122 (0.073)
0.146 (0.091)
0.098 (0.069)
0.132 (0.066)
1.538 (0.125)
1.109 (0.268)
0.227 (0.821)
1.223 (0.224)
INCDA 0.114 (0.062)
0.148 (0.077)
0.106 (0.055)
0.088 (0.060)
0.126 (0.072)
0.178 (0.101)
0.096 (0.069)
0.099 (0.059)
0.535 (0.593)
0.564 (0.574)
-0.509 (0.612)
0.354 (0.725)
DECDA -0.086 (-0.062)
-0.072 (-0.062)
-0.079 (-0.042)
-0.107 (-0.079)
-0.118 (-0.076)
-0.119 (-0.079)
-0.101 (-0.068)
-0.187 (-0.082)
-1.949 (0.052)
-1.617 (0.109)
-1.031 (0.305)
-1.793 (0.079)
Note: DA – gross/signed abnormal accruals; ABDA – absolute abnormal accruals; INCDA – income increasing abnormal accruals; DECDA – income-decreasing abnormal accruals.
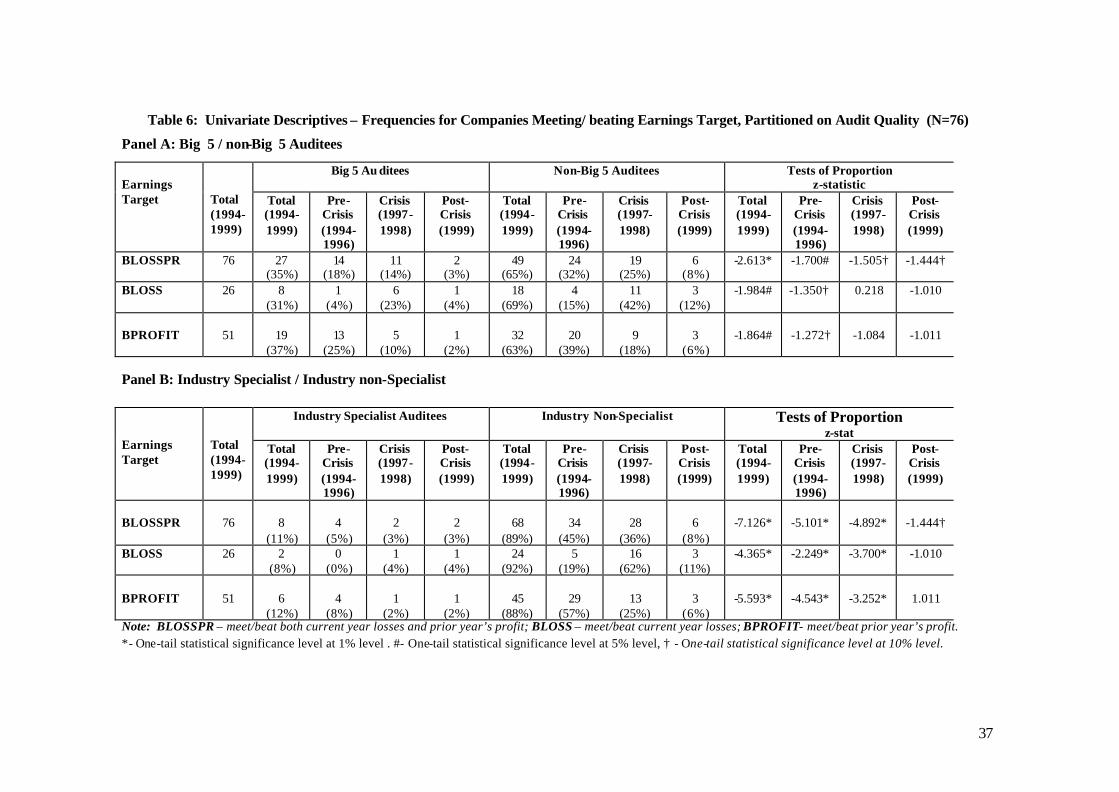
37
Table 6: Univariate Descriptives – Frequencies for Companies Meeting/ beating Earnings Target, Partitioned on Audit Quality (N=76)
Panel A: Big 5 / non-Big 5 Auditees
Big 5 Au ditees Non-Big 5 Auditees Tests of Proportion z-statistic
Earnings Target
Total (1994-1999)
Total (1994-1999)
Pre-Crisis (1994-1996)
Crisis (1997- 1998)
Post-Crisis (1999)
Total (1994-1999)
Pre-Crisis (1994-1996)
Crisis (1997- 1998)
Post-Crisis (1999)
Total (1994-1999)
Pre-Crisis (1994-1996)
Crisis (1997- 1998)
Post-Crisis (1999)
BLOSSPR 76 27 (35%)
14 (18%)
11 (14%)
2 (3%)
49 (65%)
24 (32%)
19 (25%)
6 (8%)
-2.613* -1.700# -1.505† -1.444†
BLOSS 26 8 (31%)
1 (4%)
6 (23%)
1 (4%)
18 (69%)
4 (15%)
11 (42%)
3 (12%)
-1.984# -1.350† 0.218 -1.010
BPROFIT
51
19
(37%)
13
(25%)
5
(10%)
1
(2%)
32
(63%)
20
(39%)
9
(18%)
3
(6%)
-1.864#
-1.272†
-1.084
-1.011
Panel B: Industry Specialist / Industry non-Specialist
Industry Specialist Auditees Industry Non-Specialist Tests of Proportion z-stat
Earnings Target
Total (1994-1999)
Total (1994-1999)
Pre-Crisis (1994-1996)
Crisis (1997- 1998)
Post-Crisis (1999)
Total (1994-1999)
Pre-Crisis (1994-1996)
Crisis (1997- 1998)
Post-Crisis (1999)
Total (1994-1999)
Pre-Crisis (1994-1996)
Crisis (1997- 1998)
Post-Crisis (1999)
BLOSSPR
76
8
(11%)
4
(5%)
2
(3%)
2
(3%)
68
(89%)
34
(45%)
28
(36%)
6
(8%)
-7.126*
-5.101*
-4.892*
-1.444†
BLOSS
26 2 (8%)
0 (0%)
1 (4%)
1 (4%)
24 (92%)
5 (19%)
16 (62%)
3 (11%)
-4.365* -2.249* -3.700* -1.010
BPROFIT
51
6
(12%)
4
(8%)
1
(2%)
1
(2%)
45
(88%)
29
(57%)
13
(25%)
3
(6%)
-5.593*
-4.543*
-3.252*
1.011
Note: BLOSSPR – meet/beat both current year losses and prior year’s profit; BLOSS – meet/beat current year losses; BPROFIT- meet/beat prior year’s profit. *- One-tail statistical significance level at 1% level . #- One-tail statistical significance level at 5% level, † - One-tail statistical significance level at 10% level.
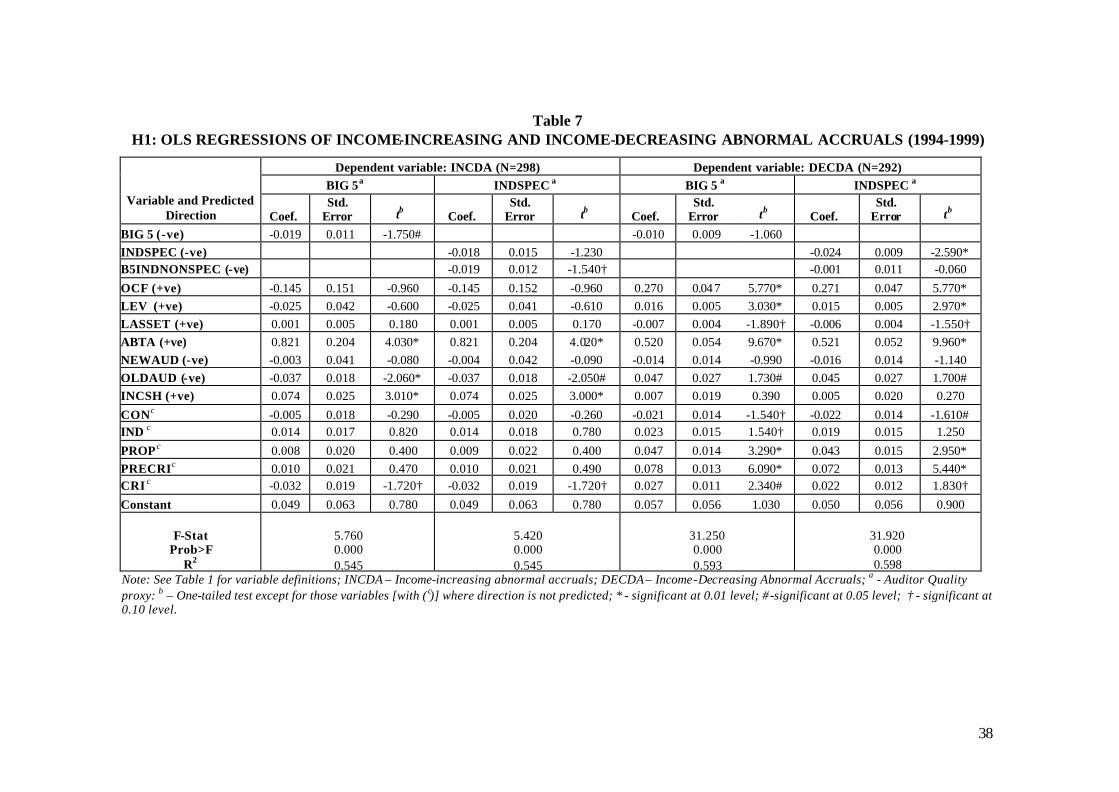
38
Table 7 H1: OLS REGRESSIONS OF INCOME-INCREASING AND INCOME-DECREASING ABNORMAL ACCRUALS (1994-1999)
Dependent variable: INCDA (N=298) Dependent variable: DECDA (N=292) BIG 5a INDSPEC a BIG 5 a INDSPEC a
Variable and Predicted Direction Coef.
Std. Error tb Coef.
Std. Error tb Coef.
Std. Error tb Coef.
Std. Error tb
BIG 5 (-ve) -0.019 0.011 -1.750# -0.010 0.009 -1.060 INDSPEC (-ve) -0.018 0.015 -1.230 -0.024 0.009 -2.590* B5INDNONSPEC (-ve) -0.019 0.012 -1.540† -0.001 0.011 -0.060 OCF (+ve) -0.145 0.151 -0.960 -0.145 0.152 -0.960 0.270 0.047 5.770* 0.271 0.047 5.770* LEV (+ve) -0.025 0.042 -0.600 -0.025 0.041 -0.610 0.016 0.005 3.030* 0.015 0.005 2.970* LASSET (+ve) 0.001 0.005 0.180 0.001 0.005 0.170 -0.007 0.004 -1.890† -0.006 0.004 -1.550† ABTA (+ve) 0.821 0.204 4.030* 0.821 0.204 4.020* 0.520 0.054 9.670* 0.521 0.052 9.960* NEWAUD (-ve) -0.003 0.041 -0.080 -0.004 0.042 -0.090 -0.014 0.014 -0.990 -0.016 0.014 -1.140 OLDAUD (-ve) -0.037 0.018 -2.060* -0.037 0.018 -2.050# 0.047 0.027 1.730# 0.045 0.027 1.700# INCSH (+ve) 0.074 0.025 3.010* 0.074 0.025 3.000* 0.007 0.019 0.390 0.005 0.020 0.270 CON c -0.005 0.018 -0.290 -0.005 0.020 -0.260 -0.021 0.014 -1.540† -0.022 0.014 -1.610# IND c 0.014 0.017 0.820 0.014 0.018 0.780 0.023 0.015 1.540† 0.019 0.015 1.250 PROP c 0.008 0.020 0.400 0.009 0.022 0.400 0.047 0.014 3.290* 0.043 0.015 2.950* PRECRI c 0.010 0.021 0.470 0.010 0.021 0.490 0.078 0.013 6.090* 0.072 0.013 5.440* CRI c -0.032 0.019 -1.720† -0.032 0.019 -1.720† 0.027 0.011 2.340# 0.022 0.012 1.830† Constant 0.049 0.063 0.780 0.049 0.063 0.780 0.057 0.056 1.030 0.050 0.056 0.900
F-Stat Prob>F
R2
5.760 0.000 0.545
5.420 0.000 0.545
31.250 0.000 0.593
31.920 0.000 0.598
Note: See Table 1 for variable definitions; INCDA – Income-increasing abnormal accruals; DECDA – Income-Decreasing Abnormal Accruals; a - Auditor Quality proxy: b – One-tailed test except for those variables [with ( c)] where direction is not predicted; * - significant at 0.01 level; # -significant at 0.05 level; † - significant at 0.10 level.
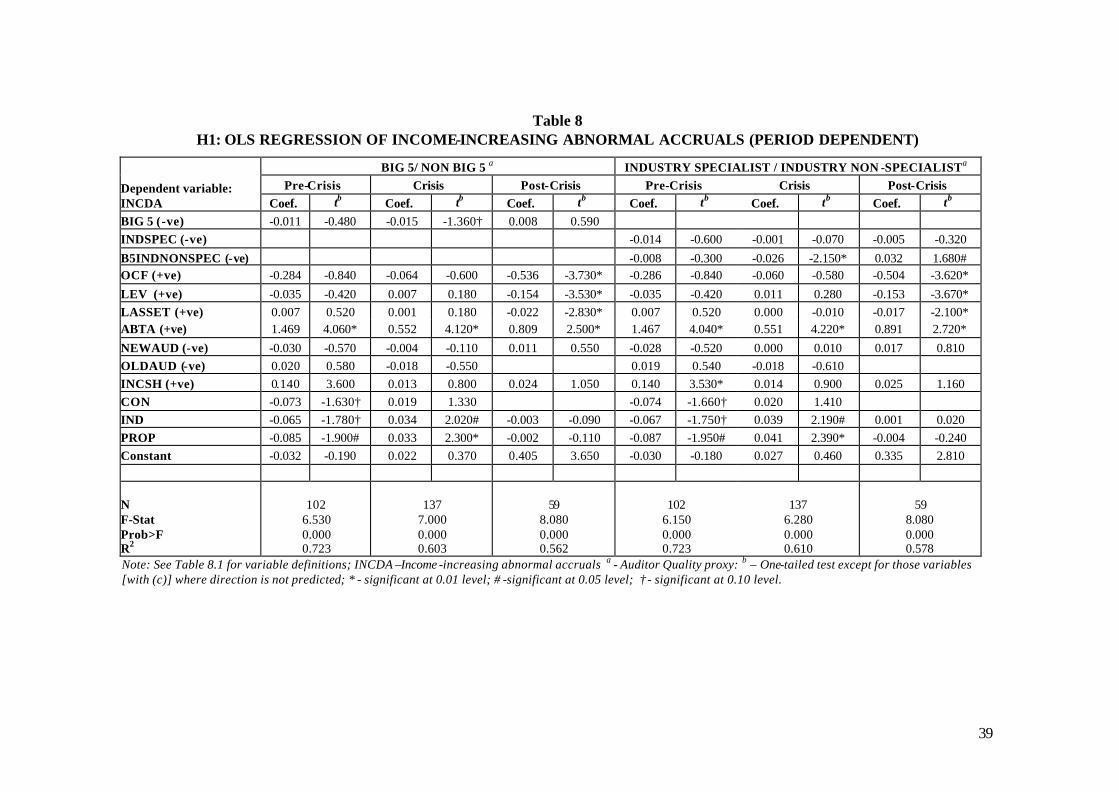
39
Table 8 H1: OLS REGRESSION OF INCOME-INCREASING ABNORMAL ACCRUALS (PERIOD DEPENDENT)
BIG 5/ NON BIG 5 a INDUSTRY SPECIALIST / INDUSTRY NON -SPECIALIST a Pre-Crisis Crisis Post-Crisis Pre-Crisis Crisis Post-Crisis
Dependent variable: INCDA Coef. tb Coef. tb Coef. tb Coef. tb Coef. tb Coef. tb BIG 5 (-ve) -0.011 -0.480 -0.015 -1.360† 0.008 0.590 INDSPEC (-ve) -0.014 -0.600 -0.001 -0.070 -0.005 -0.320 B5INDNONSPEC (-ve) -0.008 -0.300 -0.026 -2.150* 0.032 1.680# OCF (+ve) -0.284 -0.840 -0.064 -0.600 -0.536 -3.730* -0.286 -0.840 -0.060 -0.580 -0.504 -3.620* LEV (+ve) -0.035 -0.420 0.007 0.180 -0.154 -3.530* -0.035 -0.420 0.011 0.280 -0.153 -3.670* LASSET (+ve) 0.007 0.520 0.001 0.180 -0.022 -2.830* 0.007 0.520 0.000 -0.010 -0.017 -2.100* ABTA (+ve) 1.469 4.060* 0.552 4.120* 0.809 2.500* 1.467 4.040* 0.551 4.220* 0.891 2.720* NEWAUD (-ve) -0.030 -0.570 -0.004 -0.110 0.011 0.550 -0.028 -0.520 0.000 0.010 0.017 0.810 OLDAUD (-ve) 0.020 0.580 -0.018 -0.550 0.019 0.540 -0.018 -0.610 INCSH (+ve) 0.140 3.600 0.013 0.800 0.024 1.050 0.140 3.530* 0.014 0.900 0.025 1.160 CON -0.073 -1.630† 0.019 1.330 -0.074 -1.660† 0.020 1.410 IND -0.065 -1.780† 0.034 2.020# -0.003 -0.090 -0.067 -1.750† 0.039 2.190# 0.001 0.020 PROP -0.085 -1.900# 0.033 2.300* -0.002 -0.110 -0.087 -1.950# 0.041 2.390* -0.004 -0.240 Constant -0.032 -0.190 0.022 0.370 0.405 3.650 -0.030 -0.180 0.027 0.460 0.335 2.810
N F-Stat Prob>F R2
102 6.530 0.000 0.723
137 7.000 0.000 0.603
59 8.080 0.000 0.562
102 6.150 0.000 0.723
137 6.280 0.000 0.610
59 8.080 0.000 0.578
Note: See Table 8.1 for variable definitions; INCDA –Income -increasing abnormal accruals a - Auditor Quality proxy: b – One-tailed test except for those variables [with (c)] where direction is not predicted; * - significant at 0.01 level; # -significant at 0.05 level; † - significant at 0.10 level.
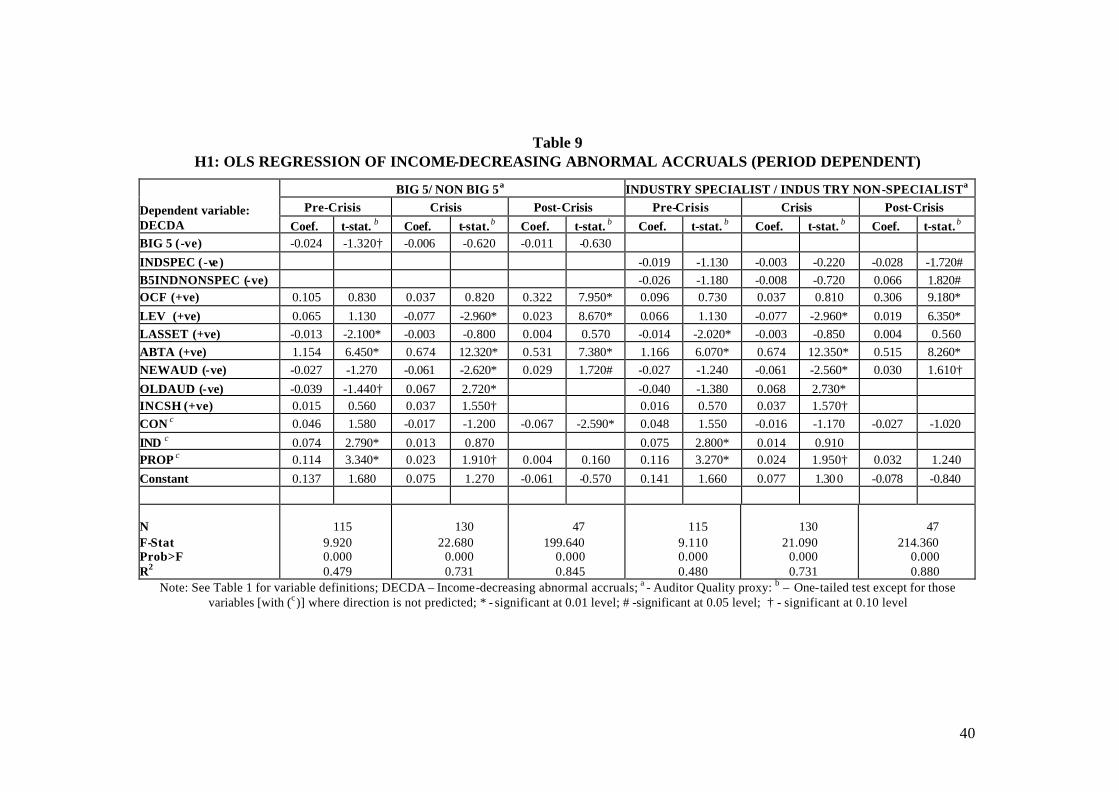
40
Table 9
H1: OLS REGRESSION OF INCOME-DECREASING ABNORMAL ACCRUALS (PERIOD DEPENDENT)
BIG 5/ NON BIG 5a INDUSTRY SPECIALIST / INDUS TRY NON-SPECIALIST a Pre-Crisis Crisis Post-Crisis Pre-Crisis Crisis Post-Crisis
Dependent variable: DECDA Coef. t-stat. b Coef. t-stat. b Coef. t-stat. b Coef. t-stat. b Coef. t-stat. b Coef. t-stat. b BIG 5 (-ve) -0.024 -1.320† -0.006 -0.620 -0.011 -0.630 INDSPEC (-ve ) -0.019 -1.130 -0.003 -0.220 -0.028 -1.720# B5INDNONSPEC (-ve) -0.026 -1.180 -0.008 -0.720 0.066 1.820# OCF (+ve) 0.105 0.830 0.037 0.820 0.322 7.950* 0.096 0.730 0.037 0.810 0.306 9.180* LEV (+ve) 0.065 1.130 -0.077 -2.960* 0.023 8.670* 0.066 1.130 -0.077 -2.960* 0.019 6.350* LASSET (+ve) -0.013 -2.100* -0.003 -0.800 0.004 0.570 -0.014 -2.020* -0.003 -0.850 0.004 0.560 ABTA (+ve) 1.154 6.450* 0.674 12.320* 0.531 7.380* 1.166 6.070* 0.674 12.350* 0.515 8.260* NEWAUD (-ve) -0.027 -1.270 -0.061 -2.620* 0.029 1.720# -0.027 -1.240 -0.061 -2.560* 0.030 1.610† OLDAUD (-ve) -0.039 -1.440† 0.067 2.720* -0.040 -1.380 0.068 2.730* INCSH (+ve) 0.015 0.560 0.037 1.550† 0.016 0.570 0.037 1.570† CON c 0.046 1.580 -0.017 -1.200 -0.067 -2.590* 0.048 1.550 -0.016 -1.170 -0.027 -1.020 IND c 0.074 2.790* 0.013 0.870 0.075 2.800* 0.014 0.910 PROP c 0.114 3.340* 0.023 1.910† 0.004 0.160 0.116 3.270* 0.024 1.950† 0.032 1.240 Constant 0.137 1.680 0.075 1.270 -0.061 -0.570 0.141 1.660 0.077 1.300 -0.078 -0.840
N F-Stat Prob>F R2
115 9.920 0.000 0.479
130 22.680
0.000 0.731
47 199.640
0.000 0.845
115 9.110 0.000 0.480
130 21.090
0.000 0.731
47 214.360
0.000 0.880
Note: See Table 1 for variable definitions; DECDA – Income-decreasing abnormal accruals; a - Auditor Quality proxy: b – One-tailed test except for those variables [with (c)] where direction is not predicted; * - significant at 0.01 level; # -significant at 0.05 level; † - significant at 0.10 level
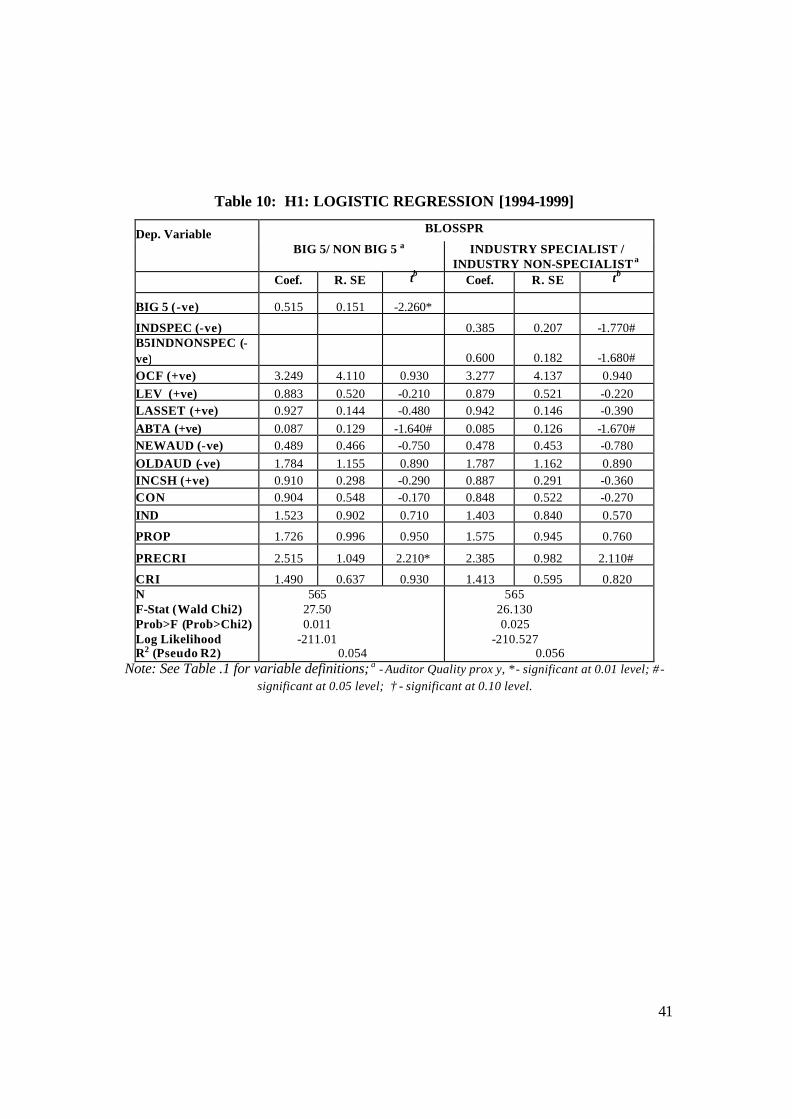
41
Table 10: H1: LOGISTIC REGRESSION [1994-1999]
Dep. Variable BLOSSPR
BIG 5/ NON BIG 5 a INDUSTRY SPECIALIST /
INDUSTRY NON-SPECIALIST a
Coef. R. SE tb Coef. R. SE tb
BIG 5 (-ve) 0.515 0.151 -2.260*
INDSPEC (-ve) 0.385 0.207 -1.770# B5INDNONSPEC (-ve) 0.600 0.182 -1.680# OCF (+ve) 3.249 4.110 0.930 3.277 4.137 0.940 LEV (+ve) 0.883 0.520 -0.210 0.879 0.521 -0.220 LASSET (+ve) 0.927 0.144 -0.480 0.942 0.146 -0.390 ABTA (+ve) 0.087 0.129 -1.640# 0.085 0.126 -1.670# NEWAUD (-ve) 0.489 0.466 -0.750 0.478 0.453 -0.780 OLDAUD (-ve) 1.784 1.155 0.890 1.787 1.162 0.890 INCSH (+ve) 0.910 0.298 -0.290 0.887 0.291 -0.360 CON 0.904 0.548 -0.170 0.848 0.522 -0.270 IND 1.523 0.902 0.710 1.403 0.840 0.570
PROP 1.726 0.996 0.950 1.575 0.945 0.760
PRECRI 2.515 1.049 2.210* 2.385 0.982 2.110#
CRI 1.490 0.637 0.930 1.413 0.595 0.820 N F-Stat (Wald Chi2) Prob>F (Prob>Chi2) Log Likelihood R2 (Pseudo R2)
565 27.50 0.011
-211.01 0.054
565 26.130 0.025
-210.527 0.056
Note: See Table .1 for variable definitions; a - Auditor Quality prox y, *- significant at 0.01 level; # -significant at 0.05 level; † - significant at 0.10 level.
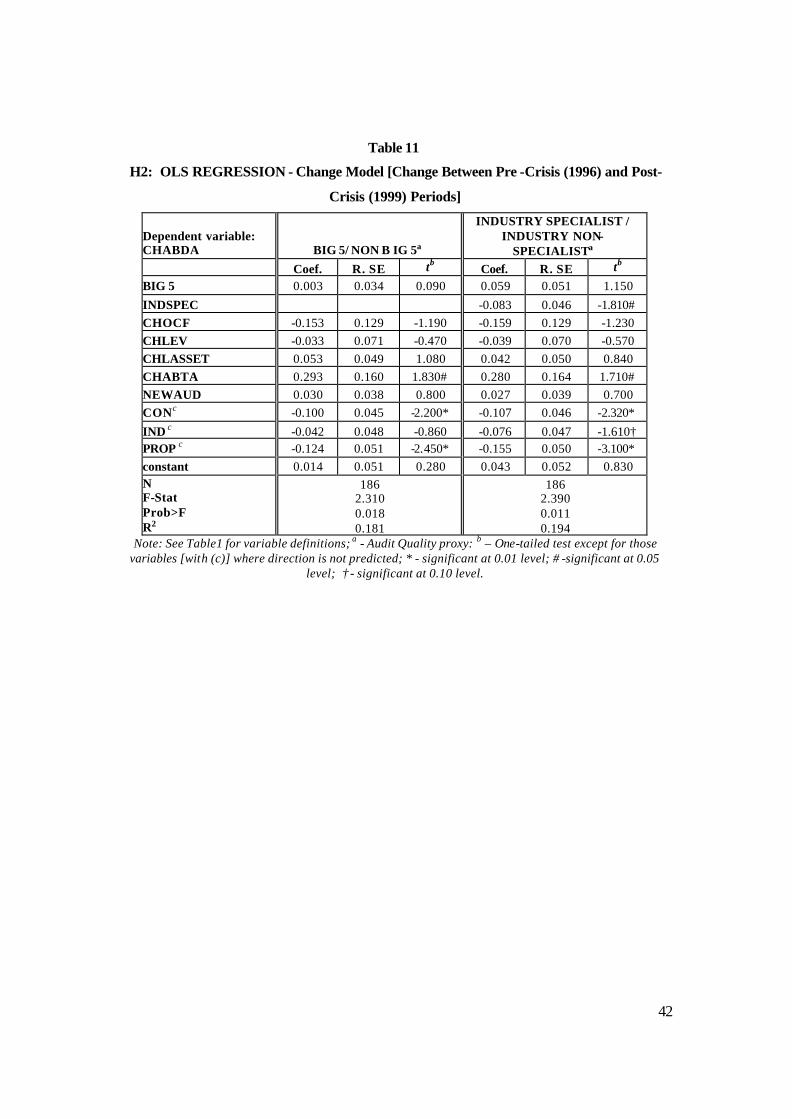
42
Table 11
H2: OLS REGRESSION - Change Model [Change Between Pre -Crisis (1996) and Post-
Crisis (1999) Periods]
Dependent variable: CHABDA BIG 5/ NON B IG 5a
INDUSTRY SPECIALIST / INDUSTRY NON-
SPECIALISTa Coef. R. SE tb Coef. R. SE tb BIG 5 0.003 0.034 0.090 0.059 0.051 1.150 INDSPEC -0.083 0.046 -1.810# CHOCF -0.153 0.129 -1.190 -0.159 0.129 -1.230 CHLEV -0.033 0.071 -0.470 -0.039 0.070 -0.570 CHLASSET 0.053 0.049 1.080 0.042 0.050 0.840 CHABTA 0.293 0.160 1.830# 0.280 0.164 1.710# NEWAUD 0.030 0.038 0.800 0.027 0.039 0.700 CON c -0.100 0.045 -2.200* -0.107 0.046 -2.320* IND c -0.042 0.048 -0.860 -0.076 0.047 -1.610† PROP c -0.124 0.051 -2.450* -0.155 0.050 -3.100* constant 0.014 0.051 0.280 0.043 0.052 0.830 N F-Stat Prob>F R2
186 2.310 0.018 0.181
186 2.390 0.011 0.194
Note: See Table1 for variable definitions; a - Audit Quality proxy: b – One-tailed test except for those variables [with (c)] where direction is not predicted; * - significant at 0.01 level; # -significant at 0.05
level; † - significant at 0.10 level.
43
ENDNOTES 1 The founder member firms are Andersen, BDO, Deloitte Touche, Ernst & Young, Grant Thornton, KPMG and PricewaterhouseCoopers. 2 From 2.2% in 1996 to 4.1% in 1997 and 9.0 in 1998. 3 For example the first half on 1998, 782 petitions, in comparison to 248 issuance of winding up orders for the whole of 1997. 4 Given that IA Ss are generally adopted in the Malaysian environment, and are argued to be more flexible/liberal than the US, UK and to a lesser extent, Australian standards, it is expected greater judgmental interpretation is required. 5 The issuance of a qualified audit opinion does not necessarily provide protection to the auditor against litigation (see Lys and Watts, 1994). 6 Teoh (1992) however argues that a switch in auditor does not necessarily signal ‘bad’ news. Other studies (eg. Shu, 2000; Eichenseher et. al. 1989) find a positive capital market reaction for switches from a non-Big 6 to a Big 6 auditor. 7 The m-Jones (1991) (refer Dechow et. al., 1995) in comparison to the original Jones (1991) model differs with respect to the explanatory variable ‘change in sales’. The Jones (1991) model utilises change in sales, whilst Dechow et. al. (1995) modifies this variable by adjusting for change in receivables. 8 This is done since the time series approach requires at least eight years of data and the current study has available to it limited data for the crisis and especially post-crisis periods, making the time series version not feasible. 9 Total accruals are not derived from cash flows because IAS 7 – Cash Flow Statement was adopted only in 1996. Given the use of this indirect balance sheet approach, it is possible that the computations for the abnormal accruals are erroneous (Hribar and Collins, 2002) and as such may lead biasness with respect to existence of earnings management. Nevertheless due to data constrains this study acknowledges this limitation. 10 Degeorge, et. al. (1999) examined three thresholds. The third threshold, not examined in this study due to unavailability of data, is meeting analysts’ forecasts – examining the distribution frequency of firms meeting or exceeding ‘zero’ forecast errors. 11 Specifically, the t-test is computed as follows (Degeorge et. al., 1999): τn = ∆p(xn) – mean {∆p(xi )} i∈R, i≠n
____________________________
s.d {∆p(xi)} i∈R, i ≠n
where τn = t like test statistic of the desired bin11, ∆p = proportion change of observation that lie in the desired bin with that in the prior bin, xn = a random sample of x of size n (desired bin), xi = balance of sample excluding observations corresponding to n, and s.d = standard deviation 12 Big 5 for this study comprise – Andersen, PricewaterhouseCoopers, Ernst & Young, Deloitte & Touche, and KPMG Peat Marwick. Prior to the Pricewaterhouse and Coopers and Lybrand merger in 1998, the Big 5 is known as the Big 6. 13 International Accounting Standard (IAS) 7 was replaced by Malaysian Accounting Standard Board (MASB) 5 (an adaptation of the IAS) and was operative 1/1/1999. 14 It is acknowledged that the use of this indirect balance sheet approach may result in erroneous abnormal accruals (Hribar and Collins; 2002) and as such poses a limitation to this study. 15 Beneish et. al. (1998) also included a dummy variable to indicate decreased shareholding by 10% or more. This variable is intended to control for possible incentives managers have to manage earnings downward in response to share repurchases. However, this study excludes this variable because share repurchase was introduced only in 1998 in Malaysia and even then, from the sample, share repurchase is very infrequent. 16 As of 23/12/99, 757 companies were listed on the KLSE, while a total of 413 companies were listed in the year 1993. 17 The authors would like to thank Prof Kulwant Singh, Head of the Management Department and the library at the National University of Singapore for their assistance in allowing the use of the database. 18 The authors would like to thank Ayoib Che Ahmad for the use of his data.

44
19 Previous studies on earnings management have excluded financial institutions and utility companies because the existing accruals model may not be able to capture the differences in the accrual process of financial companies and different incentives to manage earnings may exist for utility companies. It is expected both these arguments hold within the Malaysian context, and thus financial institutions and utility companies are excluded from the sample. 20 When absolute discretionary accruals is used as the dependent variable, BIG5 is significant at the p<0.05 level in the respective regressions. For INDSPEC as the measure of audit quality significance is at the p<0.02 level, with industry specialist auditees reporting lower absolute abnormal accruals than industry non-specialist auditees by an average of 4.1 percent of assets. The R2
for this model is 43%.