Embed Size (px)
Citation preview
Non-confidential version
27 February 2012
Audit pricing analysis

Executive Summary 1
1 Introduction 2
2 Quality of the data 3
3 Trends and drivers of audit fees 6
4 Econometric analysis 12
5 Conclusions 18
Appendix 1: Econometric models 19
Appendix 2: Regression results 21
Appendix 3: References 26
Contents
1 Oxera (2006), Competition and Choice in the UK audit market.
2 OFT (2011), UK Audit Services Market – Updated Econometric Analysis of Drivers of Audit Fee Levels, 21st July.
Executive summary
The purpose of this report is to investigate the integrity of the econometric analysis undertaken by Oxera1 and subsequently by the Office of FairTrading (“OFT”)2 regarding the relationship between audit fees and levels of concentration of the UK market for statutory audit services to largecompanies. This analysis was taken into account by the OFT in reaching its decision to refer the market to the Competition Commission (“CC”)for detailed investigation. Given that the CC has published on its web-site a further presentation by Oxera (which is now advising BDO and GrantThornton in relation to the CC investigation) it is possible that the CC may also take the results of the Oxera analysis into account in its owndeliberations. However, as Deloitte has previously expressed in its submissions to the CC, there are significant concerns over the validity of theresults of both Oxera’s and the OFT’s analyses.
Deloitte’s appraisal of the Oxera/OFT analyses has involved a thorough assessment of the data used, the explanatory factors included in the model,and the technical robustness of the model. In all three areas, we have identified significant errors and concerns, and have sought to address thesein estimating a revised model. Our assessment of the Oxera/OFT models shows that their purported findings do not withstand scrutiny due to theiruse of incorrect modelling techniques, poor quality data and the omission of explanatory factors (in particular relating to complexity and risk) thatshould have been included. No weight should therefore be placed on them.
When the model is re-estimated with a more complete set of explanatory factors, and with modelling techniques that are not flawed, the resultsshow that the previous results are spurious, and that there is no demonstrable causal relationship between concentration and audit fees. Audit feesare instead shown to be driven by other factors including changes in complexity resulting from changes in the auditees’ circumstances, changesin regulation, and by the risks to which the auditor is exposed through auditing those companies.
This is an important result as it shows that there is no detriment resulting from changes in the level of concentration in the statutory audit market.The proposition that audit fees are driven by concentration levels is not consistent with how the market for statutory audits operates; it neitherreflects the ongoing and significant competitive pressures in the market, nor takes into account the full range of fee drivers. There are significantcompetitive pressures exerted on each major auditor by the other major auditors as well as pressures exerted by well-informed and professionalaudit committees. In practice the drivers of audit fees are numerous, complex and often highly company specific.
1Audit pricing analysis
3 OFT (2011), UK Audit Services Market – Updated Econometric Analysis of Drivers of Audit Fee Levels, 21st July.
4 Oxera (2006), Competition and Choice in the UK audit market.
5 Deloitte (2011), Initial Submission to the Competition Commission, November 22nd, page 27.
6 Deloitte (2012), Response To Issues Statement, January 12th, paragraph 3.4.
7 PwC (2006), Competition and Choice in the UK audit market – a review of the Oxera report.
8 In this document, confidential information is contained within square brackets. In the accompanying non-confidential version, this has been marked as “[✂]”.
1. Introduction
In its decision to refer the UK market for statutory audit services to the CC, the OFT3 took into account econometric analysis of the relationshipbetween audit fees and levels of concentration that it had undertaken, which updated previous analysis undertaken by Oxera.4 The purpose of thisreport is to investigate the integrity of those previous analyses and to expand on the concerns over the validity of the results of both Oxera’s andthe OFT’s analyses that we expressed in our Initial Submission5 and in our Response to the CC’s Issues Statement.6
The Oxera and the OFT analyses both purport to show that market concentration has been a contributing and causal factor behind increased auditfees in recent years. Some of the problems with the analyses relate to the quality of the data that has been used in the model, but moreimportantly – in terms of the effect of the results – there are significant issues concerning the technical (econometric) details of the modelling, andthe explanatory factors that have been omitted from and not taken into account in the Oxera/OFT models.
The evidence presented in this report shows that:
• The data underpinning the Oxera/OFT analysis contains extensive errors and gaps, requiring up to 30% of the data entries for the key variablesto be added or modified;
• Oxera’s model does not include factors that should have been taken into account as drivers of fees, and it has mis-specified factors it hasincluded (for example by assuming that relevant corporate activity would only be explicitly included as an explanatory variable where acompany’s turnover increased by 40% year on year when evidence shows a more realistic figure to be significantly lower than 40%); and
• Oxera’s analysis contains technical errors (in addition to those previously identified by PwC7) that make its conclusions unreliable.
This report explores these issues in detail.8 It also presents the results of modelling that we have undertaken which addresses Oxera’s errors and isbased on a more appropriate specification of the model. Once the factors that the literature has identified as relevant are incorporated, and themodelling revised, the results of our analysis show that there is no statistically significant relationship between concentration and the level of fees.Audit fees are instead shown to be driven by other factors including changes in complexity resulting from changes in the auditees’ circumstances,changes in regulation, and by the risks to which the auditor is exposed through auditing those companies.
2
Table 1. Fame data availability
Sample 2011 2010 2009 2008 2007 2006 2005 2004 2003 2002
FTSE 350 342 100% 84% 81% 77% 73% 70% 65% 61% 57% 53%
FTSE Small Cap 261 100% 74% 62% 61% 59% 54% 51% 48% 46% 46%
FTSE Fledgling 135 100% 85% 67% 62% 58% 59% 58% 53% 53% 53%
Private companies 142 100% 77% 85% 79% 72% 68% 56% 52% 47% 34%
Source: Deloitte analysis of FAME database
2. Quality of the data
We have sought to replicate, as far as possible, the analysis that Oxera had undertaken using the same data. Oxera’s analysis was based on700 UK listed companies including the FTSE350, FTSE Small Cap, and FTSE Fledgling as well as a sample of private companies. The data used wasextracted from the FAME database, which collates information from companies’ annual returns.
Not having access to the actual dataset that Oxera/OFT used, we have undertaken our own steps to source and verify a relevant dataset extractedfrom the FAME database. However, upon examination it is apparent that the data are unreliable. Not only are there significant gaps in thecompany data extracted from the FAME dataset (in some cases no data are provided for a company for the entire period when that data waspublically available) but we have also identified numerous data points that have been incorrectly and inconsistently recorded from the annualreports.
Most concerning is the discovery that the audit fees, the variable at the crux of the Oxera analysis, has often been incorrectly recorded in theFAME database. In some cases audit services unrelated to the statutory audit or non-audit services have been included in the statutory audit feethus upwardly biasing the audit fee.
We have therefore taken steps to update and correct the database using data from publically available annual reports. We have focused onupdating the variables most relevant to the analysis, following the same sample selection approach as had previously been adopted by Oxera,namely identifying companies that were in the various indices at the end of the period of analysis, and collating data for those companies forthe preceding years.
The dataset that we have used for the econometric analysis is a combination of original FAME dataset and data sourced from company annualreports. We describe in more detail below the issues identified with the FAME dataset and the improvements to the extracted data that we havemade.
Time periodIdeally we would have tested the same dataset as that used by Oxera and the OFT. However, as the FAME dataset only stores a maximum of tenyears’ worth of data for each company at any point in time we were only able to undertake the analysis based on the current FAME dataset forthe period 2002 – 2011, and not for the same period covered by Oxera’s original analysis (1995 – 2004).
In order to assess the impact of correcting the modelling errors identified in Oxera’s original research it has been necessary to re-run Oxera’s modelusing the data from the available time period. The results of this comparison are presented in Section 4 below.
Companies in the sampleWe have followed Oxera’s approach in identifying the current constituents of the FTSE 350, FTSE Small Cap, FTSE Fledging and the 150 largestprivate companies to form the sample set for econometric analysis. Data for each of these companies has been extracted from FAME for the timeperiod available, 2002 – 2011.
It should be stressed that, while the approach for selecting the sample that Oxera adopted allows for a panel model to be constructed for thecompanies in the indices at the end of the period of analysis, it necessarily leads to the exclusion of any company that may have been aconstituent of one of the indices during the last ten years but has since exited. Only constituents in 2011 are included and some of these mayhave only recently had an initial public offering resulting in data not being available for all years. The overall impact of this is that there is adiminishing number of companies in the dataset in earlier years.
In addition, gaps in the data for the key variables Auditor, Audit Fee and Turnover also lead to a declining sample size for the earlier years of theperiod. For example, in 84% of the 342 FTSE350 companies provided by FAME the dataset had data on all three variables in 2010. However, thisfalls to 53% in 2002. This is discussed further below. Table 1 shows the overall decline in the sample size for the earlier years.
3Audit pricing analysis

Table 2: FAME variables
VariablesTable 2 provides an overview of the variables extracted from FAME for each company.
# Variable Description
1 FTSE Index FTSE 350, FTSE Small Cap, FTSE Fledgling, Private company
2 Audit fee Total fee to auditor for group statutory audit – will include international fee and is not UK only.
3 Company turnover Total revenue for audited group.
4 International turnover International turnover
5 Company industry Industry based on SIC (Service industry code)
6 Auditor name Name of auditor by year
7 Total assets Total assets (total current and non-current assets)
8 SIC code SIC – Service industry code for audited company
9 Accounts receivable Accounts receivable of audited company
10 Inventory Inventory of audited firm. Not relevant for all companies.
11 Current assets Current assets of audited company
12 Debt/Equity ratio Gearing ratio of audited company
Audit feesA review of the audit fee data included in the FAME dataset has identified a number of inconsistencies when compared to the audit fees recordedin the published company annual reports. These errors included:
• data that are simply omitted;
• the misspecification of currencies – for example, some entries were in US Dollars and not in Sterling; and
• incorrect recording of audit fees – for example, fees for the group audit, audit of subsidiaries and for non-audit services are inconsistentlyreported.
It is essential that the audit fees included in the data are correct and not over- or under-stated because they are pivotal to the econometricanalysis. To remedy this, we have undertaken an extensive data collection exercise to collect audit fees from company annual reports for theFTSE350 companies for the years 2002 – 2011.
A sample of audit fees in the FAME dataset for the FTSE Small cap and FTSE Fledging companies was tested and there were fewer errors relativeto the FTSE350. As the financial statements of the companies in these two indices tend to be less complex than the FTSE350, there may be alower likelihood of the inclusion of incorrect figures. Accordingly, correct audit fees were only collected from Annual Reports for the FTSE350 andthe raw, uncorrected FAME dataset has been used for companies in the other indices.
AuditorThe name of the auditor was collected alongside the audit fee for the FTSE350 companies. Although there are fewer errors in the FAME datasetregarding the identification of the auditor, there are a significant number of errors and omissions. As set out in Table 3 below, we have added oramended 10% of the data entries for auditor, hence significantly reducing the number of data gaps.
RevenueWe have checked the company revenue data extracted from FAME for those companies where outliers were identified. Outliers were identified inthe FAME dataset for FTSE350 companies for any year where there was greater than a 100% change in the audit fee to revenue ratio. The auditfees and revenue figures for these identified outliers were then checked against annual reports for the relevant periods to identify whether thesechanges reflected errors or were the result of genuine changes (such as mergers, acquisitions or disposals) for the companies in question. Themost common source of FAME revenue recording error was inconsistency in the figure taken from the annual report to represent revenue in eachyear. This was a particular issue in the finance and gambling industries due to the nature of revenue generation. For example:
• Revenues in FAME have been incorrectly reported for financial companies such as JP Morgan American Investment Trust and Edinburgh DragonTrust. Inconsistencies arise as in some years revenue is reported as interest revenue while in other years total capital gains or losses are used. This has led to apparently large percentage changes in revenue between years that do not reflect changes in the position of the companies.
• FAME also includes inconsistent reporting of revenues for William Hill and Ladbrokes, both in the gambling sector. For a period of years thevalue of wagers was recorded whilst in another the actual revenue was taken.
4

Table 3. Percentage of data corrections for FTSE350 summary
Variable 2011 2010 2009 2008 2007 2006 2005 2004 2003 2002 Total
Audit fee 3% 17% 19% 19% 19% 19% 30% 29% 27% 24% 21%
Turnover 0% 1% 2% 1% 2% 1% 1% 1% 1% 1% 1%
Auditor 2% 6% 8% 9% 10% 10% 9% 9% 10% 9% 8%
Source: Deloitte analysis of FAME dataset and company annual reports
Overall our data cleansing exercise has shown that the FAME dataset is incomplete and of poor quality. It is worth noting that the level ofinaccuracy is greatest in the earlier years of the database – including three of the years that Oxera used in their analysis. As Oxera’s econometricfindings are entirely based on this dataset, and the Oxera paper does not describe what, if any, data cleansing it had undertaken, this raisesconcerns about the impact that the identified weaknesses in the dataset have had on the results.
9 We note that PwC has included a figure presenting international turnover as a percentage of total turnover in their response to the Statement of Issues atparagraph 3.4. However, it is also clear from the notes provided that PwC has combined data from various sources in constructing that Figure. This carries risksof inconsistency in the data.
10 Given the errors that were identified with these particular variables, it is certain that there are further inconsistencies in the data that have not yet beencorrected.
Where such errors were identified annual reports were used to correct the data and to ensure consistency across the period. However, given thepoor quality of data for the outlier companies that were identified there are no doubt further, less prominent, errors that still exist within thedataset.
International turnoverThe Oxera analysis makes use of the International turnover variable from the FAME dataset as an indicator of audit complexity. Many companiesincluded in the sample have global operations which increases the complexity of the audit. However financial statements are commonly presentedat the aggregate or regional (or supra-national) level and so it is not always possible to identify turnover that is either ‘International’ or ‘Domestic’.In such cases international turnover is reported in FAME as a zero value which is misleading and fails to signal that the company has internationaloperations.
We have sought to identify an alternative variable that would indicate the added complexity that the audit of an international company entails.Unfortunately as companies do not consistently report the number of countries in which they operate and do not report turnover by internationaland domestic segments (in fact for some of the companies in the sample it would be difficult to define what constitutes domestic turnover) asatisfactory proxy has not been identified.9
Summary of data changesTable 3 provides an overview of the percentage of data points for the 880 companies in the Deloitte sample where either corrections or additionshave been made in respect of the three key variables: Audit Fee, Turnover and Auditor. Given the importance of these variables in the econometricmodelling, and the likelihood that Oxera and the OFT have performed no similar data cleansing (since they make no comments on data cleansing)the scale of this data correction is a matter of some concern.
Across the period where Annual Report data were readily available (2002 – 2010) a minimum of 17% of data points relating to audit fees in eachyear have been either corrected or added to the dataset (where previously omitted), with a maximum of 30% of all audit fees in 2005 requiringamendment. Given the approach of only updating turnover figures that were identified as outliers, there is a less dramatic 1-2% correction torecorded turnover data.10 However, the name of the company auditor is corrected for approximately 10% of companies. This correction isparticularly concerning as this data should be readily and reliably sourced from annual reports.
5Audit pricing analysis

3. Trends and drivers of audit fees
6
This section discusses the drivers of audit fees. It begins by setting out a list of the main drivers of audit fees that have been discussed in theliterature analysing audit fees. Next, it presents analysis of the main drivers of audit fees. This is supported both by analysis of trends drawn fromthe updated FAME dataset and a qualitative analysis of audit fee drivers based on information provided by Deloitte audit team.11 This qualitativeanalysis of audit fee drivers is particularly relevant when discussing econometric models of audit fees that necessarily involve some simplification ofthe relevant audit fee drivers.
Overview of audit fee driversA review of some of the relevant literature12 indicates that statutory audit fees are likely to be determined by many if not all of the followingfactors:
• audit complexity, driven by the relative complexity of the auditee’s operations and business model;
• audit quality;
• company size/complexity;
• geographic spread;
• organisational structure of the auditee;
• companies’ financial systems and control processes;
• the regulatory environment and changes to that environment;
• the risk to which the auditor is exposed;
• audit staff costs;
• exchange rates;
• corporate activity, involving mergers and acquisitions and demergers;
• audit efficiency;
• pressure from buyers exerted through the annual renegotiation procedures adopted by auditees; and
• the industry in which the company operates.
In seeking to model the drivers of audit fees and in particular to identify whether there is any evidence that prices are or have been driven byincreased concentration among the major auditors, it is important to control for these factors. This is supported by the analysis presented below.
Audit fees and scale
Audit fees and company turnoverFigure 1 presents the average audit fee to turnover ratio for the companies in the FTSE 100, FTSE 250 and FTSE 350. This provides an indication ofchanges in audit fees, while controlling for the impact of turnover on audit fees.13
11 We have discussed with [✂] of our audit engagement teams various possible drivers of audit fees to identify reasons for changes in audit fees from one year tothe next. These discussions have been with engagement managers (and partners) of FTSE 100, FTSE 250, FTSE Small Cap, FTSE Fledgling and Large Privateclients.
12 See Appendix 3 for a list of references.
13 The relationship between turnover and audit fees is complex, and depends not only on the level of turnover, and the risks inherent in the sector of the auditee,but when auditees are growing, it also depends on how that growth is achieved. For example, an acquisition of a firm within the same jurisdiction would lead toa one-off impact on audit fees while integration is achieved, whereas an acquisition in another jurisdiction to enter a new geographic market would lead to one-off costs, as well as higher ongoing costs.

Audit pricing analysis 7
This indicates that, although there has been movement in audit fees over the years, there is no evidence of any upwards trend. In fact, thismeasure of price has fallen since 2003, other than between 2009 and 2010, and is at a similar level to that in 2002.
FTSE100 FTSE250 FTSE350
Figure 1. Audit fee to turnover ratio trend
Source: Deloitte analysis of FAME dataset and company annual reports
Aud
it f
ee /
Turn
over
0.00020
0.00040
0.00060
0.00080
0.00100
0.00120
0.00140
0.00160
2010200920082007200620052004200320022001
FTSE100 FTSE250
20022001 2003 2004 2005 2006 2007 2008 2009 2010
FTSE350
Figure 2. Annual percentage change in audit fee to turnover ratio
Source: Deloitte analysis of FAME dataset and company annual reports
% c
hang
e in
aud
it f
ee/t
urno
ver
-20
-15
-10
-5
0
5
10
15
20
25
As well as reflecting economies of scale, a potential driver of this relationship is the pressure that large auditees place on auditors’ pricing. A significant proportion of audit teams have provided specific examples of cost pressures driving down audit fees. For example, one auditmanager told us that Deloitte was subjected to significant pressure from his client to reduce the audit fee given the client’s difficult tradingposition and their focus on cost control throughout the business. This pressure contributed to an [✂]% reduction in the audit fee in 2011.
In addition to pricing pressure from auditees, fees can be reduced through the achievement of efficiencies on the part of the auditor that are thenpassed on to auditees. The opportunity for such efficiency improvements may be expected to be greater where the underlying audit client islarger. The number of examples of efficiency improvements driving audit fees highlighted by audit teams was similar to the number of instanceswhere cost pressure from clients was cited as a fee driver.
Figure 2 further reinforces the finding that whilst there have been changes in audit fees as a percentage of turnover these changes have beenboth positive and negative.

Asset size as a driver of audit feesThe importance of size – which may be considered a proxy for complexity and risk - in driving audit fees can be examined not just in terms ofturnover but also the overall size of the asset base. The significance of the size of the asset base is noted in the literature,14 as a potentiallyrelevant driver of audit fees.
Accordingly, as an initial test of the potential relationship between audit fees and the turnover or asset measures, we have calculated thecorrelation coefficients for these variables. While the correlation coefficient provides no insight into the causality of movement between twovariables, where close relationships are observed in accordance with expectations, this provides a sound reason to incorporate the measure inmore detailed econometric modelling.
In this regard, it is striking that while the correlation between audit fees and turnover and audit fees and total assets are both high (over 0.8), thecorrelation with assets was highest. Further, the correlation between turnover and total assets was significantly lower, indicating that thecorrelations of these two variables with audit fees are driven by different factors.
The ratio of audit fee to total assets has been averaged over time for the FTSE 350 sample companies and presented in Figure 3. The ratio hasbeen persistently declining since 2002 for both FTSE 100 and FTSE 250 companies. The average ratio for FTSE 250 companies is consistentlyhigher than that of the FTSE 100, mirroring the trend for the audit fee to turnover relationship. This supports the proposition that audits of largercompanies may benefit from some economies of scale.
14 See for example, Simunic (1980), The Pricing of Audit Services: Theory and Evidence, Journal of Accounting Research
FTSE100 FTSE250 FTSE350
Figure 3. Audit fee to total asset ratio trend
Source: Deloitte analysis of FAME dataset and company annual reports
Aud
it f
ee /
Tota
l ass
ets
0
0.0001
0.0002
0.0003
0.0004
0.0005
0.0006
0.0007
0.0008
0.0009
201020092008200720062005200420032002
Audit teams also emphasised the relationship between company size, scope and audit fees. A large number of [✂] examples of organic changesin company size were cited by audit teams as driving a change in audit fees from one year to the next. This was usually in relation to entry intonew markets or geographies or changes to company structure (such as number of subsidiaries).
The analysis presented here supports the inclusion of a Total assets variable in econometric modelling of the drivers of audit fees. This is set out inthe next section. However, it should be recognised that size, measured by either turnover or asset base, is at best a proxy for the complexity ofaudit, which will depend on the specific circumstances of each auditee. Many of these idiosyncratic features cannot be easily captured in a marketmodel on a systematic basis, but can be expected to have a significant impact on fees. For example, changes in company complexity was reportedas a driver of audit fees by a significant proportion [✂] of the Deloitte audit teams questioned but such changes may be quite specific in nature.Thus, one audit team noted that the movement of their client’s corporate headquarters to [✂], which entailed no substantive change to thecountries in which the auditee was active, led to a significant increase in costs and, correspondingly, a higher audit fee. Such changes to corporatecomplexity are difficult to find reflected in any generic variable that may be defined on a common basis across all companies.
8
Other audit fee drivers
RegulationGiven that statutory audits are a legal requirement that must adhere to specific standards, changes to the regulatory environment have asignificant impact on the required scope of audit services. The introduction of Sarbanes-Oxley in 2002 is such an example. This is particularlyrelevant for the current analysis as the changes resulting from Sarbanes-Oxley were coincident with a change in the structure of the audit marketresulting from the dissolution of the Andersen business. More demanding reporting requirements were introduced together with an increasedfocus on audit risk by auditors which together led to an upward pressure on audit fees. Similarly, changes to IFRS over the years that haveintroduced more rigorous reporting standards have also had the impact of increasing audit fees. In particular, the 2005 transition from UK GAAPto IFRS increased the reporting requirements and audit scope for UK listed companies.
A significant minority of audit teams [✂] cited regulation as a driver of changes in audit fees. These typically related to IFRS, Sarbanes Oxley,changes in listing regulations and other industry specific regulations (especially in financial services). For example, the audit manager for oneFTSE Small Cap client noted that adoption of IFRS in 2009 contributed to a £[✂] increase in audit fees for that year (£[✂] of this increase wasnon-recurring).
Industry differentials and compositional effectsAudit fees may also be driven by the industry sector in which the audited company operates because the different characteristics of differentsectors can have an impact on the complexity of the audit. To highlight this point, the average audit fee to turnover ratios for each main industrysector are presented in Figure 4.
Agriculture and mining 1 General services
Real estate activities Trade
Transport, storage, communications
Insurance Light manufacture Machinery and Equipment Other financial intermediation
Banks Chemicals, Wood, Publishing Construction Electricity, gas, water supply
Figure 4. Industry average audit fee to turnover ratio - FTSE 350
Source: Deloitte analysis of FAME dataset and company annual reports
Aud
it f
ee/t
urno
ver
0.00
0.02
0.04
0.06
0.08
0.10
0.12
2001 2002 2003 2004 2005 2006 2007 2008 2009 2010
1
2
2
3
3
5
7
13
8 10
10
11 12
4
4 6
7
5 86
9
9
11 12 13
Figure 4 shows that there is a wide dispersion between the levels of audit fee/turnover ratios for each industry. Industries that have higher thanaverage audit fees include: Other financial intermediation, Insurance, Real Estate and Agriculture and mining. This is not unexpected as theseindustries incorporate more complex transaction structures in comparison to other industries such as Trade or Construction. Changes in the mix ofsectors represented in the indices could therefore have a significant impact on the aggregate relationship between audit fees observed andturnover. This needs to be controlled for in the modelling (as indeed Oxera have done).
Wage trendsStaff wage costs represent the single most important cost for Deloitte and other professional services firms, with the ongoing success of Deloittein the audit and the other markets in which it operates dependent on the recruitment of high calibre staff. To maintain successful recruitment anddeliver the quality demanded by our clients, investors and regulators, Deloitte must provide competitive wages that both attract and retain thebest graduates and experienced professionals.
In a competitive market, increases in the marginal cost of delivering a service (that affect all operators in an industry equally) will be expected tobe passed through to consumers of those services.15 This is a somewhat counter-intuitive result, but leads to the conclusion that the morecompetitive the downstream market, the greater the proportion of cost increases that would be passed on to customers.
15 This is analogous to the pass-on defence in a damages case, whereby the margins earned by customers of a cartelised input would not experience any directimpact from the unduly high input cost, as any overcharge would in turn be passed on to their customers.
9Audit pricing analysis

Figure 5 presents the movement in wages and audit fees over time. While this does not control in any manner for changes in input requirements(in other words, whether more hours of work were required to undertake audits over time), it should be noted that the trends in audit fees andstaff costs of the operators providing those audit services (proxied with an index of professional staff salaries in London) are highly correlated;growth between 2003 to 2007 for both wages and audit fees are followed by a period of low or negative growth after 2008.
16 It is important to note that this analysis does not capture all of the FTSE 100 switches that took place between 2002 and 2009. This is because, consistent withOxera’s approach, the focus is on the constituents of the FTSE 100 in 2011. Given that the constituents of the FTSE 100 would have changed over time, thisanalysis does not capture switches made by companies that were FTSE 100 constituents prior to 2011 (and subsequently fell out of the FTSE 100).
17 Similarly for the FTSE 250, the 43 switches do not represent all of the FTSE 250 switches across the time period as our data set does not capture the change inconstituents of the FTSE 250 index over time.
Average FTSE 350 Audit Fees Professional wage - London
Figure 5. Nominal wage growth trend
Source: Audit fee data, FAME and Annual reports. Annual average wage data for London based Professional Occupations sourced from the ONS, Annual Survey of Hours and Earnings, Table 15.7a Annual pay – Gross 2002 -2011
2001 2002 2003 2004 2005 2006 2007 2008 2009 2010
Ave
rage
aud
it f
ee F
TSE
350,
£ '0
00s
Average professional w
age – London, £s
0
500
1,000
1,500
2,000
2,500
0
5,000
10,000
15,000
20,000
25,000
30,000
35,000
40,000
45,000
50,000
SwitchingThe Deloitte updated FAME dataset identifies the auditor, and therefore enables changes in the auditor to be identified which in turn enables therelationship between audit fees and switching to be analysed. We considered the FTSE 100 switches that took place between 2002 and 2009,16
and the percentage change in audit fees that was concurrent with the change in auditor. Of the 12 switches identified, fees increased for8 companies, decreased for 1 company and stayed constant for 3 companies in the year of the switch. As this highlights, there are frequentlyother changes that happen at the same time as an auditor switch and it is therefore necessary to control for those other events before the impactof switching on audit fees can be isolated.
A similar analysis has been undertaken for companies in the FTSE250 that switched between 2002 and 2010.17 This shows diversity similar to thatobserved for the FTSE100 companies that switched. Of the 43 FTSE 250 switches in this time period, audit fees increased for 20 companies,decreased for 18 companies and remained constant for 5 companies.
Corporate activityCorporate activity was among the most common reasons cited by audit teams for a change in absolute audit fee. This corporate activity took anumber of forms, including mergers, demergers and divestments. Examples of this include the following:
• In 2006, a FTSE 250 company was involved in a reverse takeover of another listed company. The increased scale of the company’s operationsand complexity of the audit in the year of the transaction contributed to an increase in the audit fee of [✂]% compared to the previous year.
• In 2007, a conglomerate made acquisitions in [✂]. These acquisitions contributed to an increase in the audit fee of approximately [✂]% for thatyear.
• In 2007, one of our audit clients acquired a significant subsidiary and this contributed to an increase of approximately [✂]% in their audit feefor that year.
Audit managers informed us that mergers and acquisitions tend to result in fee increases because there are costs associated with combining twoaudit processes (those of the acquiring and acquired parties) and defining a new integrated audit approach. Such merger and acquisition activitymay have only a transitory effect on the audit fee, while the systems of the merged entity are combined. But merger and acquisition activity mayalso generate a step change in required audit fees, such as may occur for example, where an acquisition enables a company to enter a newgeography.
10

18 The audit manager for the client told us that during this process, a large audit firm competitor provided an unsolicited proposal for the client’s audit, offering a [✂] per cent discount on the fees that we were charging. As a result, our audit team worked with the client to establish efficiency savings which could be madeand this resulted in a fee reduction of [✂] per cent.
While Oxera/OFT include a variable to capture the effects of corporate activity in their analysis, our review of available evidence has highlightedconcerns about Oxera’s specification of the proxy it uses for corporate activity. A “merger” is defined by Oxera as an increase in company turnoverof 40% or more from one year to the next. However, the experience of our audit teams shows that this 40% threshold is somewhat arbitrary andis in any case set at too high a threshold. We have identified many examples of corporate activity leading to fee changes, but at turnover changesfar below the 40% threshold which Oxera (and subsequently the OFT) use. For example:
• In 2007, a FTSE 250 company was involved in an acquisition; the audit fee increased by 50% in this year however, turnover only increased by17%.
• In 2004, one of our FTSE 250 clients was involved in two acquisitions, which contributed to an [✂]% increase in audit fees. In this year, theincrease in turnover was less than 10%.
Therefore, in the Oxera/OFT models, the impact of a significant driver of fees is defined incorrectly and as such is incorrectly measured. As a result,the estimated causal effect of the merger variable will be biased, and will not capture all of the impact that corporate activity has had on auditfees.
Fee negotiation processOne factor which cannot be straightforwardly included in empirical models of audit fees but which should be considered is the negotiationprocess which is involved in agreeing the audit fee each year.
We have found a number of examples of clients exerting downward pressure on audit fees outside of an actual or threatened tender. By way ofexample, during 2011 we were asked to perform an extensive exercise for one of our FTSE 100 clients to demonstrate to the audit committeewhy we continued to be the best external auditor for the client (looking at audit quality, audit fees, etc). The process was treated internally asequivalent to a formal tender and we made significant investment in the process. This process was ultimately successful and resulted inreappointment.18 A further example involved one of our FTSE Small Cap clients, which had received a lower quote from one of our competitors.This led us to reconsider the audit fee and resulted in a reduction in the audit fee.
The annual fee negotiation process is often particularly rigorous and lengthy. For example, the audit partner for a major multi-national client toldus that “a detailed audit fee negotiation takes place every year. The client’s central finance team requests detailed analysis of fees per underlyingunit as well as hours for each Deloitte global office (to enable the client to compare the $/h recover for each unit). Negotiations start at theunderlying unit level, then further negotiations are held with the Group Reporting Manager and Financial Controller, and finally the CFO. The feeitself will then be debated at the planning Audit Committee meeting before being formally approved. The process itself takes up a significantamount of time. For the FY11 audit fee, the negotiation took over four months to finalise.”
There were also a number of examples of clients conducting fee benchmarking exercises.
SummaryThe factors identified in this section provide a solid basis for assessing which factors to incorporate within a model of audit fees. As has beennoted, Oxera/OFT incorporate some of these, but, importantly, fail to include most of the broader set, and have mis-specified the variable that isused to proxy for merger and acquisition activity. These omissions and mis-specification could have biased the results. In the following section, wedescribe the modelling approaches we have adopted, and compare the results achieved with our re-estimation of the Oxera/OFT model.
11Audit pricing analysis
12
The key findings from our review of the econometric analysis undertaken by Oxera and the OFT are that:
• The econometric models used to estimate the effects of market share and Herfindahl- Hirschman Indices (“HHIs”)19 on audit fees are incorrectlyspecified, undermining the validity of the conclusions reached; and
• The significant measurement errors in the FAME dataset raise concerns about the validity of the Oxera/OFT findings.
This section discusses the technical errors in the econometric model specified by Oxera and then presents Deloitte’s revised model and results.
Overview of the Oxera and OFT methodologyThe OFT, in their review of the Oxera analysis, claim that there is evidence to support the hypothesis that auditors with larger market shares exhibitgreater market power (comprising an ability to charge a fee higher than cost) and that an increase in concentration in the provision of auditservices is associated with an increase in audit fees. This evidence is based on the estimates of an econometric model using the FAME dataset overthe period 1995-2004 and subsequently updated by the OFT, to examine the period 2001-2010. Both studies find that auditor share20 and marketconcentration, as measured by the HHI, have a positive and significant effect on audit fees after controlling for the effects of other influencingfactors. In particular, the OFT report concludes that a doubling of auditor-share and HHI would lead to increases in audit-fees of 5% and 16%respectively.
As standard when constructing an econometric model, both Oxera and the OFT include a number of cost-side and demand side explanatoryfactors in addition to market concentration. These additional explanatory factors include turnover as a measure of audited company size,international turnover as a measure of a company’s complexity, the cumulative number of times an audited company has switched auditor overthe time period reflecting potential bargaining power and the cumulative number of mergers undertaken by the audited company.
Further variables are also included to capture the different characteristics across markets, industries and time-periods that potentially drive auditfees. Finally, the models also include the audit-fee paid in the previous year as an explanatory variable, which is justified by Oxera on the groundsthat the negotiated fee for each year is closely related to the fee in the previous year after any necessary adjustments have been taken intoaccount.21
Econometric issuesAn econometric model allows the modeller to specify and test for relationships between audit fees and the casual factors identified. Oxera and theOFT measure the effects of these explanatory variables on audit fee using two standard econometric methods: the fixed effects and the randomeffects models. However, when the explanatory factors include the previous period’s audit fee (a ‘lagged dependent variable’), neither of theseapproaches is appropriate. Technically, these estimators do not make the adjustments that are necessary when the previous year’s audit fee isincluded as an explanatory factor (a ‘lagged dependent variable’), and the estimates produced are not reliable.22 Specifically, the coefficientestimates will be biased and inconsistent estimates of the true causal effects. This is a crucial factor that has a significant bearing on the validityof the results.
Recognising the issues raised by the inclusion of the lagged audit fee variables in the model, the correct approach is to use an alternative method,such as an Arellano-Bond estimator, that produces consistent estimators. Such methods are well documented in the econometrics literature.23
This is the method that we have applied in the modelling results presented below.
4. Econometric analysis
19 HHI (Herfindahl-Hirschman Index) is a widely used indictor of the level of concentration in a particular industry. In this case it is calculated by summing the squareof each auditor’s market share by industry and year.
20 Share is defined as the percentage of total audit fees in a particular year and industry earned by an auditor.
21 The previous year’s audit fee is likely to represent the starting point for any negotiation over audit fees; however, an auditee’s position in a subsequent year maybe very different to that in the previous year for the reasons noted in paragraph 8.9 of Deloitte’s response to the Statement of Issues.
22 For the parameter estimates to be consistent under random/fixed effects, the explanatory variables must be uncorrelated with the error terms. The laggeddependent variable is correlated with the individual specific effect by definition; the random/fixed effects estimators will be inconsistent as the resulting withinand GLS transformations still yield right hand side (explanatory) variables that are correlated with the transformed error. The Arellano-Bond estimator insteadproceeds by taking a first difference and then using lagged values of the dependent variable in time t-2 as instruments for the resulting lagged differencedvariable. This yields a GMM estimator that is consistent.
23 See Cameron(2006): Microeconometrics, Cambridge University Press p.763
Audit pricing analysis 13
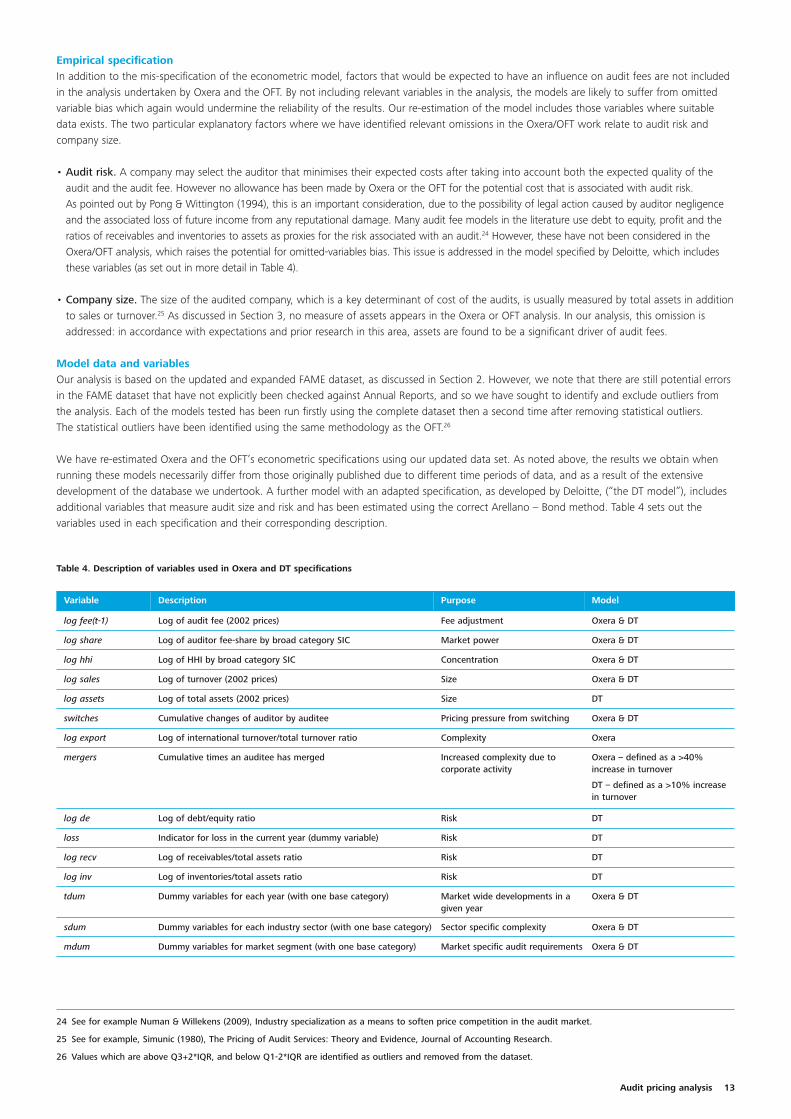
Empirical specificationIn addition to the mis-specification of the econometric model, factors that would be expected to have an influence on audit fees are not includedin the analysis undertaken by Oxera and the OFT. By not including relevant variables in the analysis, the models are likely to suffer from omittedvariable bias which again would undermine the reliability of the results. Our re-estimation of the model includes those variables where suitabledata exists. The two particular explanatory factors where we have identified relevant omissions in the Oxera/OFT work relate to audit risk andcompany size.
• Audit risk. A company may select the auditor that minimises their expected costs after taking into account both the expected quality of theaudit and the audit fee. However no allowance has been made by Oxera or the OFT for the potential cost that is associated with audit risk. As pointed out by Pong & Wittington (1994), this is an important consideration, due to the possibility of legal action caused by auditor negligenceand the associated loss of future income from any reputational damage. Many audit fee models in the literature use debt to equity, profit and theratios of receivables and inventories to assets as proxies for the risk associated with an audit.24 However, these have not been considered in theOxera/OFT analysis, which raises the potential for omitted-variables bias. This issue is addressed in the model specified by Deloitte, which includesthese variables (as set out in more detail in Table 4).
• Company size. The size of the audited company, which is a key determinant of cost of the audits, is usually measured by total assets in additionto sales or turnover.25 As discussed in Section 3, no measure of assets appears in the Oxera or OFT analysis. In our analysis, this omission isaddressed: in accordance with expectations and prior research in this area, assets are found to be a significant driver of audit fees.
Model data and variablesOur analysis is based on the updated and expanded FAME dataset, as discussed in Section 2. However, we note that there are still potential errorsin the FAME dataset that have not explicitly been checked against Annual Reports, and so we have sought to identify and exclude outliers fromthe analysis. Each of the models tested has been run firstly using the complete dataset then a second time after removing statistical outliers.The statistical outliers have been identified using the same methodology as the OFT.26
We have re-estimated Oxera and the OFT’s econometric specifications using our updated data set. As noted above, the results we obtain whenrunning these models necessarily differ from those originally published due to different time periods of data, and as a result of the extensivedevelopment of the database we undertook. A further model with an adapted specification, as developed by Deloitte, (“the DT model”), includesadditional variables that measure audit size and risk and has been estimated using the correct Arellano – Bond method. Table 4 sets out thevariables used in each specification and their corresponding description.
24 See for example Numan & Willekens (2009), Industry specialization as a means to soften price competition in the audit market.
25 See for example, Simunic (1980), The Pricing of Audit Services: Theory and Evidence, Journal of Accounting Research.
26 Values which are above Q3+2*IQR, and below Q1-2*IQR are identified as outliers and removed from the dataset.
Table 4. Description of variables used in Oxera and DT specifications
Variable Description Purpose Model
log fee(t-1) Log of audit fee (2002 prices) Fee adjustment Oxera & DT
log share Log of auditor fee-share by broad category SIC Market power Oxera & DT
log hhi Log of HHI by broad category SIC Concentration Oxera & DT
log sales Log of turnover (2002 prices) Size Oxera & DT
log assets Log of total assets (2002 prices) Size DT
switches Cumulative changes of auditor by auditee Pricing pressure from switching Oxera & DT
log export Log of international turnover/total turnover ratio Complexity Oxera
mergers Cumulative times an auditee has merged Increased complexity due tocorporate activity
Oxera – defined as a >40%increase in turnover
DT – defined as a >10% increasein turnover
log de Log of debt/equity ratio Risk DT
loss Indicator for loss in the current year (dummy variable) Risk DT
log recv Log of receivables/total assets ratio Risk DT
log inv Log of inventories/total assets ratio Risk DT
tdum Dummy variables for each year (with one base category) Market wide developments in agiven year
Oxera & DT
sdum Dummy variables for each industry sector (with one base category) Sector specific complexity Oxera & DT
mdum Dummy variables for market segment (with one base category) Market specific audit requirements Oxera & DT

14
Standard errors in parentheses* p < 0.05, ** p < 0.01, *** p < 0.001
Following extensive data cleansing, the Deloitte updated FAME dataset consists of a sample of 372 UK listed companies (332 when excludingoutliers) covering the FTSE 350, FTSE Small Cap and FTSE Fledgling indices and a sample of the largest private companies.
The dependent variable (audit fees) averages £756,000 across the sample, with a maximum of nearly £40 million. The mean exceeds the median,indicating that the distribution of fees is positively skewed.
Company turnover averages £2.1 billion across the sample and the average value of total assets per company is £4.1 billion.
International turnover (the variable ‘exports’ in Oxera’s specification) – defined as the ratio of sales outside the UK to total sales – has an averageof 50%. The maximum values exceed 100% in some cases which, as discussed in Section 3 indicates an obvious variable-measurement error.
The remaining variables are auditor share with an average of 24%, industry HHI with an average of 3235, cumulative auditee switching, mergers,loss indicators, gearing and the ratios of inventories and receivables to total assets. Following Oxera and the OFT, time-specific variables are alsoincluded in both models to allow for market-wide effects in specific years to be controlled for in the model. This would capture the impact of theimplementation of more demanding regulatory requirements in a particular year.
Model resultsUsing the updated dataset, we have re-estimated the Oxera and OFT models using the (inconsistent) fixed effects and random effects techniques.A further specification as adapted by Deloitte (DT model) which also includes the lagged (log) audit fee was estimated using the consistentArellano-Bond method. The parameter estimates of these models using the full sample (i.e. without excluding outliers) are presented in Table 5.The results presented here exclude the parameter estimates of the dummy variables; see Appendix 2 for the full results. The most noteworthyfinding is that no measure of concentration (neither market share nor HHI), has significant explanatory power in the Deloitte model. There istherefore no statistical evidence to show that an increase in concentration leads to an increase in audit fees when the parameters are beingestimated consistently.
Table 5. Estimates of Oxera, OFT and Deloitte models (including outliers)
(1) (2) (3) (4) (5)
Oxera_RE Oxera_FE OFT_RE OFT_FE DT
L.lfee 0.7648*** 0.3436*** 0.7746*** 0.4974*** 0.2129*
(0.0272) (0.0487) (0.0373) (0.0453) (0.0872)
lsales 0.1126*** 0.1861** 0.1229*** 0.2165** 0.1659*
(0.0143) (0.0710) (0.0232) (0.0759) (0.0704)
lshare 0.0302*** 0.0622*** 0.0413* 0.0649 0.0362
(0.0074) (0.0152) (0.0181) (0.0330) (0.0337)
lhhi 0.2131 0.1390 0.2486 0.0801 0.0402
(0.1154) (0.1182) (0.1406) (0.1550) (0.1116)
switches -0.0190 -0.0961** -0.0344 -0.1314* -0.0812
(0.0190) (0.0351) (0.0372) (0.0598) (0.0640)
export_oxera 0.2245*** 0.0000
(0.0404) (.)
mergers -0.0000 0.0488* 0.0142 0.0321 -0.0296
(0.0058) (0.0228) (0.0081) (0.0205) (0.0184)
export 0.1117* -0.0561
(0.0504) (0.1188)
mdum_250 -0.0174
(0.0345)
lassets 0.3772***
(0.0544)
Lde 0.0348*
(0.0167)
loss 0.0586*
(0.0233)
lrecv 0.0288
(0.0301)
linv 0.0030
(0.0096)
N 1952 1952 829 829 1667
N_g 274.0000 274.0000 191.0000 191.0000 372.0000
F 47.6952 47.1782
chi2 3.50e+04 7681.8426 338.4783
Audit pricing analysis 15
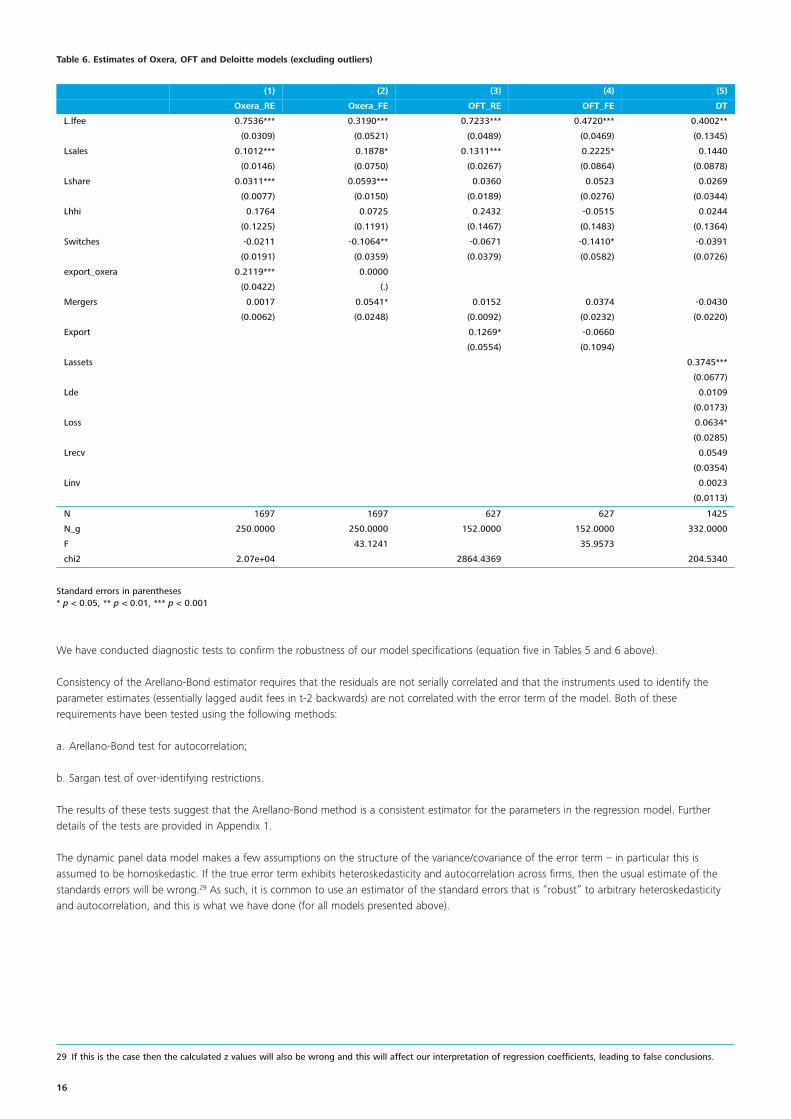
The DT model varies from the Oxera model in several respects. First, the variable for exports (international turnover) has been omitted due to themeasurement error of international turnover previously raised. The merger variable has also been redefined to reflect a more realistic change inturnover of 10% or more (as discussed in Section 3).
Due to the nature of the Arellano-Bond estimation technique the industry dummies have been removed from the Deloitte specification.27 This doesnot have a negative impact on the ability of the model to explain audit fees, nor does it affect the estimation of the remaining parameters.
Additional variables have been incorporated in the DT model to take into account risk and audit complexity. These include the company’s assets,gearing (measured by the debt to equity ratio), a loss indicator, and ratios of accounts receivable and inventory to assets. The regression resultsfrom the DT model indicate that, in addition to lagged audit fees, turnover, assets, gearing and a loss in the current year have a causal effectsignificantly different from zero in determining audit fees. Accounts receivable and inventory have not been demonstrated to have a significantcausal effect.
There is no evidence that concentration is a driver of audit fees; variables that are more indicative of the complexity and risk of audit servicesprove to have more explanatory power.
The same set of five models has been re-run after excluding outliers from the dataset. These results are set out in Table 6. The results presentedhere exclude the parameter estimates of the dummy variables; see Appendix 2 for the full results. As a result of excluding outliers, the turnoverand gearing variables (debt to equity ratio) are no longer significant in the DT model and instead the only significant estimates are those forlagged audit fee, total assets and loss.28 The market concentration variables remain insignificant in this version of the DT specification.
Our results can be interpreted as follows:
• A 100% increase in total assets leads to a 37% increase in audit fees;
• A 100 % increase in lagged audit fee leads to a 40% increase in audit fees; and,
• On average, audit fees are 6.3% higher for firms that incur a loss in the current year than for companies that do not incur a loss in the currentyear.
27 The Arellano-Bond methodology involves first-differencing of variables to remove the individual effect before GMM is applied. As a consequence time-invariantvariables such as industry dummies cannot be identified in the model.
28 Total assets is significant at the 0.1% significance level, lagged audit fee is significant at the 1% significance level and the loss variable is significant at the 5% significance level.
16
29 If this is the case then the calculated z values will also be wrong and this will affect our interpretation of regression coefficients, leading to false conclusions.
Standard errors in parentheses* p < 0.05, ** p < 0.01, *** p < 0.001
Table 6. Estimates of Oxera, OFT and Deloitte models (excluding outliers)
(1) (2) (3) (4) (5)
Oxera_RE Oxera_FE OFT_RE OFT_FE DT
L.lfee 0.7536*** 0.3190*** 0.7233*** 0.4720*** 0.4002**
(0.0309) (0.0521) (0.0489) (0.0469) (0.1345)
Lsales 0.1012*** 0.1878* 0.1311*** 0.2225* 0.1440
(0.0146) (0.0750) (0.0267) (0.0864) (0.0878)
Lshare 0.0311*** 0.0593*** 0.0360 0.0523 0.0269
(0.0077) (0.0150) (0.0189) (0.0276) (0.0344)
Lhhi 0.1764 0.0725 0.2432 -0.0515 0.0244
(0.1225) (0.1191) (0.1467) (0.1483) (0.1364)
Switches -0.0211 -0.1064** -0.0671 -0.1410* -0.0391
(0.0191) (0.0359) (0.0379) (0.0582) (0.0726)
export_oxera 0.2119*** 0.0000
(0.0422) (.)
Mergers 0.0017 0.0541* 0.0152 0.0374 -0.0430
(0.0062) (0.0248) (0.0092) (0.0232) (0.0220)
Export 0.1269* -0.0660
(0.0554) (0.1094)
Lassets 0.3745***
(0.0677)
Lde 0.0109
(0.0173)
Loss 0.0634*
(0.0285)
Lrecv 0.0549
(0.0354)
Linv 0.0023
(0.0113)
N 1697 1697 627 627 1425
N_g 250.0000 250.0000 152.0000 152.0000 332.0000
F 43.1241 35.9573
chi2 2.07e+04 2864.4369 204.5340
We have conducted diagnostic tests to confirm the robustness of our model specifications (equation five in Tables 5 and 6 above).
Consistency of the Arellano-Bond estimator requires that the residuals are not serially correlated and that the instruments used to identify theparameter estimates (essentially lagged audit fees in t-2 backwards) are not correlated with the error term of the model. Both of theserequirements have been tested using the following methods:
a. Arellano-Bond test for autocorrelation;
b. Sargan test of over-identifying restrictions.
The results of these tests suggest that the Arellano-Bond method is a consistent estimator for the parameters in the regression model. Furtherdetails of the tests are provided in Appendix 1.
The dynamic panel data model makes a few assumptions on the structure of the variance/covariance of the error term – in particular this isassumed to be homoskedastic. If the true error term exhibits heteroskedasticity and autocorrelation across firms, then the usual estimate of thestandards errors will be wrong.29 As such, it is common to use an estimator of the standard errors that is “robust” to arbitrary heteroskedasticityand autocorrelation, and this is what we have done (for all models presented above).

Audit pricing analysis 17
We note that the inclusion of a lagged dependent variable and a time specific dummy variable in the Arellano-Bond estimator may lead to abiased standard error due to the high level of collinearity, given the relatively small time sample. As such, to confirm the validity of our results, wehave also estimated the standard-errors using the paired boot-strap method. The parameter estimates and boot-strap standard errors are set outin Table 7. The results presented here exclude the parameter estimates of the dummy-variables (see Appendix 2 for the full results).
Table 7 shows that the bootstrapped standard errors are broadly similar to the robust standard errors, with the exception that the merger variableis now significant based on these standard-error estimates. Market share and HHI remain insignificant in this specification. Thus, usingbootstrapped standard errors confirms the consistency and robustness of our model.
Standard errors in parentheses* p < 0.05, ** p < 0.01, *** p < 0.001
(6)
DT
L.lfee 0.4002***
(0.1177)
lsales 0.1440
(0.0962)
lshare 0.0269
(0.0294)
lhhi 0.0244
(0.1176)
switches -0.0391
(0.0640)
mergers -0.0430*
(0.0207)
lassets 0.3745***
(0.0660)
Lde 0.0109
(0.0159)
loss 0.0634*
(0.0259)
lrecv 0.0549
(0.0345)
linv 0.0023
(0.0104)
N 1667
N_g 372.0000
F
chi2 338.4783
Table 7. Estimates of Deloitte model (excluding outliers) with bootstrapped standard errors

18
This report has investigated the validity of the original conclusions of Oxera, later supported by the OFT, that there has been a positive causalrelationship between market concentration and audit fees in the UK audit market in recent years, It is evident from the analysis presented in thisnote that these results are not robust due to both the poor quality of the dataset employed and serious errors in the econometric analysisperformed.
Oxera base their findings on the FAME dataset. Through analysis and cross checking of a more recent version of a FAME dataset sample we havefound the data to be incomplete and in some cases erroneous. Upward biases in the recording of audit fees by FAME are of particular concern.The poor quality and unreliability of this data would lead to inconsistent estimates of the effects of share, HHI and other variables in theeconometric model, due to data measurement error. Notwithstanding the other empirical issues identified in this report, this alone is reasonenough to call the Oxera analysis into question.
Most concerning is that the econometric model specified by Oxera suffers from fundamental technical errors. As the previous year’s audit fee wasincluded in the model, it was incorrect to have used either the fixed or random effects approaches. The Oxera and OFT models also failed toincorporate sufficient variables to capture the impact of audit risk and complexity which we found to be significant.
After replicating the Oxera model with an improved specification and appropriate methodology, we have found that the estimated effects ofmarket share and market concentration do not significantly differ from zero. This refutes the claim by the OFT that there is a positive relationshipbetween higher market concentration and audit fees.
5. Conclusions
Audit pricing analysis 19
The purpose of this appendix is to provide a more comprehensive overview of the econometric models that we have estimated to support ourevaluation of the Oxera pricing analysis.
As discussed in the previous sections, the reliability of the FAME dataset that Oxera and the OFT have used is questionable. Whilst we haveundertaken a data collection exercise to improve the data quality measurement error may still be present in the data. Taking this into account wehave estimated each of the models twice, once with and once without including outliers. Outliers have been identified using the same method asthe OFT in the econometric analysis that was undertaken to support their consultation document. Any value that is more than two inter-quartileranges above the upper or below the lower quartile is excluded from the data sample.
All price sensitive data (i.e. audit fees, turnover, exports, assets, accounts receivable and inventory) have been inflation adjusted to 2002 prices.
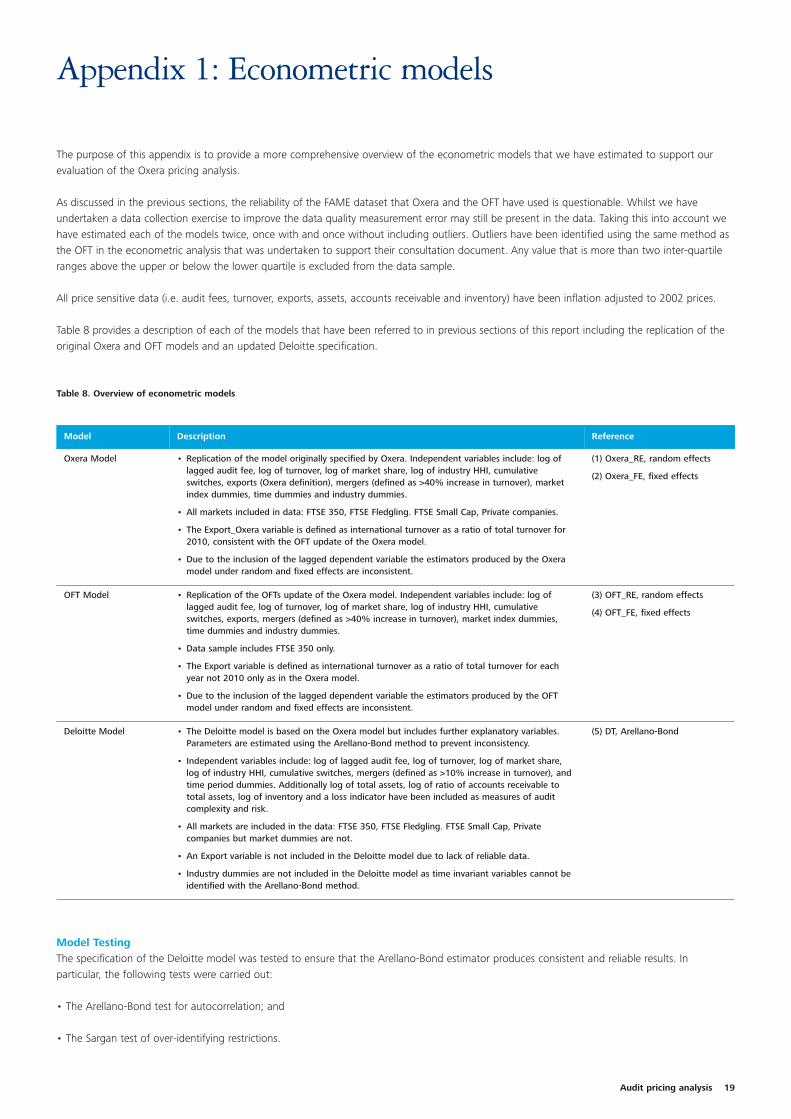
Table 8 provides a description of each of the models that have been referred to in previous sections of this report including the replication of theoriginal Oxera and OFT models and an updated Deloitte specification.
Appendix 1: Econometric models
Model TestingThe specification of the Deloitte model was tested to ensure that the Arellano-Bond estimator produces consistent and reliable results. Inparticular, the following tests were carried out:
• The Arellano-Bond test for autocorrelation; and
• The Sargan test of over-identifying restrictions.
Table 8. Overview of econometric models
Model Description Reference
Oxera Model • Replication of the model originally specified by Oxera. Independent variables include: log oflagged audit fee, log of turnover, log of market share, log of industry HHI, cumulativeswitches, exports (Oxera definition), mergers (defined as >40% increase in turnover), marketindex dummies, time dummies and industry dummies.
• All markets included in data: FTSE 350, FTSE Fledgling. FTSE Small Cap, Private companies.
• The Export_Oxera variable is defined as international turnover as a ratio of total turnover for2010, consistent with the OFT update of the Oxera model.
• Due to the inclusion of the lagged dependent variable the estimators produced by the Oxeramodel under random and fixed effects are inconsistent.
(1) Oxera_RE, random effects
(2) Oxera_FE, fixed effects
OFT Model • Replication of the OFTs update of the Oxera model. Independent variables include: log oflagged audit fee, log of turnover, log of market share, log of industry HHI, cumulativeswitches, exports, mergers (defined as >40% increase in turnover), market index dummies,time dummies and industry dummies.
• Data sample includes FTSE 350 only.
• The Export variable is defined as international turnover as a ratio of total turnover for eachyear not 2010 only as in the Oxera model.
• Due to the inclusion of the lagged dependent variable the estimators produced by the OFTmodel under random and fixed effects are inconsistent.
(3) OFT_RE, random effects
(4) OFT_FE, fixed effects
Deloitte Model • The Deloitte model is based on the Oxera model but includes further explanatory variables.Parameters are estimated using the Arellano-Bond method to prevent inconsistency.
• Independent variables include: log of lagged audit fee, log of turnover, log of market share,log of industry HHI, cumulative switches, mergers (defined as >10% increase in turnover), andtime period dummies. Additionally log of total assets, log of ratio of accounts receivable tototal assets, log of inventory and a loss indicator have been included as measures of auditcomplexity and risk.
• All markets are included in the data: FTSE 350, FTSE Fledgling. FTSE Small Cap, Privatecompanies but market dummies are not.
• An Export variable is not included in the Deloitte model due to lack of reliable data.
• Industry dummies are not included in the Deloitte model as time invariant variables cannot beidentified with the Arellano-Bond method.
(5) DT, Arellano-Bond
20
30 Note that first order or AR(1) type autocorrelation will reject by definition, due to the error being in first differences. This is not a cause for concern.
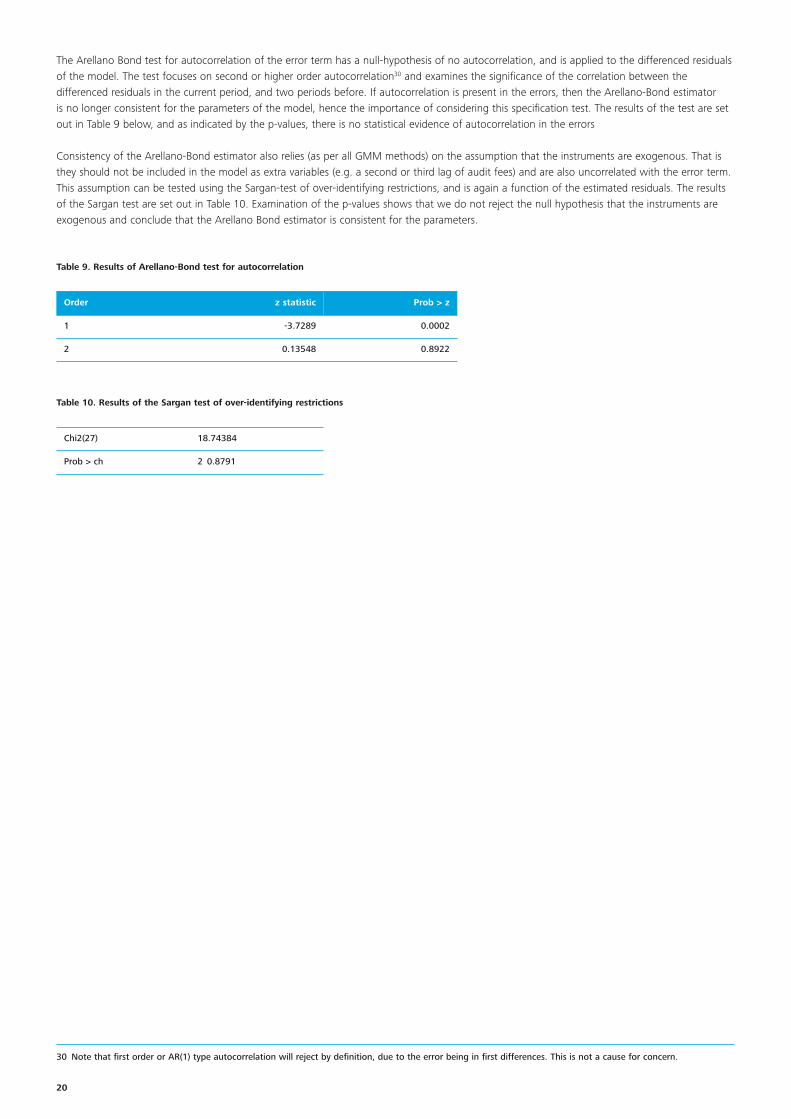
The Arellano Bond test for autocorrelation of the error term has a null-hypothesis of no autocorrelation, and is applied to the differenced residualsof the model. The test focuses on second or higher order autocorrelation30 and examines the significance of the correlation between thedifferenced residuals in the current period, and two periods before. If autocorrelation is present in the errors, then the Arellano-Bond estimatoris no longer consistent for the parameters of the model, hence the importance of considering this specification test. The results of the test are setout in Table 9 below, and as indicated by the p-values, there is no statistical evidence of autocorrelation in the errors
Consistency of the Arellano-Bond estimator also relies (as per all GMM methods) on the assumption that the instruments are exogenous. That isthey should not be included in the model as extra variables (e.g. a second or third lag of audit fees) and are also uncorrelated with the error term.This assumption can be tested using the Sargan-test of over-identifying restrictions, and is again a function of the estimated residuals. The resultsof the Sargan test are set out in Table 10. Examination of the p-values shows that we do not reject the null hypothesis that the instruments areexogenous and conclude that the Arellano Bond estimator is consistent for the parameters.
Table 9. Results of Arellano-Bond test for autocorrelation
Order z statistic Prob > z
1 -3.7289 0.0002
2 0.13548 0.8922
Table 10. Results of the Sargan test of over-identifying restrictions
Chi2(27) 18.74384
Prob > ch 2 0.8791

Audit pricing analysis 21
This appendix presents the full results of the regressions which we have run, including parameter estimates for all dummy variables.
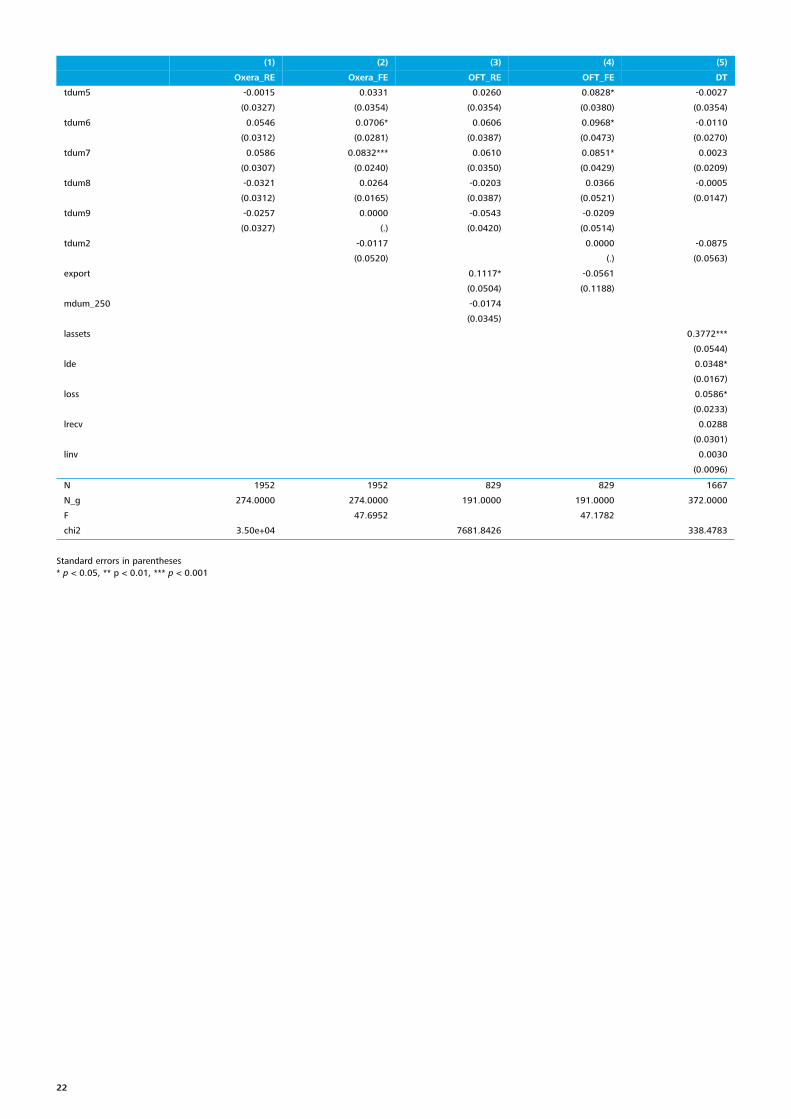
Using an updated data set, we have re-estimated the Oxera and OFT models using the (inconsistent) fixed effects and random effects techniques.A further specification as adapted by Deloitte (DT model) which also includes the lagged (log) audit fee was estimated using the consistentArellano-Bond method. The parameter estimates of these models using the full-sample (i.e. without excluding outliers) are presented in Table 11below. In our model, no measure of concentration (neither market share nor HHI) has significant explanatory power.
Appendix 2: Regression results
Table 11. Estimates of Oxera, OFT and Deloitte models (including outliers) – full form
(1) (2) (3) (4) (5)
Oxera_RE Oxera_FE OFT_RE OFT_FE DT
L.lfee 0.7648*** 0.3436*** 0.7746*** 0.4974*** 0.2129*
(0.0272) (0.0487) (0.0373) (0.0453) (0.0872)
lsales 0.1126*** 0.1861** 0.1229*** 0.2165** 0.1659*
(0.0143) (0.0710) (0.0232) (0.0759) (0.0704)
lshare 0.0302*** 0.0622*** 0.0413* 0.0649 0.0362
(0.0074) (0.0152) (0.0181) (0.0330) (0.0337)
lhhi 0.2131 0.1390 0.2486 0.0801 0.0402
(0.1154) (0.1182) (0.1406) (0.1550) (0.1116)
switches -0.0190 -0.0961** -0.0344 -0.1314* -0.0812
(0.0190) (0.0351) (0.0372) (0.0598) (0.0640)
export_oxera 0.2245*** 0.0000
(0.0404) (.)
mergers -0.0000 0.0488* 0.0142 0.0321 -0.0296
(0.0058) (0.0228) (0.0081) (0.0205) (0.0184)
mdum_sc -0.0622**
(0.0203)
mdum_f -0.1091**
(0.0337)
mdum_p -0.0931*
(0.0427)
sdum1 -0.0893 0.0134
(0.0655) (0.0822)
sdum2 0.1065 0.1102
(0.0887) (0.1124)
sdum3 -0.1091* 0.0008
(0.0503) (0.0668)
sdum4 -0.1169* -0.0757
(0.0486) (0.0715)
sdum5 -0.2023* -0.1940
(0.0809) (0.1128)
sdum6 -0.0227 0.0414
(0.0552) (0.0619)
sdum7 0.2224*** 0.1434
(0.0672) (0.1029)
sdum8 -0.2069*** -0.1598*
(0.0593) (0.0762)
sdum9 -0.0915 0.0429
(0.0486) (0.0614)
sdum10 -0.1448 -0.1655
(0.0983) (0.1404)
sdum11 0.0162 0.0968
(0.0613) (0.0803)
sdum12 -0.0921 -0.0180
(0.0568) (0.0656)
tdum3 0.0408 0.0387 0.0929* 0.0990* -0.0424
(0.0284) (0.0454) (0.0376) (0.0411) (0.0517)
tdum4 0.0413 0.0648 0.0838** 0.1161** -0.0264
(0.0250) (0.0398) (0.0320) (0.0367) (0.0437)
22
(1) (2) (3) (4) (5)
Oxera_RE Oxera_FE OFT_RE OFT_FE DT
tdum5 -0.0015 0.0331 0.0260 0.0828* -0.0027
(0.0327) (0.0354) (0.0354) (0.0380) (0.0354)
tdum6 0.0546 0.0706* 0.0606 0.0968* -0.0110
(0.0312) (0.0281) (0.0387) (0.0473) (0.0270)
tdum7 0.0586 0.0832*** 0.0610 0.0851* 0.0023
(0.0307) (0.0240) (0.0350) (0.0429) (0.0209)
tdum8 -0.0321 0.0264 -0.0203 0.0366 -0.0005
(0.0312) (0.0165) (0.0387) (0.0521) (0.0147)
tdum9 -0.0257 0.0000 -0.0543 -0.0209
(0.0327) (.) (0.0420) (0.0514)
tdum2 -0.0117 0.0000 -0.0875
(0.0520) (.) (0.0563)
export 0.1117* -0.0561
(0.0504) (0.1188)
mdum_250 -0.0174
(0.0345)
lassets 0.3772***
(0.0544)
lde 0.0348*
(0.0167)
loss 0.0586*
(0.0233)
lrecv 0.0288
(0.0301)
linv 0.0030
(0.0096)
N 1952 1952 829 829 1667
N_g 274.0000 274.0000 191.0000 191.0000 372.0000
F 47.6952 47.1782
chi2 3.50e+04 7681.8426 338.4783
Standard errors in parentheses* p < 0.05, ** p < 0.01, *** p < 0.001

Audit pricing analysis 23
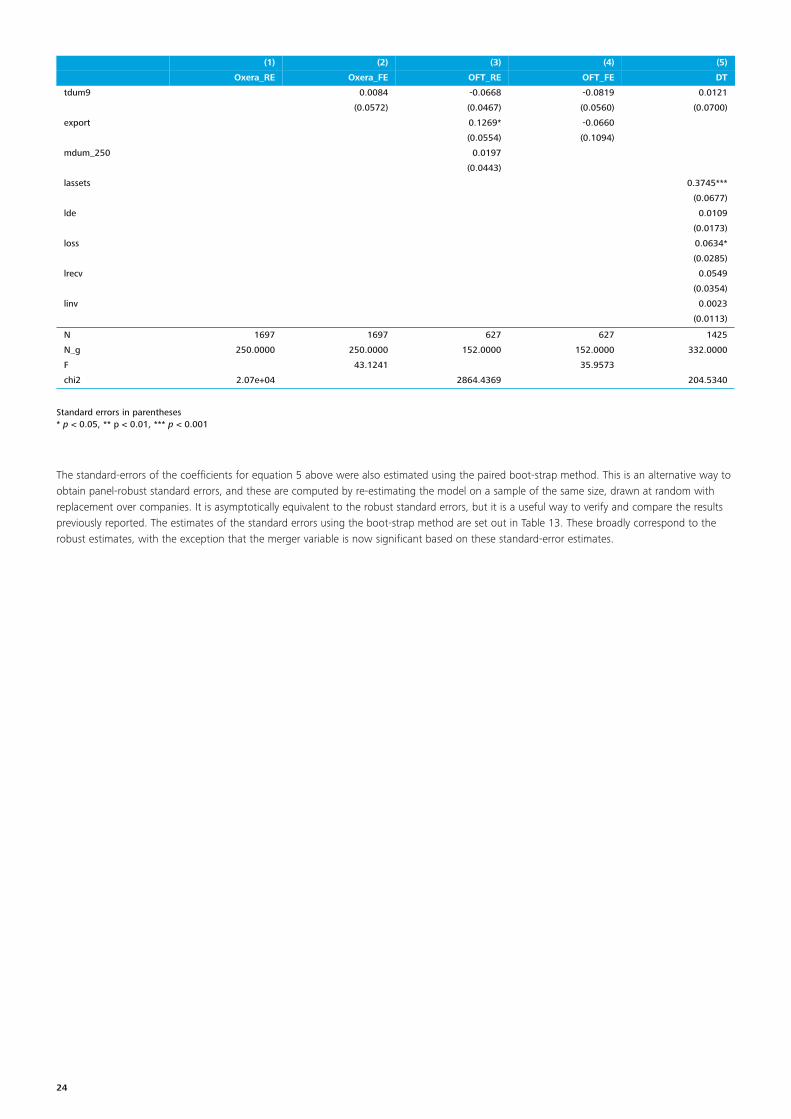
The same set of five models has been re-run after excluding outliers from the dataset. These results are set out in Table 12 below. As a result ofexcluding outliers the turnover and gearing variables are no longer significant in the DT model and instead the only significant estimates are thosefor lagged audit fee, total assets and loss. The market concentration variables remain insignificant in this version of the DT specification.
Table 12. Estimates of Oxera, OFT and Deloitte models (excluding outliers) – full form
(1) (2) (3) (4) (5)
Oxera_RE Oxera_FE OFT_RE OFT_FE DT
L.lfee 0.7536*** 0.3190*** 0.7233*** 0.4720*** 0.4002**
(0.0309) (0.0521) (0.0489) (0.0469) (0.1345)
lsales 0.1012*** 0.1878* 0.1311*** 0.2225* 0.1440
(0.0146) (0.0750) (0.0267) (0.0864) (0.0878)
lshare 0.0311*** 0.0593*** 0.0360 0.0523 0.0269
(0.0077) (0.0150) (0.0189) (0.0276) (0.0344)
lhhi 0.1764 0.0725 0.2432 -0.0515 0.0244
(0.1225) (0.1191) (0.1467) (0.1483) (0.1364)
switches -0.0211 -0.1064** -0.0671 -0.1410* -0.0391
(0.0191) (0.0359) (0.0379) (0.0582) (0.0726)
export_oxera 0.2119*** 0.0000
(0.0422) (.)
mergers 0.0017 0.0541* 0.0152 0.0374 -0.0430
(0.0062) (0.0248) (0.0092) (0.0232) (0.0220)
mdum_sc -0.0589**
(0.0197)
mdum_f -0.1295***
(0.0359)
mdum_p -0.0857*
(0.0419)
sdum1 -0.0761 0.0914
(0.0761) (0.0898)
sdum2 0.0837 0.1934
(0.0946) (0.1356)
sdum3 -0.1139 0.0326
(0.0624) (0.0747)
sdum4 -0.1187* -0.0147
(0.0573) (0.0802)
sdum5 -0.2252* -0.1485
(0.0922) (0.1214)
sdum6 -0.0344 0.1039
(0.0650) (0.0730)
sdum7 0.2229** 0.2826***
(0.0747) (0.0854)
sdum8 -0.1954** -0.1483
(0.0682) (0.0889)
sdum9 -0.1024 0.0847
(0.0609) (0.0724)
sdum10 -0.1668 -0.1225
(0.1107) (0.1444)
sdum11 0.0165 0.1826*
(0.0686) (0.0875)
sdum12 -0.0914 0.0587
(0.0678) (0.0775)
tdum2 0.0211 0.0000 0.0000
(0.0353) (.) (.)
tdum3 0.0784* 0.0577* 0.0847* 0.0683 0.0132
(0.0311) (0.0258) (0.0399) (0.0425) (0.0231)
tdum4 0.0785** 0.0866** 0.0980** 0.0956* 0.0178
(0.0278) (0.0266) (0.0339) (0.0367) (0.0336)
tdum5 0.0253 0.0471 0.0129 0.0419 0.0137
(0.0331) (0.0355) (0.0389) (0.0381) (0.0475)
tdum6 0.0826** 0.0845* 0.0699 0.0599 0.0064
(0.0277) (0.0401) (0.0400) (0.0475) (0.0481)
tdum7 0.0885*** 0.1019* 0.0476 0.0306 0.0148
(0.0247) (0.0454) (0.0379) (0.0438) (0.0603)
tdum8 -0.0146 0.0344 -0.0294 -0.0166 -0.0018
(0.0232) (0.0515) (0.0403) (0.0525) (0.0691)
24
(1) (2) (3) (4) (5)
Oxera_RE Oxera_FE OFT_RE OFT_FE DT
tdum9 0.0084 -0.0668 -0.0819 0.0121
(0.0572) (0.0467) (0.0560) (0.0700)
export 0.1269* -0.0660
(0.0554) (0.1094)
mdum_250 0.0197
(0.0443)
lassets 0.3745***
(0.0677)
lde 0.0109
(0.0173)
loss 0.0634*
(0.0285)
lrecv 0.0549
(0.0354)
linv 0.0023
(0.0113)
N 1697 1697 627 627 1425
N_g 250.0000 250.0000 152.0000 152.0000 332.0000
F 43.1241 35.9573
chi2 2.07e+04 2864.4369 204.5340
Standard errors in parentheses* p < 0.05, ** p < 0.01, *** p < 0.001
The standard-errors of the coefficients for equation 5 above were also estimated using the paired boot-strap method. This is an alternative way toobtain panel-robust standard errors, and these are computed by re-estimating the model on a sample of the same size, drawn at random withreplacement over companies. It is asymptotically equivalent to the robust standard errors, but it is a useful way to verify and compare the resultspreviously reported. The estimates of the standard errors using the boot-strap method are set out in Table 13. These broadly correspond to therobust estimates, with the exception that the merger variable is now significant based on these standard-error estimates.

Audit pricing analysis 25
Table 13. Estimates of Deloitte model (excluding outliers) with bootstrapped standard errors – full form
(6)
DT
L.lfee 0.4002***
(0.1177)
lsales 0.1440
(0.0962)
lshare 0.0269
(0. 0294)
lhhi 0.0244
(0.1176)
switches -0.0391
(0.0640
mergers -0.0430*
(0.0207)
tdum3 0.0132
(0.0606)
tdum4 0.0178
(0.0549)
tdum5 0.0137
(0.0464)
tdum6 0.0064
(0.0351)
tdum7 0.0148
(0.0289)
tdum8 -0.0018
(0.0220)
tdum9 0.0121
(0.0173)
lassets 0.3745***
(0.0660)
lde 0.0109
(0.0159)
loss 0.0634*
(0.0259)
lrecv 0.0549
(0.0345)
linv 0.0023
(0.0104)
N 1425
N_g 332.0000
F
chi2 204.5340
Standard errors in parentheses* p < 0.05, ** p < 0.01, *** p < 0.001

26
Cameron, A.C and P.K Trivedi, (2006), “Microeconometrics, methods and applications”, Cambridge University Press
Chaney, P.K., D.C. Jeter and L Shivakumar (2004), “Self selection of Auditors and Audit Pricing in Private firms”, The Accounting Review, Vol. 79, No. 1, pp. 51-72.
Chun Kao, M., E. C.T. Lin and B.H. Chin, “A Dynamic Partial Adjustment Model of Audit Pricing”, Yuanpei University of Science and Technology,University of Adelaide Business School and Yuan-Ze University.
Numan, W and M. Willekens (2009), “Industry specialization as a means to soften price competition in the audit market”, K.U. Leuven – Faculty ofBusiness and Economics
O’Keefe, T., D. A. Simunic and M. T. Stein (1994), “The production of audit services: evidence from a major public accounting firm”, Journal ofAccounting Research, Vol. 32, No. 2, p. 241-261.
Pong, C.M and G. Whittington (1994), “The determinants of audit fees: some empirical models”, Journal of Business Finance & Accounting,Vol. 21, No. 8
Simunic, D. A. (1980), “The pricing of audit services: theory and evidence”, Journal of Accounting Research, Vol. 18, No. 1, p. 161-190.
Appendix 3: References

Audit pricing analysis 27
Notes

28
Notes


Deloitte refers to one or more of Deloitte Touche Tohmatsu Limited (“DTTL”), a UK private company limited by guarantee, and itsnetwork of member firms, each of which is a legally separate and independent entity. Please see www.deloitte.co.uk/about for adetailed description of the legal structure of DTTL and its member firms.
Deloitte LLP is the United Kingdom member firm of DTTL.
This publication has been written in general terms and therefore cannot be relied on to cover specific situations; application of theprinciples set out will depend upon the particular circumstances involved and we recommend that you obtain professional advicebefore acting or refraining from acting on any of the contents of this publication. Deloitte LLP would be pleased to advise readerson how to apply the principles set out in this publication to their specific circumstances. Deloitte LLP accepts no duty of care orliability for any loss occasioned to any person acting or refraining from action as a result of any material in this publication.
© 2012 Deloitte LLP. All rights reserved.
Deloitte LLP is a limited liability partnership registered in England and Wales with registered number OC303675 and its registeredoffice at 2 New Street Square, London EC4A 3BZ, United Kingdom. Tel: +44 (0) 20 7936 3000 Fax: +44 (0) 20 7583 1198.
Designed and produced by The Creative Studio at Deloitte, London. 18227A
Member of Deloitte Touche Tohmatsu Limited