Embed Size (px)
Citation preview

AUDIT OF OVERSIGHT OF LOAD RATINGS AND POSTINGS ON
STRUCTURALLY DEFICIENT BRIDGES ON THE NATIONAL HIGHWAY SYSTEM
Federal Highway Administration
Report No. MH-2006-043 Date Issued: March 21, 2006

U.S. Department of Transportation Office of the Secretary of Transportation Office of Inspector General
Subject: ACTION: Report on Federal Highway
Administration Oversight of Load Ratings and Postings on Structurally Deficient Bridges on the National Highway System Report No. MH-2006-043
Date: March 21, 2006
From:
Kurt Hyde Assistant Inspector General for Surface and Maritime Programs
Reply to Attn. of:
JA-40
To:
Acting Federal Highway Administrator
This report presents the results of our audit of the Federal Highway Administration’s (FHWA) oversight of structurally deficient bridges on the National Highway System, specifically inspections, load ratings, and maximum weight postings.2 A structurally deficient bridge is one that has major deterioration, cracks, or other flaws that reduce its ability to support vehicles. Proper and regularly scheduled reviews of the calculations of all bridges’ maximum safe load ratings are important because as a bridge ages, corrosion and decay can decrease its capacity to support vehicles. Some bridges are weakened to the point that signs must be posted to bar vehicles heavier than the calculated maximum load. A structurally deficient bridge can suffer partial failures that further decrease its capacity and can pose a risk to public safety.3 In the worst-case scenario,
1 This report is based upon the Calendar Year (CY) 2003 National Bridge Inventory. The CY 2004
inventory was released after field work was completed. The inventory figures for 1999 and earlier are not listed because reclassification issues resulted in downward revisions to the total of structurally deficient bridges.
2 Federally owned bridges on the National Highway System were not included in the samples reviewed in this report.
3 A bridge can also be considered structurally deficient if the waterway opening provided by the bridge is insufficient and causes intolerable interruptions of traffic.
Memorandum
Structurally Deficient NHS Bridges
Year Number 2000 6,715 2001 6,643 2002 6,476 2003 6,491 2004 6,399
Source: FHWA1
2
corrosion and decay of bridge structures can weaken a bridge to the point of collapse.
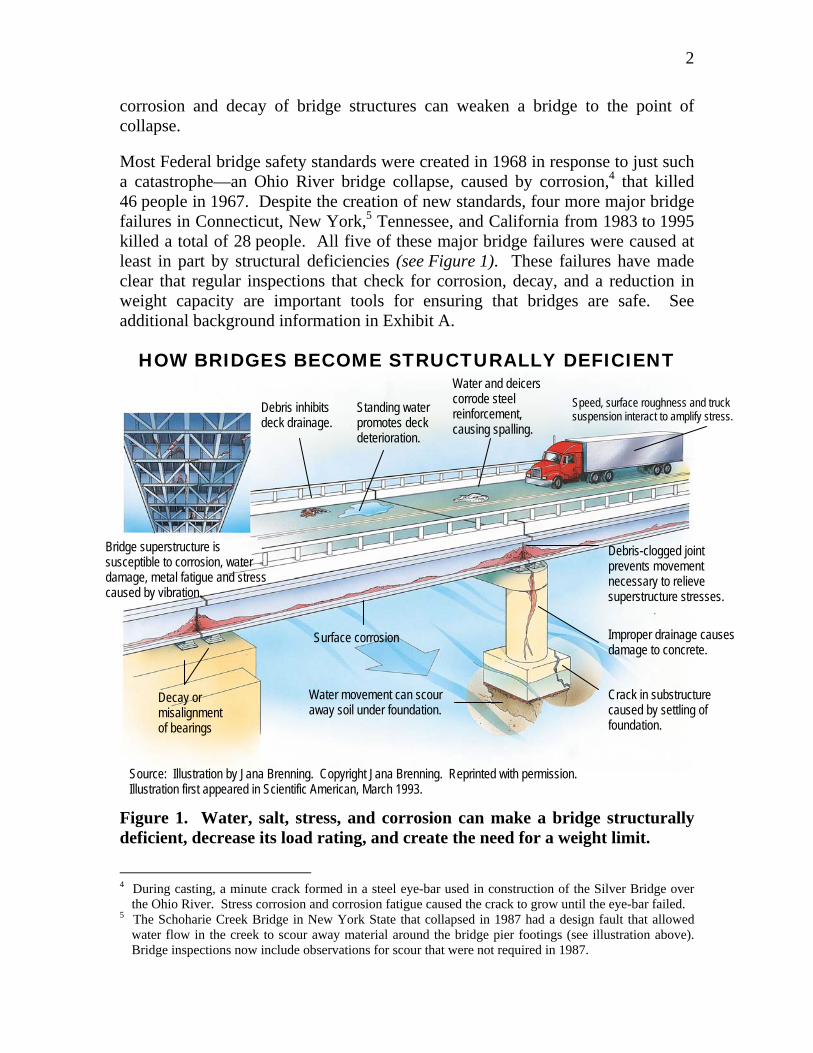
Most Federal bridge safety standards were created in 1968 in response to just such a catastrophe—an Ohio River bridge collapse, caused by corrosion,4 that killed 46 people in 1967. Despite the creation of new standards, four more major bridge failures in Connecticut, New York,5 Tennessee, and California from 1983 to 1995 killed a total of 28 people. All five of these major bridge failures were caused at least in part by structural deficiencies (see Figure 1). These failures have made clear that regular inspections that check for corrosion, decay, and a reduction in weight capacity are important tools for ensuring that bridges are safe. See additional background information in Exhibit A.
HOW BRIDGES BECOME STRUCTURALLY DEFICIENT
Figure 1. Water, salt, stress, and corrosion can make a bridge structurally deficient, decrease its load rating, and create the need for a weight limit.
4 During casting, a minute crack formed in a steel eye-bar used in construction of the Silver Bridge over
the Ohio River. Stress corrosion and corrosion fatigue caused the crack to grow until the eye-bar failed. 5 The Schoharie Creek Bridge in New York State that collapsed in 1987 had a design fault that allowed
water flow in the creek to scour away material around the bridge pier footings (see illustration above). Bridge inspections now include observations for scour that were not required in 1987.
Debris inhibits deck drainage.
Water and deicers corrode steel reinforcement, causing spalling.
Speed, surface roughness and truck suspension interact to amplify stress.
Bridge superstructure is susceptible to corrosion, water damage, metal fatigue and stress caused by vibration.
Source: Illustration by Jana Brenning. Copyright Jana Brenning. Reprinted with permission. Illustration first appeared in Scientific American, March 1993.
Water movement can scour away soil under foundation.
Decay or misalignment of bearings
Surface corrosion
Debris-clogged joint prevents movement necessary to relieve superstructure stresses.
Improper drainage causes damage to concrete. Crack in substructure caused by settling of foundation.
Standing water promotes deck deterioration.

3
The objectives of this audit were to evaluate whether state transportation departments inspected structurally deficient bridges on the National Highway System in accordance with National Bridge Inspection Standards (Inspection Standards) and properly calculated load limits and posted maximum weight limits, and whether FHWA exercised effective oversight of the states’ actions in inspecting bridges, calculating load limits and posting maximum weight limits. Police enforcement of posted maximum weight limits is also needed to keep overweight vehicles off structurally deficient bridges, but its effectiveness depends upon current and accurate load ratings. To conduct this audit, the Office of Inspector General (OIG) contracted with the U.S. Army Corps of Engineers (Corps) to provide expert technical support, under the direction of the OIG engineer advisor. The engineers surveyed the condition of bridges in the field in New York and Texas and reviewed bridge records in these states as well as Massachusetts. See Exhibit B for the audit’s scope and methodology.
BACKGROUND The 2003 National Bridge Inventory (Bridge Inventory) maintained by FHWA identified about 592,000 highway bridges. Of those, 114,676 were part of the National Highway System, which includes the nation’s most important highways. Some 6,491 of National Highway System bridges, including some in each of the 50 states, Puerto Rico, and the District of Columbia were classified as structurally deficient in 2003 because they had major deterioration, cracks, or other deficiencies in their decks, structure, or foundations6 (see Exhibit C for data on bridges in each state).
The practice of calculating the load rating of structurally deficient bridges and, if necessary, posting signs to keep heavier vehicles from crossing them, serves to protect structurally deficient bridges from powerful stresses caused by loads that exceed a bridge’s capacity. The load rating is a calculation of the weight-carrying capacity of a bridge and is critical to the bridge’s safety. A load rating is performed separately from the bridge inspection, but is based upon design capacities supplemented with data and observations of the bridge’s physical condition provided by a bridge inspector. The load rating, expressed in tons, serves as the basis for posting signs noting the vehicle weight limit restriction, which can be referred to more simply as the bridge’s maximum weight limit. The load rating is calculated at two design strength capacity levels: the operating, which is the higher level, and the inventory, which is the lower level.7 A structurally deficient bridge is not necessarily unsafe for use, nor incapable of 6 Some of these bridges may have been declared structurally deficient because the waterway opening was
insufficient and caused intolerable traffic interruptions. 7 The operating rating is the absolute maximum permissible load level to which a bridge may be subjected,
while the inventory rating represents a lower load level to which a bridge may be subjected for an indefinite period of time.

4
carrying legal loads, provided that accurate inventory data, including load ratings, are documented. Most structurally deficient bridges can continue to serve traffic safely if they are properly inspected, the bridges’ maximum load ratings are properly calculated, and, when necessary, the proper maximum weight limits are posted.
A maximum weight limit sign must be posted on a National Highway System bridge whenever the maximum vehicle weight that state regulation allows on that highway exceeds the bridge’s maximum weight limit determined by the operating rating or equivalent rating factor.8 (On most Federal highways in most states, the maximum gross vehicle weight is 40 tons for a typical, fully loaded 18-wheel tractor-trailer having 5 axles. In 22 states, trucks with more axles are permitted on some highways, and these vehicles have maximum gross weights of 43.2 to 82 tons.)
In a worst-case scenario, the lack of a correct load rating or the lack of a weight limit posting could allow heavier vehicles to cross and cause severe structural damage or the collapse of a bridge. Correct bridge load rating data and calculations are also important for the Bridge Inventory, which is the basis for the bridge information in the Department’s report to Congress—“Status of the Nation’s Highways, Bridges, and Transit: Conditions and Performance.” An incorrect load rating in the Bridge Inventory could affect whether a bridge is properly identified as structurally deficient and properly reported in the bridge statistics submitted to Congress for safety and funding decisions.
Each state’s Department of Transportation performs bridge inspections and load ratings, while the state or other governmental entity that owns the bridge performs repairs and posts maximum weight limit signs. State officials we interviewed said that in some cases, this division of duties and responsibilities can hinder prompt resolution of problems with weight limit postings and repairs to deficiencies that bridge inspections reveal. The Massachusetts Highway Department (MassHighway), for example, is responsible for inspecting and performing load ratings on the North Washington Street Bridge that was cited by the Corps in this audit, but the City of Boston owns the bridge and is responsible for making repairs and posting weight limit signs on the bridge.
Hurricane Katrina recently underscored the importance of the accuracy of the Bridge Inventory. To speed hurricane relief efforts, several state governments increased or suspended the maximum legal weight of tractor-trailers so that the trucks could carry heavier cargos of food, water, ice, temporary shelters, building materials, construction equipment, and storm debris. For example, Alabama
8 Some state highway departments may choose to post at the inventory rating or other weight limit lower
than the operating rating.
5
Governor Bob Riley signed an emergency proclamation on August 26, 2005, increasing the state’s maximum gross weight limit on some large trucks from 40 tons to 48 tons. It is important that load ratings be accurately calculated and listed in the Bridge Inventory in case, as in this situation, officials must chart a safe route for overweight loads.
Bridges with weight limitations can cause delays, higher costs for businesses, and problems for public safety by requiring heavy trucks and emergency vehicles to use longer alternative routes. These delays would be especially critical during national emergencies such as Hurricane Katrina, which require rapid transport of emergency relief personnel, hardware, construction equipment, or heavy supplies. Additionally, errors in load rating and posting can cause unnecessary delays and costs if a bridge is incorrectly posted and requires a vehicle that can safely use a bridge to instead detour to a longer route.
RESULTS IN BRIEF We found that, overall, the bridge inspections in Massachusetts, New York, and Texas that we reviewed were adequate, generally complete, and accurate. However, we found errors in the calculation of load ratings or in the posting of maximum weight limits or other related errors for 33 of the 43 bridges reviewed in a sample from the three states. On at least 12 of the 33 bridges, errors allowed vehicles to cross that were heavier than the bridge’s maximum weight limit. Of these 12 bridges, 11 that required posting were not posted, and one bridge was incorrectly posted at a maximum weight limit higher than the actual weight limit derived from load rating calculations. The inventory data for the other 21 bridges had errors and inaccuracies such as missing posting signs, and outdated or unsupported load ratings, which could have allowed heavier than permissible vehicles to cross, but that could not be evaluated further due to the absence of accurate load ratings.
FHWA can improve its oversight of the states to ensure that maximum weight limit calculations and postings are accurate. For example, the Corps found that a bridge in Massachusetts had been inspected 8 times over the previous 5 years and designated for repair. The poor condition of the bridge also warranted a recalculation of its load rating and posting of new signs showing a lower maximum weight. The Corps found that load ratings, postings, and lane closures on the bridge had been recommended, but not completed in a timely manner, which would permit vehicles that were too heavy for the bridge to travel over it.
Inaccurate or outdated maximum weight limit calculations and posting entries were recorded in bridge databases of the state transportation departments and in the Bridge Inventory. Bridge Inventory data is a component of the calculation for distribution of Federal funds for bridge rehabilitation and replacement, and these

6
errors could contribute to misdirecting funds and actions in the effort to reduce the number of structurally deficient bridges.
After finding bridge load rating and weight limit posting deficiencies during our survey in New York and Texas, we expanded the study nationwide. We asked the Corps to perform a separate engineering review of inspection reports and other documents from a random sample of 67 bridges drawn from all 50 states, the District of Columbia, and Puerto Rico. For 6 of the 67 bridges, we found errors in calculating bridge load ratings or in failing to post weight limit signs which would have allowed vehicles that exceeded the bridge’s maximum weight limit to cross the bridge. A statistical projection based on the analysis of that sample suggested that the load ratings for as many as 10.5 percent of the thousands of structurally deficient bridges on the National Highway System are inaccurate. As a result of our detailed analysis of these records, we projected that among the structurally deficient bridges on the National Highway System:
• Load rating calculations for 10.5 percent did not accurately reflect the condition of the structure. Growing shear cracks in the beams of a New Mexico bridge, for example, were not taken into account when it was rated for its load carrying capacity. Because the degradation of the bridge’s structure was not factored into its rating, its safe load capacity may have been overstated. This may have allowed vehicles that are too heavy for the bridge to continue to use it. Similar problems and results were found for an Oklahoma bridge that lost concrete from its deck.
• About 7.8 percent of the bridges were required to have maximum safe weight signs posted on them, but the signs were not posted and too-heavy vehicles were allowed to cross them. For example, the maximum load rating of a Massachusetts bridge was 27 tons, but MassHighway’s district engineer waived the posting requirement without documenting any justification. An Oregon bridge should have had a 10-ton maximum weight limit sign, but the Bridge Inventory listed a maximum load rating of 36 tons and the bridge was not posted. In another example, a State of Washington bridge built in 1925 showed significant deterioration and should have been posted because its maximum load rating was 28 tons, which is lower than legal load limits. No sign was posted.
• Procedures were not properly followed during the calculation of load ratings for 10.5 percent of the bridges, which could cause either incorrectly high weight limits—and excess loads—or incorrectly low maximum weight limits—and needless detours. For example, a Kentucky bridge was rated with a maximum weight limit of 68 tons based on the capacity of the weakest pier on the bridge to resist forces that would cause the pier to bend. But the Corps found that calculating a load rating

7
using the pier’s shear capacity—the capacity to resist forces that would cause the pier to snap as if being cut in two—resulted in a maximum weight limit of 30 tons. This was a deviation from proper rating procedures, which would have been to set the maximum weight limit at the lower of those two figures. Also, a single-span composite bridge in Rhode Island did not have any load rating calculations, and the load rating recorded in the state’s bridge inventory and the Bridge Inventory was “0.” Inspection records documented that there were temporary supports (shoring) in place. This is a deviation from proper procedures because load ratings should be calculated for the bridge without shoring. The calculation is to determine first that the bridge is unable to withstand any load without shoring, and second to specify the shoring necessary for the deficit in structural capacity found by the calculations.
These errors could cause further structural damage or failure from a vehicle crossing a bridge that is too weak to carry the vehicle’s weight. An error could also result in an underestimation of load-carrying capacity, leading to a posted maximum weight limit that is unnecessarily restrictive, sending heavy emergency vehicles and delivery trucks on a circuitous detour route. Unnecessary rerouting can delay emergency responses and cause excess costs for businesses and government services.
FHWA however does not require its Divisions to analyze bridge inspection data to better identify and target specific structurally deficient bridges most in need of load limit recalculation and posting. Also, FHWA’s Division Offices in the three states we reviewed did not ensure that states’ bridge load ratings were properly calculated, or that corresponding postings were performed. Thus, FHWA can do more to align its oversight practices with guidelines in the 1993 FHWA policy memorandum on Bridge Load Ratings for the National Bridge Inventory, which recognizes the importance of monitoring states’ efforts to keep reliable, uniformly consistent, and current bridge load ratings.
In a draft of this report, we recommended that FHWA revise its annual compliance reviews of state bridge programs to address the most serious deficiencies found during bridge inspections, and to develop a risk-based, data-driven approach and metrics to ensure states maintain up-to-date maximum weight limit records, post accurate maximum weight limit signs in a timely manner, and improve the accuracy and completeness of the Bridge Inventory and reporting to Congress. We also recommended that FHWA evaluate greater use of computerized bridge management systems to improve states' bridge inspection programs and enhance the accuracy of bridge load ratings. In responding to our draft report, FHWA agreed with the recommendations and also provided detailed information as

8
clarification. Based on our review of this additional information, we revised sections of this report as appropriate.
RESULTS State Inspections Were Adequate, but Load Ratings and Maximum Weight Postings Were Not Accurate Overall, the three states that we reviewed performed adequate inspections of structurally deficient National Highway System bridges in accordance with Inspection Standards for frequency of inspection, professional, and training qualifications of inspectors, identification of critical safety items, and reporting bridge conditions. Based on a review of inspection files for 43 bridges in three states, the Corps concluded that written bridge inspection and recording procedures were well-defined and matched closely with the intent of the Inspection Standards.
The Corps, however, found problems with the calculation of load ratings, the posting of maximum weight limits, and other related problems for 33 of the 43 bridges reviewed (see Table 1). One Massachusetts bridge had been inspected 8 times over the previous 5 years and designated for repair. The condition of this
Table 1. Load Rating Calculation and Posting Problems Found
State Bridges
Reviewed Bridges With
Problems Bridges Used by Too-Heavy
Vehicles
Problems Found
Massachusetts 15 13 3 Load rating calculations were not performed; maximum weight limit signs were not posted, posted incorrectly, or were missing.
New York 14 11 3 Ratings did not reflect the degraded conditions of the bridges; maximum weight limits were not posted or were posted incorrectly.
Texas 14 9 6
TOTAL 43 33 12
Maximum weight limits were not posted; bridge ratings were improved without supporting data; bridges were not inspected frequently enough; load rating calculations were not clear.
Source: U.S. Army Corps of Engineers
bridge also warranted a recalculation of load rating and corresponding posting. The Corps found that load ratings, postings, and lane closures on the bridge were recommended but not completed in a timely manner. The Corps reported that conditions warranting lane closure and weight limits were present for at least a year before mitigating repairs were made. The deficiencies and concerns that the Corps identified in Massachusetts are particularly significant because the state

9
allowed the situation to remain unchanged for many years. In December 1997, the Massachusetts State Auditor issued a report (No. 97-4040-3: State Auditor’s Report on the Massachusetts Highway Department’s Bridge Management Activities) that found that the load capacity had not been established for many bridges in the state and some bridges were not posted with maximum weight limit signs when necessary.
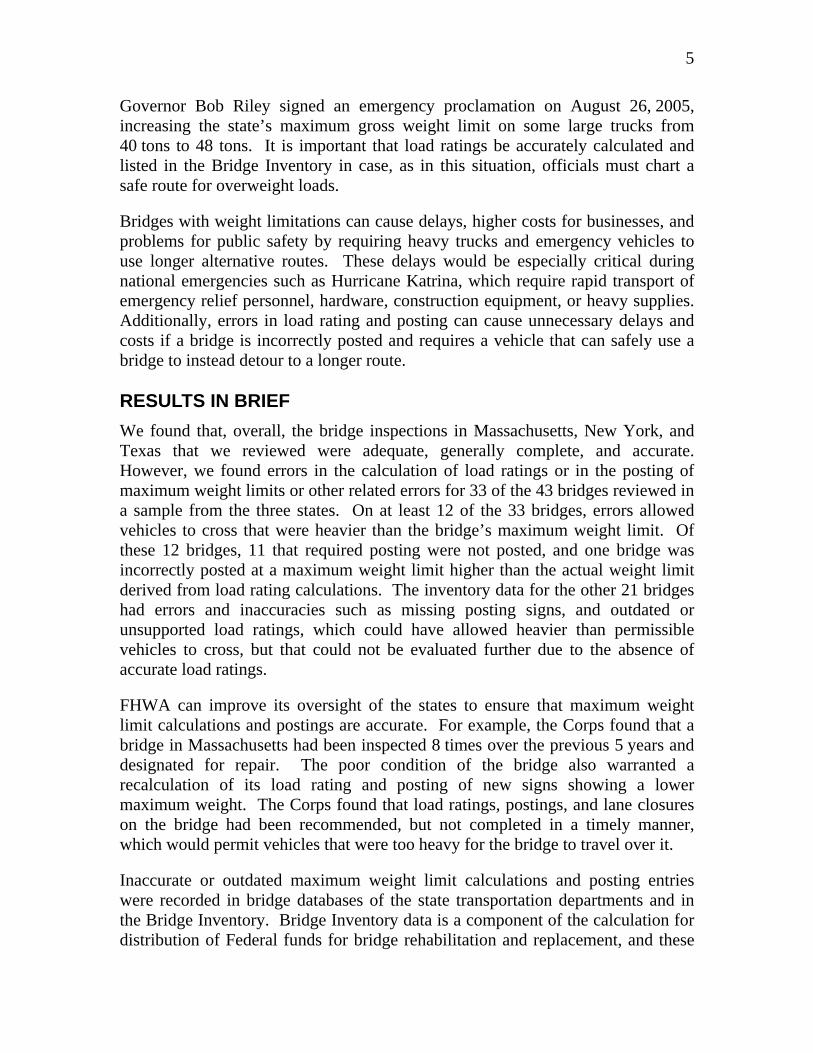
The Massachusetts State Auditor’s report found that 40 percent of the state’s bridges had not been rated to determine the maximum weight limit, and 11 percent of the bridges that had been rated were not posted to indicate to the public the weight limits for the bridges. Some had not been posted for many years. Although the State Auditor conducted its audit in 1997, we continue to find similar issues some 6 years later. For example, we found that in 2003, Boston’s North Washington Street Bridge (see Figure 2) was inspected and rated as unsafe for vehicles weighing 4 tons—the equivalent of a very large and heavy sport utility vehicle. Despite the revised load rating, Boston continued to allow trucks carrying hazardous materials and weighing as much as 50 tons to cross the bridge.
Figure 2. Severe Corrosion of Support Beam on a Massachusetts Bridge
Source: Massachusetts Highway Department
In another example, we found that a bridge connecting two boroughs in New York City lacked required weight limit signs for more than a year. The Corps was concerned that the poor condition of the bridge and lack of posting for load limits (corresponding to the poor bridge condition) had gone uncorrected for more than a year. The load rating shown in the Bridge Inventory was overstated at 55 tons, but state records indicated the bridge should have been load posted for 25 tons or less—a single tractor-trailer that represents the typical maximum load allowed by law on most Federal highways weighs 40 tons (trucks with even heavier loads are allowed on some highways with approved permits).

10
Among the Texas bridges that the Corps’ engineers reviewed, they found an unposted bridge with a load rating of 20 tons. According to both state and Federal criteria, the bridge should have been posted because of the low load rating and the poor physical condition of the bridge. Further, according to state criteria, the inspection frequency should have been 12 months rather than the 24 months recorded in the state inventory data.
Load Rating and Weight Limit Posting Errors in Nationwide Sample
To determine the extent of bridge load rating and weight limit posting deficiencies nationwide, the Corps performed a separate engineering review of bridge documents from a national random sample of 67 bridges. A statistical analysis projected the Corps’ findings to the total of structurally deficient bridges on the National Highway System at the time of its review. Based on the findings, we identified the following load rating or posting errors, and estimated the percentage of structurally deficient bridges on the National Highway System that would show each of those error types.
• For 10.5 percent of the bridges, the load rating calculations did not accurately reflect the significant deterioration reported in bridge inspections.9 Deterioration reduces the load-carrying capacity of a bridge and should be accounted for in the rating calculations to avoid bridge overloading. For the two bridges in the examples below, the load capacity of the bridge may have been overstated. For example, the inspection report of a five-span concrete bridge in New Mexico documented shear cracks in the beams that grew in size over several years, which indicated loading that exceeded the beams’ capacity. Deterioration, however, was not accounted for in the rating calculations for this bridge. In a similar situation, the load ratings for an eight-span composite bridge (concrete deck over steel girders) in Oklahoma were calculated by taking into account the relatively good condition of the girders under the deck. However, the inspection records show the condition of the bridge deck was worse than the condition of the girders, due to heavy material loss that had exposed the reinforcing steel bars. According to the Corps, the loss of concrete from the deck should have been taken into account in the rating calculations. A load rating is determined by the bridge member with the most deteriorated condition, or the lowest structural capacity, which in this case was the deck.
9 Margin of error is +/- 5.3 percentage points.
11
• Rating procedures were not properly followed for 10.5 percent of the bridges, putting in doubt the accuracy of the load carrying capacity calculated for these bridges as well as the decision to post or not post a weight limit.10 Failing to follow proper rating procedures creates safety concerns and impairs sound management of the bridge network by making it difficult to properly rank the bridges by the amount and urgency of repairs needed. In the worst-case scenario, vehicles far exceeding the safe weight limit could be using these bridges. The load ratings for a bridge in Kentucky calculated that the bridge’s weakest pier could withstand a maximum weight of 30 tons based on the pier’s capacity to resist forces that would cause the pier to shear, or break in two. The ratings also calculated a maximum weight limit of 68 tons based on the capacity of the same pier to resist forces that would bend the pier. The higher weight limit was the value incorrectly entered in the Bridge Inventory. Proper procedures require that the lowest maximum weight limit be entered in the Bridge Inventory—in other words, a chain is only as strong as its weakest link. The load rating calculations for a three-span steel bridge in Oklahoma, which were not dated, produced a maximum weight limit of 79 tons. Rating calculations must be dated to determine whether recalculation is necessary due to condition changes reported in subsequent inspections. The calculated weight limit is supported by neither the 2001 Bridge Inventory data, which reported a maximum weight limit of 49 tons, nor by the 2002 inspection, which did not report any improvements in physical condition to justify the higher weight limit calculated.
• About 7.8 percent of the bridges were required to be posted for weight limits but were not posted. Consequently, vehicles heavier than what should have been allowed were permitted to use these bridges. If bridges are frequently overloaded, they will deteriorate more quickly, and failures of parts of the bridge or the entire structure are possible.11 For example, the calculated maximum load rating for a three-span bridge in Massachusetts was 27 tons, which matched the conditions and other data recorded in state inspection reports and the Bridge Inventory. The state transportation department’s District Engineer, however, waived the posting requirement without documenting any justification for the waiver. In Oregon, the maximum load rating calculated for a three-span composite bridge was 10 tons and the bridge should have been posted with a weight limit sign. The Bridge Inventory, however, listed a maximum load rating of
10 Margin of error is +/- 5.3 percentage points. 11 Margin of error is +/- 4.7 percentage points.

12
36 tons and said that the bridge was not posted. State records indicated that the bridge was not posted. Finally, the maximum load rating calculated for a five-span steel truss bridge in the state of Washington was 28 tons, which required that the bridge be posted. The state inspection report noted significant deterioration, which was included in the rating calculations. The Bridge Inventory reported the same ratings and conditions but noted the bridge was not posted. This bridge should have been posted because its main span was designed for an unknown vehicle load when it was built in 1925, and because deterioration since then has reduced its load-carrying capacity.
• Load rating data for 40.5 percent of the structurally deficient National Highway System bridges did not match the Bridge Inventory. In these cases, important decisions on maintenance priorities are impaired. During disasters and national emergencies, inaccurate information could cause errors in selecting strategic routes for deployment of military and emergency fleets, as well as heavy trucks carrying materials and equipment for reconstruction.12 The maximum weight limit calculated for a two-span pre-stressed concrete bridge in Pennsylvania was 76 tons. The Bridge Inventory reported the same physical conditions of the bridge that were found in the state inspection used to calculate the 76-ton weight limit, but listed a maximum weight limit of 110 tons. There was no explanation for the difference in load carrying capacities without significant changes in bridge conditions. The undated load rating calculations for an 18-span concrete bridge in Texas produced a maximum weight limit of 99 tons. This rating was not supported by the state’s inventory data of 2003, which reported a maximum load rating of 25 tons with the same physical conditions that were reported in the 2001 Bridge Inventory. In contrast, the Bridge Inventory reported a maximum weight limit of 44 tons. There is no proof that the structural conditions or functional requirements changed enough to support three different load rating calculation results within a 2-year period.
Although some load rating errors might be avoided with the help of computerized bridge management systems, these systems are still not used in all states. FHWA and the American Association of State Highway and Transportation Officials (AASHTO) developed a computerized bridge management program, Pontis, and a specialized bridge load rating program, Virtis, that can help states track bridge conditions, including the progress of scheduled maintenance and necessary repairs. Improved information on the status of bridges and metrics could help
12 Margin of error is +/- 8.9 percentage points.

13
prioritize limited resources and provide better data for FHWA’s risk assessments of state bridge programs, as well as assist in national emergencies.
FHWA Oversight and Compliance Reviews Limited in Effectiveness FHWA’s Division Offices in the three states we reviewed did not ensure that states’ bridge load ratings were properly calculated and corresponding postings were performed. Our national survey showed that similar problems existed nationwide. FHWA also did not require its Divisions to analyze bridge inspection data to better identify and target those structurally deficient bridges most in need of load limit recalculation and posting. Further, FHWA’s enforcement of the states’ compliance with Inspection Standards was limited. The Inspection Standards recognize the importance of monitoring states’ efforts to repair, rehabilitate, or replace bridges and to properly post maximum weight limit signs. Thus, FHWA can do more to align its oversight practices with guidelines in the 1993 FHWA policy memorandum on Bridge Load Ratings for the National Bridge Inventory, which recognizes the importance of monitoring states’ efforts to keep reliable, uniformly consistent, and current bridge load ratings. A 1992 FHWA directive ordered Divisions to require states to comply with the inspection and maximum weight posting requirements of the Inspection Standards and suspend Federal aid to states that did not comply with the requirements. We found that more than a decade later, FHWA Divisions in Massachusetts and Texas still needed to take more aggressive action to identify and address bridge inspection and posting deficiencies in their states. For example, the Corps’ review found serious problems with bridge maintenance and posting in Massachusetts, but FHWA never suspended Federal aid to that state, even after the Massachusetts State Auditor found severe deficiencies in managing its structurally deficient bridges. In addition, our November 19, 2004, report on FHWA’s process for “Managing Risk in the Federal-Aid Highway Program,” (Report Number MH-2005-012) found that the risk assessment conducted by the Texas Division Office had evaluated only 4 of the 18 components of the bridge program. Our audit found that the Texas Division’s two bridge engineers had limited time for bridge oversight and the Division’s annual compliance review did not evaluate bridge data to focus on compliance with inspection and maximum posting requirements. The time FHWA engineers have available for bridge oversight is limited. There is an FHWA Division office in every state, as well as the District of Columbia and Puerto Rico. The Federal bridge program involves approximately 600,000 bridges greater than 20 feet in length, including those not on the National Highway System. FHWA Divisions have 52 engineers, in some cases assisted by additional engineer staff, designated to handle Federal bridge program oversight
14
responsibilities. In addition, FHWA bridge engineers also perform other highway activities. We found time constraints restricted bridge engineers’ reviews to only a small percentage of the total number of bridges in the state. For example, the FHWA bridge engineer in Texas informed us that he spent only about 15 percent of his time on oversight of the bridge inspection program. The majority of his time was spent providing technical assistance, construction inspection, final planning, primary planning, technical reviews, and committee meetings. Accordingly, little time was available to review bridge documents, analyze inspection data, and make field visits to verify state compliance with Inspection Standards. In addition, until October 2005, he spent up to 30 percent of his time on work not associated with bridges, specifically, performing hazardous material tank inspections for the Federal Motor Carrier Safety Administration. Additionally, FHWA's annual compliance review process in the Texas Division office relied on state information that it did not independently verify. FHWA did not base its annual compliance reviews on analyses of bridge data that focused on the most serious bridge deficiencies, particularly those that remained uncorrected after multiple inspections or that posed a potential threat to public safety. The bridges selected for FHWA’s annual compliance reviews are not necessarily structurally deficient, and not all of them are on the National Highway System. For example, FHWA’s Texas bridge engineer told us that he reviewed monthly reports from the state that summarize the status of bridge inspections for each of the 25 Texas Department of Transportation districts, but did not necessarily select bridges for review based on whether they had been identified as deficient. The bridge engineer could not provide a list of the specific bridges that he had inspected, or what aspects of the bridges were inspected.
Texas provides an example of the limitations of FHWA’s compliance reviews. Texas has 48,492 bridges on the 2003 Bridge Inventory, by far the largest number of all states, but has only one FHWA bridge engineer and one assistant engineer. Of the 15,072 National Highway System bridges in Texas, 193 are structurally deficient. As part of the annual compliance review, the FHWA Texas Division performs approximately eight follow-up reviews of bridge documents each year, and visits about six bridges per review (for a total of only 48 of the 48,492 bridges in the state) to ensure that inspections performed by the Texas Department of Transportation are done in accordance with Inspection Standards.
Effective annual compliance reviews are important for FHWA to assess the status of its National Bridge Inspection Program, and identify important safety issues, weaknesses, and areas for improvement in state and local bridge inspection programs. Until the 1990s, each FHWA Division was required to submit a copy

15
of its state’s annual Inspection Standards compliance review to FHWA Headquarters. When the requirement was withdrawn, the number of Divisions submitting copies of annual reviews declined significantly. This reduced FHWA’s ability to develop national data summaries for reports to Congress; to respond to inquiries from Congress, the National Transportation Safety Board (NTSB), and others; and to formulate national policy. In June 2001, FHWA reinstituted the requirement and its Divisions again began to submit copies of their states’ annual compliance reviews to Headquarters for evaluation of state Inspection Standards compliance.
The reports that the Divisions in our review submitted, however, did not focus on specific bridge deficiencies and state efforts to correct them. In addition, FHWA found that the weaknesses in the reports and the tendency for Divisions to focus on individual concerns particular to their states made it difficult to assess the efficacy of the National Bridge Inspection Program. In 2003, FHWA Headquarters acknowledged its need for better control over state reporting and began an effort to improve the annual compliance reviews, starting with standardizing the report format. FHWA can further improve its oversight by establishing a data-driven compliance review process to analyze bridge safety trends and target problem areas at the programmatic level.
FHWA Needs to Develop a Data-Driven, Risk-Based Approach to Bridge Oversight Given the small number of bridge engineers and the limited time available to oversee thousands of bridges, FHWA would benefit from an oversight program that makes substantially greater use of data and metrics to target bridge inspections for its compliance reviews. Using an objective analysis of empirical data from the Bridge Inventory and state databases, a data-driven approach would help FHWA bridge engineers focus inspections and compliance reviews on a programmatic level. That is, they could address bridge problems most in need of attention, including the structural deficiencies identified in this report.
FHWA has resources to help with this approach, such as the Bridge Management Information System Laboratory (Laboratory) at FHWA’s Turner Fairbank Highway Research Center. The Laboratory could help provide graphical analysis and presentation of Bridge Inventory data both geographically (using global information systems) and over time to the FHWA Office of Bridge Technology. The Laboratory maintains complete time-series data that allow analysis and evaluation of trends. Specifically, if a load rating value or load posting flag appears to have changed from one year to the next, the Laboratory could review data to determine whether the particular state reported a major repair or rehabilitation in a prior year. This might then indicate the reason for the change, although the state would still need to provide details.

16
Conversely, if the data indicated that a major rehabilitation was completed in a prior year, but no change in the load rating or load posting resulted, this information could be provided to the FHWA Divisions for follow-up. Such information at the program level would be useful for FHWA’s monitoring of trends to ensure states properly address structurally deficient bridges.
Better use of data could also improve states’ management of bridge programs and FHWA oversight. FHWA and AASHTO developed a computerized bridge management program, Pontis, and a specialized bridge load rating program, Virtis. Engineers can use computerized bridge management programs such as these to better manage state bridge inspection programs. They can also identify structural deficiency trends to efficiently allocate limited funds and resources for repairs before deficiencies become emergencies or before deterioration requires major bridge rehabilitation or replacement.
Although we have not evaluated this software, according to AASHTO, Pontis can store bridge inventory and inspection results, help formulate statewide preservation and improvement policies to use in evaluating the needs of each bridge. This information could be used for developing metrics and for preparing a capital plan to derive maximum benefit from available bridge funds. Virtis can provide state-of-the-art graphics, and its integrated database can help review and analyze load rating information and facilitate load posting, as necessary.
The Intermodal Surface Transportation Efficiency Act of 1991, as first introduced, required states to have a computerized bridge management system, but that requirement was subsequently dropped. However, NTSB, which we consulted for its expertise in highway safety, and FHWA still consider computerized systems to be useful tools in a state’s overall bridge management program. Accordingly, FHWA and the states are working together to implement bridge management systems. For example, Massachusetts has started implementing Pontis, while New York has been exploring use of Pontis. Texas is examining the use of Pontis in parallel with its current bridge management system. More complete and better quality bridge data at the state level would improve Federal-level information when states submit the data to the Bridge Inventory.
Computerized bridge management systems can also provide useful information for FHWA’s risk assessments at the program level. FHWA performs risk assessments to identify the most vulnerable state programs requiring oversight attention and to concentrate resources in areas having the most risk. The bridge program is one of those areas. However, our November 2004 report noted inconsistencies in FHWA Divisions’ reviews of major components in the bridge program.
For example, one FHWA Division did not evaluate compliance with Inspection Standards or Rehabilitation Program practices, even though 30 percent of the

17
state’s bridges were deficient. Based on concerns raised, FHWA should focus its risk assessments on critical components of each state’s bridge program, particularly the bridge management system, states’ adherence to Inspection Standards, the National Bridge Inventory, and Rehabilitation Program practices, including other components as necessary.
RECOMMENDATIONS
We recommend that FHWA:
1. Revise its annual compliance reviews of state bridge programs to address the most serious deficiencies found during bridge inspections. FHWA should develop a risk-based, data-driven approach and metrics to focus on ensuring that states:
a. Maintain up-to-date maximum weight limit records through state quality assurance/quality control programs that ensure current bridge conditions are accurately incorporated into load rating calculations.
b. Post accurate maximum weight limit signs on bridges in a timely manner, when inspections indicate posting or revised posting should occur.
c. Coordinate with other states to improve the accuracy and completeness of the Bridge Inventory and reporting of results to Congress. FHWA should focus on reducing discrepancies, including the most frequent deficiency identified in our statistical sample—the failure of information in the Bridge Inventory to match bridge load rating results in state databases.
2. Evaluate greater use of computerized bridge management systems to improve states’ bridge inspection programs and enhance the accuracy of bridge load ratings.
MANAGEMENT COMMENTS AND OFFICE OF INSPECTOR GENERAL RESPONSE We provided FHWA a draft of this report on January 6, 2006. In its March 21, 2006 written comments, FHWA gave its overall concurrence in response to both recommendations 1 and 2, and provided examples of planned actions and initiatives it supports to improve oversight of load ratings and postings on structurally deficient bridges on the National Highway System. We carefully reviewed FHWA’s response, together with additional detailed information FHWA attached as clarification, and revised certain sections of the report as appropriate. FHWA’s complete comments are in the Appendix to this final report.
18
Given the long lead time and complex coordination needed to address bridge deficiencies, it may take years before corrective action is actually completed. Therefore, FHWA may want to consider beginning implementation of its plan of actions to improve oversight of load ratings and postings in 2006, rather than January 2007, as proposed in its response. Bridge load rating has been a concern of FHWA for more than 12 years. In November 1993, the chief of FHWA’s Bridge Division issued a policy memorandum reporting concerns that “Apparent discrepancies in load ratings being reported by some States suggests that load rating practices and frequency of review may, in those cases, be at variance with the NBIS and the AASHTO Manual.”
The policy memorandum requested Regional and Division Offices to include load rating practices in their 1994 NBIS reviews, and to report on the practices and status of bridge load rating in each State. As noted in our report, these practices still remain a problem.
Specifically, FHWA should factor the bridge issues discussed in this report into the risk assessment process that is an integral part of the Financial Integrity Review and Evaluation (FIRE) Program. In developing the FIRE Program, FHWA should focus on identifying similar bridge concerns in states that were not reviewed in depth by our audit.
ACTION REQUIRED We request that FHWA provide written comments within 30 days containing its formal response to our comments regarding a 2006 time frame for implementation of FHWA’s plan of actions and use of FIRE Program risk assessments to improve oversight of load ratings and postings on structurally deficient bridges on the National Highway System. We appreciate the cooperation and assistance provided by you and your staff during this audit. If you have questions about this report, please call me at (202) 366-2017 or Engineer Advisor Rodolfo Pérez, at (202) 366-2002.
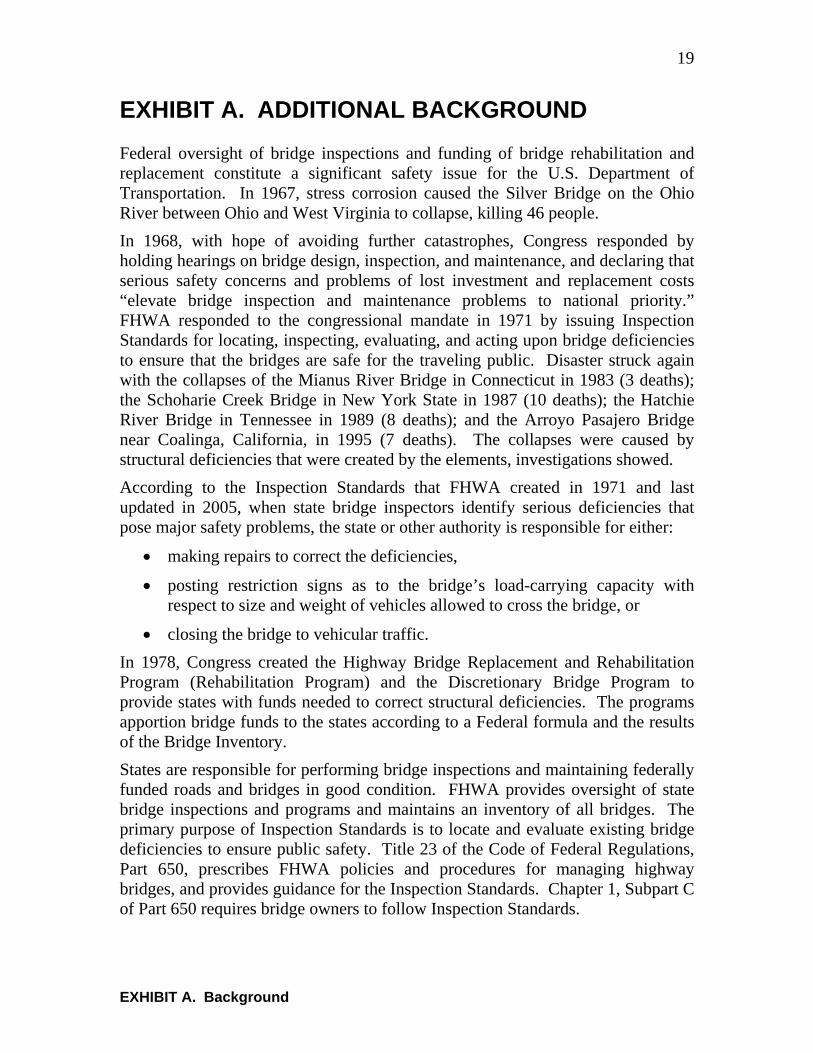
EXHIBIT A. Background
19
EXHIBIT A. ADDITIONAL BACKGROUND Federal oversight of bridge inspections and funding of bridge rehabilitation and replacement constitute a significant safety issue for the U.S. Department of Transportation. In 1967, stress corrosion caused the Silver Bridge on the Ohio River between Ohio and West Virginia to collapse, killing 46 people. In 1968, with hope of avoiding further catastrophes, Congress responded by holding hearings on bridge design, inspection, and maintenance, and declaring that serious safety concerns and problems of lost investment and replacement costs “elevate bridge inspection and maintenance problems to national priority.” FHWA responded to the congressional mandate in 1971 by issuing Inspection Standards for locating, inspecting, evaluating, and acting upon bridge deficiencies to ensure that the bridges are safe for the traveling public. Disaster struck again with the collapses of the Mianus River Bridge in Connecticut in 1983 (3 deaths); the Schoharie Creek Bridge in New York State in 1987 (10 deaths); the Hatchie River Bridge in Tennessee in 1989 (8 deaths); and the Arroyo Pasajero Bridge near Coalinga, California, in 1995 (7 deaths). The collapses were caused by structural deficiencies that were created by the elements, investigations showed. According to the Inspection Standards that FHWA created in 1971 and last updated in 2005, when state bridge inspectors identify serious deficiencies that pose major safety problems, the state or other authority is responsible for either:
• making repairs to correct the deficiencies,
• posting restriction signs as to the bridge’s load-carrying capacity with respect to size and weight of vehicles allowed to cross the bridge, or
• closing the bridge to vehicular traffic. In 1978, Congress created the Highway Bridge Replacement and Rehabilitation Program (Rehabilitation Program) and the Discretionary Bridge Program to provide states with funds needed to correct structural deficiencies. The programs apportion bridge funds to the states according to a Federal formula and the results of the Bridge Inventory. States are responsible for performing bridge inspections and maintaining federally funded roads and bridges in good condition. FHWA provides oversight of state bridge inspections and programs and maintains an inventory of all bridges. The primary purpose of Inspection Standards is to locate and evaluate existing bridge deficiencies to ensure public safety. Title 23 of the Code of Federal Regulations, Part 650, prescribes FHWA policies and procedures for managing highway bridges, and provides guidance for the Inspection Standards. Chapter 1, Subpart C of Part 650 requires bridge owners to follow Inspection Standards.

EXHIBIT A. Background
20
The Inspection Standards provide a definition of bridges (greater than 20 feet long) and requirements regarding the frequency of bridge inspections, qualifications of inspection personnel, and data to be collected. According to the Inspection Standards:
• Most bridges are to be inspected at 2-year intervals, but more frequent inspections are required on certain structurally deficient bridges that pose a higher than normal potential for collapse.
• Each state is required to have a bridge inspection organization capable of performing inspections, preparing reports, and determining bridge ratings in accordance with AASHTO and provisions in the Code of Federal Regulations.
• Each bridge shall be rated as to its safe load carrying capacity. If the calculated load rating is less than the state’s maximum legal load, the bridge must have signs posted as to the permitted load or be closed.
• The findings and results of bridge inspections, including the safe load ratings, shall be recorded by state inspectors on standard paper or electronic forms, and submitted to the Bridge Inventory.
FHWA is responsible for maintaining an inventory of the Nation’s public highway bridges in its Bridge Inventory database and submitting a biennial report to Congress on the conditions of all bridges. FHWA also performs an annual review of each state’s bridge inspection program and compliance with inspection standards. Bridge Inventory inspection reports provide important information on bridge location, age, and ownership. Each year, FHWA’s Office of Bridge Technology collects Bridge Inventory data from the states, updates the Bridge Inventory. In recent years, the number of structurally deficient National Highway System bridges nationwide has gradually declined from 6,715 in 2000 to 6,399 in 2004. The National Highway System includes the Dwight D. Eisenhower National System of Interstate and Defense Highways (Interstate System), urban and rural principal arterial routes, connector highways and toll roads that link arterial routes to major intermodal transportation facilities, and connector highways that link major military installations to highways. Federal law sets 40 tons as the maximum gross vehicle weight on the National Highway System, except for longer-combination vehicles on portions of the Interstate System in 22 states. Longer-combination vehicles are double-trailer, triple-trailer, and other truck configurations. The maximum gross vehicle weight for those vehicles differs by state and ranges from 43.2 to 82 tons. There are similar exceptions granted to forestry, logging, and mining vehicles, and those carrying specially permitted oversize loads.

EXHIBIT B. Scope and Methodology
21
EXHIBIT B. SCOPE AND METHODOLOGY The audit included a judgmental sample in addition to a separate statistical sample. For the judgmental sample, we reviewed inspection files for 252 structurally deficient National Highway System bridges in New York, Texas, and Massachusetts. From these, we referred the files for 43 bridges to the Corps for detailed technical review of the deficiencies. The Corps then reviewed a separate, nationwide, statistical sample of 67 bridges to determine the extent of the deficiencies identified in the judgmental sample. When we began our survey, the 2002 Bridge Inventory was the most current data available. Nationwide, in 2002, FHWA reported 6,476 structurally deficient National Highway System bridges, of which 248 were in New York (4 percent), 207 in Texas (3 percent), and 181 in Massachusetts (3 percent). New York and Texas were selected based on their large number of bridges and geographical differences, while Massachusetts was selected based on concerns about its bridge program. Together with engineers from the state, Corps, and FHWA, the audit team visited a total of five bridges in the three states to observe inspection procedures and view bridge deficiencies on-site. We also reviewed inspection files for 252 bridges. These bridges were judgmentally selected from the state DOT districts having the most structurally deficient bridges, including 60 bridges in New York, 83 in Texas, and 109 in Massachusetts. From this judgmental sample, the Corps examined approximately 100 inspection records and load rating calculations for 43 bridges in the three states and documented the problems found with the records. Where possible, we reviewed inspection reports for the three most recent inspection cycles to determine whether they had been inspected in accordance with Inspection Standards, AASHTO guidelines, and state bridge inspection and inventory criteria. We also reviewed FHWA’s internal controls and oversight over bridge inspections, bridge inventory, frequency of inspections, and qualifications of inspectors. The documents we reviewed generally covered the period from 1998 to 2004. Our audit was conducted from November 2003 through October 2004, in accordance with Generally Accepted Government Auditing Standards prescribed by the Comptroller General of the United States. The original objectives of this audit were to evaluate (1) whether structurally deficient bridges on the National Highway System have been inspected in accordance with Inspection Standards and (2) whether FHWA’s oversight was effective in addressing the deficiencies on these bridges. The objectives as restated during the audit were to evaluate whether state transportation departments inspected structurally deficient bridges on the National Highway System in accordance with Inspection Standards, whether state transportation departments properly calculated load limits and posted maximum

EXHIBIT B. Scope and Methodology
22
weight limits, and whether FHWA exercised effective oversight of the states’ actions in inspecting bridges, calculating load limits, and posting maximum weight limits. In addition to reviewing pertinent inspection and engineering records and reports, we interviewed staff from the FHWA Office of Bridge Technology, Office of Research and Development, FHWA Divisions, and the states. We used FHWA’s Bridge Inventory as our point of reference, as this information is reported to Congress and is the basis for funding and policy decisions. We also compared the information in state inspection reports with the Bridge Inventory to determine the accuracy of Bridge Inventory data. Throughout the audit, the OIG engineer advisor provided guidance to the audit team on how to identify potential safety concerns and questions involving load rating and posting on the judgmentally selected bridges from the three states, which were referred to the Corps for a detailed technical review. The methodology and scope of work for the Corps included reviews using the procedures of the Inspection Standards, AASHTO guidelines and state criteria, and cited specific inaccuracies and/or inconsistencies found in the cases reviewed. For example, the Corps found bridges with structure inventory, and appraisal data entries incorrectly coded including outdated or unsupported load ratings and posted operational status. In addition, we discussed our load rating and posting concerns with bridge experts from NTSB and AASHTO.
STATISTICAL SAMPLING METHODOLOGY The Corps performed a review of load rating and posting documentation for 67 structures that the OIG senior statistician randomly selected from the universe of 5,902 structurally deficient National Highway System bridges on the 2003 Bridge Inventory. The objective was to determine the extent of the inconsistencies and inaccuracies in load rating and posting procedures that the Corps identified in its separate review of the judgmental sample of bridges in three states. The Corps performed the following tasks:
• reviewed 67 load rating reports and supporting documentation for bridges in 30 different states and the territory of Puerto Rico, which had been randomly selected from all 50 states, Puerto Rico, and the District of Columbia.
• compared load rating procedures used in the reports to those accepted by FHWA,
• checked whether bridge member condition was adequately represented in the load rating calculations,
• reviewed Bridge Inventory data sheets to determine whether the provided data matched that reported to the Bridge Inventory, and
EXHIBIT B. Scope and Methodology
23
• checked whether bridges were properly posted for load based on the load rating calculations and that load postings were properly reflected in the inventory data.
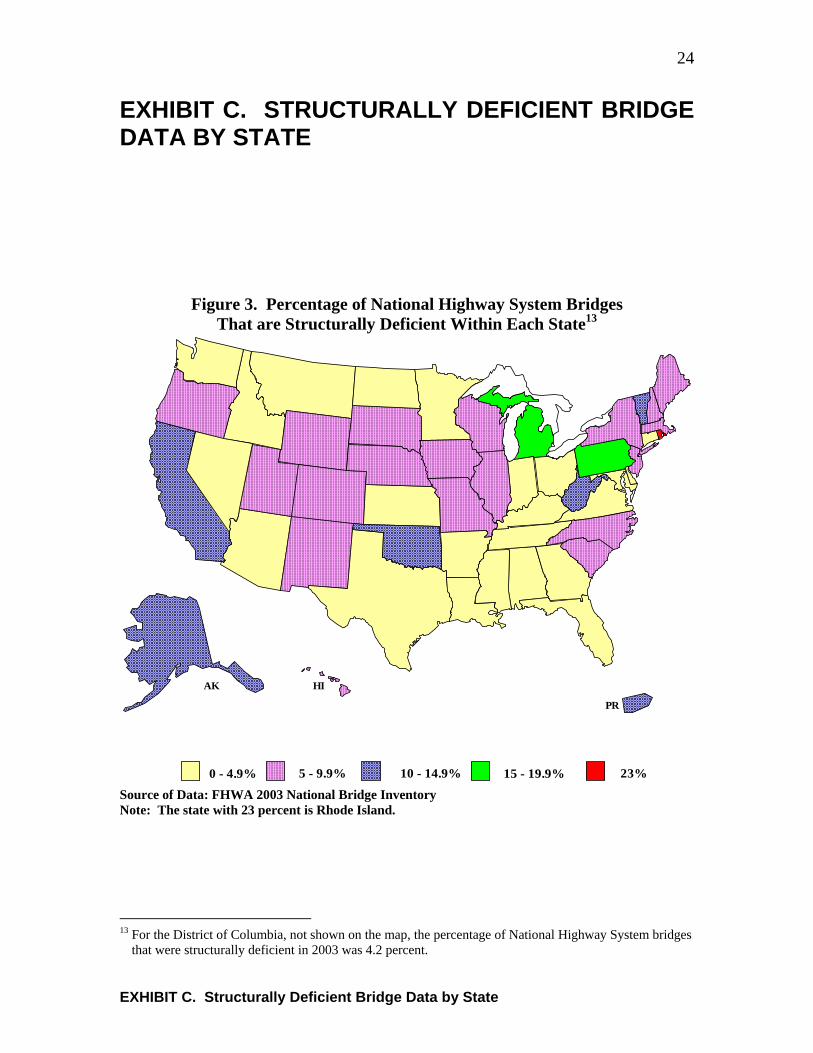
EXHIBIT C. Structurally Deficient Bridge Data by State
24
EXHIBIT C. STRUCTURALLY DEFICIENT BRIDGE DATA BY STATE
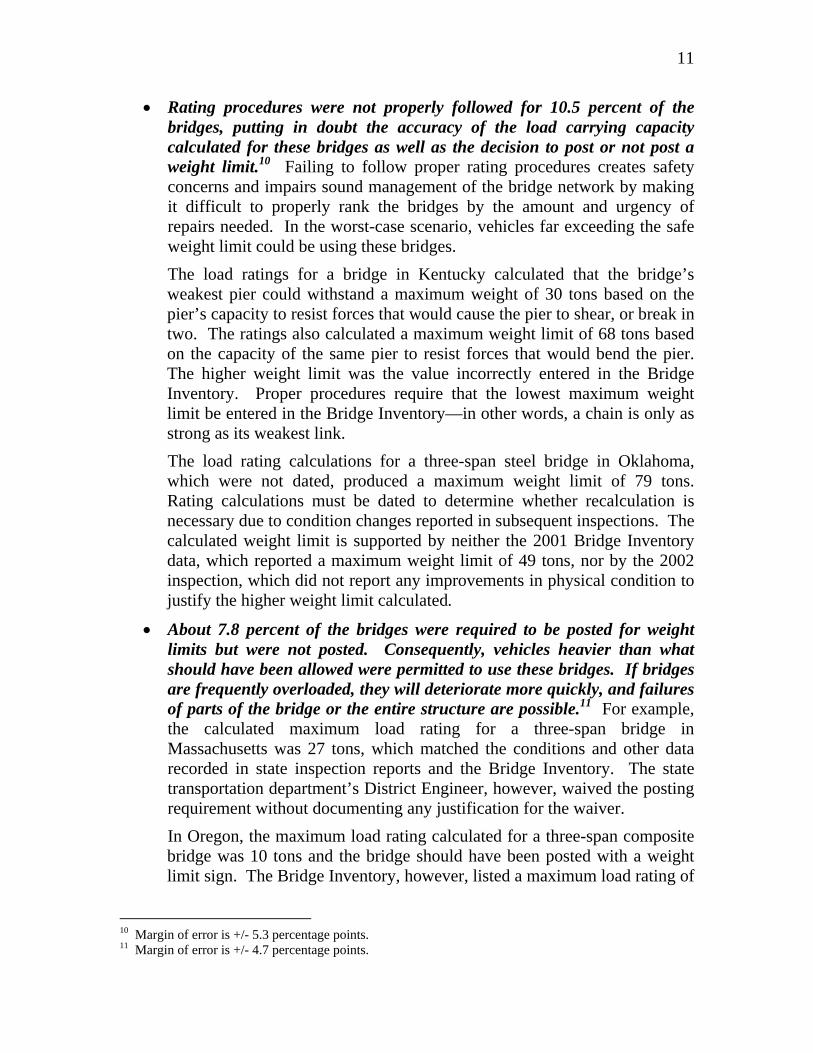
Figure 3. Percentage of National Highway System Bridges That are Structurally Deficient Within Each State13
0 - 4.9% 5 - 9.9% 10 - 14.9% 15 - 19.9% 23%
AK HI
PR
Source of Data: FHWA 2003 National Bridge Inventory Note: The state with 23 percent is Rhode Island.
13 For the District of Columbia, not shown on the map, the percentage of National Highway System bridges
that were structurally deficient in 2003 was 4.2 percent.

EXHIBIT C. Structurally Deficient Bridge Data by State
25
Figure 4. Total Average Daily Vehicle Traffic Over Structurally Deficient National Highway System Bridges14
0 - 10,000
10,001 - 20,000
20,001 - 30,000
30,001 - 40,000
40,001 - 50,000
> 50,000
AK HI PR
Source of Data: FHWA 2004 National Bridge Inventory
14 The total average daily vehicle traffic in 2004 over structurally deficient National Highway System
bridges in the District of Columbia, not shown on the map, was 58,933.

EXHIBIT D. Major Contributors to This Report
26EXHIBIT D. MAJOR CONTRIBUTORS TO THIS REPORT
The following individuals contributed to this report. Name Title Kurt Hyde Assistant Inspector General for Surface and Maritime Programs Michael E. Goldstein Program Director Jeffrey Ong Project Manager Stephen Gruner Senior Analyst Carl Christian Auditor Joseph Tschurilow Auditor Farrin Tamaddon Auditor Rodolfo Pérez OIG Engineer Advisor Petra Rose OIG Senior Statistician Clayton Boyce Strategic Communications Consultant Harriet Lambert Writer-Editor
APPENDIX: FHWA Response
27APPENDIX: FHWA RESPONSE
Subject: INFORMATION: Federal Highway Administration Response to Office of Inspector General (OIG) Draft Report, “Audit of Oversight of Load Ratings and Postings On Structurally Deficient Bridges”
From: J. Richard Capka
Deputy Administrator To: Kurt Hyde Assistant Inspector General for Surface and Maritime Programs (JA-40)
Thank you for the opportunity to review and comment on the OIG Draft Report, “Audit of Oversight of Load Ratings and Postings On Structurally Deficient Bridges.” We concur with the recommendations and plan to implement them as described herein. Following are our comments and planned actions on the specific audit report recommendations. Recommendation 1: “Revise its annual compliance reviews of state bridge programs to address the most serious deficiencies found during bridge inspections. FHWA should develop a risk-based, data-driven approach and metrics to focus on ensuring that states: a. Maintain up-to-date maximum weight limit records through state quality assurance/quality
control programs that ensure current bridge conditions are accurately incorporated into load rating calculations.
b. Post accurate maximum weight limit signs on bridges in a timely manner, when inspections indicate posting or revised posting should occur.
c. Coordinate with other states to improve the accuracy and completeness of the Bridge Inventory and reporting of results to Congress. FHWA should focus on reducing discrepancies, including the most frequent deficiency identified in our statistical sample—the failure of information in the Bridge Inventory to match bridge load rating results in state databases.”
Memorandum
Date March 21, 2006
Reply to Attn. of: HIBT-1
APPENDIX: FHWA Response
28Response: Concur with comments. The FHWA has already undertaken several actions that will help to address this recommendation. With the issuance of the updated National Bridge Inspection Standards (NBIS) regulation in January 2005, States are now required to assure that systematic quality control (QC) and quality assurance (QA) procedures are used to maintain a high degree of accuracy and consistency in the inspection program. In November 2005, FHWA issued a recommended framework for comprehensive QC/QA procedures, which includes quality of load ratings. The updated NBIS regulation also introduced a requirement stating that the individual charged with the overall responsibility for load rating bridges must be a registered professional engineer, and a requirement to establish a statewide procedure to assure that critical findings are addressed in a timely manner. Periodic notification to the FHWA of the actions taken to resolve or monitor critical findings must be part of the procedures. The National Bridge Inventory (NBI) database, which is the official source of all national bridge information, contains several report tools for data analysis as well as a new module scheduled for implementation in April of 2006 that will allow bridge engineers to quickly identify changes in items that typically would not change from year to year, such as load rating data. In 2003, FHWA initiated the use of a standardized format for use by the Division Offices to submit the NBIS annual program review summary reports. The standard format also serves as a guideline for the reviews ensuring that all aspects of the bridge inspection program are addressed each year. Sufficient flexibility exists for Divisions to focus their reviews on areas of greatest concern, risk or interest. Other initiatives are currently underway that will lead to further improvements in load rating practices and data reliability. These include the development of training in Load and Resistance Factor Rating (LRFR) methods, technical assistance with LRFR implementation, multi-State bridge inspection program exchanges and workshops, and clarification and updating of the 1995 NBI Coding Guide. We work closely with the American Association of State Highway and Transportation Officials (AASHTO) on each of these initiatives to facilitate acceptance and implementation. The FHWA recognizes that additional proactive oversight measures are needed. Accordingly, by August 31, 2006, the FHWA will convene a working group of representatives from the Office of Bridge Technology, Division Offices, and the Resource Center to evaluate options and make recommendations for incorporating the audit recommendations specific to load rating and posting into our annual bridge inspection program compliance reviews conducted by the Division Offices. The evaluation of options will consider the risk, availability of data and mining tools, and the availability of resources within FHWA. The working group will be requested to develop and issue a plan of action by January 2007. Since the NBIS regulation requires that the person responsible for load rating be a professional engineer, we will need to carefully consider the qualifications of those FHWA staff who review load rating calculations. There is currently no requirement that our own bridge engineers be registered professional engineers. Recommendation 2: “Evaluate greater use of computerized bridge management systems to improve states’ bridge inspection programs and enhance the accuracy of bridge load ratings.”

APPENDIX: FHWA Response
29Response: Concur with comments. Although the 1995 NHS Designation Act made implementation of bridge management systems (BMSs), originally required under the Intermodal Surface Transportation Efficiency Act of 1991, optional, the FHWA has supported the use of BMSs for many years and is continuously evaluating ways to assist States and other bridge owning agencies with implementation efforts. We note however that greater use of BMSs does not necessarily ensure improved accuracy of load ratings. The use of quality data and understanding of the functionality, capabilities, and limitations of BMSs and load rating tools are the key factors. Accordingly, we have undertaken many activities targeted to these key areas including:
Technical assistance to the more than 45 States and municipalities that license the Pontis BMS software.
Case studies of BMS utilization in California, Florida, and South Dakota. Development and delivery of training for the Pontis BMS software and element level
inspections. Executive sessions to educate upper management within State DOTs.
The FHWA will continue its efforts in each of these areas. In 2003, FHWA initiated a research project to collect element level bridge inspection data from the States and conduct exploratory data analysis. In 2006, we will initiate a follow-on project to conduct additional analysis focused on the potential for beneficial use of element level data for bridge management at the national level. In closing, we would like to emphasize that the FHWA’s role is to provide general oversight of the bridge inspection program. Our role is not to carry out the quality control and quality assurance responsibilities of the States. The FHWA Bridge Program Manual documents the guidelines and procedures typically followed during our annual NBIS program reviews and serves as a valuable resource to our staff. The annual review procedures and approach that we have implemented are consistent with the general direction of FHWA oversight responsibilities set by Congress in past and current legislation balanced against our available resources. The efforts of the OIG auditors to further improve national bridge inspection and load rating practices are greatly appreciated. If you have any questions or comments regarding this response, please contact Mr. Thomas Everett at (202) 366-4675.

The following pages contain textual versions of the graphs and charts found in this document. These pages were not in the original document but have been added here to assist screenreaders.
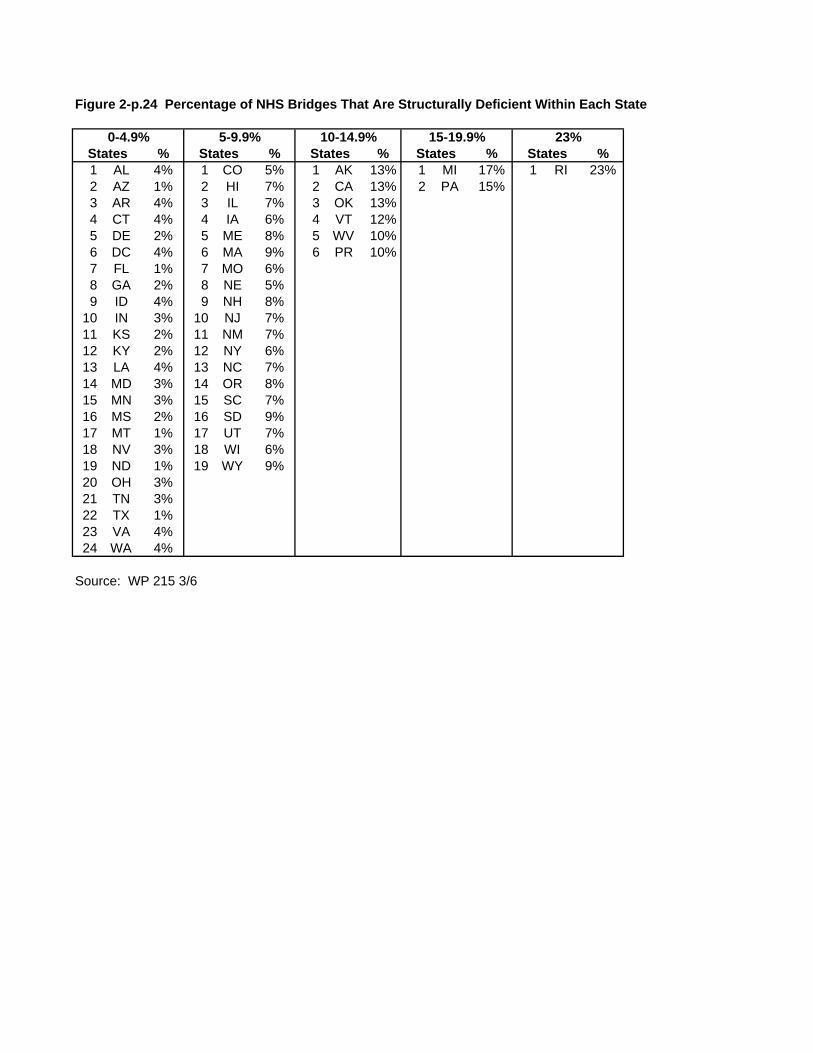
Figure 2-p.24 Percentage of NHS Bridges That Are Structurally Deficient Within Each State
0-4.9% 5-9.9% 10-14.9% 15-19.9% 23%States % States % States % States % States %1 AL 4% 1 CO 5% 1 AK 13% 1 MI 17% 1 RI 23%2 AZ 1% 2 HI 7% 2 CA 13% 2 PA 15%3 AR 4% 3 IL 7% 3 OK 13%4 CT 4% 4 IA 6% 4 VT 12%5 DE 2% 5 ME 8% 5 WV 10%6 DC 4% 6 MA 9% 6 PR 10%7 FL 1% 7 MO 6%8 GA 2% 8 NE 5%9 ID 4% 9 NH 8%
10 IN 3% 10 NJ 7%11 KS 2% 11 NM 7%12 KY 2% 12 NY 6%13 LA 4% 13 NC 7%14 MD 3% 14 OR 8%15 MN 3% 15 SC 7%16 MS 2% 16 SD 9%17 MT 1% 17 UT 7%18 NV 3% 18 WI 6%19 ND 1% 19 WY 9%20 OH 3%21 TN 3%22 TX 1%23 VA 4%24 WA 4%
Source: WP 215 3/6
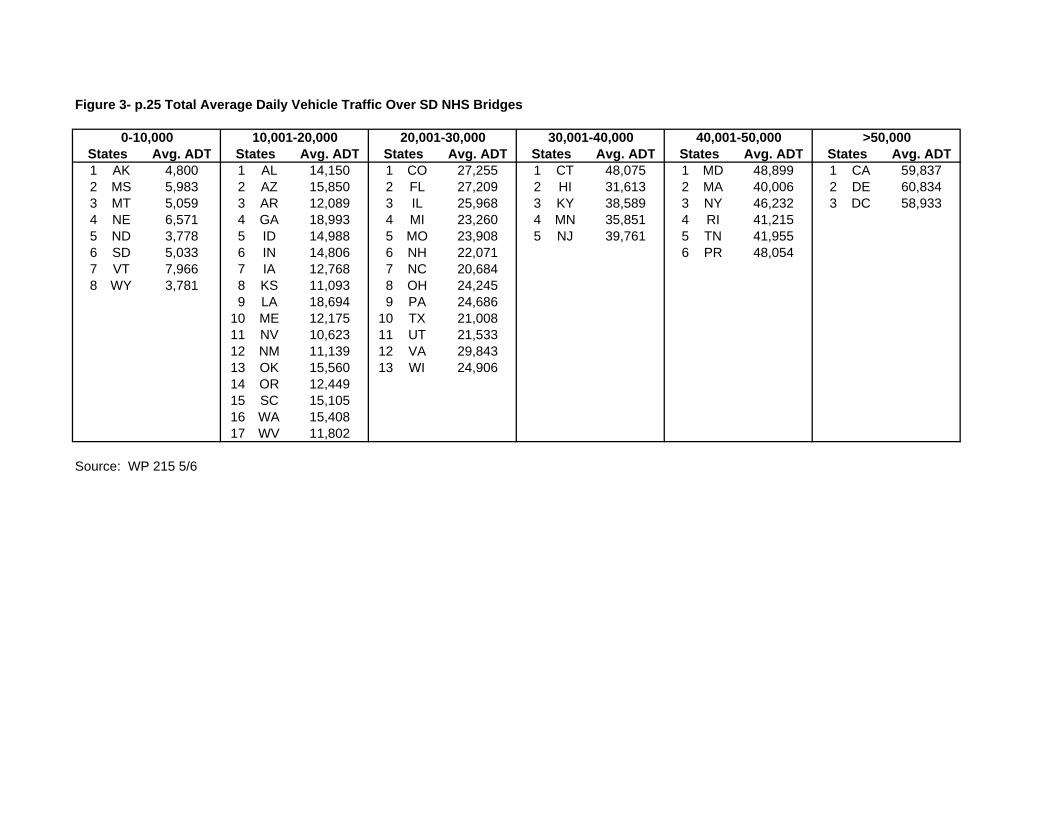
Figure 3- p.25 Total Average Daily Vehicle Traffic Over SD NHS Bridges
0-10,000 10,001-20,000 20,001-30,000 30,001-40,000 40,001-50,000 >50,000States Avg. ADT States Avg. ADT States Avg. ADT States Avg. ADT States Avg. ADT States Avg. ADT1 AK 4,800 1 AL 14,150 1 CO 27,255 1 CT 48,075 1 MD 48,899 1 CA 59,8372 MS 5,983 2 AZ 15,850 2 FL 27,209 2 HI 31,613 2 MA 40,006 2 DE 60,8343 MT 5,059 3 AR 12,089 3 IL 25,968 3 KY 38,589 3 NY 46,232 3 DC 58,9334 NE 6,571 4 GA 18,993 4 MI 23,260 4 MN 35,851 4 RI 41,2155 ND 3,778 5 ID 14,988 5 MO 23,908 5 NJ 39,761 5 TN 41,9556 SD 5,033 6 IN 14,806 6 NH 22,071 6 PR 48,0547 VT 7,966 7 IA 12,768 7 NC 20,6848 WY 3,781 8 KS 11,093 8 OH 24,245
9 LA 18,694 9 PA 24,68610 ME 12,175 10 TX 21,00811 NV 10,623 11 UT 21,53312 NM 11,139 12 VA 29,84313 OK 15,560 13 WI 24,90614 OR 12,44915 SC 15,10516 WA 15,40817 WV 11,802
Source: WP 215 5/6