Embed Size (px)
Citation preview

Office of the Auditor General Audit of Fleet Services Photo credit: City of Ottawa
September 2021

Audit of Fleet Services
Office of the Auditor General
Table of Contents Acknowledgement .................................................................................................... 2
Introduction .............................................................................................................. 2
Background and context .......................................................................................... 2
Audit objective and scope ........................................................................................ 4
Conclusion ............................................................................................................... 4
Audit findings and recommendations ....................................................................... 5
Appendix 1 – About the audit ................................................................................. 16

Audit of Fleet Services
1
Acknowledgement The team responsible for this audit was comprised of Sarah Parr from the Office of the Auditor General and KPMG, under the supervision of former Deputy Auditor General Sonia Brennan, my direction and that of former Auditor General Ken Hughes. My colleagues and I would like to thank those individuals who contributed to this project, and particularly, those who provided insights and comments as part of this audit.
Respectfully,
Nathalie Gougeon, CPA, CA, CIA, CRMA, B.Comm. Auditor General

Audit of Fleet Services
2
Introduction The Audit of Fleet Services was included in the 2019 Audit Work Plan of the Office of the Auditor General (OAG), approved by Council on April 24, 2019.
Background and context The City’s fleet services functions are carried out by the Municipal Fleet Services (Fleet) group within the Innovative Client Services Department and the Fleet and Facilities Maintenance Branch within OC Transpo.
Fleet Fleet supports all City departments as well as some City boards and utilities that rely on vehicles and equipment to deliver their services. Fleet is responsible for procuring, maintaining, administering, repairing, and replacing the City’s diverse fleet of roughly 5,000 non-revenue vehicles1, equipment and components. Fleet operates under a shared services model, charging back the vast majority of its costs to user departments (nearly $85M charged back out of $89M spent in 2019). Fleet had 194 full-time equivalents (FTEs) in 2019 and is made up of three branches (see Figure 1). Fleet delivers services through nine garages located throughout the city. Maintenance support is provided on a 24/7 basis throughout the year.
Figure 1: Organizational structure of Fleet Services
Each year, Fleet prepares draft operating and capital budgets for replacement and growth expenditures for the City’s Municipal Fleet and Transit non-revenue vehicles.
1 Non-revenue vehicles provide support to City operations. Unlike buses or trains, non-revenue vehicles do not generate revenues for the City.
Fleet Services
Fleet Maintenance & Technical Services
Branch
Fleet Safety & Training
Branch
Fleet Supply Chain & Operational Support
Branch

Audit of Fleet Services
3
These are approved by Council as part of the annual budget process. Fleet considers various factors including age, usage, and maintenance costs to determine when a unit should be replaced, while growth requests for new vehicles are determined by the client departments with Fleet’s assistance in forecasting costs.
The main system that Fleet uses to manage operations is M5, which tracks units (vehicles/equipment), parts and maintenance information. Fleet also uses FuelFocus, which integrates with M5, to monitor fuel details and Markview for processing vendor invoices. SAP is used as the back end financial system.
OC Transpo OC Transpo provides transit services across Ottawa and into Gatineau, serving nearly 340,000 riders a day.2 OC Transpo has a diverse fleet of 1,279 units, including 992 buses (various models), non-revenue vehicles and equipment. OC Transpo maintains its fleet at four garages with a total of 410 FTEs. The organizational structure of OC Transpo’s Fleet and Facilities maintenance branch is provided below.
OC Transpo uses SAP as the financial and asset (e.g. parts, buses) system while M5 is used to record maintenance work details.
Figure 2: Organizational structure of OC Transpo's Fleet & Facilities Maintenance Branch
2 Based on ridership prior to the COVID-19 pandemic (https://www.octranspo.com/en/about-us/).
Fleet & Facilities Maintenance Branch
Transit Maintenance Area 1 Unit
Transit Maintenance Area 2 Unit
Capital Projects & Engineering
Unit
Transit Facility Maintenance
Unit
Operational Services Unit
Materials Management Unit

Audit of Fleet Services
4
Audit objective and scope The objective of this audit was to review the City’s fleet services functions including fleet maintenance, lifecycle management and fleet operations in order to provide City Council with reasonable assurance that the City’s key systems, practices and procedures related to fleet are operating with due regard for economy, efficiency and effectiveness.
The scope of the audit included:
• the management and operations of Fleet Services in areas related to maintenance, inventory, warranty, material management and capital projects; and
• OC Transpo processes and practices related to maintenance and materials management.
Transactions from January 2019 to July 2020 were reviewed. The scope of the audit did not include compliance with legislation, policy or other requirements by Fleet and OC Transpo. Please see Appendix 1 for detailed audit criteria.
Conclusion Based on the work conducted with Fleet and OC Transpo, there are opportunities to increase the efficiency and effectiveness of certain fleet management processes. These include the monitoring of low usage units at OC Transpo, lease versus buy assessments, and warranty claims and recoveries. Improvements to these processes, as well as continued benchmarking of the City’s fleet operating costs against those of similar municipalities would increase value for money for the City. We also observed instances where controls related to invoice review and repetitive maintenance at OC Transpo weren’t designed and operating as intended, resulting in increased costs. Improvements in control design and performance could help the City avoid unnecessary costs and reduce waste. Additional opportunities to improve fleet practices were outlined in a management letter provided directly to management.

Audit of Fleet Services
5
Audit findings and recommendations Audit objective 1: Value for money Value for money refers to the extent to which fleet practices, goals and objectives, controls, monitoring and reporting support the efficiency and effectiveness of current operations. Audit objectives related to value for money were as follows:
• Assess the efficiency and effectiveness of asset life cycle management including needs identification; specifications; asset management; parts; fuel; and repairs and maintenance; and
• Assess the information for decision making to support asset life cycle management, i.e. timely, complete, and accurate information systems, reports, and embedded analytics.
We expected to see that key processes and practices were put into place throughout the asset lifecycle, for Fleet and OC Transpo, to help ensure effective and efficient operations. The following value for money findings is organized by lifecycle phase for Fleet and OC Transpo.
1.1 Need identification
1.1.1 Monitoring low usage units (OC Transpo)
The audit included an assessment of OC Transpo’s low usage units. We observed that OC Transpo did not have a process to identify or monitor low usage of non-revenue units. We reviewed a 2019 usage report (see Table 1) and identified 38 heavy units and 23 light units which had low usage based on Fleet’s low usage criteria3. Although usage is tracked, the percentage of units with low usage suggests that usage is not adequately monitored. Lack of monitoring of low usage units may lead to having too many vehicles and to delays in disposal of assets, which reduces the disposal value of the asset and results in wastage of fleet funds.
3 Low usage criteria include: less than 10,000 km for light units and less than 5,000 km for heavy units.

Audit of Fleet Services
6
Table 1: Summary of low usage units
Description Number of units Number of units with low usage
Percentage of units with low usage
Heavy units 90 38 42%
Light units 63 23 37%
Further investigation also identified a snow-melter that was rented for four months in 2010 at a cost of $100K and then purchased in 2011 for $175K4. M5 data shows that the unit was used for 3 hours over the last 10 years, incurring operating costs of $11K ($8K fuel, $3K maintenance). Based on the tender documents and the case study documents for purchasing the unit, the cost benefit analysis performed was inadequate. The purchase of the snow-melter appears to have wasted up to $286K.
Conclusion
Monitoring and analysis of low usage units needs to be improved to ensure units that are not being used as expected are reallocated or disposed of in a timely manner.
RECOMMENDATION 1 - MONITORING USAGE OF NON-REVENUE FLEET
The Director, Transit Operations should develop a process to monitor low usage units, including defining a threshold for low usage and providing reports on these units for management review at least annually. This will ensure more timely decision-making with respect to low usage units and potentially increase the value provided by these units during their lifecycle.
MANAGEMENT RESPONSE 1
Management agrees with this recommendation.
OC Transpo’s Management currently reviews usage data in the M5 scheduling system for replacement of vehicles. A Standard Operating Procedure (SOP) will be formalized to monitor and report on low usage of units, including defining a threshold for low usage. The SOP is expected to be completed by Q4 2021.
4 Both the rental and purchase prices are in pre-tax dollars.

Audit of Fleet Services
7
1.1.2 Inconsistencies in lease versus buy analysis (Fleet)
The audit included an assessment of the process for making lease versus buy decisions. It should be noted that leasing costs are paid for out of operating budgets whereas purchasing costs are paid for out of capital budgets.
Prior to entering into a lease arrangement, a lease versus buy assessment must be performed by Fleet to determine whether leasing or buying would be more cost-effective for the City. We reviewed a sample of these assessments and found that while they are being completed, there were inconsistencies and limitations in the way assessments were conducted and documented. This limited our ability to evaluate management’s decisions to lease or buy these units. We found that appropriate templates for assessment are not used consistently and evidence of review and approval is not always documented. In addition, the savings achieved by deferring capital outlays through leasing are not quantified within the assessment. These exceptions could lead to inconsistent decisions and potentially waste City funds.
Based on discussions with management and our review of the assessments, the availability of capital budget needed to purchase units is a key factor in lease versus buy decision-making. As a result, even when an assessment indicates that it would be less expensive to purchase units, they are often leased. For example, one of the assessments we reviewed was to procure 16 riding mowers. The annual operating cost, including the capital cost, for an owned unit was approximately $19K and the annual operating cost for a leased unit was approximately $26K (i.e. a variance of over $7K per unit or $119K per year for the 16 units). Despite this analysis, the decision was made to lease the riding mowers due to a lack of available capital budget.
Furthermore, our review of completed assessment templates found one or more cases where:
• Key requirements for the vehicle / equipment (i.e. its purpose) and non-financial considerations involved in the decision were not documented in the template;
• It was not clear what source data or documents were used to prepare the assessment;
• It was not clear when the source data was pulled from M5; • The final decision and rationale to lease or buy the vehicle / equipment was
not clearly documented in the template; and • The approval of the assessment and the date of its approval were not
documented in the template.
Audit of Fleet Services
8
These findings are likely a result of Fleet not using a consistent template and the assessments not always being appropriately reviewed and approved. It should also be noted that client departments are responsible for securing capital funding for growth units through a request approved by Council as part of the budget process. Should insufficient capital funds be obtained, client departments must find other ways to meet operational requirements, including the use of operational funding to lease the unit(s) until funding is approved.
Conclusion
Inconsistencies in the lease versus buy assessments and limited capital budgets for growth units can lead to client departments’ fleet needs not being fulfilled in the most cost-effective manner.
RECOMMENDATION 2 - ENSURE CONSISTENCY IN LEASE VERSUS BUY
ASSESSMENTS
The Director, Fleet Services should ensure that lease versus buy assessments are conducted using the appropriate templates, supported by recent data and appropriately quantify the costs saved by deferring capital outlays through leasing. The decision to lease or buy should be clearly documented and the assessment should be approved and dated in order to create an official business record.
MANAGEMENT RESPONSE 2
Management agrees with this recommendation.
The Director, Fleet Services will ensure lease versus buy assessments are conducted using appropriate templates that are supported by recent data and that they appropriately quantify the costs saved by deferring capital outlays through leasing.
The Director, Fleet Services will ensure decisions to lease or buy are clearly documented, and the assessment is approved and dated creating an official business record. This work will be completed by the end of Q4 2021.
Audit of Fleet Services
9
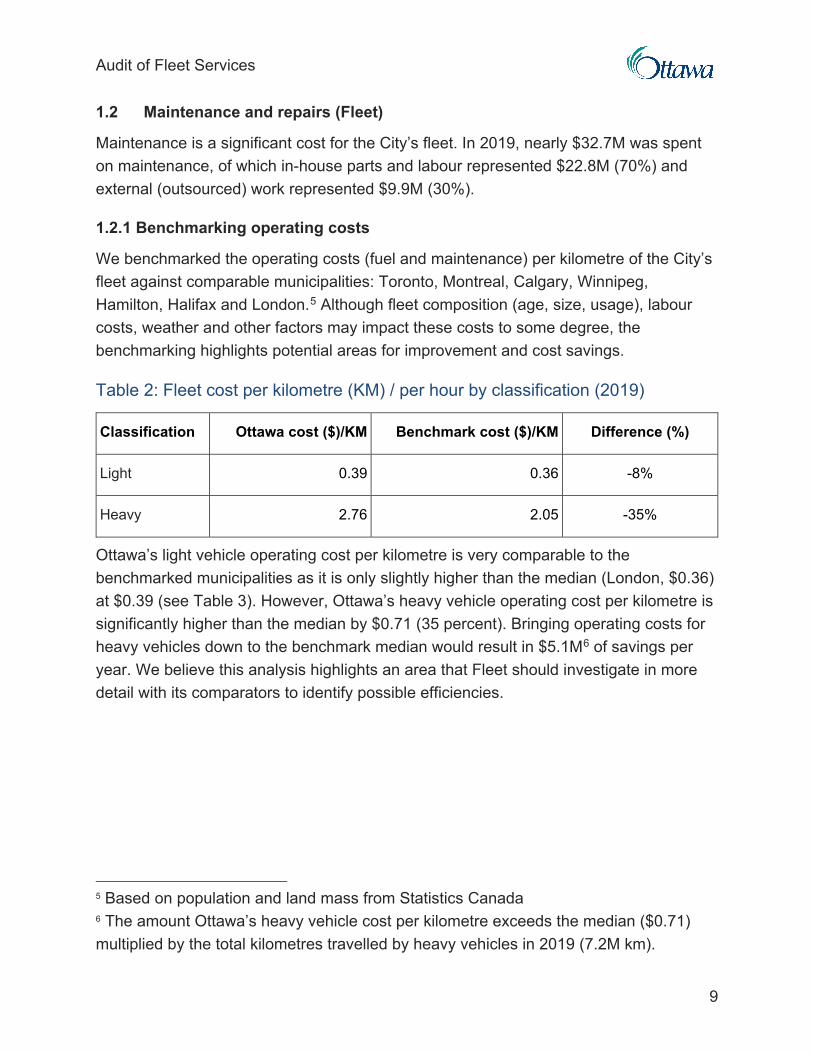
1.2 Maintenance and repairs (Fleet)
Maintenance is a significant cost for the City’s fleet. In 2019, nearly $32.7M was spent on maintenance, of which in-house parts and labour represented $22.8M (70%) and external (outsourced) work represented $9.9M (30%).
1.2.1 Benchmarking operating costs
We benchmarked the operating costs (fuel and maintenance) per kilometre of the City’s fleet against comparable municipalities: Toronto, Montreal, Calgary, Winnipeg, Hamilton, Halifax and London.5 Although fleet composition (age, size, usage), labour costs, weather and other factors may impact these costs to some degree, the benchmarking highlights potential areas for improvement and cost savings.
Table 2: Fleet cost per kilometre (KM) / per hour by classification (2019)
Classification Ottawa cost ($)/KM Benchmark cost ($)/KM Difference (%)
Light 0.39 0.36 -8%
Heavy 2.76 2.05 -35%
Ottawa’s light vehicle operating cost per kilometre is very comparable to the benchmarked municipalities as it is only slightly higher than the median (London, $0.36) at $0.39 (see Table 3). However, Ottawa’s heavy vehicle operating cost per kilometre is significantly higher than the median by $0.71 (35 percent). Bringing operating costs for heavy vehicles down to the benchmark median would result in $5.1M6 of savings per year. We believe this analysis highlights an area that Fleet should investigate in more detail with its comparators to identify possible efficiencies.
5 Based on population and land mass from Statistics Canada 6 The amount Ottawa’s heavy vehicle cost per kilometre exceeds the median ($0.71) multiplied by the total kilometres travelled by heavy vehicles in 2019 (7.2M km).

Audit of Fleet Services
10
Table 3: Benchmark of cost per KM for similar municipalities7
Classification OTT8 TOR MTL CAL WINN HAM HFX LON Median
Light 0.39 0.48 0.53 0.28 0.32 0.32 0.39 0.36 $0.36
Heavy 2.76 1.45 2.01 2.18 1.42 2.62 2.82 2.05 $2.05
1.2.2 Warranty process
Fleet Services captures the standard warranty terms for each unit in the M5 system when the unit is procured. When the M5 system identifies that a work order is for work covered under warranty, the technician is informed. Fleet then has the option of sending the unit to the original equipment manufacturer (OEM) to complete the work under warranty or to conduct the repair themselves and claim the negotiated rates for labour and parts. When this work is done in-house, Fleet’s Warranty Administrator is then responsible for making the warranty claim and recovering the warranty amount from the OEM.
Our review of maintenance jobs between January 2019 and June 2020 indicated that 295 work orders valued at $77,734 were tagged as warranty jobs but had no warranty recovery against them. We sampled 10 of these warranty jobs valued at $3,030 to understand why there was no recovery; there is no report that indicates why a recovery did not occur. For the 10 jobs sampled, there was no warranty recovery for the following reasons:
• in 5 instances (50%), the vendor was not notified about the warranty request; • in 4 instances (40%), the defective parts were not returned to the vendor; and • in 1 instance (10%), the warranty had expired, and therefore could not be
claimed.
There are problems relying on M5 to identify all work that might be covered under warranty. M5 captures repairs at a job description level, and the technical nature of
7 MBN Canada Benchmarking 2018 (http://mbncanada.ca/app/uploads/2019/11/2018-Fleet.pdf). 8 The costs for Ottawa are for 2019 whereas the costs for the other cities are for 2018. We would expect the costs for 2019 to be slightly higher than 2018 to account for inflation, however the impact of inflation would be marginal.

Audit of Fleet Services
11
warranty jobs makes it difficult to identify those jobs eligible for warranty. On discussion with the Warranty Administrator, jobs under warranty that are not flagged in the M5 system can only be identified through manual review of work orders.
We sampled 10 warranty claims totalling $22,840 that were recovered by the Warranty Administrator. In six (60 percent) of these cases, the work order was not tagged as a warranty job in M5. With the volume of maintenance jobs and the fact that the warranty process is carried out by only one Warranty Administrator, it is likely that many other jobs that could be covered under warranty are being missed. By comparison, even though OC Transpo has a less diverse fleet (limited bus models), they have five employees involved in the warranty process, compared to the one employee in Fleet.
Conclusion
Warranty claims are not submitted for all warrantable jobs and/or parts, leading the City to incur additional costs.
RECOMMENDATION 3 - IMPLEMENT MECHANISMS TO INCREASE WARRANTY CLAIMS
AND RECOVERIES
The Director, Fleet Services should implement more robust mechanisms to recover parts and labour costs covered under warranty including enhanced identification of warranty parameters and warrantable jobs in M5, reconciliation of warranty parts inventory and consideration of adding resources to the warranty team.
MANAGEMENT RESPONSE 3
Management agrees with the recommendation.
The Director, Fleet Services will implement more robust mechanisms to recover parts and labour costs covered under warranty including enhanced identification of warranty parameters and warrantable job in M5, reconciliation of warranty parts inventory, and consideration of adding resources to the warranty team by the end of Q3 20229.
9 To confirm increased recovery of parts and labour costs covered under warranty, management will perform a comparison of the annual dollar value of recoveries during the audit period versus the period following enhancements. To allow sufficient time to collect relevant data, this comparison will be completed by Q1 2023.

Audit of Fleet Services
12
Audit objective 2: Controls designed and operating effectively The purpose of this audit objective was to assess the design and operating effectiveness of controls related to the management and maintenance of fleet assets. We tested the design and operating effectiveness of:
• controls within the fleet asset lifecycle, including need identification and validation of specifications, acquisition as per approved capital budget for replacement and growth assets, parts availability for repair and maintenance and fuel availability for use; and
• controls that help ensure accurate, timely and complete information for decision-making.
We expected to see that key controls were put in place and operating effectively throughout the asset lifecycle, in both Fleet and OC Transpo, to help ensure effective and efficient operations. We also expected to find that information to support decision making and monitoring of fleet assets throughout their lifecycle was accurate, timely and complete. The following are the significant internal control findings for Fleet and OC Transpo.
2.1 Amount paid for services higher than standing offer price (OC Transpo)
OC Transpo receives services such as towing from external vendors with whom they have a negotiated standing offer price. Of the 8 towing invoices we sampled, 7 were from one vendor and had a price charged ($150) and paid which was above the standing offer price ($125), resulting in an overpayment of $1,487. These invoices were reviewed and confirmed as overpayments by OC Transpo staff. Staff reviewed other invoices from this vendor and confirmed a total overpayment of $2,887 (unaudited). This may be caused by inadequate review of invoices, where the price paid is not reconciled with standing offer prices.
Conclusion
Insufficient controls over vendor invoice payments related to the matching of charged prices to negotiated prices may lead to increased costs to the City.

Audit of Fleet Services
13
RECOMMENDATION 4 - REVIEW INVOICE PRICE AGAINST NEGOTIATED PRICE PRIOR
TO PAYMENT
The Director, Transit Operations should strengthen the process for review of standing offer prices for each vendor prior to approval and payment of invoice.
MANAGEMENT RESPONSE 4
Management agrees with this recommendation.
Currently, all Standing Offer information is available to managers and staff on Transportation Services Department internal resources and a secure management drive.
To strengthen this process, Transportation Services Department’s Document Control Administrator will distribute Request for Tender (RFTs) and Standing Offer information to each garage, on a quarterly basis, to maintain consistency amongst all maintenance locations. This will commence starting in Q2 2021. In addition, management will reconfirm with staff the requirement to verify costs against the standing offer prior to submitting an invoice for payment.
Targeted date of completion Q3 2021.
2.2 Repetitive maintenance within external work orders (OC Transpo)
Repetitive maintenance occurs when the same job is performed on the same unit on multiple occasions within a short period of time, increasing maintenance costs and unit downtime. OC Transpo identifies repetitive work orders through analysis using Microsoft Power BI, which helps staff track the frequency of maintenance for individual units (buses). However, we noted that their analysis focuses on repetitive work orders within a limited (seven day) timeframe and excludes non-revenue vehicles. Based on our analysis of OC Transpo’s external work orders, we identified 396 potential repeat repairs and reviewed a sample of 29 of these. Five of the 29 repairs sampled were confirmed by OC Transpo to be repeat maintenance which they had not previously identified.
We also conducted an analysis of parts movement history in SAP. Every time a part is required for a work order, the part will appear in the parts movement report in SAP. We identified 166 instances where parts were assigned to units multiple times within a short

Audit of Fleet Services
14
timeframe. We sampled seven units for which parts were sent to the external vendor performing maintenance work multiple times, of which three were considered repeats that were not identified in the previous analysis by management. This may be caused by incomplete parameters and analytics used to identify repeat maintenance through the exception reports currently used by management. Inadequate monitoring of repeat maintenance may lead to vendor quality issues (e.g. defective parts, poor workmanship) not being identified, increased downtime due to repeat maintenance, increased cost and wastage of City funds.
Conclusion
Current monitoring for repetitive work orders may be insufficient to identify repetitive maintenance, potentially leading to increased unit downtime and wastage of City funds.
RECOMMENDATION 5 - ENHANCE DETECTION OF POTENTIAL REPETITIVE WORK
ORDERS
The Director, Transit Operations should develop reports to identify repetitive work orders which are similar in nature, such as, same unit, same job description, jobs within 30-60 days of each other to enable OC Transpo staff to identify and investigate the root cause for the repetitive maintenance and reduce associated costs. Reports should include all units, including non-revenue vehicles.
MANAGEMENT RESPONSE 5
Management agrees with this recommendation.
In March 2021, OC Transpo’s management reviewed and improved existing processes for tracking and resolving repetitive work orders for Transportation Services Department’s conventional bus fleet.
A Standard Operating Procedure (SOP) will be developed, formalizing the improved process, and will also include a process for Para Transpo and Operational Support vehicles.
The SOP will be finalized and implemented by end of Q4 2021.

Audit of Fleet Services
15
RECOMMENDATION 6 - IDENTIFY UNITS CONSUMING PARTS AT A HIGHER-THAN-EXPECTED RATE
The Director, Transit Operations should identify units which have consumed parts at a rate higher than expected. In addition, the Director should consider implementing a process to monitor, and track parts sent to external vendors. These reviews will assist OC Transpo staff in identifying the root cause(s) of increased parts consumption and enable them to prevent future occurrences and associated costs.
MANAGEMENT RESPONSE 6
Management agrees with this recommendation.
This information is currently tracked in OC Transpo’s Fleet Maintenance Information Operating System and is reported on a monthly basis (overall spend, by fleet type). This reporting structure can be adjusted to highlight individual units and this information will be added to the monthly reports provided to management.
Information on parts sent to external vendors is currently tracked on vendor work orders and/or vendor job lines in OC Transpo’s Fleet Maintenance Information Operating System. Lists of parts sent to external vendors are also reviewed and approved by Superintendents. This information will be added to monthly reports provided to management.
These reporting adjustments will be implemented by the end of Q3 2021.

Audit of Fleet Services
16
Appendix 1 - About the audit Audit objectives and criteria The objective of this audit was to review the City’s fleet services functions including fleet maintenance, lifecycle management and fleet operations in order to provide City Council with reasonable assurance that the City’s key systems, practices and procedures related to fleet are operating with due regard for economy, efficiency and effectiveness.
Audit objective 1 Value for money: To examine practices, goals and objectives, controls, monitoring and reporting within fleet services functions to assess the efficiency and effectiveness of current operations.
Criteria:
• Assess the efficiency and effectiveness of asset life cycle management including needs identification; specifications; asset management; parts; fuel; and repairs and maintenance.
• Assess the information for decision making to support asset life cycle management, i.e. timely, complete, and accurate information systems, reports, and embedded analytics.
Audit objective 2 Effectiveness of controls: To assess the design and operating effectiveness of controls related to the management and maintenance of the fleet assets.
Criteria:
• Test the design and operating effectiveness of controls within the fleet asset lifecycle, including need identification and validation of specifications; acquisition as per approved capital budget for replacement and growth assets; parts availability for repair and maintenance; and fuel availability for use.
• Test the design and operating effectiveness of controls that help ensure accurate, timely and complete information for decision-making.
Scope The scope of the audit included the management and operations of Fleet Services in areas related to maintenance, inventory, warranty, material management and capital projects. The audit also included OC Transpo processes and practices related to maintenance and materials management. Transactions from January 2019 to July 2020

Audit of Fleet Services
17
were reviewed. The scope did not include compliance with legislation, policy or other requirements by Fleet Services and OC Transpo.
Audit approach and methodology The audit methodology included the following activities:
• Detailed walkthroughs to support the identification of detailed tests related to value for money and controls;
• Data analytics over the in-scope period to support value for money audit objectives;
• Assessment of reports to support key decisions related to fleet lifecycle; and • Tests of design and operating effectiveness for key controls.

Audit of Fleet Services
18
Visit us online:
www.ottawa.ca/en/city-hall/accountability-and-transparency/office-auditor-general
The Fraud and Waste Hotline is a confidential and anonymous service that allows City of Ottawa employees and members of the general public to report suspected or witnessed cases of fraud or waste 24 hours a day, seven days a week.
www.ottawa.fraudwaste-fraudeabus.ca / 1-866-959-9309