Embed Size (px)
Citation preview

Audit Manual
Chapter 13
Statistical Sampling
Sales and Use Tax Department
California State Board of Equalization
This is an advisory publication providing direction to staff administering the Sales and Use Tax Law and Regulations. Although this material is revised periodically, the most current material may be contained in other resources including
Operations Memoranda and Policy Memoranda. Please contact any board office if there are concerns regarding any section of this publication.


STATISTICAL SAMPLING
November 2001
Table of Contents
Statistical Sampling 1300.00 INTRODUCTION ....................................................................................................... 1301.00 General .................................................................................................................................. 1301.05 Testing with Statistical Samples ............................................................................................ 1301.10 Advantages of the Statistical Sample ................................................................................... 1301.15 Sampling Plans ...................................................................................................................... 1301.20
SETTING UP THE TEST ........................................................................................... 1302.00 General .................................................................................................................................. 1302.05 Define the Objective of the Test ............................................................................................ 1302.10 Define and Limit the Population ............................................................................................ 1302.15 Define the Characteristic Being Measured ........................................................................... 1302.20 Special Considerations .......................................................................................................... 1302.25
DETERMINING SAMPLE SIZE ................................................................................ 1303.00 General .................................................................................................................................. 1303.05 Sample Size Formula ............................................................................................................ 1303.10 Pilot Samples ......................................................................................................................... 1303.15 Sample Size Tables ............................................................................................................... 1303.20 Factors Affecting Sample Size .............................................................................................. 1303.25
SAMPLE SELECTION TECHNIQUES ...................................................................... 1304.00 General .................................................................................................................................. 1304.05 Unrestricted Random Sampling ............................................................................................ 1304.10 Stratified Random Sampling .................................................................................................. 1304.15 Systematic Sampling ............................................................................................................. 1304.20 Cluster Sampling ................................................................................................................... 1304.25 Combination ........................................................................................................................... 1304.30 Methods of Selecting a Sample ............................................................................................ 1304.35 Computer Audit Specialist ..................................................................................................... 1304.40
EVALUATION OF SAMPLE RESULTS .................................................................... 1305.00 General .................................................................................................................................. 1305.05 Statistical Sampling Symbols, Formulas and Definitions ...................................................... 1305.10 Analysis of Data ..................................................................................................................... 1305.15 Expanding a Sample ............................................................................................................. 1305.20
ESTIMATION — PROJECTION TECHNIQUES ........................................................ 1306.00 General .................................................................................................................................. 1306.05 Mean-Per-Unit Estimation ..................................................................................................... 1306.10 Difference Estimation ............................................................................................................ 1306.15 Ratio Estimation (Percentage of Error) ................................................................................. 1306.20
WORKING PAPER TECHNIQUES ............................................................................ 1307.00 General .................................................................................................................................. 1307.05 Minimum Documentation ....................................................................................................... 1307.10
STATISTICAL SAMPLING STANDARDS ................................................................. 1308.00 Minimum Errors and Evaluation Standards .......................................................................... 1308.05
GLOSSARY OF STATISTICAL TERMS ................................................................... 1309.00

AUDIT MANUAL
January 2000

STATISTICAL SAMPLING 1300.00
INTRODUCTION 1301.00
GENERAL 1301.05
This chapter provides guidelines to follow when a statistical sample is used to perform a test in an audit. There is no intention to establish rigid rules; rather this chapter will set forth general goals for statistical sampling and will allow the auditor discretion in the implementation of various analytical procedures to develop an appropriate sampling plan.
Planning and evaluating audit samples is a critical part of the Board’s mission, as stated in section 0101.03 of this manual. During the sample planning phase, the auditor gathers information about the taxpayer’s accounting systems and tax issues. The auditor should take the opportunity to educate the taxpayer on the objectives of the sampling process and encourage the taxpayer to offer suggestions on designing the sampling plan. The taxpayer may be able to share specialized knowledge of the accounting system and sampling techniques that could result in a more effective and efficient audit. The auditor should work with the taxpayer to find the best procedures for the given situation. However, it is a general principle of auditing that the auditor is ultimately responsible for assuring that adequate tests are conducted to provide the auditor with assurance of the accuracy of the records. The auditor should refer to Chapter 4 for general audit procedures regarding tests of specific items.
The primary objective of a sales and use tax audit is to determine, with the least possible expenditure of time for both the taxpayer and staff, the accuracy of reported tax. To accomplish this, the auditor should take into account the possibility of both overpayments and underpayments in analyzing the sampling plans necessary to accurately measure variances from the proper amount of tax due. All such variances should be taken into account by the auditor when assessing the net overpayment or underpayment resulting from the audit. A sample or an audit may result in a net refund if the dollar value of tax overpayment errors exceeds the value of tax underpayment errors. As stated in section 101.20 of this manual, the Board is just as willing to recommend a refund of an overpayment as we are to propose a deficiency determination.
The information and guidelines presented are designed for use by tax auditors and should be used in conjunction with material received in the statistical sampling class. Auditors receive a brief introduction to statistical sampling in their initial audit training class, and with the help of their supervisor or a more experienced auditor, they should use the information in this chapter to conduct audits incorporating statistical sampling techniques.
Section 1309.00 contains a glossary of terms peculiar to testing by the statistical sampling method. Board of Equalization tax auditors are required to have a working knowledge of these terms. It is suggested the auditor be familiar with these terms prior to reading this chapter.
STATISTICAL SAMPLING
January 2000

TESTING WITH STATISTICAL SAMPLES 1301.10
Publications of the AICPA (American Institute of Certified Public Accountants) and its committees have increasingly recognized the importance of statistical sampling in modern accounting and auditing. Statistical sampling is now used widely in private industry and by certified public accounting firms.
The Board encourages testing with the use of statistical sampling techniques whenever feasible. The Board’s auditors must develop and use recognized testing methods that will be accepted with confidence by taxpayers and their accountants.
ADVANTAGES OF THE STATISTICAL SAMPLE 1301.15
A statistical sample has two important characteristics — the estimation of the required sample size and the objective projection and evaluation of the sample results. When a sample is obtained by this method, it is possible to state with a desired level of confidence that the sample result is no further away than some calculable amount from the result attainable from a complete examination of all items. This provides a number of advantages which are explained as follows:
a. Sample Result Is Objective and Defensible
One important feature of statistical sampling is that, in an unstratified random sampling plan, all items in the population have an equal chance for selection as a sample item. This random selection process eliminates bias and would reduce any possible argument that the sample is not representative. The sample is not only objective but defensible before the taxpayer, a court of law, one’s supervisors, or even more important, before one’s own conscience.
b. Method Provides for Advance Estimation of Sample Size
An advance estimation of the necessary sample size can be computed based upon statistical principles. The advance estimation provides both a defense for the reasonableness of the sample size and a justification for the expenditure involved. However, determination of sample size is not purely mechanical, but calls for good analytical skills and decisions by the auditor.
c. Method Provides an Estimate of the Sampling Error When a judgment (non-statistical) sample is performed, there is no way to evaluate the reliability or accuracy of the results. When a probability sample is used, the results may be evaluated in terms of how far the sample projection might deviate from the value that could be obtained by a 100 percent examination of the population.
d. Statistical Sampling May Save Time and Money
With the ability to calculate an advance estimate of the required sample size, the statistical sampling approach may result in a smaller sample size than might be used on the basis of a judgmental approach. Although the statistical sampling approach will not always produce smaller sample sizes, the ability to estimate the required sample size in advance will help to reduce the possibility of over sampling.
e. Multiple Samples May Be Combined and Evaluated
When the entire test operation has an objective and scientific basis, it is possible for different auditors to participate independently in the same test and for the results to be combined as though the test was accomplished by one auditor. For instance, in an audit covering a number of locations, the audit can be accomplished independently and separately at the different locations and the results combined for an overall evaluation, if statistical sample techniques were applied.
AUDIT MANUAL
January 2000

ADVANTAGES OF THE STATISTICAL SAMPLE (CONT.) 1301.15
f. Objective Evaluation of Test Results Is Possible
The results of a judgmental sample can be projected to the population, but there is no way of objectively evaluating the reliability or accuracy of the test. If the statistical method is used, the audit test result can be projected, given a stated confidence level, to be within not more than a known interval from the result that would have been obtained if the population had been examined on an actual basis.
SAMPLING PLANS 1301.20
Attributes sampling provides a qualitative measure which estimates the proportion of items in a population containing an attribute of interest. In attributes sampling, the value of each data item is one of a few discrete qualitative categories:
a. missing or non-missing;
b. underpaid, correctly paid, or overpaid;
c. valid or invalid supporting documents
The objective of attributes sampling in auditing financial records is to reach a conclusion about whether or not there is sufficient evidence to conclude the frequency of errors exceeds a tolerable level. For example, does the rate of missing documentation exceed one percent or not? Attributes sampling is widely used in internal auditing and financial statement auditing, but is not frequently used in tax auditing. Attributes sampling could be used to determine if a managed compliance program is performing within an acceptable deviation rate.
Variables sampling, in auditing financial records, provides a quantitative measure which is used to estimate an average or total dollar value of a given population. In variables sampling the value of each data item is a quantity drawn from a continuous range, such as dollars, percentage, or number of pieces. The objective of variables sampling is to estimate a quantity. For example, what is the dollar amount of adjustment in taxable sales? Or, what is the percentage of sales excluded on the tax return for which no valid exemptions documentation exists? Tax auditors are nearly always doing variables sampling.
Another way to define the difference between attributes sampling and variables sampling is that attributes sampling is concerned with the frequency of an attribute, while variables sampling is concerned with the value of a variable.
Certified Public Accountants do many different types of audits, including tax audits. In financial statement audits, the auditor’s primary objective is to reach a conclusion about whether or not there is sufficient evidence to conclude that the financial statements are fair representations of the entity’s condition. Financial auditors do both attributes and variables sampling, but their final conclusion is either “yes” or “no”. Tax auditors have a more difficult task — to estimate the difference between the taxpayer’s reported tax and the tax due as estimated from the audit evidence. It is important to understand the difference in the two approaches in order to be able to successfully discuss the audit results with taxpayers and their accountants.
STATISTICAL SAMPLING
January 2000

AUDIT MANUAL
January 2000

SETTING UP THE TEST 1302.00
GENERAL 1302.05
Prior to determining the type of testing to be used in a given audit situation or if statistical sampling is appropriate, the auditor must make a thorough examination of the business operation during the period under audit. This examination should include a review of source documents, changes in business activity, and changes in accounting procedures and key personnel.
Form BOE–472, “Audit Sampling Plan,” will facilitate the use of sampling by assisting the auditor and taxpayer in documenting their sampling plan, and setting the criteria by which the sample results will be evaluated. In addition, the form covers many common situations that might arise in sampling, such as:
• The possibility that stratification or expansion of a sample may become necessary
• The potential of overpayments (e.g., over-accruals of tax on payables)
This form is to be used as a tool to gather information in conducting samples, as well as to make the taxpayer aware of important considerations that might impact the audit. This form should be completed with the assistance and input from the taxpayer, prior to the actual selection of the sample. The information and methods documented in this form are not binding on either the taxpayer or Board staff. The sampling plan can and should be continually evaluated (and changed, if necessary) based upon information obtained during the audit process. However, if any deviation from this sampling plan is required, the deviations will be fully explained and discussed with the taxpayer.
The purpose of the BOE–472 is to establish the most effective and efficient means of developing a sampling plan. This form must be used in all large audits (defined here as any audit with a cell designation of 1D through 4D) or any time sampling is performed. This plan will provide much of the information that will later be needed to complete the working paper documentation and audit comments. The Audit Sampling Plan should be included in the audit working papers as a memo schedule.
While the BOE–472 includes many situations that might arise in sampling, it cannot include them all. As such, the form should be modified (in Section 11, “Other”) to address any situations not included in previous sections of the form. Once the information has been evaluated, the auditor is in a position to determine the best method of testing. See Exhibit 1 for an example of the different types of information that might be included in some sections of the Audit Sampling Plan.
Once the decision has been made to test using available statistical sampling methods, the development of an audit sampling program that documents the information available and the anticipated course of action will provide the auditor with an organized plan. This plan can be modified as work progresses; however, changes to the plan should be explained and discussed with the taxpayer. See Exhibit 2 for an illustration of a statistical sampling audit program.
STATISTICAL SAMPLING
March 2002

DEFINE THE OBJECTIVE OF THE TEST 1302.10
Each test should have a specific, stated objective; subsequent statistical techniques are selected on the basis of that objective. The usefulness of any sampling test depends on a clear recognition of the relationship between the test objective and the corresponding audit objective.
For example: Is our objective to test sales for resale or to test all claimed deductions? The sample selection technique used might vary depending on what the true objective of the test is.
DEFINE AND LIMIT THE POPULATION 1302.15
The population must be defined to ensure that all items about which the auditor wishes to draw a conclusion have an equal or known chance of being selected in the sample. The population should be defined and limited to the area of audit interest. For instance, if the auditor is testing resales, the population should be limited to resales. In an accounts payable test, the auditor should limit the population to the accounts that are of audit interest. In a typical accounts payable population, only five to ten percent of the invoices may be in general ledger accounts of audit interest relative to possible overpayments or underpayments. Based on this, an auditor would require a sample size of at least 3,000 invoices (300 ¸ 10%) in order to obtain a sample of 300 invoices from the areas of audit interest (see section 1303.05 for minimum sample size requirements). Additionally, an auditor needs to consider that the population distribution could impact the sample size requirement and cause it to rise to 15,000 or more units, unless the population is well defined and appropriate statistical sampling techniques (i.e., stratification) are used. Therefore, it is best to have a population defined by the specific general ledger accounts that the auditor has identified as areas of audit concern and employ stratification techniques.
Although the majority of errors encountered by auditors relate to underpayments, audit staff should also be aware of, and discuss with the taxpayer, the potential of overpayments. Examples of general ledger accounts relevant to overpayment errors may include special inventory accounts, expense accounts that may include materials held for resale, printing expense (exempt printed sales messages), non-recurring engineering accounts (exempt prototypes), and software (custom or transferred via modem). Examples of general ledger accounts relevant to underpayment errors may include fixed assets, expensed inventories, research and development engineering, tooling, dues and subscriptions, and expense accounts that clearly relate to tangible personal property. Service-related accounts that may relate to assembly or fabrication of taxable property include engineering services, installation and assembly accounts, and lab expenses.
The auditor may want to consider using statistical sampling for examinations of areas other than an accounts payable or sales examination. Depending upon the taxpayer’s record keeping system, statistical sampling may be warranted for the fixed asset, journal voucher, or even debits to the tax accrual account (the auditor would still be required to reconcile the accrual account). When using statistical sampling for examinations of these other areas, it is important to work with the taxpayer to determine how the population will be defined and how stratification levels will be selected. Again, this discussion and information should be documented on the BOE–472.
AUDIT MANUAL
January 2000

DEFINE AND LIMIT THE POPULATION (CONT.) 1302.15
It is recommended that all tests include samples taken from the entire audit period whenever possible. In some instances, results from a statistical sample are projected to areas outside the defined population. This might occur if only one or two years of documentation are available in a three-year audit period. Generally, a minimum period of two years (unless an audit period is shorter) should be available in which to perform a statistical sample. On a rare occasion, fewer than two years but no less than one year may be used, but the reasons for using this short of a period must be well documented in the audit. However, it must be emphasized that no statistical inferences can be made regarding projection of results outside the tested population. The projection of these results to periods outside the tested population should be discussed with the taxpayer and the taxpayer’s written agreement should be obtained prior to commencing the sample(s).
A clear audit trail of the population should be included in the working papers. The auditor must clearly describe the choices, assumptions, and methodologies used in the statistical sample, specifically relating to the definition of the population so that an adequate trail is developed to permit subsequent evaluation of the auditor’s work by the taxpayer.
DEFINE THE CHARACTERISTIC BEING MEASURED 1302.20
The auditor should carefully define the quantity characteristic being measured and determine a means of measuring it. For example, in a test of resales, the quantity of measure may be the differences between audited and claimed resales, a ratio of audited resales to claimed resales, or the audited total resale amounts.
SPECIAL CONSIDERATIONS 1302.25
A number of special factors must be considered whenever a statistical sampling plan is being developed. These factors should be discussed with the taxpayer when developing the sampling plan (BOE–472), so that the auditor and taxpayer can reach agreement as to how these factors should be handled if they are encountered during the test. These factors include:
a. Multiple Locations — When a taxpayer has multiple locations, the auditor must take care to determine how the records are maintained and whether internal controls are adequate. It is necessary to determine whether the record keeping is centralized at one location or whether each location maintains its own records.
b. Arrangement of Source Documents — Documents may be maintained or processed by the taxpayer in a number of ways such as numeric, periodic, cyclical, alphabetical, or batch processed, etc. In most cases, the taxpayer’s method of maintaining documents will not preclude the use of statistical sampling techniques.
c. Non-Response — Occasionally the taxpayer will not be able to obtain a response to a confirmation request, e.g., XYZ letter, in spite of sending a second and maybe even a third request. The use of statistical sampling techniques should not change the auditor’s reasoning in determining whether to accept or disallow a transaction. The auditor should still determine whether the transaction questioned can be supported by alternative means.
STATISTICAL SAMPLING
January 2000
SPECIAL CONSIDERATIONS (CONT. 1) 1302.25 XYZ non-responses should not automatically be considered errors or non-errors. When XYZ responses are not returned, audit staff should make every effort, if not already done, to determine the taxability of the questioned sale by alternative methods. Such methods could include, but are not limited to:
• Examine the customer’s seller’s permit registration to determine whether or not the purchaser had a permit at the time of purchase, the type of business, reported sales, etc.
• Review the quantity and type of items sold — for resale or consumption.
• Review a subsequent resale certificate (prior to the start of the audit) but for similar purchases.
• Examine other types of items sold to the customer.
• Contact the customer by telephone to determine the true nature of the sale. If the customer indicates that the sale was for resale, a copy of the XYZ request letter should be faxed to the customer for immediate response. This XYZ response will be subject to the same verification as any other XYZ response.
• Accept or deny based on personal knowledge of the auditor gained from prior audits or other sources.
There are occasions when the taxpayer is unable to obtain an XYZ letter response because the customer is no longer in business due to a bankruptcy or other reason. In this situation only (not where there is just a change in ownership, such as a change in partners or from a sole proprietorship to partnership/corporation in which the previous owner continues the business under the new ownership), the sale will be considered a sale for resale if the property purchased by the customer is consistent with the type of sales the business makes. The auditor must verify file information regarding the close-out or bankruptcy of the business, as well as the type of business operations of the customer to ensure that the situation meets these specific requirements.
In all other situations, if the sale appears to be of a type that could be consumed, the taxpayer is unable to obtain a proper XYZ letter response, and the auditor is unable to determine the exempt status of the sale by alternative means, the non-response should be considered an error.
d. Timing — The auditor must take care to be aware of timing differences between the date of a transaction and the date it is recorded by the taxpayer. For example, paid bills are frequently recorded when paid rather than on the date of the invoice.
In addition, the auditor must take special care when a sample item is found to involve an installment contract. Not only must the auditor determine whether or not the sample item constitutes a difference, the auditor must also carefully determine the taxable measure of that difference. For example:
ABC Company, an unpermitized out-of-state vendor, enters into an installment contract with XYZ Corporation to furnish and deliver a piece of manufacturing equipment for $1,000,000. The contract specifies the following progress payments:
Payment 1 $200,000 Contract signing Payment 2 $200,000 Design approval Payment 3 $200,000 Completion of manufacture Payment 4 $200,000 Delivery Payment 5 $200,000 Completion of installation and testing
AUDIT MANUAL
January 2000
SPECIAL CONSIDERATIONS (CONT. 2) 1302.25 The contract specifies that title and possession of the equipment transfer from ABC Company to XYZ Corporation upon delivery, when the fourth installment payment becomes due and payable.
In this example, Payments 1, 2, 3, or 5 would not constitute differences for sampling purposes because they do not represent a “sale.” On the other hand, Payment 4 would be a taxable transaction and it would have a measure of $1,000,000. The fact that the statute of limitations has expired on one or more of the earlier progress payments or that Payment 5 is not yet due and payable would not alter this.
Care should be taken to determine whether or not XYZ Corporation reported tax on the earlier progress payments. If it did, then the $1,000,000 taxable measure should be reduced accordingly.
e. Voids — The initial problem is to determine whether voids (canceled or unused invoices) are included in big —“N” the total population. If so, the auditor can leave the voids in the sample and consider each as a ‘’zero” or non-error or take all voids out of the sample and the population. If voids are not included in the population, the auditor can disregard voids as they are not part of the population.
f. Credit Invoices, Credit Memos, and Debit Memos — Credit invoices, credit memos, or debit memos reduce or totally offset a previously issued invoice; they can also affect the taxable or exempt status of an original invoice. In general, the correct way of dealing with these items would be to evaluate all of the information available for the sample unit selected, i.e., follow the event (transaction) through its life, as shown in Method 1 and Method 2. For example:
1. If a claimed resale is determined in a test to be taxable, the auditor would make certain that only the net amount due is projected in the test.
2. Questioned transactions subject to a discount, returned, or written off as a bad debt would be considered and adjusted in calculating the net amount of error.
3. Only net amounts paid to vendors would be projected in a paid bills test.
4. For any item questioned in a sample, in general, the auditor would look at prior and subsequent events that might affect the net amount due on that sample item.
In order to conduct a valid statistical sample when credit invoices and credit/debit memos are included in the population from which sample units are selected, use either Method 2 or Method 3 described below. Method 2 allows for all available information on the sample items to be used in determining the taxable measure. When using Method 2, the credit invoices, credit memos and debit memos that are actually selected as sample items are deemed to be non-errors, i.e., they have a taxable measure of zero. To do otherwise, i.e., to analyze both the credit invoices and credit/debit memos that are selected as sample items under Method 2, as well as credit invoices and credit/debit memos related to sample items would mean that credit invoices and credit/debit memos in the population would have more than one chance of being selected for examination. This would bias1 the sample and render statistical evaluation of the sample results invalid.
1 Bias does not mean that the sample is inferior, inaccurate, or undesirable. It means that non-probability methods were used to select, examine, or treat sample items; therefore, the laws of probability do not apply and the evaluation of the sample results would be unsound and irrelevant.
STATISTICAL SAMPLING
November 2001
SPECIAL CONSIDERATIONS (CONT. 3) 1302.25 When using Method 3, the credit memos and debit memos selected in the sample are analyzed to determine the taxable measure as described below, but information from credit invoices, credit memos and debit memos related to sample items selected cannot be used when determining the taxable measure for sample items.
Given the above information, following are descriptions of three methods that can be used to handle credit invoices, credit memos, and debit memos:
Method 1
One statistical method of handling credit invoices, credit memos, and debit memos is to remove them from the population to be sampled. If a Computer Audit Specialist (CAS) is involved in the examination or if the taxpayer has the technological resources (computerized system or information systems department that can separate these types of transactions from the rest of the population), it is fairly easy to stratify these credit transactions from the population to be sampled. Some audit staff also have the technological knowledge and expertise to separate these types of transactions from the population to be sampled. Electronic records must be available for this method to be utilized.
By removing the credit invoices, credit memos, and debit memos from the population to be sampled, allowable credit transactions can be examined and offset (without affecting the statistical nature of the sample) as events that might affect the net amount due for items selected in the sample. This method also permits allowable bad debts or tax paid purchases resold to either be offset against sample items or to be tested and adjusted separately.
However, in order to use this method, staff must have access to electronic records in order to be able to remove the credit invoices, credit memos, and debit memos from the population to be sampled.
Method 2
Oftentimes, it is not possible or feasible to separate credit invoices, credit memos, and debit memos from the population to be sampled. When it is not possible to segregate these types of transactions from the population, they should not be ignored or removed from the sample.
Under this method, if selected as a sample item, the credit invoice, credit memo, or debit memo would be considered to have a zero measure of tax. Note that the credit invoice, credit memo or debit memo is left in the sample as a credit transaction.
Questioned original sales or purchases (debit transactions) selected as sample items would take into account, when determining the appropriate measure of tax for the sample item, all available information including prior and subsequent events. Therefore, other related invoices, tax only invoices, credit invoices, credit memos, and debit memos may be examined for information that would help determine the proper measure of tax due on the sample item. This method also permits allowable bad debts or tax paid purchases resold to either be offset against sample items or to be tested and adjusted separately.
AUDIT MANUAL
November 2001

SPECIAL CONSIDERATIONS (CONT. 4) 1302.25 Method 3
If credit invoices or credit memos in a sales examination (or debit memos in a purchases examination) are included in the population being tested, then these negative transactions should be included in the sample selected and handled in the same manner as the positive transactions in the test. They should be reviewed carefully and, if properly supported, should be included in the test results. Under no circumstances should they be ignored or deleted from the sample if they are included in the population being tested. Credit invoices, credit memos, or debit memos resulting in errors in the sample should be included as errors when computing the estimated ratio (percentage of error) if they are included in the population being tested.
If credit invoices, credit memos, and debit memos cannot or will not be removed from the population to be tested and the taxpayer is concerned with the statistical validity of the sample, the test can be conducted in such a manner as to maintain the statistical nature of the test, only if the following procedures are used (assuming that the sample units are selected using random/chance/probability methods):
1. Debit transactions selected as sample items would be examined, as in any other test, to determine the taxable nature of the transaction. Debit transactions determined to be in error would be assessed in the test as debit errors. Offsetting credit transactions, whether or not selected as a sample item, would not be examined or offset against the debit transaction.
2. Credit transactions selected as sample items would have to be analyzed. In order to determine the disposition of the credit transaction, the original transaction would have to be reviewed:
• In a test of total sales — If the original transaction was claimed as an exempt sale but was actually a taxable sale (i.e., if the original transaction would have been assessed as a debit error if it had been selected as a sample item), the credit transaction would result in a credit error. If the original transaction was a taxable sale or a supported exempt sale, the credit transaction would result in a zero measure of tax. The credit item itself remains in the sample as a credit transaction.
• In a test of exempt sales — If the original transaction was claimed as an exempt sale but was actually a taxable sale (i.e., if the original transaction would have been assessed as a debit error if it had been selected as a sample item), the credit transaction selected as a sample item would result in a credit error. If the original transaction was a taxable sale or a supported exempt sale, the credit transaction would result in a zero measure of tax. The credit item itself remains in the sample as a credit transaction.
• In a test of paid bills — If the original transaction would have been assessed as a debit error if it had been selected as a sample item, the credit transaction selected as a sample item would result in a credit error. If the original transaction was a purchase that was not part of the population being tested, a purchase not subject to tax, or a purchase exempt from tax, the credit transaction would result in a zero measure of tax. The credit item itself remains in the sample as a credit transaction.
STATISTICAL SAMPLING
November 2001

SPECIAL CONSIDERATIONS (CONT. 5) 1302.25 3. In order to maintain the integrity of the test, each individual sample item must
be examined and evaluated independently, without examining any related transactions. As such, debit or credit transactions not selected as sample items would not be examined or offset against any sample items. Also, bad debt deductions would not be offset against any sample items. Under this method, bad debt deductions would need to be examined and adjusted separately.
Using the above methods, following are examples of how credit items in a sales test, or debit memos in a paid-bills test, should be handled. These examples are illustrative, but not exhaustive, of the possible types of credit invoices, credit memos, and debit memos that might be encountered. The disposition of credit invoices, credit memos, and debit memos, as well as bad debts and tax paid purchases resold, is dependent upon the method used, as described above.
Before the test is conducted, audit staff and the taxpayer should discuss each of these methods and come to an agreement on the method to be used. The agreed-upon method to be used to handle credit invoices, credit memos, and debit memos, and bad debts and tax paid purchases resold should be documented on the BOE–472, Audit Sampling Plan.
AUDIT MANUAL
November 2001

SPECIAL CONSIDERATIONS (CONT. 6) 1302.25
Sales Test — Sample Transaction Examples
#
metIelp
maS
elpma
SmetI
tnuom
Atnev
Etneuqesbu
S
tneuqesbuS
tnevE
tnuom
Atnev
Eroir
P
roirP
tnevE
tnuom
A
elbaxaTfo
erusaeM
metIelp
maS
1dohte
M
elbaxaTfo
erusaeM
metIelp
maS
2dohte
M
elbaxaTfo
erusaeM
metIelp
maS
3dohte
M
11
11
eciovni
selaS
)elasel
baxat,t
pmexe
sade
koob
elaS(
00
0,0
12
22
OM
EM
TID
ER
C0
00,
01
–—
—0
00
00,
01
23
33
eciovni
selaS
00
0,5
44
4o
mem
nrute
R)
denr
uters
metie
htfo
½(0
05,
2–
——
00
5,2
00
5,2
00
0,5
35
55
eciovni
selaS
)elasel
baxat,t
pmexe
sade
koob
elaS(
00
0,7
55
6o
mem
tider
Cssel
htrow
raelcot
MC(
saffo
nettirw
,tn
uocca)
24
61
Ry
bderi
uqer
00
0,7
–—
—0
00
00,
7
47
77
eciovni
selaS
00
2,1
23
1t
nemts
ujd
AR/
Assel
htrow
ffoetir
wot
EJ(sa
ffonettir
w,t
nuocca
)2
46
1R
yb
deriuqer
00
2,1
–—
—0
00
02,
1
54
44
ome
mti
derC
00
5,2
–—
—3
33
eciovni
selaS
sade
koob
elaS(
)elasel
baxat,t
pmexe
00
0,5
A/N
some
mti
derco
N(/
noitalu
pop
ni)el
pmas
00
05,
2–
67
77
ome
mti
derC
00
0,4
–—
—8
88
eciovni
selaS
rofelas
detrop
pu
S()elaser
00
0,4
A/N
some
mti
derco
N(/
noitalu
pop
ni)el
pmas
00
79
99
ome
mti
derC
02
3,4
–—
—3
21
eciovni
selaS
00
0,4
)xat(0
23
02
3,4
A/N
some
mti
derco
N(/
noitalu
pop
ni)el
pmas
00
85
21
1o
mem
tider
C)
denr
uters
metI(0
00,
02
–—
—2
86
eciovni
selaS
sade
koob
elaS(
)elasel
baxat,t
pmexe
00
0,0
2
A/N
some
mti
derco
N(/
noitalu
pop
ni)el
pmas
00
00,
02
–
9no
xatselas
rof5
28
eciovni
selaS
54
5eciov
niroir
p0
53
dna
deurcca
saw
xatselas
05
3$
eh
Tnr
utertxe
ne
htno
etatS
eht
otdetti
mer.
delif
54
5eciov
nisela
St
ub
,degra
hcxat
oN(
)nee
beva
hdl
uohs
57
3,4
00
0
01
89
8eciov
nino
xatrof
ome
mti
derC
.nr
utersi
hno
tiderc
demialc
relleS(
ro/d
naC/
Ryle
mita
tnes
remots
uC
OP
dna
"elaserrof"
otO
Pdetcerroc
)C/
Rfo
stne
meriuqer
rehto
steem
08-
——
89
8eciov
nisela
SO
Ps're
motsu
C(ni
"elbaxat"
dekra
m)rorre
00
0,1 )xat(
08
08
0,1
A/N
some
mti
derco
N(/
noitalu
pop
ni)el
pmas
00
11
25
9eciov
nisela
S)elas
elbaxat
,tp
mexesa
dekoo
bela
S(0
06,
1
em
ulovtcelfer
otEJ
eciovni
node
wollat
nuocsi
d,t
nemts
ujda
R/A
;2
59
deussi
ome
mti
derc
00
4–
——
00
2,1
00
2,1
00
6,1
21
23
01
eciovni
selaS
)elasel
baxat,t
pmexe
sade
koob
elaS(
00
3ne
katt
nuocsi
dhsa
C)
03
ten
,syad
01
%5(
51
–—
—5
82
58
25
82
31
ome
Mti
derC
lluf
,ne
katto
nt
nuocsi
dhsa
C(,
doirep
tn
uocsid
nihti
wdia
pt
nuo
ma)t
nuocsi
dhsac
rofti
derc
00
8,2
–5
54
1eciov
nisela
Ssa
dekoo
bela
S()elas
elbaxat
,tp
mexe0
00,
82
A/N
some
mti
derco
N(/
noitalu
pop
ni)el
pmas
00
08,
2–
STATISTICAL SAMPLING
November 2001

SPECIAL CONSIDERA (CONT. 7) 1302.25 TIONS
Paid Bills/Purchases — Sample Transaction Examples
1 A
ssu
mes
tax
paid
pu
rch
ase
s re
sold
are
not
bei
ng
separa
tely
exa
min
ed a
nd a
dju
sted
. 2
Ass
um
es p
urc
hase
su
bje
ct t
o u
se t
ax.
If pu
rch
ase
su
bje
ct t
o sa
les
tax,
taxa
ble
mea
sure
wou
ld b
e ze
ro.
3.
“Tax
only
” sa
mple
ite
ms
shou
ld n
ot b
e ex
trapol
ate
d, w
het
her
neg
ati
ve o
r pos
itiv
e. A
ssu
min
g th
ese
sam
ple
ite
ms
are
act
ual in
voic
es, th
e m
easu
re s
hou
ld b
e ze
ro; jo
urn
al en
trie
s w
ill ge
ner
ally
not
be
incl
uded
in
th
e pop
ula
tion
of a p
aid
bills
tes
t.
#metI
elpma
S
elpma
SmetI
tnuom
Atnev
EtneuqesbuS
tneuqesbuS
tnevE
tnuom
Atnev
Eroir
Ptnev
Eroir
Ptnuo
mA
elbaxaTfo
erusaeM
metIelp
maS
1dohte
M
elbaxaTfo
erusaeM
metIelp
maS
2dohte
M
elbaxaTfo
erusaeM
metIelp
maS
3dohte
M
A,esa
hcrup
xates
Ude
urccaxat
on
000,51tiderc,de
nruter
metIde
ussi–
000,51—
—0
0000,51
B,esa
hcrup
xates
Ude
urccaxat
on
000,52
dellibe
htfo5/3
yln
Otibed,deviecer
smeti
ton
smeti
rofo
mem
deviecer
–000,01
——
000,51000,51
000,52
Cesa
hcrup
elbaxaT000,3
dlosermeti
desahcr
uP;es
uy
nag
nikam
otroirp
diapxat
saseifila
uqRPPT
on;dloser
esahcr
upfo
emit
tade
mialctiderc
elas
——
—01
0102
D;esa
hcrup
elbaxaTot
diapd
nade
urccaxat
esu
etatS
000,2061
dlosermeti
desahcr
uPsa
deifilauq;es
uot
roirp;dloser
esahcr
updiap
xatta
demialc
tidercRPPT
on
elasfoe
mit
——
—–
000,21
–000,2
1–
000,2
E,esa
hcrup
xates
Ude
urccaxat
on
005,2
rodnev
etatsfot
uO
tidua
nixat
esu
dessessas
metirali
misro
emasfo
rettelC
BA
rep
——
—0
00
F;o
mem
tibeD
rodnev
otde
nruter
meti–
000,6—
—o
n;esahcr
upxat
esU
deurcca
xates
u000,6
A/N
smeti
tiderco
N(/
noitalupop
ni)elp
mas
0–
000,6
G;o
mem
tibeD
dluo
hst
ubdesrever
ton
xatneeb
evah
–000,7
——
esu;esa
hcrup
xates
Ud
na%8
@de
urccaxat
etatS
otdiap
000,7065
A/N
smeti
tiderco
N(/
noitalupop
ni)elp
mas
0–
000,7
H
yrtne
"ylno
xaT"3
saw
taht
yrtne
PA
nasi
sihT
taht
xatesrever
oteda
mdesrever
neebeva
hdl
uohs
tibed000,01$
eht
neh
wderet
nesa
wo
mem
–008
——
:noitcas
nartlanigir
Oesa
hcrup
xates
Ud
nade
urccaxat
esU
tibeD)
%8(etat
Sot
diap)desrever
ton
xaT(o
mem
000,01008
–000,01
A/N
smeti
tiderco
N(/
noitalupop
ni)elp
mas
00
AUDIT MANUAL
November 2001

#metI
elpma
S
elpma
SmetI
tnuom
Atnev
Etneuqesbu
S
tneuqesbuS
tnevE
tnuom
Atnev
Eroir
Ptnev
Eroir
Ptnuo
mA
elbaxaTfo
erusaeM
metIelp
maS
1dohte
M
elbaxaTfo
erusaeM
metIelp
maS
2dohte
M
elbaxaTfo
erusaeM
metIelp
maS
3dohte
M
I
yrtne
"ylno
xaT"
3
PA
taht
xate
htsi
sih
Tel
baxatno
na
node
urccaO
Pe
htes
uaceb
esahcr
up
rorreni
"elbaxat"
dekra
msa
w
04
6—
—esa
hcru
pel
baxat-no
N0
00,
80
00
J;esa
hcru
pel
baxat-no
N%
8@
rorreni
deurcca
xates
uetat
Sot
diap
dna
00
0,8
04
6—
——
—000,8-
000,8-000,8-
K;esa
hcru
pxat
esU
neh
wdia
pro
deurcca
xato
ndia
peciov
ni0
00,
01
otdia
pd
nade
urccaxa
Tt
neuqes
bus
noetat
Sti
dua
eht
ninr
uterfo
tluser
asa
ton
,doire
pti
dua
eht
4
00
8—
—0
00
L;esa
hcru
pxat
esU
neh
wdia
pro
deurcca
xato
ndia
peciov
ni0
00,
00
1
otdia
pd
nade
urccaxa
Tt
neuqes
bus
noetat
Sfo
tluser
asa
nruter
otffats
tid
uahti
wtcat
nocg
nimoc
pu
eht
elu
dehcs
tid
ua5
00
0,8
——
000,001000,001
000,001
M
;esahcr
up
xates
Uro
rod
nevy
bdegra
hcxat
oN
neh
wresa
hcru
py
bde
urccadesa
hcru
p
00
0,0
2
yb
dellib
retalxat
esU
eht
htiw
deretsigerro
dnev
yb
diap
dna
draoB
resahcr
up
00
6,1
——
00
0
N
riaper
elbaxat
non
rofegra
hC
etatsfo
tuo
morfro
balot
diap
%8
@xat
esu;ro
dnev
sio
hw
,rod
nevetats
fot
uoxat
esu
tcellocot
deretsiger6
00
0,3
04
2—
——
—000,3-
000,3-000,3-
O
riaper
elbaxat
non
rofegra
hC
;robal
yb
degrahc
%8
@xat
selaS
rod
nevai
nrofilaC
00
0,2
06
1—
——
—07
0707
SPECIAL CONSIDERATIONS (CONT. 8) 1302.25
Paid Bills/Purchases — Sample Transaction Examples (cont.)
3.
“Tax
only
” sa
mple
ite
ms
shou
ld n
ot b
e ex
trapol
ate
d, w
het
her
neg
ati
ve o
r pos
itiv
e. A
ssu
min
g th
ese
sam
ple
ite
ms
are
act
ual in
voic
es, th
e m
easu
re s
hou
ld b
e ze
ro; jo
urn
al en
trie
s w
ill ge
ner
ally
not
be
incl
uded
in
th
e pop
ula
tion
of a p
aid
bills
tes
t.
4 Th
e abov
e ex
am
ple
s pro
vide
gen
eral gu
idan
ce a
s to
how
cre
dit
in
voic
es, cr
edit
mem
os, an
d d
ebit
mem
os s
hou
ld b
e h
an
dle
d. A
s m
enti
oned
pre
viou
sly,
th
ese
exam
ple
s are
not
exh
au
stiv
e of
th
e ty
pes
of si
tuati
ons
that
cou
ld b
e en
cou
nte
red a
nd c
are
sh
ould
be
taken
wh
en a
pply
ing
thes
e ex
am
ple
s to
dif
fere
nt
situ
ati
ons.
F
or e
xam
ple
: A
ssu
me
fixe
d a
sset
pu
rch
ase
s w
ere
exam
ined
on
an
act
ual basi
s. Th
e ta
xpaye
r pu
rch
ase
d, du
rin
g th
e au
dit
per
iod, a p
iece
of
equ
ipm
ent
that
cost
a s
ign
ific
an
t am
oun
t. Th
e ta
xpaye
r re
por
ted t
his
pu
rch
ase
du
rin
g th
e au
dit
per
iod, bu
t tw
o ye
ars
aft
er t
he
date
of pu
rch
ase
. I
n t
his
si
tuati
on, an
adju
stm
ent
wou
ld h
ave
to
be
made
in t
he
au
dit
to
corr
ectl
y ass
ess
the
mea
sure
of ta
x du
e at
the
tim
e of
pu
rch
ase
, w
ith
a c
orre
spon
din
g cr
edit
for
th
e m
easu
re o
f ta
x re
por
ted t
wo
years
late
r.
5 Th
is ite
m w
ould
be
ass
esse
d a
s an
err
or in
th
e te
st. A
sep
ara
te a
dju
stm
ent
outs
ide
the
test
wou
ld h
ave
to
be
made
to g
ive
the
taxp
aye
r cr
edit
for
th
e m
easu
re
of tax
alr
eady
paid
. 6
Sta
ff w
ould
nee
d t
o ve
rify
th
at
ven
dor
has
not
filed
a c
laim
for
ref
un
d.
7 Th
e pu
rch
ase
r w
ill h
ave
to
seek
a r
efu
nd o
f th
e sa
les
tax
paid
in
err
or f
rom
th
e C
alifo
rnia
ven
dor
. N
o adju
stm
ent
in t
he
paid
bills
tes
t is
warr
an
ted.
STATISTICAL SAMPLING
November 2001

SPECIAL CONSIDERATIONS (CONT. 9) 1302.25 g. Missing Documents — If during the course of a statistical test a document cannot
be located, normal auditing procedure requires the auditor to ascertain the reason for the missing or incomplete documents. When the investigation fails to reveal any specific reason, the auditor may first determine whether there is any acceptable alternative evidence. Fortunately, as more and more companies are converting to true paperless systems, it is generally not difficult to obtain a considerable amount of data about a missing invoice. The only statistical requirement is that an audited value be established for each sampling unit.
Statistical evaluation involves both estimating the extent of missing or incomplete documents and determining the possible effects that this might have on the auditor’s decision. If missing invoices would create a material error and the taxpayer objects to the sample, the auditor may want to discuss possible alternatives with his or her supervisor or CAS.
Based upon the facts of the situation and guidelines presented in this manual, the auditor and the taxpayer together shall discuss whether to consider missing or incomplete documents as incorrect (in error), correct (no error), whether to substitute another sample unit, or whether they should be removed from the sample base and projection.
Alternative procedures that can be considered, if appropriate, when missing documents are encountered include:
1. The taxpayer and/or auditor can contact the vendor or customer for a copy of the missing or unreadable documentation.
2. Allow the taxpayer to produce additional documentation on similar transactions for the same customer or vendor. The auditor can decide whether or not the taxability of the transaction(s) with missing documentation is similar to the transactions for which documentation is provided
3. Expand the initial sample size. For example, if the sample size for a stratum is 300, then pull an initial sample of 360 items. The auditor’s sample would consist of the first 300 items from the items pulled for which documentation exists. This method results in a relatively small incremental up-front cost to pull additional invoices, and avoids lengthy disputes over missing documents that may occur later in the audit.
4. Remove the missing item from the sample base and projection.
h. Taxpayer Request for CAS Involvement — If there is a disagreement between the taxpayer and the auditor regarding the procedures to be used, the auditor can enlist the assistance of the Computer Audit Specialist (see section 1304.40). If the taxpayer asks to consult directly with the CAS, he or she should be directed to the auditor’s supervisor, who will analyze the situation to determine whether CAS or Headquarters assistance is warranted or whether the situation can be resolved without their involvement. This type of situation should be resolved prior to conducting the sample in order to avoid the possibility of having to conduct another sample or having a non-concurred audit before any testing has even begun.
AUDIT MANUAL
January 2000

SPECIAL CONSIDERATIONS (CONT. 10) 1302.25 i. Tax Overpayments in Sample Plans — During the course of a statistical sample,
the auditor may detect both underpayments and overpayments. It is very important that the underpayments and overpayments be treated equally. Therefore, both overpayments (in certain situations) and underpayments need to be taken into account and treated the same when examining sample items, when analyzing the sample results, and when projecting the resulting errors to the population being tested. For example:
1. Purchase examination: Any sample items that are identified and verified as overpayments of use tax to vendors, overpayments of tax accrued and paid directly to the Board by the purchaser, or “tax paid purchases resold” should be tested in the same manner as underpayments. Reimbursement for sales tax paid to a vendor in error must come from the vendor, as the incidence of tax actually falls on the retailer.
2. Sales examination: Any sample items that are identified and verified as overpayments of sales or use tax reported by the retailer should be tested in the same manner as underpayments, provided that the retailer has not collected tax reimbursement from the customer. (If tax reimbursement is collected, these sample item overpayments cannot be used to offset underpayments from other sample items.)
There is no objection to projecting the results of a test that includes both overpayments and underpayments, as long as the test evaluates according to Board standards (sections 1305.15, 1308.05). The criteria for evaluating, accepting, and projecting samples resulting in overpayments or underpayments are the same.
STATISTICAL SAMPLING
January 2000

AUDIT MANUAL
January 2000

STATISTICAL SAMPLING
January 2000
DETERMINING SAMPLE SIZE 1303.00
GENERAL 1303.05
The sample size must be large enough to provide meaningful results, but not so large as to cause excessive work. In judgmental sampling, you can arbitrarily select a sample size, but the question of whether it is adequate to meet your objective is not measurable and is therefore based on subjective judgment. Statistical sampling techniques provide mathematically verifiable quantitative aids for estimating the sample size needed to achieve the desired precision and reliability. The adequacy of the sample size in meeting those specifications, however, can only be determined after all the sample items are examined and the results evaluated mathematically.
A minimum sample size of at least 300 items of interest is to be used for all tests unless the auditor can support a smaller sample size and it evaluates well. This means that in the case of a sample of sales for resale, within the context of a total sample of total sales, the sample size should be large enough to provide a minimum of 300 invoices that were claimed/ netted as sales for resale (at least 300 items of interest). In unstratified populations, 300 sample units will rarely be an adequate sample size. However, stratified samples with multiple strata (three or more) may have a sample size of less than 300 per stratum, but the combined test will normally contain at least 300 items of interest.
This 300 minimum sample size relates to individual transactions and not cluster or batch sampling. The sample size when cluster or batch sampling is used will depend upon the volume of transactions in each cluster or batch and will often result in a significantly smaller sample size than if cluster or batch sampling is not used.
While statistical techniques define and quantify the decisions to be made, the auditor must nevertheless evaluate the situation and identify what he or she may want to achieve in applying sampling techniques. The method used to determine the sample size is decided by the auditor based upon the circumstances or information available at the time, including the auditor’s knowledge of the business, review of internal controls, discussion with the taxpayer, and application of the guidelines discussed in this chapter.
SAMPLE SIZE FORMULA 1303.10
In order to use the formula for sample size, the auditor must be able to determine values to enter in the formula. These values can be obtained from a number of different sources. The auditor can compute the necessary statistics from the differences found in a prior audit even if the test was a block sample. The errors found in a prior block sample may be used to estimate the needed values required by the formula.
It is also feasible to compute the values from the cursory examination of a small number of current transactions — e.g., one day’s invoices, a page or two from the sales journal, etc. Once these evaluations have been made, the sample size can be computed by the following formula:
Sample Size = n =
See Exhibit 11 for an example of how to use the sample size formula.
If the sample size formula will be used to estimate the initial sample size, the auditor should provide the details of the statistical sample size formula to the taxpayer during the planning phase of the audit. The planned confidence and precision should be clearly stated on the BOE–472.
( ) s • z Ι
2

AUDIT MANUAL
January 2000
SAMPLE SIZE FORMULA (CONT.) 1303.10
After a sample has been pulled, the results can be used to prepare a sample size matrix to provide an overview of additional samples necessary to achieve a desired confidence and interval level. The auditor and taxpayer should discuss the feasibility of expanding the sample if the planned confidence or precision is not achieved. This discussion should be documented by comments on the BOE–472.
PILOT SAMPLES 1303.15
A pilot sample may be necessary if no other information is available to compute the needed values. The main disadvantage of using a pilot sample is that usually it will require expansion, which means a second pass through the population. This added step can be time consuming and may meet with resistance from the taxpayer. As a result, it is not recommended when other means are available.
A more efficient approach is to estimate the sample size that would produce an acceptable audit result. Then, if during the examination of the sample detail it becomes apparent that the test is not productive (not producing errors), some consideration can be given to shortening the examination.
A test being done on a random selection basis may be stopped at any time if the samples are examined in the random order in which they were selected, since samples were randomly selected from the entire population. However, any test being done on a systematic basis should be continued since the entire population has not been sampled. An alternative when using systematic sampling would be to increase the skip interval. This would produce fewer samples, but the entire population will have been sampled. Caution should be exercised if errors are discovered with the increased skip interval. If this occurs, the test should be restored to the original plan and completed as originally started.
Estimated sample sizes can be developed using the auditor’s analysis and evaluation of the audit situation and may involve the following factors:
a. Auditor’s knowledge of the industry
b. Cursory exam of a handful of documents, or a short period of transactions, to estimate the expected error rate
c. Review of the prior audit
d. Discussion with the taxpayer
SAMPLE SIZE TABLES 1303.20
Statistical tables are available to estimate sample size based upon a number of factors including population, desired confidence level and expected rate of occurrence. These tables are found in statistical sampling textbooks and should be available in the reference area of each district office. Exhibit 12, Sample Sizes for Variable Sampling, is a condensed form of one of these tables and could be useful in estimating needed sample sizes.
Most tables used by auditors are based upon infinite population sizes. It is possible to take the population size into account in determining the computed upper precision limit by making an adjustment called the finite population correction factor.
FINITE POPULATION CORRECTION FACTOR =
This has the effect of reducing the required sample size somewhat. It should not be used unless the sample size equals 5% or more of the population. The finite population correction factor may also be used in computing the standard error as shown in section 1305.10.
(N - n) (N - 1)

STATISTICAL SAMPLING
January 2000
FACTORS AFFECTING SAMPLE SIZE 1303.25
a. Population — statistical theory proves that in most types of populations where statistical sampling applies, the population size is only a minor consideration. This is because representativeness is ensured by the random selection process. Once an adequate sample size is obtained that includes a good cross-section of items, additional items are not needed regardless of population size.
b. Confidence level/interval — an increase in the desired confidence level or decrease in the confidence interval will both result in an increase in the necessary sample size.
For example:
An increase of the confidence level from 80% to 90% would increase the required sample size by approximately 65%, or
A decrease in the confidence interval will increase the required sample size proportionally.
c. Cost benefit ratio — before beginning the test, consideration should be given to the cost and time needed to conduct a test using statistical sampling techniques. The use of the random method for selecting a sample may impose an additional time requirement in the audit. This can be alleviated, in part, if the taxpayer assists in pulling the items selected for examination.
A key consideration should be materiality. A test should not be conducted just for the sake of testing. Also in audits of smaller taxpayers, it is frequently faster to examine all transactions on an actual basis.
The use of prior audit percentages of error should be considered when the taxpayer meets the specific criteria of section 0405.33 of this Audit Manual.
d. Standard deviation of the population — the standard deviation is used to indicate the level of variance in the population and is the key criteria in determining sample size in the Board’s formula. Understanding the population distribution in a test is important in selecting a sample size and statistical method to be used. Accounting populations generally do not have a normal distribution (normal bell-shaped curve); rather, they normally have a skewed distribution. For example, a positively skewed distribution is comprised of a large number of invoices with low dollar values and a small number of invoices with high dollar values. Unfortunately, determining the population distribution is complicated by the fact that the distribution is hidden from view. An example of a skewed population distribution and a sample selected is as follows:
Population = 20,000 Dollar Range = $1– $100,000 10,000 invoices = $400 or less 9,400 invoices = $401 to $29,999 600 invoices = $30,000 or more
Sample Size = 300 150 invoices = $400 or less 141 invoices = $401 to $29,999 9 invoices = $30,000 or more
When an auditor is unaware that a population is skewed, the low-dollar transactions are normally oversampled and the high-dollar transactions are undersampled. This will generally lead to an inaccurate and unrepresentative sample with a high interval. For these types of situations, stratification is an appropriate and time-saving remedy (section 1304.15).
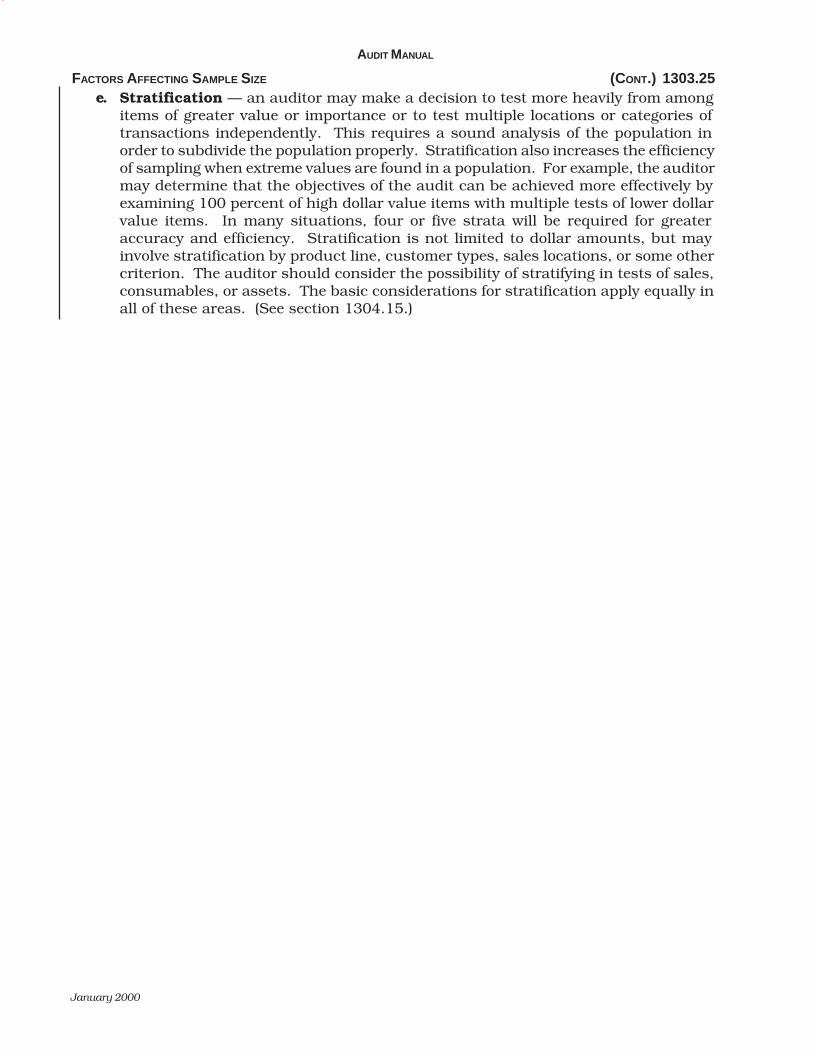
FACTORS AFFECTING SAMPLE SIZE (CONT.) 1303.25 e. Stratification — an auditor may make a decision to test more heavily from among
items of greater value or importance or to test multiple locations or categories of transactions independently. This requires a sound analysis of the population in order to subdivide the population properly. Stratification also increases the efficiency of sampling when extreme values are found in a population. For example, the auditor may determine that the objectives of the audit can be achieved more effectively by examining 100 percent of high dollar value items with multiple tests of lower dollar value items. In many situations, four or five strata will be required for greater accuracy and efficiency. Stratification is not limited to dollar amounts, but may involve stratification by product line, customer types, sales locations, or some other criterion. The auditor should consider the possibility of stratifying in tests of sales, consumables, or assets. The basic considerations for stratification apply equally in all of these areas. (See section 1304.15.)
AUDIT MANUAL
January 2000

SAMPLE SELECTION TECHNIQUES 1304.00
GENERAL 1304.05
The key element common to all tests to be evaluated statistically is that the items to be included in the test must be chosen at random. There are several acceptable methods for selecting a random sample, with those most common to the Board’s auditing explained in the following sections.
UNRESTRICTED RANDOM SAMPLING 1304.10
The unrestricted random sample is obtained by the use of a random number table or computer generated random numbers. This method is used to draw individual sample items from the entire population without segregating or separating any portion of the population. By this method, each and every item in the population has an equal chance of being selected as a sample unit. This is one of the most commonly used sample selection techniques.
STRATIFIED RANDOM SAMPLING 1304.15
An essential concept to understand is that accounting populations are not typically evenly distributed; rather, accounting populations normally have a skewed distribution. It is also important to understand that the purpose of an audit is to cover as much of the population dollars as possible in an efficient manner, not necessarily a certain percentage of the population invoices. Stratification is the methodology that allows this goal to be achieved and is the key to effectively and efficiently conducting an examination.
Stratified sampling is where all items in the population are divided into sub-populations, ideally according to similar types of characteristics (homogeneous groups); for example, periods, product lines, customer types, sales locations, dollar ranges, etc. Each sub- population is then sampled independently. After the results of the individual samples have been completed, they are generally combined into one overall population estimate in terms of a confidence interval and confidence level. Audit staff must contact their local Computer Audit Specialist for assistance in computing a combined evaluation of the population tested.
Stratification is used to reduce the effect of extreme values in measured variables (errors). By reducing the variability of the population within each stratum, stratification often reduces the sample size needed to achieve a desired level of precision and reliability. With stratified sampling, an auditor can cover 35–80% of the total population dollars while examining the same or fewer invoices than without stratification. Another benefit of stratifying the population is that the combined computed precision level for each stratum will normally reduce the overall confidence interval, resulting in a much better sample evaluation.
Unless the population is very homogeneous, stratified sampling is the preferred method to be used, especially where difference estimation is employed. In many situations, four or five strata will be required for greater accuracy and efficiency (e.g., $0–$400; $401–$5,000; $5,001–$25,000; >$25,000). For example, accounts payable populations would normally need to be stratified into multiple strata due to the variances in the population. At the lower end, almost all accounts payable populations have similar characteristics; such as, approximately 30%–50% of the invoices are between $200–$400, which represents only 1%–2% of the population dollars. Therefore, without stratifying the accounts payable population into multiple strata, an auditor may not achieve a representative sample of all the population dollars.
It should be noted that once the population has been divided into several strata, unrestricted random sampling procedures would be used on each of the resulting strata. See Exhibits 9 and 10.
STATISTICAL SAMPLING
November 2001

AUDIT MANUAL
January 2000
SYSTEMATIC SAMPLING 1304.20
Systematic sampling involves selecting samples at a given interval after establishing a random starting place. The random start is essential to ensure each unit in the population has an equal chance to be included in the sample. This method of sampling can be the most efficient if the documents in the population are not numbered. For instance, invoices can be selected by physical count rather than by invoice number.
Systematic sampling is the selection of every ‘’nth” item following a random start. In this type of sample, the size of the interval directly affects the size of the sample. As a result, the population and required sample size should be estimated in order to determine the interval necessary. (Population ÷ sample size = interval).
Although this method is indeed a simple method of selecting samples, the method must be used with caution since bias can be introduced into the sample. In general, if there is any periodic or cyclic arrangement of the items in the population, a bias can result. Further, it may not be apparent from the sample that the bias exists.
There will be some situations in which, for purely practical reasons, systematic sampling would seem to be the only viable approach. In these instances, if the auditor has reasonable assurance that no cyclical pattern exists in the filing arrangement, such an approach can be used.
CLUSTER SAMPLING 1304.25
Cluster sampling is a special form of sampling using either the random or systematic approach. However, instead of selecting a single sample unit, a group of sample items is selected. For instance, a group of ten consecutive invoices may be selected as a group or cluster. The group or cluster then becomes one sample unit.
Cluster sampling may be the only feasible method of sampling when there is a very high cost to retrieving items randomly selected across the entire population. This method can save time in accumulating the sample since fewer points in the file are sought. However, since each cluster represents one sample unit, some sampling efficiency may be lost. It is generally recommended that a minimum of 20 clusters be included in a test.
In cluster sampling, an auditor must first divide the population into non-overlapping groups (clusters). The sampling units within each group may exhibit considerable differences. The clusters, however, are chosen to be as nearly alike as possible. Next, a random sample of the clusters is performed. If all units in a cluster are sampled, a single stage cluster sample has been performed. However, an auditor may also perform a two-stage cluster sample-selecting a random sample of the clusters and then taking a random sample of the sampling units within the chosen clusters.
Batch sampling is a form of cluster sampling. In a situation where a taxpayer has filed documents in batches, it may be very difficult and time consuming to select individual invoices and trace them to their location. Selecting a batch as a sample unit will quite frequently reduce the time required to select the sample. This can be a very efficient form of cluster sampling.

STATISTICAL SAMPLING
January 2000
COMBINATION 1304.30
It is possible to combine different selection techniques — for example, a random sampling of days may be selected with transactions on those days tested on a systematic basis.
There are a wide variety of ways to select a sample other than those already discussed, and it will be up to the auditor to determine the most effective means based upon his or her review. The sample may be selected by pages, lines on a page, months, days, vouchers, etc.
METHODS OF SELECTING A SAMPLE 1304.35
The following paragraphs illustrate a number of aids available to assist the auditor in the use and selection of a statistical sample:
a. Use of Computers
The use of a computer to select the sample provides a number of advantages including significant time saving, elimination of incorrect number selection and automatic documentation in the form of printed reports. Audit staff should be aware that it is not only preferable, but also Department policy, to conduct an audit using computerized records, if available.
1. Board’s Computer Program — The use of the ‘’Random Number Generator” program allows the auditor to select items with replacement to be tested from one or a number of sequences at random in a matter of minutes. The program will provide the items selected in numerical or random sequence. See Exhibit 5.
2. Taxpayer’s Computer — Prior to conducting any tests, the auditor must make a thorough examination of the business operations, including a review of source documents and the taxpayer’s accounting system. Form BOE–472, Audit Sampling Plan, is a tool to be used by both the auditor and taxpayer to gather information prior to conducting a sample, so that the most effective and efficient sampling plan can be developed (see section 1302.15). This form, and the discussion with the taxpayer regarding the information on this form, shall be completed whenever sampling is done, whether testing is conducted using a computerized system or paper records. After the audit sampling plan has been agreed upon, the taxpayer should provide the records agreed upon in the plan.
An important part of designing the sampling plan consists of defining and limiting the population, whenever possible, to only the areas of audit interest (i.e., relevant accounts). For example, in testing accounts payable, it is preferable to have the population defined by the specific general ledger accounts that the auditor and taxpayer have discussed and identified as areas of audit concern. It is also important to employ stratification techniques in order to increase the efficiency of the sample when extreme values are contained in a population, which is generally the case in accounting populations. The taxpayer’s computer system or computerized data may be used to define and limit the population and employ stratification techniques.
When the taxpayer maintains machine-sensible records, the auditor and taxpayer, or a representative from the taxpayer’s information systems department, should discuss the use of this system for testing purposes. The auditor is encouraged to contact their local Computer Audit Specialist if any assistance is needed to determine the feasibility of using the taxpayer’s system for testing purposes or for guidance in setting up tests (see section 1304.40). If a CAS will be contacted for assistance, it is preferable that he or she be contacted prior to this meeting with the taxpayer, so that the CAS can also attend.

METHODS OF SELECTING A SAMPLE (CONT.) 1304.35 In discussing the use of the taxpayer’s computerized records for testing purposes, the taxpayer may express concern regarding the confidentiality or proprietary nature of the information included in the taxpayer’s electronic records. Taxpayers should be assured that confidential taxpayer information is required by both Board policy and law to be safeguarded.
Existing state and federal laws prohibit the disclosure, willful unauthorized inspection, or unwarranted disclosure or use of any information concerning any taxpayer by the State Board of Equalization, except as specifically authorized by statute (i.e., public information — business address).
Also, if the taxpayer expresses concern with allowing data tapes to leave their premises, audit staff should work with the taxpayer to make arrangements to retrieve the data necessary for the test while at the taxpayer’s site. The only data that will leave the taxpayer’s site is the data necessary to the auditing process.
When records are maintained in an electronic or computerized system, but the taxpayer indicates that they will not allow access to these records, the auditor should follow the procedures outlined in section 0403.10 of this Audit Manual. The District Administrator should also contact the Chief of Field Operations for guidance on obtaining access to computerized records, as required by the requirements of Revenue and Taxation Code sections 7053, Records, and 7054, Examination of Records; and Regulation 1698, Records.
b. Tables
There are a number of tables available to assist the auditor in selecting the sample. They contain random numbers, random letters or random months. These tables can be used in combination with each other if, for example, the taxpayer uses both alpha and numeric combinations to identify documents.
It is important to remember that even with the use of these tables, the sample must have a random start.
The major disadvantage in using these tables is the time necessary to identify the items to be selected and then to reorganize the items in a usable format, such as numerical. See Exhibit 6.
AUDIT MANUAL
January 2000

COMPUTER AUDIT SPECIALIST 1304.40
In response to the growing need to audit through sophisticated taxpayer computer systems, the Sales and Use Tax Department initiated a Computer Audit Program. The goal of the program is to provide technical support to auditors who conduct reviews of complex accounting systems, especially those consisting of machine-sensible records. The Computer Audit Specialists (CAS) can be asked to write specialized software programs to extract required accounting detail, if necessary. The CAS are also able to improve audit efficiency (reduce audit hours) and the accuracy of testing procedures. The CAS are located in the San Jose, Industry, Santa Ana and Out-of-State/Sacramento District offices. CAS are available to assist auditors from any district office within their geographical area of responsibility. The CAS are also available to assist audit supervisors or District Principal Auditors, if additional guidance is necessary. Refer to the Board Directory for phone numbers and any future CAS locations.
The current process is as follows:
1. Currently, it is mandatory that the CAS be contacted when the prior audit expended 400 or more hours.
It is critical that the CAS be involved in the audit at the earliest possible stage. For this reason, at the time each mandatory CAS-contact audit is assigned to an auditor, the lead auditor must contact his/her area’s CAS to arrange a meeting to review the prior audit and determine if the services of the CAS would be beneficial. This meeting should be held before the initial audit discussion with the taxpayer is scheduled. While initial contact with the CAS is mandatory, it may be determined after meeting with the CAS that his/her involvement is not necessary.
The CAS’ geographical areas of responsibility are as follows:
• Northern California and Out-of-State/Sacramento area CAS are responsible for the San Francisco, Oakland, Fresno, San Jose, Santa Rosa, Sacramento, and all Out-of-State offices
• Southern California area CAS are responsible for the Norwalk, Torrance, Van Nuys, West Covina, Ventura, Culver City, Orange County, Riverside, and San Diego offices
2. Audit staff are encouraged to contact the CAS (regardless of the size of the audit) whenever assistance is needed due to the volume of computerized records, or whenever the auditor needs assistance in setting up a test or has questions regarding statistical sampling procedures. Depending on district policy, the auditor’s supervisor should be notified prior to contacting the CAS. Ideally, the CAS should be contacted prior to the first meeting with the taxpayer or as soon as a problem arises.
Audit supervisors and District Principal Auditors can also contact the CAS for assistance or questions regarding statistical sampling or computerized auditing techniques. If a taxpayer requests consultation with a CAS, this request should be forwarded through the audit supervisor.
3. Typically, the specialist will first verify whether the computer tape provided by the taxpayer contains all the necessary information. Control reports are then developed which list account balances by month and year. These totals allow the auditor to verify that the electronic data processing (EDP) records are complete.
STATISTICAL SAMPLING
March 2002

COMPUTER AUDIT SPECIALIST (CONT.) 1304.40 4. After verifying the accuracy and completeness of the control reports, an interval and
frequency report are produced. Both the auditor and taxpayer receive copies of these reports. A mutual agreement between the auditor and taxpayer is reached on stratification points and sample sizes.
5. The CAS provides the auditor with a diskette, in Excel spreadsheet format, containing the strata samples that have been selected. Upon request, the CAS can provide a disk or documentation that supports the total population figure(s). This information should be provided to the taxpayer.
6. The auditor determines whether the selected sales/purchases are taxable and whether any errors have been made. Errors are noted, and statistical sample evaluations are compiled by the auditor.
AUDIT MANUAL
January 2000

EVALUATION OF SAMPLE RESULTS 1305.00
GENERAL 1305.05
The use of statistical sampling techniques enables the auditor to make generalizations and inferences about the total population by examining only a portion of that population.
After the auditor has located the selected items, he or she must examine each one and determine the cause and the audit significance of each exception. Doing so is much easier if the objective, the characteristic being tested, and the means of measuring it have been rigorously defined. Likewise, the auditor must be careful not to let the significance of one characteristic blind him/her to another. If an unanticipated characteristic should be found, it may be subject to adequate evaluation by means of the sampling technique in process, or a new sample and a different technique may be required. For example, if the only errors in a sample relate to one customer or vendor it might be preferable to examine those transactions on an actual basis.
STATISTICAL SAMPLING SYMBOLS, FORMULAS AND DEFINITIONS 1305.10
lobmyS salumroF noitinifeD
N .esrevinurodleif,noitalupopehtnismetiforebmuN
n .elpmasehtnismetiforebmun;eziselpmaS
x .elpmasehtnistinu;seulavlaudividnI
µ .esrevinuro,dleif,noitalupopfonaem;naemeurT
∑ .mus;folatoT
.elpmasfonaeM
.srorre,secnereffiD
.secnereffidehtfonaeM
σ .esrevinuro,dleif,noitalupopehtfonoitaiveDdradnatS
S .secnereffiDehtfonoitaiveDdradnatS
.rorrEdradnatS
desu(rotcafnoitcerrocnoitalupopetinifehtgnisurorrEdradnatS).noitalupopehtfo%5sdeecxeelpmasehtfiylno
ZeulaV
.evruclamronehtrednuaerarofeulav;tneiciffeocecnedifnoC
.I.CdeveihcamumixamehT.noisicerp;lavretniecnedifnoC
.%57sielbawollalavretniecnedifnoc
.L.C
dluohseromro%08fotneiciffeocecnedifnoca;levelecnedifnoCnahtsselsieziselpmasehtfI.)82.1si%08rofeulavZ(.desuebebdluohseziselpmasdeificepsehtta%08rofeulavTeht,ytriht
).4tibihxEeeS(.desu
_ x
Σx n
xd _ xd
Σd n
_
Σ(x–x)2 (n–1)
(n)(Σd2)– (Σd)2 n(n – 1)
S _ x n
S
S _ x
STATISTICAL SAMPLING
March 2002
• z xS
1)-(N
n)-(N• n
S

ANALYSIS OF DATA 1305.15
See Exhibit 7 for a sample evaluation worksheet schedule to be submitted with the completed audit. (Auditors must contact their local Computer Audit Specialist for assistance in computing a combined evaluation of a stratified sample — see Section 1304.15.)
Although it will not be necessary for the auditor to show mathematical computations, it is felt each formula should include the basic figures used in the computation. This will ensure that anyone reviewing the audit can readily see how the auditor arrived at his/her conclusions.
Since the auditor is sampling for variables, the confidence levels used for analysis purposes will generally be less than the confidence levels used in attribute sampling. An 80% confidence level is used in the evaluation of statistical samples by audit staff. Increasing or decreasing the confidence level will affect the confidence interval. Some reasons for confidence interval variation are: variability within the sample units; differences in sample size; small vs. large errors or credit errors. The fact the confidence interval is wide (greater than 75%) will require the auditor to analyze the sample to determine why this has occurred. This analysis will generally show that the auditor needs to expand the sample size, stratify the population, or take other measures to ensure the sample results meet the Board standards. The following factors can be used to assist in the evaluation of the sample and to determine what measures to undertake to remedy the situation.
(a) Mean of sample vs. mean of population
(b) Range of values in sample vs. range of values in population
(c) Substantial sample size
(d) Auditor’s analysis and evaluation of all the information available, based upon the guidelines presented in this chapter.
The confidence interval is a measure of the variability of the units included in the sample. It is not a measure of whether a sample is acceptable or unacceptable. However, a small interval is preferred because it indicates that the population is more homogeneous, contains less variability, and enhances the precision of the sample.
When a large interval (greater than 75%) is disclosed, the auditor must make a decision regarding the acceptability of the sample based upon the best information available. Some of the options to be considered in making this decision include:
1. Increase the sample size.
2. Stratify (by dollar value, product line or type of error).
3. Drop the test and accept reported amounts in that area of the audit.
4. Examine specific transactions on an actual basis.
5. Accept the test only if it is agreed to by the taxpayer (explanation for acceptance and taxpayer’s agreement should be contained in the working papers).
AUDIT MANUAL
March 2002

ANALYSIS OF DATA (CONT.) 1305.15
When a test results in zero errors the auditor must review the sample units and if they appear representative of the population, a no change report is appropriate.
A Computer Audit Specialist may develop some other tests to determine the acceptability of a particular audit sample.
A sample may result in a refund or credit if the dollar value of tax overpayment errors exceeds the dollar value of the tax underpayment errors in the sample. The auditor must review the sample results, and if they appear representative of the population and meet Board standards (as noted above and in section 1308.05), compute the negative estimated ratio (negative percentage of error) and project it against the population being tested to derive the projected measure of tax overpayments in the population.
EXPANDING A SAMPLE 1305.20
After analyzing the original sample results, sample evaluation, and any additional factors, the auditor must decide whether to accept the sample or to expand it. If the decision is made to expand the sample, the auditor should discuss the need for selection of additional sample items with the taxpayer. Using a sample size matrix, the auditor and taxpayer should come to an agreement regarding the number of additional sample items to be selected.
Care must be taken in deciding if expansion is really necessary because this requires a second pass through the population and will increase the cost and time required, for both staff and the taxpayer, to conduct the audit. As a result, every attempt should be made to select an adequate sample size before conducting the test, rather than relying on the ability to expand the sample at a later date.
If the taxpayer requests that a sample be expanded and the auditor believes that expansion is not necessary, the auditor’s supervisor should be contacted. The supervisor will analyze the situation to determine if expansion is warranted. The supervisor may want to consult with the CAS for assistance in making this decision.
If the auditor feels the test should be expanded or the sample is to be expanded at the request of the taxpayer, it should be remembered that the expanded sample will not replace the original but will rather extend it. The audit findings will then be based upon the combined results. If the same method is used to select the original and the expanded samples, they can be combined even if they are conducted by different auditors.
When expanding a sample at the taxpayer’s request, the auditor should elicit as much assistance as possible from the taxpayer in order to minimize the additional time needed to complete the audit.
It is important to advise taxpayers, prior to the start of work on a second sample, that they cannot later accept the initial sample and disregard the expanded sample if the combined results prove to be unfavorable.
STATISTICAL SAMPLING
March 2002

AUDIT MANUAL
January 2000

STATISTICAL SAMPLING
January 2000
ESTIMATION — PROJECTION TECHNIQUES 1306.00
GENERAL 1306.05
There are three basic methods used by the Board to project sample results: mean-per-unit estimation (simple projection), difference estimation, and ratio estimation (percentage of error). Until the results of the sample are known, a determination of which method of projection provides the best estimate cannot be made. An example of these estimation techniques is shown in Exhibit 8.
All errors in the test, both underpayments and overpayments, should be included in the evaluation and, if the results meet Board standards, should be projected to the population tested.
MEAN-PER-UNIT ESTIMATION 1306.10
Estimates are made from the audited values in the sample. The average audited value of the sample items multiplied by the number of units in the population can be used to estimate the total value of the population. This type of estimation is generally not used because it almost always results in a larger standard deviation, which requires a larger sample. At times, it may be a useful statistical method in situations where no recorded book value is available for individual population items or the taxpayer has been using estimates.
DIFFERENCE ESTIMATION 1306.15
Estimates of the total error in the population are made from the sample differences by multiplying the average audited difference (sum of the differences ¸ sample size) by the number of units in the population. This method cannot be used unless there is both a recorded value and an audited value for each item in the sample.
This method almost always results in a smaller sample size than mean-per-unit estimation because the standard deviation of the difference is smaller than the standard deviation of the audited values.
Difference estimation should be used in situations where the errors discovered in the sample tend to be constant and have no relationship in size to the recorded book value. An example of this type of error would be handling charges that are a flat amount regardless of the size of the transaction.
RATIO ESTIMATION (PERCENTAGE OF ERROR) 1306.20
The ratio is formed by dividing the net sample difference by the total sample value, when using unrestricted random sampling. This ratio is then applied to the population total to estimate the error in the population being tested.
This method also requires the use of smaller sample sizes than the mean-per-unit method. Like difference estimation, recorded values are also required for the population in order to use ratio estimation. This is the most efficient method when the differences have a consistent relationship to recorded book values.
This is the estimating technique used most frequently in audits conducted by the Board. It is recommended that this method be used to project sample results unless there is convincing evidence to the contrary.

AUDIT MANUAL
January 2000

STATISTICAL SAMPLING
January 2000
WORKING PAPER TECHNIQUES 1307.00
GENERAL 1307.05
Statistical sampling techniques must be adequately documented in the working papers, not only to provide a means for review but, if necessary, to justify expansion of the sample. It is also necessary to support the validity of the technique used in the test.
MINIMUM DOCUMENTATION 1307.10
Minimum documentation should include:
a. Audit Sampling Plan Form BOE–472. Form BOE–472 is required for all large audits (cell designation “D”) or any time sampling is performed.
b. The population total, its source and a reconciliation of strata totals to the population total, if several strata are involved.
c. The method of selecting sample items — for example, if a random number table is used, the documentation should include the name and source of the table, starting point, route through the table and the stopping point. If a random number generator was used, the random seed should be documented in the working papers. This information is essential in the event the sample is to be expanded.
d. A listing of the sample items and any differences noted. Whatever methods are used, proper referencing is essential to provide the proper audit trail.
NOTE: Generally, unless a sample is relatively small, a separate schedule for differences or questioned items should be made for ease in the summary or analysis of the sample results. At a minimum, the schedule of questioned items should include the following, as applicable for the type of test:
1. Date
2. Invoice number
3. Vendor/Customer name
4. Vendor/Customer address
5. Shipped from/to
6. Complete description of the item(s) in question
7. Amount in question
8. If applicable, general ledger/cost center/department that AP purchase(s) charged to
e. Evaluation of sample results — this is most frequently completed in a worksheet format. A sample evaluation template, as illustrated in Exhibit 7, is included as part of the electronic audit package worksheets. In addition to numeric data, the evaluation may also include additional information pertinent to the sample or population that the auditor feels is necessary to properly evaluate the test.
f. The audit conclusion reached — this will be used as the basis for projecting the results of the sample to the total population.

AUDIT MANUAL
January 2000

STATISTICAL SAMPLING STANDARDS 1308.00
MINIMUM ERRORS AND EVALUATION STANDARDS 1308.05
The projection of a sample result to the population total is based upon the theory that the sample is truly representative of the population from which it was drawn. At all times, it should be remembered that the goal of a sample is not to find some minimum number of errors. The emphasis on a minimum number of errors can lead to inaccurate sampling. The goal is to draw a sample that provides a representative and reliable picture of the population.
When a sample produces only one or two errors, the auditor must evaluate whether these errors were truly random, or whether it is possible that they indicate problems in certain areas that could be examined separately. Such a low error occurrence rate would leave doubt as to whether the sample is representative and should be projected. Therefore, any population sampled, whether by an unrestricted random sample or a stratified sample, must have a minimum of three errors. For an unrestricted random sample, a minimum of three (3) errors, exclusive of any actual basis examination, is required before the errors in the sample may be projected. For a stratified random sample, a minimum of three (3) errors per stratum is required before the errors in a sample may be projected. If fewer than three errors are found, the auditor’s analysis of the situation based on the guidelines in this chapter should be used to determine whether the sample should be expanded, a separate examination of a particular problem area should be made, or the sample should be considered to have shown too small an error rate to project.
When an examination results in zero errors, a no change report would normally result for that portion of the audit. This would not necessarily be the case, however, if the results do not appear to be representative. A large number of BOE–1164’s on hand would indicate that the results were not representative. In a case such as this, the BOE–1164’s would have to be analyzed to establish whether expansion of the sample would be warranted.
STATISTICAL SAMPLING
November 2001

AUDIT MANUAL
January 2000
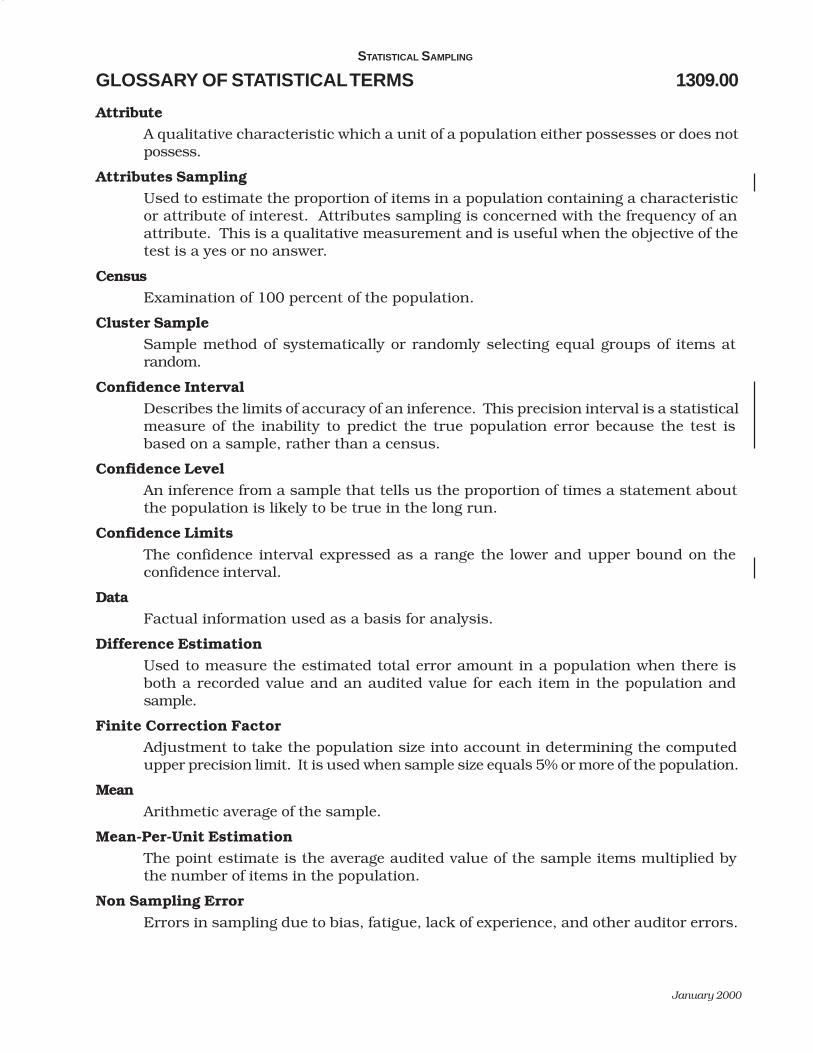
STATISTICAL SAMPLING
January 2000
GLOSSARY OF STATISTICAL TERMS 1309.00
Attribute
A qualitative characteristic which a unit of a population either possesses or does not possess.
Attributes Sampling
Used to estimate the proportion of items in a population containing a characteristic or attribute of interest. Attributes sampling is concerned with the frequency of an attribute. This is a qualitative measurement and is useful when the objective of the test is a yes or no answer.
Census
Examination of 100 percent of the population.
Cluster Sample
Sample method of systematically or randomly selecting equal groups of items at random.
Confidence Interval Describes the limits of accuracy of an inference. This precision interval is a statistical measure of the inability to predict the true population error because the test is based on a sample, rather than a census.
Confidence Level An inference from a sample that tells us the proportion of times a statement about the population is likely to be true in the long run.
Confidence Limits
The confidence interval expressed as a range the lower and upper bound on the confidence interval.
Data
Factual information used as a basis for analysis.
Difference Estimation
Used to measure the estimated total error amount in a population when there is both a recorded value and an audited value for each item in the population and sample.
Finite Correction Factor Adjustment to take the population size into account in determining the computed upper precision limit. It is used when sample size equals 5% or more of the population.
Mean
Arithmetic average of the sample.
Mean-Per-Unit Estimation
The point estimate is the average audited value of the sample items multiplied by the number of items in the population.
Non Sampling Error Errors in sampling due to bias, fatigue, lack of experience, and other auditor errors.

AUDIT MANUAL
January 2000
GLOSSARY OF STATISTICAL TERMS (CONT. 1) 1309.00
Parameters
A set of physical properties that describes a population such as the mean, number of transactions in the population, standard deviation, etc. In this chapter, these parameters are symbolized as follows:
N = Number of items in population, field or universe
n = Number of items in sample
= Arithmetic mean of the sample
s = Standard deviation of the population
S = Standard deviation of the differences
= Standard error
Population
Any group of units with some characteristics in common. The total units from which the sample is drawn.
Precision
The range within which the universe average will lie, with the degree of certainty specified in the confidence level.
Random
An order of selection governed by chance.
Range
The highest and lowest values in the population.
Ratio Estimation
Projects the point estimate of the population on the basis of the net ratio of error in the sample times the recorded total dollar amount of the population.
Sample
The observations drawn from the entire group being sampled, any number of units drawn from a population. A JUDGMENT SAMPLE is a sample where the criteria for including a unit in the sample is decided in advance. A RANDOM SAMPLE is a sample where every unit still remaining in the population has an equal chance of selection on each draw.
Sampling Error Error due to chance that the sample is not a miniature replica of the population.
Sampling Frame
The population from which the sample units will be selected, limited to the area of audit interest.
Standard Deviation
A measurement of the distance of all values from the arithmetic mean. The sample standard deviation is used as an estimate of the population standard deviation.
Standard Error The standard deviation of all possible sample means of a given size.
x
xS

STATISTICAL SAMPLING
January 2000
GLOSSARY OF STATISTICAL TERMS (CONT. 2) 1309.00
Statistic
Descriptive terms used to define or describe the sample.
Statistical Sample
One where the selection of the items to be included is independent of the sample, and which provides a means of establishing the sample size objectively and a means of objectively appraising the sample results.
Stratum
A statistical sub-population. Dividing a population into sub-populations. (Plural: Strata).
Stratification
Physical segregation of the population into more homogeneous groups with the expressed purpose of improving sample efficiency and/or sample reliability.
Systematic
Random systematic sampling is a sampling technique for selecting each sample item at a set interval (every ‘’nth” item), with a randomly selected start.
T Value
Used instead of Z value in analyzing samples of fewer than 30 (thirty).
Unit A member of a population. Each sale is a unit of the total sales population.
Universe
Population, field. The total units from which the sample is drawn.
Variable
Quantity, a property of a unit of a population which is measurable.
Variables Sampling
Method used to estimate the dollar value of a given population — provides a quantitative measurement.
Z Value
Confidence coefficient —used to determine the precision interval, represents the number of standard errors along the horizontal axis about the mean under the normal distribution.

AUDIT MANUAL
January 2000
Table of Exhibits
Audit Sampling Plan ..................................................................................................Exhibit 1 Statistical Sampling Audit Program ...........................................................................Exhibit 2 Z Table .......................................................................................................................Exhibit 3 The T Distribution ......................................................................................................Exhibit 4 Random Number Generator ......................................................................................Exhibit 5 Tables of Random Months, Weeks,
Days, Alphabet, Numbers ....................................................................................Exhibit 6 Sample Evaluation ....................................................................................................Exhibit 7 Estimation Projection Techniques ..............................................................................Exhibit 8 Sample Data Analysis: Stratified Population .............................................................Exhibit 9 Projection Techniques with Stratification .................................................................Exhibit 10 Sample Size Matrix .................................................................................................Exhibit 11 Sample Sizes for Variable Sampling
at 80% Confidence Level ...................................................................................Exhibit 12 Julian Calendar .......................................................................................................Exhibit 13 Perpetual Calendar .................................................................................................Exhibit 14 Bibliography .............................................................................................................Exhibit 15

STATISTICAL SAMPLING
January 2000
AUDIT SAMPLING PLAN EXHIBIT 1 PAGE 1 OF 5
STATE OF CALIFORNIA
STATE BOARD OF EQUALIZATIONSALES AND USE TAX DEPARTMENT
450 N STREET, SACRAMENTO, CALIFORNIA 95814
(PO BOX 942879, SACRAMENTO, CALIFORNIA 94279 )
TELEPHONE (916)
FAX (916)
www.boe.ca.gov
Use of Sampling in Auditing
The primary purpose behind the Board of Equalization’s audit program is to determine, with the least possible expenditure oftime for both the taxpayer and the Board, the accuracy of reported amounts. Sampling serves to accomplish this purpose.
Sampling is a process of drawing a conclusion about an entire body of information based on measurements of a representativesample of that information. Sales and use taxes are transaction taxes, meaning that tax is determined on a transaction-by-transaction basis. Therefore, verification must be done at the source document level. Since in many cases it iseconomically impractical to audit all transactions, the Board encourages the use of sampling whenever feasible.
There are generally two methods of sampling: judgment sampling and statistical sampling. A judgment sample includes allsamples obtained by nonstatistical sampling methods. The most common type of judgment sample is the examination of a blockperiod of time (i.e., day, week, month, or quarter). A statistical or random sample is a sample in which each item in thepopulation has an equal or known chance of being selected for examination. Examples of statistical or random samplingtechniques include unrestricted sampling, stratified sampling, systematic sampling with random start, and cluster sampling.
While judgment samples are not necessarily less accurate than statistical samples, there is no way of objectively evaluating theaccuracy or reliability of the test. The advantages of statistical sampling over non-statistical sampling are:
• It provides a selection process which is representative of the types of transactions involved and eliminates bias, since everyitem in the population has an equal or known chance of being selected.
• It provides an advance estimate of the sample size required for a given objective.• The results can be objectively evaluated.• Multiple samples may be combined and evaluated.• Properly conducted statistical sampling can yield more reliable results than judgment sampling.• It is a method approved and recommended by the American Institute of Certified Public Accountants (AICPA).
Other factors to be considered in determining the best type of sample to conduct are the format, condition, storage, andavailability of business records. The auditor and taxpayer should discuss the most beneficial approach to examining sourcedocuments after the auditor has had an opportunity to review the business records but prior to the selection of the sample.
The attached Audit Sampling Plan form (BOE-472) was developed to facilitate the use of sampling by helping the auditor andtaxpayer to document the sampling plan and to set the criteria by which the sample results will be evaluated. The purpose ofthis form is to obtain information regarding the taxpayer’s operations in order to establish the most effective and efficient meansof developing a sampling plan. The form covers many common situations that might arise in sampling and should be discussedwith the taxpayer. This form should be completed with the assistance of the taxpayer, prior to the selection of the sample.
The information and methods documented in this form are not binding on either the taxpayer or Board staff. The sampling plancan, and should, be continually evaluated (and changed, if necessary) based upon information obtained during the auditingprocess. In addition, it is possible that stratification or expansion of this sample may become necessary depending on the resultsproduced by this process. However, should any deviation to this plan be required, it will be fully discussed with the taxpayer.
If you have any questions regarding this form and accompanying information, please contact your auditor.
BOE-472 (S1) REV. 2 (7-00)
JOHAN KLEHSFirst District, Hayward
DEAN ANDALSecond District, Stockton
CLAUDE PARRISHThird District, Torrance
JOHN CHIANGFourth District, Los Angeles
KATHLEEN CONNELLState Controller, Sacramento
JAMES E. SPEEDExecutive Director
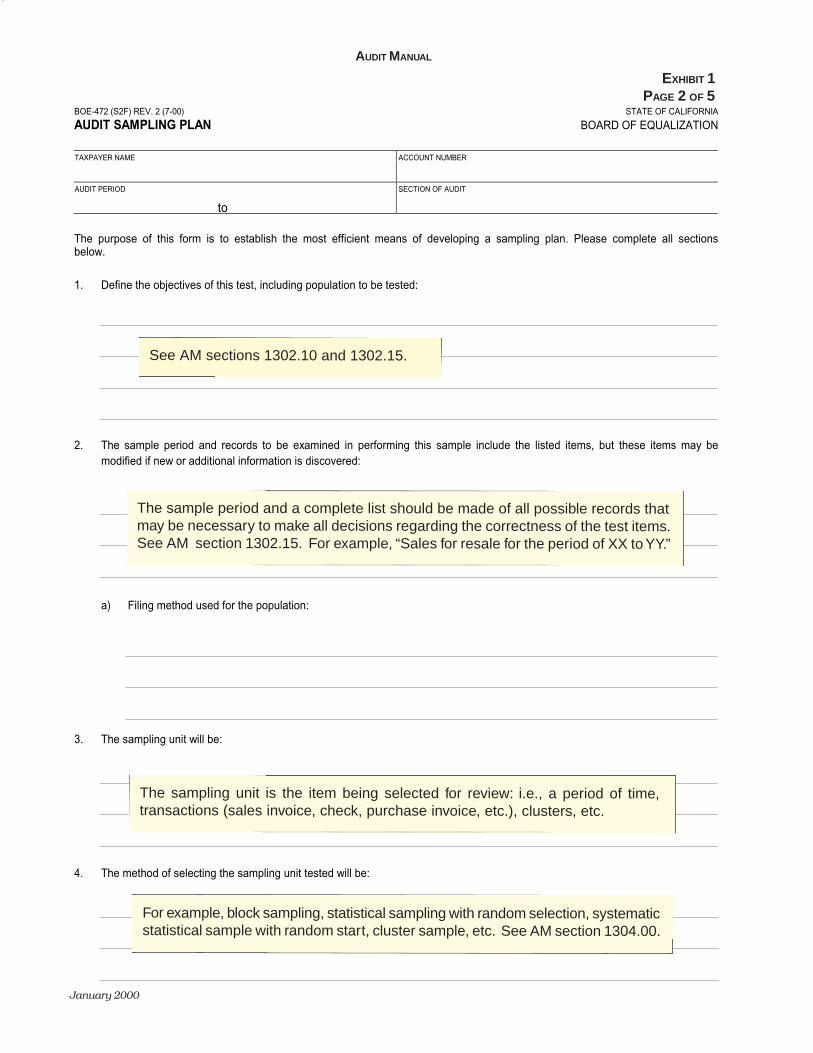
AUDIT MANUAL
January 2000
EXHIBIT 1 PAGE 2 OF 5
BOE-472 (S2F) REV. 2 (7-00) STATE OF CALIFORNIA
AUDIT SAMPLING PLAN BOARD OF EQUALIZATION
TAXPAYER NAME
ACCOUNT NUMBER
AUDIT PERIOD
to
SECTION OF AUDIT
The purpose of this form is to establish the most efficient means of developing a sampling plan. Please complete all sectionsbelow.
1. Define the objectives of this test, including population to be tested:
2. The sample period and records to be examined in performing this sample include the listed items, but these items may bemodified if new or additional information is discovered:
a) Filing method used for the population:
3. The sampling unit will be:
4. The method of selecting the sampling unit tested will be:
See AM sections 1302.10 and 1302.15.
The sample period and a complete list should be made of all possible records that may be necessary to make all decisions regarding the correctness of the test items. See AM section 1302.15. For example, “Sales for resale for the period of XX to YY.”
The sampling unit is the item being selected for review: i.e., a period of time, transactions (sales invoice, check, purchase invoice, etc.), clusters, etc.
For example, block sampling, statistical sampling with random selection, systematic statistical sample with random start, cluster sample, etc. See AM section 1304.00.

STATISTICAL SAMPLING
January 2000
EXHIBIT 1 PAGE 3 OF 5
BOE-472 (S2B) REV. 2 (7-00)
a) If you plan to conduct a statistical sample, identify the procedure(s) to be used:
b) If you plan to conduct a block test, please list the reasons why a statistical test was not possible:
5. The statistical sample size will be:
a) The method and/or reason for determining the above sample size:
6. If a block sample is used, list the selected test period(s):
7. The sample base will be:
Units:
Dollars:
8. The population base will be:
Units:
Dollars:
Indicate the number of sample units. See AM section 1303.00.
See AM sections 0405.20(c) and 1303.00.

AUDIT MANUAL
January 2000
EXHIBIT 1 PAGE 4 OF 5
BOE-472 (S3F) REV. REV. 2 (7-00)
9. The results of the sample will be projected using the following procedures:
10. The following procedures will be used for the treatment of some specific situation(s) should they occur. Any additional items willbe addressed in Section 11, “Other.”
a) Duplicate sample units (sampling with or without replacement):
b) Missing sample unit(s):
c) Sample unit is a void or canceled transaction:
d) Sample unit is an error but the transaction is corrected at a later date:
e) Sample unit is a “credit” item:
Indicate whether duplicate sample units will or will not be replaced with another sample unit.
See AM section 1302.25(g).
See AM section 1302.25(e) and (f).
See AM section 1302.25(f).
See AM section 1302.25(f).

STATISTICAL SAMPLING
January 2000
EXHIBIT 1 PAGE 5 OF 5
BOE-472 (S3B) REV. 2 (7-00)
f) Sample unit is a partial/down/installment or progress payment:
g) Sample unit is for “tax” only:
h) Sample unit is an error but the transaction later resulted in a bad debt:
11. Other:
This sampling plan is a collaborative effort by the auditor and taxpayer to determine the most efficient method of establishing anestimated percentage of error, if any, for the population being tested. The information and methods documented in this form are notbinding on either the taxpayer or Board staff. This sampling plan may be modified if new or additional data is encountered. Shouldany deviation to this plan be required, it will be fully discussed with the taxpayer.
A copy of this sampling plan was provided to the taxpayer on .DATE
AUDITOR’S SIGNATURE TAXPAYER’S SIGNATURE FOR RECEIPT OF COPY
See AM section 1302.25(d).
See AM section 1302.25(f).
See AM section 1302.25(f).

STATISTICAL SAMPLING AUDIT PROGRAM EXHIBIT 2 PAGE 1 OF 6
When you decide to use variables sampling techniques for validation testing, you should carry out the following steps in designing, implementing, evaluating, and documenting your test:
1. Establish the Objective of the Test (Section 1302.10) Each test should have a specific stated objective; subsequent statistical techniques are selected on the basis of that objective. The usefulness of any sampling test depends on a clear recognition of the relationship between the test objective and the corresponding audit objective. Usually the more precisely we can establish our objective, the better able we will be to tailor our sample to meet this objective.
The most important step in the sampling process is defining the objective of the sample. If the objective is not precisely defined, the sample probably will not meet the objective.
2. Define and Limit the Population (Section 1302.15) The population must be defined to ensure that all items about which the auditor wishes to draw a conclusion have an equal or known chance of being selected in the sample. The population should be defined and limited to the area of audit interest. It is best to have a population defined by the general ledger accounts that the auditor has identified as areas of audit concern and employ stratification techniques.
Although the majority of errors encountered by auditors relate to underpayments, audit staff should also be aware of, and discuss with the taxpayer, the potential of overpayments. When examining underpayments and overpayments, the auditor should keep in mind that these types of transactions may not occur with the same frequency in a population. It is not uncommon for the transactions containing possible overpayment errors to occur much less frequently than underpayment errors. To obtain an accurate measure of these overpayment errors would require a much larger sample size in a combined sample than to establish two separate sampling frames (underpayments and overpayments) and sample the areas separately.
The auditor may want to consider using statistical sampling for examinations of areas other than an accounts payable or sales examination. Depending upon the taxpayer’s record keeping system, statistical sampling may be warranted for the fixed asset, journal voucher, or even debits to the tax accrual account (the auditor would still be required to reconcile the accrual account).
A clear audit trail of the population should be included in the working papers. The auditor must clearly describe the choices, assumptions, and methodologies used in the statistical sample, specifically relating to the definition of the population so that an adequate trail is developed to permit subsequent evaluation of the auditor’s work by the taxpayer.
3. Define the Characteristic Being Measured (Section 1302.20) You should carefully define the quantity characteristic being measured and determine a means of measuring it. For example, in a test of resales, the quantity of measure may be the differences between audited and reported resales, a ratio of audited to reported, or the audited total resale amounts.
AUDIT MANUAL
January 2000

EXHIBIT 2 PAGE 2 OF 6
4. Identify the Sampling Unit After defining the objective of the sample and the population of interest, we next need to define the sampling unit (i.e., invoice, paid bill, etc.). If we do not define the sampling unit accurately, our estimates may not be as precise as they could be.
5. Select the Sampling Plan
A random sample—defined as one selected in such a way that each item in the population has an equal or known chance of selection—generally achieves the desired representativeness. The first step in developing the plan is to determine what sampling method we are going to use. There are several acceptable methods for selecting a random sample, three of which are briefly explained below:
a. Unrestricted Random Sampling—sampling units are drawn from the entire population and each item has an equal chance of being selected. Numbers are drawn from a random number table and associated with items in the population.
b. Systematic Sampling—drawing every nth item, where n is equal to population size divided by sample size, can be an alternative to unrestricted random sampling. It should be used only if you can determine that there is no periodic, cyclic, or other biased arrangement of the characteristic being tested. Modification of the nth item selection method, such as using multiple random starts, can reduce the possibility that the sample might be biased because of some unknown pattern existing in the population.
c. Stratified Random Sampling—involves dividing the population to be tested into separate segments and drawing samples, usually of different sizes, from each as if it were a separate population. Stratification often increases the efficiency of sampling where there are considerable differences among the amounts being measured, as is often the case in accounting transactions. Therefore, you should look for opportunities to stratify. For example, you may determine that you can achieve the objectives efficiently by auditing all items in a stratum of high dollar value items (census) and combining this 100% test with some sampling of strata containing lower dollar value items. You should compute a combined evaluation of the entire population.
Next, we need to determine how we are going to gather the data. Is the data already available in some tabular or computerized form? We also need to determine how to handle missing documentation and other items, such as invoices for progress payments or sales tax, and credit memos.
6. Conduct a Pilot Study (Section 1303.15) A pilot sample may be necessary if no other information is available to compute the needed values. The main disadvantage of using a pilot sample is that usually it will require expansion. This means a second pass through the population. This added step can be time consuming and may meet with resistance from the taxpayer. As a result, it is not recommended when other means (auditor’s knowledge of the industry, cursory exam of a handful of documents, or a prior audit) are available. However, a more efficient approach is to estimate the sample size that would produce an acceptable audit result.
STATISTICAL SAMPLING
March 2002

EXHIBIT 2 PAGE 3 OF 6
7. Estimate the Sample Size (Section 1303.00) Sample size must be large enough to provide meaningful results, but not so large as to cause excessive work. In judgmental sampling you can arbitrarily select a sample size, but the question of whether it is adequate to meet your objectives is not measurable and is therefore based on subjective judgment. Statistical sampling techniques provide mathematically verifiable quantitative aids for estimating the sample size needed to achieve the desired precision and reliability. The adequacy of the sample size in meeting those specifications, however, can only be determined after all the sample items are examined and the results evaluated mathematically.
While statistical techniques define and quantify the decisions to be made, you must nevertheless evaluate the situation and identify what he or she may want to achieve in applying sampling techniques. In addition to the size of the population, the factors influencing the estimate of sample size are:
a. The desired reliability and confidence level
b. The desired sampling precision
c. The variability of the characteristic being measured (i.e. - the population “standard deviation”).
Once these factors have been determined, the sample size may be estimated from tables in a recognized statistical text or by using formulas.
The relationships of the previously stated factors to sample size are as follows (in each case all other factors must be assumed to be held constant):
a. An increase of the confidence level from 80% to 90% would increase the required sample size by approximately 65%.
b. A decrease in the confidence interval will increase the required sample size proportionally.
c. An increase in population variability (standard deviation) will increase the required sample size.
8. Locate and Examine the Selected Items and Investigate Exceptions
After you have located the selected items, you must audit each one. Any errors made in examining the sample will be projected to the final results and could be magnified into an erroneous conclusion about the population. Such errors are generally known as “non-sampling errors” and they can occur regardless of the sampling method used.
You must determine the cause and the audit significance of each exception. Doing so is much easier if the objective, the characteristic being tested, and the means of measuring it have been rigorously defined. Likewise, you must be careful not to let the significance of one characteristic blind you to another. If an unanticipated characteristic should be found, it may be subject to adequate evaluation by means of the sampling technique in process, or a new sample and a different technique may be required.
AUDIT MANUAL
January 2000

EXHIBIT 2 PAGE 4 OF 6
9. Evaluate the Sample Results (Section 1305.00) You must statistically evaluate the test results to determine whether you have achieved your desired confidence level and interval. Stratified samples must have a combined evaluation. An 80% confidence level is recommended for use by audit staff in the analysis of statistical samples. The maximum confidence interval allowed is 75%. Increasing or decreasing the confidence level will affect the confidence interval. Some of the other reasons for confidence interval variation are:
• Variability within the sample units
• Differences in sample size
• Small vs. large errors or credit errors
The fact that the confidence interval is wide (greater than 75%) will require the auditor to analyze the sample to determine why this has occurred. The confidence interval is a measure of the variability of the units included in the sample. It is not a measure of whether a sample is acceptable or unacceptable. However, a small interval is preferred because it indicates that the population is more homogeneous, contains less variability, and enhances the reliability of the sample.
When a large interval (greater than 75%) is disclosed, the auditor must make a decision regarding the acceptability of the sample based upon the best information available. The following factors can be used in the evaluation of the sample and to determine what measures to undertake to remedy the situation:
• Mean of the sample vs. mean of the population
• Range of values in the sample vs. range of values in the population
• Substantial sample size
• Auditor’s analysis and evaluation of all the information available, based upon the guidelines presented in Chapter 13 of the Audit Manual
The auditor must make a decision regarding the acceptability of the sample based on the best information available. Some of the options to be considered when making this decision include:
• Increase the sample size
• Stratify (A large confidence interval is the result of a large standard deviation. A way to demonstrate that the sample standard deviation might actually be a close approximation of the population standard deviation, and the only way to improve the computed results, would be to stratify.)
• Drop the test and accept reported amounts in that area of the audit
• Examine specific transactions on an actual basis
• Accept the test only if it agreed to by the taxpayer (explanation for acceptance and taxpayer’s agreement should be contained in the working papers)
STATISTICAL SAMPLING
March 2002

EXHIBIT 2 PAGE 5 OF 6
10. Project the Sample Results (Section 1306.00) The three most widely used techniques for projecting variables sampling results are:
a. Mean-per-Unit Estimation—the point estimate is the average audited value of the sample items multiplied by the number of items in the population.
b. Difference Estimation—the point estimate of the difference is equal to the average of the differences multiplied by the number of items in the population, and the point estimate of the actual total amount is the taxpayer’s recorded amount plus the point estimate of the difference. The average difference may be either positive or negative.
c. Ratio Estimation—the point estimate is calculated by multiplying the taxpayer’s total value by the ratio of the aggregate audited value of sample items to their aggregate book values.
Ratio estimation is the technique used most frequently in audits conducted by the Board. It is recommended that this method be used to project sample results unless there is convincing evidence to the contrary.
11. Document (Section 1307.00) Statistical sampling techniques must always be adequately documented in the working papers. Minimum documentation should include:
a. Audit Sampling Plan Form BOE-472. Form BOE-472 is required for all large audits (cell designation “D”) or any time sampling is performed.
b. The population total, its source and a reconciliation, if several strata are involved.
c. The method of selecting sample items — for example, if a random number table is used, the documentation should include the name and source of the table, starting point, route through the table and the stopping point. If a random number generator was used, the random seed should be documented in the working papers. This information is essential in the event the sample is to be expanded.
d. A listing of the sample items and any differences noted. Whatever methods are used, proper referencing is essential to provide the proper audit trail.
AUDIT MANUAL
March 2002

EXHIBIT 2 PAGE 6 OF 6
NOTE: Generally, unless a sample is relatively small, a separate schedule for differences or questioned items should be made for ease in the summary or analysis of the sample results. At a minimum, the schedule of questioned items should include the following, as applicable for the type of test:
1. Date
2. Invoice number
3. Vendor/Customer name
4. Vendor/Customer address
5. Shipped from/to
6. Complete description of the item(s) in question
7. Amount in question
8. The general ledger/cost center/department that AP purchase(s) charged to
e. Evaluation of sample results—this is most frequently completed in a worksheet format. A sample evaluation template is included as part of the electronic audit package worksheets. In addition to numeric data, the evaluation may also include additional information pertinent to the sample or population that the auditor feels is necessary to properly evaluate the test.
f. The audit conclusion reached—this will be used as the basis of projecting the results of the sample to the total population.
Important Notes: 1. Steps 1-5, 8, 10 and 11 are used in non-statistical (“block”) samples conducted by
Board auditors. Step 6 is also used, in part. However, without Steps 7 and 9, one cannot scientifically measure (evaluate) the sample size or reliability.
2. Taxpayers are encouraged to participate in determining the sampling method, setting up the sampling plan and compiling the sample items, as this will provide a better understanding of the testing procedures and sampling process. Taxpayers are also requested, at times, to select the random starting point of a test.
STATISTICAL SAMPLING
January 2000

AUDIT MANUAL
January 2000
Z TABLE EXHIBIT 3
Areas Under The Normal Curve
+/or .00 .01 .02 .03 .04 .05 .06 .07 .08 .09
0.0 0.0000 0.0040 0.0080 0.0120 0.0160 0.0199 0.0239 0.0279 0.0319 0.0359 0.1 0.0398 0.0438 0.0478 0.0517 0.0557 0.0596 0.0636 0.0675 0.0714 0.0753 0.2 0.0793 0.0832 0.0871 0.0910 0.0948 0.0987 0.1026 0.1064 0.1103 0.1141 0.3 0.1179 0.1217 0.1255 0.1293 0.1331 0.1368 0.1406 0.1443 0.1498 0.1517 0.4 0.1554 0.1591 0.1628 0.1664 0.1700 0.1736 0.1772 0.1808 0.1844 0.1879
0.5 0.1915 0.1950 0.1985 0.2019 0.2054 0.2088 0.2123 0.2157 0.2190 0.2224 0.6 0.2257 0.2291 0.2324 0.2357 0.2389 0.2422 0.2454 0.2486 0.2518 0.2549 0.7 0.2580 0.2612 0.2642 0.2673 0.2704 0.2734 0.2764 0.2794 0.2823 0.2852 0.8 0.2881 0.2910 0.2939 0.2967 0.2995 0.3023 0.3051 0.3078 0.3106 0.3133 0.9 0.3159 0.3186 0.3212 0.3238 0.3264 0.3289 0.3315 0.3340 0.3365 0.3389
1.0 0.3413 0.3438 0.3461 0.3485 0.3508 0.3531 0.3554 0.3577 0.3599 0.3621 1.1 0.3643 0.3665 0.3686 0.3708 0.3729 0.3749 0.3770 0.3790 0.3810 0.3830 1.2 0.3849 0.3869 0.3888 0.3907 0.3923 0.3944 0.3962 0.3980 0.3997 0.4015 1.3 0.4032 0.4049 0.4066 0.4082 0.4099 0.4115 0.4131 0.4147 0.4162 0.4177 1.4 0.4192 0.4207 0.4222 0.4236 0.4251 0.4265 0.4279 0.4292 0.4306 0.4319
1.5 0.4332 0.4345 0.4357 0.4370 0.4382 0.4394 0.4406 0.4418 0.4429 0.4441 1.6 0.4452 0.4463 0.4474 0.4484 0.4495 0.4505 0.4515 0.4525 0.4535 0.4545 1.7 0.4554 0.4564 0.4573 0.4582 0.4591 0.4599 0.4608 0.4616 0.4625 0.4633 1.8 0.4641 0.4649 0.4656 0.4664 0.4671 0.4678 0.4686 0.4693 0.4699 0.4706 1.9 0.4713 0.4719 0.4726 0.4732 0.4738 0.4744 0.4750 0.4756 0.4761 0.4767
2.0 0.4772 0.4778 0.4783 0.4788 0.4793 0.4798 0.4803 0.4808 0.4812 0.4817 2.1 0.4821 0.4826 0.4830 0.4834 0.4838 0.4842 0.4846 0.4850 0.4854 0.4857 2.2 0.4861 0.4864 0.4868 0.4871 0.4875 0.4878 0.4881 0.4884 0.4887 0.4890 2.3 0.4893 0.4896 0.4898 0.4901 0.4904 0.4906 0.4909 0.4911 0.4913 0.4916 2.4 0.4918 0.4920 0.4922 0.4925 0.4927 0.4929 0.4931 0.4932 0.4934 0.4936
2.5 0.4938 0.4940 0.4941 0.4943 0.4945 0.4946 0.4948 0.4949 0.4951 0.4952 2.6 0.4953 0.4955 0.4956 0.4957 0.4959 0.4960 0.4961 0.4962 0.4963 0.4964 2.7 0.4965 0.4966 0.4967 0.4968 0.4968 0.4970 0.4971 0.4972 0.4973 0.4974 2.8 0.4974 0.4975 0.4976 0.4977 0.4977 0.4978 0.4979 0.4979 0.4980 0.4981 2.9 0.4981 0.4982 0.4982 0.4983 0.4984 0.4984 0.4985 0.4985 0.4986 0.4986
3.0 0.4987 0.4987 0.4987 0.4988 0.4988 0.4989 0.4989 0.4989 0.4990 0.4990 3.1 0.499033 3.2 0.4993129 3.3 0.4995166 3.4 0.4996631
3.5 0.4997674 3.6 0.4998409 3.7 0.4998922 3.8 0.4999277 3.9 0.4999519
4.0 0.4999683 4.5 0.4999966
Note:
The data above represents the area under the normal curve for a given number of standard deviations (z factors). Since the normal curve is symmetrical, and we are interested in deviations above and below the mean, the total area would be double the value shown in the table.
For Example z at 1.28 = .3997
Confidence Level = .3997 x 2 = .7994 or approximately 80%
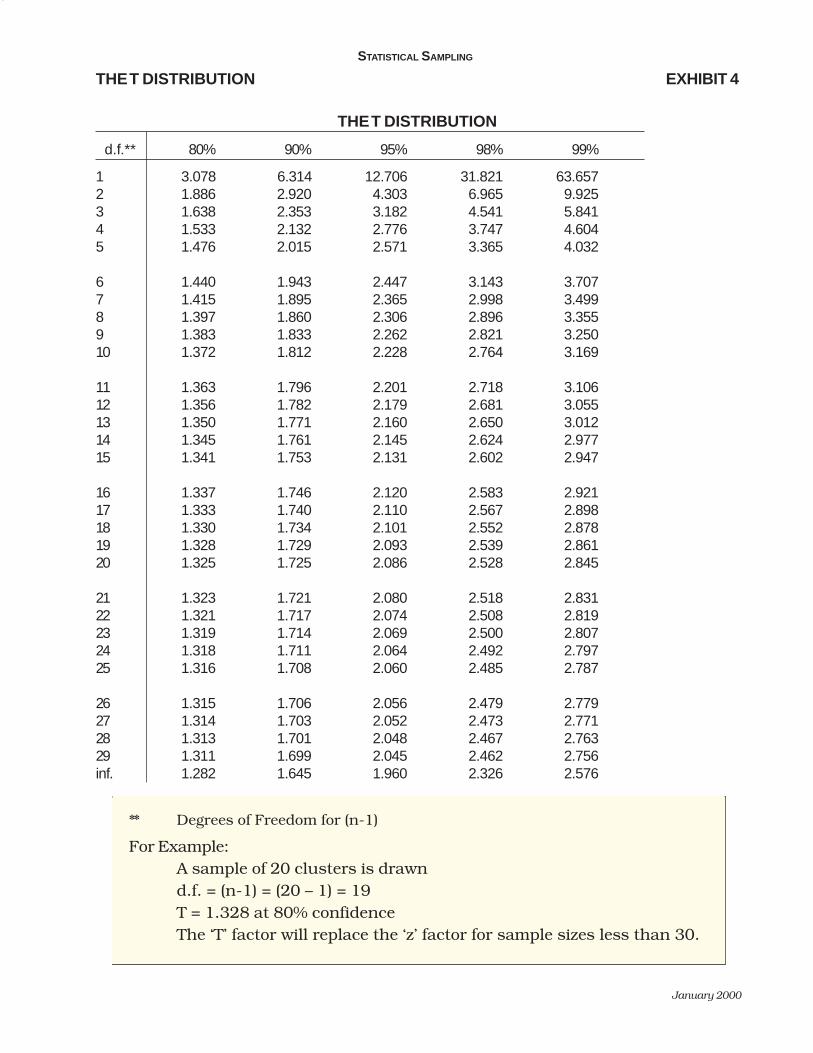
STATISTICAL SAMPLING
January 2000
THE T DISTRIBUTION EXHIBIT 4
THE T DISTRIBUTION
d.f.** 80% 90% 95% 98% 99%
1 3.078 6.314 12.706 31.821 63.657 2 1.886 2.920 4.303 6.965 9.925 3 1.638 2.353 3.182 4.541 5.841 4 1.533 2.132 2.776 3.747 4.604 5 1.476 2.015 2.571 3.365 4.032
6 1.440 1.943 2.447 3.143 3.707 7 1.415 1.895 2.365 2.998 3.499 8 1.397 1.860 2.306 2.896 3.355 9 1.383 1.833 2.262 2.821 3.250 10 1.372 1.812 2.228 2.764 3.169
11 1.363 1.796 2.201 2.718 3.106 12 1.356 1.782 2.179 2.681 3.055 13 1.350 1.771 2.160 2.650 3.012 14 1.345 1.761 2.145 2.624 2.977 15 1.341 1.753 2.131 2.602 2.947
16 1.337 1.746 2.120 2.583 2.921 17 1.333 1.740 2.110 2.567 2.898 18 1.330 1.734 2.101 2.552 2.878 19 1.328 1.729 2.093 2.539 2.861 20 1.325 1.725 2.086 2.528 2.845
21 1.323 1.721 2.080 2.518 2.831 22 1.321 1.717 2.074 2.508 2.819 23 1.319 1.714 2.069 2.500 2.807 24 1.318 1.711 2.064 2.492 2.797 25 1.316 1.708 2.060 2.485 2.787
26 1.315 1.706 2.056 2.479 2.779 27 1.314 1.703 2.052 2.473 2.771 28 1.313 1.701 2.048 2.467 2.763 29 1.311 1.699 2.045 2.462 2.756 inf. 1.282 1.645 1.960 2.326 2.576
** Degrees of Freedom for (n-1)
For Example: A sample of 20 clusters is drawn d.f. = (n-1) = (20 – 1) = 19 T = 1.328 at 80% confidence The ‘T’ factor will replace the ‘z’ factor for sample sizes less than 30.

AUDIT MANUAL
January 2000
RANDOM NUMBER GENERATOR EXHIBIT 5 PAGE 1 OF 2
Copy to Taxpayer Date: _________
A B C D E F G H I
REF SAMPLE CREATION AREA REQUESTED ACTUALPICK
ORDERRANDOM NUMBERS
1 TYPE OF SAMPLE Number 2,406 28 1619
2 NUMBER OF SERIES 1 50 42 1620
3 RANDOM SEED 12681 48 49 1697
4 DESIRED SAMPLE SIZE 50 2 47 1704
36 1764
8 1858
9 1970
SERIESSERIES LOW
NUMBERSERIES HIGH
NUMBER 16 2011
1 1,500 3,905 18 2083
33 2086
1 2137
37 2177
48 2193
23 2221
14 2288
20 2318
21 2379
24 2446
44 2481
4 2506
31 2511
40 2530
39 2532
43 2628
29 2720
19 2866
45 2963
13 3025
46 3043
NUMBER OF ITEMS IN POPULATIONACTUAL SAMPLE SIZE INCLUDING DUPLICATESACTUAL SAMPLE SIZE EXCLUDING DUPLICATESDUPLICATES DELETED IN SAMPLE
21-000000SCHEDULE
S R06/26/00
STATISTICAL SAMPLING INFORMATION SHEET

STATISTICAL SAMPLING
January 2000
EXHIBIT 5 PAGE 2 OF 2
17 3086
10 3118
34 3162
26 3221
7 3312
2 3419
32 3421
25 3468
15 3538
30 3595
12 3673
38 3719
11 3761
5 3767
41 3800
3 3821
6 3854
50 3857
22 3891
27
35
A B C D E F G H I
REF SAMPLE CREATION AREA REQUESTED ACTUALPICK
ORDERRANDOM NUMBERS
21-000000SCHEDULE
S R06/26/00
STATISTICAL SAMPLING INFORMATION SHEET
Copy to Taxpayer Date: _________

AUDIT MANUAL
January 2000
TABLES OF RANDOM MONTHS, WEEKS, DAYS, ALPHABET, NUMBERS EXHIBIT 6
PAGE 1 OF 3 Random Months JAN APR OCT DEC APR MAY APR JUL JUN MAR MAR JUL FEB JAN NOV NOV AUG DEC DEC DEC SEP AUG SEP JAN AUG JAN JAN NOV MAR NOV OCT JUL MAR JUL DEC JAN MAR MAY OCT AUG DEC JAN MAY MAY AUG JAN OCT JUN JUL SEP SEP JUL JUN JUL APR NOV NOV AUG FEB APR DEC AUG AUG MAY MAY AUG JUL AUG JAN FEB JAN SEP APR OCT JUL
OCT JAN FEB MAR NOV SEP JAN APR JAN DEC MAY MAR NOV MAR FEB MAR OCT SEP APR OCT DEC FEB APR NOV MAR FEB APR APR AUG APR MAR APR JAN NOV FEB FEB FEB AUG MAY JUN JUN JUN SEP APR FEB NOV FEB SEP JUN AUG AUG MAY APR APR JUL JUN AUG OCT FEB MAR NOV FEB JAN JUN DEC FEB DEC FEB DEC AUG AUG MAR MAR JAN JAN
OCT NOV NOV FEB JUN JUL JUN MAY MAR MAY MAY MAR FEB APR OCT SEP JUL NOV SEP JUL NOV MAY MAY JAN NOV NOV MAY AUG NOV SEP MAY AUG MAR DEC JUL FEB SEP MAR APR AUG SEP NOV SEP JAN JUL FEB OCT JUN FEB MAR APR DEC FEB JUL APR OCT AUG NOV JUN JUN SEP FEB OCT FEB JAN DEC SEP JUL APR OCT FEB MAY MAR APR JAN
APR JUL MAR MAY AUG MAR NOV DEC MAR JUN MAR APR DEC OCT JAN NOV NOV NOV SEP DEC NOV MAY MAR JUN OCT FEB FEB AUG AUG SEP APR JAN DEC OCT APR APR MAY OCT JUN JUL MAR AUG OCT MAR JUL FEB APR NOV MAR DEC AUG DEC FEB JUN AUG APR OCT AUG SEP OCT FEB AUG MAR JUN OCT JUN JAN JUN JUL AUG OCT MAR NOV FEB FEB
MAY AUG NOV SEP FEB SEP OCT APR FEB JUL JUN MAR NOV SEP OCT NOV MAR MAR FEB FEB JUN JUN APR DEC FEB MAR DEC FEB JAN NOV AUG DEC MAR AUG JUL FEB MAR FEB FEB APR JAN JUN JUL DEC OCT AUG JUN NOV DEC JUL NOV NOV MAR JAN OCT FEB AUG MAY SEP MAR FEB APR JAN JUN JUL DEC JUN DEC MAR DEC FEB NOV DEC APR AUG
APR JAN DEC MAR APR APR FEB JAN MAY JAN JUN FEB JAN SEP JUL JUL MAR OCT MAY NOV JAN JAN AUG JAN APR JUL JAN JAN JAN JAN JUN DEC MAR JAN JAN JUN APR FEB MAR APR MAY SEP APR NOV MAR NOV JUN NOV JUN FEB APR OCT JAN FEB DEC MAR DEC JAN JAN MAR APR JAN AUG DEC DEC MAR MAR OCT MAR MAR APR SEP FEB JUL SEP
Random Weeks 03 49 15 43 26 45 25 07 32 01 29 48 12 38 24 11 36 47 51 37 02 40 52 35 13 10 09 41 19 28 42 44 06 30 27 05 23 31 14 20 04 22 50 39 17 16 08 33 46 34 18 21
Random Days 1 4 1 6 4 7 4 5 7 4 6 4 3 4 4 2 4 5 4 2 5 7 1 7 3 5 4 1 3 7 1 2 2 3 5 1 1 2 7 3 3 2 3 1 3 7 6 2 1 7 4 3 3 3 5 3 7 7 4 3 5 1 3 6 4 1 4 2 5 4 1 2 6 6 4 2 6 4 1 4 6 2 3 5 3 1 6 3 1 6 3 6 2 5 7 4 4 2 5 6 7 6 7 6 1 1 2 4 3 6 3 7 2 4 4 7 3 4 4 7
Sunday 1 Monday 2 Tuesday 3 Wednesday 4 Thursday 5 Friday 6 Saturday 7

STATISTICAL SAMPLING
January 2000
EXHIBIT 6 PAGE 2 OF 3
EIKDL
JULAL
FJPRV
FWXRW
CDFDE
INHPZ
CQHAT
RRSFS
HZDOQ
XCSKV
KTOYD
NEGJU
GPHSA
GKYFR
JRSTV
VBNWG
WCCPX
SBEZZ
PDIDJ
GNGNR
EMDPF
FLTED
XBOIR
RYVQP
UHNNO
TPTET
SXWWF
OGZAY
SBFHR
AWEBD
VXTBH
YHRWL
FKMKQ
JAKKA
DOARL
EGNGV
TNOZY
RKMSV
PIOSC
VSNBJ
RNPTR
RTSWH
FXYPD
OUALW
TNGLG
HXMSI
RFSTJ
CDKVG
SOKQH
MJYFS
FUOLL
ENMXC
KZPGJ
WOKKR
UMFJC
OXSQH
VEURE
ILAHY
YXJGM
RUDSK
WMVWB
PPWYV
QYHXX
NXUAM
UXMLA
GXFEE
GBAFI
ZQIUK
NZOUY
NQGUY
UEHIP
AKFMC
QCFBY
WSTKS
EUKIF
PJQUW
GPJIL
NLHBY
KRJYV
SHRZK
DVQIP
IFTHP
HTKEE
MSCXN
BPCOH
AGSVG
YTYXT
GCCPZ
UEMIW
EFBOE
KLZGU
QYKBW
GKHIF
ZIRWU
QPSPH
ZLVGT
GTFYX
DAPGJ
YGZBC
YDLFI
HBDFE
PXKCA
CNNMZ
EYONS
HRIME
IIZST
NAMCF
CFWUN
BRWGR
JWSLZ
YDLZA
RHCPX
XJGND
TRSDN
ENQJK
QKDEG
LUFOH
GKSSC
GUDLW
HJEZM
EDJQU
UNVSY
OTBEA
AGLMD
ZGQBH
QNQIO
CIXJJ
PZBSI
WKONM
LBGTM
ZHYUF
AZLLW
MIPAY
BBFDI
DWOSF
GXGHM
QYIGI
VWBRP
AGOBV
FLBGX
ZDOZY
HUXVJ
MIXXO
BEVTW
JFWXP
NAZHJ
MBLYW
SSYNM
KWUCR
BZAFN
VQPMM
YVDOP
HASDI
PJOIQ
AZIPL
HKBUK
ZPELK
LBZPZ
NSKIR
ZURKF
HCIKP
QBWIX
SLJHA
ZOWIK
MYREJ
QSDVR
MLGZK
YTUXX
CEVQG
MOKEM
BGZJW
SPTWQ
ANUJQ
OBMYN
ZPWLN
KYXLG
XFCOA
XTVXN
UCGTY
THTOW
ASEVA
GMCPT
PNYRI
WAKPG
GFKXX
JDQFJ
PCNFV
XRXOG
WPUIE
ONHTJ
TMPKE
CNJMR
DELBL
HZCYL
WUKBO
DMDFT
DQOEH
GPANB
UXWYA
POLQK
TJNCA
KVSPM
NLCWR
DGPVT
HBQBI
NOUBN
WSDRR
UHVMH
KROPD
UBTSO
TFANZ
VPZAV
TLXDA
DGJWO
SPMZE
GTUKE
SZCRT
HMRCM
QCYNH
LTLTN
BNLAR
WHVVU
JOXAS
TGKHW
DQVPC
JRGUA
KWSQQ
RJXDK
ZNSMW
UYXPQ
PIREQ
COHRF
GZWUP
OEJQH
KPKGX
XSQUM
DKTZD
OOJVM
ETBHG
CXXDO
LXXZE
MJPBX
NOKNU
VRRSU
SVDYK
LVFCK
YIIFN
DOYLF
BQKHV
PEZQT
ODTDA
MAXON
NSTOB
VAPFK
HWENO
QBODE
PWGQS
JGYKN
ESYUQ
NIUGH
FFVHY
SYSUU
BKTQF
ZJZDI
OFAIF
DLTDF
TCTGG
LADJN
EUXWO
CLEYW
QEMKY
TXACZ
HFLPY
GOEBJ
VDARG
ATVAO
YKVMB
YLJIV
SPLDB
OUTVI
XPGEO
DQCFL
SQMEF
NKAZM
NYWMA
EZMUC
SJDPH
ZHGGK
JPFHE
JPMDC
KRNTG
GOKYR
NILEL
GPHQC
BQCHY
KYEYF
EWHOP
NRWMJ
WZTPL
QZIJF
XHOCI
CKHLI
HGSZE
QUHPE
BMGSQ
KDLPM
QARMN
ERDNU
KDWPJ
SGGHO
LUHUY
FNGSB
GKMSB
PDZMD
BZXUV
WCSRH
QUWXL
OLPXD
HBXKA
XKAWC
YFWHQ
URQNX
MYRJP
SYJXN
PBDVQ
DUDYV
GRSEP
YBDSF
RXFWR
THVEQ
HICTC
SWECR
ULQRB
RXHIK
JWRBJ
CBPHC
RXSSX
TZLPI
VDWXZ
MHYEH
QQVNE
MDOIZ
BMKUC
JRUHS
MKFXI
RIVIK
MNBDT
AZRGA
YLUPO
FPWZV
XPGRT
KTHRQ
HTGYZ
HXGVH
JJTYR
EKZFW
ICYCK
JWEEE
LOPAT
IELAA
FPJBP
SQLGG
MDIBK
WTMDD
GUKIL
JOTUB
HCNCR
WDCFO
OELAF
EPFSG
MICRH
KEIRP
MNMIV
PJYWD
AMJOZ
SIDOH
PFWCC
QXBEW
FXMBZ
IGOYE
KRKNV
ZFGYU
SXGQW
NJPAI
FEBLY
ZDCRP
OFHFO
JNEHO
RFOVB
ZVSCB
YSYSA
TTWZS
IVODT
WMVSP
SWLWZ
RPRDO
AKWSV
LERLS
PXLKF
LEFYR
SEIEC
XWWBB
LVSCF
XFDGU
QIKND
WOEXB
MUYCG
LLTWD
ENUPS
TGYWA
MDHUJ
REQUF
XLTNH
JQKNI
CLZNS
YCUTI
JJKYB
YWHOT
REQTP
APEIA
Ran
do
m L
ette
rs o
f th
e A
lph
abet

AUDIT MANUAL
January 2000
EXHIBIT 6 PAGE 3 OF 3
1 2
3 4
5 6
7 8
9 10
1 40778124
75159148
53122660
85528978
62398120
12324611
7429056
60531432
89884596
55864440
2 51149215
9119308
33382295
79278140
34907645
49866436
9312075
17399993
51675336
4131224
3 14644533
35315123
18792992
82190290
28722228
49996373
2546838
86159719
81231773
41150160
4 17582246
98629872
54557453
87158231
55059242
84667125
90771492
57692887
9586208
15054100
5 85966829
66163015
93872801
43900360
50580560
40869313
26864698
68899010
3419473
14777685
6 35803276
98804984
64067763
72264872
38213189
54455049
32823601
90189125
63971372
58788330
7 45760954
91995654
28289414
45659034
17100150
17360470
22462130
22006750
71314454
16611739
8 15352550
28017181
36453718
22982806
38876258
99517277
56465474
19958278
90194940
30490469
9 85306688
68400099
19532943
18188932
91585102
68469747
29830415
19513076
54692561
44353435
10
90346592
39008217
25111941
59055079
22246811
63542279
66528659
69239999
51232155
33482410
11
60637652
56276092
86631932
33556831
5145679
98620706
54952532
43254681
51906616
91601406
12
31087788
63826853
64534337
69920877
16151840
77523865
17768988
10860538
62641301
17728763
13
68134781
4512574
2815500
79395379
26365907
9049740
89312578
87271418
66883727
39677383
14
91921846
24110574
2455074
27879558
85777321
30393142
65591285
79862384
55126211
1540596
15
83789671
71142007
75132855
15986394
25986090
9028179
26929212
22578440
56908697
55488265
16
77661085
2082930
25399957
41749916
56705655
98028477
84976088
67082374
91120641
34537385
17
18852166
25866412
43853932
23269738
56044879
28456967
88943325
25405591
56403657
26679244
18
26642983
89526862
2611661
14749293
59540869
41767096
85286420
68380643
42979965
4745772
19
3489985
28089708
32490134
43065016
3178561
50039008
85323299
38067424
34763512
98864676
20
45719548
90210867
86675002
44915805
66461322
87815373
45943605
52018222
50688535
48711622
21
83355524
91379300
55163683
61551386
24149214
70276718
4553484
10610057
36553237
96297241
22
79778010
68842894
8208703
89591798
71233280
89869533
51681544
94375154
57342095
60099031
23
15964889
50209245
69533937
54851853
30933126
79312328
94364989
86196286
58039627
40472291
24
5610468
90383108
87119184
77049698
61484030
62050840
16552465
63396314
52613047
76071866
25
73340830
53163496
51047599
69419796
70301640
10022486
13355163
4579451
94914877
48746346
26
58611591
98230428
93608243
76804036
7874166
37323354
76765260
4934455
69594830
30949031
27
81228324
84923939
79120106
73806141
30611877
29587641
6179527
76392984
41959131
73866488
28
74220807
59014117
8529260
1500938
38976616
52629681
32765256
78297264
10851377
93176367
29
31010746
97212972
37039317
96189279
81288573
45454800
74848964
83741475
27663848
77011994
30
77292299
50291097
98995755
47714522
19189432
4219721
26424220
75504717
42325018
73925875
31
42975863
9488848
14672587
40270457
65414418
78869859
55498975
29899788
99041775
38829683
32
76278695
96377206
86419960
44295822
86759113
37366392
48984372
17035097
29813601
77439187
33
29540790
81047381
28939416
97173959
57084320
91351263
60333902
86737318
81809742
76530412
34
7591851
76762616
33615654
1022343
85919304
36722569
61737743
12997318
15554190
76993043
35
39887598
22163527
20394138
4978775
72731037
58874178
51927425
66404555
27518213
28335766
Ran
do
m N
um
ber
s

STATISTICAL SAMPLING
January 2000
SAMPLE EVALUATION EXHIBIT 7
Copy to Taxpayer Date: _________
A B C D E
REF Units Dollars
Sample Difference
Items (d)
Sample Difference Items
Squared (d^2)1 Population (N) 40,000 52,100,000 658 432,9642 Sample (n) 100 130,237 321 103,0413 Population Mean 1,302.50 313 97,9694 Sample Mean 1,302.37 594 352,8365 Difference of sample mean from population mean -0.13 458 209,764
6 491 241,0817 Underpayment Differences in Sample 11 6,027 -178 31,6848 Overpayment Differences in Sample 3 -380 767 588,2899 Differences Total (Sum d) 14 5,647 567 321,489
10 1,476 2,178,57611 Differences Squared (Sum d^2) 14 4,672,601 -57 3,24912 Standard Deviation of Sample Differences (s) 97 9,40913 = Sqrt[ { n *Sum d^2 - ( Sum d)^2 } / {n(n-1)} ] 209.7067 285 81,22514 -145 21,02515 Sample Evaluation with Signed Differences 16 17 Standard Deviation of Sample Differences (s) 209.7067 18 Square Root of Sample Size ( Sqrt[n] ) 10.0000 19 Standard Error ( se = s / Sqrt [n] ) 20.9707 20 21 80% Confidence Coefficient (z) 1.2800 22 Achieved Confidence Interval ( ACI = se * z ) 26.8425
23 24 Sum of Differences in Sample (Sum d) 5,647.0000 25 Number of Items in Sample 100.0000 26 Mean Difference in Sample (Mean d) 56.4700 27 28 Achieved Confidence Interval as % of Mean ( ACI / Mean d ) 47.53% 29 30 Percentage of Error ( Sum d / Sample Base ) 4.3359% 31 32 33 34 Sample Projection with Difference Estimation Method 35 Total Differences in Sample (Sum d) $5,647.00 36 Number of Items in Sample (n) 100 37 Mean Difference in Sample (= Sum d / n ) $56.4700 38 Number of Items in Population (N) 40,000 39 Estimated Difference in Population $2,258,800.00
40 41 42 Sample Projection with Ratio (Percentage of Error) Estimation Method 43 Total Differences in Sample (Sum d) $5,647.00 44 Sample Base in dollars $130,237.00 45 Percentage of Error (= Sum d / Sample Base) 4.3359% 46 Population Base in dollars $52,100,000.00 47 Estimated Difference in Population $2,259,025.47
48 Totals 5,647 4,672,601
STATISTICAL SAMPLE EVALUATION WITH80% CONFIDENCE LEVEL
21-000000SCHEDULE
S R06/26/00

ESTIMATION PROJECTION TECHNIQUES EXHIBIT 8
�� �� �� �� �� �� ��
REFERENCE
SCHEDULE PAGE
ACCOUNT NO.
AUDITOR
DATE
1
2
3
4
5
6
7
8
9
10
11
12
13
14
15
16
17
18
19
20
21
22
23
24
25
26
27
28
29
30
31
32
33
34
35
36
37
38
39
40
������ ����� � �������������� ����������� ���������������� ������������� ��� �������� �����������!� �������������!���""����#��� $������ ∑ $���%�&��� ���%&����
'��(���(�����)��� �����*���� ���+��� ������!�,��������-�$�.����� %&�����$���$�� ���.����� ���������� /����"�� ���� ����� �������$���$�.���� ������������������0�������� ���1��%��%��� ��$���$�.�����
������������������������������(���1��%��%��� ����!������� ����-�$�.�����
��""����#��)��� �������%&����0�������������� ����!�1����� ����-�$�.�����
.����)��� �����2���#�������"�)����3�
����4�0�������������� ����!�������������-�$�.�����
21-000000 SJR 6-18-xx
Note:
Refer to section 1306.00 for a discussion of these techniques.
sx
AUDIT MANUAL
January 2000
%�&���������!�
∑����

SAMPLE DATA ANALYSIS: STRATIFIED POPULATION EXHIBIT 9
As explained in section 1304.15, Audit Staff must contact their local Computer Audit Specialist for assistance in computing a combined evaluation of the population tested. A revised exhibit 9 is being developed to illustrate the computations of a combined evaluation.
STATISTICAL SAMPLING
March 2002

AUDIT MANUAL
January 2000
PROJECTION TECHNIQUES WITH STRATIFICATION EXHIBIT 10
761,93
347,4
���5�#�����*�#6��7����-��6������"�#�����
8���6�����#�$�����0 �������5�#�����-��$����������������"��$���$� �� �����/�����8���6����0 ����-��-�����5�#������6��/�����"�������"��$����������-��6���� ��#����0#��$�����������/������0 ���$������#���/�����
9��6������"�#��������$5��� ���������������������-��/����#����:���"��-�;�
������ ����� � �����
������������ ������� ��������������,���������"�#����� (������� (����1�������*������������� ���%��� �����1��������� ���������
� ������ ���� ������!�,���������"�#����� ���%� ���%��!%��$5����$�� ��� ��&�� ��1��!%�� ����%����
��""����#���$�� ��� %&���,���������"�#����� ���� ��!%� ���$5����$���""����#��� �1� ���!� ���!��
���5�#�����<�.����)��� ������� ��%�4�0��1����������� ��&�&�&&������-�$�.�����
8��$$����������6�����������5�#��$�/� ����:�$$�������������"�� ��6��#����0 ������������ ��#����0#��$�����������-��$�/��$$�$�����6�����5�#��$����������� ��������������$���-�$��
�� �� �� �� �� �� ��
REFERENCE
SCHEDULE PAGE
ACCOUNT NO.
AUDITOR
DATE
1
2
3
4
5
6
7
8
9
10
11
12
13
14
15
16
17
18
19
20
21
22
23
24
25
26
27
28
29
30
31
32
33
34
35
36
37
38
39
40
∑$�&��

STATISTICAL SAMPLING
January 2000
Given: σ = 285.05 (Standard Deviation)
= 68.23 (Mean of Differences)
n =
For Example: Sample size for 80% C.L. and 40% C.I. z at 80% equals 1.28 (refer to z table ) I at 40% equals 27.29 ( x 40%)
n = = 179
SAMPLE SIZE MATRIX EXHIBIT 11
L.C%59 %09 %58 %08 %57 %06
.I.C%53 745 683 592 332 881 451
%04 914 592 622 971 441 811
%54 133 332 971 141 411 39
%05 862 981 541 411 29 67
%55 222 651 021 59 67 26
%06 681 131 101 97 46 25
%56 951 211 68 86 55 54
%07 731 69 47 85 74 93
%57 911 48 46 15 14 43
%08 501 47 75 54 63 92
dx
dx
• ( )2

AUDIT MANUAL
January 2000
SAMPLE SIZES FOR VARIABLE SAMPLING AT 80% CONFIDENCE LEVEL EXHIBIT 12
Instructional Note:
The Sample Size Table for Variable Sampling requires an advance estimate of the sampling error and the standard deviation in order to use the table. These advance estimates could be obtained from prior audit results, or any other information available to the auditor.
The sampling error is a measurement of the error which is due to the chance that the sample is not a miniature replica of the population. In the example shown in Exhibit 6, the samping error was computed to be 20.97
Using the data from Exhibit 6, the following ratio would be computed:
With this factor computed, the table can then be used to estimate the sample size for any given population.
Sample Sizes for Variable Sampling at 80% Confidence Level
Population Sizes
5,000 10,000 20,000 25,000 50,000 100,000 500,000 1,000,000 0.01 3,834 6,217 9,020 9,914 12,366 14,110 15,905 16,163 0.02 2,255 2,912 3,408 3,528 3,796 3,945 4,074 4,091 0.03 1,338 1,544 1,673 1,702 1,761 1,793 1,819 1,822 0.04 852 932 977 987 1,007 1,017 1,025 1,026 0.05 581 617 637 641 649 653 657 657 0.06 419 437 447 449 453 455 456 457 0.07 315 325 330 331 334 335 336 336 0.08 245 251 254 255 256 257 257 257 0.09 195 199 201 202 202 203 203 203 0.10 160 162 163 164 164 165 165 165 0.11 133 134 135 136 136 136 136 136 0.12 112 113 114 114 114 114 115 115 0.13 96 97 97 97 98 98 98 98 0.14 83 84 84 84 84 84 84 84 0.15 72 73 73 73 73 73 74 74 0.16 64 64 64 64 65 65 65 65 0.17 57 57 57 57 57 57 57 57 0.18 51 51 51 51 51 51 51 51 0.19 46 46 46 46 46 46 46 46 0.20 41 41 41 41 42 42 42 42 0.21 37 38 38 38 38 38 38 38 0.22 34 34 34 34 34 34 34 34 0.23 31 31 32 32 32 32 32 32 0.24 29 29 29 29 29 29 29 29 0.25 27 27 27 27 27 27 27 27 0.30 19 19 19 19 19 19 19 19 0.35 14 14 14 14 14 14 14 14 0.40 11 11 11 11 11 11 11 11
Ratio of Sampling Error
to Standard Deviation
Sampling Error
Standard Deviation =
20.97
209.70 = .10

STATISTICAL SAMPLING
January 2000
JULIAN CALENDAR EXHIBIT 13
Julian Calendar Day JAN FEB MAR APR MAY JUN JUL AUG SEP OCT NOV DEC
1 1 32 60 91 121 152 182 213 244 274 305 335 2 2 33 61 92 122 153 183 214 245 275 306 336 3 3 34 62 93 123 154 184 215 246 276 307 337 4 4 35 63 94 124 155 185 216 247 277 308 338 5 5 36 64 95 125 156 186 217 248 278 309 339
6 6 37 65 96 126 157 187 218 249 279 310 340 7 7 38 66 97 127 158 188 219 250 280 311 341 8 8 39 67 98 128 159 189 220 251 281 312 342 9 9 40 68 99 129 160 190 221 252 282 313 343 10 10 41 69 100 130 161 191 222 253 283 314 344
11 11 42 70 101 131 162 192 223 254 284 315 345 12 12 43 71 102 132 163 193 224 255 285 316 346 13 13 44 72 103 133 164 194 225 256 286 317 347 14 14 45 73 104 134 165 195 226 257 287 318 348 15 15 46 74 105 135 166 196 227 258 288 319 349
16 16 47 75 106 136 167 197 228 259 289 320 350 17 17 48 76 107 137 168 198 229 260 290 321 351 18 18 49 77 108 138 169 199 230 261 291 322 352 19 19 50 78 109 139 170 200 231 262 292 323 353 20 20 51 79 110 140 171 201 232 263 293 324 354
21 21 52 80 111 141 172 202 233 264 294 325 355 22 22 53 81 112 142 173 203 234 265 295 326 356 23 23 54 82 113 143 174 204 235 266 296 327 357 24 24 55 83 114 144 175 205 236 267 297 328 358 25 25 56 84 115 145 176 206 237 268 298 329 359
26 26 57 85 116 146 177 207 238 269 299 330 360 27 27 58 86 117 147 178 208 239 270 300 331 361 28 28 59 87 118 148 179 209 240 271 301 332 362 29 29 88 119 149 180 210 241 272 302 333 363 30 30 89 120 150 181 211 242 273 303 334 364
31 31 90 151 212 243 304 365
Note: For leap year, Feb 29 has the Julian Date of 60. All dates after Feb 29 must be increased by 1 from date shown above.

AUDIT MANUAL
January 2000
PERPETUAL CALENDAR EXHIBIT 14 PAGE 1 OF 8
1821 .............. 2 1822 .............. 3 1823 .............. 4 1824 ............ 12 1825 .............. 7 1826 .............. 1 1827 .............. 2 1828 ............ 10 1829 .............. 5 1830 .............. 6 1831 .............. 7 1832 .............. 5 1833 .............. 3 1834 .............. 4 1835 .............. 5 1836 ............ 13 1837 .............. 1 1838 .............. 2 1839 .............. 3 1840 ............ 11 1841 .............. 6 1842 .............. 7 1843 .............. 1 1844 .............. 9 1845 .............. 4 1846 .............. 5 1847 .............. 6 1848 ............ 14 1849 .............. 2 1850 .............. 3 1851 .............. 4 1852 ............ 12 1853 .............. 7 1854 .............. 1 1855 .............. 2 1856 ............ 10 1857 .............. 5 1858 .............. 6 1859 .............. 7 1860 .............. 8 1861 .............. 3 1862 .............. 4 1863 .............. 5 1864 ............ 13 1865 .............. 1
1866 .............. 2 1867 .............. 3 1868 ............ 11 1869 .............. 6 1870 .............. 7 1871 .............. 1 1872 .............. 9 1873 .............. 4 1874 .............. 5 1875 .............. 6 1876 ............ 14 1877 .............. 2 1878 .............. 3 1879 .............. 4 1880 ............ 12 1881 .............. 7 1882 .............. 1 1883 .............. 2 1884 ............ 10 1885 .............. 5 1886 .............. 6 1887 .............. 7 1888 .............. 8 1889 .............. 3 1890 .............. 4 1891 .............. 5 1892 ............ 13 1893 .............. 1 1894 .............. 2 1895 .............. 3 1896 ............ 11 1897 .............. 6 1898 .............. 7 1899 .............. 1 1900 .............. 2 1901 .............. 3 1902 .............. 4 1903 .............. 5 1904 ............ 13 1905 .............. 1 1906 .............. 2 1907 .............. 3 1908 ............ 11 1909 .............. 6 1910 .............. 7
1911 .............. 1 1912 .............. 9 1913 .............. 4 1914 .............. 5 1915 .............. 6 1916 ............ 14 1917 .............. 2 1918 .............. 3 1919 .............. 4 1920 ............ 12 1921 .............. 7 1922 .............. 1 1923 .............. 2 1924 ............ 10 1925 .............. 5 1926 .............. 6 1927 .............. 7 1928 .............. 8 1929 .............. 3 1930 .............. 4 1931 .............. 5 1932 ............ 13 1933 .............. 1 1934 .............. 2 1935 .............. 3 1936 ............ 11 1937 .............. 6 1938 .............. 7 1939 .............. 1 1940 .............. 9 1941 .............. 4 1942 .............. 5 1943 .............. 6 1944 ............ 14 1945 .............. 2 1946 .............. 3 1947 .............. 4 1948 ............ 12 1949 .............. 7 1950 .............. 1 1951 .............. 2 1952 ............ 10 1953 .............. 5 1954 .............. 6 1955 .............. 7
1956 .............. 8 1957 .............. 3 1958 .............. 4 1959 .............. 5 1960 ............ 13 1961 .............. 1 1962 .............. 2 1963 .............. 3 1964 ............ 11 1965 .............. 6 1966 .............. 7 1967 .............. 1 1968 .............. 9 1969 .............. 4 1970 .............. 5 1971 .............. 6 1972 ............ 14 1973 .............. 2 1974 .............. 3 1975 .............. 4 1976 ............ 12 1977 .............. 7 1978 .............. 1 1979 .............. 2 1980 ............ 10 1981 .............. 5 1982 .............. 6 1983 .............. 7 1984 .............. 8 1985 .............. 3 1986 .............. 4 1987 .............. 5 1988 ............ 13 1989 .............. 1 1990 .............. 2 1991 .............. 3 1992 ............ 11 1993 .............. 6 1994 .............. 7 1995 .............. 1 1996 .............. 9 1997 .............. 4 1998 .............. 5 1999 .............. 6 2000 ............ 14
2001 .............. 2 2002 .............. 3 2003 .............. 4 2004 ............ 12 2005 .............. 7 2006 .............. 1 2007 .............. 2 2008 ............ 10 2009 .............. 5 2010 .............. 6 2011 .............. 7 2012 .............. 8 2013 .............. 3 2014 .............. 4 2015 .............. 5 2016 ............ 13 2017 .............. 1 2018 .............. 2 2019 .............. 3 2020 .............. 4 2021 .............. 5 2022 .............. 6 2023 .............. 7 2024 .............. 8 2025 .............. 3 2026 .............. 4 2027 .............. 5 2028 ............ 13 2029 .............. 1 2030 .............. 2 2031 .............. 3 2032 ............ 11 2033 .............. 6 2034 .............. 7 2035 .............. 1 2036 .............. 9 2037 .............. 4 2038 .............. 5 2039 .............. 6 2040 ............ 14 2041 .............. 2 2042 .............. 3 2043 .............. 4 2044 ............ 12 2045 .............. 7
CALENDARS - 1821 TO 2045 INDEX
DIRECTIONS FOR USE Look for the year you want in the index. The number opposite each year is the number of the calendar, located on the following pages, to use for that year.

STATISTICAL SAMPLING
January 2000
EXHIBIT 14 PAGE 2 OF 8
1 �������
S M T W T F S
1 2 3 4 5 6 78 9 01 11 21 31 4151 61 71 81 91 02 1222 32 42 52 62 72 8292 03 13
�������
S M T W T F S
1 2 3 45 6 7 8 9 01 1121 31 41 51 61 71 8191 02 12 22 32 42 5262 72 82
����
S M T W T F S
1 2 3 45 6 7 8 9 01 1121 31 41 51 61 71 8191 02 12 22 32 42 5262 72 82 92 03 13
����
S M T W T F S
12 3 4 5 6 7 89 01 11 21 31 41 5161 71 81 91 02 12 2232 42 52 62 72 82 9203
���
S M T W T F S
1 2 3 4 5 67 8 9 01 11 21 3141 51 61 71 81 91 0212 22 32 42 52 62 7282 92 03 13
����
S M T W T F S
1 2 34 5 6 7 8 9 0111 21 31 41 51 61 7181 91 02 12 22 32 4252 62 72 82 92 03
� ��
S M T W T F S
12 3 4 5 6 7 89 01 11 21 31 41 5161 71 81 91 02 12 2232 42 52 62 72 82 9203 13
������
S M T W T F S
1 2 3 4 56 7 8 9 01 11 2131 41 51 61 71 81 9102 12 22 32 42 52 6272 82 92 03 13
���������
S M T W T F S
1 23 4 5 6 7 8 901 11 21 31 41 51 6171 81 91 02 12 22 3242 52 62 72 82 92 03
�������
S M T W T F S
1 2 3 4 5 6 78 9 01 11 21 31 4151 61 71 81 91 02 1222 32 42 52 62 72 8292 03 13
��������
S M T W T F S
1 2 3 45 6 7 8 9 01 1121 31 41 51 61 71 8191 02 12 22 32 42 5262 72 82 92 03
��������
S M T W T F S
1 23 4 5 6 7 8 901 11 21 31 41 51 6171 81 91 02 12 22 3242 52 62 72 82 92 0313
�������
S M T W T F S
1 2 3 4 5 67 8 9 01 11 21 3141 51 61 71 81 91 0212 22 32 42 52 62 7282 92 03 13
�������
S M T W T F S
1 2 34 5 6 7 8 9 0111 21 31 41 51 61 7181 91 02 12 22 32 4252 62 72 82
����
S M T W T F S
1 2 34 5 6 7 8 9 0111 21 31 41 51 61 7181 91 02 12 22 32 4252 62 72 82 92 03 13
����
S M T W T F S
1 2 3 4 5 6 78 9 01 11 21 31 4151 61 71 81 91 02 1222 32 42 52 62 72 8292 03
���
S M T W T F S
1 2 3 4 56 7 8 9 01 11 2131 41 51 61 71 81 9102 12 22 32 42 52 6272 82 92 03 13
����
S M T W T F S
1 23 4 5 6 7 8 901 11 21 31 41 51 6171 81 91 02 12 22 3242 52 62 72 82 92 03
� ��
S M T W T F S
1 2 3 4 5 6 78 9 01 11 21 31 4151 61 71 81 91 02 1222 32 42 52 62 72 8292 03 13
������
S M T W T F S
1 2 3 45 6 7 8 9 01 1121 31 41 51 61 71 8191 02 12 22 32 42 5262 72 82 92 03 13
���������
S M T W T F S
12 3 4 5 6 7 89 01 11 21 31 41 5161 71 81 91 02 12 2232 42 52 62 72 82 9203
�������
S M T W T F S
1 2 3 4 5 67 8 9 01 11 21 3141 51 61 71 81 91 0212 22 32 42 52 62 7282 92 03 13
��������
S M T W T F S
1 2 34 5 6 7 8 9 0111 21 31 41 51 61 7181 91 02 12 22 32 4252 62 72 82 92 03
��������
S M T W T F S
12 3 4 5 6 7 89 01 11 21 31 41 5161 71 81 91 02 12 2232 42 52 62 72 82 9203 13
2

AUDIT MANUAL
January 2000
EXHIBIT 14 PAGE 3 OF 8
�������
S M T W T F S
1 2 3 4 56 7 8 9 01 11 2131 41 51 61 71 81 9102 12 22 32 42 52 6272 82 92 03 13
�������
S M T W T F S
1 23 4 5 6 7 8 901 11 21 31 41 51 6171 81 91 02 12 22 3242 52 62 72 82
����
S M T W T F S
1 23 4 5 6 7 8 901 11 21 31 41 51 6171 81 91 02 12 22 3242 52 62 72 82 92 0313
����
S M T W T F S
1 2 3 4 5 67 8 9 01 11 21 3141 51 61 71 81 91 0212 22 32 42 52 62 7282 92 03
���
S M T W T F S
1 2 3 45 6 7 8 9 01 1121 31 41 51 61 71 8191 02 12 22 32 42 5262 72 82 92 03 13
����
S M T W T F S
12 3 4 5 6 7 89 01 11 21 31 41 5161 71 81 91 02 12 2232 42 52 62 72 82 9203
� ��
S M T W T F S
1 2 3 4 5 67 8 9 01 11 21 3141 51 61 71 81 91 0212 22 32 42 52 62 7282 92 03 13
������
S M T W T F S
1 2 34 5 6 7 8 9 0111 21 31 41 51 61 7181 91 02 12 22 32 4252 62 72 82 92 03 13
���������
S M T W T F S
1 2 3 4 5 6 78 9 01 11 21 31 4151 61 71 81 91 02 1222 32 42 52 62 72 8292 03
�������
S M T W T F S
1 2 3 4 56 7 8 9 01 11 2131 41 51 61 71 81 9102 12 22 32 42 52 6272 82 92 03 13
��������
S M T W T F S
1 23 4 5 6 7 8 901 11 21 31 41 51 6171 81 91 02 12 22 3242 52 62 72 82 92 03
��������
S M T W T F S
1 2 3 4 5 6 78 9 01 11 21 31 4151 61 71 81 91 02 1222 32 42 52 62 72 8292 03 13
�������
S M T W T F S
1 2 3 45 6 7 8 9 01 1121 31 41 51 61 71 8191 02 12 22 32 42 5262 72 82 92 03 13
�������
S M T W T F S
12 3 4 5 6 7 89 01 11 21 31 41 5161 71 81 91 02 12 2232 42 52 62 72 82
����
S M T W T F S
12 3 4 5 6 7 89 01 11 21 31 41 5161 71 81 91 02 12 2232 42 52 62 72 82 9203 13
����
S M T W T F S
1 2 3 4 56 7 8 9 01 11 2131 41 51 61 71 81 9102 12 22 32 42 52 6272 82 92 03
���
S M T W T F S
1 2 34 5 6 7 8 9 0111 21 31 41 51 61 7181 91 02 12 22 32 4252 62 72 82 92 03 13
����
S M T W T F S
1 2 3 4 5 6 78 9 01 11 21 31 4151 61 71 81 91 02 1222 32 42 52 62 72 8292 03
� ��
S M T W T F S
1 2 3 4 56 7 8 9 01 11 2131 41 51 61 71 81 9102 12 22 32 42 52 6272 82 92 03 13
�������
S M T W T F S
1 2 3 45 6 7 8 9 01 1121 31 41 51 61 71 8191 02 12 22 32 42 5262 72 82 92 03 13
������
S M T W T F S
1 23 4 5 6 7 8 901 11 21 31 41 51 6171 81 91 02 12 22 3242 52 62 72 82 92 0313
�������
S M T W T F S
1 2 3 45 6 7 8 9 01 1121 31 41 51 61 71 8191 02 12 22 32 42 5262 72 82 92 03 13
��������
S M T W T F S
12 3 4 5 6 7 89 01 11 21 31 41 5161 71 81 91 02 12 2232 42 52 62 72 82 9203
��������
S M T W T F S
1 2 3 4 5 67 8 9 01 11 21 3141 51 61 71 81 91 0212 22 32 42 52 62 7282 92 03 13
3
4

STATISTICAL SAMPLING
January 2000
EXHIBIT 14 PAGE 4 OF 8
��������
S M T W T F S
1 2 3 4 5 6 78 9 01 11 21 31 4151 61 71 81 91 02 1222 32 42 52 62 72 82
�����
S M T W T F S
1 2 3 4 5 6 78 9 01 11 21 31 4151 61 71 81 91 02 1222 32 42 52 62 72 8292 03 13
���
S M T W T F S
1 2 3 45 6 7 8 9 01 1121 31 41 51 61 71 8191 02 12 22 32 42 5262 72 82 92 03
���
S M T W T F S
1 23 4 5 6 7 8 901 11 21 31 41 51 6171 81 91 02 12 22 3242 52 62 72 82 92 0313
���
S M T W T F S
1 2 3 4 5 67 8 9 01 11 21 3141 51 61 71 81 91 0212 22 32 42 52 62 7282 92 03
���
S M T W T F S
1 2 3 45 6 7 8 9 01 1121 31 41 51 61 71 8191 02 12 22 32 42 5262 72 82 92 03 13
������
S M T W T F S
12 3 4 5 6 7 89 01 11 21 31 41 5161 71 81 91 02 12 2232 42 52 62 72 82 9203 13
��������
S M T W T F S
1 2 3 4 56 7 8 9 01 11 2131 41 51 61 71 81 9102 12 22 32 42 52 6272 82 92 03
�������
S M T W T F S
1 2 34 5 6 7 8 9 0111 21 31 41 51 61 7181 91 02 12 22 32 4252 62 72 82 92 03 13
��������
S M T W T F S
1 2 3 4 5 6 78 9 01 11 21 31 4151 61 71 81 91 02 1222 32 42 52 62 72 8292 03
��������
S M T W T F S
1 2 3 4 56 7 8 9 01 11 2131 41 51 61 71 81 9102 12 22 32 42 52 6272 82 92 03 13
�������
S M T W T F S
1 23 4 5 6 7 8 901 11 21 31 41 51 6171 81 91 02 12 22 3242 52 62 72 82 92 0313
�������
S M T W T F S
1 2 3 4 5 67 8 9 01 11 21 3141 51 61 71 81 91 0212 22 32 42 52 62 7282
����
S M T W T F S
1 2 3 4 5 67 8 9 01 11 21 3141 51 61 71 81 91 0212 22 32 42 52 62 7282 92 03 13
����
S M T W T F S
1 2 34 5 6 7 8 9 0111 21 31 41 51 61 7181 91 02 12 22 32 4252 62 72 82 92 03
���
S M T W T F S
12 3 4 5 6 7 89 01 11 21 31 41 5161 71 81 91 02 12 2232 42 52 62 72 82 9203 13
����
S M T W T F S
1 2 3 4 56 7 8 9 01 11 2131 41 51 61 71 81 9102 12 22 32 42 52 6272 82 92 03
� ��
S M T W T F S
1 2 34 5 6 7 8 9 0111 21 31 41 51 61 7181 91 02 12 22 32 4252 62 72 82 92 03 13
������
S M T W T F S
1 2 3 4 5 6 78 9 01 11 21 31 4151 61 71 81 91 02 1222 32 42 52 62 72 8292 03 13
���������
S M T W T F S
1 2 3 45 6 7 8 9 01 1121 31 41 51 61 71 8191 02 12 22 32 42 5262 72 82 92 03
�������
S M T W T F S
1 23 4 5 6 7 8 901 11 21 31 41 51 6171 81 91 02 12 22 3242 52 62 72 82 92 0313
��������
S M T W T F S
1 2 3 4 5 67 8 9 01 11 21 3141 51 61 71 81 91 0212 22 32 42 52 62 7282 92 03
��������
S M T W T F S
1 2 3 45 6 7 8 9 01 1121 31 41 51 61 71 8191 02 12 22 32 42 5262 72 82 92 03 13
5
6
������
S M T W T F S
1 2 34 5 6 7 8 9 0111 21 31 41 51 61 7181 91 02 12 22 32 4252 62 72 82 92 03 13

AUDIT MANUAL
January 2000
�������
S M T W T F S
12 3 4 5 6 7 89 01 11 21 31 41 5161 71 81 91 02 12 2232 42 52 62 72 82 9203 13
�������
S M T W T F S
1 2 3 4 56 7 8 9 01 11 2131 41 51 61 71 81 9102 12 22 32 42 52 6272 82
����
S M T W T F S
1 2 3 4 56 7 8 9 01 11 2131 41 51 61 71 81 9102 12 22 32 42 52 6272 82 92 03 13
����
S M T W T F S
1 23 4 5 6 7 8 901 11 21 31 41 51 6171 81 91 02 12 22 3242 52 62 72 82 92 03
���
S M T W T F S
1 2 3 4 5 6 78 9 01 11 21 31 4151 61 71 81 91 02 1222 32 42 52 62 72 8292 03 13
����
S M T W T F S
1 2 3 45 6 7 8 9 01 1121 31 41 51 61 71 8191 02 12 22 32 42 5262 72 82 92 03
������
S M T W T F S
1 2 3 4 5 67 8 9 01 11 21 3141 51 61 71 81 91 0212 22 32 42 52 62 7282 92 03 13
���������
S M T W T F S
1 2 34 5 6 7 8 9 0111 21 31 41 51 61 7181 91 02 12 22 32 4252 62 72 82 92 03
�������
S M T W T F S
12 3 4 5 6 7 89 01 11 21 31 41 5161 71 81 91 02 12 2232 42 52 62 72 82 9203 13
��������
S M T W T F S
1 2 3 4 56 7 8 9 01 11 2131 41 51 61 71 81 9102 12 22 32 42 52 6272 82 92 03
��������
S M T W T F S
1 2 34 5 6 7 8 9 0111 21 31 41 51 61 7181 91 02 12 22 32 4252 62 72 82 92 03 13
� ��
S M T W T F S
1 23 4 5 6 7 8 901 11 21 31 41 51 6171 81 91 02 12 22 3242 52 62 72 82 92 0313
�������
S M T W T F S
1 2 3 4 5 6 78 9 01 11 21 31 4151 61 71 81 91 02 1222 32 42 52 62 72 8292 03 13
�������
S M T W T F S
1 2 3 45 6 7 8 9 01 1121 31 41 51 61 71 8191 02 12 22 32 42 5262 72 82 92
����
S M T W T F S
1 2 34 5 6 7 8 9 0111 21 31 41 51 61 7181 91 02 12 22 32 4252 62 72 82 92 03 13
����
S M T W T F S
1 2 3 4 5 6 78 9 01 11 21 31 4151 61 71 81 91 02 1222 32 42 52 62 72 8292 03
���
S M T W T F S
1 2 3 4 56 7 8 9 01 11 2131 41 51 61 71 81 9102 12 22 32 42 52 6272 82 92 03 13
����
S M T W T F S
1 23 4 5 6 7 8 901 11 21 31 41 51 6171 81 91 02 12 22 3242 52 62 72 82 92 03
� ��
S M T W T F S
1 2 3 4 5 6 78 9 01 11 21 31 4151 61 71 81 91 02 1222 32 42 52 62 72 8292 03 13
������
S M T W T F S
1 2 3 45 6 7 8 9 01 1121 31 41 51 61 71 8191 02 12 22 32 42 5262 72 82 92 03 13
���������
S M T W T F S
12 3 4 5 6 7 89 01 11 21 31 41 5161 71 81 91 02 12 2232 42 52 62 72 82 9203
�������
S M T W T F S
1 2 3 4 5 67 8 9 01 11 21 3141 51 61 71 81 91 0212 22 32 42 52 62 7282 92 03 13
��������
S M T W T F S
1 2 34 5 6 7 8 9 0111 21 31 41 51 61 7181 91 02 12 22 32 4252 62 72 82 92 03
��������
S M T W T F S
12 3 4 5 6 7 89 01 11 21 31 41 5161 71 81 91 02 12 2232 42 52 62 72 82 9203 13
7
8
EXHIBIT 14 PAGE 5 OF 8

STATISTICAL SAMPLING
January 2000
�������
S M T W T F S
1 2 3 4 5 67 8 9 01 11 21 3141 51 61 71 81 91 0212 22 32 42 52 62 7282 92 03 13
�������
S M T W T F S
1 2 34 5 6 7 8 9 0111 21 31 41 51 61 7181 91 02 12 22 32 4252 62 72 82 92
����
S M T W T F S
1 23 4 5 6 7 8 901 11 21 31 41 51 6171 81 91 02 12 22 3242 52 62 72 82 92 0313
����
S M T W T F S
1 2 3 4 5 67 8 9 01 11 21 3141 51 61 71 81 91 0212 22 32 42 52 62 7282 92 03
���
S M T W T F S
1 2 3 45 6 7 8 9 01 1121 31 41 51 61 71 8191 02 12 22 32 42 5262 72 82 92 03 13
����
S M T W T F S
12 3 4 5 6 7 89 01 11 21 31 41 5161 71 81 91 02 12 2232 42 52 62 72 82 9203
� ��
S M T W T F S
1 2 3 4 5 67 8 9 01 11 21 3141 51 61 71 81 91 0212 22 32 42 52 62 7282 92 03 13
������
S M T W T F S
1 2 34 5 6 7 8 9 0111 21 31 41 51 61 7181 91 02 12 22 32 4252 62 72 82 92 03 13
���������
S M T W T F S
1 2 3 4 5 6 78 9 01 11 21 31 4151 61 71 81 91 02 1222 32 42 52 62 72 8292 03
�������
S M T W T F S
1 2 3 4 56 7 8 9 01 11 2131 41 51 61 71 81 9102 12 22 32 42 52 6272 82 92 03 13
��������
S M T W T F S
1 23 4 5 6 7 8 901 11 21 31 41 51 6171 81 91 02 12 22 3242 52 62 72 82 92 03
��������
S M T W T F S
1 2 3 4 5 6 78 9 01 11 21 31 4151 61 71 81 91 02 1222 32 42 52 62 72 8292 03 13
�������
S M T W T F S
1 2 3 4 56 7 8 9 01 11 2131 41 51 61 71 81 9102 12 22 32 42 52 6272 82 92 03 13
�������
S M T W T F S
1 23 4 5 6 7 8 901 11 21 31 41 51 6171 81 91 02 12 22 3242 52 62 72 82 92
����
S M T W T F S
12 3 4 5 6 7 89 01 11 21 31 41 5161 71 81 91 02 12 2232 42 52 62 72 82 9203 13
����
S M T W T F S
1 2 3 4 56 7 8 9 01 11 2131 41 51 61 71 81 9102 12 22 32 42 52 6272 82 92 03
���
S M T W T F S
1 2 34 5 6 7 8 9 0111 21 31 41 51 61 7181 91 02 12 22 32 4252 62 72 82 92 03 13
����
S M T W T F S
1 2 3 4 5 6 78 9 01 11 21 31 4151 61 71 81 91 02 1222 32 42 52 62 72 8292 03
� ��
S M T W T F S
1 2 3 4 56 7 8 9 01 11 2131 41 51 61 71 81 9102 12 22 32 42 52 6272 82 92 03 13
������
S M T W T F S
1 23 4 5 6 7 8 901 11 21 31 41 51 6171 81 91 02 12 22 3242 52 62 72 82 92 0313
���������
S M T W T F S
1 2 3 4 5 67 8 9 01 11 21 3141 51 61 71 81 91 0212 22 32 42 52 62 7282 92 03
�������
S M T W T F S
1 2 3 45 6 7 8 9 01 1121 31 41 51 61 71 8191 02 12 22 32 42 5262 72 82 92 03 13
��������
S M T W T F S
12 3 4 5 6 7 89 01 11 21 31 41 5161 71 81 91 02 12 2232 42 52 62 72 82 9203
��������
S M T W T F S
1 2 3 4 56 7 8 9 01 11 2131 41 51 61 71 81 9102 12 22 32 42 52 6272 82 92 03 13
9
10
EXHIBIT 14 PAGE 6 OF 8

AUDIT MANUAL
January 2000
�������
S M T W T F S
1 2 3 45 6 7 8 9 01 1121 31 41 51 61 71 8191 02 12 22 32 42 5262 72 82 92 03 13
�������
S M T W T F S
12 3 4 5 6 7 89 01 11 21 31 41 5161 71 81 91 02 12 2232 42 52 62 72 82 92
����
S M T W T F S
1 2 3 4 5 6 78 9 01 11 21 31 4151 61 71 81 91 02 1222 32 42 52 62 72 8292 03 13
����
S M T W T F S
1 2 3 45 6 7 8 9 01 1121 31 41 51 61 71 8191 02 12 22 32 42 5262 72 82 92 03
���
S M T W T F S
1 23 4 5 6 7 8 901 11 21 31 41 51 6171 81 91 02 12 22 3242 52 62 72 82 92 0313
����
S M T W T F S
1 2 3 4 5 67 8 9 01 11 21 3141 51 61 71 81 91 0212 22 32 42 52 62 7282 92 03
� ��
S M T W T F S
1 2 3 45 6 7 8 9 01 1121 31 41 51 61 71 8191 02 12 22 32 42 5262 72 82 92 03 13
������
S M T W T F S
12 3 4 5 6 7 89 01 11 21 31 41 5161 71 81 91 02 12 2232 42 52 62 72 82 9203 13
���������
S M T W T F S
1 2 3 4 56 7 8 9 01 11 2131 41 51 61 71 81 9102 12 22 32 42 52 6272 82 92 03
�������
S M T W T F S
1 2 34 5 6 7 8 9 0111 21 31 41 51 61 7181 91 02 12 22 32 4252 62 72 82 92 03 13
��������
S M T W T F S
1 2 3 4 5 6 78 9 01 11 21 31 4151 61 71 81 91 02 1222 32 42 52 62 72 8292 03
��������
S M T W T F S
1 2 3 4 56 7 8 9 01 11 2131 41 51 61 71 81 9102 12 22 32 42 52 6272 82 92 03 13
�������
S M T W T F S
1 2 34 5 6 7 8 9 0111 21 31 41 51 61 7181 91 02 12 22 32 4252 62 72 82 92 03 13
�������
S M T W T F S
1 2 3 4 5 6 78 9 01 11 21 31 4151 61 71 81 91 02 1222 32 42 52 62 72 8292
����
S M T W T F S
1 2 3 4 5 67 8 9 01 11 21 3141 51 61 71 81 91 0212 22 32 42 52 62 7282 92 03 13
����
S M T W T F S
1 2 34 5 6 7 8 9 0111 21 31 41 51 61 7181 91 02 12 22 32 4252 62 72 82 92 03
���
S M T W T F S
12 3 4 5 6 7 89 01 11 21 31 41 5161 71 81 91 02 12 2232 42 52 62 72 82 9203 13
����
S M T W T F S
1 2 3 4 56 7 8 9 01 11 2131 41 51 61 71 81 9102 12 22 32 42 52 6272 82 92 03
� ��
S M T W T F S
1 2 34 5 6 7 8 9 0111 21 31 41 51 61 7181 91 02 12 22 32 4252 62 72 82 92 03 13
������
S M T W T F S
1 2 3 4 5 6 78 9 01 11 21 31 4151 61 71 81 91 02 1222 32 42 52 62 72 8292 03 13
���������
S M T W T F S
1 2 3 45 6 7 8 9 01 1121 31 41 51 61 71 8191 02 12 22 32 42 5262 72 82 92 03
�������
S M T W T F S
1 23 4 5 6 7 8 901 11 21 31 41 51 6171 81 91 02 12 22 3242 52 62 72 82 92 0313
��������
S M T W T F S
1 2 3 4 5 67 8 9 01 11 21 3141 51 61 71 81 91 0212 22 32 42 52 62 7282 92 03
��������
S M T W T F S
1 2 3 45 6 7 8 9 01 1121 31 41 51 61 71 8191 02 12 22 32 42 5262 72 82 92 03 13
11
12
EXHIBIT 14 PAGE 7 OF 8

STATISTICAL SAMPLING
January 2000
�������
S M T W T F S
1 23 4 5 6 7 8 901 11 21 31 41 51 6171 81 91 02 12 22 3242 52 62 72 82 92 0313
�������
S M T W T F S
1 2 3 4 5 67 8 9 01 11 21 3141 51 61 71 81 91 0212 22 32 42 52 62 7282 92
����
S M T W T F S
1 2 3 4 56 7 8 9 01 11 2131 41 51 61 71 81 9102 12 22 32 42 52 6272 82 92 03 13
����
S M T W T F S
1 23 4 5 6 7 8 901 11 21 31 41 51 6171 81 91 02 12 22 3242 52 62 72 82 92 03
���
S M T W T F S
1 2 3 4 5 6 78 9 01 11 21 31 4151 61 71 81 91 02 1222 32 42 52 62 72 8292 03 13
����
S M T W T F S
1 2 3 45 6 7 8 9 01 1121 31 41 51 61 71 8191 02 12 22 32 42 5262 72 82 92 03
� ��
S M T W T F S
1 23 4 5 6 7 8 901 11 21 31 41 51 6171 81 91 02 12 22 3242 52 62 72 82 92 0313
������
S M T W T F S
1 2 3 4 5 67 8 9 01 11 21 3141 51 61 71 81 91 0212 22 32 42 52 62 7282 92 03 13
���������
S M T W T F S
1 2 34 5 6 7 8 9 0111 21 31 41 51 61 7181 91 02 12 22 32 4252 62 72 82 92 03
�������
S M T W T F S
12 3 4 5 6 7 89 01 11 21 31 41 5161 71 81 91 02 12 2232 42 52 62 72 82 9203 13
��������
S M T W T F S
1 2 3 4 56 7 8 9 01 11 2131 41 51 61 71 81 9102 12 22 32 42 52 6272 82 92 03
��������
S M T W T F S
1 2 34 5 6 7 8 9 0111 21 31 41 51 61 7181 91 02 12 22 32 4252 62 72 82 92 03 13
13
�������
S M T W T F S
12 3 4 5 6 7 89 01 11 21 31 41 5161 71 81 91 02 12 2232 42 52 62 72 82 9203 13
�������
S M T W T F S
1 2 3 4 56 7 8 9 01 11 2131 41 51 61 71 81 9102 12 22 32 42 52 6272 82 92
����
S M T W T F S
1 2 3 45 6 7 8 9 01 1121 31 41 51 61 71 8191 02 12 22 32 42 5262 72 82 92 03 13
����
S M T W T F S
12 3 4 5 6 7 89 01 11 21 31 41 5161 71 81 91 02 12 2232 42 52 62 72 82 9203
���
S M T W T F S
1 2 3 4 5 67 8 9 01 11 21 3141 51 61 71 81 91 0212 22 32 42 52 62 7282 92 03 13
����
S M T W T F S
1 2 34 5 6 7 8 9 0111 21 31 41 51 61 7181 91 02 12 22 32 4252 62 72 82 92 03
� ��
S M T W T F S
12 3 4 5 6 7 89 01 11 21 31 41 5161 71 81 91 02 12 2232 42 52 62 72 82 9203 13
������
S M T W T F S
1 2 3 4 56 7 8 9 01 11 2131 41 51 61 71 81 9102 12 22 32 42 52 6272 82 92 03 13
���������
S M T W T F S
1 23 4 5 6 7 8 901 11 21 31 41 51 6171 81 91 02 12 22 3242 52 62 72 82 92 03
�������
S M T W T F S
1 2 3 4 5 6 78 9 01 11 21 31 4151 61 71 81 91 02 1222 32 42 52 62 72 8292 03 13
��������
S M T W T F S
1 2 3 45 6 7 8 9 01 1121 31 41 51 61 71 8191 02 12 22 32 42 5262 72 82 92 03
��������
S M T W T F S
1 23 4 5 6 7 8 901 11 21 31 41 51 6171 81 91 02 12 22 3242 52 62 72 82 92 0313
14
EXHIBIT 14 PAGE 8 OF 8

AUDIT MANUAL
January 2000
BIBLIOGRAPHY EXHIBIT 15
Following is a list of statistical sampling reference materials that were used in drafting language for this chapter of the Audit Manual:
• Board of Equalization’s Statistical Sampling Instructor’s Guide (revised April 1978, revised 1990, and in the process of being revised)
• Board of Equalization Study Notes for Sampling and Testing Techniques as Applied to the Sales Tax Audit (John Gee and Robert Gustafson, January 1964)
• Statistical Sampling for Audit and Control (T.W. McRae, 1974)
• Modern Elementary Statistics, Fourth Edition (John Freund, 1973)
• Application of Statistical Sampling to Auditing (Alvin Arens & James Loebbecke, 1981)
• Handbook of Sampling for Auditing and Accounting (Herbert Arkin, 1974)
• Sampling Manual for Auditors (Institute of Internal Auditors, 1967)
• Supplement to the Sampling Manual for Auditors (Institute of Internal Auditors, 1970)
• IRS Statistical Sampling Handbook (November 1988)
• Institute of Property Taxation - Advanced Sampling Issues in Sales and Use Tax Audits (Thomas Andrews and Dennis Fox, September 1996)
• The Ernst & Young Foundation Tax Research Grant Program - A Statistical Sampling Guide for Sales Tax Audits (William Yancey, Ph.D., CPA and Roger Pfaffenberger, Ph.D. - Texas Christian University, October 1996)
• COST State Tax Report - Use and Abuse of Sampling in Sales and Use Tax Audits (William Yancey, Ph.D., CPA and Roger Pfaffenberger, Ph.D. - Texas Christian University, November 1997)