Embed Size (px)
Citation preview
AUDIT COMMITTEE ACCOUNTING EXPERTISE AND CHANGES IN
FINANCIAL REPORTING QUALITY
by
KEVIN T. RICH
A DISSERTATION
Presented to the Department of Accountingand the Graduate School of the University of Oregon
in partial fulfillment of the requirementsfor the degree of
Doctor of Philosophy
June 2009
11
University of Oregon Graduate School
Confirmation of Approval and Acceptance of Dissertation prepared by:
Kevin Rich
Title:
"Audit Committee Accounting Expertise and Changes in Financial Reporting Quality"
This dissertation has been accepted and approved in partial fulfillment of the requirements forthe Doctor of Philosophy degree in the Department of Accounting by:
Steven Matsunaga, Chairperson, AccountingDavid Guenther, Member, AccountingXuesong Bu, Member, AccountingLarry Singell, Outside Member, Economics
and Richard Linton, Vice President for Research and Graduate Studies/Dean ofthe GraduateSchool for the University of Oregon.
June 13,2009
Original approval signatures are on file with the Graduate School and the University of OregonLibraries.
in the Department of Accounting
Kevin T. Rich
An Abstract of the Dissertation of
for the degree of
to be taken
III
Doctor of Philosophy
June 2009
Title: AUDIT COMMITTEE ACCOUNTING EXPERTISE AND CHANGES IN
FINANCIAL REPORTING QUALITY
Approved:Steve Matsunaga
In this dissertation. I examine whether financial reporting quality increases
following the appointment of an accounting expert to the audit committee. Prior
literature documents positive cross-sectional associations between maintaining an
accounting expert on the audit committee and financial reporting quality. Although this
suggests that accounting expertise enhances the quality of a firm's financial reports, it is
unclear whether financial reporting quality improves after appointing an accounting
expert. Additionally, I explore how the strength of alternative governance provisions and
the current expertise of the audit committee influence relations between appointing an
accounting expert and changes in financial repOliing qua.l ity.
I hypothesize that accounting experts possess the financial backgrounds needed to
detect accounting manipulations and the reputational capital to warrant actions that limit
exposure to financial reporting failures. Therefore, I predict that newly appointed
IV
accounting experts have the ability and incentive to strengthen financial reporting
systems and increase the quality of financial reports. Furthermore. I predict that
incremental improvements in reporting quality following the appointment of an
accounting expert are larger for strong governance firms because they possess the
infrastructure necessary to act on audit committee recommendations and for firms with
no prior accounting expertise because of opportunities for new accounting critiques by
financially minded individuals.
I test these predictions on a sample of 1,590 audit committee appointments between
2003 and 2005. Overall. I do not find empirical evidence of a change in financial
reporting quality following the appointment of an audit committee accounting expert.
However. I find that firms with strong governance that appoint an accounting expert
experience larger post-appointment improvements in reporting quality than do firms with
weak governance, as highlighted by more income-decreasing discretionary accruals,
larger increases in earnings response coefficients, and higher quality accruals.
Additionally, my evidence suggests that strong governance firms appointing their first
accounting expert increase their reporting quality following the appointment. Therefore,
my results imply that accounting expertise complements other governance mechanisms
involved in financial monitoring. Overall, I provide evidence regarding the audit
committee's inf1uence over financial reporting and the conditions associated with
effective use of accounting expertise.

CURRICULUM VITAE
NAME OF AUTHOR: Kevin 1. Rich
GRADUATE AND U1\JDERGRADUATE SCHOOLS ATTENDED:
University of Oregon, Lundquist College of BusinessUniversity of Notre Dame, Mendoza College of Business
DEGREES AWARDED:
Doctor of Philosophy in Accounting, 2009, University of OregonBachelor of Business Administration, 2000, University ofNotre Dame
AREAS OF SPECIAL INTEREST:
Corporate GovernanceFinancial Accounting
PROFESSIONAL EXPERIENCE:
Research Assistant and Instructor, Department of Accounting,University of Oregon, Eugene, Oregon, 2004-2009.
Senior Auditor, Business Risk Services, Ernst & Young LLP,Boston, Massachusetts, 2000-2004.
v
GRANTS, AWARDS AND HONORS:
Lundquist College of Business Roger and Robin Best Award for OutstandingTeaching by a Ph.D. Student, University of Oregon, 2006
Accounting Circle Doctoral Student Award, Lundquist College of Business,University of Oregon, 2005, 2006
VI
Vll
ACKNOWLEDGMENTS
I wish to express sincere appreciation to Professors Guenther, Hu, and Singell for
their assistance in the preparation of this manuscript. In addition, special thanks are due
to my committee chair, Professor Steve Matsunaga, whose guidance and suppOli were
instrumental throughout my doctoral studies. I also would like to thank workshop
participants at Loyola College in Maryland, Providence College, The University of
Massachusetts - Boston, and The University of Oregon for helpful comments and
suggestions.
Vlll
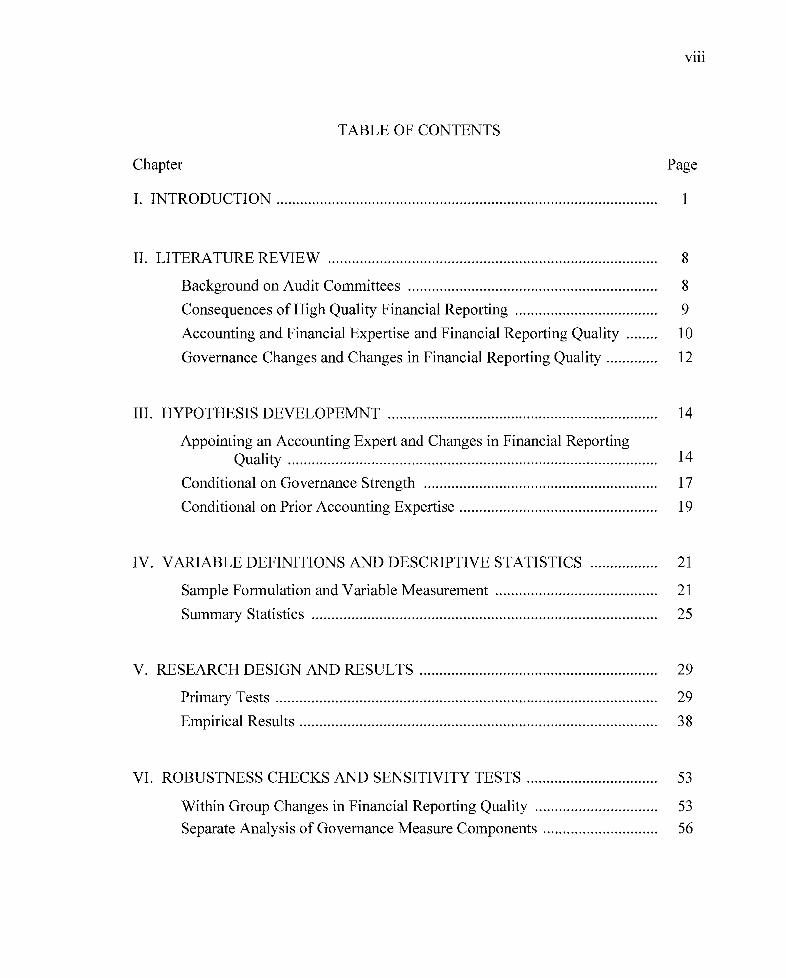
TABLE OF CONTENTS
Chapter
I. INTRODUCTION .
Page
II. LITERATURE REVIEW 8
Background on Audit Committees 8
Consequences of High Quality Financial Reporting 9
Accounting and Financial Expertise and Financial Reporting Quality........ 10
Governance Changes and Changes in Financial Reporting Quality............. 12
III. HYPOTHESIS DEVELOPEMNT 14
Appointing an Accounting Expert and Changes in Financial ReportingQuality 14
Conditional on Governance Strength 17
Conditional on Prior Accounting Expertise 19
IV. VARIABLE DEFINITIONS AND DESCRIPTIVE STATISTICS 21
Sample Formulation and Variable Measurement 21
Summary Statistics 25
V. RESEARCH DESIGN AND RESULTS 29
Primary Tests 29
Empirical Results 38
VI. ROBUSTNESS CHECKS AND SENSITIVITY TESTS 53
Within Group Changes in Financial Reporting Quality............................... 53
Separate Analysis of Governance Measure Components 56

IX
Chapter Page
Alternative Definitions of Accounting Expertise 63
Weighted Least Squares Approach 66
Disclosure of Audit Committee Appointments in a Press Release 67
Expanding the Size of the Audit Committee 70
VII. CONCLUSION 73
APPENDIX: CONTROLLING FOR SELF-SELECTION IN REGRESSIONSTESTING FOR WITHIN-GROUP VARIATION 75
BIBLIOGRAPHY 79

LIST OF TABLES
Table Page
1. Sample Selection 23
2. Variable Definitions 24
3. Summary Statistics........................................................................................ 26
4. Components of Composite Governance Measure 30
5. Changes in Financial Reporting Quality: Tests of Hypothesis 1 38
6. Changes in Financial Reporting Quality Conditional on GovernanceStrength: Tests of Hypothesis 2 42
7. Changes in Financial Reporting Quality Conditional on Prior AccountingExpertise: Tests of Hypothesis 3 45
8. Combined Effects of Governance Strength and Prior AccountingExpertise 48
9. Restricted Sample of Firms Appointing an Accounting Expert 54
10. Analysis of Individual Components of Governance Proxy.......................... 57
11. Comparison of Public Accounting to Corporate Financial Backgrounds 64
12. Weighted Least Squares Regressions 66
13. Analysis of Firms Disclosing Apointments in a Press Release 68
14. Analysis ofFirms Increasing the Size ofthe Audit Committee 71
15. Modeling the Decision to Appoint an Accounting Expert 78
x
CHAPTER I
INTRODUCTION
One of the primary functions of audit committees is to monitor the firm's financial
reporting system. Prior studies find evidence of a positive relation between accounting
expertise on the audit committee and the quality of the firm's financial reports,
suggesting that audit committee members with accounting backgrounds enhance financial
monitoring. I Furthermore, DeFond, Hann, and Hu (2005) document positive abnormal
returns for firms that appoint an accounting expert to their audit committee, consistent
with investors believing that adding accounting expertise enhances corporate governance
and increases shareholder value.2 Although these results imply that appointing an
accounting expert will improve financial oversight, there is currently little direct evidence
of increases in reporting quality when firms appoint an accounting expert to their audit
committee. In this dissertation, I examine whether the firm's financial reporting quality
improves following the appointment of an accounting expert, and whether the extent of
the improvement in financial reporting quality varies based on the strength of alternative
governance mechanisms, or the presence of an accounting expert on the audit committee.
Understanding how appointing an accounting expert relates to changes in the firm's
financial reporting quality is important for several reasons. First, although boards of
directors designate responsibility for overseeing a company's accounting and financial
1 See Carcello, Hollingsworth, Klein, and Neal (2008), Farber, Huang, and Mauldin (2008), Dhaliwal,Naiker, and Navissi (2006), and Bryan, Liu, and Tiras (2007), among others.
2 I refer to "audit committee accounting experts" as "accounting experts" for convenience going forward.

2
reporting processes to the audit committee (Bill 2006), it is not clear whether having an
accounting expert allows the firm to communicate financial information to market
participants in a way that enables more accurate assessments of firm value. Therefore,
my analysis provides important information to investors regarding the factors driving the
premium to accounting expertise (DeFond et al. 2005). Second, despite assertions within
regulatory initiatives such as Section 407 of the Sarbanes-Oxley Act of 2002 (SOX) that
having financially minded members enhances the ability of audit committees to oversee
the financial reporting process, there is a lack of evidence on whether adding accounting
expertise influences the financial reporting decisions made by managers. My study
enhances our understanding of whether increases in the number of accounting experts
serving on audit committees relates to higher quality financial reports. 3 Finally, existing
research does not provide a definitive answer to the question of when accounting
expertise is successful at fostering high quality financial repOliing. By relating changes
in financial reporting quality following the appointment of an accounting expert to the
strength of alternative governance provisions, and the current expertise of the audit
committee, I provide insight into the conditions necessary for accounting expertise to
have a significant impact on the firm's financial reporting system.
There are at least two factors that support the conclusion that appointing an
accounting expert leads to increases in financial reporting quality. The first is that
individuals with accounting backgrounds should be better able to discover accrual
3 A recent survey of 178 public companies from the Fortune 100 and NASDAQ 100 suggests the fractionof audit committee members who are accountants doubled from 5 percent in 2002 to 11 percent in 2005,and the number of audit committees with at least one accountant increased from 20 percent to 38 percentduring the same period (Huron Consulting Group 2006).

3
manipulations than non-accounting experts (Carcello et al. 2008). Second, accounting
experts are likely to bear a higher loss in reputation and human capital from serving on
the audit committee of a firm that discloses an accounting restatement (Srinivasan 2005)
or faces a class action lawsuit (Fich and Shivdasani 2006). This combination of ability
and incentive should prompt new accounting experts to take actions that strengthen the
overall repOliing system and improve financial monitoring in a way that results in higher
quality financial reporting.
However, it is not necessarily the case that appointing an accounting expert will result
in increases in the fim1's financial reporting quality. First, there is the possibility that
prospective audit committee members with a high degree of accounting expertise are
drawn to firms that already produce high quality financial reporting (Engel 2005).
Furthermore, newly appointed accounting experts may lack sufficient inf1uence to
materially impact managers' financial reporting decisions. Finally, the SOX requirement
that firms identify the financial expe11 on their audit committee possibly creates an
incentive for firms to appoint accounting experts exclusively for compliance purposes.
Thus, the presence of these competing possibilities renders the issue of whether
appointing an accounting expert relates to improvements in financial reporting quality an
empirical question.
The audit committee is only one body responsible for providing financial oversight,
and the literature provides mixed evidence regarding how accounting expertise works
with other aspects of a firm's governance structure. Strong corporate governance signals
a commitment to oversight, and implies that the firm possesses the infrastructure needed

4
to act on audit committee recommendations. Therefore, appointing an accounting expert
could only improve financial reporting quality when accompanied by complimentary
governance provisions (Blue Ribbon Committee 1999; DeFond et al. 2005; Dhaliwal et
al. 2006). Alternatively, firms with strong corporate governance may exeti stronger
control over the firm's financial rep0l1ing decisions, irrespective of the activities of the
audit committee, thereby reducing the impact of audit committee financial expertise on
the firm's reporting quality (Carcello et al. 2008; Bryan et al. 2007). Given these
alternatives, the question of whether associations between appointing an accounting
expert and changes in financial reporting quality will be positively or negatively
influenced by the strength of the finn's corporate governance structure remains
unresolved.
The incremental impact of appointing an accounting expert could also vary according
to the composition of the existing audit committee. When an audit committee does not
possess accounting expertise, appointing an accounting expert introduces a monitor that
is intimately familiar with the financial reporting process. If the lack of accounting
expertise results in inadequate financial monitoring, and the new accounting skills allow
the audit committee to more effectively monitor managers' reporting decisions, then
improvements in financial reporting quality could be largest for firms that appoint their
first accounting expert. However, appointing an accounting expert can add to the
influence of accounting experts on the audit committee and the board as a whole. If a
minimum number of accounting experts on the audit committee are necessary to pressure
managers into action, then improvements in reporting quality could be largest for firms
5
that appoint an accounting expert to an audit committee with prior accounting expertise.
As a result, I also examine whether associations between adding an accounting expert and
changes in financial repOliing quality relate to whether the firm maintained an accounting
expert on the audit committee in the year prior to appointment.
I use a sample of 1,590 firm-years with annual meeting dates between 2003 and 2005
where the firm appointed an outside board member and assigned them to the audit
committee in my analysis. Consistent with prior literature (DeFond et a!. 2005; Carcello
et a!. 2008), I use biographical information from proxy statements to designate audit
committee appointees as accounting experts if they are a certified public accountant, or
have either worked in public accounting, or for a public company as the chief financial
officer or controller. Next, I identify non-accounting financial experts as individuals with
investment banking experience, or who have supervised those responsible for preparing
financial statements, usually as the chief executive of a public firm. Finally, I define all
other audit committee appointees as non-experts.
I examine whether appointing an accounting expert relates to improved financial
repOliing quality by comparing reporting quality in the three years prior to appointment
with the three years following appointment, conditional on the appointee's accounting
background. I measure financial reporting quality using a variety of proxies from the
accounting literature including abnormal accruals from the modified Jones model
(Dechow et a!. 1995), the earnings response coefficient (Collins and Kothari 1989), and
accruals quality (Dechow and Dichev 2002). Furthermore, 1differentiate between firms
with strong and weak corporate governance structures using a composite governance

6
measure based on board and audit committee characteristics and the ratio of institutional
shareholdings (Carcello et al. 2008). Finally, I measure the extent of prior accounting
expertise by examining whether the firm maintained an accounting expert on the audit
committee in the year prior to each sample appointment.
My results suggest that financial reporting quality does not improve, on average,
following the appointment of an accounting expert to the audit committee. However, I
find evidence consistent with the assertion that firms with strong corporate governance
experience larger improvements in financial reporting quality following the appointment
of an accounting expert than firms with weak corporate governance. Specifically, my
results suggest that firms with strong corporate governance become more conservative
with accruals (i.e. use more income-decreasing accruals) following the appointment of an
accounting expert. Additionally, my evidence highlights that firms with strong
governance experience larger increases in earnings response coefficients and Dechow and
Dichev (2002) accruals quality following the appointment of accounting experts than
firms with weak governance. Finally, I find evidence that firms appointing their first
accounting expert shift to more income-decreasing accruals and have higher accruals
quality following the appointment, but only when there is a strong corporate governance
structure in place.
Overall, the results of this dissertation add to our understanding of how audit
committee composition influences financial reporting decisions. Prior studies (Dhaliwal
et al. 2006; Carcello et al. 2008) contend that having audit committee members with
accounting backgrounds relates to high quality financial reporting, and DeFond et al.
7
(2005) identify a premium for firms that appoint an accounting expert. Furthermore, the
literature provides mixed evidence regarding whether accounting expertise and other
governance provisions are complements (DeFond et al. 2005; Dhaliwal et al. 2006) or
substitutes (Carcello et al. 2008; Bryan et al. 2007). I add to these studies by providing
evidence regarding the conditions under which the appointment of an accounting expert
is associated with increases in financial reporting quality. My results indicate that
reporting quality improves following the appointment of an accounting expert, but only
when the firm maintains a strong corporate governance structure. Thus, appointing an
accounting expert to the audit committee is only likely to lead to improve~ents in
financial reporting quality if the firm is equipped to utilize the expertise (DeFond et al.
2005). Additionally, my evidence is also relevant to regulators looking to assess whether
regulatory changes (SOX, NYSE, Nasdaq) designed to increase the amount of financial
expertise on audit committees resulted in higher quality financial information being
communicated to market participants.
The remainder of this dissertation proceeds as follows: In Chapter II, I review the
related literature. Chapter III presents my hypotheses, while Chapter IV describes my
sample selection and research design. In Chapter V, I provide the detail of my primary
empirical results, and present the results of robustness checks and sensitivity analyses in
Chapter VI. Finally, I provide concluding remarks in Chapter VII.
8
CHAPTER II
LITERATURE REVIEW
Background on Audit Committees
The audit committee plays a central role in the financial monitoring of a firm. First,
audit committee members maintain responsibility for oversight over accounting policies
and judgments, as well as the quality ofthe overall financial statements (Blue Ribbon
Committee 1999; Bill 2006). Furthermore, the audit committee is typically responsible
for selecting outside auditors, and meeting with financial managers to gauge whether they
are acting in the firm's best interest (Klein 2002b). DeFond et al. (2005) suggest that
these responsibilities often require significant accounting sophistication in that they
involve assessing the reasonableness of complex financial matters such as the company's
accounting reserves, and management's handling of proposed audit adjustments
suggested by the external auditors.
Each of the major stock exchanges (i.e. NYSE, NASDAQ, AMEX) requires that all
audit committee members be able to read and understand financial statements (Bill 2006).
Furthermore, Section 407 of SOX requires firn1s to designate an audit committee member
as a "financial expert" in their proxy statement, or explain why it is cost prohibitive to
maintain one if there is no financial expert (Engel 2005).4 These provisions suggest that
4 The final version of SOX Section 407 defines a financial expert as someone with experience preparing orreviewing financial statements, or supervising individuals engaged in such activities (Bill 2006). [refer tothese individuals as "general" financial experts for the remainder of this dissertation. It should be notedthat the final SOX definition of a financial expert contrasts with the definition in draft versions of Section407 that focused on experience specifically in finance and accounting (DeFond et al. 2005).
9
regulators consider an individual's financial background to be an important characteristic
of the audit committee member's ability to successfully monitor the financial reporting
process.
Prior literature suggests that investors assign a market premium to firms that appoint
individuals thought to be more effective monitors to their boards of directors. For
example, Rosenstein and Wyatt (1990) identify positive short-window abnormal returns
surrounding the appointment of independent outside directors, while Fich (2005) finds
evidence of a market premium for firms that appoint the chief executive of another firm
to their board. One interpretation of these results is that investors perceive outsiders to be
less susceptible to excessive influence from top management. Furthermore, the results
from Fich (2005) suggest the outside director premium varies directly with the operating
performance of the appointee's home firm, consistent with rewards for firms that appoint
outsiders possessing a track record of successful oversight. DeFond et al. (2005) also
provide evidence of a positive stock market reaction for firms that appoint an accounting
expert to their audit committee, with one interpretation being that accounting skills
enhance the ability of the audit committee to oversee high-quality financial reporting. In
addition, DeFond et al. (2005) find that firms that appoint a non-accounting financial
expert do not experience abnormal returns sunounding appointment, which implies the
premium to financial expertise is limited to individuals with accounting backgrounds.
Consequences of High Quality Financial Reporting
Existing research suggests that there are economic benefits to high quality financial
reporting. For example, Xie (2001) finds that firms with low levels of discretionary
10
accruals experience higher risk-adjusted returns than firms with high discretionary
accruals. Furthermore, Francis et a1. (2005) provides evidence that firms with low
Dechow and Dichev (2002) accruals quality face higher costs of debt and equity capital
than firms with high quality accruals. Finally, results from Palmrose et a1. (2004)
highlight a market penalty of approximately 9% (based on short-window abnormal
returns) for firms disclosing an accounting restatement, and larger penalties for firms that
fail to quantify the misstatement. One possible explanation for these results is that
investors perceive low quality financial repOliing to indicate the presence of high agency
costs. Evidence supporting this idea comes from studies highlighting opportunistic use of
financial repOliing by managers before equity offerings (Teoh et a1. 1998), and stock
option exercises (Bartov and Mohanram 2004).
Accounting and Financial Expertise and Financial Reporting Quality
The accounting literature provides support for cross-sectional associations between
accounting expertise and high quality financial reporting. For example, prior studies
document reduced usage of discretionary accruals (Carcello et a1. 2008) and abnormal
income-increasing accruals (Bedard et a1. 2004) when firms have at least one general
financial expert on their audit committee. Additionally, Xie et a1. (2003) document that
the percentage of investment bankers on the audit committee is associated with lower
current discretionary accruals. Taken together, these results suggest possessing at least
one individual with experience from the financial sector is associated with high quality
financial repOliing. In addition, firms with at least one accounting expert on their audit
committee have been shown to have lower levels of performance adjusted discretionary

11
accruals (Carcello et al. 2008) and higher accruals quality (Dhaliwal et al. 2006). Finally,
Krishnan and Visvanathan (2008) identify a positive association between the proportion
of audit committee members with accounting expertise and measures of accounting
conservatism, suggesting that financial experts constrain overpayments to managers and
other parties (Watts 2003a, 2003b).
There are also documented associations between financial/accounting expertise and
the incidence of accounting irregularities. Prior studies suggest that firms with at least
one general financial expert disclose fewer accounting restatements (Agrawal and
Chadha 2005; Abbott et al. 2004), and are less likely to face enforcement action by the
SEC (Abbott et al. 2004). In addition, Zhang et al. (2007) and Bedard et al. (2007) find
that firms with a larger percentage of financial experts (both accounting and non
accounting) are less likely to report an internal control weakness over financial reporting,
while Krishnan (2005) documents an inverse association between the number of general
audit committee financial experts and the likelihood that predecessor auditors identify an
internal control weakness in the 8-K accompanying an auditor change. These results
support the idea that financial experts are associated with stronger internal control
systems over financial reporting, which should relate to the quality of published financial
reports.
Audit committee accounting expertise has also been linked to more informative
earnings. More specifically, prior studies provide evidence of higher earnings response
coefficients for firms having at least one accounting expert on their audit committee
(Bryan et al. 2007; Qin 2007) than firms without an accounting expert. These results
12
suggest that accounting expertise is associated with investor perceptions that earnings are
persistent (Collins and Kothari 1989), and therefore of high quality.
Governance Changes and Changes in Financial Reporting Qualitv
Existing research also links changes in board and committee composition to changes
in financial reporting quality. For example, Klein (2002a) documents that firms
transitioning from an independent board/audit committee to a non-independent
board/audit committee have significantly higher levels of abnormal accruals following
the switch than a control sample of firms. FUlihermore, FeIo et al. (2003) provide
evidence that an increase in the fraction of audit committee members with general
financial expertise is associated with improvements in analyst perceptions of disclosure
quality, while Carcello et al. (2008) finds evidence of a decline in abnormal accruals in
the year after an accounting expert joins the audit committee. Alternatively, Menon and
Williams (2004) find some evidence that discretionary accruals are larger following the
appointment of an audit committee member that was formerly employed by the firm's
external auditor, implying that employing an accounting expert that is a former audit
partner impairs the audit function's independence.
Governance changes unrelated to the audit committee have also been show to relate
to changes in financial reporting quality. For example, Geiger and North (2006) suggest
that hiring a new chief financial officer is associated with a decrease in discretionary
accruals. One interpretation of this result is that new CFOs possess sufficient influence
and expertise to bring best practices that impact the reported financial statements of their
13
finn. 5 Furthermore, Matsunaga and Yeung (2008) find that hiring a chief executive with
a background as a chief financial officer is associated with higher quality voluntary
disclosures, suggesting that financially minded CEOs recognize the importance of high
quality financial disclosures.
'An alternative explanation include outgoing eFOs using accruals to increase income prior to theirdeparture, and new eFOs using a "big-bath" strategy upon arrival to general higher future income.
14
CHAPTER III
HYPOTHESIS DEVELOPMENT
A!2I2-ointing an Accounting Expert and Changes in Financial Reporting Quality
Audit committee changes occur for a variety of reasons. Open audit committee
positions arise when current members leave through voluntary resignation, retirement,
dismissal, and term expiration, or when the board decides to increase the size of the audit
committee. Appointments to and dismissals from the audit committee can also result
when members rotate committee responsibilities. While the evidence from prior
literature suggests that having an accounting expert on the audit committee is associated
with strong current financial reporting practices, it is not clear whether appointing an
accounting expeli relates to improvements in financial reporting quality. More
specifically, although the existing evidence is consistent with accounting experts using
their financial training to enhance monitoring over financial reporting, it is also consistent
with alternative explanations such as a matching process between firms with strong
fll1ancial reporting systems and audit committee members with extensive accounting
backgrounds. Thus, the question of whether adding an accounting expert to the audit
committee is associated with improvements in financial reporting quality remains
unresolved.
Accounting expertise should relate to a new audit committee member's ability to
oversee the financial reporting process for several reasons. First, given the increasingly
complex nature of accounting transactions (Cox 2005; Herz 2005), experience preparing

15
and reviewing financial statements increases the ability of audit committee members to
ask management probing questions and effectively evaluate the responses (KPMG
2006).6 Second, accounting experts should be more familiar with the nature of internal
and external audit procedures, and therefore more apt to use auditor recommendations as
a catalyst to improve the reporting system (Abbott et al. 2004; DeZoort and Salterio
200 I). Finally, accounting experts often have experience designing and implementing
financial reporting systems, which should allow them to both understand the financial
issues facing management and advise them on best financial reporting practices.
Prior literature also suggests that litigation and human capital concerns provide
accounting experts with incentives to enforce high quality financial reporting during their
tenure on the audit committee. First, accounting experts may be more susceptible to
litigation arising from accounting failures relative to other audit committee members and
directors because of state court decisions holding experts to a higher standard (Cost and
Miller 2005; Cunningham 2007).7 These concerns are reflected in a recent survey
highlighting that many audit committee members feel they have inadequate directors and
officers (D&O) insurance coverage, despite safe harbor provisions contained in SOX
designed to protect directors from liability under federal securities law (KPMG 2006).
Audit committee members have also been shown to suffer declines in their labor
market value from being associated with poor financial reporting quality. For example,
(, Admittedly, the Blue Ribbon Committee (J 999) highlights that an audit committee member's ability toquestion managers' reporting decisions may not require financial expertise.
7 Linck et al. (2008), suggest that increases in the Iitigation risk and time comm itments of aud it committeeservice prompted a decrease in the proportion of active executives serving as aud it comm ittee membersfrom 54.8% in 1998 to 41.6% in 2004.
16
Srinivasan (2005) finds that the audit committee members of firms disclosing an
accounting restatement are more likely to lose their board positions at the restating firm
and at other firms where they hold directorships, while Fich and Shivdasani (2006)
highlight that the outside directors of firms facing class action lawsuits alleging financial
misrepresentation experience a decline in other outside directorships following the suit. 8
Given that accounting experts are unlikely to be able to credibly plead ignorance with
regard to suspect accounting, there is the possibility that this translates into greater
reputational penalties from misreported financial statements with respect to the other
individuals on an audit committee.
Alternatively, there are at least three reasons for why appointing an accounting expert
would not elicit a measurable improvement in the quality of the firm's financial reports.
First, economic theory suggests that individuals will only accept audit committee
invitations when the marginal personal benefit exceeds the marginal personal cost (Perry
and Peyer 2005). Based on the potential for reputational hann from serving on the audit
committee of a firm that reports an accounting failure (Srinivasan 2005; Fich and
Shivdasani 2006), prospective members will likely perform due diligence procedures to
assess the integrity of the inviting firm's financial reporting system prior to acceptance
(Engel 2005). One implication of this process is that accounting experts should be drawn
to the audit committees of firms that already produce high quality financial rep0l1ing.
Second, a newly appointed accounting expert is only one member of the audit committee,
8 It should be noted that Srinivasan (2005) documents that only 4% of the directors from firms disclosingan accounting restatement are specifically named in class action lawsuits, and that audit committeemembers are no more likely to t~1ce litigation than other directors.
17
and they may lack the influence needed to materially alter the financial reporting
decisions made by managers. Finally, Section 407 of SOX requires that firms disclose in
their proxy statement whether their audit committee has a financial expert, which creates
the prospect that firms appoint accounting experts for compliance purposes rather than to
improve the quality of financial reporting. To test between these alternative explanations,
I propose the following Hypothesis (stated in the null):
HIFirms that appoint an accounting expert to their audit committee experience noimprovement in financial reporting qualityfollowing the appointment.
Conditional on Governance Strength
A related question involves whether associations between appointing an accounting
expert and changes in financial reporting quality vary according to the strength of
alternative governance provisions already in place. Prior literature documents that strong
corporate governance is associated with lower levels of earnings management, suggesting
that governance provisions limit managers' ability to use financial reporting
opportunistically. For example, evidence from Dechow et al. (1996) is consistent with a
positive association between the fraction of board seats held by insiders and the
likelihood of enforcement action by the SEC, while evidence from Klein (2002a)
suggests that firms with more independent boards have lower levels of abnormal
accruals. These results imply that boards governed by outsiders serve as effective
monitors over the financial reporting process: More generally, Garcia Lara et al. (2008)
highlight that financial reporting is more conservative when there is a strong corporate

18
governance structure in place, and that the direction of causality moves from governance
strength to conservative financial reporting.
Some existing evidence suggests that having an accounting expert complements the
other components of a firm's corporate governance structure. DeFond et al. (2005) find
that abnormal returns surrounding the appointment of accounting experts are
concentrated in firms with strong corporate governance, suggesting that investors
consider accounting expertise to increase firm value when firms have the infrastructure
necessary to effectively use the expertise (Blue Ribbon Committee 1999). Additionally,
Dhaliwal et al. (2006) find that accounting expertise relates to high quality accruals when
there is a strong audit committee, while Krishnan and Visvanathan (2008) find that
associations between accounting expertise and conservatism are conditional on having a
board with overall strong governance. This suggests improvements in financial reporting
quality following the appointment of an accounting expert should be larger for firms with
strong versus weak corporate governance structures.
Alternatively, if firms with strong corporate governance structures already possess the
tools necessary to produce high quality financial reports, there could be less room for
improvement following the appointment of an accounting expert. Consistent with this
idea, Bryan et al. (2007) find that positive associations between accounting expertise and
earnings response coefficients are smaller for firms with strong governance.
Furthermore, results from Carcello et al. (2008) suggest that other corporate governance
mechanisms substitute for accounting expertise in limiting earnings management through
discretionary accruals. As a result, an alternative possibility is that improvements in
19
reporting quality following the appointment of an accounting expert will be larger for
firms that lack compensating governance provisions, suggesting that accounting expertise
and other governance provisions are substitutes. To test between these alternatives, I
present Hypothesis 2 (stated in the null):
H2
Firms with strong corporate governance structures will experience the samechange in financial reporting qualityfollowing the appointment ofanaccounting expert to the audit committee asfirms with weak corporategovernance structures.
Conditional on Prior Accounting Expertise
The incremental effect of appointing an accounting expert to the audit committee is
also likely to be dependent on whether an accounting expert is already present. If the
firm does not maintain accounting expertise on their audit committee, then appointing an
accounting expert introduces an external monitor with the experience necessary to ask
probing questions of management regarding financial reporting decisions (KPMG 2006).
Furthermore, given that accounting experts are also likely to be familiar with the audit
process, appointing an audit committee's first accounting expert increases the chance the
firm acts on suggestions raised during external and internal audit procedures (Abbott et
al. 2004). As a result, one possibility is that firms appointing their first accounting expert
will experience the largest improvements in financial reporting quality following the
appointment.
However, an alternative is that the critical mass necessary for accounting expertise to
influence accounting policy is greater than one. In other words, having several
accounting experts on the audit committee could increase the influence of the audit
20
committee over managers' financial reporting decisions. Furthermore, having multiple
accounting experts on the committee could allow accounting experts to better determine
the proper accounting for technically complex issues, i.e., the technical knowledge of
different accounting experts could complement each other. In either case, there will be
increasing returns to scale from the financial monitoring provided by accounting experts,
and improvements in financial reporting quality following the appointment of an
accounting expert would be largest for firms with prior accounting expertise. To test
between these alternatives, I present Hypothesis 3 (stated in the null):
H3
Firms with no prior accounting expertise on the audit committee willexperience the same change infinancial reporting quality following theappointment ofan accounting expert asfirms with an accounting expert alreadyon the audit committee.

21
CHAPTER IV
VARIABLE DEFINITIONS AND DESCRIPTIVE STATISTICS
Sample Formation and Variable Measurement
To form my sample, I start with the S&P 1,500 firms listed in the RiskMetrics
database (formerly the Investor Responsibility Research Center). Based on these firms, I
identify all outside board appointments where the appointee was assigned to the audit
committee, and participated in their first annual shareholders meeting between 2003 and
2005 to focus on the post-SOX environment. I use outside director appointments because
they are more likely to lead to changes in financial reporting practices than reassigning
audit committee responsibilities among active directors. Of the 6,042 board
appointments during the sample period, 2,389 individuals were also placed on the audit
committee. Next, I group appointments made in the same year together to focus on firm-
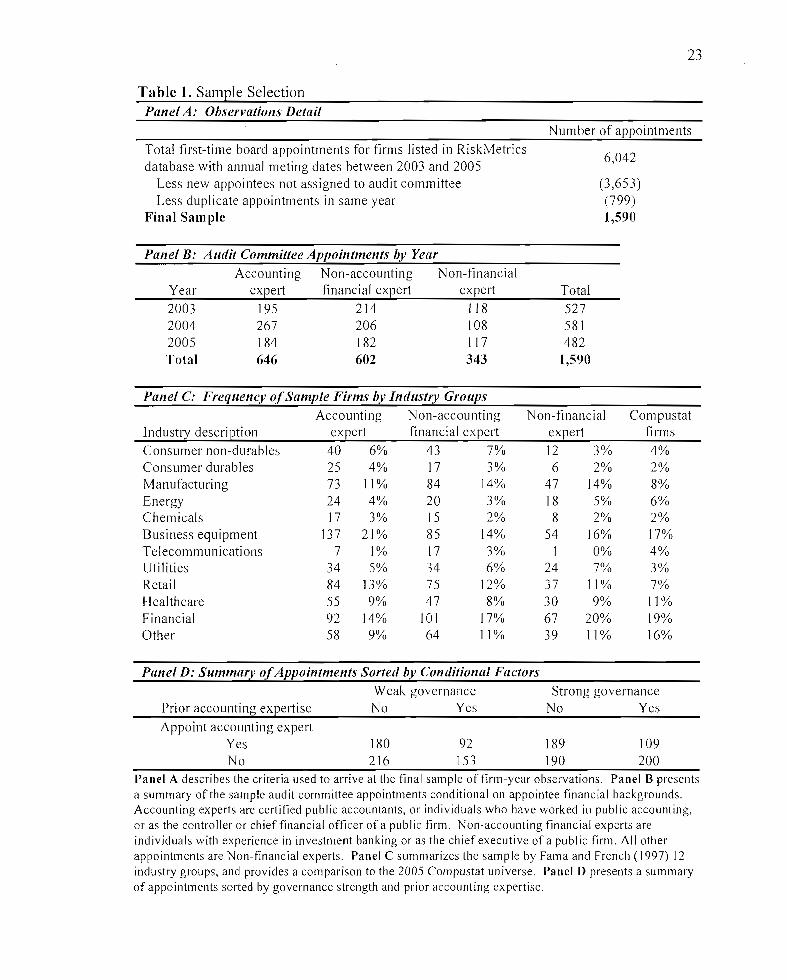
year observations, which reduces the sample by 799 observations.9 Panel A of Table I
provides the details of my sample selection procedures, which results in a final sample of
1,590 firm-years in which the firm appointed an individual to the audit committee.
I classifY each appointee into one of three categories according to their financial
backgrounds using biographical information from proxy statements, in line with prior
literature (DeFond et al. 2005; Carcello et al. 2008). I define appointees as accounting
9 Note that approximately 13% offirms appointed more than one individual to the audit comm ittee in agiven year. Given that I am primarily interested in identifying firms that appoint an accounting expert totheir audit committee, I do not differentiate between firms that appoint only an accounting expert, fromfirms that appoint any combination of accounting experts and non-accounting experts.

22
experts if they are a certified public accountant, or have worked either in public
accounting, or for a publicly traded firm as the chief financial officer or controller. 10
Additionally, I define non-accounting financial experts as individuals with experience in
investment banking, or as the supervisor of those responsible for preparing financial
statements, usually as the chief executive officer of a public firm. I define all other audit
committee appointees as non-financial experts.
Panel B of Table I presents a summary by year of my sample appointments according
to these three groupings of financial expertise. The results highlight that significantly
more accounting experts were appointed to audit committees during my sample period
(41 %) than in the pre-SOX period used by DeFond et a1. (2005) (17%). Panel C presents
a frequency distribution of sample appointments by Fama and French (1997) 12 industry,
and provides a comparison to Compustat firms in fiscal year 2005. The sample
breakdown is generally consistent with the Compustat population, except for more
appointments of accounting experts by retail and business equipment firms, and fewer
appointments of accounting experts by financial firms. Panel D presents a summary of
appointments grouped by governance strength and prior accounting expertise, and
highlights that no single pairing of my conditional factors dominates the sample. Table 2
lists the variables used in my tests.
10 It should be noted that firms are only required to provide the work experience of board members duringthe most recent five years in the proxy statement. The extent to which individuals with accountingexpertise early in their career are classified as non-experts will add noise to my measure of accountingexpertise.
23
Table 1. Sample SelectionPanel A: Observations Detail
Number of appointments
Total first-time board appointments for firms listed in RiskMetricsdatabase with annual meting dates between 2003 and 2005
Less new appointees not assigned to audit committeeLess duplicate appointments in same year
Final Sample
6,042
(3,653)(799)1,590
Panel B: Audit Committee Appointments by YearAccounting Non-accounting Non-financial
Year expert financial expert expert Total
2003 195 214 lIS 5272004 267 206 108 5812005 184 182 I 17 482Total 646 602 343 1,590
Panel C: Frequency ofSample Firms by Industry GroupsAccounting Non-accounting Non-financial Compustat
Industry description expert financial expert expert firms
Consumer non-durables 40 6% 43 7% 12 3% 4%Consumer durables 25 4% 17 3% 6 2% 2%Manufacturing 73 11% 84 14% 47 14% 8%Energy 24 4% 20 3% 18 5% 6%Chemicals 17 3% 15 2% 8 2% 2%Business equipment 137 21% 85 14% 54 16% 17%Tel ecommunicati ons 7 1% 17 3% 1 0% 4%Utilities 34 5% 34 6% 24 7% 3%Retail 84 13% 75 12% 37 11% 7%Healthcare 55 9% 47 8% 30 9% 11%Financial 92 14% 101 17% 67 20% 19%Other 58 9% 64 11% 39 11% 16%
Panel D: Summary ofAppointments Sorted by Conditional Factors
Prior accounting expertiseWeak governanceNo Yes
Strong governanceNo Yes
Appoint accounting expertYes 180 92 189 109No 216 153 190 200
Panel A describes the criteria used to arrive at the final samp Ie of firm-year observations. Panel B presentsa summary of the sample audit committee appointments conditional on appointee financial backgrounds.Accounting experts are certified public accountants, or individuals who have worked in public accounting,or as the controller or chief financial officer ofa public firm. Non-accounting financial experts areindividuals with experience in investment banking or as the ch ief executive of a public j~rm. All otherappointments are Non-financial experts. Panel C summarizes the sample by Fama and French (1997) 12industry groups, and provides a comparison to the 2005 Compustat universe. Panel D presents a summaryof appointments sorted by governance strength and prior accounting expertise.
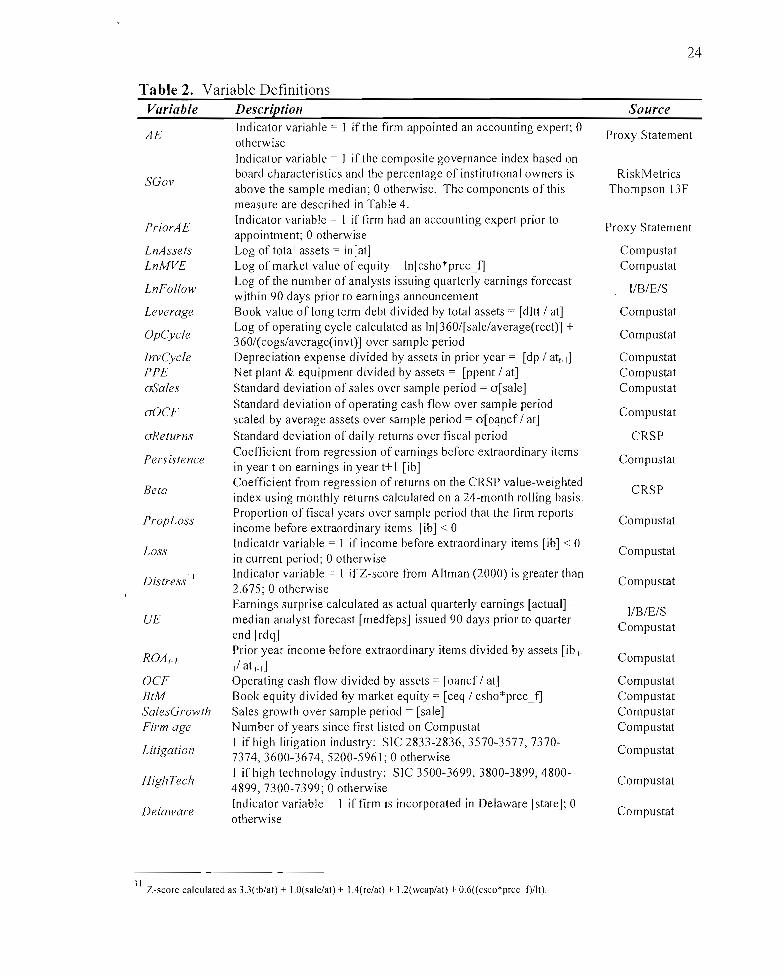
Table 2. Variable DefinitionsVariable Description
24
Source
AE
SGov
PriorAE
LnAssetsLnMVE
LnFollmv
Leverage
OpCycle
InvCyc/ePPEaSales
aOCF
aReturns
Persistence
Beta
PropLoss
Loss
Distress II
UE
ROA'_J
OCFBtMSalesGrmvthFirm age
Litigation
High Tech
Delaware
Indicator variable = I ifthe firm appointed an accounting expert; 0otherwiseIndicator variable = I if the composite governance index based onboard characteristics and the percentage of institutional owners isabove the sample median; 0 otherwise. The components of thismeasure are described in Table 4.Indicator variable = I if firm had an accounting expert prior toappointment; 0 otherwiseLog of total assets = In [at]Log of market value of equity = In[csho*prcc_fJLog of the number of analysts issuing quarterly earnings forecastwithin 90 days prior to earnings announcementBook value of long term debt divided by total assets = [dltt / at]Log of operating cycle calculated as In[360/[sale/average(rect)] +360/(cogs/average(invt)] over sample periodDepreciation expense divided by assets in prior year = [dp / att-dNet plant & equipment divided by assets = [ppent / at]Standard deviation of sales over sample period = o[sale]Standard deviation of operating cash flow over sample periodscaled by average assets over sample period = o[oancf / at]Standard deviation of dai Iy returns over fiscal periodCoefficient from regression of earnings before extraordinary itemsin year t on earnings in year t+ I [ib]Coefficient from regression of returns on the CRSP value-weightedindex using monthly returns calculated on a 24-month rolling basis.Proportion of fiscal years over sample period that the firm reportsincome before extraordinary items [ib] < 0Indicatdr variable = 1 if income before extraordinary items lib] < 0in current period; 0 otherwiseIndicator variable = I if Z-score from Altman (2000) is greater than2.675; 0 otherwiseEarnings surprise calculated as actual quarterly earnings [actual] median analyst forecast [medfeps] issued 90 days prior to quarterend [rdq]Prior year income before extraordinary items divided by assets lib t
/ at t_l ]
Operating cash flow divided by assets = [oancf / at]Book equity divided by market equity = [ceq / csho*prcc_fJSales growth over sample period = [sale]Number of years since first listed on CompustatI ifhigh litigation industry: SIC 2833-2836, 3570-3577, 73707374,3600-3674, 5200-5961; 0 otherwiseI if high technology industry: SIC 3500-3699, 3800-3899, 48004899, 7300-7399; 0 otherwiseIndicator variable = I iffirm is incorporated in Delaware [state]; 0otherwise
Proxy Statement
RiskMetricsThompson 13 F
Proxy Statement
CompustatCompustat
I1B/E/S
Compustat
Compustat
Compusta:tCompustatCompustat
Compustat
CRSP
Compustat
CRSP
Compustat
Compustat
Compustat
I/B/E/SCompustat
Compustat
CompustatCompustatCompustatCompustat
Compustat
Compustat
Compustat
II .Z-score calculated as 3J(tb/at) + I.O(sale/al) + 1.4(re/at) + 1.2(wcap/at) + 06«csco*prcc_f)/II).
25
Table 2. (continued).Variable Description Source
Top5Own
Big 4
Tenure
CEOTenure
Lambda
Accruals
Percentage of shares held by top five executives = [shrown_excl_opts/ csho]Indicator variable = I if the firm employs a Big 4 auditor [au < 8]; 0otherwise
Number of years following audit committee appointment
Number of years as CEOEqual to the inverse Mills ratio based on selection model described inAppendix A.Residual from estimating cross-sectional regressions by 2-digit SICindustry using the Modified Jones model (Dechow et al. 1995) usingthe following equation:
Execucomp
Compustat
ProxyStatement
Execucomp
Various
Compustat
= [-I * AAccounts receivable + Alnventory - AAccountspayable - ATaxes payable + LiOther assets]
= [(-1 *recch + invch + apalch + txach + aoloch)/at]= [oancf! at]= [sale / at]= [ppent / at]= [rect / at]
CFO!JSales
PPEARec
TCA j,1 = bo + b j ( t'1.Sales j.1 - Mec).,) + b2 PPE ;.1 + E /.1
where:TCA
CAR
3-day cumulative abnormal return surrounding Compustat quarterlyearnings announcement date calculated as raw return less the CRSPvalue-weighted index adjusted for dividends.
CRSPCompustat
AQ
Dechow and Dichev (2002) modified by McNichols (2002) andFrancis et al. (2005) accruals quality measure calculated as thestandard deviation of residuals from yearly cross-sectional regressionsby Fama-French 48 industry of changes in working capital accrualson lagged, current, and future cash flows from operations, change insales, and property, plant & equipment (all scaled by average totalassets) over a four-year rolling basis.
Compustat
TCA j.l = bo+bIOCFj •I _ 1 + b20CF;.1 +b3OCF). I +1 + b4 ASa/es;f +
bsPPE;.1 +E j .1
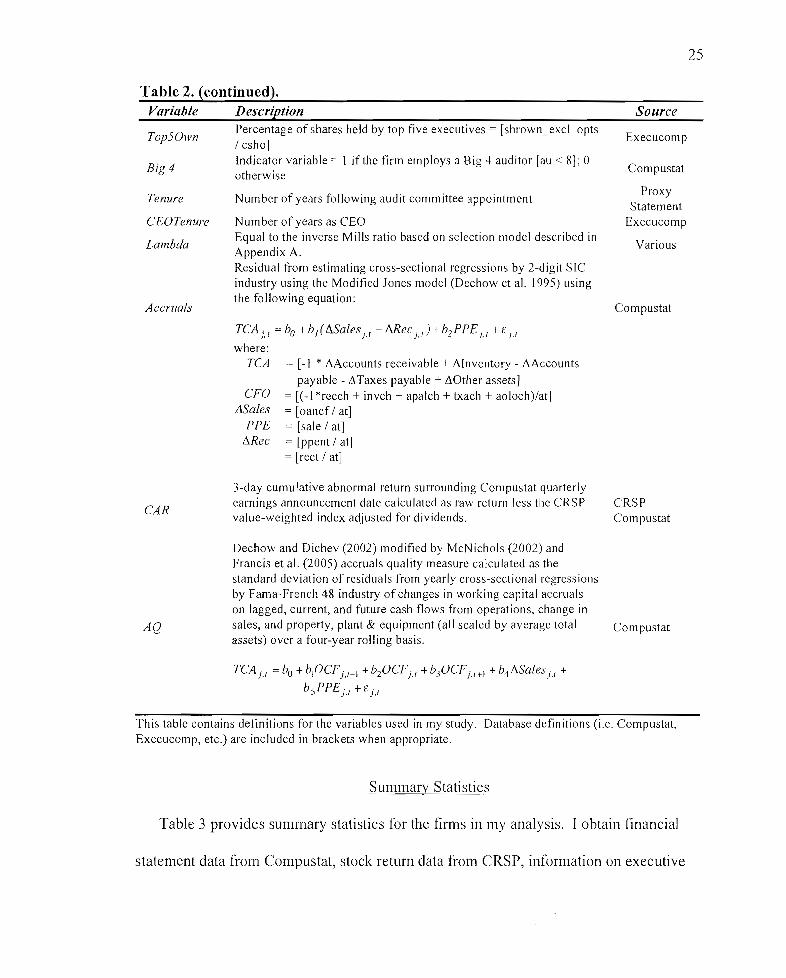
This table contains definitions for the variables used in my study. Database definitions (i.e. Compustat,Execucomp, etc.) are included in brackets when appropriate.
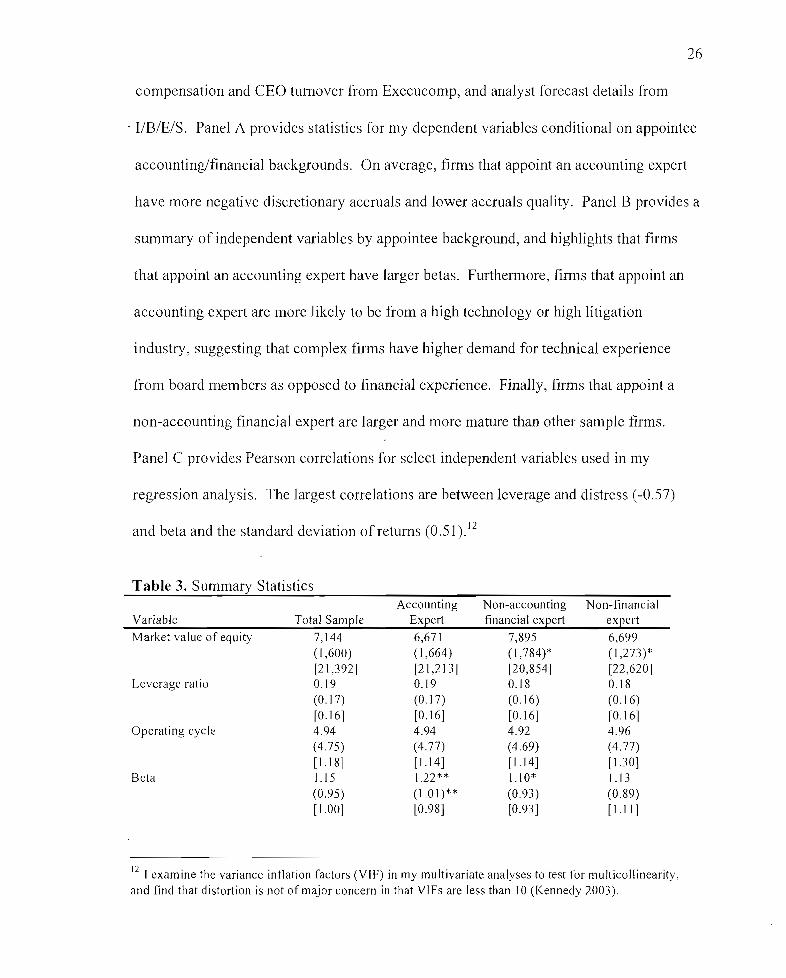
Summary Statistics
Table 3 provides summary statistics for the firms in my analysis. I obtain financial
statement data from Campustat, stock return data from CRSP, information on executive
26
compensation and CEO turnover from Execucomp, and analyst forecast details from
- I/B/E/S. Panel A provides statistics for my dependent variables conditional on appointee
accounting/financial backgrounds. On average, finns that appoint an accounting expert
have more negative discretionary accruals and lower accruals quality. Panel B provides a
summary of independent variables by appointee background, and highlights that firms
that appoint an accounting expert have larger betas. Furthennore, finns that appoint an
accounting expert are more likely to be from a high technology or high litigation
industry, suggesting that complex finns have higher demand for technical experience
from board members as opposed to financial experience. Finally, firms that appoint a
non-accounting financial expert are larger and more mature than other sample finns.
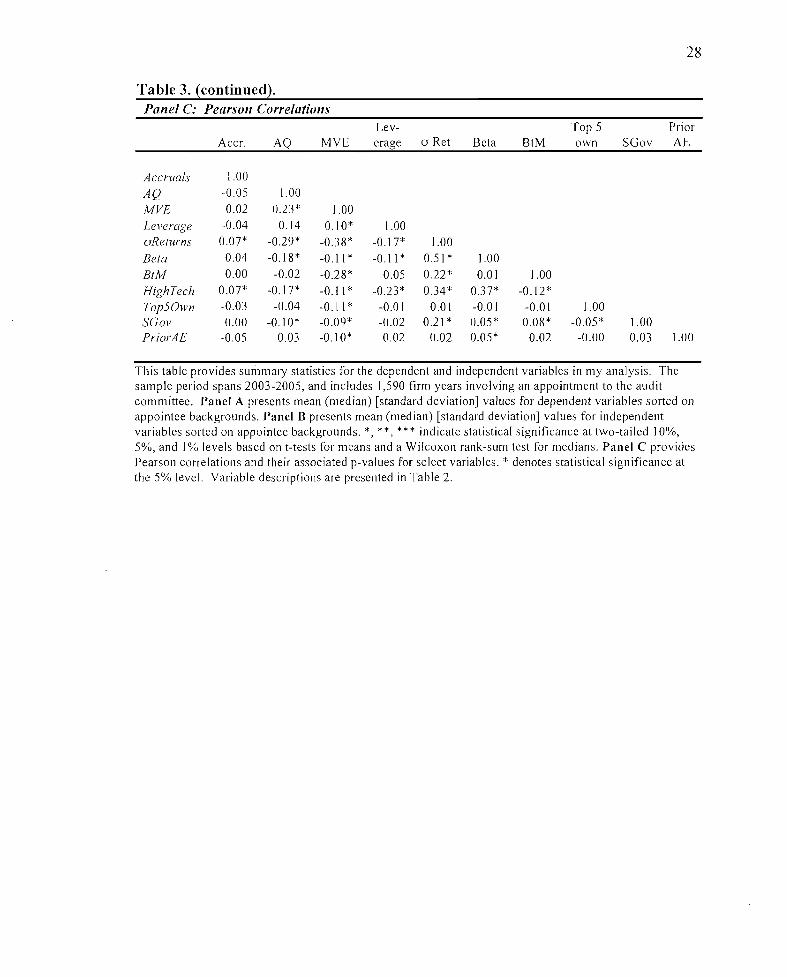
Panel C provides Pearson correlations for select independent variables used in my
regression analysis. The largest conelations are between leverage and distress (-0.57)
and beta and the standard deviation of returns (0.51).12
Table 3. Summary StatisticsAccounting Non-accounting Non-financial
Variable Total Sample Expert financial expert expert
Market value of equity 7,144 6,671 7,895 6,699(1,600) (1,664) (1,784)* (1,273 )*[21,392] [21,213] [20,854] [22,620]
Leverage ratio 0.19 0.19 0.18 0.18(0.17) (0.17) (0.16) (0.16)[0.16] [0.16] [0.16] [0.16]
Operating cycle 4.94 4.94 4.92 4.96(4.75) (4.77) (4.69) (4.77)[1.18] [1.14] [1.14] [ 1.30]
Beta 1.15 1.22 ** 1.10* 1.13(0.95) (1.01)** (0.93 ) (0.89)[ 1.00] [0.98] [0.93] [1.11]
12 I examine the variance inflation factors (VIF) in my multivariate analyses to test for multicollinearity,and find that distortion is not of major concern in that VIFs are less than 10 (Kennedy 2003).
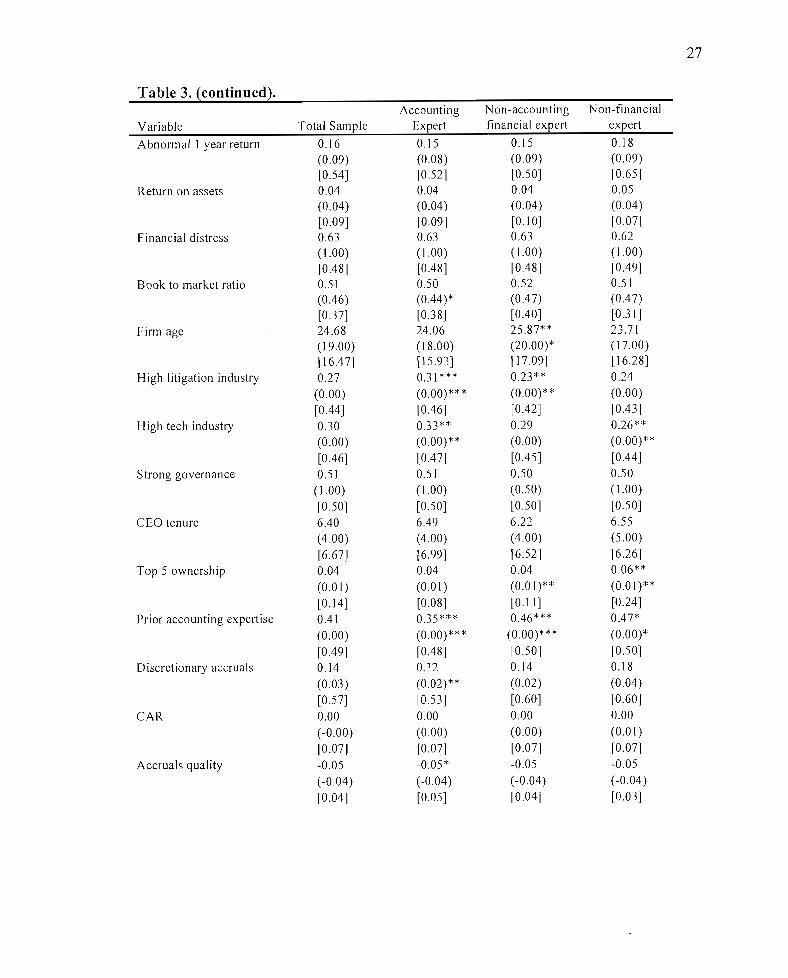
27
Table 3. (continued).Accounting Non-accounting Non-financial
Variable Total Sample Expert financial expert expert
A bnormal I year return 0.16 0.15 0.15 0.18(0.09) (0.08) (0.09) (0.09)[0.54] [0.52] [0.50] [0.65]
Return on assets 0.04 0.04 0.04 0.05(0.04) (0.04 ) (0.04 ) (0.04 )[0.09] [0.09] [0.10] [0.07]
Financial distress 0.63 0.63 0.63 0.62(] .00) ( 1.00) (1.00) (1.00)[0.48] [0.48] [0.48] [0.49]
Book to market ratio 0.51 0.50 0.52 0.51(0.46) (0.44 )* (0.47) (0.47)[0.37] [0.38] [0.40] [0.31 ]
Firm age 24.68 24.06 25.87* * 23.71(19.00) (18.00) (20.00)* (17.00)[16.47] [15.93] [17.09] [] 6.28]
High litigation industry 0.27 0.31*** 0.23** 0.24(0.00) (0.00)*** (0.00)** (0.00)[0.44] [0.46] [0.42] [0.43]
High tech industry 0.30 0.33** 0.29 0.26**(0.00) (0.00)** (0.00) (0.00)**[0.46] [0.47] [0.45] [0.44]
Strong governance 0.5 I 0.51 0.50 0.50( 1.00) (1.00) (0.50) ( 1.00)[0.50] [0.50] [0.50] [0.50]
CEO tenure 6.40 6.49 6.22 6.55(4.00) (4.00) (4.00) (5.00)
[6.67] [6.99] [6.52] [6.26]Top 5 ownership 0.04 0.04 0.04 0.06**
(0.0 1) (0.0 I) (0.01)** (0.01)**
[0.14] [0.08] [0.11 ] [0.24]Prior accounting expertise 0.41 0.35*** 0.46*** 0.47*
(0.00) (0.00)*** (0.00)*** (0.00)*[0.49] [0.48] [0.50] [0.50]
Discretionary accruals 0.14 0.]2 0.14 0.18(0.03) (0.02)** (0.02) (0.04 )[0.57] [0.53 ] [0.60] [0.60]
CAR 0.00 0.00 0.00 0.00(-0.00) (0.00) (0.00) (0.0 I)[0.07] [0.07] [0.07] [0.07]
Accruals quality -0.05 -0.05 * -0.05 -0.05(-0.04 ) (-004) (-0.04) (-0.04)[0.04] [0.05] [0.04] [0.03]
28
Table 3. (continued).Panel C: Pearson Correlations
Lev- Top 5 PriorAccr. AQ MVE erage a Ret Beta BtM own SGov AE
Accruals 1.00
AQ -0.05 1.00
MVE 0.02 0.23* 1.00
Leverage -0.04 0.14 0.10* 1.00oReturns 0.07* -0.29* -0.38* -0.17* 1.00
Beta 0.04 -0. I 8* -0. I 1* -0. I 1* 0.5 I * 1.00
BtM 0.00 -0.02 -0.28* 0.05 0.22* 0.01 1.00
High Tech 0.07* -0. I 7* -0.11 * -0.23* 0.34* 0.37* -0.12*
Top50wn -0.03 -0.04 -0. I 1* -0.01 0.01 -0.01 -0.01 1.00SGov 0.00 -0.10* -0.09* -0.02 0.21 * 0.05* 0.08* -0.05* 1.00PriorAE -0.05 0.03 -0. I 0* 0.02 0.02 0.05* 0.02 -0.00 0.03 1.00
This table provides sUlnmary statistics for the dependent and independent variables in my analysis. Thesample period spans 2003-2005, and includes 1,590 firm years involving an appointment to the auditcommittee. Panel A presents mean (median) [standard deviation] values for dependent variables sorted onappointee backgrounds. Panel B presents mean (median) [standard deviation] values for independentvariables sorted on appointee backgrounds. *, **, *** indicate statistical significance at two-tailed 10%,5%, and I% levels based on t-tests for means and a Wilcoxon rank-sum test for medians. Panel C providesPearson correlations and their associated p-values for select variables. * denotes statistical significance atthe 5% level. Variable descriptions are presented in Table 2.
29
CHAPTER V
RESEARCH DESIGN AND RESULTS
Primary Tests
Hypothesis 1 tests for changes in financial reporting quality on average following the
appointment of an accounting expert, while Hypotheses 2 and 3 examine whether these
improvements are conditional on governance strength and prior accounting expertise,
respectively. To test my predictions, I run a series of regressions where the dependent
variable is one of three proxies for financial reporting quality used in the accounting
literature. My sample includes the three years before and after each audit committee
appointment (excluding the appointment year). for a maximum of 6 observations per
sample firm-year. I begin by defining an indicator variable, After, that is equal to one if
the firm year follows the appointment of a new member to the audit committee and a
variable, AE, that is equal to one if the firm appointed an accounting expert at any time
during the sample period. The interaction between these two variables (AE x After)
captures the incremental change in reporting quality for firms appointing an accounting
expert relative to firms that appoint non-accounting experts to their audit committee, and
serves as the primary variable of interest in tests of Hypothesis 1.
I consider whether the strength of existing governance provisions influence the
impact of added accounting expertise on changes in financial reporting quality by
separately analyzing firms with strong governance and those with weak governance. My
proxy for governance strength is a composite measure (SGov) that considers board and
Relative audit committee power
Audit committee independenceInstitutional ownership
30
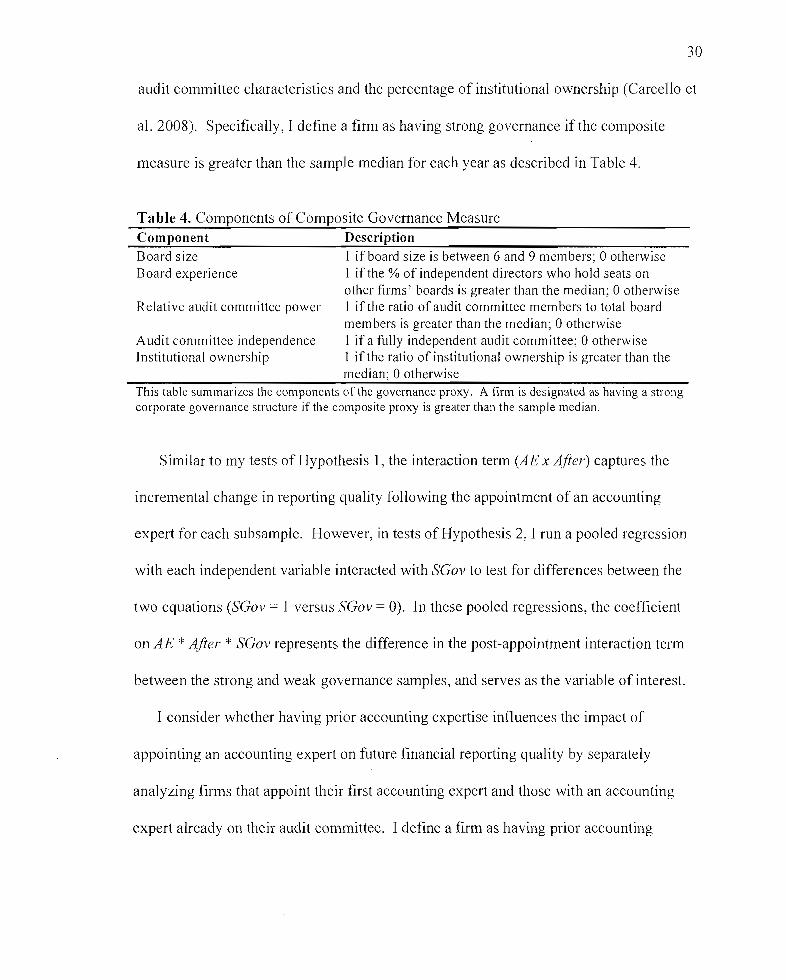
audit committee characteristics and the percentage of institutional ownership (Carcello et
a1. 2008). Specifically, I define a firm as having strong governance if the composite
measure is greater than the sample median for each year as described in Table 4.
Table 4. Components of Composite Governance MeasureComponent Description
Board size I ifboard size is between 6 and 9 members; 0 otherwiseBoard experience I if the % of independent directors who hold seats on
other firms' boards is greater than the median; 0 otherwiseI if the ratio of audit committee members to total boardmembers is greater than the median; 0 otherwiseI if a fully independent audit committee; 0 otherwise1 if the ratio of institutional ownership is greater than themedian; 0 otherwise
This table summarizes the components of the governance proxy. A firm is designated as having a strongcorporate governance structure if the composite proxy is greater than the sample median.
Similar to my tests of Hypothesis 1, the interaction term (AE x After) captures the
incremental change in reporting quality following the appointment of an accounting
expert for each subsample. However, in tests of Hypothesis 2, I run a pooled regression
with each independent variable interacted with SGov to test for differences between the
two equations (SGov = 1 versus SGov = 0). In these pooled regressions, the coefficient
on AE * After * SGov represents the difference in the post-appointment interaction term
between the strong and weak governance samples, and serves as the variable of interest.
I consider whether having prior accounting expertise influences the impact of
appointing an accounting expert on future financial reporting quality by separately
analyzing firms that appoint their first accounting expert and those with an accounting
expert already on their audit committee. I defme a firm as having prior accounting

31
expertise (PriorAE) ifthere was at least one accounting expert on the audit committee in
the year prior to the appointment of interest.
Similar to my tests of Hypotheses 1 and 2, the interaction term (AE x After) captures
the incremental change in reporting quality for firms that appoint an accounting expert to
their audit committee for each subsample. However, in tests of Hypothesis 3, I run a
pooled regression with each independent variable interacted with PriorAE to test for
differences between the two equations (PriorAE = 0 versus PriorAE = 1). In these
pooled regressions, the coefficient on AE * After * PriorAE represents the difference in
the post-appointment interaction term between the no prior accounting expeliise and prior
accounting expertise subsamples, and serves as the variable of interest.
There is also the possibility that a strong governance structure is a necessary
condition for prior accounting expertise to influence the incremental change in financial
reporting quality following the appointment of an accounting expert. As a result, I
perform a second set of tests of Hypothesis 3 using interaction terms to consider the
strength of alternative governance provisions and prior accounting expeliise
simultaneously. Specifically, I interact prior accounting expertise (PriorAE) with AE *
After and After in regressions segregated by governance strength, and interact governance
strength (SGov) with AE * After and After in regressions segregated by prior accounting
expertise. In the regressions segregated by governance strength, the coefficient on AE *
After represents the incremental change in reporting quality for firms appointing their
first accounting expeli. Similarly, the in the regression segregated by prior accounting
32
expertise, the coefficient on AE * After * SGov represents the incremental change in
reporting quality from having a strong governance structure.
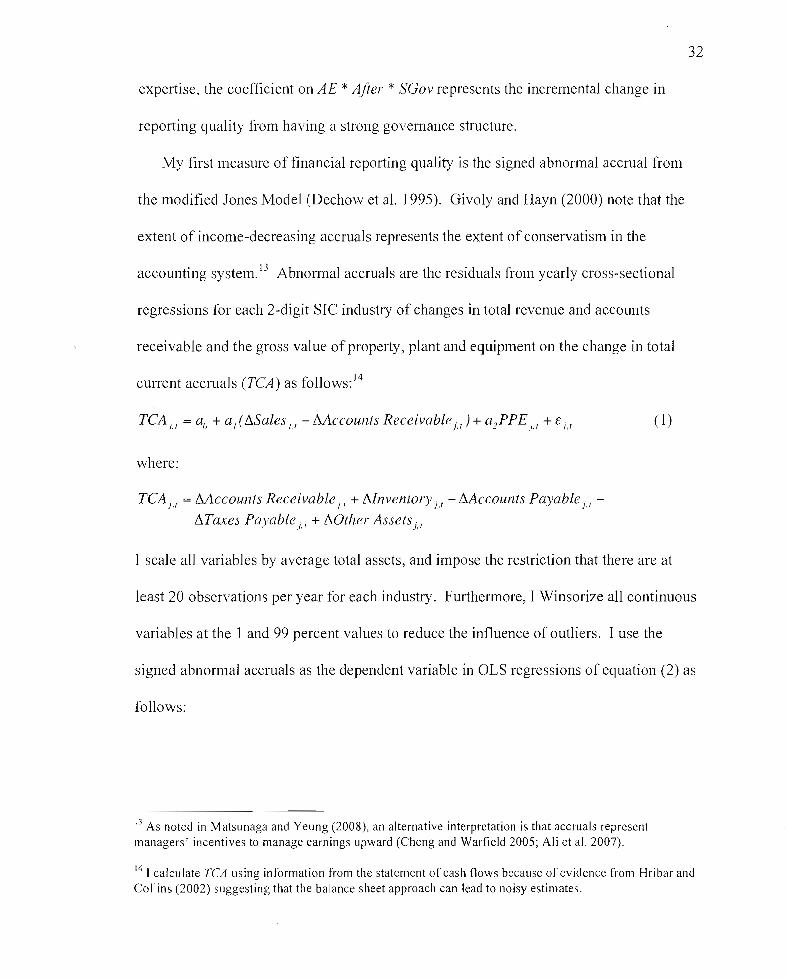
My first measure of financial reporting quality is the signed abnormal accrual from
the modified Jones Model (Dechow et al. 1995). Givoly and Hayn (2000) note that the
extent of income-decreasing accruals represents the extent of conservatism in the
accounting system. 13 Abnormal accruals are the residuals from yearly cross-sectional
regressions for each 2-digit SIC industry of changes in total revenue and accounts
receivable and the gross value of property, plant and equipment on the change in total
current accruals (TCA) as follows: 14
TCA j.t = aD + al(!1Salesj,t - !':.Accounts Receivablej.t )+ a2 PPEj,t + Ej,t
where:
TCA jt = Mccounts Receivablej,t + !1Inventory j,t - !':.Accounts Payablej.t
!1Taxes Payablej.t + !10ther Assetsjt
(1)
I scale all variables by average total assets, and impose the restriction that there are at
least 20 observations per year for each industry. Furthermore, I Winsorize all continuous
variables at the 1 and 99 percent values to reduce the influence of outliers. I use the
signed abnormal accruals as the dependent variable in OLS regressions of equation (2) as
follows:
13 As noted in Matsunaga and Yeung (2008), an alternative interpretation is that accruals representmanagers' incentives to manage earnings upward (Cheng and Warfield 2005; Ali et al. 2007).
14 I calcu late TCA using information from the statement of cash flows because of evidence from Hri bar andCollins (2002) suggesting that the balance sheet approach can lead to noisy estimates.
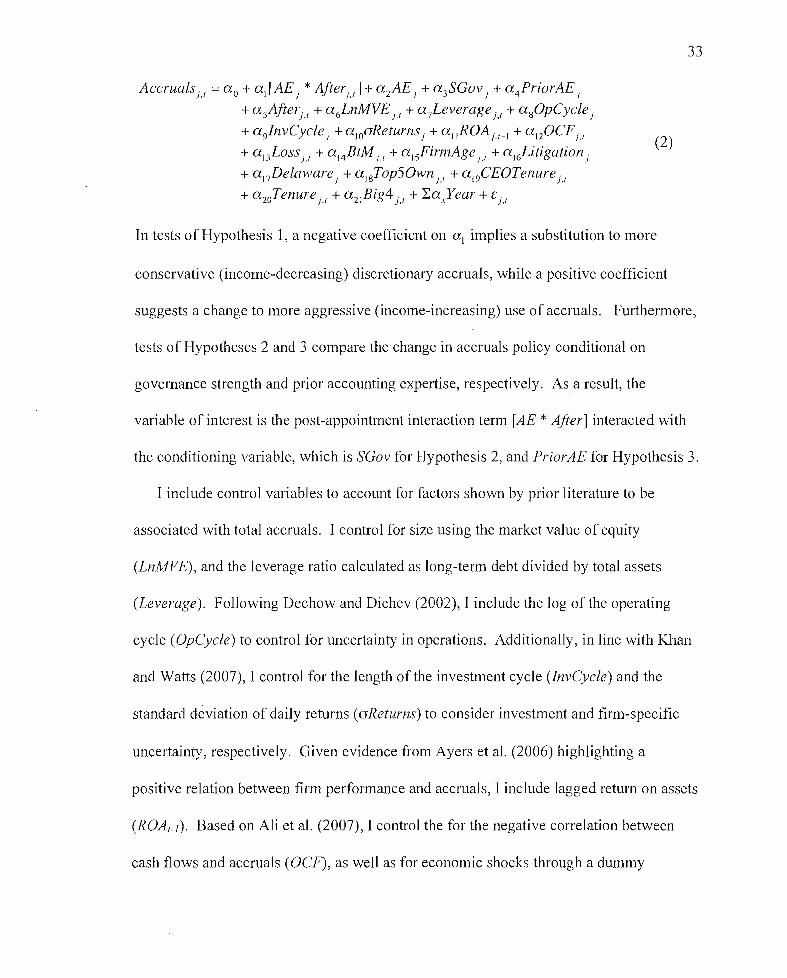
Accruals 'I = a o+ ai/ AE ' * After" J+ a 2 AE} + a 3SGov, + a 4PriorAE,}, }}, }}
+asAfterjl + a 6LnMVE},r + a 7Leverage j,t + agOpCycle j
+ a 9JnvCycle, +a1ooReturnsj + al,ROAj,r_, + a I20CFj,1
+ a 13 Loss j,r + a l4 BtM j,t + a ,sFirmAge},1 + a'6Litigationj
+a'7Delaware j + a l gTopS Own },r + a l9CEOTenure j,t+ a 20Tenure j,r + a 2 ,Big4 j,l + LaxYear + Ej,l
(2)
33
In tests of Hypothesis 1, a negative coefficient on a, implies a substitution to more
conservative (income-decreasing) discretionary accruals, while a positive coefficient
suggests a change to more aggressive (income-increasing) use of accruals. Furthermore,
tests of Hypotheses 2 and 3 compare the change in accruals policy conditional on
governance strength and prior accounting expertise, respectively. As a result, the
variable of interest is the post-appointment interaction term [AE * After] interacted with
the conditioning variable, which is SGov for Hypothesis 2, and PriorAE for Hypothesis 3.
I include control variables to account for factors shown by prior literature to be
associated with total accruals. I control for size using the market value of equity
(LnMVE), and the leverage ratio calculated as long-term debt divided by total assets
(Leverage). Following Dechow and Dichev (2002), I include the log of the operating
cycle (OpCycle) to control for uncertainty in operations. Additionally, in line with Khan
and Watts (2007), I control for the length of the investment cycle (lnvCycle) and the
standard deviation of daily returns (oReturns) to consider investment and firm-specific
uncertainty, respectively. Given evidence from Ayers et al. (2006) highlighting a
positive relation between firm performance and accruals, I include lagged return on assets
(ROAr-I). Based on Ali et al. (2007), I control the for the negative correlation between
cash flows and accruals (OCF), as well as for economic shocks through a dummy

34
variable identifying a loss in the current period (Loss). I control for growth firms using
the book-to-market ratio (BtM), and the maturity of governance systems through the
number of years listed on Compustat (FirmAge) (Khan and Watts 2007).
Accounting experts likely have different incentives to rigorously monitor the financial
reporting process in more risky situations. Therefore, I control for high litigation
industries (Litigation) using the Francis et al. (1994) categories. Furthermore, I control
for managerial ownership (Top50wn) to consider managerial incentives to misreport
accruals, and for CEO influence through the number of years the chief executive has held
the position (CEOTenure) (Hermalin and Weisbach 1988). I also include the number of
years following the audit committee appointment (Tenure) to control for learning effects
by accounting experts and the time needed to implement structural changes to the
financial reporting system, as well as for monitoring by high quality auditors through an
indicator variable equal to one if the firm employs a large, national auditor (Big4).
Finally, I include year fixed-effects to control for time-specific factors in all
specifications. All variables are described in detail in Table 2, and results are presented
using standard errors clustered by firm (Rogers 1993).
My next set of tests use the extent to which investors react to an earnings surprise as a
proxy for high quality earnings. I calculate the earnings response coefficient (ERC) as
the relation between the three-day cumulative abnormal return (CAR) surrounding
quarterly earnings announcements, and unexpected earnings calculated as the I1B/E/S
actual earnings minus the median analyst forecast (UE) using equation (3) as follows:
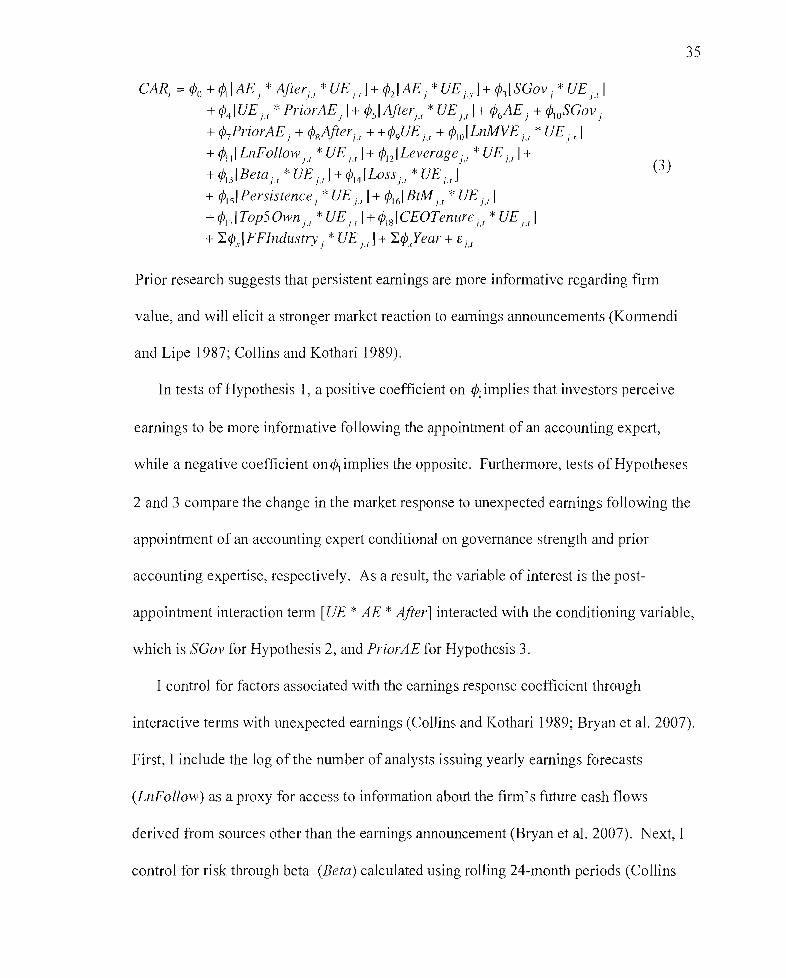
CAR, = ¢o + ¢II AE j * Ajterj.1*VE'I J+ ¢2[AEi *VE j.r I+ ¢3[SGov j *VE j.1 j
+ ¢4 [VE jl * PriorAE j I+ ¢s! Ajteljt *VE j,l] + ¢6AE j + ¢lOSGov j+¢7PriorAEj + ¢sAjterjt + +¢9VEj,1 + ¢1O!LnMVE j,l *VEj,l]
+ ¢III LnFollow jl *VE j.l] + ¢12[Leverage j,r *VEi,t J+
+ ¢I3IBetaj I *VEj,l]+¢14[Lossj,r *VEj,rJ
+ ¢Isl Persistence j *VE i ., J+ ¢16! BtMj,r *VE j,rJ+ ¢17 1TopS Owni I *VEi.,] +¢,s!CEOTenure j.1*VE j.1J
+ I¢,IFFlndustry j * VE,,I] + I¢Xear + Ej,t
(3 )
3S
Prior research suggests that persistent earnings are more informative regarding firm
value, and will elicit a stronger market reaction to earnings announcements (Kormendi
and Lipe 1987; Collins and Kothari 1989).
In tests of Hypothesis 1, a positive coefficient on ¢I implies that investors perceive
earnings to be more inforn1ative following the appointment of an accounting expert,
while a negative coefficient on 1, implies the opposite. Furthermore, tests of Hypotheses
2 and 3 compare the change in the market response to unexpected earnings following the
appointment of an accounting expert conditional on governance strength and prior
accounting expertise, respectively. As a result, the variable of interest is the post-
appointment interaction term [VE * AE * ~fter] interacted with the conditioning variable,
which is SGov for Hypothesis 2, and PriorAE for Hypothesis 3.
I control for factors associated with the earnings response coefficient through
interactive terms with unexpected earnings (Collins and Kothari 1989; Bryan et al. 2007).
First, I include the log of the number of analysts issuing yearly earnings forecasts
(LnFollow) as a proxy for access to information about the firm's future cash flows
derived from sources other than the earnings announcement (Bryan et al. 2007). Next, I
control for risk through beta (Beta) calculated using rolling 24-month periods (Collins
36
and Kothari 1989; Matsunaga and Yeung 2008). In line with Bryan et al. (2007), I
control for economic shocks through dummy variables for a loss period (Loss), and
earnings persistence (Persistence) based on a time-series regression of current earnings
on future earnings (Collins and Kothari 1989). Finally I control for industry effects
through dummy variables for the 12 Fama French industries interacted with unexpected
earnings (Ali et al. 2007). All other variables are defined previously, and are
summarized in Table 2.
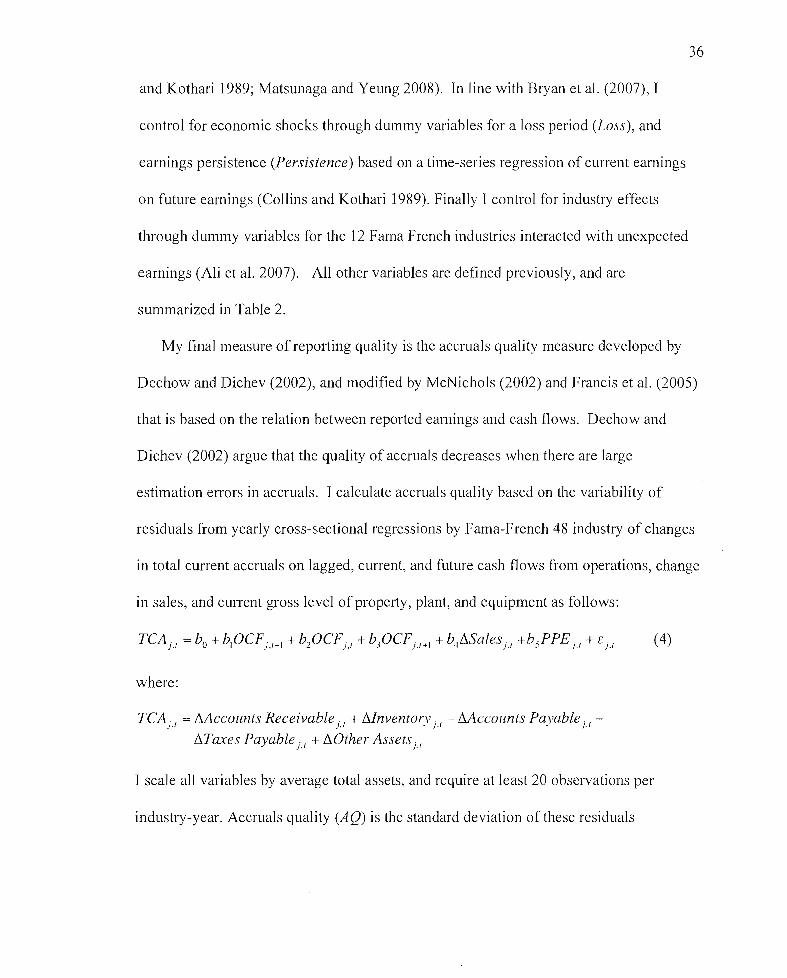
My final measure of repOliing quality is the accruals quality measure developed by
Dechow and Dichev (2002), and modified by McNichols (2002) and Francis et al. (2005)
that is based on the relation between reported earnings and cash flows. Dechow and
Dichev (2002) argue that the quality of accruals decreases when there are large
estimation errors in accruals. I calculate accruals quality based on the variability of
residuals from yearly cross-sectional regressions by Fama-French 48 industry of changes
in total current accruals on lagged, current, and future cash flows from operations, change
in sales, and current gross level of property, plant, and equipment as follows:
where:
TeA j.1= t1Accounts Receivable;.1 + t1InventorYj.1 - Mccounts Payable).l
t1Taxes Payable j,1 + t10ther Assets). I
I scale all variables by average total assets, and require at least 20 observations per
industry-year. Accruals quality (AQ) is the standard deviation of these residuals
37
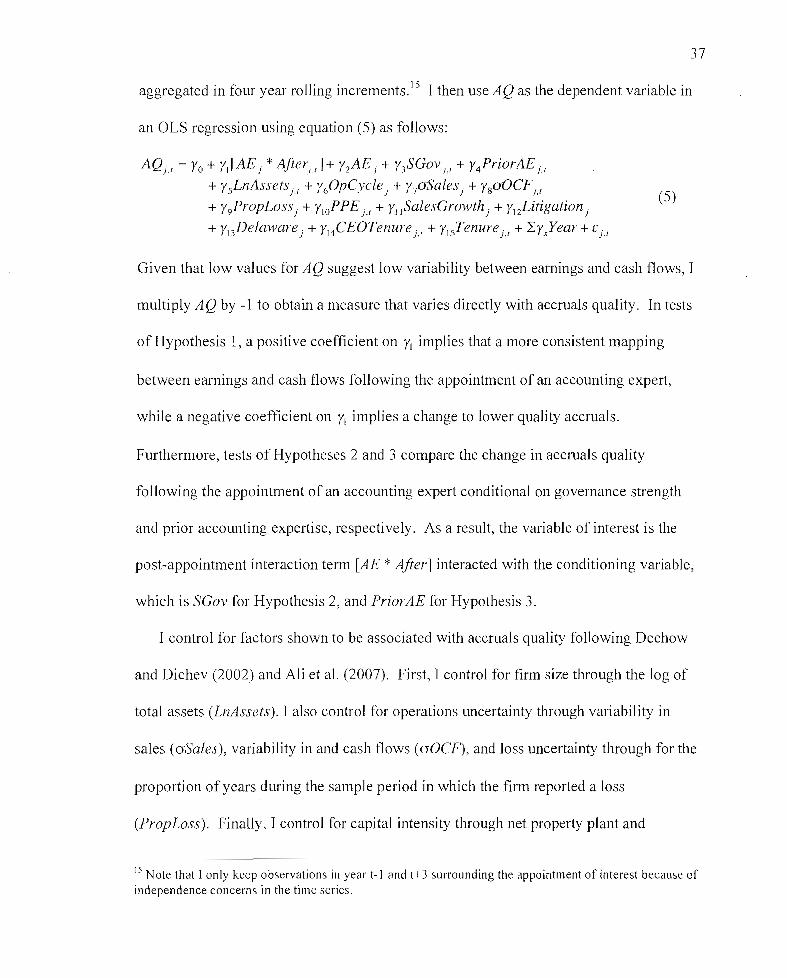
aggregated in four year rolling increments.] 5 I then use AQ as the dependent variable in
an OLS regression using equation (5) as follows:
AQ)I = Yo + YllAE j * Ajterjl ]+ Y2AEI + hSGoVj,1 + Y4PriorAEj.1
+ YsLnAssets jl + Y60pCycle) + Y70Salesj + YsoOCFj,l
+ Y9PropLossj + YloPPE j,1 + YllSalesGrowth j + YI2Litigationj
+ YuDelaware j + YI4CEOTenure j.r + YlsTenure j,l + Lr.year + [j.1
(5)
Given that low values for AQ suggest low variability between earnings and cash flows, I
multiply AQ by -1 to obtain a measure that varies directly with accruals quality. In tests
of Hypothesis 1, a positive coefficient on YI implies that a more consistent mapping
between earnings and cash flows following the appointment of an accounting expert,
while a negative coefficient on Y, implies a change to lower quality accruals.
Furthermore, tests of Hypotheses 2 and 3 compare the change in accruals quality
following the appointment of an accounting expert conditional on governance strength
and prior accounting expertise, respectively. As a result, the variable of interest is the
post-appointment interaction term [AE * After] interacted with the conditioning variable,
which is SGov for Hypothesis 2, and PriorAE for Hypothesis 3.
I control for factors shown to be associated with accruals quality following Dechow
and Dichev (2002) and Ali et al. (2007). First, I control for firm size through the log of
total assets (LnAssets). I also control for operations uncertainty through variability in
sales (aSales), variability in and cash flows (aOCF), and loss uncertainty through for the
proportion of years during the sample period in which the firm reported a loss
(PropLoss). Finally, I control for capital intensity through net property plant and
15 Note that [only keep observations in year t-l and t+3 surrounding the appointment of interest because ofindependence concerns in the time series.
38
equipment scaled by total assets (PPE), and sales growth (SalesGrowth) (Dechow and
Dichev, 2002). All other variables are defined previously, and summarized in Table 2.
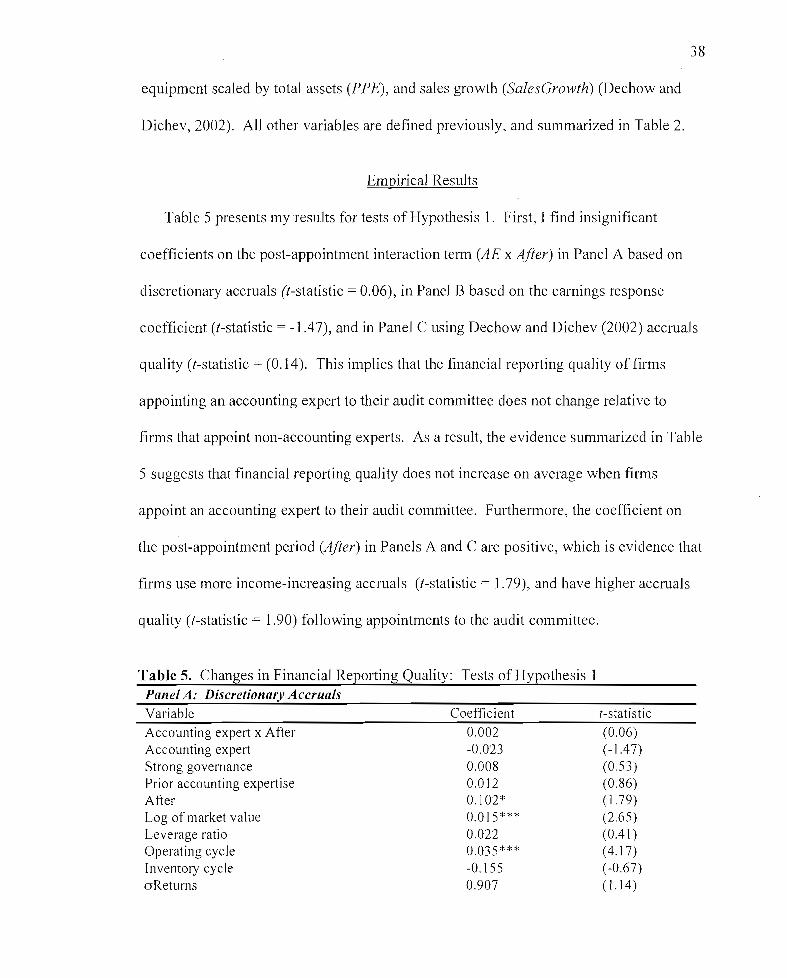
Empirical Results
Table 5 presents my results for tests of Hypothesis 1. First, I find insignificant
coefficients on the post-appointment interaction term (AE x After) in Panel A based on
discretionary accruals (t-statistic = 0.06), in Panel B based on the earnings response
coefficient (I-statistic = -1.47), and in Panel C using Dechow and Dichev (2002) accruals
quality (I-statistic = (0.14). This implies that the financial reporting quality of firms
appointing an accounting expert to their audit committee does not change relative to
firms that appoint non-accounting experts. As a result, the evidence summarized in Table
5 suggests that financial reporting quality does not increase on average when firms
appoint an accounting expert to their audit committee. Furthermore, the coefficient on
the post-appointment period Vifier) in Panels A and C are positive, which is evidence that
firms use more income-increasing accruals (I-statistic = 1.79), and have higher accruals
quality (I-statistic = 1.90) following appointments to the audit committee.
Table 5. Changes in Financial Reporting Quality: Tests of Hypothesis 1Panel A: Discretionary AccrualsVariableAccounting expert x AfterAccounting expertStrong governancePrior accounting expertiseAfterLog of market valueLeverage ratioOperating cycleInventory cycleaReturns
Coefficient0.002-0.0230.0080.0120.102*0.015***0.0220.035***-0.1550.907
(-statistic(0.06)(-1.47)(0.53)(0.86)(1.79)(2.65)(0041)(4.17)(-0.67)(1.14)

39
Table 5. (continued).Variable Coefficient I-statistic
Return on assets t_! 0.210* ( 1.82)Operating cash flow -0.489*** (-4.88)Loss in current year -0.065** (-2.33)Book to market ratio -0.034 (-0.67)Firm age -0.000 (-0.92)High litigation industry 0.048** (2.50)Top 5 ownership -0.025 (-0.37)CEO tenure 0.000 (0.12)Tenure -0.021 (-1.37)Big four auditor -0.000 (-0.02)Intercept -0.224** (-2.29)
Observations 4,581Adjusted R2 0.05
Panel B: Earnings Response CoefficientUE x Accounting expert x After -0.035 (-1.47)UE x Accounting expert 0.032 (1.58)UE x Strong governance 0.013 (0.60)UE x Prior expeli 0.045*** (3.31 )UE x After 0.001 (0.046)Accounting expert -0.001 (-0.73)Strong governance 0.001 (0.81)Prior expert -0.000 (-0.094 )After -0.004** (-2.18)UE -0.524*** (-8.43 )UE x Market value 0.030*** (4.83)UE x Analyst following -0.012 (-0.86)UE x Leverage 0.101** (2.34)UE x Beta -0.006 (-0.66)UE x Loss 0.108*** (5.49)UE x Earnings persistence 0.000 (0.11 )UE x Book to market ratio 0.026** (2.49)UE x Top 5 ownership 0.106 ( 1.25)UE x CEO Tenure 0.001 (0.92)Intercept 0.005** (2.16)
Observations 16,551Adjusted R1 0.03
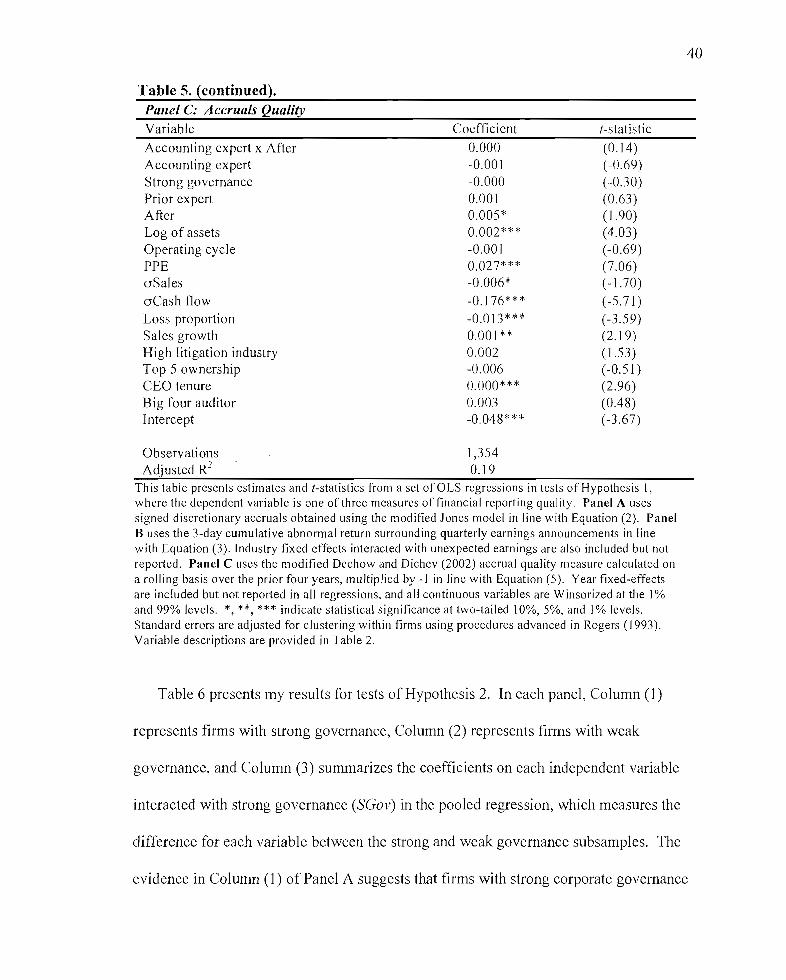
40
Table 5. (continued).Panel C: Accruals QualityVariable
Accounting expert x AfterAccounting expertStrong governancePrior expertAfterLog of assetsOperating cyclePPEoSalesoCash flowLoss propoliionSales growthHigh litigation industryTop 5 ownershipCEO tenureBig four auditorIntercept
Coefficient
0.000-0.001-0.0000.0010.005*0.002***-0.0010.027***-0.006*-0.176***-0.013***0.001**0.002-0.0060.000***0.003-0.048***
t-statistic
(0.14)(-0.69)(-0.30)(0.63)(1.90)(4.03)(-0.69)(7.06)(-1.70)(-5.71)(-3.59)(2.19)(1.53)(-0.51)(2.96)(0.48)(-3.67)
Observations 1,354Adjusted R2 0.19
This table presents estimates and (-statistics from a set ofOLS regressions in tests of Hypothesis I,where the dependent variable is one of three measures of financial reporting quality. Panel A usessigned discretionary accruals obtained using the modified Jones model in line with Equation (2). PanelB uses the 3-day cumulative abnormal return surround ing quarterly earnings announcements in linewith Equation (3). Industry fixed effects interacted with unexpected earnings are also included but notreported. Panel C uses the modified Dechow and Dichev (2002) accrual quality measure calculated ona rolling basis over the prior four years, multiplied by -I in line with Equation (5). Year fixed-effectsare included but not reported in all regressions, and all continuous variables are Winsorized at the 1%and 99% levels. *, **, *** indicate statistical significance at two-tailed 10%,5%, and 1% levels.Standard errors are adjusted for clustering within firms using procedures advanced in Rogers (1993).Variable descriptions are provided in Table 2.
Table 6 presents my results for tests of Hypothesis 2. In each panel, Column (l)
represents firms with strong governance, Column (2) represents firms with weak
governance, and Column (3) summarizes the coefficients on each independent variable
interacted with strong governance (SGov) in the pooled regression, which measures the
difference for each variable between the strong and weak governance subsamples. The
evidence in Column (l) of Panel A suggests that firms with strong corporate governance
41
that appoint an accounting expert substitute to more income-decreasing accruals
following the appointment, as illustrated by the significant coefficient on the post
appointment interaction term (AE * After) (t-statistic = _1.78).16 Alternatively, Column
(2) suggests no different in the post-appointment interaction tenn for firms with weak
corporate governance (t-statistic = 1.45). One interpretation of these results is that a
strong governance structure is a necessary condition for a transition to more conservative
accruals following the appointment of an accounting expert. Additionally, Column (3)
documents a significant difference (I-statistic = -2.21) between the coefficients on (AE *
After) between the strong and weak governance subsamples, which supports the
conclusion that improvements in reporting quality following the appointment of an
accounting expert are larger for firms with strong versus weak corporate governance.
Panel B of Table 6 provides evidence of an incremental improvement in earnings
response coefficients following the appointment of an accounting expert in the strong
governance subsample, as highlighted by the significant coefficient on UE * AE * After
in Column (1) (I-statistic = 2.30), and an incremental decrease in earnings response
coefficients for the weak governance subsample following the appointment of an
accounting expert, as highlighted by the negative coefficient on UE * AE * After in
Column (2) (t-statistic = -2.60). Furthermore, the results presented in Column (3)
confirm that firms with strong governance have larger increases in their earnings
response coefficients following the appointment of an accounting expert than firms with
16 In terms of economic significance, the coefficient on the post-appointment interaction term isapproximately 44% of the average discretionary accruals in my sample (-0.061 10.14).
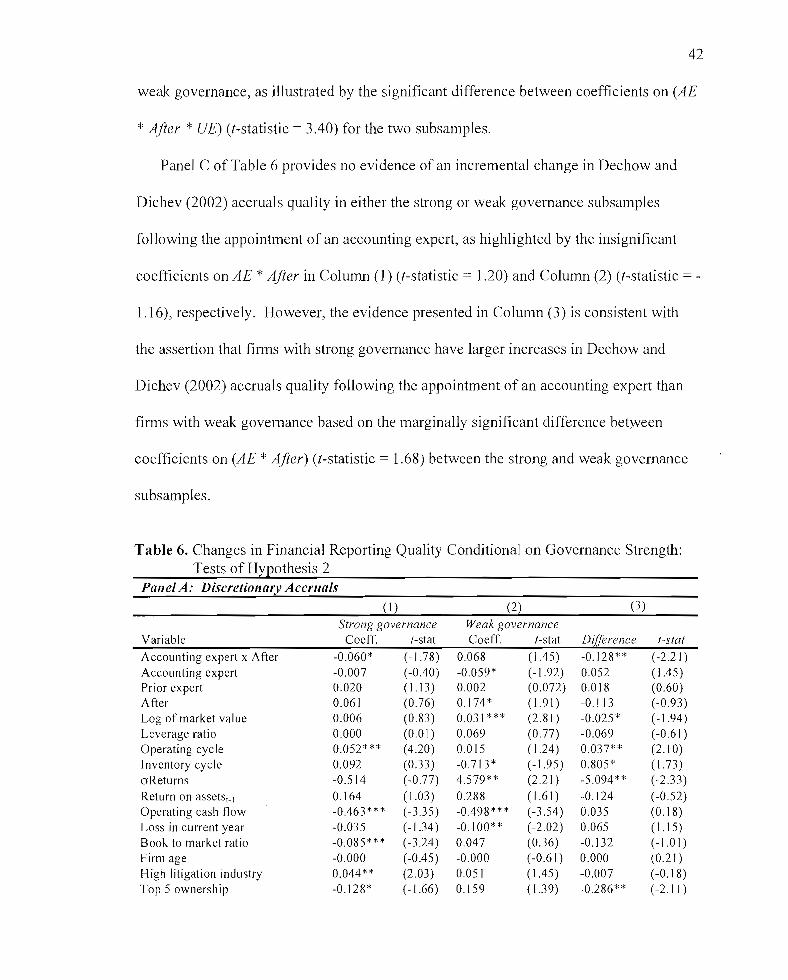
42
weak governance, as illustrated by the significant difference between coefficients on (AE
* After * UE) (t-statistic = 3.40) for the two subsamples.
Panel C of Table 6 provides no evidence of an incremental change in Dechow and
Dichev (2002) accruals quality in either the strong or weak governance subsamples
following the appointment of an accounting expert, as highlighted by the insignificant
coefficients on AE *After in Column (1) (t-statistic = 1.20) and Column (2) (t-statistic = -
1.16), respectively. However, the evidence presented in Column (3) is consistent with
the assertion that firms with strong governance have larger increases in Dechow and
Dichev (2002) accruals quality following the appointment of an accounting expert than
firms with weak governance based on the marginally significant difference between
coefficients on (AE * After) (t-statistic = 1.68) between the strong and weak governance
subsamples.
Table 6. Changes in Financial Reporting Quality Conditional on Governance Strength:Tests of Hypothesis 2
Panel A: Discretionary Accruals(1) (2) (3)
Strong governance Weak governanceVariable Coetf. t-stat Coeff. t-stat Difference t-stat
Accounting expert x After -0.060* (-1.78) 0.068 (l.45) -0.128** (-2.21)Accounting expert -0.007 (-0.40) -0.059* (-1.92) 0.052 (1.45)Prior expert 0.020 (1.13) 0.002 (0.072) 0.018 (0.60)After 0.061 (0.76) 0.174* (1.91) -0.1 13 (-0.93)Log of market value 0.006 (0.83) 0.031*** (2.81 ) -0.025* (-1.94)Leverage ratio 0.000 (0.01) 0.069 (0.77) -0.069 (-0.61)Operating cycle 0.052*** (4.20) 0.015 (1.24 ) 0.037** (2.10)Inventory cycle 0.092 (0.33) -0.713* . (-1.95) 0.805* ( 1.73)oReturns -0.514 (-0.77) 4.579** (2.21 ) -5.094** (-2.33)
Return on assetst_1 0.164 ( 1.03) 0.288 ( 1.61 ) -0.124 (-0.52)Operating cash flow -0.463*** (-3.35) -0.498*** (-3.54) 0.035 (0.18)Loss in current year -0.Q35 (-1.34 ) -0.100** (-2.02) 0.065 (I. I5)Book to market ratio -0.085*** (-3.24) 0.047 (0.36) -0.132 (-1.01)Firm age -0.000 (-0.45) -0.000 (-0.61) 0.000 (0.21 )High litigation industry 0.044** (2.03) 0.051 (1.45) -0.007 (-0.18)Top 5 ownership -0.128* (-1.66) 0.159 ( 1.39) -0.286** (-2.11 )
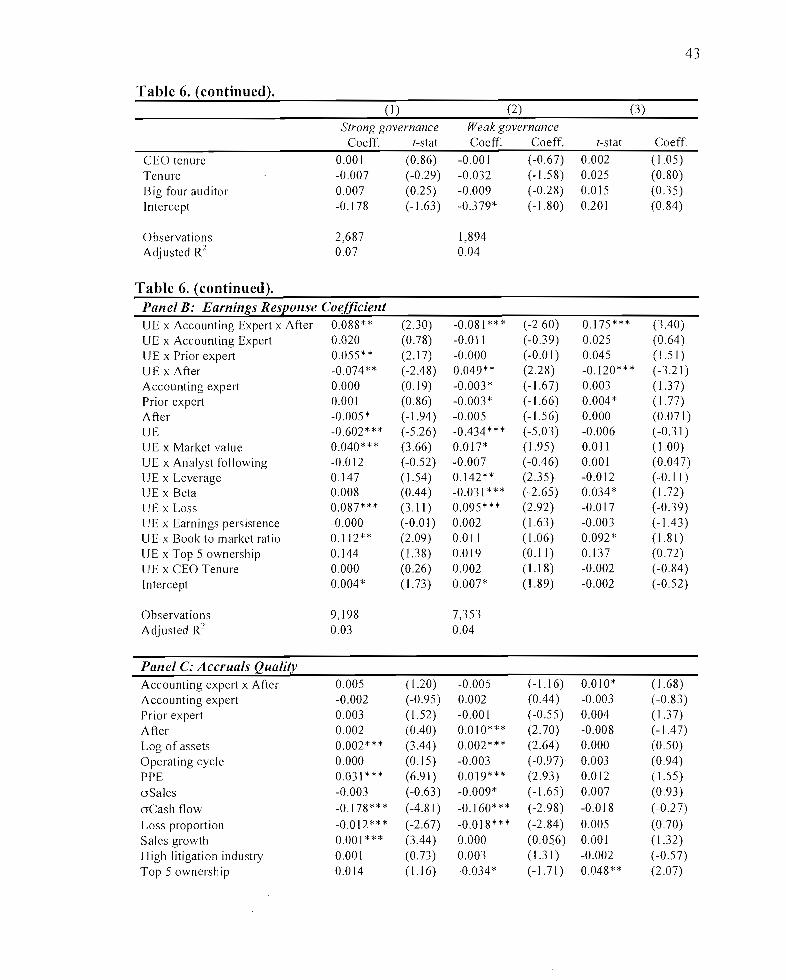
43
Table 6. (continued).(1) (2) (3)
Strong governance Weak governanceCoeff. t-stat Coeff. Coeff. t-stat Coeff.
CEO tenure 0.001 (0.86) -0.001 (-0.67) 0.002 ( 1.05)Tenure -0.007 (-0.29) -0.032 (-1.58) 0.025 (0.80)Big four auditor 0.007 (0.25) -0.009 (-0.28) 0.015 (0.35)Intercept -0.178 (-1.63) -0.379* (-1.80) 0.201 (0.84 )
Observations 2,687 1,894Adjusted R2 0.07 0.04
Table 6. (continued).Panel B: Earnings Response CoefficientUE x Accounting Expert x After 0.088 ** (2.30) -0.081*** (-2.60) 0.175*** (3AO)UE x Accounting Expert 0.020 (0.78) -0.011 (-0.39) 0.025 (0.64 )UE x Prior expert 0.055** (2.17) -0.000 (-0.01) 0.045 (1.5 I)UE x After -0.074** (-2A8) 0.049** (2.28) -0.120*** (-3.21)Accounting expert 0.000 (0.19) -0.003 * (-1.67) 0.003 ( 1.37)Prior expeli 0.001 (0.86) -0.003* (-1.66) 0.004* (1.77)After -0.005* (-1.94) -0.005 (-1.56) 0.000 (0.071 )UE -0.602*** (-5.26) -0.434*** (-5.03) -0.006 (-0.31)UE x Market value 0.040* ** (3.66) 0.017* (1.95) 0.011 ( 1.00)UE x Analyst following -0.012 (-0.52) -0.007 (-OA6) 0.001 (0.047)UE x Leverage 0.147 (J .54) 0.142** (2.35) -0.012 (-0.11 )UE x Beta 0.008 (OA4 ) -0.031*** (-2.65) 0.034* (1.72)UE x Loss 0.087*** (3.11) 0.095*** (2.92) -0.017 (-0.39)UE x Earnings persistence -0.000 (-0.01) 0.002 ( 1.63) -0.003 (-1.43)UE x Book to market ratio 0.112** (2.09) 0.011 (1.06 ) 0.092* (1.81 )UE x Top 5 ownership 0.144 ( 1.38) 0.019 (0.11) 0.137 (0.72)UE x CEO Tenure 0.000 (0.26) 0.002 (1.18) -0.002 (-0.84)Intercept 0.004* (1.73) 0.007* (1.89) -0.002 (-0.52)
Observations 9,198 7,353Adjusted R2 0.03 0.04
Panel C: Accruals QualityAccounting expert x After 0.005 ( 1.20) -0.005 (-1.16) 0.010* ( 1.68)Accounting expert -0.002 (-0.95) 0.002 (0.44 ) -0.003 (-0.83)Prior expert 0.003 (1.52) -0.001 (-0.55) 0.004 (1.3 7)After 0.002 (DAD) 0.010*** (2.70) -0.008 (-1.47)Log of assets 0.002*** (3 A4) 0.002*** (2.64) 0.000 (0.50)Operating cycle 0.000 (0.15) -0.003 (-0.97) 0.003 (0.94 )PPE 0.031*** (6.91) 0.019*** (2.93) 0.012 ( 1.55)aSales -0.003 (-0.63) -0.009* (-1.65) 0.007 (0.93)aCash flow -0.178*** (-4.81) -0.160*** (-2.98) -0.018 (-0.27)Loss proportion -0.012*** (-2.67) -0.018*** (-2.84) 0.005 (0.70)Sales growth 0.001 *** (3A4) 0.000 (0.056) 0.001 (1.32)High litigation industry 0.001 (0.73) 0.003 (1.31 ) -0.002 (-0.57)Top 5 ownership 0.014 (1.16) -0.034* (-1.71) 0.048** (2.07)
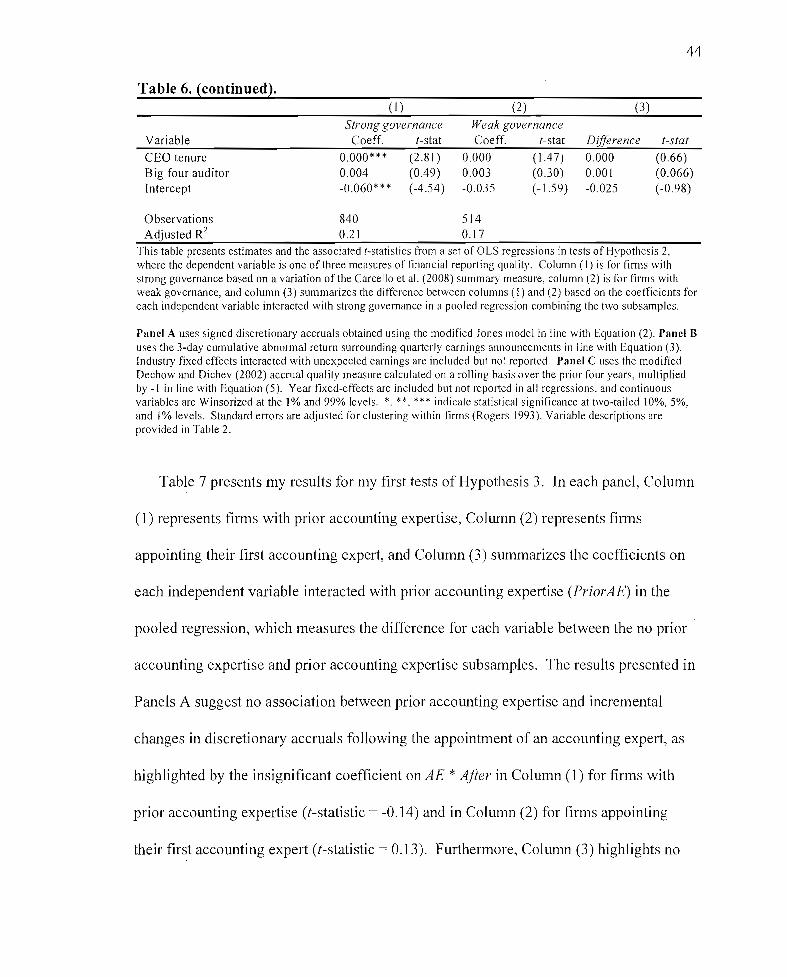
44
Table 6. (continued).
Variable
CEO tenureBig four auditorIntercept
(I)
Strong governanceCoeff. t-stat
0.000*** (2.81)0.004 (0.49)-0.060*** (-4.54)
(2)
Weak governanceCoeff. t-stat
0.000 (1.47)0.003 (0.30)-0.035 (-1.59)
(3)
Difference
0.0000.001-0.025
t-stat
(0.66)(0.066)(-0.98)
Observations 840 514AdjustedR2 0.21 0.17
This table presents estimates and the associated I-statistics from a set of OLS regressions in tests of Hypothesis 2,where the dependent variable is one of three measures of financial rep0l1ing quality. Column (J) is for firms withstrong governance based on a variation of the Carcello et al. (2008) summary measure, column (2) is for firms withweak governance, and column (3) summarizes the difference between columns (I) and (2) based on the coefficients foreach independent variable interacted with strong governance in a pooled regression combining the two subsamples.
Panel A uses signed discretionary accruals obtained using the modified Jones model in line with Equation (2). Panel Buses the 3-day cumulative abnormal return surrounding quarterly earnings announcements in line with Equation (3).Industry fixed effects interacted with unexpected earnings are included but not reported. Panel C uses the modifiedDechow and Dichev (2002) accrual quality measure calculated on a rolling basis over the prior four years, multipliedby -I in line with Equation (5). Year fixed-effects are included but not reported in all regressions. and continuousvariables are Winsorized at the 1% and 99% levels. *. **. *** indicate statistical significance at two-tailed 10%,5%,and 1% levels. Standard errors are adjusted for clustering within tlrms (Rogers 1993). Variable descriptions areprovided in Table 2.
Table 7 presents my results for my first tests of Hypothesis 3. In each panel, Column
(1) represents firms with prior accounting expertise, Column (2) represents firms
appointing their first accounting expert, and Column (3) summarizes the coefficients on
each independent variable interacted with prior accounting expertise (Prim-A£) in the
pooled regression, which measures the difference for each variable between the no prior
accounting expertise and prior accounting expertise subsamples. The results presented in
Panels A suggest no association between prior accounting expertise and incremental
changes in discretionary accruals following the appointment of an accounting expert, as
highlighted by the insignificant coefficient on AE * After in Column (1) for firms with
prior accounting expertise (t-statistic = -0.14) and in Column (2) for firms appointing
their first accounting expert (t-statistic = 0.13). Furthermore, Column (3) highlights no
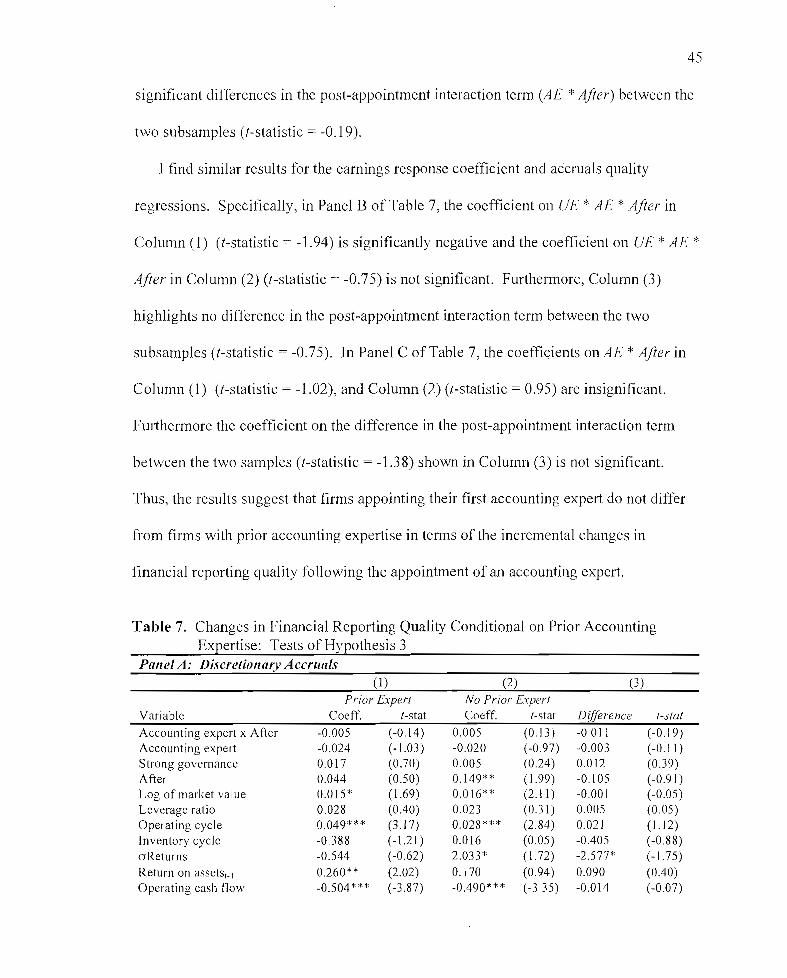
45
significant differences in the post-appointment interaction term (AE *After) between the
two subsamples (I-statistic = -0.19).
I find similar results for the earnings response coefficient and accruals quality
regressions. Specifically, in Panel B of Table 7, the coefficient on UE * AE * After in
Column (l) (I-statistic = -1.94) is significantly negative and the coefficient on UE * AE *
After in Column (2) (I-statistic = -0.75) is not significant. Furthermore, Column (3)
highlights no difference in the post-appointment interaction term between the two
subsamples (I-statistic = -0.75). In Panel C of Table 7, the coefficients on AE * After in
Column (l) (I-statistic = -1.02), and Column (2) (t-statistic = 0.95) are insignificant.
Furthermore the coefficient on the difference in the post-appointment interaction term
between the two samples (I-statistic = -1.38) shown in Column (3) is not significant.
Thus, the results suggest that firms appointing their first accounting expert do not differ
from firms with prior accounting expertise in terms of the incremental changes in
financial reporting quality following the appointment of an accounting expert.
Table 7. Changes in Financial Reporting Quality Conditional on Prior AccountingExpertise: Tests of Hypothesis 3
Panel A: Discretionary Accruals(1) (2) (3)
No Prior ExpertVariable
Accounting expert x AfterAccounting expertStrong governanceAfterLog of market valueLeverage ratioOperating cycleInventory cycleaReturnsReturn on assets t_1
Operating cash flow
Prior ExpertCoeff. t-stat
-0.005 (-0.14)-0.024 (-1.03)0.017 (0.70)0.044 (0.50)0.015* (1.69)0.028 (0.40)0.049*** (3.17)-0.388 (-1.21)-0.544 (-0.62)0.260* * (2.02)-0.504*** (-3.87)
Coeff.
0.005-0.0200.0050.149**0.016**0.0230.028***0.0162.033 *0.170-0.490***
t-stat
(0.13)(-0.97)(0.24)( I.99)(2.11 )(0.31 )(2.84)(0.05)( I.72)(0.94 )(-335)
Difference
-0.011-0.0030.012-0.105-0.00 I0.0050.021-0.405-2.577*0.090-0.014
t-stat
(-0.19)(-0.11 )(0.39)(-0.91)(-0.05)(0.05)(I. 12)(-0.88)(-1.75)(0.40)(-0.07)

46
Table 7. (continued).(I) (2) (3)
Prior Experl No Prior ExperlVariable Coeff. I-stat Coeff. I-stat Difference I-sial
Loss in current year -0.021 (-0.68) -0.101** (-2.40) 0.080 (1.53)Book to market ratio -0.095*** (-2.98) 0.001 (0.02) -0.097 (-1.13)Firm age -0.00 I (-1.25) -0.000 (-0.14 ) -0.001 (-0.80)High litigatio'n industry 0.058** (2.24 ) 0.041 (1.55) 0.017 (0.45)Top 5 ownership -0.148 (-1.59) 0.025 (0.27) -0.174 (-1.32)CEO tenure 0.001 (0.41 ) -0.000 (-0.09) 0.001 (0.37)Tenure -0.013 (-0.57) -0.029 (-1.33) 0.016 (0.52)Big four auditor 0.001 (0.04 ) 0.003 (0.15) -0.002 (-0.05)Intercept -0.190 (-1.32) -0.261** (-1.97) 0.070 (0.36)Observations 1,810 2,771Adjusted R2 0.08 0.04
Panel B: Earnings Response CoefficientLIE x Accounting expert x After -0.080* (-1.94) -0.026 (-0.75) -0.041 (-0.75)LIE x Accounting expert 0.030 (0.69) 0.059** (2.47) 0.034 (0.67)LIE x Strong governance 0.022 (0.50) -0.006 (-0.31 ) 0.038* (1.65 )LIE x After 0.022 (0.71 ) 0.004 (0.21 ) 0.001 (0.018)Accounting expert -0.00 I (-0.96) -0.000 (-0.11 ) 0.001 (0.44 )Strong governance -0.000 (-0.25) 0.003* (I.77) 0.004* ( 1.80)After -0.006** (-2.20) -0.003 (-0.82) 0.003 (0.75)LIE -0.662*** (-4.35) -0.325*** (-3.62) 0.298* (1.75)LIE x Market value 0.031*** (3.22) 0.021 ** (1.97) -0.0 II (-0.74)LIE x Analyst following -0.002 (-0092) -0.011 (-0.80) -0.009 (-0.34 )LIE x Leverage 0.220** (2.26) -0.017 (-0.28) -0.219** (-1.98)LIE x Beta 0.002 (0.12) -0.029** (-2.31) -0.033* (-1.73)LIE x Loss 0.091*** (3.08) 0.137*** (4.30) 0.041 (0.94)LIE x Earnings persistence -0.002 (-0.40) -0.00 I (-1.18) 0.001 (0.22)LIE x Book to market ratio 0.039* (1.83) 0.029* ( 1.78) -0.010 (-0.38)LIE x Top 5 ownership 0.183 (0.85) 0.164* ( 1.68) -0.026 (-0.12)LIE x CEO Tenure 0.000 (0.060) -0.00 I (-0.77) -0.001 (-0.60)Intercept 0.000 (0.07) 0.007* ** (2.64) -0.007 (-1.59)Observations 10,171 6,380Adjusted R2 0.04 0.03
Panel C: Accruals QualityAccounting expert x After -0.005 (-1.02) 0.003 (0.95) -0.008 (-1.38)Accounting expert -0.004 * (-1.65) 0.000 (0.11 ) -0.005 (-1.32)Strong governance 0.002 (0.86) -0.002 (-1.12) 0.004 ( 1.38)After 0.004 ( 1.02) 0.006 (1.49) -0.002 (-0.33)Log of assets 0.002** (2.06) 0.002*** (3.63) -0.001 (-0.60)Operating cycle -0.003 (-0.95) -0.000 (-0.25) -0.002 (-0.69)PPE 0.032*** (4.92) 0.025*** (5.62) 0.007 (0.95)oSales -0.003 (-0.58) -0.008* (-1.86) 0.005 (0.69)
oCash flow -0.153*** (-3.42) -0.191 *** (-4.57) 0.038 (0.62)
Loss proportion -0.008 (-1.54) -0.015*** (-2.83) 0.007 (0.93)Sales growth 0.000 (0.90) 0.001 ** (2.05) -0.000 (-0.85)

47
Table 7. (continued).(I) (2) (3)
Prior Expert No Prior ExpertVariable Coeff. I-stat Coeff. I-stat
High litigation industry 0.007*** (2.94) -0.000 (-0.06)Top 5 ownership -0.021 (-1.03) 0.003 (0.24)CEO tenure 0.001** (2.59) 0.000** (1.97)Big four auditor -0.012*** (-2.64) 0.012 (1.40)Intercept -0.027 (-1.49) -0.060*** (-3.67)Observations 528 826Adjusted R2 O. I 9 0.22
Difftrence
0.007**-0.0240.000-0.024**0.033
I-slat
(2.22)
(-1.00)(1.12)(-2.46)(1.37)
This table presents estimates and the associated I-statistics from a set of OLS regressions in tests of Hypothesis 3,where the dependent variable is one of three measures of financial reporting quality. Column (I) is for firms with prioraccounting expertise, column (2) is for lirJllS appointing their first accounting expert to the audit committee. andcolumn (3) summarizes the difference between columns (1) and (2) based on the coefficients for each independentvariable interacted with prior accounting expeltisc in a pooled regression combining the two subsamples.
Panel A uses signed discretional'\' accruals obtained using the modified Jones model in line with Equation (2l. Panel Buses the 3-day cumulative abnormal return surrounding qUaIterly earnings announcements in line with Equation (3).Industry fixed effects interacted with unexpected earnings are included but not reported. Panel C uses the modifiedDechow and Diehev (2002) accrual quality measure calculated on a rolling basis over the prior four years, multipliedby -I in line with Equation (5). Year fixed-effects are included but not reported in all regressions, and continuousvariables are Winsorized at the 1% and 99% levels. *. **, *** indicate statistical significance at two-tailed 10%.5%.and 1% levels. Standard errors are adjusted for clustering within firms (Rogers 1993). Variable descriptions arcprovided in Table 2.
Table 8 presents the results from tests of Hypothesis 3 that consider the strength of
the firm's corporate governance structure when assessing the incremental influence of
prior accounting expertise on future financial reporting quality. The evidence in Panel A
suggests that firms with strong corporate governance transition to more conservative
accruals following the appointment of their first accounting expert, as illustrated by the
significantly negative coefficients on AE * After (t-statistic = -2.11) in Column (1), and
AE * SGav * After (t-statistic = -2.28) in Column (3). However, the coefficients on the
post-appointment interaction terms are not significant in Panel B when the dependent
variable is the earnings response coefficient, suggesting no combined effect for
governance strength and prior accounting expertise. Finally, Panel C provides limited
evidence of an increase in accruals quality following the appointment first accounting
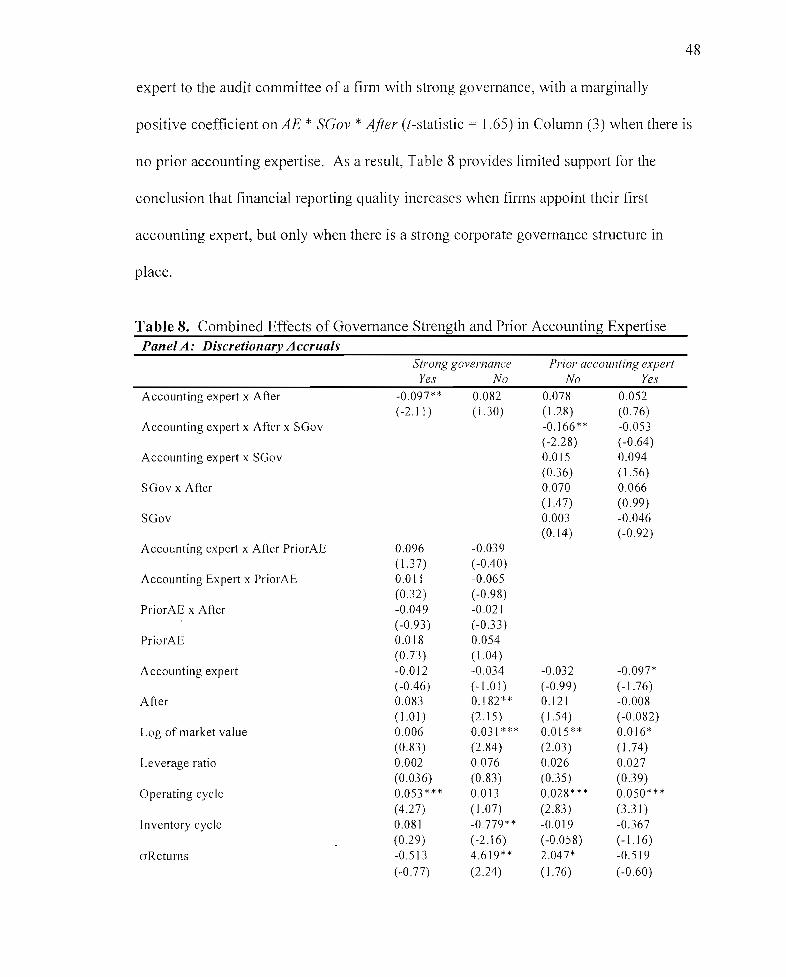
48
expert to the audit committee of a firm with strong governance, with a marginally
positive coefficient on AE * SGov * After (t-statistic = 1.65) in Column (3) when there is
no prior accounting expertise. As a result, Table 8 provides limited support for the
conclusion that financial reporting quality increases when firms appoint their first
accounting expert, but only when there is a strong corporate governance structure in
place.
Table 8. Combined Effects of Governance Strength and Prior Accounting ExpertisePanel A: Discretionary Accruals
Strong governance Prior accounting expertYes No No Yes
Accounting expert x After -0.097** 0.082 0.078 0.052(-2.11 ) (1.30 ) (1.28) (0.76)
Accounting expert x After x SGov -0.166** -0.053(-2.28) (-0.64 )
Accounting expert x SGov 0.015 0.094(0.36) ( 1.56)
SGov x After 0.070 0.066(1.47) (0.99)
SGov 0.003 -0.046(0.14) (-0.92)
Accounting expert x After PriorAE 0.096 -0.039( 1.3 7) (-0.40)
Accounting Expert x PriorAE 0.011 -0.065(0.32) (-0.98)
PriorAE x After -0.049 -0.021(-0.93) (-0.33)
PriorAE 0.018 0.054(0.73) (1.04 )
Accounting expert -0.012 -0.034 -0.032 -0.097*(-0.46) (-1.0 I) (-0.99) (-1.76)
After 0.083 0.182** 0.121 -0.008( 1.0 I) (2.15) (1.54) (-0.082)
Log of market value 0.006 0.031 *** 0.015** 0.016*(0.83) (2.84) (2.03) (1.74)
Leverage ratio 0.002 0.076 0.026 0.027(0.036) (0.83) (0.35) (0.39)
Operating cycle 0.053*** 0.013 0.028*** 0.050***(4.27) ( 1.07) (2.83) (3.31 )
Inventory cycle 0.081 -0.779** -0.019 -0.367(0.29) (-2.16) (-0.058) (-1.16)
oReturns -0.513 4.619** 2.047* -0.519(-0.77) (2.24) ( 1.76) (-0.60)
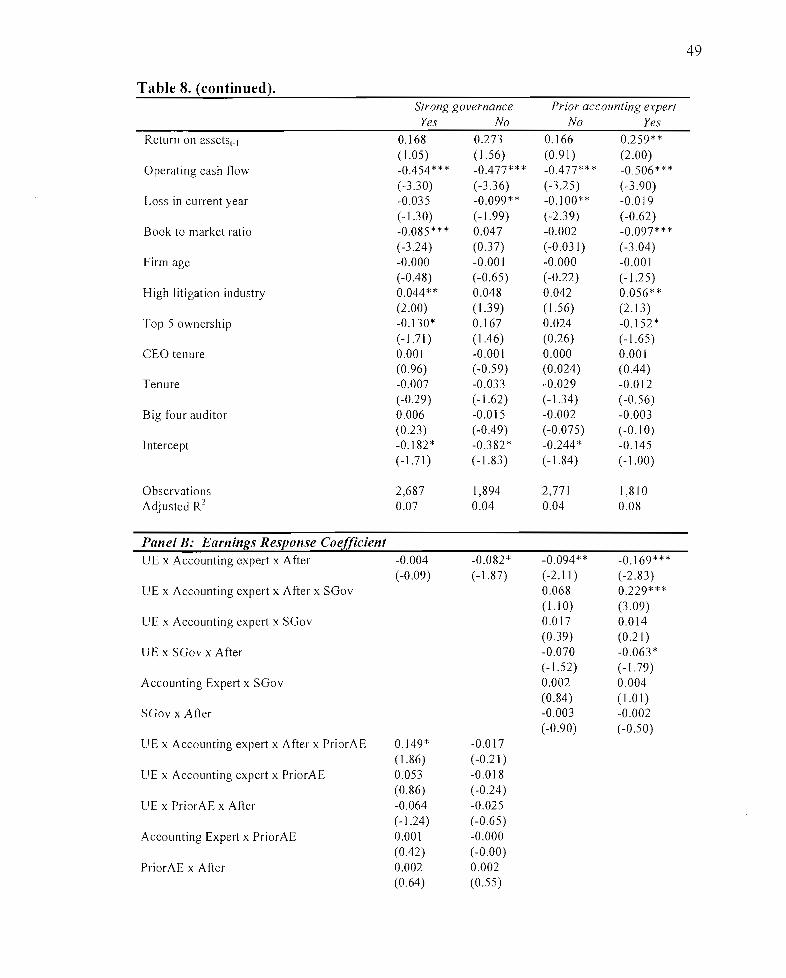
49
Table 8. (continued).Strong governance Prior accounting expert
Yes No No Yes
Return on assets'_1 0.168 0.273 0.166 0.259**(1.05) (1.56) (0.91 ) (2.00)
Operating cash flow -0.454*** -0.477*** -0.477*** -0.506***(-3.30) (-3.36) (-3.25) (-3.90)
Loss in current year -0.035 -0.099** -0.100** -0.019(-1.30) (-1.99) (-2.39) (-0.62)
Book to market ratio -0.085*** 0.047 -0.002 -0.097***(-3.24) (0.37) (-0.031) (-3.04)
Firm age -0.000 -0.001 -0.000 -0.00 I(-0.48) (-0.65) (-0.22) (-1.25)
High litigation industry 0.044** 0.048 0.042 0.056**(2.00) (1.39) ( 1.56) (2.13)
Top 5 ownership -0.130* 0.167 0.024 -0.152*(-1.71) (1.46) (0.26) (-1.65)
CEO tenure 0.001 -0.001 0.000 0.001(0.96) (-0.59) (0.024) (0.44)
Tenure -0.007 -0.033 -0.029 -0.012(-0.29) (-1.62) (-1.34) (-0.56)
Big four auditor 0.006 -0.015 -0.002 -0.003(0.23) (-0.49) (-0.075) (-0.10)
Intercept -0. I82* -0.382* -0.244* -0.145(-1.71) (-1.83) (-1.84) (-1.00)
Observations 2,687 1,894 2,771 1,810Adjusted R2 0.07 0.04 0.04 0.08
Panel B: Earnings Response CoefficientUE x Accounting expert x After -0.004 -0.082* -0.094** -0.169***
(-0.09) (-1.87) (-2.11) (-2.83)UE x Accounting expert x After x SGov 0.068 0.229***
(1.10) (3.09)UE x Accounting expel1 x SGov 0.017 0.014
(0.39) (0.21)UE x SGov x After -0.070 -0.063*
(-1.52) (-1.79)Accounting Expert x SGov 0.002 0.004
(0.84 ) (1.01)SGov x After -0.003 -0.002
(-0.90) (-0.50)UE x Accounting expert x After x PriorAE 0.149* -0.017
(1.86) (-0.21 )UE x Accounting expert x PriorAE 0.053 -0.018
(0.86) (-0.24 )UE x PriorAE x After -0.064 -0.025
(-1.24) (-0.65)Accounting Expel1 x PriorAE 0.001 -0.000
(0.42) (-0.00)PriorAE x After 0.002 0.002
(0.64) (0.55)
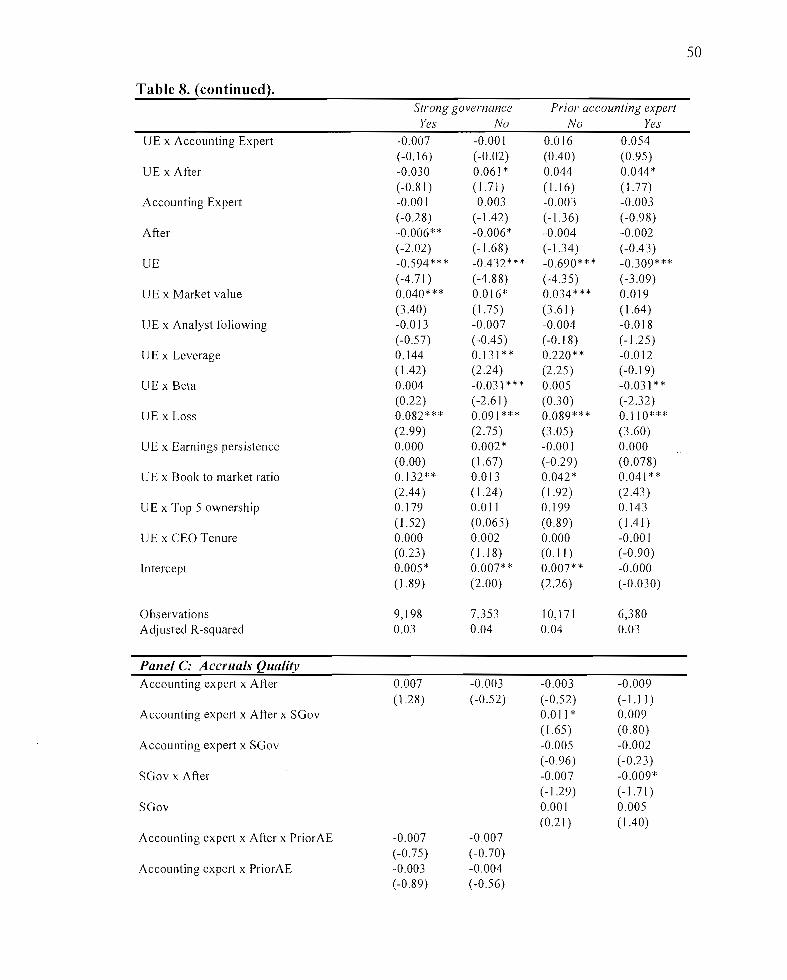
50
Table 8. (continued).Strong governance Prior accounting expert
Yes No No Yes
UE x Accounting Expert -0.007 -0.001 0.016 0.054(-0.16) (-0.02) (OAO) (0.95)
UE x After -0.030 0.061 * 0.044 0.044*(-0.81) (1.71 ) (1.16) (1.77)
Accounting Expert -0.001 -0.003 -0.003 -0.003(-0.28) (-1.42) (-1.36) (-0.98)
After -0.006** -0.006* -0.004 -0.002(-2.02) (-1.68) (-1.34) (-OA3)
UE -0.594*** -OA32*** -0.690* ** -0.309***(-4.71 ) (-4.88) (-4.35) (-3.09)
UE x Market value 0.040*** 0.016* 0.034*** 0.019(3 AO) (1.75) (3.61 ) (1.64 )
UE x Analyst following -0.013 -0.007 -0.004 -0.018(-0.57) (-OA5) (-0.18) (-1.25)
UE x Leverage 0.144 0.131 ** 0.220** -0.012(1.42 ) (2.24 ) (2.25 ) (-0.19)
UE x Beta 0.004 -0.03] *** 0.005 -0.03]**(0.22) (-2.61) (0.30) (-2.32)
UE x Loss 0.082*** 0.091 *** 0.089*** 0.] 10***(2.99) (2.75) (3.05) (3.60)
UE x Earnings persistence 0.000 0.002* -0.001 0.000(0.00) ( 1.67) (-0.29) (0.078)
UE x Book to market ratio 0.132** 0.013 0.042* 0.041 **(2 A4) (1.24) (1.92) (2A3 )
UE x Top 5 ownership 0.179 O.OJ J 0.199 0.143(1.52) (0.065) (0.89) (I A])
UE x CEO Tenure 0.000 0.002 0.000 -0.001(0.23) (1.18) (0.1 ] ) (-0.90)
Intercept 0.005* 0.007** 0.007** -0.000( 1.89) (2.00) (2.26) (-0.030)
Observations 9,198 7,353 10,]71 6,380Adjusted R-squared 0.03 0.04 0.04 0.03
Panel C: Accruals QualityAccounting expert x After 0.007 -0.003 -0.003 -0.009
(] .28) (-0.52) (-0.52) (-l.Jl)Accounting expert x After x SGov 0.011 * 0.009
( 1.65) (0.80)Accounting expert x SGov -0.005 -0.002
(-0.96 ) (-0.23)SGov x After -0.007 -0.009*
(-1.29) (-1.71)SGov 0.001 0.005
(0.21 ) ( lAO)Accounting expert x After x PriorAE -0.007 -0.007
(-0.75) (-0.70)Accounting expert x PriorAE -0.003 -0.004
(-0.89) (-0.56)
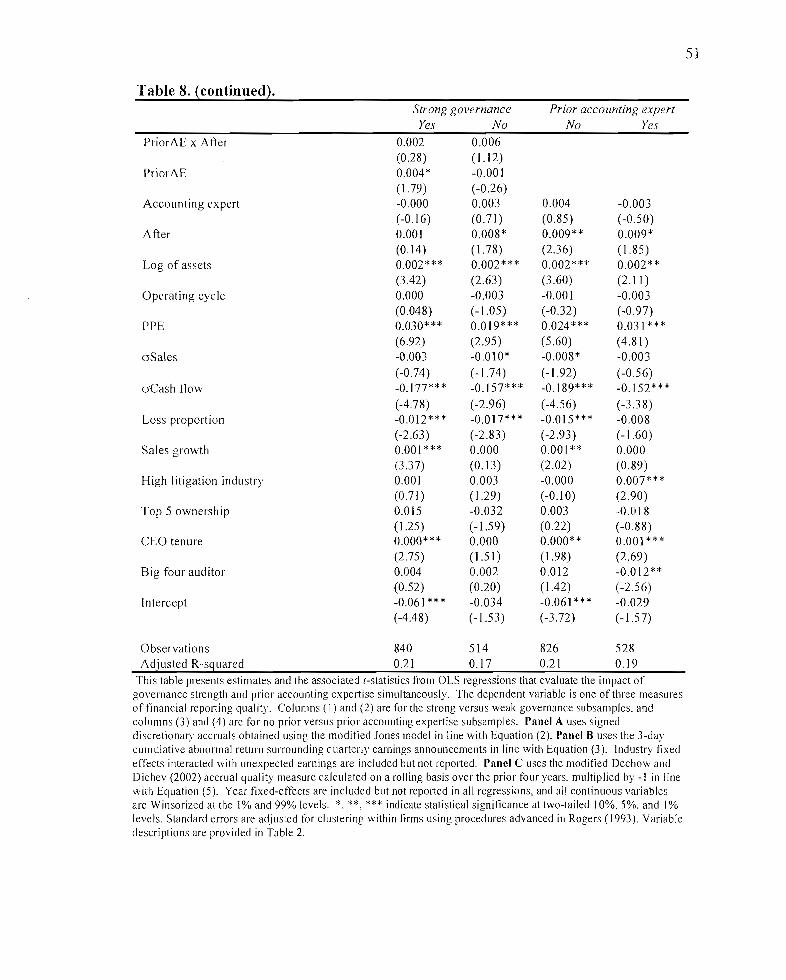
51
Table 8. (continued).Strong governance Prior accounting expert
Yes No No Yes
PriorAE x After 0.002 0.006(0.28) (1.12)
PriorAE 0.004* -0.001(1.79) (-0.26)
Accounting expert -0.000 0.003 0.004 -0.003(-0.16) (0.71 ) (0.85) (-0.50)
After O.OOl 0.008* 0.009** 0.009*(0.14) (1.78) (2.36) (1.85)
Log of assets 0.002*** 0.002*** 0.002*** 0.002**(3.42) (2.63) (3.60) (2.11 )
Operating cycle 0.000 -0.003 -0.001 -0.003(0.048) (-1.05) (-0.32) (-0.97)
PPE 0.030* ** 0.019*** 0.024*** 0.031***(6.92) (2.95) (5.60) (4.81)
oSales -0.003 -0.010* -0.008* -0.003(-0.74) (-1.74) (-1.92) (-0.56)
oCash flow -0.177*** -0.157*** -0.189** * -0.152***(-4.78) (-2.96) (-4.56) (-3.38)
Loss proportion -0.012*** -0.017*** -0.015*** -0.008(-2.63) (-2.83) (-2.93) (-1.60)
Sales growth 0.001*** 0.000 0.001** 0.000(3.37) (0.13) (2.02) (0.89)
High litigation industry 0.001 0.003 -0.000 0.007***(0.71 ) (1.29) (-0.10) (2.90)
Top 5 ownership 0.015 -0.032 0.003 -0.018(1.25) (-1.59) (0.22) (-0.88)
CEO tenure 0.000*** 0.000 0.000** 0.001 ***(2.75) (1.51) (1.98) (2.69)
Big four auditor 0.004 0.002 0.012 -0.012**(0.52) (0.20) (1.42) (-2.56)
Intercept -0.061*** -0.034 -0.061*** -0.029(-4.48) (-1.53) (-3.72) (-1.57)
Observations 840 514 826 528Adjusted R-squared 0.21 0.17 0.21 0.19
This table presents estimates and the associated I-statistics from OLS regressions that evaluate the impact ofgovernance strength and prior accounting expertise simultaneously. The dependent variable is one of three measuresof financial reporting quality. Columns (I) and (2) are for the strong versus weak governance subsamples. andcolumns (3) and (4) are for no prior versus prior accounting expertise subsamples. Panel A uses signeddiscretionary accruals obtained using the modified .Iones model in line with Equation (2). Panel B uses the 3-daycumulative abnormal return surrounding quarterly ealllings announcements in line with Equation (3). Industry fixedeffects interacted with unexpected earnings are included but not reported. Panel C uses the modified Dechow andDichev (2002) accrual quality measure calculated on a rolling basis over the prior four years. multiplied by -1 in linewith Equation (5). Year fixed-effects are included but not reported in all regressions, and all continuous variablesare Winsorized at the 1% and 99% levels. *. ** *** indicate statistical significance at two-tailed 10%,5%, and 1%levels. Standard errors are adjusted for clustering within firms using procedures advanced in Rogers (1993). Variabledescriptions are provided in Table 2.
52
To summarize, the results in Table 5 provide no evidence of an average increase in
financial reporting quality following the appointment of an accounting expert to the audit
committee. This suggests that appointing an accounting expert, in and of itself, is not
associated with discernible improvements in the financial reporting decisions made by
managers. However, the evidence in Table 6 suggests that firms with strong governance
experience larger increases in financial reporting quality than firms with weak
governance following the appointment of an accounting expert. More specifically, I find
that strong governance firms that appoint an accounting expert substitute to more income
decreasing discretionary accruals, and have larger increases in earnings response
coefficients and accruals quality following the appointment than finns with weak
governance structures. These results suggest that accounting expertise is most effective
at improving financial reporting quality when the firm maintains a governance structure
that is able to make good use of the expertise (DeFond et al. 2005).
Finally, Table 7 documents that firms appointing their first accounting expert do not
experience larger improvements in financial reporting quality than firms adding to the
number of accounting expelis on the audit committee. However, the evidence presented
in Table 8 suggests that when there is a strong governance structure in place, appointing
the first accounting expert to the audit committee is associated with substitution to more
conservative and higher quality accruals following the appointment. Therefore, these
results suggest that a strong corporate governance structure provides a necessary
condition for finns introducing accounting expertise to experience increases in financial
reporting quality following the appointment.
53
CHAPTER VI
ROBUSTNESS CHECKS AND SENSITIVITY TESTS
Within Group Changes in Financial Reporting Quality
In separate analyses, I re-perform my primary tests on a restricted sample of firms
only appointing accounting experts to their audit committee to investigate the within-
group variation over time. 17 In these tests, the post-appointment variable (After) captures
the change in financial reporting quality with respect to the pre-appointment period.
Untabulated results suggest no improvement, on average, in financial reporting quality
for firms that appoint an accounting expert, in line with the evidence presented in Table
4. Table 9 presents results for modified tests of Hypothesis 2 (Columns 1 through 3) and
Hypothesis 3 (Columns 4 through 6) using this accowlting expert sample, where the
dependent variable is discretionary accruals (Panel A) and accruals quality (Panel B).
The evidence in Panel A suggests that finns with strong governance utilize more
income-decreasing accruals following the appointment than firms with weak governance,
as indicated by the significantly negative coefficient on After (t-statistic = -1.70) in
Column (3). Furthennore, the results presented in Panel B indicate that finns with strong
governance increase their accruals quality following the appointment, as shown by the
significantly positive coefficient on After (t-statistic = 1.71) in Column (1). Therefore,
the evidence in both panels support the findings from Table 6. Finally, in contrast to the
evidence in Table 7, I find evidence that finns appointing their first accounting expert
17 Given the possibility for selection bias, I utilize the 2-step approach advanced by Heckman (1979).Details of these procedures are included in Appendix A.
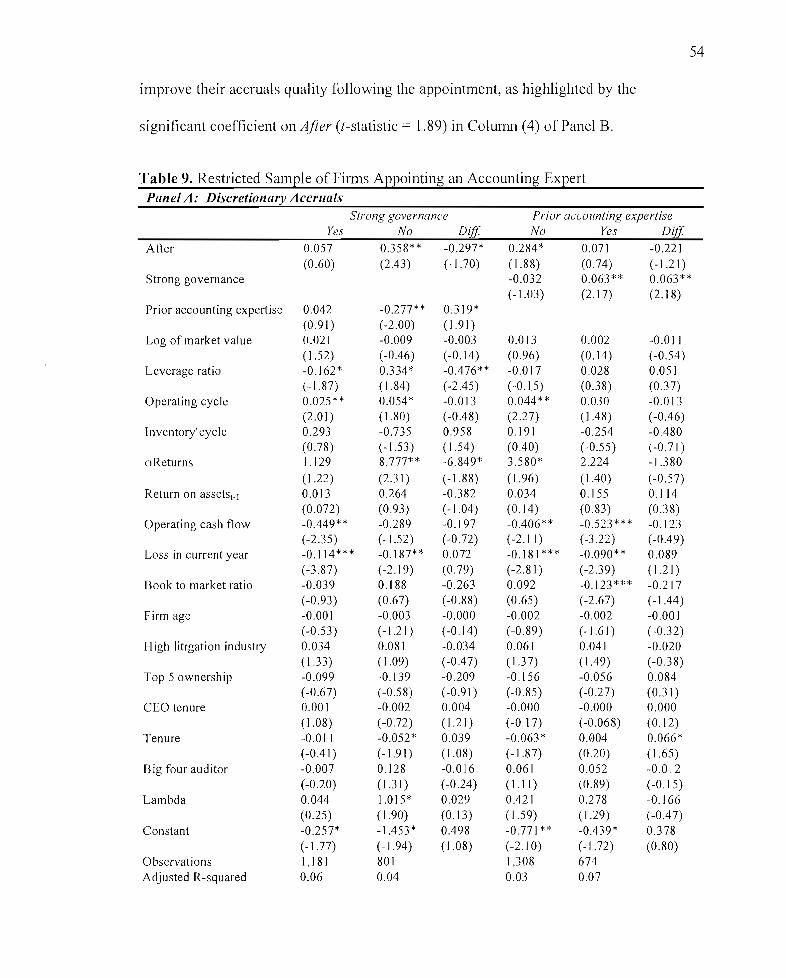
54
improve their accruals quality following the appointment, as highlighted by the
significant coefficient on Afier (t-statistic = 1.89) in Column (4) of Panel B.
Table 9. Restricted Sample of Firms Appointing an Accounting ExpertPanel A: Discretionary Accruals
Strong governance Prior accounting expertiseYes No Diff No Yes Diff
After 0.057 0.358** -0.297* 0.284* 0.071 -0.221(0.60) (2.43) (-1.70) (1.88) (0.74) (-1.21)
Strong governance -0.032 0.063** 0.063**(-1.03) (2.17) (2.18)
Prior accounting expertise 0.042 -0.277** 0.319*(0.91 ) (-2.00) (1.91 )
Log of market value 0.021 -0.009 -0.003 0.013 0.002 -0.011( 1.52) (-0.46) (-0.14) (0.96) (0.14) (-0.54)
Leverage ratio -0.162* 0.334* -0.476** -0.017 0.028 0.051(-1.87) ( 1.84) (-2.45) (-0.15) (0.38) (0.37)
Operating cycle 0.025** 0.054* -0.013 0.044** 0.030 -0.013(2.01 ) ( 1.80) (-0.48) (2.27) (1 .48) (-0.46)
Inventory' cycle 0.293 -0.735 0.958 0.191 -0.254 -0.480(0.78) (-1.53) (1.54) (0.40) (-0.55) (-0.71)
oReturns 1.129 8.777** -6.849* 3.580* 2.224 -1.380
( 1.22) (2.3 I) (-1.88) (1.96) ( 1.40) (-0.57)Return on assetst_1 0.013 0.264 -0.382 0.034 0.155 0.114
(0.072) (0.93) (-1.04) (0.14) (0.83) (0.38)Operating cash flow -0.449** -0.289 -0.197 -0.406** -0.523*** -0.123
(-2.35) (-1.52) (-0.72) (-2.] 1) (-3.22) (-0.49)Loss in current year -0.114*** -0.187** 0.072 -0.181*** -0.090* * 0.089
(-3.87) (-2.19) (0.79) (-2.81) (-2.39) (1.21 )Book to market ratio -0.039 0.188 -0.263 0.092 -0.123*** -0.217
(-0.93) (0.67) (-0.88) (0.65) (-2.67) (-1.44 )Firm age -0.001 -0.003 -0.000 -0.002 -0.002 -0.001
(-0.53) (-1.21) (-0.14) (-0.89) (-1.61) (-0.32)High litigation industry 0.034 0.081 -0.034 0.061 0.041 -0.020
( 1.33) ( 1.09) (-0.47) ( 1.3 7) (1.49) (-0.38)Top 5 ownership -0.099 -0.139 -0.209 -0.156 -0.056 0.084
(-0.67) (-0.58) (-0.91 ) (-0.85) (-0.27) (0.31 )CEO tenure 0.001 -0.002 0.004 -0.000 -0.000 0.000
(1.08) (-0.72) (1.21) (-0.17) (-0.068) (0.12)Tenure -0.011 -0.052 * 0.039 -0.063 * 0.004 0.066*
(-0.41) (-1.91) (1.08) (-1.87) (0.20) ( 1.65)Big four aud itor -0.007 0.128 -0.016 0.061 0.052 -0.0] 2
(-0.20) (1.31) (-0.24 ) (1.1 1) (0.89) (-0.15)Lambda 0.044 1.015 * 0.029 0.421 0.278 -0.166
(0.25) ([ .90) (0.13) ( 1.59) ( 1.29) (-0.4 7)Constant -0.257* -1.453* 0.498 -0.771 ** -0.439* 0.378
(-1.77) (-1.94) (1.08) (-2.10) (-1.72) (0.80)Observations 1,181 801 1,308 674
Adjusted R-squared 0.06 0.04 0.03 0.07
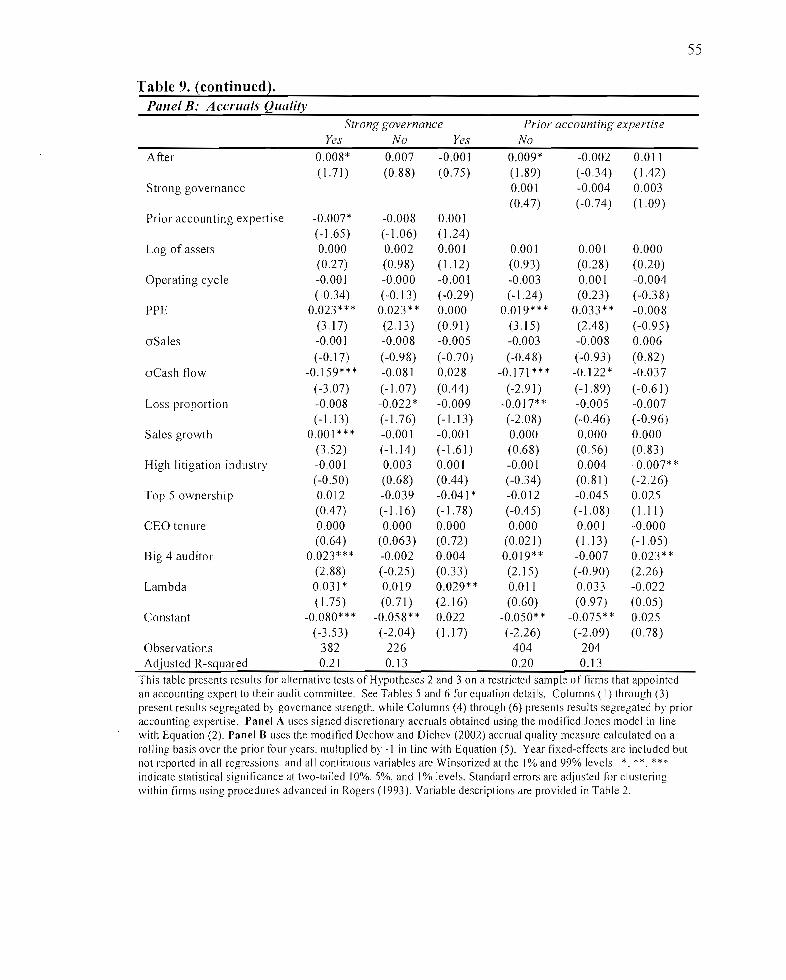
Table 9. (continued).Panel B: Accruals Quality
55
Strong governance Prior accounting expertiseYes No Yes No
After 0.008* 0.007 -0.001 0.009* -0.002 0.011(1.71) (0.88) (0.75) (1.89) (-0.34) ( 1.42)
Strong governance 0.001 -0.004 0.003(0.47) (-0.74) (1.09)
Prior accounting expertise -0.007* -0.008 0.001(-1.65) (-1.06) ( 1.24)
Log of assets 0.000 0.002 0.001 0.001 0.001 0.000(0.27) (0.98) (1.12) (0.93) (0.28) (0.20)
Operating cycle -0.001 -0.000 -0.001 -0.003 0.001 -0.004(-0.34) (-0.13) (-0.29) (-1.24) (0.23) (-0.38)
PPE 0.023*** 0.023** 0.000 0.019*** 0.033** -0.008(3.17) (2.13) (0.91 ) (3.15) (2.48) (-0.95)
aSales -0.001 -0.008 -0.005 -0.003 -0.008 0.006
(-0.17) (-0.98) (-0.70) (-0.48) l-0.93) (0.82)aCash flow -0.159*** -0.081 0.028 -0.171 ** * -0.122* -0.037
(-3.07) (-1.07) (0.44) (-2.91) (-1.89) (-0.61)Loss proportion -0.008 -0.022 * -0.009 -0.017** -0.005 -0.007
(-1.13) (-1.76) (-l.l3) (-2.08) (-0.46) (-0.96)Sales growth 0.001 *** -0.001 -0.001 0.000 0.000 0.000
(3.52) (-1.14) (-1.61 ) (0.68) (0.56) (0.83 )High litigation industry -0.001 0.003 0.001 -0.001 0.004 -0.007* *
(-0.50) (0.68) (0.44 ) (-0.34) (0.81 ) (-2.26)Top 5 ownership 0.012 -0.039 -0.041 * -0.012 -0.045 0.025
(0.47) (-1.16) (-1.78) (-0.45) (-1.08) (l.ll)CEO tenure 0.000 0.000 0.000 0.000 0.001 -0.000
(0.64) (0.063) (0.72) (0.021 ) (1.13) (-1.05)Big 4 auditor 0.023*** -0.002 0.004 0.019** -0.007 0.023**
(2.88) (-0.25) (0.33) (2.15) (-0.90) (2.26)Lambda 0.031 * 0.019 0.029** 0.011 0.033 -0.022
( 1.75) (0.71 ) (2.16) (0.60) (0.97) (0.05)Constant -0.080*** -0.058** 0.022 -0.050* * -0.075 ** 0.025
(-3.53) (-2.04) (1.17) (-2.26) (-2.09) (0.78)Observations 382 226 404 204Adjusted R-squared 0.21 0.13 0.20 0.13
This table presents results for alternative tests of Hypotheses 2 and 3 on a restricted sample offirms that appointedan accounting expert to theil' audit committee. See Tables 5 and 6 for equation details. Columns (I) through (3)present results segregated by governance strength. while Columns (4) through (6) presents results segregated by prioraccounting expertise. Panel A uses signed discretionary accruals obtained using the modified Jones model in linewith Equation (2). Panel B uses the modified Dechow and Dichev (2002) accrual quality measure calculated on arolling basis over the prior four years. multiplied by -1 in line with Equation (5). Year fixed-effects are included butnot reported in all regressions. and all continuous variables are Winsorized at the 1% and 99% levels. *. ** ***indicate statistical significance at two-tailed 10%. 5%. and 1% levels. Standard errors are adjusted for clusteringwithin firms using procedures advanced in Rogers (1993). Variable descriptions are provided in Table 2.

56
Separate Analysis of Governance Measure Components
My tests of Hypothesis 2 rely on a composite governance measure that combines
several aspects of a firm's governance structure including board and audit committee
characteristics, as well as the fraCtion of institutional ownership. To identifY the specific
governance components associated with changes in financial repoliing quality following
the appointment of an accounting expert, I evaluate each of the five components of my
governance proxy (SGov) on an individual basis while re-performing tests of Hypothesis
2. Table 10 presents the results ofthis analysis. The evidence suggests that
improvements in financial reporting quality following the appointment of an accounting
expert are concentrated in firms with a large number of board members holding multiple
outside directorships in terms of both discretionary accruals (Panel A) and accruals
quality (Panel B), as highlighted by the significant coefficients on AE x After in Column
(6) of each panel (t-statistics = -2.22 and 3.05, respectively). One interpretation of these
results is that these directors with multiple board appointments have more reputation
capital at stake, and are therefore more likely to act on recommendations made by
accounting experts to limit the likelihood of financial reporting failures such as an
accounting restatement. Alternatively, a second possibility is that mUltiple directorships
are a sign of high ability (Kaplan and Reishus 1990).
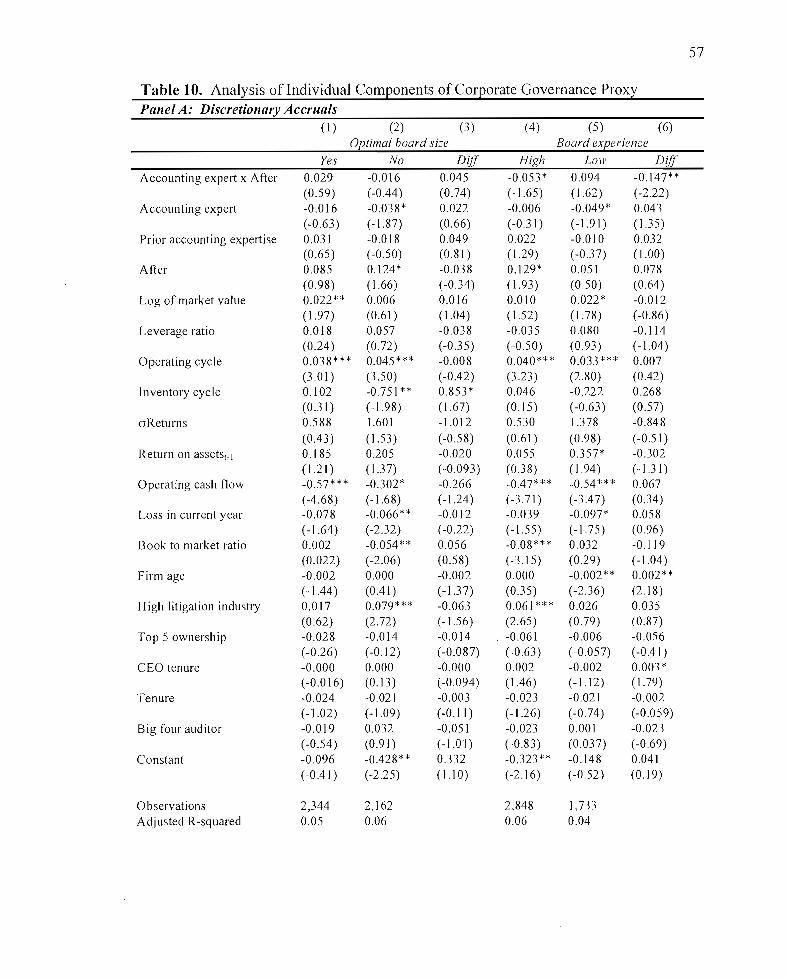
57
Table 10. Analysis of Individual Components of Corporate Governance ProxyPanel A: Discretionary Accruals
(I) (2) (3) (4) (5) (6)Optimal board size Board experience
Yes No DifJ High Low DifJAccounting expert x After 0.029 -0.016 0.045 -0.053* 0.094 -0.147**
(0.59) (-0044 ) (0.74 ) (-1.65) (1.62 ) (-2.22)Accounting expert -0.016 -0.038* 0.022 -0.006 -0.049* 0.043
(-0.63) (-1.87) (0.66) (-0.31) (-1.91) ( 1.35)Prior accounting expertise 0.03] -0.018 0.049 0.022 -0.0 10 0.032
(0.65) (-0.50) (0.81 ) (1.29) (-0.37) (1.00)After 0.085 0.124* -0.038 0.129* 0.05l 0.078
(0.98) (1.66) (-0.34) (1.93) (0.50) (0.64 )Log of market value 0.022** 0.006 0.016 0.010 0.022* -0.012
(1.97) (0.61) (1.04 ) (1.52) ( 1.78) (-0.86)Leverage ratio 0.018 0.057 -0.038 -0.035 0.080 -0.114
(0.24 ) (0.72) (-0.35) (-0.50) (0.93) (-1.04)Operating cycle 0.038*** 0.045*** -0.008 0.040*** 0.033*** 0.007
(3.0 I) (3.50) (-0042) (3.23) (2.80) (0042)Inventory cycle 0.102 -0.751 ** 0.853 * 0.046 -0.222 0.268
(0.31 ) (-1.98) (1.67) (0.15) (-0.63 ) (0.57)crReturns 0.588 1.601 -1.012 0.530 1.378 -0.848
(0043) (1.53 ) (-0.58) (0.61 ) (0.98) (-0.51)Return on assetst_1 0.185 0.205 -0.020 0.055 0.357* -0.302
(1.21) (1.37) (-0.093) (0.38) (1.94 ) (-1.31)Operating cash flow -0.57*** -0.302* -0.266 -0047*** -0.54*** 0.067
(-4.68) (-1.68) (-1.24) (-3.71 ) (-3047) (0.34 )Loss in current year -0.078 -0.066** -0.012 -0.039 -0.097* 0.058
(-1.64) (-2.32) (-0.22) (-1.55) (-1.75) (0.96)Book to market ratio 0.002 -0.054** 0.056 -0.08*** 0.032 -0.119
(0.022) (-2.06) (0.58) (-3.15) (0.29) (-1.04)Firm age -0.002 0.000 -0.002 0.000 -0.002** 0.002**
(-1044 ) (0 041) (-1.37) (0.35) (-2.36) (2.18 )High litigation industry 0.017 0.079*** -0.063 0.061 *** 0.026 0.035
(0.62) (2.72) (-1.56) (2.65) (0.79) (0.87)Top 5 ownership -0.028 -0.014 -0.014 . -0.061 -0.006 -0.056
(-0.26) (-0.12) (-0.087) (-0.63) (-0.057) (-0041)CEO tenure -0.000 0.000 -0.000 0.002 -0.002 0.003*
(-0.016) (0.13) (-0.094) (1046) (-1.12) (1.79)Tenure -0.024 -0.021 -0.003 -0.023 -0.021 -0.002
(-1.02) (-1.09) (-0.11 ) (-1.26) (-0.74) (-0.059)Big four aud itor -0.019 0.032 -0.051 -0.023 0.001 -0.023
(-0.54 ) (0.91 ) (-1.01) (-0.83) (0.037) (-0.69)Constant -0.096 -00428** 0.332 -0.323 ** -0.148 0.041
(-0 AI) (-2.25) (1.10) (-2.16) (-0.52) (0.19)
Observations 2,344 2,162 2,848 1,733Adjusted R-squared 0.05 0.06 0.06 0.04
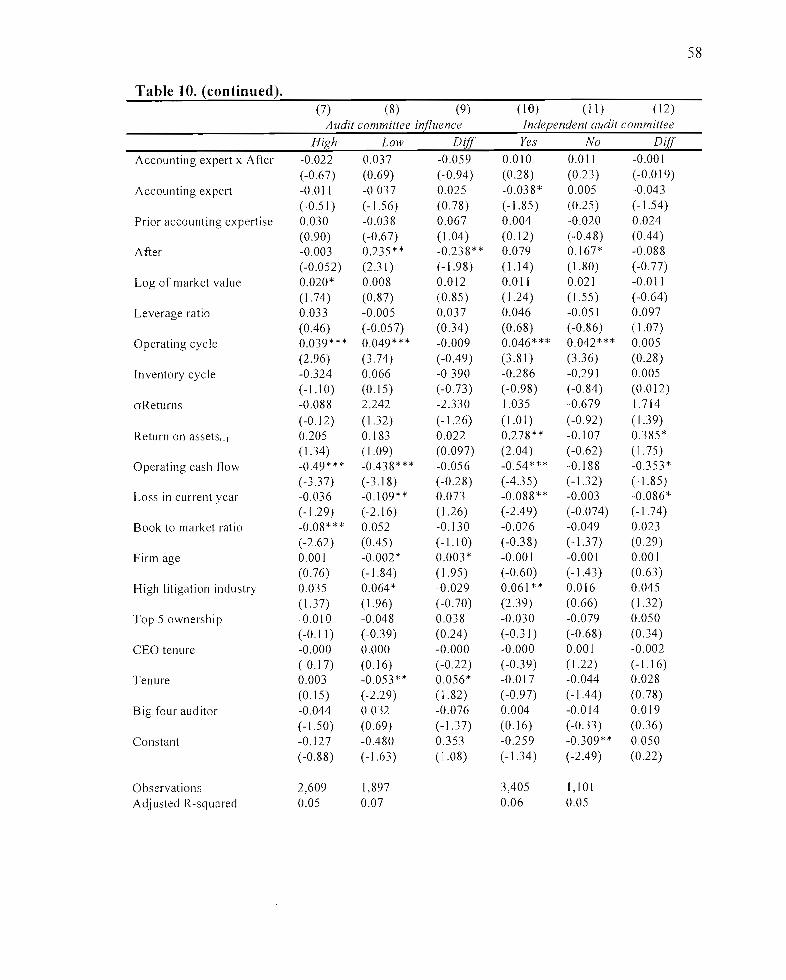
58
Table 10. (continued).(7) (8) (9) (10) (11 ) ( 12)
Audit committee influence Independent audit committee
High Low DifJ Yes No Dif(
Accounting expert x After -0.022 0.037 -0.059 0.010 0.011 -0.001(-0.67) (0.69) (-0.94) (0.28) (0.23 ) (-0.019)
Accounting expert -0.011 -0.037 0.025 -0.038* 0.005 -0.043(-0.51) (-1.56) (0.78) (-1.85) (0.25) (-1.54)
Prior accounting expertise 0.030 -0.038 0.067 0.004 -0.020 0.024(0.90) (-0.67) (1.04 ) (0.12) (-0.48) (0.44)
After -0.003 0.235** -0.238** 0.079 0.167* -0.088(-0.052) (2.31 ) (-1.98) (1.14) (1. 80) (-0.77)
Log of market value 0.020* 0.008 0.012 0.011 0.021 -0.011(1.74) (0.87) (0.85) (1.24) (1.55) (-0.64)
Leverage ratio 0.033 -0.005 0.037 0.046 -0.051 0.097(0.46) (-0.057) (0.34) (0.68) (-0.86) (1.07)
Operating cycle 0.039*** 0.049*** -0.009 0.046*** 0.042*** 0.005(2.96) (3.74) (-0.49) (3.81) (3.36) (0.28)
Inventory cyc Ie -0.324 0.066 -0.390 -0.286 -0.291 0.005(-l.l0) (0.15) (-0.73) (-0.98) (-0.84 ) (0.012)
aReturns -0.088 2.242 -2.330 1.035 -0.679 1.714(-0.12) (1.32) (-1.26) (1.01) (-0.92) ( 1.39)
Return on assets'_1 0.205 0.183 0.022 0.278** -0.107 0.385*( 1.34) (1.09) (0.097) (2.04) (-0.62) (1.75)
Operating cash flow -0.49*** -0.438 *** -0.056 -0.54*** -0.188 -0.353*(-3.37) (-3.18) (-0.28) (-4.35) (-1.32) (-1.85)
Loss in current year -0.036 -0.109** 0.073 -0.088 ** -0.003 -0.086*(-1.29) (-2.16) (1.26) (-2.49) (-0.074) (-1.74)
Book to market ratio -0.08*** 0.052 -0.130 -0.026 -0.049 0.023(-2.62) (0.45) (-1.10) (-0.38) (-1.3 7) (0.29)
Firm age 0.001 -0.002* 0.003* -0.001 -0.001 0.001(0.76) (-1.84) (1.95) (-0.60) (-1.43) (0.63)
High litigation industry 0.035 0.064* -0.029 0.061** 0.016 0.045(1.37) (1.96) (-0.70) (2.39) (0.66) (1.32)
Top 5 ownership -0.010 -0.048 0.038 -0.030 -0.079 0.050(-0.11 ) (-0.39) (0.24) (-0.31 ) (-0.68) (0.34)
CEO tenure -0.000 0.000 -0.000 -0.000 0.001 -0.002(-0.17) (0.16) (-0.22) (-0.39) (1.22) (-1.16)
Tenure 0.003 -0.053** 0.056* -0.017 -0.044 0.028(0.15) (-2.29) (1.82) (-0.97) (-1 .44) (0.78)
Big four auditor -0.044 0.032 -0.076 0.004 -0.014 0.019(-1.50) (0.69) (-J .37) (0.16) (-0.33) (0.36)
Constant -0.127 -0.480 0.353 -0.259 -0.309** 0.050(-0.88) (-1.63) ( 1.08) (-1.34) (-2.49) (0.22)
Observations 2,609 1,897 3,405 1,101Adjusted R-squared 0.05 0.07 0.06 0.05
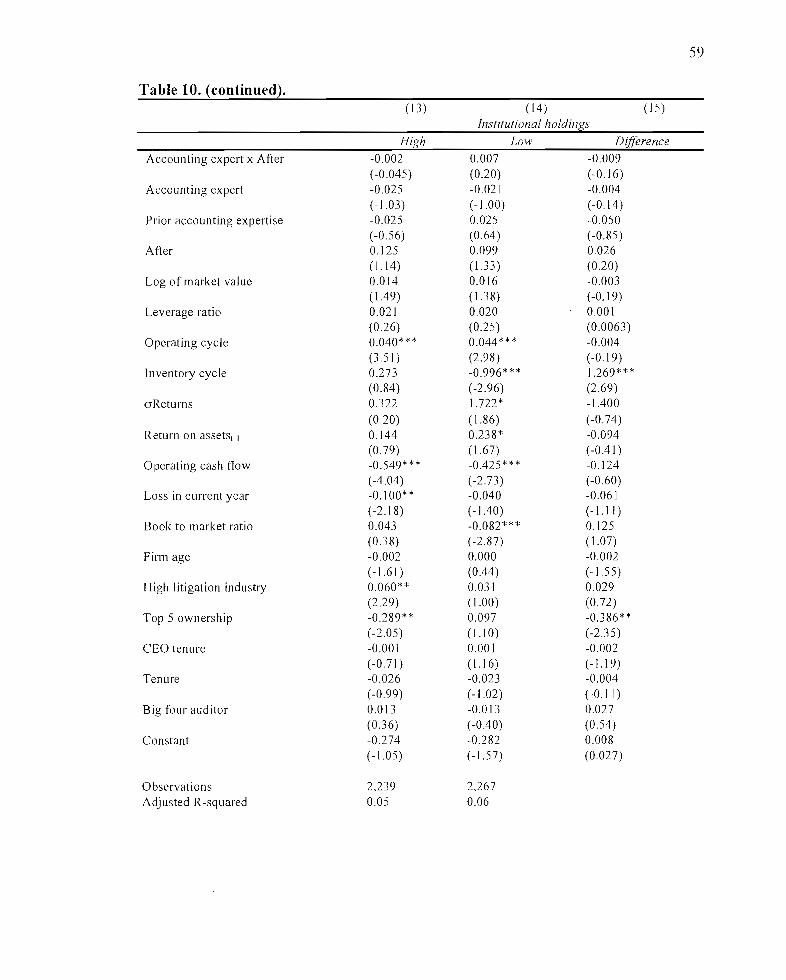
59
Table 10. (continued).( 13) (14 ) (15)
Institutional holdings
High Low Difference
Accounting expert x After -0.002 0.007 -0.009(-0.045) (0.20) (-0.16)
Accounting expert -0.025 -0.02 ] -0.004(-1.03) (-1.00) (-0.14)
Prior accounting expertise -0.025 0.025 -0.050(-0.56) (0.64) (-0.85)
After 0.125 0.099 0.026(J.J4) (1.33 ) (0.20)
Log of market value 0.014 0.016 -0.003( 1.49) ( 1.3 8) (-0.19)
Leverage ratio 0.021 0.020 0.001(0.26) (0.25) (0.0063)
Operating cycle 0.040*** 0.044*** -0.004(3.51 ) (2.98) (-0.19)
Inventory cycle 0.273 -0.996*** 1.269***(0.84 ) (-2.96) (2.69)
aReturns 0.322 1.722* -1.400(0.20) ( 1.86) (-0.74)
Return on assetst_1 0.144 0.238* -0.094(0.79) ( 1.67) (-0.41)
Operating cash flow -0.549*** -0.425*** -0.124(-4.04) (-2.73) (-0.60)
Loss in current year -0.100** -0.040 -0.061(-2.18) (-1.40) (-1.11)
Book to market ratio 0.043 -0.082*** 0.125(0.38) (-2.87) ( 1.07)
Firm age -0.002 0.000 -0.002(-1.61) (0.44) (-1.55)
High litigation industry 0.060** 0.031 0.029(2.29) (1.00) (0.72)
Top 5 ownership -0.289** 0.097 -0.386**(-2.05) (1.10) (-2.35)
CEO tenure -0.001 0.001 -0.002(-0.71) (1.16) (-1.19)
Tenure -0.026 -0.023 -0.004(-0.99) (-1.02) (-0.1 1)
Big four aud itor 0.0 13 -0.0 13 0.027(0.36) (-0.40) (0.54)
Constant -0.274 -0.282 0.008(-1.05) (-1.57) (0.027)
Observations 2,239 2,267Adjusted R-squared 0.05 0.06

60
Table 10. (continued).Panel B: Accruals Quality
( I) (2) (3 ) (4 ) (5) (6)Optimal board size Board experience
Yes No Diff High Low DifJAccounting expert x After -0.005 0.007** -0.OJ2** 0.007** -0.011** 0.018***
(-I.I 7) (I.97) (-2.15) (2.02) (-2.31) (3.05)Accounting expert 0.001 -0.003 0.004 -0.002 -0.001 -0.001
(0.26) (-1.30) (1.05) (-0.92) (-0.18) (-0.39)Prior accounting expertise -0.004 -0.003 -0.001 0.001 0.001 -0.00 I
(-1.l1) (-0.79) (-0.28) (0.40) (0.61 ) (-0.24 )After 0.010*** -0.002 0.011 ** 0.002 0.01 *** -0.009*
(2.59) (-0.42) (2.16) (0.63) (2.8 I) (-I. 77)Log of assets 0.001 0.001 0.000 0.002*** 0.003** -0.001
(1.17) (I.23) (0.17) (2.79) (2.52) (-0.67)Operating cycle -0.001 -0.000 -0.001 0.000 -0.003 0.004
(-0.64) (-0.025) (-0.37) (0.25) (-1.09) (1.07)PPE 0.024*** 0.027*** -0.003 0.029*** 0.02*** 0.006
(4.87) (4.69) (-0.40) (5.75) (3.79) (0.72)oSales -0.005 -0.009* 0.005 -0.005 -0.007 0.002
(-1.03) (-1.94) (0.73) (-1.22) (-1.42) (0.27)oCash flow -0.172*** -0. I57*** -0.016 -0.166*** -0. 18* ** 0.017
(-4.41) (-2.77) (-0.23) (-4.04) (-3.82) (0.27)Loss proportion -0.008* -0.015** 0.006 -0.015*** -0.010* -0.005
(-1.66) (-2.41) (0.79) (-3.09) (-1.70) (-0.62)Sales growth 0.001 0.001 -0.000 0.001 * 0.001 -0.000
(1.64) (1.62 ) (-0.41) (1.88) (1.33 ) (-0.028)High litigation industry 0.003 0.003 0.000 0.002 0.003 -0.001
(1.33) (1.19) (0.034) (1.10) (1.24 ) (-0.29)Top 5 ownership -0.008 0.000 -0.008 -0.008 -0.000 -0.007
(-0.58) (0.02 I) (-0.39) (-0.57) (-0.024) (-0.35)CEO tenure 0.000*** 0.000 0.000 0.000*** 0.000 0.000
(2.60) (1.22) ( 1.05) (3.56) (1.26) (0.79)Big 4 aud itor 0.006 0.007 -0.001 0.005 0.002 0.003
(0.88) (0.56) (-0.059) (0.54) (0.27) (0.22)Constant -0.075*** -0.053** -0.02] -0.067* ** -0.06*** -0.015
(-4.69) (-2.26) (-0.76) (-4.30) (-2.79) (-0.55)
Observations 692 638 825 505Adjusted R-squared 0.17 0.15 0.18 0.19
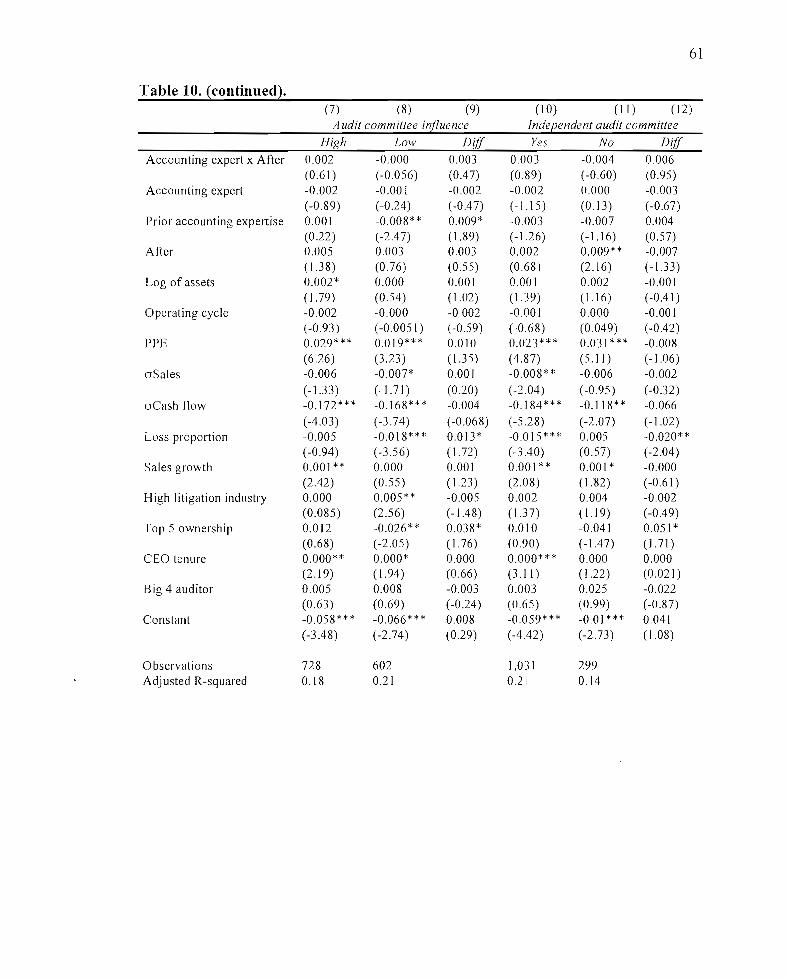
61
Table 10. (continued).(7) (8) (9) (10) (11) (12)
Audit commillee influence Independent audit commillee
High Low DifJ Yes No DifJAccounting expert x After 0.002 -0.000 0.003 0.003 -0.004 0.006
(0.61 ) (-0.056) (0.47) (0.89) (-0.60) (0.95)Accounting expert -0.002 -0.001 -0.002 -0.002 0.000 -0.003
(-0.89) (-0.24) (-OA 7) (-1.15) (0.13) (-0.67)Prior accounting expertise 0.001 -0.008** 0.009* -0.003 -0.007 0.004
(0.22) (-2A7) (1.89) (-1.26) (-1.16) (0.57)After 0.005 0.003 0.003 0.002 0.009** -0.007
(1.38) (0.76) (0.55) (068) (2.16 ) (-1.33)Log of assets 0.002* 0.000 0.001 0.001 0.002 -0.001
( 1.79) (0.54 ) ( 1.02) (1.39) (1.16) (-OA 1)Operating cycle -0.002 -0.000 -0.002 -0.001 0.000 -0.001
(-0.93) (-0.0051 ) (-0.59) (-0.68) (0.049) (-OA2)PPE 0.029*** 0.019*** 0.010 0.023*** 0.031*** -0.008
(6.26) (3.23 ) (1.35) (4.87) (5.11 ) (-1.06)oSales -0.006 -0.007* 0.001 -0.008** -0.006 -0.002
(-1.33) (-1.71) (0.20) (-2.04) (-0.95) (-0.32)oCash flow -0.172*** -0.168* ** -0.004 -0.184*** -0.118** -0.066
(-4.03) (-3.74) (-0.068) (-5.28) (-2.07) (-1.02)Loss proportion -0.005 -0.018*** 0.013* -0.015*** 0.005 -0.020**
(-0.94) (-3.56) (1. 72) (-3 AO) (0.57) (-2.04)Sales growth 0.001 ** 0.000 0.001 0.001** 0.001 * -0.000
(2.42) (0.55) (1.23 ) (2.08 ) (1.82 ) (-0.61 )I-1 igh litigation industry 0.000 0.005** -0.005 0.002 0.004 -0.002
(0.085) (2.56) (-1 A8) (1.37) (1.19) (-0.49)Top 5 ownership 0.012 -0.026** 0.038* 0.010 -0.041 0.051 *
(0.68) (-2.05) (1.76) (0.90) (-1 A7) (1.71)CEO tenure 0.000** 0.000* 0.000 0.000*** 0.000 0.000
(2.19) (1.94 ) (0.66) (3.1 1) ( 1.22) (0.021)Big 4 aud itor 0.005 0.008 -0.003 0.003 0.025 -0.022
(0.63) (0.69) (-0.24 ) (0.65) (0.99) (-0.87)Constant -0.058*** -0.066*** 0.008 -0.059*** -0.01*** 0.041
(-3.48) (-2.74) (0.29) (-4.42) (-2.73) (1.08)
Observations 728 602 1.031 299Adjusted R-squared 0.18 0.21 0.2 ] 0.14

----------------------_._-- ---
62
Table 10. (continued).(13) (14) (15)
Institutional holdings
High Low Difference
Accounting expert x After -0.001 0.004 -0.005(-0.24) (0.97) (-0.85)
Accounting expert -0.001 -0.002 0.002(-0.23) (-0.83) (0.45)
Prior accounting expertise -0.001 -0.007** 0.007(-0.22) (-2.26) (1.3 7)
After 0.007** 0.001 0.006(I. 99) (0.33) ( 1.27)
Log of assets 0.002* 0.000 0.002( 1.79) (0.53) ( 1.17)
Operating cycle 0.003 -0.005** 0.007**
(1.26) (-2.19) (2.53)
PPE 0.039*** 0.010* 0.029***(7.26) ( 1.82) (3.92)
oSales -0.005 -0.007 0.002
(-0.93) (-1.64) (0.30)
oCash flow -0.159*** -0.212 ** * 0.053
(-4.28) (-3.85) (0.79)
Loss proportion -0.011** -0.008 -0.002(-1.98) (-1.64) (-0.31)
Sales growth 0.000 0.001 ** -0.000(1.3 8) (2.40) (-0.83)
High litigation industry 0.004 0.002 0.001( 1.58) (0.99) (0.36)
Top 5 ownership 0.002 -0.001 0.003(0.10) (-0.085) (0.13)
CEO tenure 0.001 *** 0.000 0.000*(2.85) (1.11) (1.74)
Big 4 auditor -0.000 0.012 -0.013(-0.026) ( 1.3 8) (-1.10)
Constant -0.076*** -0.050** * -0.026(-3.94) (-2.89) (-1.00)
Observations 71 J 619AdjustedR-squared 0.16 0.24
Th is table presents results for an analysis of the separate components of my corporate governance proxy as part ofrobustness checks for tests of Hypothesis 2. See Tables 5 for equation details. Panel A uses signed discretionaryaccruals obtained using the modified .Iones model in line with Equation (2). Panel B uses the modified Dechow andDichev (2002) accrual quality measure calculated on a rolling basis over the prior four years. multiplied by -I in linewith Equation (5). Year fixed-effects are included but not reported in all regressions, and all continuous variables areWinsorized at the I% and 99% levels. *. **. ** * indicate statistical significance at two-tailed 10%. 5%. and I% levels.Standard errors are adjusted for clustering within firms using procedures advanced in Rogel's (1993). Variabledescriptions are provided in Table 2.

63
Alternative Definitions of Accounting Expertise
My definition of accounting expertise includes individuals with a variety of financial
backgrounds, and there is the possibility that accounting experts with particular skill sets
will be more effective than others at enhancing the financial reporting system following
the appointment. For example, Carcello et al. (2008) note that having a CPA on the audit
committee relates to fewer earnings management activities. One important distinction
involves individuals with corporate financial backgrounds compared to those with public
accounting experience, because the accounting expertise derives from preparation versus
review of financial statements. As a result, I re-perform my tests of Hypothesis 2
defining accounting expertise based on whether or not the individual has experience in
public accounting, and present the results in Table 11. This procedure highlighted that
approximately 47% of the accounting experts in my sample had experience in public
accounting. Panel A indicates that conclusions from Table 6 are consistent in terms of
changes to more conservative accruals for firms with strong governance for both
definitions of an accounting expert, as highlighted by the negative coefficients on AE x
After in Column (1) (t-statistic = -2.14) and Column (4) (t-statistic = -2.15).
The results in Panel B of Table 11 suggest that firms with strong governance have larger
improvements in accruals quality than firms with weak governance only when the
accounting expert has a background in public accounting, as highlighted by the
significant difference between AE x After (t-statistic = 1.86) in Column (3). One
interpretation of this result is that that experience reviewing financial statements is
associated with audit committee members having a material impact on accruals quality.
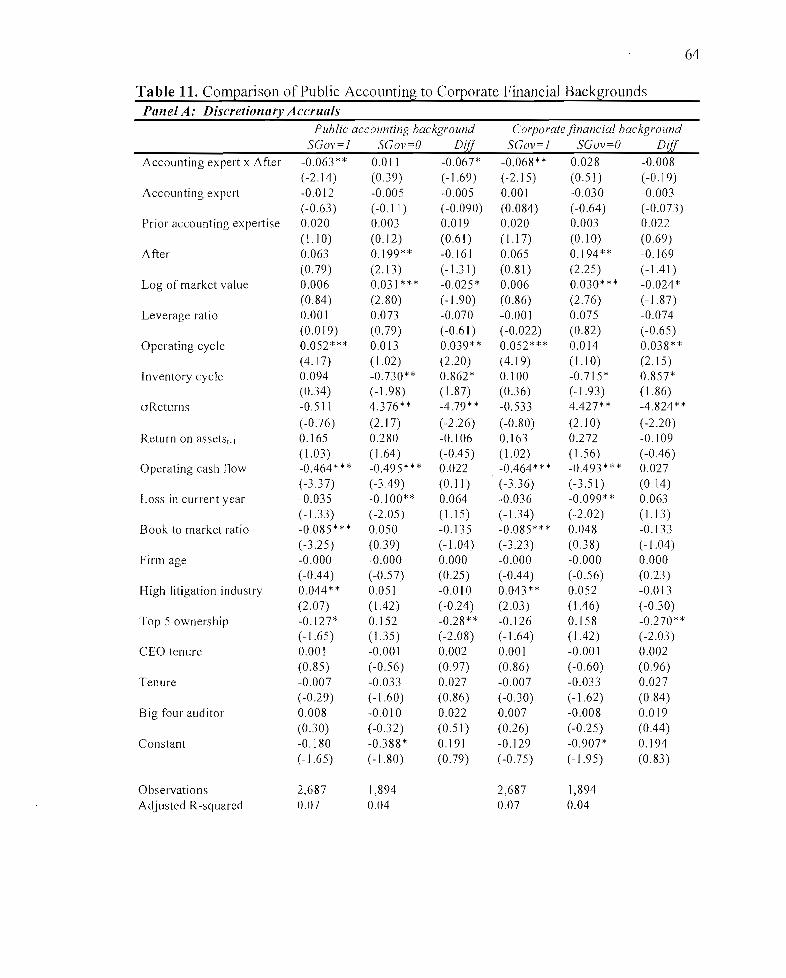
64
Table 11. Comparison of Public Accounting to Corporate Financial BackgroundsPanel A: Discretionary Accruals
Public accounting background Corporate /inanc ial backgroundSGOl'=J SGOl'=O Diff SGov=J SGov=O Diff
Accounting expert x AHer -0.063** 0.011 -0.067* -0.068** 0.028 -0.008(-2.14) (0.39) (-1.69) (-2.15) (0.51 ) (-0.19)
Accounting expert -0.012 -0.005 -0.005 0.001 -0.030 -0.003(-0.63) (-0.1 ]) (-0.090) (0.084) (-0.64 ) (-0.073)
Prior accounting expertise 0.020 0.003 0.019 0.020 0.003 0.022(1.10) (0.12) (0.61 ) (1.17) (0.10) (0.69)
After 0.063 0.199** -0.161 0.065 0.J94** -0.169(0.79) (2.13) (-1.31) (0.81 ) (2.25) (-1.41)
Log of market value 0.006 0.031*** -0.025 * 0.006 0.030* ** -0.024 *(0.84 ) (2.80) (- 1.90) (0.86) (2.76) (-1.87)
Leverage ratio 0.001 0.073 -0.070 -0.001 0.075 -0.074(0.019) (0.79) (-0.61) (-0.022) (0.82) (-0.65)
Operating cycle 0.052*** 0.013 0.039* * 0.052*** 0.014 0.038**(4.17) ( 1.02) (2.20) (4.19) (1.10) (2.15)
Inventory cycle 0.094 -0.730** 0.862* 0.100 -0.715* 0.857*(0.34) (-1.98) (1.87) (0.36) (-1.93) (1.86)
aReturns -0.51 ] 4.376** -4.79** -0.533 4.427** -4.824**(-0.76) (2.17) (-2.26) (-0.80) (2.10) (-2.20)
Return on assetst.1 0.165 0.280 -0.106 0.163 0.272 -0.109(1.03) (1.64) (-0.45) (1.02) (1.56) (-0.46)
Operating cash flow -0.464 ** * -0.495*** 0.022 -0.464*** -0.493*** 0.027(-3.37) (-3.49) (0.11 ) (-3.36) (-3.51) (0. ]4)
Loss in current year -0.035 -0.100** 0.064 -0.036 -0.099** 0.063(-1.33) (-2.05) (1.15) (-1.34) (-2.02) (1.13)
Book to market ratio -0.085*** 0.050 -0.135 -0.085 ** * 0.048 -0.133(-3.25) (0.39) (-1.04) (-3.23) (0.38) (-1.04)
Firm age -0.000 -0.000 0.000 -0.000 -0.000 0.000(-0.44) (-0.57) (0.25) (-0.44) (-0.56) (0.23)
High litigation industry 0.044** 0.051 -0.010 0.043** 0.052 -0.013(2.07) (1.42) (-0.24) (2.03) (1.46) (-0.30)
Top 5 ownership -0.127* 0.152 -0.28** -0.126 0.158 -0.270**(-1.65) (1.35 ) (-2.08) (-1.64) (1.42) (-2.03 )
CEO tenure 0.001 -0.00 I 0.002 0.001 -0.00 I 0.002(0.85) (-0.56) (0.97) (0.86) (-0.60) (0.96)
Tenure -0.007 -0.033 0.027 -0.007 -0.033 0.027(-0.29) (-1.60) (0.86) (-0.30) (-1.62) (0.84 )
Big four auditor 0.008 -0.010 0.022 0.007 -0.008 0.019(0.30) (-0.32) (0.5 I) (0.26) (-0.25) (0.44 )
Constant -0.] 80 -0.388* 0.191 -0.129 -0.907* 0.194(-1.65) (-1.80) (0.79) (-0.75) (-1.95) (0.83)
Observations 2,687 1,894 2,687 1,894Adjusted R-squared 0.07 0.04 0.07 0.04
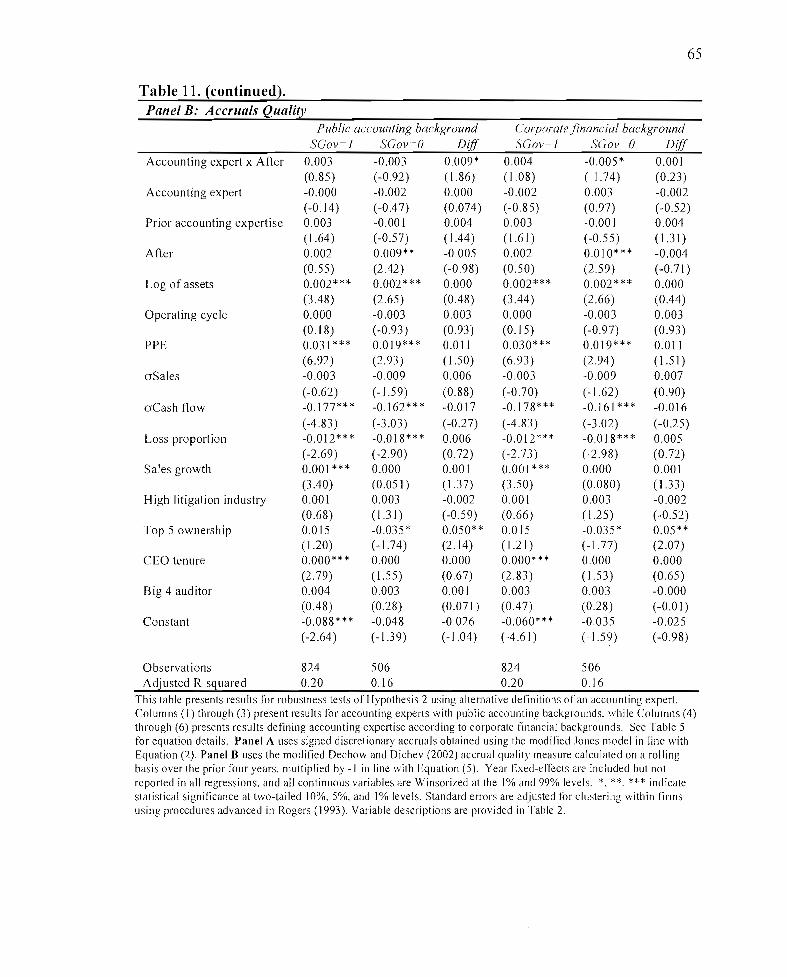
65
Table 11. (continued).Panel B: Accruals Quality
Public accounting background Corporate .financial backgroundSGov=J SGov=O Dir( SGov=J SGov=O D(r(
Accounting expert x After 0.003 -0.003 0.009* 0.004 -0.005 * 0.001(0.85 ) (-0.92) (1. 86) (1.08) (-1.74) (0.23)
Accounting expert -0.000 -0.002 0.000 -0.002 0.003 -0.002(-0.14) (-0.4 7) (0.074) (-085) (0.97) (-0.52)
Prior accounting expertise 0.003 -0.001 0.004 0.003 -0.00 I 0.004(1.64) (-0.57) (1.44) (1.61 ) (-0.55) (1.31)
After 0.002 0.009** -0005 0.002 0.010*** -0.004(0.55) (2.42) (-0.98) (0.50) (2.59) (-0.71 )
Log of assets 0.002*** 0.002*** 0.000 0.002*** 0.002*** 0.000(3.48) (2.65 ) (0.48) (3.44 ) (2.66) (0.44)
Operating cycle 0.000 -0.003 0.003 0.000 -0.003 0.003(0.18) (-0.93 ) (0.93) (0.15) (-0.97) (0.93)
PPE 0.031 *** 0.019*** 0.011 0.030*** 0.019*** 0.011(6.92) (2.93) (1.50) (6.93) (2.94 ) (1.51 )
aSales -0.003 -0.009 0.006 -0003 -0.009 0.007(-0.62) (-1.59) (0.88) (-0.70) (-1.62) (0.90)
aCash flow -0.177** * -0.162*** -0.017 -0.178*** -0.161 *** -0.016(-4.83) (-3.03) (-0.27) (-4.83) (-3.02) (-0.25)
Loss proportion -0.012*** -0.018*** 0.006 -0.012*** -0.018*** 0.005(-2.69) (-2.90) (0.72) (-2.73) (-2.98) (0.72)
Sales growth 0.001 *** 0.000 0.001 0.001 *** 0000 0.001(3.40) (0.051 ) (1.3 7) (3.50) (0080) (1.33 )
High litigation industry 0.001 0.003 -0.002 0.001 0.003 -0.002(0.68) (1.31) (-0.59) (0.66) (1.25) (-0.52)
Top 5 ownership 0015 -0.035 * 0.050** 0.015 -0.035 * 0.05**(1.20) (-1.74) (2.14) (1.21) (-J.77) (2.07)
CEO tenure 0.000*** 0.000 0.000 0.000*** 0.000 0.000(2.79) (1.55) (0.67) (2.83 ) ( 1.53) (0.65)
Big 4 auditor 0.004 0.003 0.001 0.003 0.003 -0.000(0.48) (0.28) (0.071) (0.47) (0.28) (-0.01)
Constant -0.088*** -0.048 -0.026 -0.060*** -0035 -0.025(-2.64) (-1.39) (-1.04) (-4.61) (-1.59) (-0.98)
Observations 824 506 824 506Adjusted R-squared 0.20 0.16 0.20 0.16
This table presents results for robustness tests of Hypothesis 2 using alternative definitions of an accounting expert.Columns (I) through (3) present results for accounting expet1s with public accounting backgrounds. while Columns (4)through (6) presents results defining accounting expertise according to corporate financial backgrounds. See Table 5for equation details. Panel A uses signed discretionary accruals obtained using the modified Jones model in line withEquation (2). Panel B uses the modified Dechow and Dichev (2002) accrual quality measure calculated on a rollingbasis over the prior four years. multiplied by -1 in line with Equation (5). Year flxed-clTects are included but notreported in all regressions. and all continuous variables are Winsorized at the J% and 99% levels. *. **- *** indicatestatistical significance at two-tailed J0%.5%. and 1% levels. Standard errors al'e adjusted for clustering within firmsusing procedures advanced in Rogers (1993). Variable descriptions are provided in Table 2.
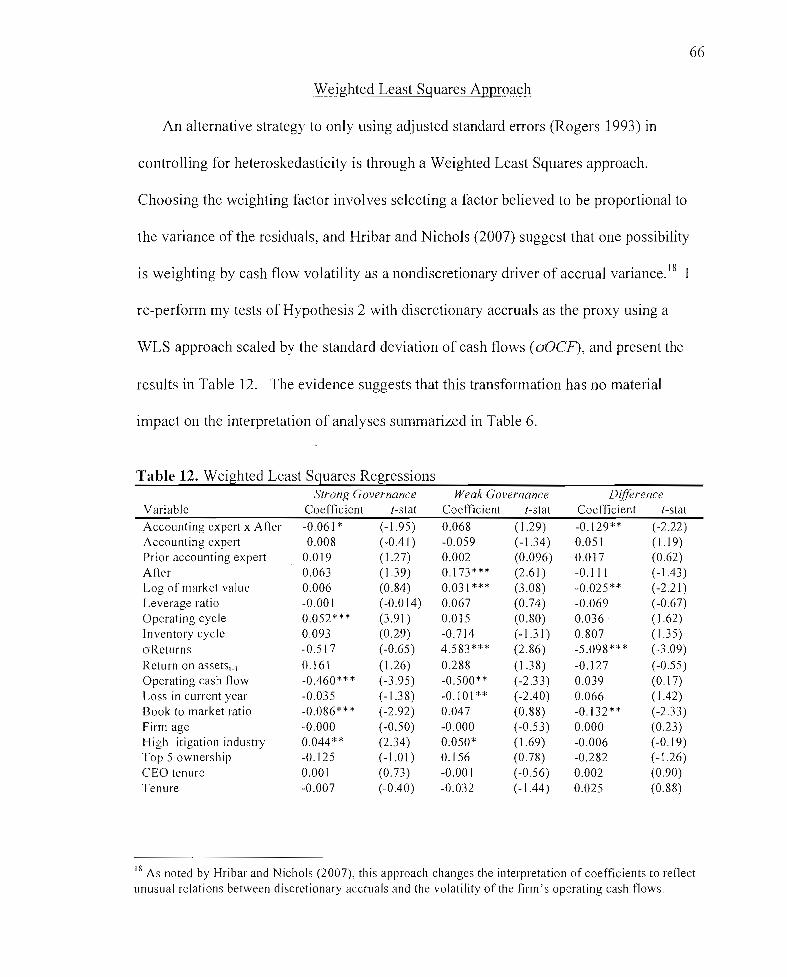
66
Weighted Least Squares Approach
An alternative strategy to only using adjusted standard errors (Rogers 1993) in
controlling for heteroskedasticity is through a Weighted Least Squares approach.
Choosing the weighting factor involves selecting a factor believed to be proportional to
the variance of the residuals, and Hribar and Nichols (2007) suggest that one possibility
is weighting by cash flow volatility as a nondiscretionary driver of accrual variance. 18
re-perform my tests of Hypothesis 2 with discretionary accruals as the proxy using a
WLS approach scaled by the standard deviation of cash flows (aOCF), and present the
results in Table 12. The evidence suggests that this transformation has no material
impact on the interpretation of analyses summarized in Table 6.
Table 12. Weighted Least Squares RegressionsStrong Governance Weak Governance Difference
Variable Coefficient I-stat Coefficient I-stat Coefficient t-stat
Accounting expert x After -0.061 * (-1.95) 0.068 ( 1.29) -0.129** (-2.22)Accounting expert -0.008 (-0.41 ) -0.059 (-1.34) 0.051 (1.19)Prior accounting expert 0.019 (1.27) 0.002 (0.096) 0.017 (0.62)After 0.063 (1.39) 0.173*** (2.61 ) -0.111 (-1.43)Log of market value 0.006 (0.84) 0.031 *** (3.08) -0.025** (-2.21)Leverage ratio -0.001 (-0.014) 0.067 (0.74) -0.069 (-0.67)Operatjng cycle 0.052*** (3.91 ) 0.015 (0.80) 0.036 . (1.62)Inventory cycle 0.093 (0.29) -0.714 (-1.31) 0.807 ( 1.35)oReturns -0.517 (-0.65) 4.583*** (2.86) -5.098*** (-3.09)Return on assets•. } 0.161 (1.26) 0.288 (1.38) -0.127 (-0.55)Operating cash flow -0.460** * (-3.95) -0.500** (-2.33) 0.039 (0.17)Loss in current year -0.035 (-1.38) -0.101** (-2.40) 0.066 ( 1.42)Book to market ratio -0.086*** (-2.92) 0.047 (0.88) -0.132** (-2.33)Firm age -0.000 (-0.50) -0.000 (-0.53) 0.000 (0.23)High Iitigation industry 0.044** (2.34) 0.050* (1.69) -0.006 (-0.19)Top 5 ownership -0.125 (-1.01) 0.156 (0.78) -0.282 (-1.26)CEO tenure 0.001 (0.73) -0.00 I (-0.56) 0.002 (0.90)Tenure -0.007 (-0.40) -0.032 (-1 .44) 0.025 (0.88)
18 As noted by Hribar and Nichols (2007), this approach changes the interpretation of coefficients to reflectunusual relations between discretionary accruals and the volatility of the firm's operating cash flows.
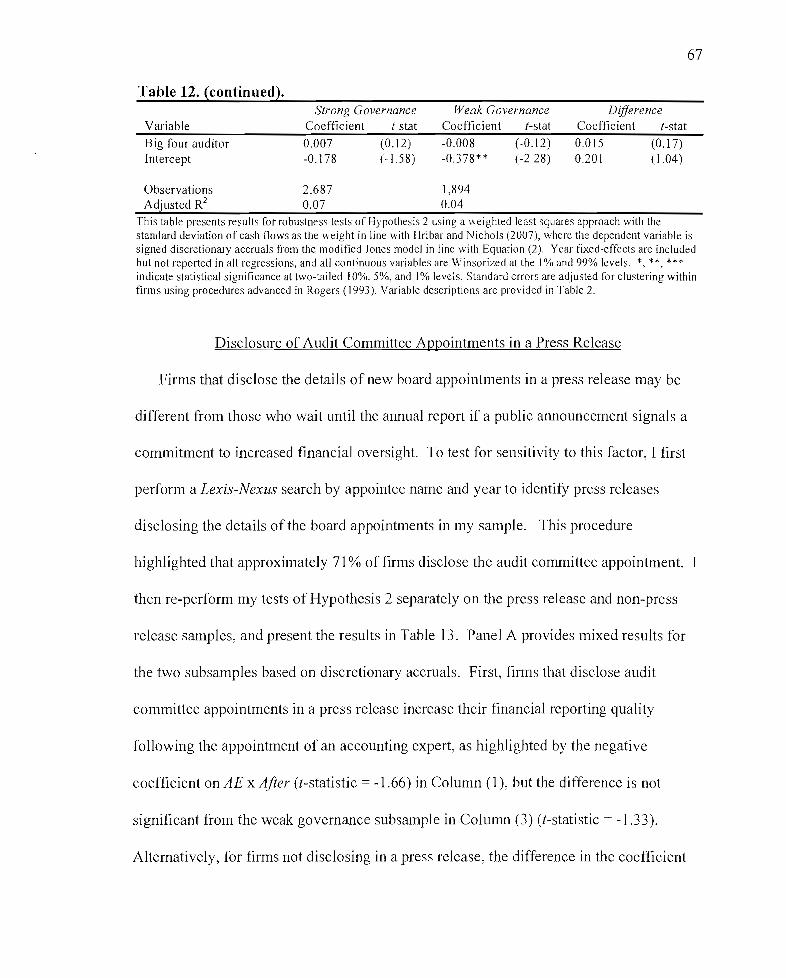
67
Table 12. (continued).
VariableStrong Governance
Coefficient I-statWeak Governance
Coefficient t-statDifference
Coefficient t-statBig four auditorIntercept
0.007-0.178
(0.12)(-1.58)
-0.008-0.378**
(-0.12 )(-2.28)
0.015 (0.17)0.201 (1.04)
Observations 2,687 1,894Adjusted R2 0.07 0.04
This table presents results for robustness tests of Hypothesis 2 using a weighted least squares approach with thestandard deviation of cash flows as the weight in line with Hribar and Nichols (2007), where the dependent variable issigned discretionary accruals from the modified Jones model in Iine with Equation (2). Year fixed-effects are includedbut not reported in all regressions, and all continuous variables are Winsorized at the 1% and 99% levels. *, **, ***indicate statistical significance at two-tailed 10%. 5%. and I% levels. Standard errors are adjusted for clustering withinfirms using procedures advanced in Rogers (1993). Variable descriptions are provided in Table 2.
Disclosure of Audit Committee Appointments in a Press Release
Firms that disclose the details of new board appointments in a press release may be
different from those who wait until the annual report if a public announcement signals a
commitment to increased financial oversight. To test for sensitivity to this factor, I first
perform a Lexis-Nexus search by appointee name and year to identify press releases
disclosing the details of the board appointments in my sample. This procedure
highlighted that approximately 71 % of firms disclose the audit committee appointment. I
then re-perform my tests of Hypothesis 2 separately on the press release and non-press
release samples, and present the results in Table 13. Panel A provides mixed results for
the two subsamples based on discretionary accruals. First, firms that disclose audit
committee appointments in a press release increase their financial reporting quality
following the appointment of an accounting expert, as highlighted by the negative
coefficient on AE x After (I-statistic = -1.66) in Column (l), but the difference is not
significant from the weak governance subsample in Column (3) (I-statistic = -1.33).
Alternatively, for firms not disclosing in a press release, the difference in the coefficient

68
on AE x After between the strong and weak governance subsamples are significantly
different from each other (t-statistic = -2.24) in Column (6). Panel B summarizes results
using accruals quality, where the positive coeffIcient on AE x After (t-statistic = 1.71) in
Column (1) suggests an increase in accruals quality for films with strong governance that
disclose the announcement in a press release, and Column (3) highlights this is
significantly different from the firms with weak governance (t-statistic = 2.26).
Table 13. Analysis of Films Disclosing Appointments in a Press ReleasePanel A: Discretionary Accruals
Disclosed in press release Not disclosed in press releaseSGov = I SGov = 0 DifJ SGov = I SGov = 0 DifJ
Accounting expert x After -0.065 * 0.024 -0.089 -0.017 0.245** -0.262**(-1.66) (0.44 ) (-1.33) (-0.33) (2.29) (-2.24)
Accounting expert -0.015 -0.040 0.026 0.024 -0.145** 0.169**(-0.73) (-1.17) (0.64 ) (0.50) (-2.07) (2.0 I)
Prior accounting expertise 0.OJ3 -0.016 0.029 0.058 0.070 -0.013(0.70) (-0.60) (0.89) (1.21) (1.39) (-0.18)
After 0.104 0.237** -0.133 -0.171 -0.046 -0.125(1.09) (2.4 7) (-0.98) (-1.53) (-0.20) (-0.51 )
Log of market value 0.002 0.031 ** -0.028 * 0.020 0.050* -0.030(0.31 ) (2.40) (-1.90) (0.98) (1.91) (-0.87)
Leverage ratio 0.048 0.063 -0.015 -0.206* 0.050 -0.256(0.58) (0.59) (-0.1 I) (-1.78) (0.26) (-1.11)
Operating cycle 0.055*** 0.018 0.037* 0.057** -0.009 0.066(3.67) (J .34) (1.81 ) (2.26) (-0.28) (1.57)
Inventory cycle -0.022 -0.816* 0.795 0.232 -0.857 1.089(-0.068) (-1.94 ) (1.50) (0.30) (-1.12) (0.97)
aReturns -0.091 4.690* -4.781 * -3.167* 4.610 -7.778*(-0.13) (1.70) (-1.67) (-1.74) (1.28) (-1.93)
Return on assetst_1 0.235 0_198 0.037 -0.521 0.672 -1.l93*(1.35 ) (0.98) (0.14 ) (-1.10) (1.64 ) (-1.92)
Operating cash flow -0.481 ** * -0.437*** -0.044 -0.196 -0.628* 0.432(-2.94) (-2.66) (-0.19) (-0.93) (-1.78) (1.06)
Loss in current year -0.059** -0.093 0.033 0.093 -0.123 0.216**(-2.04) (-1.53) (0.49) (1.47) (-1.42) (2.03)
Book to market ratio -0.090*** 0.105 -0.195 -0.056 -0.094 0.038(-3.07) (0.58) (-1.07) (-0.86) (-1.42) (0.40)
Firm age -0.000 -0.001 0.000 0.001 0.000 0.001(-0.54) (-0.72) (0.25) (0.36) (0.0079) (0.21 )
High litigation industry 0.051 ** 0.056 -0.005 0.012 0.028 -0.016(2.0 I) (1.31) (-0.097) (0.30) (0.41) (-0.20)
Top 5 ownership -0.199** 0.141 -0.34** 0.091 0_298 -0.207(-2.03) (1.24) (-2.33) (0.54) (0.85) (-0.51)
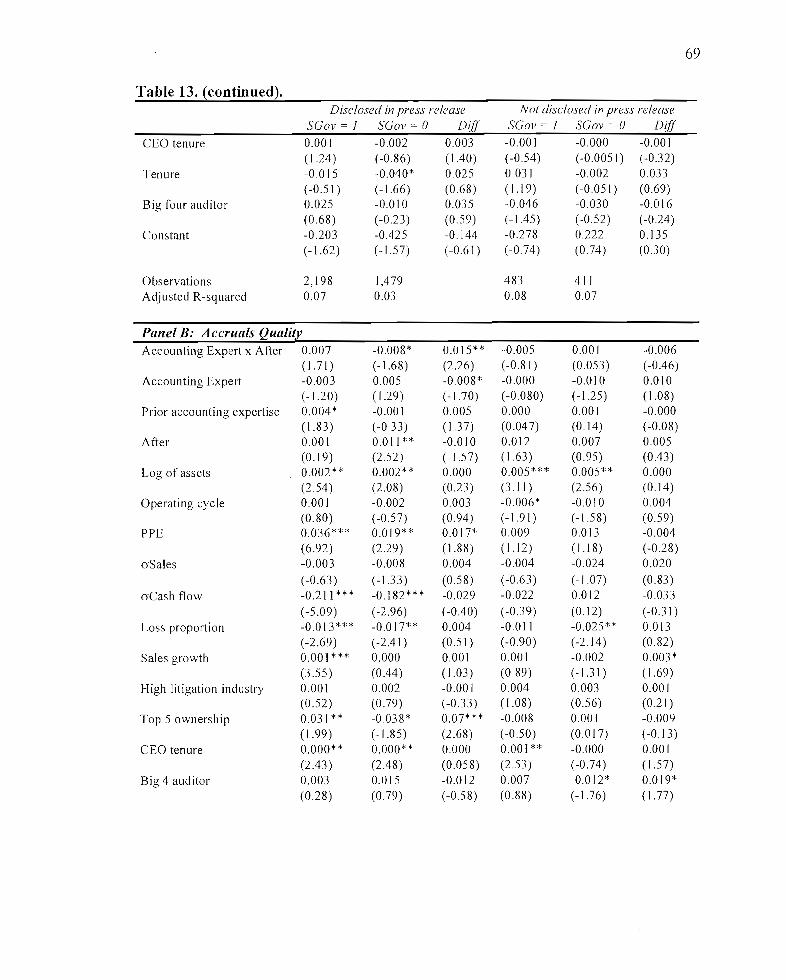
69
Table 13. (continued).Disclosed in press release Not disclosed in press release
SGov = I SGov = () Diff SGov = I SGov = () DifJ
CEO tenure 0.001 -0.002 0.003 -0.001 -0.000 -0.001(1.24 ) (-0.86) (1.40) (-0.54 ) (-0.0051) (-0.32)
Tenure -0.015 -0.040* 0.025 0031 -0.002 0.033(-0.51) (-1.66) (0.68) (1.19) (-0.051) (0.69)
Big four auditor 0.025 -0.0\ 0 0.D35 -0.046 -0.030 -0.016(0.68) (-0.23) (0.59) (-1.45) (-0.52) (-0.24)
Constant -0.203 -0.425 -0.144 -0.278 0.222 0.135(-1.62) (-1.57) (-0.61) (-0 74) (0.74 ) (0.30)
Observations 2,198 1,479 483 411Adjusted R-squared 0.07 0.03 0.08 0.07
Panel B: Accruals QualityAccounting Expert x After 0.007 -0.008* 0.015** -0.005 0.001 -0.006
(1.71) (-1.68) (2.26) (-0.81) (0.053) (-0.46)Accounting Expert -0.003 0.005 -0.008* -0.000 -0.010 0.010
(-1.20) ( 1.29) (-1.70) (-0.080) (-1.25) ( 1.08)Prior accounting expertise 0.004* -0.001 0.005 0.000 0.001 -0.000
(1.83 ) (-0.33) (1.37) (0.047) (0.14) (-0.08)After 0.001 0.011 ** -0.010 0.012 0.007 0.005
(0.19) (2.52 ) (-1.57) (1.63) (0.95) (0.43)Log of assets 0.002** 0.002** 0.000 0.005*** 0.005** 0.000
(2.54) (2.08) (0.23 ) (3.1 I) (2.56) (0.14)Operating cycle 0.001 -0.002 0.003 -0.006* -0.0 I0 0.004
(0.80) (-0.57) (0.94 ) (-1.91) (-1.58) (0.59)PPE 0.036*** 0.019** 0.017* 0.009 0.013 -0.004
(6.92) (2.29) (1.88) (1.12) (1.18) (-0.28)oSales -0.003 -0.008 0.004 -0.004 -0.024 0.020
(-0.63) (-1.33) (0.58) (-0.63 ) (-1.07) (0.83 )oCash flow -0.211 *** -0.182*** -0.029 -0.022 0.0\2 -0.033
(-5.09) (-2.96) (-0.40) (-0.39) (0.12) (-0.31 )Loss proportion -0.013*** -0.017** 0.004 -0.011 -0.025** 0.013
(-2.69) (-2.41) (0.51 ) (-0.90) (-2.14) (0.82)Sales growth 0.001 *** 0.000 0.001 0.00] -0.002 0.003*
(3.55) (0.44 ) (1.03 ) (0.89) (-1.31) ( 1.69)High litigation industry 0.001 0.002 -0.001 0.004 0.003 0.001
(0.52) (0.79) (-0.33) ( 1.08) (0.56) (0.21 )Top 5 ownership 0.031 ** -0.038* 0.07*** -0.008 0.001 -0.009
(1. 99) (-1.85) (2.68) (-0.50) (0.017) (-0. J 3)CEO tenure 0.000** 0.000** 0.000 0.001** -0.000 0.001
(2.43 ) (2.48) (0.058) (2.53) (-0.74 ) ( 1.57)Big 4 auditor 0.003 0.015 -0.012 0.007 -0.012* 0.019*
(0.28) (0.79) (-0.58) (0.88) (-1.76) ( 1.77)
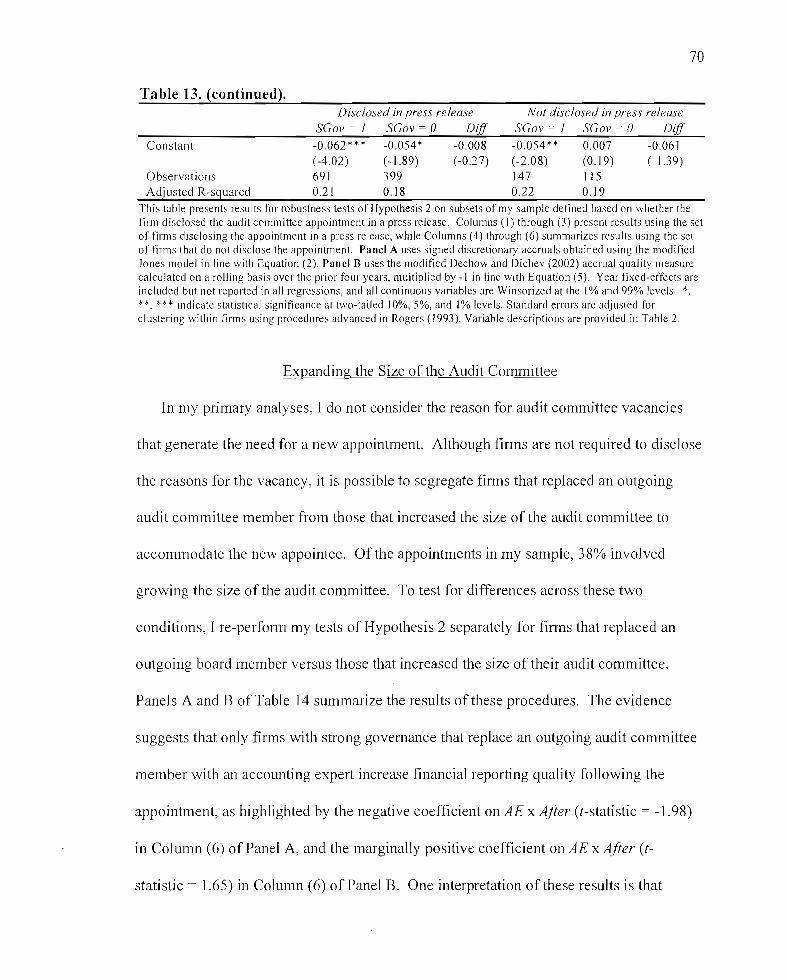
70
Table 13. (continued).Disclosed in press release Not disclosed in press release
SGov = I SGov = 0 DifJ SGov = J SGov = () DifJ
Constant -0.062*** -0.054* -0.008 -0.054** 0.007 -0.061(-4.02) (-1.89) (-0.27) (-2.08) (0.19) (-1.39)
Observations 691 399 147 115Adjusted R-squared 0.21 0.18 0.22 0.19
This table presents results for robustness tests of Hypothesis 2 on subsets of my sample defined based on whether thefirm disclosed the audit committee appointment in a press release. Columns (I) through (3) present results using the setof firms disclosing the appointment in a press release, while Columns (4) through (6) summarizes results using the setof firms that do not disclose the appointment. Panel A uses signed discretionary accruals obtained using the modifiedJones model in line with Equation (2). Panel B uses the modified Dechow and Dichev (2002) accrual quality measurecalculated on a rolling basis over the prior four years, multiplied by -I in line with Equation (5). Year fixed-effects areincluded but not reported in all regressions, and all continuous variables are Winsorized at the I% and 99% levels. *.**. *** indicate statistical significance at two-tailed 10%, 5%, and 1% levels. Standard errors are adj usted forclustering within firms using procedures advanced in Rogers (1993). Variable descriptions are provided in Table 2.
Expanding the Size of the Audit Committee
In my primary analyses, I do not consider the reason for audit committee vacancies
that generate the need for a new appointment. Although firms are not required to disclose
the reasons for the vacancy, it is possible to segregate firms that replaced an outgoing
audit committee member from those that increased the size of the audit committee to
accommodate the new appointee. Of the appointments in my sample, 38% involved
growing the size of the audit committee. To test for differences across these two
conditions, I re-perfonn my tests of Hypothesis 2 separately for firms that replaced an
outgoing board member versus those that increased the size of their audit committee.
Panels A and B of Table 14 summarize the results of these procedures. The evidence
suggests that only firms with strong governance that replace an outgoing audit committee
member with an accounting expert increase financial reporting quality following the
appointment, as highlighted by the negative coefficient on AE x After (t-statistic = -1.98)
in Column (6) of Panel A, and the marginally positive coefficient on AE x After (t-
statistic = 1.65) in Column (6) of Panel B. One interpretation of these results is that
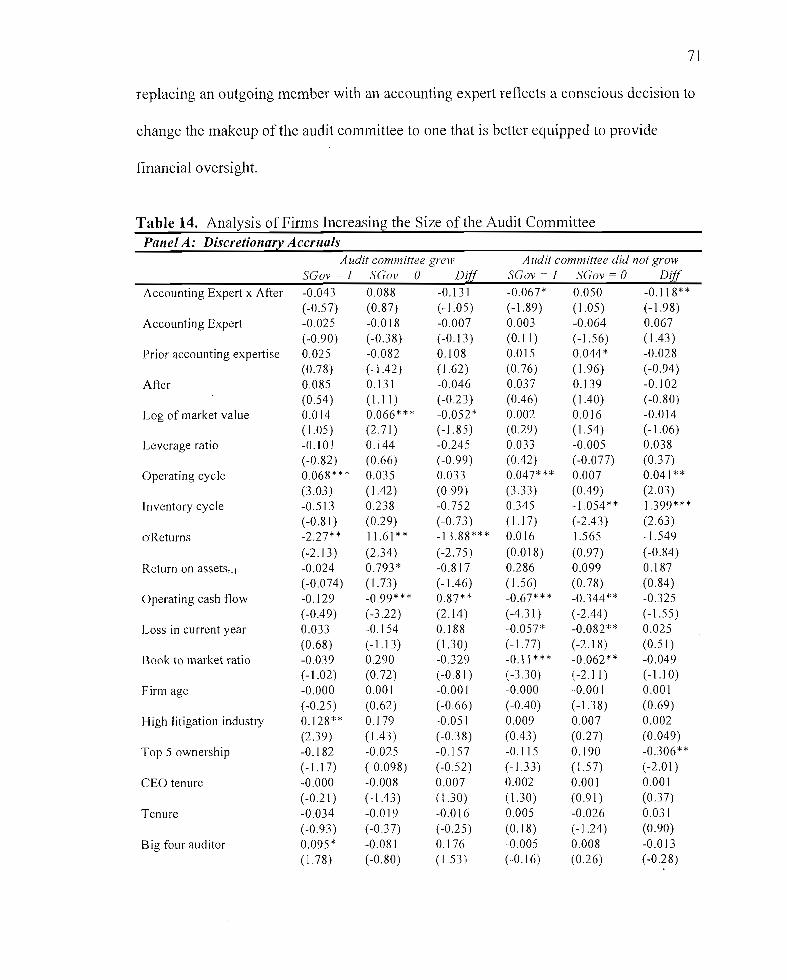
71
replacing an outgoing member with an accounting expert reflects a conscious decision to
change the makeup of the audit committee to one that is better equipped to provide
financial oversight.
Table 14. Analysis of Finns Increasing the Size of the Audit CommitteePanel A: Discretionary Accruals
Audit committee grew Audit committee did not growSGov = 1 SGov = 0 DifJ SGov = 1 SGov = 0 DifJ
Accounting Expert x After -0.043 0.088 -0.131 -0.067* 0.050 -0.118**(-0.57) (0.87) (-1.05) (-1.89) (1.05) (-1.98)
Accounting Expert -0.025 -0.018 -0.007 0.003 -0.064 0.067(-0.90) (-0.38) (-0.13) (0.11 ) (-1.56) (1.43 )
Prior accounting expertise 0.025 -0082 0.108 0.015 0.044* -0.028(0.78) (-1.42) (1.62) (0.76) (1.96) (-0.94)
After 0.085 0.131 -0.046 0.037 0.139 -0.102(0.54) (1.11 ) (-0.23) (0.46) (1.40) (-0.80)
Log of market value 0.014 0.066*** -0.052* 0.002 0.016 -0.014(1.05) (2.71) (-1.85) (0.29) (1.54) (-1.06)
Leverage ratio -0.10 J 0.144 -0.245 0.033 -0.005 0.038(-0.82) (0.66) (-0.99) (0.42) (-0.077) (0.37)
Operating cycle 0.068*** 0.035 0.033 0.047*** 0.007 0.041 **(3.03) (1.42) (0.99) (333) (0.49) (2.03)
Inventory cycle -0.513 0.238 -0.752 0.345 -1.054** 1.399***(-0.81) (0.29) (-0 73) ( 1.17) (-2.43) (2.63)
oReturns -2.27** 11.61** -13.88*** 0.016 1.565 -1.549(-2.13) (2.34) (-2.75) (0.018) (0.97) (-0.84)
Return on assetst_1 -0.024 0.793* -0.817 0.286 0.099 0.187(-0.074) (1.73 ) (-1.46) (1.56) (0.78) (0.84)
Operating cash flow -0.129 -0.99*** 0.87* * -0.67* ** -0.344** -0.325(-0.49) (-3.22) (2.14) (-4.31) (-2.44 ) (-1.55)
Loss in current year 0.033 -0.154 0.188 -0.057* -0.082** 0.025(0.68) (-1.13) (1.30) (-1.77) (-2.18) (0.51 )
Book to market ratio -0.039 0.290 -0.329 -0.11 *** -0.062** -0.049(-1.02) (0.72) (-0.81 ) (-3.30) (-2.11) (-1.10)
Firm age -0.000 0.001 -0.00 I -0.000 -0.00 I 0.001(-0.25) (0.62) (-0.66) (-0.40) (-1.38) (0.69)
High litigation industry 0.128** 0.179 -0.05 ] 0.009 0.007 0.002(2.39) (1.43) (-0.38) (0.43) (0.27) (0.049)
Top 5 ownership -0.182 -0.025 -0.157 -0.115 0.190 -0.306**(-1.1 7) (-0.098) (-0.52) (-1.33) (1.57) (-2.01)
CEO tenure -0.000 -0.008 0.007 0.002 0.001 0.001(-0.21 ) (-1.43) ( 1.30) (1.30) (0.91 ) (0.37)
Tenure -0.034 -0.019 -0.016 0.005 -0.026 0.031(-0.93) (-0.37) (-0.25) (0.18) (- 1.24) (0.90)
Big four auditor 0.095* -0.081 0.176 -0005 0.008 -0.013(1.78) (-0.80) ( 153) (-0.16) (0.26) (-0.28)
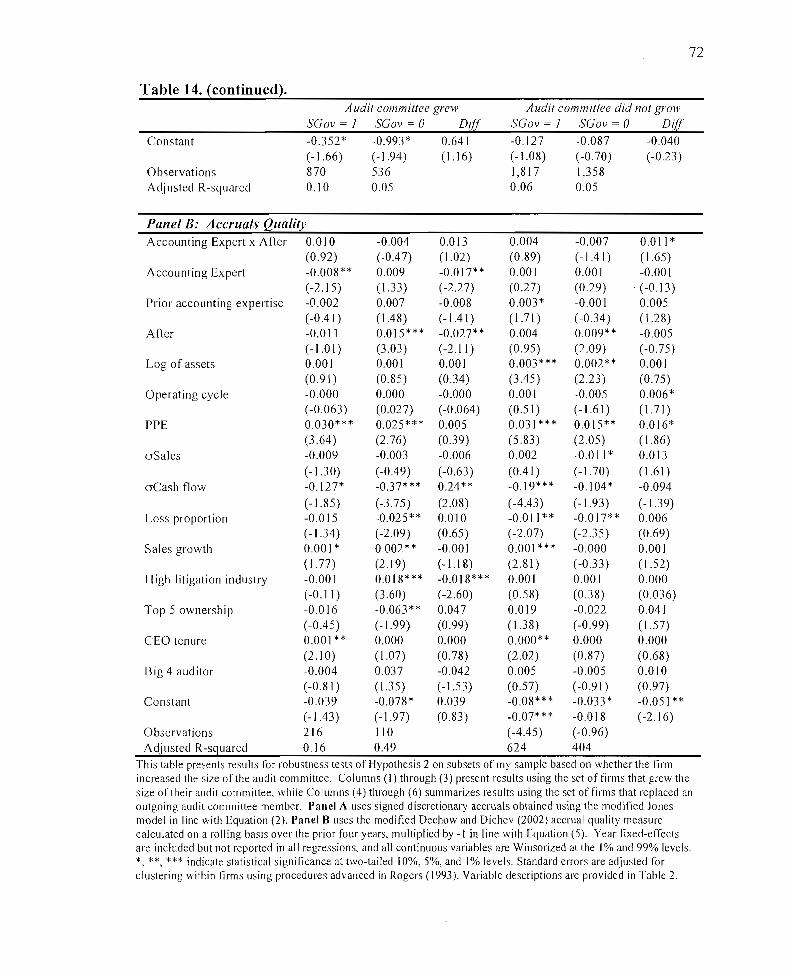
Table 14. (continued).
Constant
ObservationsAdjusted R-squared
Audit committee grewSGov = 1 SGov = 0 Difl-0.352* -0.993* 0.64 J
(-1.66) (-1.94) (1.16)870 5360.10 0.05
Audit committee did not growSGov = 1 SGov = 0 Difl-0.127 -0.087 -0040(-1.08) (-0.70) (-0.23)1,817 1,3580.06 0.05
72
Panel B: Accruals QualityAccounting Expert x After 0.010 -0.004 0.013 0.004 -0.007 0.011 *
(0.92) (-0.47) (1.02 ) (0.89) (-1.41 ) ( 1.65)Accounting Expert -0.008** 0.009 -0.017** 0.001 0.001 -0.001
(-2.15) ( 1.33) (-2.27) (0.27) (0.29) (-0.13)Prior accounting expertise -0.002 0.007 -0.008 0.003* -0.001 0.005
(-0.41) (1.48 ) (-1.41) (1.71 ) (-0.34) (1.28 )After -0.01 ] 0.015*** -0.027** 0.004 0.009** -0.005
(-1.01) (3.03) (-2.1 I) (0.95) (2.09) (-0.75)Log of assets 0.001 0.001 0.001 0.003*** 0.002** 0.001
(0.91) (0.85) (0.34) (3.45) (2.23) (0.75)Operating cycle -0.000 0.000 -0.000 0.001 -0.005 0.006*
(-0.063) (0.027) (-0.064) (0.51 ) (-1.61) (1.71)
PPE 0.030*** 0.025*** 0.005 0.031 *** 0.015** 0.016*(3.64 ) (2.76) (0.39) (5.83) (2.05) ( 1.86)
CJSales -0.009 -0.003 -0.006 0.002 -0.011 * 0.013
(-1.30) (-0.49) (-0.63) (0.41 ) (-1.70) (1.61 )
CJCash flow -0.127* -0.37*** 0.24** -0.19*** -0.104* -0.094
(-1.85) (-3.75) (2.08) (-4.43) (-1.93) (-1.39)Loss proportion -0.015 -0.025** 0.010 -0.011** -0.017** 0.006
(-1.34) (-2.09) (0.65) (-2.07) (-2.35) (0.69)Sales growth 0.001 * 0.002** -0.001 0.001*** -0.000 0.001
(1.77) (2.19) (-1.18) (2.81 ) (-0.33) (1.52)High litigation industry -0.001 0.018*** -0.018*** 0.001 0.001 0.000
(-0.11 ) (3.60) (-2.60) (0.58) (0.38) (0.036)Top 5 ownership -0.016 -0.063** 0.047 0.019 -0.022 0.041
(-0.45) (-1.99) (0.99) (1.38) (-0.99) ( 1.57)CEO tenure 0.001** 0.000 0.000 0.000** 0.000 0.000
(2.10) (1.07) (0.78) (2.02) (0.87) (0.68)Big 4 auditor -0.004 0.037 -0.042 0.005 -0.005 0.010
(-0.81) ( 1.35) (-1.53) (0.57) (-0.91) (0.97)Constant -0.039 -0.078* 0.039 -0.08*** -0.033 * -0.051 **
(-1.43) (-1.97) (0.83) -0.07*** -0.018 (-2.16)Observations 216 110 (-4.45) (-0.96)
Adjusted R-squared 0.16 0.49 624 404
This table presents results for robustness tests of Hypothesis 2 on subsets of my sample based on whetherthe firmincreased the size of the audit committee. Columns (I) through (3) present results using the set offirms that grew thesize of their audit committee. while Columns (4) through (6) summarizes results using the set of firms that replaced anoutgoing audit committee member. Panel A uses signed discretionary accruals obtained using the modified Jonesmodel in line with Equation (2). Panel B uses the modified Dechow and Dichev (2002) accrual quality measurecalculated on a rolling basis over the prior four years. multiplied by -I in line with Equation (5). Year fixed-effectsare included but not reported in all regressions. and all continuous variables are Winsorized at the 1% and 99% levels.*. **, *** indicate statistical significance at two-tailed 10%,5%, and 1% levels. Standard errors are adjusted forclustering within firms using procedures advanced in Rogers (1993). Variable descriptions are provided in Table 2.
73
CHAPTER VII
CONCLUSION
Boards of directors designate responsibility for overseeing a company's accounting
and financial reporting processes to the audit committee. Although this implies that audit
committees playa major role in the monitoring of a firm's financial reporting decisions,
it is not clear whether appointing an accounting expel1 is associated with higher financial
reporting quality in the future. The evidence in this dissertation suggests that appointing
an accounting expert to the audit committee does not by itself lead to improvements in
financial reporting quality, and that the conditions surrounding a newly appointed
accounting expert influence the change in reporting quality following the appointment.
Specifically, my evidence suggest that improvements in financial reporting quality are
larger following the appointment of an accounting expel1 to a firm with strong
governance, reinforcing conclusions from DeFond et a1. (2005) that the benefits to
appointing an accounting expert are concentrated in firms that are well suited to utilize
the expertise. This is particularly important because prior literature is mixed regarding
whether accounting expertise and other governance mechanisms are complements or
substitutes. Furthermore, my results suggest that firms with strong governance that
appoint their first accounting expert show increased financial reporting quality following
the appointment, highlighting that strong governance is a necessary condition for prior
accounting expel1ise to impact the incremental change in financial reporting quality
following an appointment.
74
One limitation in my analysis is that I assume that all accounting experts have the
same incentives to oversee financial reporting. Admittedly, other factors such as career
concerns and wealth effects playa role in who accepts audit committee appointments,
and the intensity of monitoring after such appointments. Therefore, a possibility for
future research involves incorporating measures of audit committee member pay and
prestige to consider these incentives. A second limitation is that my results are not
conclusive regarding the premium to accounting expertise. Although improved financial
reporting quality following the appointment of an accounting expert could imply a lower
cost of capital, there could also be future cash flow implications resulting from greater
financial oversight. Finally, my data set only includes audit committee appointments
from a three-year window, which limits the number of observations in my sample. As
more data on audit committee appointments become available, future research can
investigate whether links between added accounting expertise and changes in financial
reporting quality persist over time.
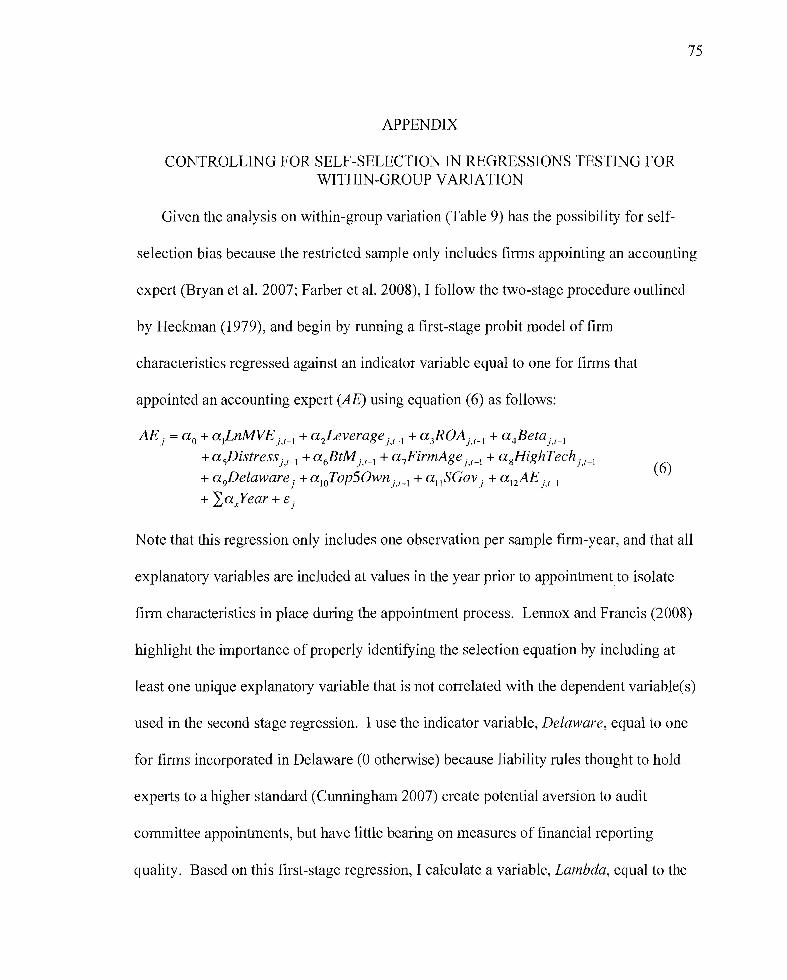
75
APPENDIX
CONTROLLING FORSELF-SELECTION IN REGRESSIONS TESTING FORWITHIN-GROUP VARIATION
Given the analysis on within-group variation (Table 9) has the possibility for self-
selection bias because the restricted sample only includes firms appointing an accounting
expert (Bryan et al. 2007; Farber et al. 2008), I follow the two-stage procedure outlined
by Heckman (1979), and begin by running a first-stage probit model of firm
characteristics regressed against an indicator variable equal to one for firms that
appointed an accounting expert (AE) using equation (6) as follows:
AEj = U o + u1LnMVE j,t-l + u 2Leverage j.l-l + u 3ROA j,t-l + u 4 Betaj,t-I+usDistressj.H + u 6BtMj,t_l + u 7FirmAge j,l-l + ugHighTechj,t_l
+u 9Delaware j + u lOTop50wn j,t-l + ul1SGov j + u l2 AE j,t-l
+ IuXear+Cj
(6)
Note that this regression only includes one observation per sample firm-year, and that all
explanatory variables are included at values in the year prior to appointment to isolate
firm characteristics in place during the appointment process. Lennox and Francis (2008)
highlight the importance of properly identifying the selection equation by including at
least one unique explanatory variable that is not correlated with the dependent variable(s)
used in the second stage regression. I use the indicator variable, Delaware, equal to one
for fimls incorporated in Delaware (0 otherwise) because liability rules thought to hold
experts to a higher standard (Cunningham 2007) create potential aversion to audit
committee appointments, but have little bearing on measures of financial reporting
quality. Based on this first-stage regression, I calculate a variable, Lambda, equal to the
76
inverse Mills ratio, and include it as an independent variable in the second stage
multivariate specifications presented in Table 9.
Klein (2002b) suggests that demand for a high quality audit committee arises from a
variety of constituencies including management, shareholders, and creditors. I include
variables shown by prior literature to relate to whether a firm maintains a financial or
accounting expert on their audit committee (Agrawal and Chadha 2005; Bryan et al.
2007; Farber et al. 2008). First, given that large firms likely have more resources to
monitor the reporting process, I follow DeFond et al. (2005) and Farber et al. (2008) and
include the log of market capitalization (LnMVE) as a proxy for firm size. Next,
following Agrawal and Chadha (2005), I include the debt ratio (Leverage) to consider the
needs for external financing, and operating performance (ROA) as a proxy for prior
managerial effectiveness. I also include systematic risk (Beta) calculated on a rolling
basis over the prior 24 months, and financial distress (Distress) using the Z-Score
(Altman, 2000), based on the idea that troubled firms could have different needs for
board expertise.
In line with Farber et al. (2008), I include the book-to-market ratio (BtM) to account
for the impact of growth opportunities on the demand for outside financial monitoring.
also include the number of years listed on Compustat (FirmAge) as a proxy for the
maturity of existing govemance systems (Khan and Watts 2007). Next, given that Farber
et al. (2008) find that firms in high-technology industries are more likely to have an
accounting expert, I include an indicator variable to one for firms with 2-digit SIC codes
of 35,36,38,48, or 73 (High Tech). I also include the percentage of shares held by the
77
top 5 executives (Top50wn) to consider incentives to misreport based on evidence from
Bryan et al. (2007) that firms with high CEO ownership are more likely to have an
accounting expert on their audit committee. Furthermore, I consider the possibility that a
high quality auditor substitutes for accounting expertise by including an indicator
variable equal to one for firms that employ a member of the Big four to perform their
financial statement audit (Big4).19
I include a proxy for governance strength (SGov) based on evidence from Farber et al.
(2008) suggesting that firms with strong governance are more likely to appoint an
accounting expert using the summary governance metric described in Table 4, and
whether the audit committee already maintains an accounting expert because firms
balance financial oversight with the other responsibilities of board members (Adams and
Ferreira 2007). I define a firm as having prior accounting expertise (PriorAE) ifthere
was at least one accounting expert on the audit committee in the year prior to the
appointment of interest.
Table 15 presents my regression results of the decision to appoint an accounting
expert. In line with Farber et al. (2008), I find that large firms are less likely to appoint
an accounting expert, while firms in high technology industries are more likely to appoint
an accounting expert (marginal effect = 8.8%). One interpretation of these results is that
large firms have more sophisticated financial reporting systems that reduce the need for
accounting expertise, while complex firms have demand for increased monitoring.
Furthermore, the evidence suggests that firms with at least one accounting expert already
19 As a robustness check, I substitute an auditor industry specialization metric based on Francis, Reichelt,and Wang (2005), with similar results to those presented in Table 3.
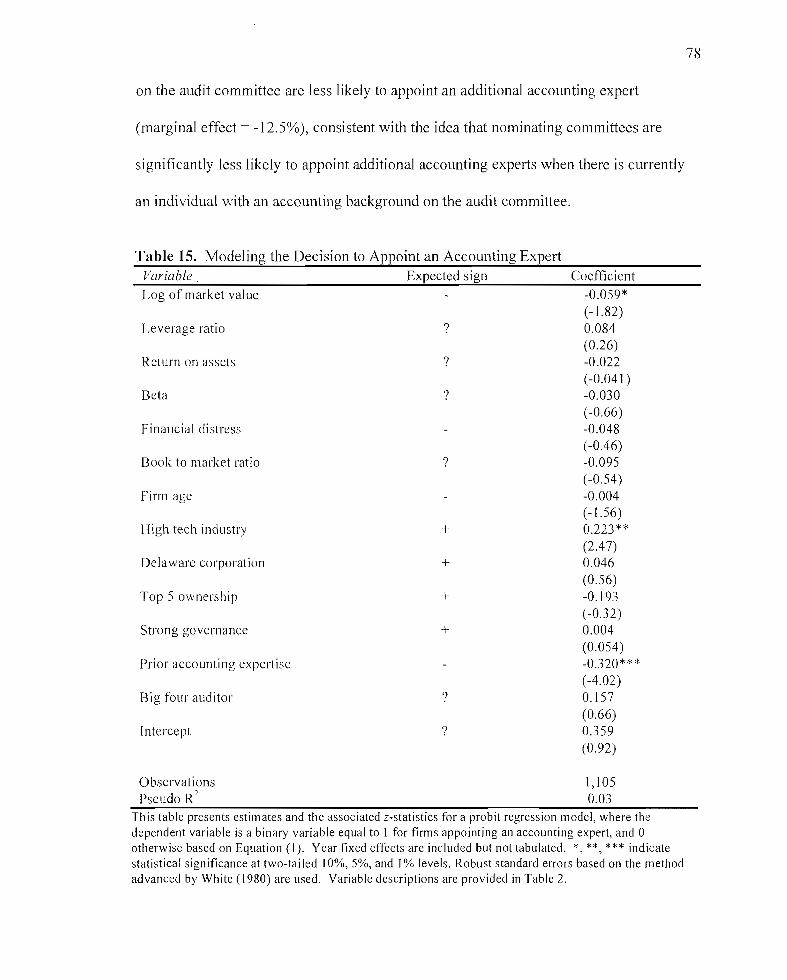
on the audit committee are less likely to appoint an additional accounting expert
(marginal effect = -12.5%), consistent with the idea that nominating committees are
significantly less likely to appoint additional accounting experts when there is currently
an individual with an accounting background on the audit committee.
Table 15. Modeling the Decision to Appoint an Accounting Expert
78
Variable. Expected sign CoefficientLog of market val ue
Leverage ratio
Return on assets
Beta
Financial distress
Book to market ratio
Firm age
High tech industry
Delaware corporation
Top 5 ownership
Strong governance
Prior accounting expeJiise
Big four auditor
Intercept
ObservationsPseudo R"
?
?
?
?
+
+
+
+
?
?
-0.059*(-1.82)0.084(0.26)-0.022(-0.041)-0.030(-0.66)-0.048(-0.46)-0.095(-0.54)-0.004(-1.56)0.223**(2.47)0.046(0.56)-0.193(-0.32)0.004(0.054)-0.320***(-4.02)0.157(0.66)0.359(0.92)
1,1050.03
This table presents estimates and the associated z-statistics for a probit regression model, where thedependent variable is a binary variable equal to 1 for finns appointing an accounting expert, and 0otherwise based on Equation (I). Year fixed effects are included but not tabulated. *, **, *** indicatestatistical significance at two-tailed 10%,5%, and 1% levels. Robust standard errors based on the methodadvanced by White (1980) are used. Variable descriptions are provided in Table 2.
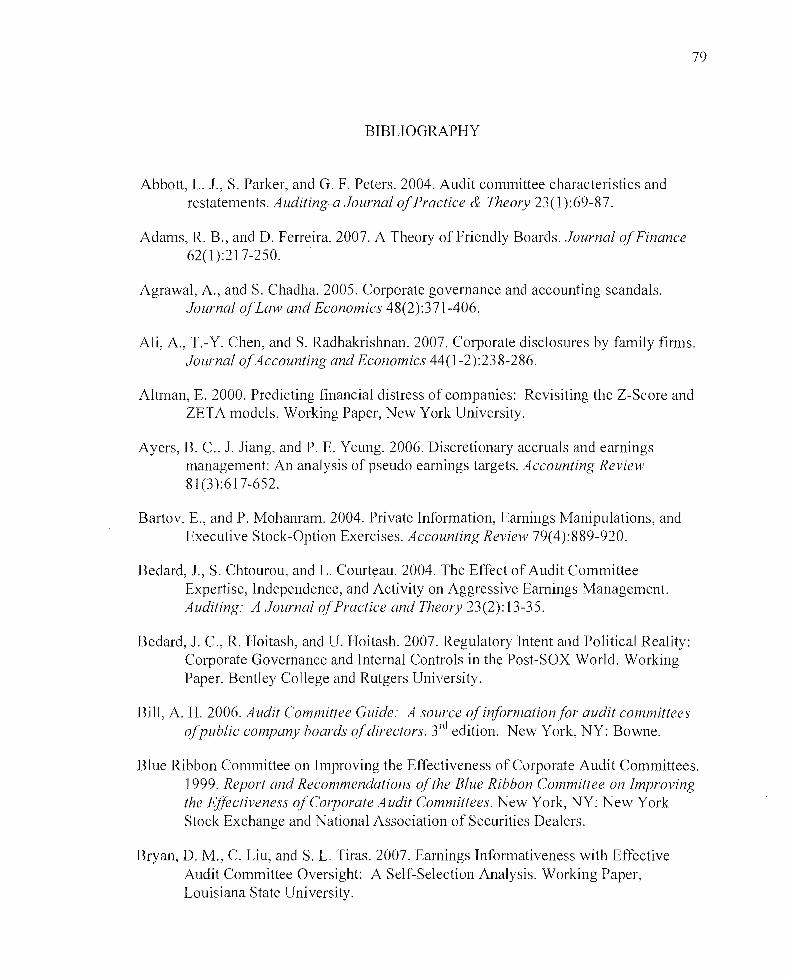
r79
BIBLIOGRAPHY
Abbott, L. 1., S. Parker, and G. F. Peters. 2004. Audit committee characteristics andrestatements. Auditing-a Journal ofPractice & Theory 23(1):69-87.
Adams, R. B., and D. Ferreira. 2007. A Theory of Friendly Boards. Journal o.lFinance62(1):217-250.
Agrawal, A., and S. Chadha. 2005. Corporate governance and accounting scandals.Journal o.lLaw and Economics 48(2):371-406.
Ali, A., T.- Y. Chen, and S. Radhakrishnan. 2007. Corporate disclosures by family firms.Journal o.lAccounting and Economics 44(1-2):238-286.
Altman, E. 2000. Predicting financial distress of companies: Revisiting the Z-Score andZETA models. Working Paper, New York University.
Ayers, B. c., 1. Jiang, and P. E. Yeung. 2006. Discretionary accruals and earningsmanagement: An analysis of pseudo earnings targets. Accounting Review81(3):617-652.
Bartov, E., and P. Mohanram. 2004. Private Information, Earnings Manipulations, andExecutive Stock-Option Exercises. Accounting Review 79(4):889-920.
Bedard, 1., S. Chtourou, and L. Courteau. 2004. The Effect of Audit CommitteeExpertise, Independence, and Activity on Aggressive Earnings Management.Auditing: A Journal ofPractice and Theory 23(2): 13-35.
Bedard, 1. c., R. Hoitash, and U. Hoitash. 2007. Regulatory Intent and Political Reality:Corporate Governance and Internal Controls in the Post-SOX World. WorkingPaper, Bentley College and Rutgers University_
Bill, A. H. 2006. Audit Committee Guide: A source ofinformation for audit committeesolpublic company boards 0.1directors. 3rd edition. New York, NY: Bowne.
Blue Ribbon Committee on Improving the Effectiveness of Corporate Audit Committees.1999. Report and Recommendations ofthe Blue Ribbon Committee on Improvingthe Effectiveness olCorporate Audit Committees. New York, NY: New YorkStock Exchange and National Association of Securities Dealers.
Bryan, D. M., C. Liu, and S. L. Tiras. 2007. Earnings Informativeness with EffectiveAudit Committee Oversight: A Self-Selection Analysis. Working Paper,Louisiana State University.
80
Carcello,1. V., C. W. Hollingsworth, A. Klein, and T. L. Neal. 2008. Audit CommitteeFinancial Expertise, Competing Corporate Governance Mechanisms, andEarnings Management. Working Paper, University of Tennessee and New YorkUniversity.
Cheng, Q., and T. A. Warfield. 2005. Equity incentives and earnings management.Accounting RevievF 80(2):441-476.
Collins, D. W., and S. P. Kothari. 1989. An analysis of intertemporal and cross-sectionaldeterminants of earnings response coefficients. Journal o.fAccounting andEconomics 11(2-3):143-181.
Cost, B., and D. Miller. 2005. Emerging Communications: Enhanced director liabilityfor experts. The Metropolitan Corporate Counsel January:26.
Cox, C. 2005. Remarks Before the 2005 AICPA National Conference on Current SECand PCAOB Developments.
Cunningham, L. A. 2007. Rediscovering Board Expertise: Legal Implications of theEmpirical Literature: Working Paper, The George Washington University.
Dechow, P., R. Sloan, and A. Sweeney. 1995. Detecting Earnings Management.Accounting Review 70(2): 193-225.
Dechow, P. M., and 1. D. Dichev. 2002. The quality of accruals and earnings: The role ofaccrual estimation errors. Accounting Review 77(Supplement):35-59.
Dechow, P. M., R. G. Sloan, and A. P. Sweeney. 1996. Causes and Consequences ofEarnings Manipulation: An Analysis of Firms Subject to Enforcement Actions bythe SEC. Contemporary Accounting Research 13(1): 1-36.
DeFond, M. L., R. N. Hann, and X. S. Hu. 2005. Does the market value financialexpertise on audit committees of boards of directors? Journal ofAccountingResearch 43(2): 153-193.
DeZoort, F. T., and S. E. Salterio. 2001. The effects of corporate governance experienceand financial-reporting and audit knowledge on audit committee members'judgments. Auditing-a Journal ofPractice & Theory 20(2):31-47.
Dhaliwal, D., V. Naiker, and F. Navissi. 2006. The Association between AuditCommittee Accounting Expertise, Corporate Governance and Accruals Quality:An Empirical Analysis. Working Paper, Monash University.
Engel, E. 2005. Discussion of Does the Market Value Financial Expertise on AuditCommittees of Boards of Directors? Journal ofAccounting Research 43(2): 195204.
81
Fama, E., and K. French. 1997. Industry costs of equity. Journal ofFinancial Economics43(2): 153-193.
Farber, D., X. Huang, and E. Mauldin. 2008. Accounting Expertise on the AuditCommittee and a Firm's Infonnation Environment. Working Paper, University ofMissouri.
Fe1o, A., S. Krishnamurthy, and S. Solieri. 2003. Audit Committee Characteristics andthe Perceived Quality of Financial Reporting: An Empirical Analysis. WorkingPaper, Pennsylvania State University - Management Division.
Fich, E. M. 2005. Are some outside directors better than others? Evidence from directorappointments by fortune 1000 firms. Journal ofBusiness 78(5): 1943-1971.
Fich, E. M., and A. Shivdasani. 2006. Financial Fraud, Director Reputation, andShareholder Wealth. Working Paper, University of North Carolina.
Francis, 1, R. LaFond, P. Olsson, and K. Schipper. 2005. The market pricing of accrualsquality. Journal ofAccounting & Economics 39(2):295-327.
Francis, 1, D. Philbrick, and K. Schipper. 1994. Shareholder Litigation and CorporateDisclosures. Journal ofAccounting Research 32 (2): 137-164.
Francis, 1 R., K. Reichelt, and D. Wang. 2005. The Pricing of National and City-SpecificReputations for Industry Expertise in the U.S. Audit Market. Accounting Review80(1): 113-136.
Garcia Lara, 1, B. Garcia Osma, and F. Penalva. 2009. Accounting conservatism andcorporate governance. Revievl' ofAccounting Studies 14(l): 161-20 1.
Geiger, M. A., and D. S. North. 2006. Does Hiring a New CFO Change Things? AnInvestigation of Changes in Discretionary Accruals. Accounting Revievv81(4):781-809.
Givoly, D., and C. Hayn. 2000. The changing time-series properties of earnings, cashflows, and accruals: Has financial reporting become more conservative? JournalofAccounting and Economics 29:287-320.
Heckman, 1 1 1979. Sample Selection Bias as a Specification Error. Econometrica47(1):153-161.
Hennalin, B., and M. Weisbach. 1988. The Detenninants of Board Composition. RANDJournal ofEconomics 19(4):589-606.
Herz, R. H. 2005. Remarks at 2005 AICPA National Conference on Current SEC andPCAOB Reporting Developments.
82
Hribar, P., and D. W. Collins. 2002. Errors in Estimating Accruals: Implications forEmpirical Research. Journal o/Accounting Research 40( I): I05-134.
Hribar, P., and D. C. Nichols. 2007. The Use of Unsigned Earnings Quality Measures inTests of Earnings Management. Journal ofAccounting Research 45(5):10171053.
Huron Consulting Group. 2006. Audit Committee Reserach Report. Chicago, IL: Huron.
Kaplan, S. N., and D. Reishus. 1990. Outside directorships and corporate performance.Journal ofFinancial Economics 27(2):389-410.
Kennedy, P. 2003. A Guide to Econometrics. 5th edition. Cambridge, Massachusetts: TheMIT Press.
Khan, M., and R. L. Watts. 2007. Estimation and Validation ofa Firm-Year Measure ofConservatism. Working Paper, Massachusetts Institute of Technology.
Klein, A. 2002a. Audit committee, board of director characteristics, and earningsmanagement. Journal o/Accounting & Economics 33(3):375-400.
---. 2002b. Economic determinants of audit committee independence. AccountingRevielv 77(2):435-452.
Kormendi, R., and R. Lipe. 1987. Earnings Innovations, Earnings Persistence, and StockReturns. Journal ofBusiness 60(3):323-345.
KPMG. 2006. The Audit Committee Journey: Looking Back, Thinking Ahead. In 20052006 Public Company Audit Committee Member Survey. New York, NY: KPMGInternational
Krishnan, G., and G. Visvanathan. 2008. Does the SOX Definition of an AccountingExpert Matter? the Association between Audit Committee Directors' AccountingExpeliise and Accounting Conservatism. Contemporary Accounting Research25(3):827-858.
Krishnan, 1. 2005. Audit committee quality and internal control: An empirical analysis.Accounting Review 80(2):649-675.
Lennox, C., and 1. R. Francis. 2008. Selection Models in Accounting Research. WorkingPaper, Hong Kong University of Science and Technology and University ofMissouri.
Linck, 1., 1. Netter, and T. Yang. 2008. The Effects and Unintended Consequences of theSarbanes-Oxley Act on the Supply and Demand for Directors. Working Paper,University of Georgia.
83
Matsunaga, S. R., and P. E. Yeung. 2008. Evidence on the Impact of a CEO's FinancialExperience on Quality of the Firm's Financial Reports and Disclosures. WorkingPaper, University of Oregon and University of Georgia.
McNichols, M. 2002. Discussion of the qualilty of accruals and earnings: The role ofaccrual estimation errors. Accounting Revie~w 77(Supplement):61-69.
Menon, K., and D. D. Williams. 2004. Former Audit Partners and Abnormal Accruals.Accounting Review 79(4):1095-1118.
Palmrose, Z. V., V. 1. Richardson, and S. Scholz. 2004. Detenninants of market reactionsto restatement announcements. Journal ofAccounting & Economics 37(1):59-89.
Perry, T., and U. Peyer. 2005. Board seat accumulation by executives: A shareholder'sperspective. Journal ofFinance 60(4):2083-2123.
Qin, B. 2007. The Influence of Audit Committee Financial Expertise on EarningsQuality: U.S. Evidence. lcfai Journal ofAudit Practice 4(3):7-28.
Rogers, W. 1993. Regression standard errors in clustered samples. Stata TechnicalBulletin 3(13).
Rosenstein, S., and 1. G. Wyatt. 1990. Outside directors, board independence, andshareholder wealth. Journal ofFinancial Economics 26(2): 175-191.
Srinivasan, S. 2005. Consequences of financial reporting failure for outside directors:Evidence from accounting restatements and audit committee members. Journal ofAccounting Research 43 (2):291-334.
Teoh, S. H., 1. Welch, and T. 1. Wong. 1998. Earnings management and theunderperformance of seasoned equity offerings. Journal ofFinancial Economics50(1 ):63-99.
U.S. House of Representatives. 2002. The Sarbnes-Oxley Act of 2002. Public Law 107204 [H.R. 3763]. Washington, D.C.: Government Printing Office.
Watts, R. L. 2003a. Conservatism in Accounting Part 1: Explanations and Implications.Accounting Horizons 17(3):207-221.
---~. 2003b. Conservatism in Accounting Part II: Evidence and ResearchOpportunities. Accounting Horizons 17(4):287-301.
White, H. 1980. A Heteroskedasticity-Consistent Covariance Matrix Estimator and aDirect Test for Heteroskedasticity. Econometrica 48(4):817-838.
84
Xie, 8., W. N. Davidson, and P. J. DaDalt. 2003. Earnings management and corporategovernance: the role of the board and the audit committee. Journal ofCorporateFinance 9(3):295-316.
Xie, H. 2001. The Mispricing of Abnormal Accruals. Accounting RevieH' 76(3):357.
Zhang, Y., J. Zhou, and N. Zhou. 2007. Audit committee quality, auditor independence,and internal control weaknesses. Journal ofAccounting and Public Policy26(3):300-327.