Embed Size (px)
Citation preview
Journal of Research and Practice in Information Technology, Vol. 35, No. 1, February 2003 41
Copyright© 2003, Australian Computer Society Inc. General permission to republish, but not for profit, all or part of thismaterial is granted, provided that the JRPIT copyright notice is given and that reference is made to the publication, to itsdate of issue, and to the fact that reprinting privileges were granted by permission of the Australian Computer Society Inc.
41
Audio-Visual Speech Recognition using Red Exclusion andNeural NetworksTrent W. Lewis and David M.W. PowersSchool of Informatics and EngineeringFlinders University of South Australia, PO Box 2100, Adelaide, South Australia 5001Email: [trent.lewis|powers]@infoeng.flinders.edu.au
Automatic speech recognition (ASR) performs well under restricted conditions, butperformance degrades in noisy environments. Audio-Visual Speech Recognition(AVSR) combats this by incorporating a visual signal into the recognition. Thispaper briefly reviews the contribution of psycholinguistics to this endeavour and therecent advances in machine AVSR. An important first step in AVSR is that of featureextraction from the mouth region and a promising new technique is presented. Thispaper examines how useful this extraction technique in combination with severalintegration architectures and compares it with competing techniques, demonstratesthat vision does in fact assist speech recognition when used in a linguistically guidedfashion, and gives insight into remaining issues.
Keywords: Audio-Visual Speech Recognition, Feature Extraction, Neural Networks,Sensor Fusion
Manuscript received: 1 May 2002Communicating Editor: Hugh Williams
1. INTRODUCTIONAutomatic speech recognition (ASR) performs well under restricted conditions with word accuracyrates up to 98–99%. When we step outside the boundaries, however, performance can be severelydegraded and the utility of such systems comes under fire (Bregler et al, 1993). The question thenarises of how are humans able to recognise speech in unfavourable conditions such as a busy office,a train station or a construction site? Is our acoustic apparatus performing an enormous amount ofnoise filtering and reduction or is it that we are using another source of information? It is in fact thelatter which may be an answer to robust speech recognition.
Work from the areas of psychology and linguistics has shed much light on how humans perceivespeech, not only how we perceive it acoustically but also visually, such as lip-reading in deafpeople. This has evolved into what is now known as speechreading (Dodd and Campbell, 1987).The most important finding from this research is that normally hearing people do rely on vision forspeech perception and that the set of visually perceivable speech sounds forms a complementary setto that of the acoustically perceivable sounds in the presence of noise. This set of visuallyperceivable speech sounds have been named visemes, that is visual phonemes (Summerfield, 1987).
Researchers in the fields of engineering and computer science have taken these ideas and appliedthem to traditional acoustic speech recognition systems to produce audio-visual speech recognition
Journal of Research and Practice in Information Technology, Vol. 35, No. 1, February 20034242
Audio-Visual Speech Recognition using Red Exclusion and Neural Networks
(AVSR) systems with very encouraging results (for a comprehensive review see Stork and Hennecke,1996). Although only minimal improvement is found under optimal conditions, improvements usinga degraded acoustic signal have been large (Hennecke, Stork and Prasad, 1996). For example, Meieret al (1999) have reported up to a 50% error reduction when vision is incorporated.
AVSR requires expertise in interpreting evidence from psycholinguistics, a solid grounding inthe traditional acoustic speech recognition, and a grasp on the computer vision techniques forrelevant visual feature extraction. However, a new problem also arises with AVSR and that is howto best combine the acoustic and visual signals without the result being worse than acoustic or visualrecognition alone, that is catastrophic fusion (Movellan and Mineiro, 1998). This is a lively researcharea in AVSR and the effectiveness of different techniques, such as early, intermediate and latefusion, are still being decided.
Although our primary interest is in the fusion of acoustic and visual data there are considerableproblems to be overcome in other aspects of the system as well, notably in visual feature extraction.Unlike acoustic feature extraction, which is a mature field, visual feature extraction suitable for lipreading is still in its infancy and current techniques for lip feature dectection prove to be inadequateor marginal.
In this paper we will initially look at the psycholinguistics in Section 2 and give an overview ofAVSR in Section 3. We go into the effect of environmental conditions in Section 4, being particularlyinterested in AVSR under adverse conditions using cheap off-the-shelf (OTS) hardware. Issues of faceand feature extraction are described in Section 5 and the new techniques we have developed for thisare explored. The final sections report on AVSR fusion experiments using artificial neural networks(ANN) for the recognition process in both the acoustic and visual signals as well as the fusion process.
2. PSYCHOLINGUISTIC RESEARCHThe knowledge of both the psychological and linguistic aspects of AVSR by humans are valuabletools for exploration in this rapidly developing field. The way in which humans perceive speech,both acoustically and visually, may not be the best or most efficient in engineering terms, but suchwork can enlighten how one might start tackling the problem. Thus, instead of blindly attemptingto get a machine to recognise speech visually, the work from psycholinguistics can be included toproduce a potentially more elegant and refined solution.
Probably the most cited article in AVSR literature is “Hearing lips and seeing voices” byMcGurk and MacDonald (1976). This paper reported on an effect that definitively demonstrated theinfluence of vision on speech perception that later became commonly known as the “McGurkeffect”. This effect, which is easily replicated, occurs when a person is confronted with, forexample, the utterance [ba] and the lip movements [ga], and the person perceives the sound [da]. Itis stated that the reason for this is because the listener has combined or fused the two sensory inputsinto one, thus altering the perception and demonstrating that visual input is heavily influencing theprocessing of speech. This effect has been replicated many times and has even been extended toentire sentences (Massaro and Stork, 1998).
Research in this area has also uncovered that the addition of visual cues can enhance normal,human listeners’ accuracy and speed in speech perception. For example, using nine normal-hearingsubjects, Grant and Seitz (1998) found that the intelligibility threshold of a sentence with respect tonoise was greatest for auditory-visually matched sequence when compared to auditory only andauditory-visually unmatched sequences (surprisingly, visually unmatched sequences did not degradeperformance relative to auditory only). Further studies by Grant and Seitz have found that the speedof spoken word recognition is superior for auditory-visual conditions over auditory or visual alone.
Journal of Research and Practice in Information Technology, Vol. 35, No. 1, February 2003 4343
Audio-Visual Speech Recognition using Red Exclusion and Neural Networks
These studies demonstrate that even normal hearing people benefit greatly from the addition of avisual signal.
One reason humans benefit from a visual signal may be that our various speech articulators arevisible. Lips, teeth, and tongue have been identified as the primary indicators for visual speech,however, the cheeks, chin and nose are also very useful as secondary indicators (Robert-Ribes et al,1996). To an extent the entire facial expression is used, hence speechreading.
One of the most important findings in this area is that of the viseme. A viseme is the virtualsound attributed to a specific mouth (or face) shape. The viseme is analogous to the phoneme in theauditory domain, however, there does not exist a one-to-one mapping between the two. Phonemesare the distinctive sound segments that contrast or distinguish words, for example, /p/ as in ‘pit’ and/b/ in ‘bit’ (Fromkin et al, 1996).
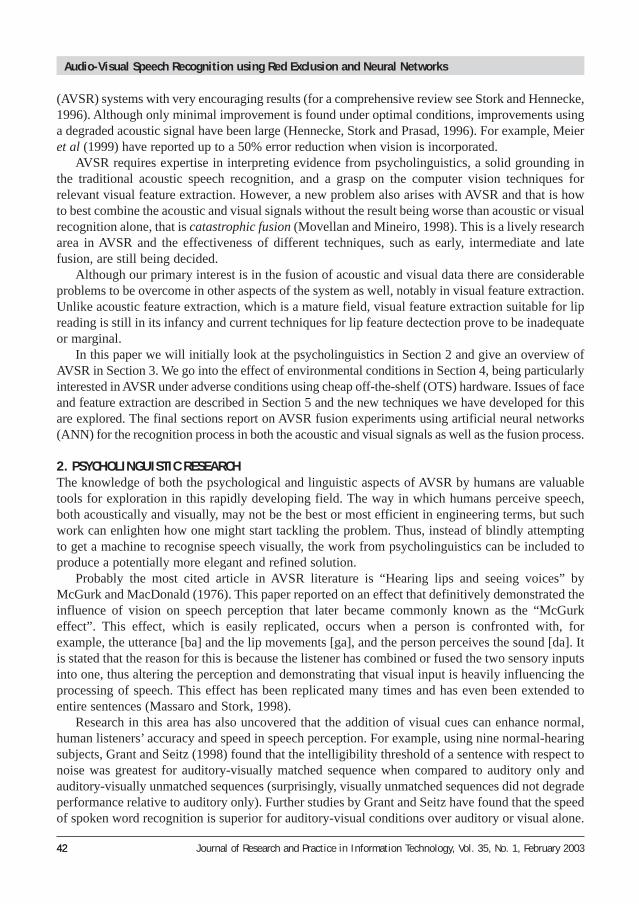
Experiments have found that the human perception of consonant phonemes systematicallygroup in the presence of noise (Summerfield, 1987). Under a signal-to-noise ratio of -6dB, humansare only able to audibly distinguish consonants on the basis of voicing (voiced/voiceless) andnasality. In contrast, visual discrimination doesn’t degrade with increasing acoustic noise andhierarchical clustering of human experimental results have found that, from the standpoint ofconfusion and noise degradation, visemes actually form a complementary set to phonemes (Waldenet al, 1977). Table 1 shows the nine distinct, humanly perceivable viseme classes, as well as theircommon place of articulations (Cohen et al, 1996). A further distinction can also be made withinthe LSH class, which involves a split between the alveolar stops and nasal, /t,d,n/, and thevelar/glottal stops and nasal, /g,k,ng,h/ (Goldschen et al, 1996).
3. MACHINE AVSRMachine AVSR must not only deal with the recognition of the auditory signal, as in ASR, but it mustalso decide on a number of important design questions concerning visual processing. Some of thequestions, pointed out by Hennecke et al (1996), are outlined below.1. How will the face and and mouth region be found?2. Which visual features to extract from the image?3. How are auditory and visual channels integrated?4. What type of learning and/or recognition is used?
Unfortunately, there is still no consensus on the answers to any of these questions. Manydifferent approaches have been developed for each, of which we can only mention the generalaspects of the main techniques.
Label Place of Articulation Phoneme(s)LAB labial /p,b,m/LDF labiodental fricatives /f,v/IDF interdental fricatives /th,dh/LSH lingual stops and h /d,t,n,g,k,ng,h/ALF alveolar frictives /s,z/LLL tongue sides /l/RRR tongue blade /r/PAL palatal veolars /sh,zh/WWW lips/tongue back /w/
Table 1: Consonant viseme classes
Journal of Research and Practice in Information Technology, Vol. 35, No. 1, February 20034444
Audio-Visual Speech Recognition using Red Exclusion and Neural Networks
3.1 Face and Mouth Region ExtractionThere are some AVSR systems that process both the audio and visual channels, and completerecognition in near real-time. These types of systems need to be able to initially locate the face froma cluttered background, a research area in itself, and then extract the mouth region for furtheranalysis. A prime example of this is the Interactive Systems Laboratory complete multi-modalhuman computer interface, of which part is a movement-invariant AVSR system (Duchnowski et al,1995). In this case, as it is with many other systems, the face is found with colour. This simple, buteffective, technique works because the colour of human skin (normalised for brightness/whitelevels) varies little between individuals, and even races (Hunke and Waibel, 1994; Yang and Waibel,1996). Once the face is located it is necessary to pinpoint the mouth within the face. This is usuallyachieved using either a triangulation with the eyes (or nose) which are more easily located(Stiefelhagen et al, 1997), or by finding an area with high edge-content in the lower half of the faceregion (Hennecke et al, 1995). Given the large amount of research already carried out in facelocating/recognition (Chelappa et al, 1995), many researches in AVSR opt to skip the stage and startworking with pre-cropped mouth images (Gray et al, 1997; Movellan, 1995). This allows for arelatively quicker progression for researchers beginning work in this area and this is the approachtaken here.
3.2 Visual Feature ExtractionOnce the mouth region is found, either automatically or by hand, useful lip features must beextracted that can be used visual or audio-visual speech recognition. It is at this stage whereresearch groups begin to differ greatly in the extraction techniques applied. Some prefer to use low-level, pixel based approaches with minimal alteration to the original image (Movellan and Mineiro,1998; Meier et al, 1999), whilst others insist that a high-level, model approach is the most efficientway to proceed (Hennecke et al, 1996; Leuttin and Dupont, 1998). The approach taken here issomewhere in the middle of this continuum; feature points are specifically chosen although nomodel is constructed. Section 5 elaborates further on this stage of AVSR.
3.3 Acoustic and Visual IntegrationA researcher’s answers to how to integrate and what learning algorithm to use are intimatelyintertwined as the type of recognition algorithm used heavily influences the type and method ofintegration used. The recognition problem here is basically a pattern matching problem and manyof the techniques from traditional ASR can be used, with modifications, for the recognition ofvisemes. Thus, many researchers are biased in the choice of recognition and integration algorithmsby what type of ASR system they may have been developing previously and therefore see AVSR asmerely an extension to their already powerful ASR system (Meier et al, 1999). This is not a problemunless the researcher does not take into account the special characteristics of the visual forms ofphonemes, that is, what is practical and what is not.
The two most widely used recognition techniques are the ANN and the Hidden Markov Model(HMM; Hennecke et al, 1996). HMMs have the distinct advantage that they are inherently rateinvariant and this is especially important for speaker independent ASR, where different speakersspeak at different rates (Charniak, 1993). Another important factor of HMMs concerning recognition,is that there are efficient algorithms for training and recognition, which is hugely beneficial whendealing with the large amounts of visual data that accumulates, especially if recognition is to be donein real-time. ANNs, on the other hand, are often criticised for their slow trainability and variance dueto rate. However, they do have the empowering ability to generalise to unseen data, given large
Journal of Research and Practice in Information Technology, Vol. 35, No. 1, February 2003 45Journal of Research and Practice in Information Technology, Vol. 35, No. 1, February 2003 45
Audio-Visual Speech Recognition using Red Exclusion and Neural Networks
enough training sets, and, moreover, they do not make any assumptions about the underlying data.Furthermore, they demonstrate graceful degradation in the presence of noise.
The two most closely followed psychologically derived models of integration are the directintegration (DI) and separate identification (SI) models. In the DI model, feature vectors of theacoustic and visual signals can be simply concatenated together, and then this vector can be used asinput into the HMM (Adjoudani and Benoit, 1996) or ANN (Meier et al, 1999). When following theDI model sensor integration occurs automatically and it is up to the recognition engine to decideupon the important features. This is the default approach if using ASR already.
Under the more sophisticated SI model integration becomes somewhat trickier. The simplest caseis when the outputs of separate ANNs are fed into another ANN that effectively performs theintegration task. In the case of HMMs the resulting log-likelihoods are combined in some way toproduce a final estimate. The most common, and simplest way to integrate the log-likelihoods is tocombine them in such a way to maximise their cross-product. Late integration (ie. SI) is an evolvingarea in AVSR and is a difficult issue to contend with because fusing the two signals can lead tocatastrophic fusion (Movellan and Mineiro, 1998). This is when the accuracy of the fused outcomeis less than the accuracy of both individual systems. Much work is underway for both HMMs andANNs in trying to automatically bias one signal when conditions are adverse for the other (Movellanand Mineiro, 1998; Adjoudani and Benoit, 1996; Meier et al, 1996; Massaro and Stork, 1998).
Which is better – early or late? This is a question still debated within the literature. Ontheoretical grounds and the necessity of maintaining temporal relationships between the signals,many argue for early integration (Bregler et al, 1996; Basu and Ho, 1999). For example, Henneckeet al (1996) state that late integration is just a special case of early integration and given the rightconditions “… a system that uses early integration should perform at least as well as one thatintegrates at a later stage. (p. 338, Hennecke et al, 1996).” Indeed, if an inadequate set of sensorspecific features are used, essential information can be thrown away in late integration.Comparative empirical studies, however, have found that late integration techniques are performingbetter than early integration even with the loss of synchronisation (Adjoudani and Benoit, 1996;Meier et al, 1999). The survey that follows is mainly made up of research involving variants of lateintegration as this technique has many more issues to overcome. For completeness, work on earlyintegration is also mentioned for comparison.
Potamiaonos and Potamianos (1999) use a multi-stream HMM in which the visual stream is justanother parameter to the HMM. The emission probability of the HMM is equal to the product of thesum distributions of each stream. These sum of distributions are augmented by a stream exponent�. This exponent models the reliability of each stream and satisfies,
The stream exponents are estimated using a generalised probabilistic descent algorithm. Thisappears to occur initially during training, but it is unclear as to whether the exponents aredynamically estimated during recognition. Thus in this system the late integration is taking placevia a weighted product of the contributions from the acoustic and visual channels. This is probablythe most common approach to sensor integration in this field and demonstrates that the AV systemis superior to the acoustic or visual alone. Although the word accuracy by this system is high (90.5%for AV) the weights on each stream are determined a priori to test time (i.e. on the training set) andthus if the conditions change enough the weightings might not correctly reflect the reliability ofeach the signals.
(1)
Journal of Research and Practice in Information Technology, Vol. 35, No. 1, February 20034646
Audio-Visual Speech Recognition using Red Exclusion and Neural Networks
Neti et al (2001) and Glotin et al (2001) have produced comparative studies of early, late withconstant weighting, and late with dynamic weighting audio-visual integration schemes. Thedynamic technique was based on the degree of voicing present in the audio stream average over theentire utterance such that 0 ≤ �A = degree of voicing ≤ 1 and �V = 1 – �A. Overall, the integrationsystem using the dynamic weights outperformed all others on a word recognition task in both cleanand noisy acoustic conditions. Interestingly, in clean acoustic conditions some of the late integrationtechniques were outperformed by the early integration and in some cases even demonstratedcatastrophic integration.
Dynamically setting the weights based on the current utterance is a preferred method ofintegration. This utterance based method, however, is somewhat lacking in its ability to generaliseto other situations. For example, if there was a loud, brief sound in the background this might affectthe overall average for the utterance and hence distort the weighting considerably. Calculating themedian instead of a mean might correct the weights for the majority of the speech segment, but thenat extra noisy sections performance would degrade. Dynamically determining the weights needs tooccur at a lower level. Moreover, waiting until the end of the utterance to determine weights meansthat integration can only take place after the entire utterance has been spoken.
Dupont and Leuttin (2000) tackle the problem of continuous speech recognition. In continuousspeech recognition the system must deal with co-articulation and the fact that the utterance has nopredetermined length. They claim that because of these factors waiting until the end of utterance tofuse is too time consuming for late integration architectures and that integration should occur duringthe utterance. Moreover a list of N-best hypotheses must be kept for each state until integrationoccurs. Their speech recognition system consists of a multi-stream HMM with NN as HMM stateprobability estimators. This system uses anchor points to denote where individual streams mustsynchronise (fuse). These anchors may occur on relevant phonological transition points, such asphonemes, syllable or words. Dupont and Leuttin (2000) only test anchor points at the HMM stateand word level. Integration is a weighted product of the segment likelihoods. These weights aredetermined by automatically estimating the acoustic SNR, such that the higher the SNR, the higherthe weight to the acoustic information. They make mention that with a clean signal the addition ofvisual information did not increase accuracy. However, with a clean signal (high SNR) the weightwas very high and it might be that the visual system does not have the ability to influence the resultgiven this weighting. Early integration (concatenation) yields inferior results compared to thedifferent late integration techniques. The most successful late integration was with combination atthe word level and including phoneme duration models into the HMM further increased theaccuracy. They mention that there is considerable temporal asynchrony between the acoustic andvisual modalities and that this asynchrony is not stable.
In their work, Adjoudani and Benoit (1996) strive for AV > A and AV > V over all testingconditions and explore several progressive model of integration. The first, an early integrationmethod, fails in acoustically noisy conditions because it is dragged down by the inability of thesystem to capture the contribution of the visual parameters. The first late integration technique is asimple maximisation of the product of the resulting probabilities across each output channel. In highSNR conditions the system is able to take advantage of the complimentary information between thesignals with AV outperforming both subsystems. In poor acoustic conditions, however, the systemis once again not able to correctly attribute each subsystem.
To overcome the inadequacy of the combination so far, Adjoudani and Benoit (1996) introduceda certainty factor to differentially weight each subsystem. This weighting factor differs frompreviously discussed architectures as it is not solely based upon the level of acoustic noise within
Journal of Research and Practice in Information Technology, Vol. 35, No. 1, February 2003 4747
Audio-Visual Speech Recognition using Red Exclusion and Neural Networks
the signal. Rather, it is based upon the dispersion of the N-best hypotheses in each modality, that is,large differences in probabilities equates to greater certainty, close probabilities to less certainty.The first application of the certainty factor was a binary selection of either the acoustic or visualhypothesis based on which had the greatest certainty. This method satisfy the original criteria set byAdjoudani and Benoit (1996), however it can only ever choose between the votes of the individualsubsystems because of its binary nature. A weighted product version of the late integration systembased on a normalised dispersion certainty factor combined the acoustic and visual system in asynergistically over all noise levels and can choose a different class from either subsystem.
The dispersion idea used by Adjoudani and Benoit (1996) has been implemented by otherresearchers in various forms (Meier et al, 1999; Potamianos and Neti, 2000; Heckmann et al, 2001).Using Gaussian mixture model (GMM) to classify phonemes, Potamianos and Neti (2000) use anN-best dispersion method that is framed as the difference between each pair of nth-best hypotheses,given by,
where N ≥ 2 and Rn is equal to the nth best hypothesis. Interestingly, both Adjoudani and Benoit(1996) and Potamianos and Neti (2000) have found that an N-best of four has been the mostsuccessful. Potamianos and Neti (2000) also use a method called N-best likelihood ratio average inwhich the difference is only calculated against the best hypothesis, that is,
The best performing system here was the one using dispersion as a confidence measure with aphoneme accuracy of 55.19%. The ratio average achieved an accuracy of 55.05%. Both of thesemethods were significantly better than the baseline acoustic only system. Another confidencemethod based on the negative entropy of the stream was unable to achieve accuracy significantlybetter than the baseline.
Basu and Ho (1999) also used GMMs for recognition but only looked at early integration. Incomparison to Potamianos and Neti (2000), the accuracy of the system on the test data wasconsistently below 50%. Moreover, the combined feature vector provides little increase in accuracy.The value of this research, however, is that they also test the system on a real-life data set. That is,one that is not collected in a controlled environment and without specialised equipment. Theperformance on this data set drops dramatically with 33% for acoustic only and 9% for visual only.This clearly demonstrates that moving out of the experimental environment can severely affect eventhe “state-of-the-art” systems.
Heckmann et al (2001) use a hybrid ANN/HMM AVSR system with the NNs providing the aposteriori probabilities for the HMM which provide the phone and word models (language models).Heckmann et al (2001) argue for and use a late integration method and use a weighting method theycall Geometric Weighting. Detecting the most probable phoneme is found by a conditionalprobability that is augmented by the geometric weights. The value of weight based on another valuec and they want c to reflect an estimate of the SNR of the acoustic signal. To achieve this they usea similar idea as dispersion by exploiting the distribution of the a posteriori probabilities at theoutput of the MLP, but based on the calculated entropy,
(2)
(3)
Journal of Research and Practice in Information Technology, Vol. 35, No. 1, February 20034848
Audio-Visual Speech Recognition using Red Exclusion and Neural Networks
where N is the number of phonemes and K is the number of frames. They created a mappingbetween c and H through an empirical analysis of the values (optimisation process). Results(WER%) show a synergistic gain using this technique down to -6dB (high noise level) where itstarts to perform worse than the visual. The automatic weighting performs similarly to manuallysetting c. They have also compared using entropy for setting c to using a Voicing Index andDispersion methods, however, the entropy based c still gave the best results (Heckmann et al, 2001).
Using a Multiple State-Time Delayed NN (MS-TDNN), Meier et al (1999) use the flexibility ofthe NN to employ several different integration methods for AVSR. They look at both the traditionalearly and late integration but also integration on the hidden layer of the NN. The early integrationtechnique included the standard concatenation and also the inclusion of an estimated SNR for theacoustic data. Late integration is explored in two different architectures. The first is a weighted sumof the acoustic and visual systems. The weight was determined either by a piecewise-linear mappingto the SNR of the acoustic signal or by what they called “entropy weights”. The calculation ofentropy weights was not fully described in this paper (or previouly for that matter, e.g. Meier et al,1996), however, their description of the purpose of the weights, High Entropy = Even Spread =High Ambiguity = Low Accuracy, is reminiscent of the dispersion concept from Adjoudani andBenoit (1996). The entropy weights were further augmented by a bias b that “… pre-skews theweights to favour one of the modalities (p. 4, Meier et al, 1999)”. This b value was hand set toreflect quality of the acoustic data.
A more interesting and novel technique introduced by Meier et al (1999) is the learning of theweights. They used another NN to combine both the acoustic and visual hypotheses with the outputbeing the combined phoneme hypothesis. Theoretically, this technique should be able to at leastmatch the performance of the other late integration techniques as it can not only compute pair-wisecomparison but also potentially make comparisons across the phoneme and viseme sets, thus takingadvantage of the complementary information contained within the signal better than the simpleweighted summation. In fact, best performance was with NN weight learning (except in high noiseconditions). As would be expected from the bias b, entropy and SNR weighting performed similarlythroughout. Early and hidden layer integration combinations were, as others have found, poorer inperformance.
Movellan and Mineiro (1998) compare standard Bayesian integration technique (sum of loglikelihoods) with what they call a robustified approach. They argue that most integration systemsuffer from catastrophic integration because they make implicit assumptions and degenerate quicklywhen those assumptions are broken and used outside its original context. The robustified approachmakes these assumptions explicit by including extra parameters that represent the non-stationaryproperties of the environment. These parameters make up what is dubbed the context model. Thisapproach works by not only maximising the probability with respect to the word but also to eachcontext model, acoustic and visual. Movellan and Mineiro (1998) prove analytically that theirapproach is superior to the traditional as when the measurements yield data far from the model thetraditional integration system is heavily influenced by this subsystem. In contrast, the robustifiedapproach, limits the influence of signals far from a contextual model. Applied to AVSR using aHMM this technique outperforms the classical in acoustic noise as well as with visual noise, an areanot investigated by many researchers. In situations where normal integration exhibits catastrophicintegration, the robustified integration is no worse than acoustic or visual subsystems.
(4)
Journal of Research and Practice in Information Technology, Vol. 35, No. 1, February 2003 4949
Audio-Visual Speech Recognition using Red Exclusion and Neural Networks
Not all of the research conducted follows the rigid late integration architecture of weightedsum/product of hypotheses. For example, Verma et al (1999) investigated audio-visual phonerecognition using Gaussian mixture models with their second and third late integration techniquesbeing somewhat out of the ordinary. They look at three models of late integration: 1) simpleweighted sum, 2) weighted sum but V identifying only viseme and using an associated probabilityof the phoneme given the viseme, and 3) use both A and V to predict viseme (weighted sum, phase1), then based on viseme class predict which phoneme class (weighted sum, phase 2). The sum ofthe weights was equal to 1 and was again adjusted manually. The recognition accuracies of theGMMs were well below that of systems combined with HMM. The third integration technique(multi-phase) performed the best. However, this technique is not the most intuitive and a primeexample of a system developed without linguistic knowledge. The very characteristic that is maskedby noise in acoustic speech is the one that distinguishes the viseme classes (eg. /b/ from /d/, placeof articulation), so that using hypotheses derived from the acoustic data in phase 1 could be moreof a hindrance (although this isn’t what is found in their experiments). Then in phase 2 they use Vto distinguish within viseme classes! This is again very counterintuitive, given the definition of aviseme.
A more logical approach to integration is presented by Rogozan (1999). This approach isinteresting as it uses both early and late integration in the one system. First a HMM based systemproduces a hypothesis based on a combined bimodal observation (early integration). Then based onthe N-best phoneme hypotheses, another system (a HMM or a NN) refines the result using thevisual observations. The results of these two systems are then fused (late integration) using areliability measure based on the dispersion of accuracy of the N-best. In this work the visualprocessing is used in the late integration to perform visual discrimination to remove any ambiguityof the hypothesis derived from the acoustics signal. This system is much more linguistically soundthan the multi-phase system of Verma et al (1999).
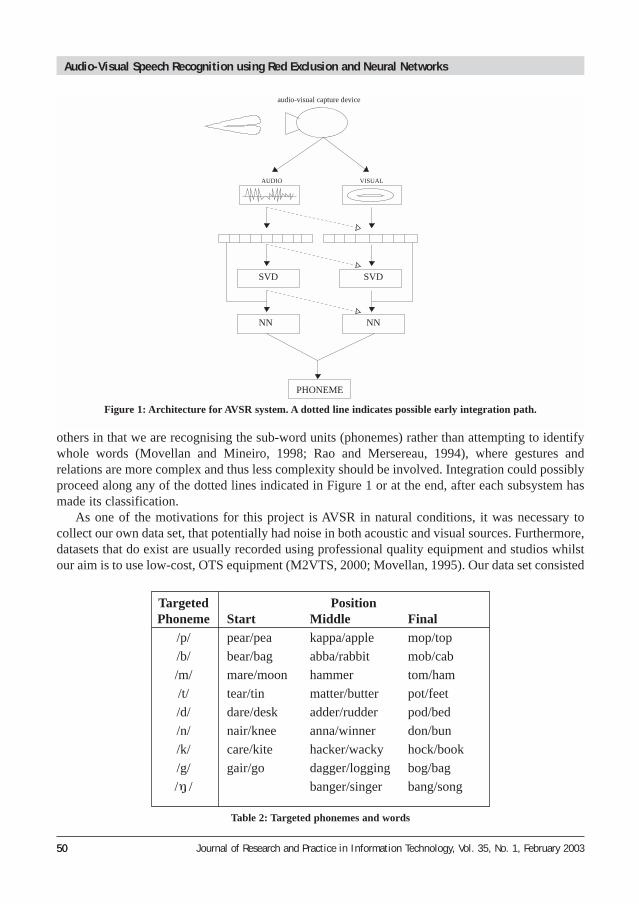
4. THE BROADER ASPECTMany of the AVSR systems that have been tested are often restricted to operate in well-definedexperimental conditions, for example, controlled lighting conditions, and minimal acoustic andvisual noise levels. Performance of these systems in adverse conditions is usually tested byartificially increasing the noise levels (Movellan and Mineiro, 1998). One of the goals of this projectis to train and test the AVSR system with naturally degraded input, with varying amounts of noise,such that the system should perform well in all conditions. This includes the development of arobust visual system for finding lip features, which is the focus of Section 5. Figure 1 is a schematicrepresentation of the architecture of the AVSR system that we are developing.
Using a low-cost, off-the-shelf (OTS) integrated audio-visual capture device1, the audio andvisual signals are passed through preprocessing stages where feature vectors are built up. Currentlythis stage is completed off-line, but there is progress being made towards real-time featureextraction. The feature vectors can be further reduced in sized by using a data reduction technique,for example principal components analysis (PCA) or its generalisation, singular valued decom-position (SVD; Gray et al, 1997; Schifferdecker, 1994).
This is a common trick for overcoming the large amounts of data for visual processing and canimprove and speed up training when using ANNs. The feature vectors are then passed to a classifier,in this case an ANN, where the phoneme (viseme) is identified. At this point this system differs from
1 In this case, a Philips VestaPro (PCVC680K) recording at 44.1kHz, 16bit audio and 352x288, 20fps, 24bit video.
Journal of Research and Practice in Information Technology, Vol. 35, No. 1, February 20035050
Audio-Visual Speech Recognition using Red Exclusion and Neural Networks
others in that we are recognising the sub-word units (phonemes) rather than attempting to identifywhole words (Movellan and Mineiro, 1998; Rao and Mersereau, 1994), where gestures andrelations are more complex and thus less complexity should be involved. Integration could possiblyproceed along any of the dotted lines indicated in Figure 1 or at the end, after each subsystem hasmade its classification.
As one of the motivations for this project is AVSR in natural conditions, it was necessary tocollect our own data set, that potentially had noise in both acoustic and visual sources. Furthermore,datasets that do exist are usually recorded using professional quality equipment and studios whilstour aim is to use low-cost, OTS equipment (M2VTS, 2000; Movellan, 1995). Our data set consisted
AUDIO VISUAL
PHONEME
SVD SVD
NN NN
audio-visual capture device
Figure 1: Architecture for AVSR system. A dotted line indicates possible early integration path.
Targeted PositionPhoneme Start Middle Final
/p/ pear/pea kappa/apple mop/top
/b/ bear/bag abba/rabbit mob/cab
/m/ mare/moon hammer tom/ham
/t/ tear/tin matter/butter pot/feet
/d/ dare/desk adder/rudder pod/bed
/n/ nair/knee anna/winner don/bun
/k/ care/kite hacker/wacky hock/book
/g/ gair/go dagger/logging bog/bag
/ / banger/singer bang/song
Table 2: Targeted phonemes and words
Journal of Research and Practice in Information Technology, Vol. 35, No. 1, February 2003 5151
Audio-Visual Speech Recognition using Red Exclusion and Neural Networks
of AV recordings of spoken words that expressed most of the phonetic contexts of the differentphonemes found in (Australian) English, eg. /p/ – pot, apple, cop. These word sets were spoken bythree people, two males and one female, that varied greatly in appearance. In the following sections,this database has been used to test the algorithms explained. However only a subset of the phonemeshave been used for the recognition experiments (see Table 2).
5. FEATURE EXTRACTION5.1 Visual FeaturesThe accurate extraction of lip features for recognition is a fundamental first step in AVSR. Moreover,the consistency of the extraction is very important if it is to be used in a variety of conditions andpeople. Broadly speaking there exist two different schools of thought for visual processing (Bregleret al, 1993). At one extreme, there are those who believe that the feature extraction stage shouldreduce the visual input to the least amount of hand-crafted features as possible, such as deformabletemplates (Hennecke et al, 1994). This type of approach has the advantage that the number of visualinputs are drastically reduced – potential speeding up subsequent processing and reducing thevariability and increasing generalisability. However, this approach has been heavily criticised as itcan be time consuming in fitting a model to each frame (Rao and Mersereau, 1994) and, mostimportantly, the model may exclude linguistically relevant information (Gray et al, 1997; Bregler etal, 1993). The opponents of this approach believe that only minimal processing should be applied tothe found mouth image, so as to reduce the amount of information lost due to any transformation.For example, Gray et al, (1997) found that simply using the difference between the current andprevious frames produce results that were better than using PCA. However, in this approach thefeature vector is equal to the size of the image (40x60 in most cases), which is potentially orders ofmagnitudes larger than a model based approach. This can become a problem depending on the choiceof recognition system and training regime, however, successful systems have been developed usingboth HMMs and ANNs using this approach (Movellan and Mineiro, 1998; Meier et al, 1999).
Of course there are many systems that lie between the two extremes, and the model extrema canalso benefit from better feature extraction methods as this is the first step of many models. We willnow examine some of the more popular methods for initial feature extraction and how well theywork for the subjects in our data set. The first feature set that is usually extracted from the moutharea is the lip corner pair. For this stage many of the algorithms use very similar techniques, suchas peak picking (Prasad et al, 1993), and thus the focus will be on how they extract the lip corners.
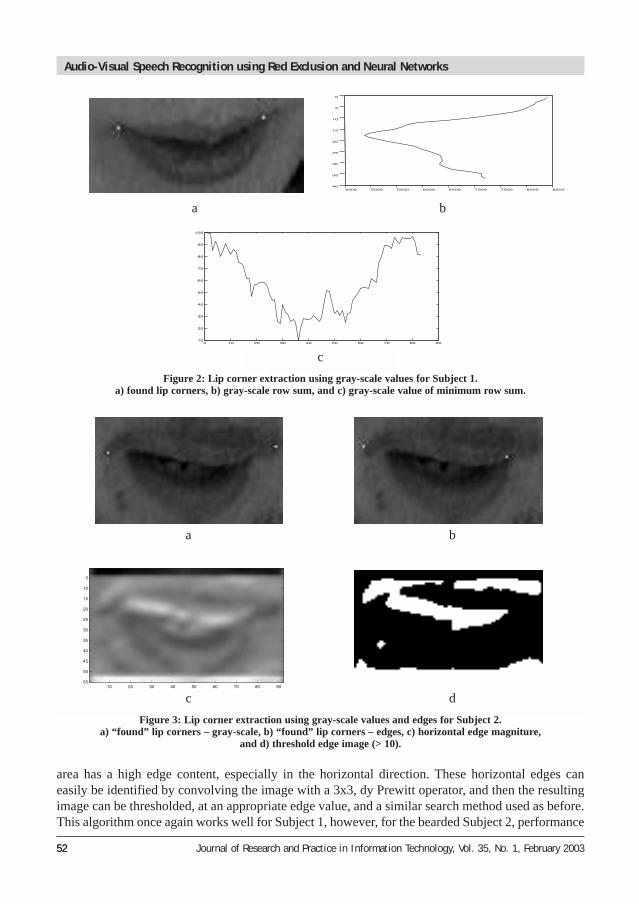
5.1.1. Grayscale One of the most common methods for feature extraction of mouth features is the use of the gray-scalevalue and edge detection (Rao and Mersereau, 1994; Stiefelhagen et al, 1997). The initial step, as withmany of these techniques, is the identification of the vertical position of the centre of the mouth. Thiscan be achieved by taking the sum of each row and finding the row with the minimum value, Figure2a. Then by examining the actual values of the minimum row, and possibly rows close to it, from theleft and right, one can discover the lip corners by setting a threshold. In Figure 2, the threshold wasset to the average of the maximum and minimum values for that row. For subject 1 the method workswell, however, on subject 2, Figure 3a, the method works poorly due to the slight presence of a beard.
5.1.2. Horizontal Edges Another common method that makes use of gray-scale values, that has been more successful, is theuse of horizontal edges (Stiefelhagen et al, 1997). The rationale behind this idea is that the mouth
Journal of Research and Practice in Information Technology, Vol. 35, No. 1, February 20035252
Audio-Visual Speech Recognition using Red Exclusion and Neural Networks
area has a high edge content, especially in the horizontal direction. These horizontal edges caneasily be identified by convolving the image with a 3x3, dy Prewitt operator, and then the resultingimage can be thresholded, at an appropriate edge value, and a similar search method used as before.This algorithm once again works well for Subject 1, however, for the bearded Subject 2, performance
Figure 2: Lip corner extraction using gray-scale values for Subject 1. a) found lip corners, b) gray-scale row sum, and c) gray-scale value of minimum row sum.
Figure 3: Lip corner extraction using gray-scale values and edges for Subject 2.a) “found” lip corners – gray-scale, b) “found” lip corners – edges, c) horizontal edge magniture,
and d) threshold edge image (> 10).
a
c
a
c d
b
b
Journal of Research and Practice in Information Technology, Vol. 35, No. 1, February 2003 5353
Audio-Visual Speech Recognition using Red Exclusion and Neural Networks
is way below what is acceptable. The beard itself has high edge content in both vertical andhorizontal directions and, thus the edge finding technique falls down under this generalisation.Increasing the threshold any further will decrease the amount of beard detected, unfortunately, thisalso results in shrinkage of the detected lip region.
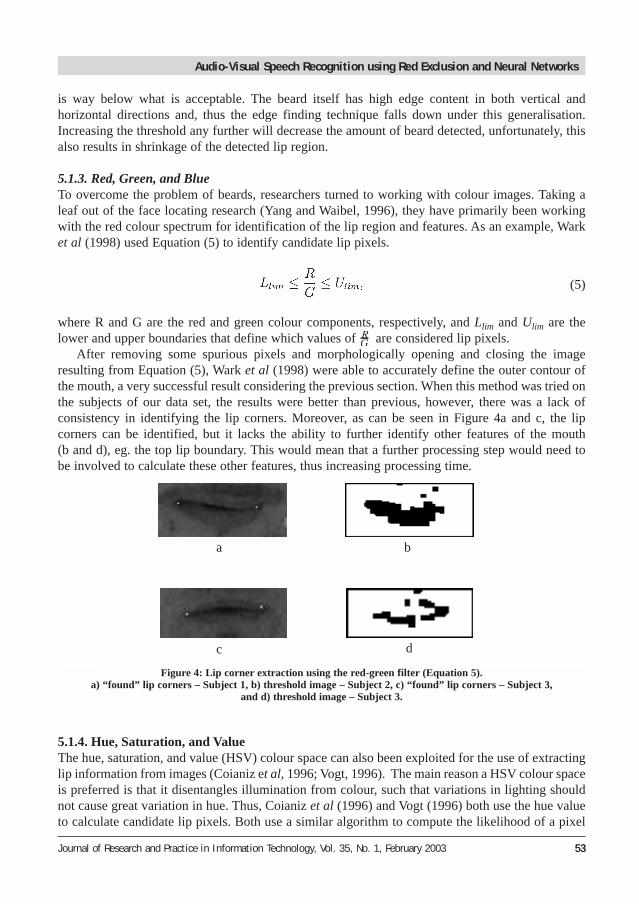
5.1.3. Red, Green, and BlueTo overcome the problem of beards, researchers turned to working with colour images. Taking aleaf out of the face locating research (Yang and Waibel, 1996), they have primarily been workingwith the red colour spectrum for identification of the lip region and features. As an example, Warket al (1998) used Equation (5) to identify candidate lip pixels.
where R and G are the red and green colour components, respectively, and Llim and Ulim are thelower and upper boundaries that define which values of are considered lip pixels.
After removing some spurious pixels and morphologically opening and closing the imageresulting from Equation (5), Wark et al (1998) were able to accurately define the outer contour ofthe mouth, a very successful result considering the previous section. When this method was tried onthe subjects of our data set, the results were better than previous, however, there was a lack ofconsistency in identifying the lip corners. Moreover, as can be seen in Figure 4a and c, the lipcorners can be identified, but it lacks the ability to further identify other features of the mouth (b and d), eg. the top lip boundary. This would mean that a further processing step would need tobe involved to calculate these other features, thus increasing processing time.
5.1.4. Hue, Saturation, and ValueThe hue, saturation, and value (HSV) colour space can also been exploited for the use of extractinglip information from images (Coianiz et al, 1996; Vogt, 1996). The main reason a HSV colour spaceis preferred is that it disentangles illumination from colour, such that variations in lighting shouldnot cause great variation in hue. Thus, Coianiz et al (1996) and Vogt (1996) both use the hue valueto calculate candidate lip pixels. Both use a similar algorithm to compute the likelihood of a pixel
(5)
a
c d
b
Figure 4: Lip corner extraction using the red-green filter (Equation 5).a) “found” lip corners – Subject 1, b) threshold image – Subject 2, c) “found” lip corners – Subject 3,
and d) threshold image – Subject 3.
Journal of Research and Practice in Information Technology, Vol. 35, No. 1, February 20035454
Audio-Visual Speech Recognition using Red Exclusion and Neural Networks
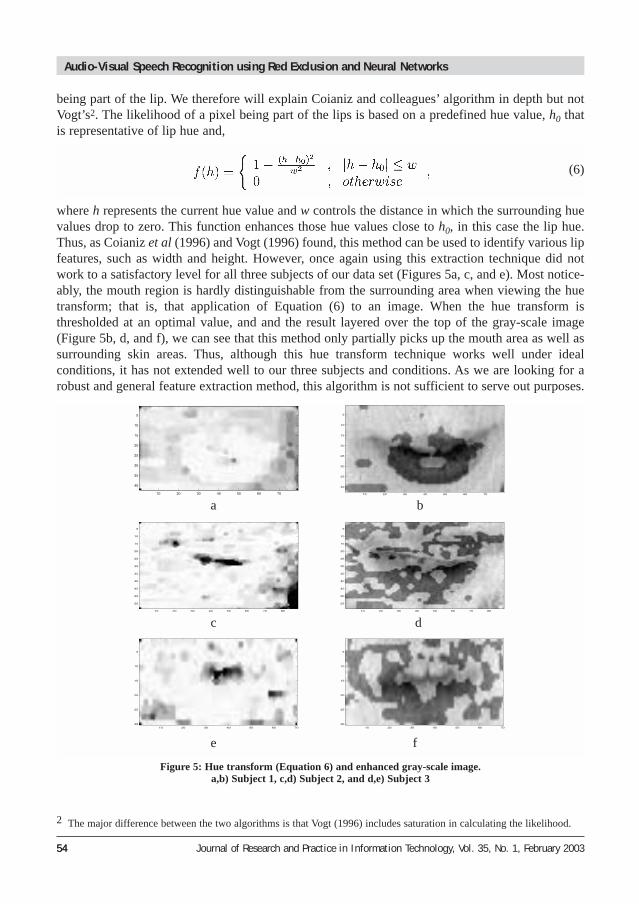
being part of the lip. We therefore will explain Coianiz and colleagues’ algorithm in depth but notVogt’s2. The likelihood of a pixel being part of the lips is based on a predefined hue value, h0 thatis representative of lip hue and,
where h represents the current hue value and w controls the distance in which the surrounding huevalues drop to zero. This function enhances those hue values close to h0, in this case the lip hue.Thus, as Coianiz et al (1996) and Vogt (1996) found, this method can be used to identify various lipfeatures, such as width and height. However, once again using this extraction technique did notwork to a satisfactory level for all three subjects of our data set (Figures 5a, c, and e). Most notice-ably, the mouth region is hardly distinguishable from the surrounding area when viewing the huetransform; that is, that application of Equation (6) to an image. When the hue transform isthresholded at an optimal value, and and the result layered over the top of the gray-scale image(Figure 5b, d, and f), we can see that this method only partially picks up the mouth area as well assurrounding skin areas. Thus, although this hue transform technique works well under idealconditions, it has not extended well to our three subjects and conditions. As we are looking for arobust and general feature extraction method, this algorithm is not sufficient to serve out purposes.
(6)
2 The major difference between the two algorithms is that Vogt (1996) includes saturation in calculating the likelihood.
Figure 5: Hue transform (Equation 6) and enhanced gray-scale image.a,b) Subject 1, c,d) Subject 2, and d,e) Subject 3
a
c
e f
d
b
Journal of Research and Practice in Information Technology, Vol. 35, No. 1, February 2003 5555
Audio-Visual Speech Recognition using Red Exclusion and Neural Networks
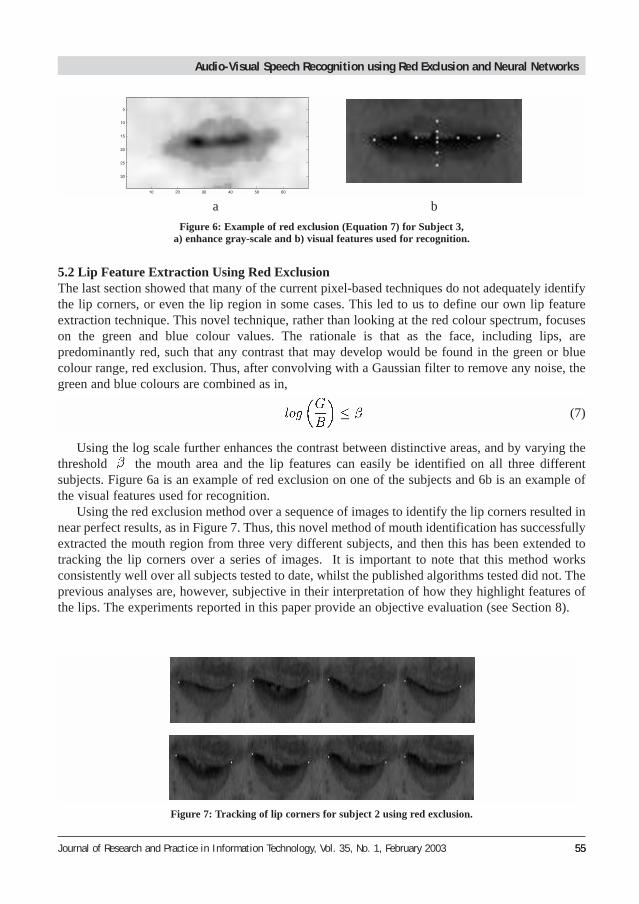
5.2 Lip Feature Extraction Using Red ExclusionThe last section showed that many of the current pixel-based techniques do not adequately identifythe lip corners, or even the lip region in some cases. This led to us to define our own lip featureextraction technique. This novel technique, rather than looking at the red colour spectrum, focuseson the green and blue colour values. The rationale is that as the face, including lips, arepredominantly red, such that any contrast that may develop would be found in the green or bluecolour range, red exclusion. Thus, after convolving with a Gaussian filter to remove any noise, thegreen and blue colours are combined as in,
Using the log scale further enhances the contrast between distinctive areas, and by varying thethreshold the mouth area and the lip features can easily be identified on all three differentsubjects. Figure 6a is an example of red exclusion on one of the subjects and 6b is an example ofthe visual features used for recognition.
Using the red exclusion method over a sequence of images to identify the lip corners resulted innear perfect results, as in Figure 7. Thus, this novel method of mouth identification has successfullyextracted the mouth region from three very different subjects, and then this has been extended totracking the lip corners over a series of images. It is important to note that this method worksconsistently well over all subjects tested to date, whilst the published algorithms tested did not. Theprevious analyses are, however, subjective in their interpretation of how they highlight features ofthe lips. The experiments reported in this paper provide an objective evaluation (see Section 8).
Figure 7: Tracking of lip corners for subject 2 using red exclusion.
a b
Figure 6: Example of red exclusion (Equation 7) for Subject 3, a) enhance gray-scale and b) visual features used for recognition.
(7)
Journal of Research and Practice in Information Technology, Vol. 35, No. 1, February 20035656
Audio-Visual Speech Recognition using Red Exclusion and Neural Networks
5.3. Acoustic FeaturesThe choice of the representation of the (acoustic) speech signal is critical (Schafer and Rabiner,1990). Many different representations of speech have been developed, including simple waveformcodings, time and frequency domain techniques, linear predictive coding, and nonlinear orhomomorphic representations. Here, we focus on the homomorphic representations, especially themel-cepstrum representation.
The mel-frequency scale is defined as a linear frequency spacing below 1000 Hz and a logarithmicspacing above 1000 Hz (Davis and Mermelstein, 1990). This representation is preferred by many inthe speech community as it more closely resembles the subjective human perception of sinewavepitch (Brookes, 2000; Rabiner and Juang, 1993). A compact representation of the phoneticallyimportant features of the speech signal can be encoded by a set of mel-cepstrum coefficients, with thecepstral coefficients being the Fourier transform representation of the log magnitude spectrum.
The mel-cepstrum representation of acoustic speech has had great success in all areas of speechprocessing, including speech recognition. It has been found to be a more robust, reliable feature setfor speech recognition than other forms of representation (Davis and Mermelstein, 1990; Rabinerand Juang, 1993). Thus, it was decided that this was the best representation to be used for thefollowing recognition experiments. Moreover, the cepstrum has been found to be invaluable inidentifying the voicing of particular speech segments (Schafer and Rabiner, 1990).
As per Movellan and Mineiro (1998), the first 12 cepstral coefficients, 12 delta-cepstralcoefficients, 1 log-power and 1 delta log-power were extracted from the speech signal. Thisextraction was performed in Matlab using the speech processing toolbox VOICEBOX (Brookes,2000) and a final data vector of 130 features (26 features per acoustic frame by 5 frames), which iscomparable to the number of visual features, was used for the following experiments.
6. INTEGRATION ARCHITECTURESThis section overviews the three integration architectures tested. The first is a simple early inte-gration technique, whilst the last two are more complicated late integration architectures.
6.1 Early IntegrationA very simple approach to early integration has been followed. The acoustic and visual data sets areconcatenated together, giving one large input vector from which data transformation andrecognition can occur (Hennecke et al, 1996). This vector is then used as input into a multi-layerperceptron (MLP) with one hidden layer. The number of neurons in the hidden layer was equal tothe log2 of the number of input neurons. Supervised training was performed using backpropagationusing a mean squared error performance function and a training algorithm known as resilientbackpropagation. The purpose of resilient backpropagation algorithm is to eliminate the potentiallyharmful effects of the magnitude of the gradient. Basically, it does this by only considering the signof the derivative to calculate the direction of the weight update. The method converges much fasterthan standard gradient descent and is useful for large problems (Demuth and Beale, 1998).
6.2 Late IntegrationMany complicated techniques have been developed for integration of acoustic and visual networks(Section 3.3), however, an analysis by Meier, Hurst and Duchnowski (1996), found that the best lateintegration technique was to use a neural network for the integration (Meier et al, 1996;1999). Abonus of late integration is that the acoustic and visual data do not have to be in perfect synchrony,because the acoustic and visual subnets effectively act as independent recognisers.
Journal of Research and Practice in Information Technology, Vol. 35, No. 1, February 2003 5757
Audio-Visual Speech Recognition using Red Exclusion and Neural Networks
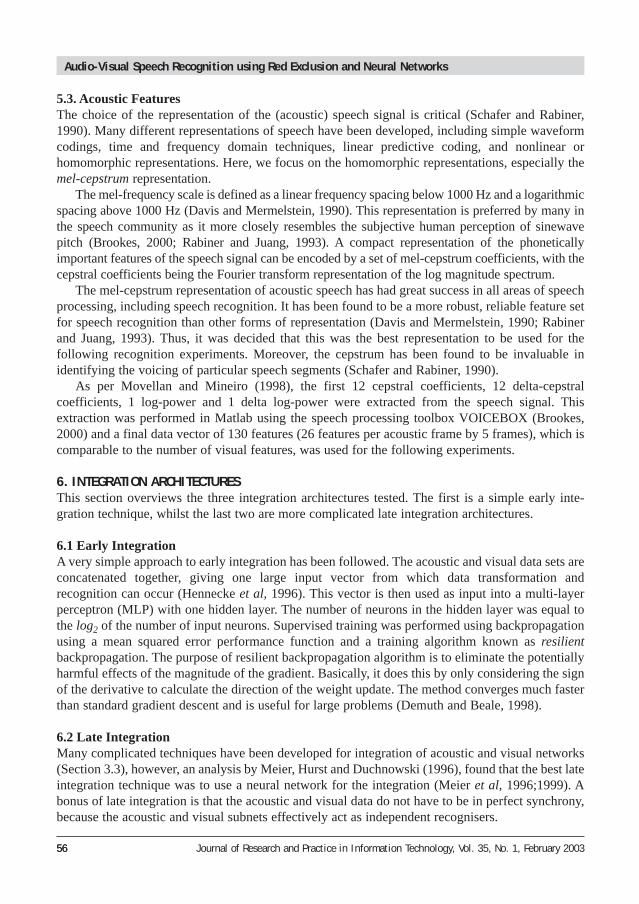
As the subnets are effectively their own recognisers, the training of the late integration networkis a little bit more complicated than before and included two phases. The two phases of training andthe basic architecture are outlined in Figure 8 (ignore part 1b for the moment).
The first phase involves training the acoustic and visual subnets. Once the training of eachsubnet is completed, the training data is passed through the respective network which produces twooutputs – one from each subnet. Phase two of the training uses these outputs by concatenating themtogether and then this data is used to train the integration network. To test the network, a separateset of acoustic and visual data were passed through the respective subnets. The output from eachnetwork was concatenated in the same way as in training and then this data was used to test theintegration capabilities of the ANN.
Most researchers use the brute force of the algorithm to recognise each phoneme/word, ie eachmodality attempting to recognise everything. Using late integration, however, one can alter whateach subnet is recognising. As would be expected from psycholinguistic research the followingwere tested: phoneme-phoneme (P-P), phoneme-viseme (P-V), voicing-viseme (Voi-V), where thefirst is the acoustic subnet and the second is the visual.
6.3 Late Integration with ErrorTo combat the amount of error that exists in the network, two extra networks have been introducedinto the architecture (Figure 8 – 1b). The two new networks can be considered as error predictingnetworks, one for each subnet. The training stage for these ANN, part 1b, occurs after the trainingof the acoustic and visual ANNs, but before the integration network. The training data for thesenetworks is the same for which subnet it is predicting the error for. The target pattern for the errornetwork is,
Phase 1
Combined Acoustic and Visual Output
Integration Net
Itarget Ioutput
Phoneme Classification
Train
Phase 2
AcousticData
VisualData
Acoustic Net V isual Net
Voutput
Train
Aoutput
Atarget Vtarget
AError Net
1b
VError Net
Figure 8: Late Integration with Error Component
(8)
Journal of Research and Practice in Information Technology, Vol. 35, No. 1, February 20035858
Audio-Visual Speech Recognition using Red Exclusion and Neural Networks
where TE is the target vector, TA is the target vector for the acoustic subnet, and OA is the output ofthe training acoustic network on the training data. The same is also true for the visual error ANN.
The result of Equation 8 is in the range [-1,1], thus in order to train the network to produceresults in this range a tan sigmoid transfer function was used on the output layer, rather than the logsigmoid which transforms data into the range [0,1].
The motivation behind this type of network is to help the integration network decide when aninput is useful. Thus, the output of the error ANN needs to reflect the usefulness of data. In itspresent form the output represents a high error as either -1 or 1, and a perfect match with 0. This setup may actually impede the performance of the integration network, thus before the output of theerror ANN is used for training, it is transformed by,
which transforms the data such to a perfect classification is ranked as 1 and a high error as 0.
7. METHOD AND DATA PREPARATION7.1 Filter Comparision on AVSR TaskTo further assess the utility of red exclusion as a feature extraction technique a comparative analysisof each technique described in Section 5 was carried out. As each filter required to have parametersset a priori, images were selected as prototypical examples of each subject and the key features (leftcorner, right corner, middle top and middle bottom of the mouth) were hand labelled. Using aniterative approach, the parameter spaces were searched to find values that gave the least distancebetween hand and filter labelled key features. The resulting parameter sets were used for subsequentfeature extraction.
A 300 fold bootstrapping procedure, with 100 at a maximum training epoch of 5000 and another200 with a maximum training epoch of 10,000 were used. Randomly selected training and testingdata were used for each trial at a 50:50 ratio without replacement. For each trial the training andtesting data were mutually exclusive, however, there was no guarantee of evenly distributed data,even though a uniform random number generator was used. The data was normalised by scaling thedata such that it had a zero mean and unity standard deviation (Demuth and Beale, 1998).
For each image five different filters were used to initally extract the mouth contour. From thiscontour the same processing applied to each technique to calculate the required features (eg. heightand width). Using these features an ANN was trained and tested on its ability to distinguish visemes.
7.2 Recognition ExperimentsFor all the results of the recognition experiments that follow, a 10-fold bootstrapping procedure,with randomly selected training and testing data for each trial, was adhered to.
In addition to the raw and normalised data sets, two other transformations were performed in thehope to improve recognition accuracy. SVD was performed on the data and attributes witheigenvalues greater than 0.001 were used. We also tested a combination of normalisation and thenSVD. Therefore, there were four types of data to train each neural network upon – raw, normalised(N), SVD, and N/SVD.
Phoneme, Viseme, or Voicing were the three possible classification tasks for a NN to perform. 1. Phoneme classification tasks involved discriminating between the stops /p,b,m,t,d,n,k,g, /. 2. Viseme classes are defined as labial (/p,b,m/), dental (/t,d,n/), and glottal (/k,g, /). 3. The voicing task discriminated between unvoiced (/p,t,k/), voiced (/b,d,g/) and nasal stops
(/m,n, /).
(9)
Journal of Research and Practice in Information Technology, Vol. 35, No. 1, February 2003 5959
Audio-Visual Speech Recognition using Red Exclusion and Neural Networks
Thus, the tasks were 9, 3, and 3 item discrimination tasks, respectively. This is more generallyuseful then the word level preferred by many which are biased by the use of statistical or langaugemodels – thus not directly comparable in terms of raw recall accuracy.
8. RESULTSBefore presenting the results the reader is reminder that the ANN were trained on a very limited setof low resolution data: two examples of each phoneme/position pair for each of three subjects.Furthermore, low-cost OTS equipment was used and each subject was seated 1.5 to 1.8 metres fromthe recording device.
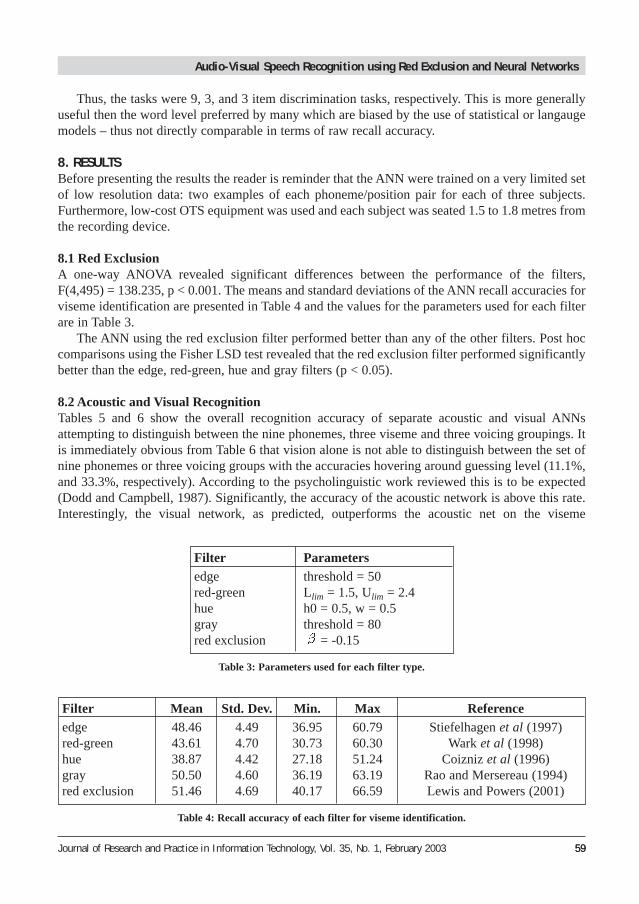
8.1 Red ExclusionA one-way ANOVA revealed significant differences between the performance of the filters,F(4,495) = 138.235, p < 0.001. The means and standard deviations of the ANN recall accuracies forviseme identification are presented in Table 4 and the values for the parameters used for each filterare in Table 3.
The ANN using the red exclusion filter performed better than any of the other filters. Post hoccomparisons using the Fisher LSD test revealed that the red exclusion filter performed significantlybetter than the edge, red-green, hue and gray filters (p < 0.05).
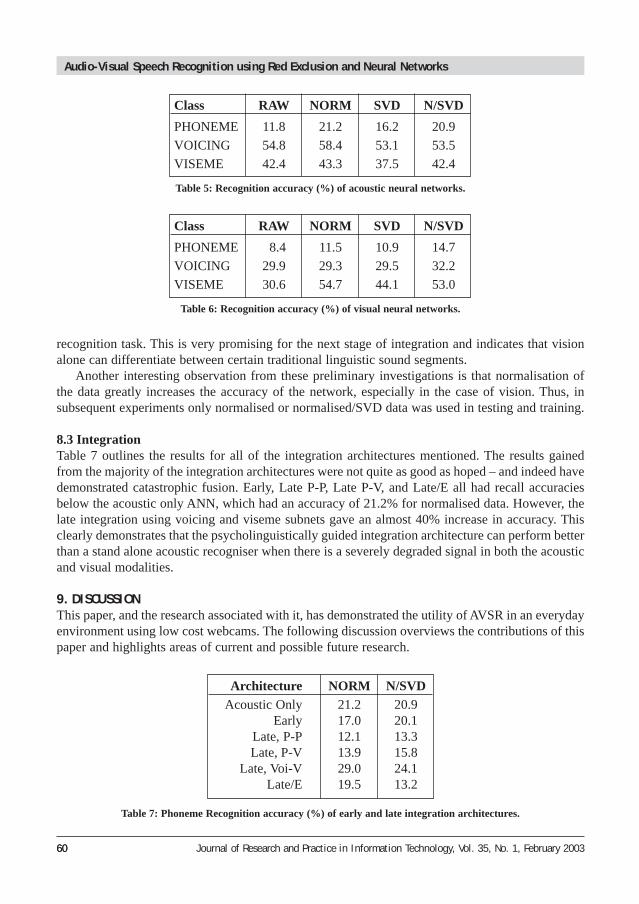
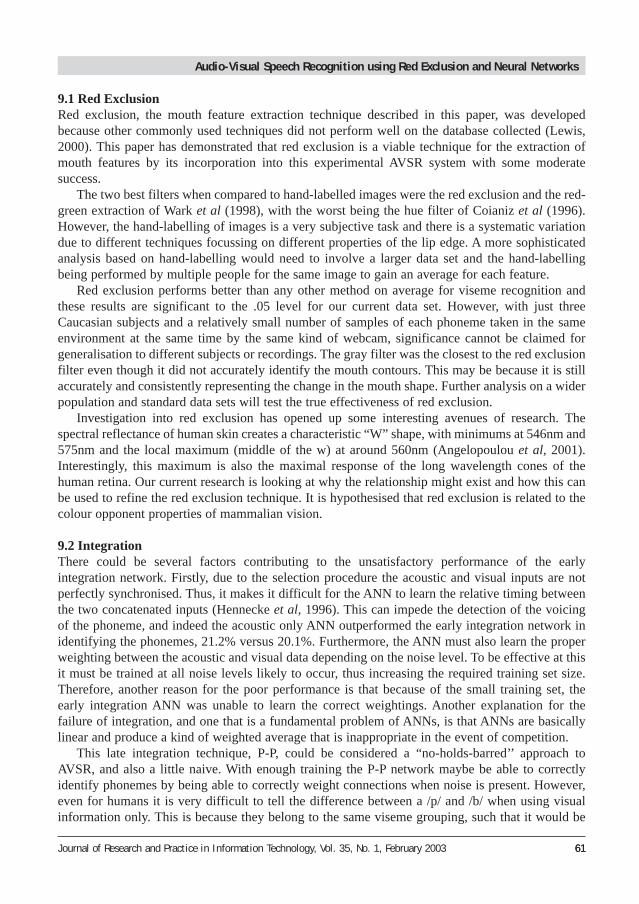
8.2 Acoustic and Visual RecognitionTables 5 and 6 show the overall recognition accuracy of separate acoustic and visual ANNsattempting to distinguish between the nine phonemes, three viseme and three voicing groupings. Itis immediately obvious from Table 6 that vision alone is not able to distinguish between the set ofnine phonemes or three voicing groups with the accuracies hovering around guessing level (11.1%,and 33.3%, respectively). According to the psycholinguistic work reviewed this is to be expected(Dodd and Campbell, 1987). Significantly, the accuracy of the acoustic network is above this rate.Interestingly, the visual network, as predicted, outperforms the acoustic net on the viseme
Filter Parametersedge threshold = 50red-green Llim = 1.5, Ulim = 2.4hue h0 = 0.5, w = 0.5gray threshold = 80red exclusion = -0.15
Table 3: Parameters used for each filter type.
Filter Mean Std. Dev. Min. Max Referenceedge 48.46 4.49 36.95 60.79 Stiefelhagen et al (1997)red-green 43.61 4.70 30.73 60.30 Wark et al (1998)hue 38.87 4.42 27.18 51.24 Coizniz et al (1996)gray 50.50 4.60 36.19 63.19 Rao and Mersereau (1994)red exclusion 51.46 4.69 40.17 66.59 Lewis and Powers (2001)
Table 4: Recall accuracy of each filter for viseme identification.
Journal of Research and Practice in Information Technology, Vol. 35, No. 1, February 20036060
Audio-Visual Speech Recognition using Red Exclusion and Neural Networks
recognition task. This is very promising for the next stage of integration and indicates that visionalone can differentiate between certain traditional linguistic sound segments.
Another interesting observation from these preliminary investigations is that normalisation ofthe data greatly increases the accuracy of the network, especially in the case of vision. Thus, insubsequent experiments only normalised or normalised/SVD data was used in testing and training.
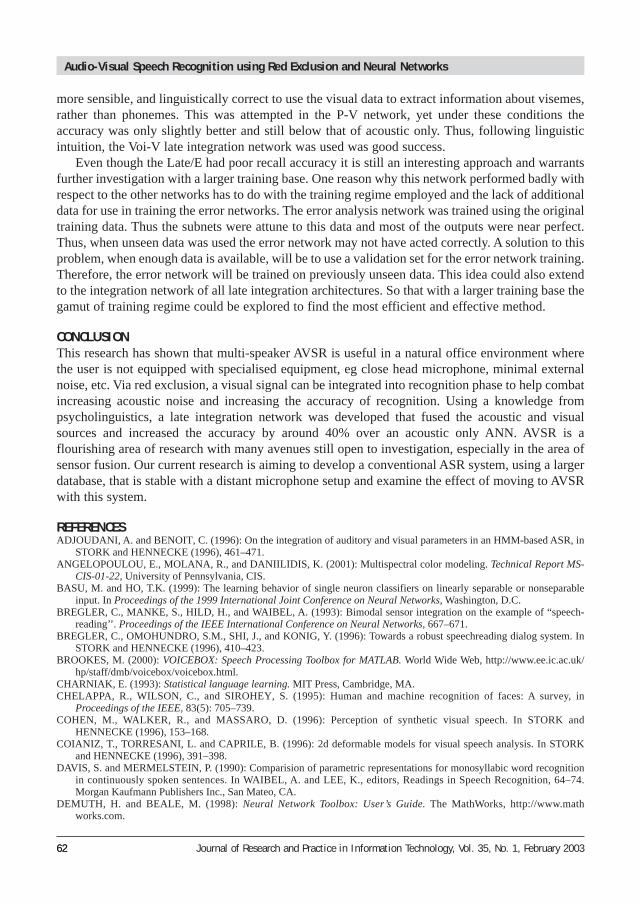
8.3 IntegrationTable 7 outlines the results for all of the integration architectures mentioned. The results gainedfrom the majority of the integration architectures were not quite as good as hoped – and indeed havedemonstrated catastrophic fusion. Early, Late P-P, Late P-V, and Late/E all had recall accuraciesbelow the acoustic only ANN, which had an accuracy of 21.2% for normalised data. However, thelate integration using voicing and viseme subnets gave an almost 40% increase in accuracy. Thisclearly demonstrates that the psycholinguistically guided integration architecture can perform betterthan a stand alone acoustic recogniser when there is a severely degraded signal in both the acousticand visual modalities.
9. DISCUSSIONThis paper, and the research associated with it, has demonstrated the utility of AVSR in an everydayenvironment using low cost webcams. The following discussion overviews the contributions of thispaper and highlights areas of current and possible future research.
Class RAW NORM SVD N/SVD
PHONEME 11.8 21.2 16.2 20.9
VOICING 54.8 58.4 53.1 53.5
VISEME 42.4 43.3 37.5 42.4
Table 5: Recognition accuracy (%) of acoustic neural networks.
Class RAW NORM SVD N/SVD
PHONEME 8.4 11.5 10.9 14.7
VOICING 29.9 29.3 29.5 32.2
VISEME 30.6 54.7 44.1 53.0
Table 6: Recognition accuracy (%) of visual neural networks.
Architecture NORM N/SVDAcoustic Only 21.2 20.9
Early 17.0 20.1Late, P-P 12.1 13.3Late, P-V 13.9 15.8
Late, Voi-V 29.0 24.1Late/E 19.5 13.2
Table 7: Phoneme Recognition accuracy (%) of early and late integration architectures.
Journal of Research and Practice in Information Technology, Vol. 35, No. 1, February 2003 6161
Audio-Visual Speech Recognition using Red Exclusion and Neural Networks
9.1 Red ExclusionRed exclusion, the mouth feature extraction technique described in this paper, was developedbecause other commonly used techniques did not perform well on the database collected (Lewis,2000). This paper has demonstrated that red exclusion is a viable technique for the extraction ofmouth features by its incorporation into this experimental AVSR system with some moderatesuccess.
The two best filters when compared to hand-labelled images were the red exclusion and the red-green extraction of Wark et al (1998), with the worst being the hue filter of Coianiz et al (1996).However, the hand-labelling of images is a very subjective task and there is a systematic variationdue to different techniques focussing on different properties of the lip edge. A more sophisticatedanalysis based on hand-labelling would need to involve a larger data set and the hand-labellingbeing performed by multiple people for the same image to gain an average for each feature.
Red exclusion performs better than any other method on average for viseme recognition andthese results are significant to the .05 level for our current data set. However, with just threeCaucasian subjects and a relatively small number of samples of each phoneme taken in the sameenvironment at the same time by the same kind of webcam, significance cannot be claimed forgeneralisation to different subjects or recordings. The gray filter was the closest to the red exclusionfilter even though it did not accurately identify the mouth contours. This may be because it is stillaccurately and consistently representing the change in the mouth shape. Further analysis on a widerpopulation and standard data sets will test the true effectiveness of red exclusion.
Investigation into red exclusion has opened up some interesting avenues of research. Thespectral reflectance of human skin creates a characteristic “W” shape, with minimums at 546nm and575nm and the local maximum (middle of the w) at around 560nm (Angelopoulou et al, 2001).Interestingly, this maximum is also the maximal response of the long wavelength cones of thehuman retina. Our current research is looking at why the relationship might exist and how this canbe used to refine the red exclusion technique. It is hypothesised that red exclusion is related to thecolour opponent properties of mammalian vision.
9.2 IntegrationThere could be several factors contributing to the unsatisfactory performance of the earlyintegration network. Firstly, due to the selection procedure the acoustic and visual inputs are notperfectly synchronised. Thus, it makes it difficult for the ANN to learn the relative timing betweenthe two concatenated inputs (Hennecke et al, 1996). This can impede the detection of the voicingof the phoneme, and indeed the acoustic only ANN outperformed the early integration network inidentifying the phonemes, 21.2% versus 20.1%. Furthermore, the ANN must also learn the properweighting between the acoustic and visual data depending on the noise level. To be effective at thisit must be trained at all noise levels likely to occur, thus increasing the required training set size.Therefore, another reason for the poor performance is that because of the small training set, theearly integration ANN was unable to learn the correct weightings. Another explanation for thefailure of integration, and one that is a fundamental problem of ANNs, is that ANNs are basicallylinear and produce a kind of weighted average that is inappropriate in the event of competition.
This late integration technique, P-P, could be considered a “no-holds-barred’’ approach toAVSR, and also a little naive. With enough training the P-P network maybe be able to correctlyidentify phonemes by being able to correctly weight connections when noise is present. However,even for humans it is very difficult to tell the difference between a /p/ and /b/ when using visualinformation only. This is because they belong to the same viseme grouping, such that it would be
Journal of Research and Practice in Information Technology, Vol. 35, No. 1, February 20036262
Audio-Visual Speech Recognition using Red Exclusion and Neural Networks
more sensible, and linguistically correct to use the visual data to extract information about visemes,rather than phonemes. This was attempted in the P-V network, yet under these conditions theaccuracy was only slightly better and still below that of acoustic only. Thus, following linguisticintuition, the Voi-V late integration network was used was good success.
Even though the Late/E had poor recall accuracy it is still an interesting approach and warrantsfurther investigation with a larger training base. One reason why this network performed badly withrespect to the other networks has to do with the training regime employed and the lack of additionaldata for use in training the error networks. The error analysis network was trained using the originaltraining data. Thus the subnets were attune to this data and most of the outputs were near perfect.Thus, when unseen data was used the error network may not have acted correctly. A solution to thisproblem, when enough data is available, will be to use a validation set for the error network training.Therefore, the error network will be trained on previously unseen data. This idea could also extendto the integration network of all late integration architectures. So that with a larger training base thegamut of training regime could be explored to find the most efficient and effective method.
CONCLUSIONThis research has shown that multi-speaker AVSR is useful in a natural office environment wherethe user is not equipped with specialised equipment, eg close head microphone, minimal externalnoise, etc. Via red exclusion, a visual signal can be integrated into recognition phase to help combatincreasing acoustic noise and increasing the accuracy of recognition. Using a knowledge frompsycholinguistics, a late integration network was developed that fused the acoustic and visualsources and increased the accuracy by around 40% over an acoustic only ANN. AVSR is aflourishing area of research with many avenues still open to investigation, especially in the area ofsensor fusion. Our current research is aiming to develop a conventional ASR system, using a largerdatabase, that is stable with a distant microphone setup and examine the effect of moving to AVSRwith this system.
REFERENCESADJOUDANI, A. and BENOIT, C. (1996): On the integration of auditory and visual parameters in an HMM-based ASR, in
STORK and HENNECKE (1996), 461–471.ANGELOPOULOU, E., MOLANA, R., and DANIILIDIS, K. (2001): Multispectral color modeling. Technical Report MS-
CIS-01-22, University of Pennsylvania, CIS.BASU, M. and HO, T.K. (1999): The learning behavior of single neuron classifiers on linearly separable or nonseparable
input. In Proceedings of the 1999 International Joint Conference on Neural Networks, Washington, D.C.BREGLER, C., MANKE, S., HILD, H., and WAIBEL, A. (1993): Bimodal sensor integration on the example of “speech-
reading’’. Proceedings of the IEEE International Conference on Neural Networks, 667–671.BREGLER, C., OMOHUNDRO, S.M., SHI, J., and KONIG, Y. (1996): Towards a robust speechreading dialog system. In
STORK and HENNECKE (1996), 410–423.BROOKES, M. (2000): VOICEBOX: Speech Processing Toolbox for MATLAB. World Wide Web, http://www.ee.ic.ac.uk/
hp/staff/dmb/voicebox/voicebox.html.CHARNIAK, E. (1993): Statistical language learning. MIT Press, Cambridge, MA.CHELAPPA, R., WILSON, C., and SIROHEY, S. (1995): Human and machine recognition of faces: A survey, in
Proceedings of the IEEE, 83(5): 705–739.COHEN, M., WALKER, R., and MASSARO, D. (1996): Perception of synthetic visual speech. In STORK and
HENNECKE (1996), 153–168.COIANIZ, T., TORRESANI, L. and CAPRILE, B. (1996): 2d deformable models for visual speech analysis. In STORK
and HENNECKE (1996), 391–398.DAVIS, S. and MERMELSTEIN, P. (1990): Comparision of parametric representations for monosyllabic word recognition
in continuously spoken sentences. In WAIBEL, A. and LEE, K., editors, Readings in Speech Recognition, 64–74.Morgan Kaufmann Publishers Inc., San Mateo, CA.
DEMUTH, H. and BEALE, M. (1998): Neural Network Toolbox: User’s Guide. The MathWorks, http://www.mathworks.com.
Journal of Research and Practice in Information Technology, Vol. 35, No. 1, February 2003 6363
Audio-Visual Speech Recognition using Red Exclusion and Neural Networks
DODD, B. and CAMPBELL, R., editors (1987): Hearing by Eye: The pyschology of lip-reading. Lawrence ErlbaumAssociates, Hillsdale NJ.
DUCHNOWSKI, P., HUNKE, P., BUSCHING, M., MEIER, U., and WAIBEL, A. (1995): Toward movement-invariantautomatic lip-reading and speech recognition. In Proceedings of the International Conference of Acoustics, Speech,and Signal Processing, Detriot USA.
DUPONT, S. and LEUTTIN, J. (2000): Audio-visual speech modeling for continuous speech recognition. IEEETransactions on Multimedia, 2(3):141–151.
FROMKIN, V., RODMAN, R., COLLINS, P., and BLAIR, D. (1996): An Introduction to Langauge. Hartcort Brace andCompany, Sydney, 3rd edition.
GLOTIN, H., VERGYRI, D., NETI, C., POTAMIANOS, G., and LUETTIN, J. (2001): Weighting schemes for audio-visual fusion in speech recognition. In Proc. Int. Conf. Acoust. Speech Signal Process.
GOLDSCHEN, A., GARCIA, O., and PETAJAN, E. (1996): Rationale for phoneme-viseme mapping and feature selectionin visual speech recognition. In STORK and HENNECKE (1996), 505–515.
GRANT, K. and SEITZ, P. (1998): The use of visible speech cues (speechreading) for directing auditory attention:Reducing temporal and spectral uncertainty in auditory detection of spoken utterances. In 16th International Congresson Acoustics.
GRAY, M., MOVELLAN, J., and SEJNOWSKI, T. (1997): Dynamic features for visual speechreading: A systematiccomparision. In MOZER, JORDAN, and PERSCHE, editors, Advances in Neural Information Processing Systems,volume 9. MIT Press, Cambridge MA.
HECKMANN, M., BERTHOMMIER, F., and KROSCHEL, K. (2001a): A hybrid ANN/HMM audio-visual speechrecognition system. In Proceedings of AVSP-2001.
HECKMANN, M., BERTHOMMIER, F., and KROSCHEL, K. (2001b): Optimal weighting of posteriors for audio-visualspeech recognition. In Proceedings of ICASSP 2001, Salt Lake City, Utah.
HENNECKE, M., PRASAD, K.V., and STORK, D. (1995): Automatic speech recognition using acoustic and visualsignals. Technical Report CRC-TR-95-37, Ricoh Californian Research Centre.
HENNECKE, M., PRASAD, V., and STORK, D. (1994): Using deformable templates to infer visual speech dynamics. In28th Annual Asimolar Conference on Signals, Systems, and Computer, Pacific Grove, CA. IEEE Computer.2:576–582.
HENNECKE, M., STORK, D., and PRASAD, K.V. (1996): Visionary speech: Looking ahead to practical speech readingsystems. In STORK and HENNECKE (1996), 331–350.
HUNKE, M. and WAIBEL, A. (1994): Face locating and tracking for human-computer interaction. In 28th AnnualAsimolar Conference on Signals, Systems, and Computers, IEEE Computer Society, Pacific Grove, CA. 2: 1277–1281.
LEUTTIN, J. and DUPONT, S. (1998): Continuous audio-visual speech recognition. In Proceedings of the 5th EuropeanConference on Computer Vision, 2: 657–673.
LEWIS, T.W. (2000). Audio visual speech recognition: Extraction, recognition, and intergration.LEWIS, T.W. and POWERS, D. (2001): Lip feature extraction using red exclusion. In EADES, P. and JIN, J., editors,
CRPIT: Visualisation, 2000, 2: 61–70.M2VTS (2000): M2VTS Multimodel face database, release 1.0. World Wide Web, http://www.tele.ucl.ac.be/
PROJECTS/M2VTS/.MASSARO, D. and STORK, D. (1998): Speech recognition and sensory integration: a 240-year old theorem helps explain
how people and machines can integrate auditory and visual information to understand speech. American Scientist,86(3): 236–245.
MCGURK, H. and MACDONALD, J. (1976): Hearing lips and seeing voices. Nature, 264:746–748.MEIER, U., HURST, W., and DUCHNOWSKI, P. (1996): Adaptive bimodal sensor fusion for automatic speechreading. In
Proceedings of the International Conference of Acoustics, Speech, and Signal Processing, 2: 833–837.MEIER, U., STEIFELHAGEN, R., YANG, J., and WAIBEL, A. (1999): Towards unrestricted lip reading. In Second
International Conference on Multimedia Interfaces, Hong Kong, http://werner.ir.uks.de/js.MOVELLAN, J. (1995): Visual speech recognition with stochastic networks. In Tesauro, G., Toruetzky, D., and Leen, T.,
editors, Advances in Neural Information Processing Systems, 7: 851–858. MIT Press, Cambridge.MOVELLAN, J. and MINEIRO, P. (1998): Robust sensor fusion: Analysis and application to audio visual speech
recognition. Machine Learning, 32: 85–100.NETI, C., POTAMIANOS, G., LEUTTIN, J., MATTHEWS, I., GLOTIN, H., and VERGYRI, D. (2001): Large-vocabulary
audio-visual speech recognition: A summary of the Johns Hopkins summer 2000 workshop. In Workshop onMultimedia Signal Processing, Special Session on Joint Audio-Visual Processing, Cannes.
POTAMIANOS, G. and NETI, C. (2000): Stream confidence estimation for audio-visual speech recognition. InProceedings of the International Conference on Spoken Language Processing, 746–749, Beijing.
POTAMIAONOS, G. and POTAMIANOS, A. (1999): Speaker adaptation for audio-visual speech recognition. InProceedings of EUROSPEECH (3), 1291–1294, Budapest.
PRASAD, K., STORK, D., and WOLFF, G. (1993): Preprocessing video images for neural learning of lipreading.Technical Report CRC-TR-93-26, Ricoh California Research Centre.
Journal of Research and Practice in Information Technology, Vol. 35, No. 1, February 20036464
Audio-Visual Speech Recognition using Red Exclusion and Neural Networks
RABINER, L. and JUANG, B. (1993): Fundamentals of Speech Recognition. Prentice Hall, Englewood Cliffs, NJ.RAO, R. and MERSEREAU, R. (1994): Lip modeling for visual speech recognition. In 28th Annual Asimolar Conference
on Signals, Systems, and Computers, volume 2. IEEE Computer Society, Pacific Grove CA.ROBERT-RIBES, J., PIQUEMAL, M., SCHWARTZ, J., and ESCUDIER, P. (1996): Exploiting sensor fusion and stimuli
complementary in av speech recognition. In STORK and HENNECKE (1996), 194–219.ROGOZAN, A. (1999): Discriminative learning of visual data for audiovisual speech recognition. International Journal of
Artificial Intelligence Tools, 8(1):43–52.SCHAFER, R. and RABINER, L. (1990): Digital representations of speech signals. In WAIBEL, A. and LEE, K., editors,
Readings in Speech Recognition, 49–64. Morgan Kaufmann Publishers Inc., San Mateo, CA.SCHIFFERDECKER, G. (1994): Finding structure in language. Master’s thesis, University of Karlsruhe.STIEFELHAGEN, R., YANG, J., and MEIER, U. (1997): Real time lip tracking for lipreading. In Proceedings of
Eurospeech ’97.STORK, D. and HENNECKE, M., editors (1996): Speechreading by Man and Machine: Models, System, and Applications.
NATO/Springer-Verlag, New York.SUMMERFIELD, Q. (1987): Some preliminaries to a comprehensive account of audio-visual speech perception, 3–52. In
DODD and CAMPBELL (1987).VERMA, A., FARUQUIE, T., NETI, C., BASU, S., and SENIOR, A. (1999): Late integration in audio-visual continuous
speech recognition. In Automatic Speech Recognition and Understanding.VOGT, M. (1996): Fast matching of a dynamic lip model to color video sequences under regular illumination conditions.
In STORK and HENNECKE (1996), 399–407.WALDEN, B., PROSEK, R., MONTGOMERY, A., SCHERR, C., and JONES, C. (1977): Effect of training on the visual
recognition of consonants. Journal of Speech and Hearing Research, 20:130–145.WARK, T., SRIDHARAN, S., and CHANDRAN, V. (1998): An approach to statistical lip modelling for speaker
identification via chromatic feature extraction. In Proceedings of the IEEE International Conference on PatternRecognition, 123–125.
YANG, J. and WAIBEL, A. (1996): A real-time face tracker. In Proceedings of WACV’96, 142–147.
BIOGRAPHICAL NOTESTrent Lewis completed a BSc in Cognitive Science in 1999 and went on tocomplete Honours in Computer Science in 2000 at the Flinders University ofSouth Australia. He commenced his PhD in July of 2001 also at FlindersUniversity. Trent’s main area of study is sensory data fusion with a particularfocus on solving this problem using learning and statistical techniques to findthe best fusion strategy in different situations. His current application for thisarea is audio-visual speech recognition.
David Powers is Associate Professor of Computer Science at the FlindersUniversity of South Australia. He has a PhD from the University of NSW in thearea of Machine Learning of Natural Language and specialises particularlyin unsupervised learning techniques as applied to linguistic and cognitiveapplications. Current research interests include speech and brain control ofan intelligent room, and multimodal sensory-motor processing in the contextof a robot baby, with another major application being intelligent web search.
David M.W. Powers
Trent W. Lewis