Embed Size (px)
Citation preview
Auctions: A Survey of Experimental Research*
John H. Kagel and Dan Levin Department of Economics The Ohio State University
410 Arps Hall 1945 North High Street
Columbus, OH 43210-1172
[email protected] [email protected] 614-292-4812 (phone) 614-688-4239
614-292-4192 (fax)
http://www.econ.ohio-state.edu/kagel/ (Web) http://www.econ.ohio-state.edu/levin/
11/15/2014
* Research support from the National Science Foundation for our experimental auction work is gratefully acknowledged. We thank Tim Cason, Sonsino Doron, Dirk Engelmann, Charles Holt, Radsoveta Ivanova-Stenzel, Julian Jameson, John List, Eric Maskin, Axel Ockenfels, Paul Pezanis-Christou, Ronald Peters, Tim Salmon and participants at the Stony Brook Game Theory Festival and the Harvard Conference on the Handbook of Experimental Economics, Vol. 2 for helpful comments and suggestions on earlier drafts of this survey. Any opinions, findings, conclusions, or recommendations in this material are those of the authors and do not necessarily reflect the views of the National Science Foundation.
Introduction The first question faced in writing this survey is how to organize it and what to
include. There have been hundreds of papers reporting experimental work on auctions
since the 1995 survey published in the first Handbook of Experimental Economics
(Kagel, 1995) so that it is quite impossible, and not very useful, to cover them all. Early
theoretical and experimental research on auctions was restricted to simple environments
with a fixed and commonly known number of bidders, each demanding a single unit.
Accordingly, the 1995 survey focused on the Revenue Equivalence Theorem with respect
to independent-private-value (IPV) auctions, with research on common value auctions
largely restricted to demonstrating the overwhelming presence of a winner’s curse.
The present survey takes up where the other one left off. Section I reviews work
since then on single-unit IPV auctions. Much of this research continues to be concerned
with bidding above the risk neutral Nash equilibrium (RNNE) in first-price sealed bid
(FPSB) auctions, work that is covered in Sections 1.1 and 1.2. Empirical economists have
developed techniques for analyzing field data on auctions that are designed to uncover
the underlying distribution of bidder values. Section 1.3 looks at an econometric analysis
designed to investigate the validity of these techniques using experimental data where,
unlike in field data, the underlying distribution of bidder values is known and can be
compared to the implied probability distribution. Recent work on second-price sealed bid
(SPSB) auctions is reported in section 1.4. Section 1.5 reviews work on auctions with
asymmetric valuation structures, where weak and strong bidders compete against each
other. Section 1.6 reviews work on procurement auctions (where the low bid wins),
dealing with some of the practices that are peculiar to that environment. Experiments
investigating the role of cash balances and outside earnings on bids are reported in
Section 1.7. Section 1.8 visits an important methodological issue related to analyzing
experimental outcomes in auctions and other repeated trial settings.
Section II reviews work on single-unit common value (CV) auctions. Sections
2.1-2.3 review studies investigating some of the important comparative static predictions
of the theory; the ability of English auctions to raise revenue compared to FPSB auctions,
the effect of a bidder with superior information (an insider) on auction revenue, and
bidding in almost common-value auctions (where one bidder has a small private value
1
advantage for the item). Section 2.4 looks at results from the closely related “takeover”
game, with a focus on sorting out between recent theories designed to explain the
winner’s curse. Section 2.5 ties up some loose ends: Examining the behavior of super
experienced bidders (e.g., is the persistent bidding above the RNNE a best response to
rivals who are bidding more aggressively?), bidding in auctions with both common and
private value elements for all bidders, the role of selection bias, demographic and ability
effects on the presence of a winner’s curse (e.g.; do “smarter” subjects bid closer to Nash
prediction and/or make more money?), and the extent to which the winner’s curse
extends beyond the lab to field settings.
Section III takes up multi-unit demand auctions – auctions in which bidders
demand more than a single unit of the items being sold. Much of the work here has been
spurred by the Federal Communications Commission’s sale of spectrum (air wave) rights,
beginning in the early 1990s, and the explosion of theoretical and applied research that
followed (as well as the widespread application of auctions for the sale of government
owned property rights that followed). Section 3.1 looks at bidding in uniform price and
Vickrey auctions for substitute goods. The experiments here are concerned with the issue
of demand reduction in the uniform price auctions, and the ability of the Vickrey
mechanism to correct for this. Section 3.2 extends the study of multi-unit demand
Vickrey auctions to different ways of implementing the Vickrey auction – dynamic
versus static mechanisms. Multi-unit demand auctions with synergies are covered in
Section 3.3, with sequential multi-unit demand auctions covered in Section 3.4.
Mechanism design studies that deal primarily with the thorny issues associated with
package bidding are covered in Chapter xx.
Section IV deals with several issues that do not fit in neatly elsewhere: collusion,
an ever present concern in auctions (Section 4.1), selling multiple units simultaneously to
bidders who demand only a single unit (Section 4.2), Internet auction practices (Section
4.3), and entry in auctions (Section 4.4).
The literature is much more extensive and less focused this time around than in
the 1995 survey. The good news is that it covers a lot of new ground. The bad news is
that we cannot hope to cover all of the good papers out there. Our hope is that we have
surveyed enough of the more important developments in enough detail for both the
2
novice and experienced reader to benefit from the survey, and that we have established
synthesis in some areas, while not leaving out too much of importance.
I. Single-Unit Private Value Auctions
Initial experimental research on auctions focused on the independent private
values (IPV) model, with particular focus on the Revenue Equivalence Theorem (RET).
In the IPV model each bidder privately observes their own valuation (known with
certainty), bidders' valuations are drawn independently from the same commonly known
distribution function, and the number of bidders is known. Under the RET (Myerson,
1981, Riley and Samuelson, 1981) the four main auction formats – first- and second-price
sealed-bid auctions, English and Dutch auctions – yield the same average revenue
assuming the same number of risk-neutral bidders and the same reserve price.1 Further,
FPSB and Dutch auctions, as well as SPSB and English auctions, are theoretically
isomorphic to each other, yielding not just the same ex-ante expected revenue but also the
same revenue (price) in any realization of bidders’ signals. These two isomorphisms are
particularly attractive as they do not depend on risk neutrality (as does the more general
RET), which makes for more robust tests of the theory’s predictions.
An experimental session typically consists of several auction periods under a given
auction institution. Subjects' valuations are determined randomly prior to each auction with
valuations being independent draws (iid) from the same distribution, typically a uniform
distribution. In each period the high bidder earns a profit equal to his value less the auction
price; other bidders earn zero profit. Bids are commonly restricted to be nonnegative and
rounded to the nearest penny. Theory does not specify what information feedback bidders
ought to get after each auction, which usually differ between experimenters, and which will
be shown to impact bidding.
At the time of the 1995 survey it was clear that both the RET as well as the strategic
equivalence between each of the two pairs of auction formats failed. Further, there were
persistent reports of significant bidding above the risk neutral Nash equilibrium (RNNE)
benchmark in FPSB auctions, initial explanations of which focused on risk aversion. This
1 The Dutch auction starts with a high price which is lowered until a bidder accepts at that price. In English auctions price starts low and increases until only one bidder remains active, paying the price at which the next to last bidder dropped out. In a first- (second-) price sealed-bid auction the high bidder wins the item and pays the highest (second-highest) bid.
3
explanation generated considerable controversy among experimenters (see the December
1992 issue of the American Economic Review). Sorting out between explanations for
bidding above the RNNE in FPSB auctions has preoccupied a number of later papers as
well, several of which are reviewed first.
1.1 Bidding Above the RNNE in First-Price Private Value Auctions
Isaac and James (2000a) compare estimates of risk preferences from FPSB
auctions to the Becker-DeGroot-Marshak (BDM) procedure for comparably risky
choices.2 Aggregate measures of risk preferences under the two procedures showed that
bidders were risk averse (RA) in the FPSB auction but risk neutral, or moderately risk
loving, under the BDM procedure. The latter may result from subjects’ failure to
understand and follow the dominant strategy of truthful revelation under BDM (much
like what is reported in SPSB auctions; see Section 1.4 below). In any case, what is more
damaging to the risk aversion argument, is that the if those who are most risk averse in
the auction tend to be most risk averse under BDM, then the Spearman rank order
correlation coefficient between individual subject estimates of risk preferences should be
positively related under the two institutions. However, as Figure 1 shows, if anything the
there is a modest negative relationship indicating those counted as most RA in FPSB
auction, tend to be least RA under BDM. Although it is well known from the psychology
literature that different elicitation procedures commonly yield somewhat different
quantitative responses (see Camerer, 1995, pp. 657-61; Mellers and Cooke, 1996), a
negative relationship between the two measures is not what one would expect. Under the
circumstances, while one can still maintain a hypothesis of RA in the FPSB auctions, an
equally compelling alternative hypothesis is confusion of one sort or another in the FPSB
auctions, with those who are most confused under BDM procedures being most confused
in the auctions.3
[Insert Fig 1 here]
2 These experiments use computerized rivals who bid according to the RNNE bidding strategy in the first-price sealed bid auctions. This permits isolating the risk preferences of individual human bidders in each auction market. 3 James (2007) shows that with experience, risk preference estimates from the buying and selling versions of the BDM procedure converge in the vicinity of risk neutrality, but nowhere near the estimates from FPSB auctions. Engel (2009) compares risk preferences measured in FPSB auctions (with human rivals) to measures using the Holt-Laury (2002) elicitation procedure, reporting much closer correspondence between the two than Isaac and James do.
4
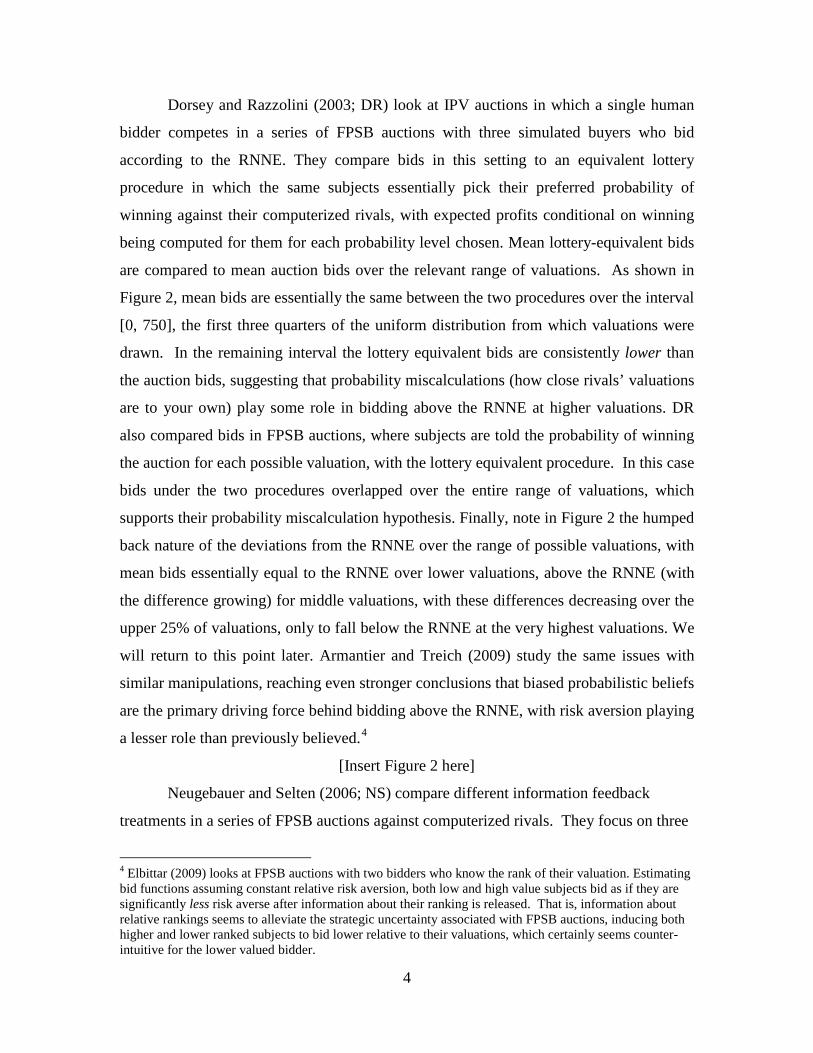
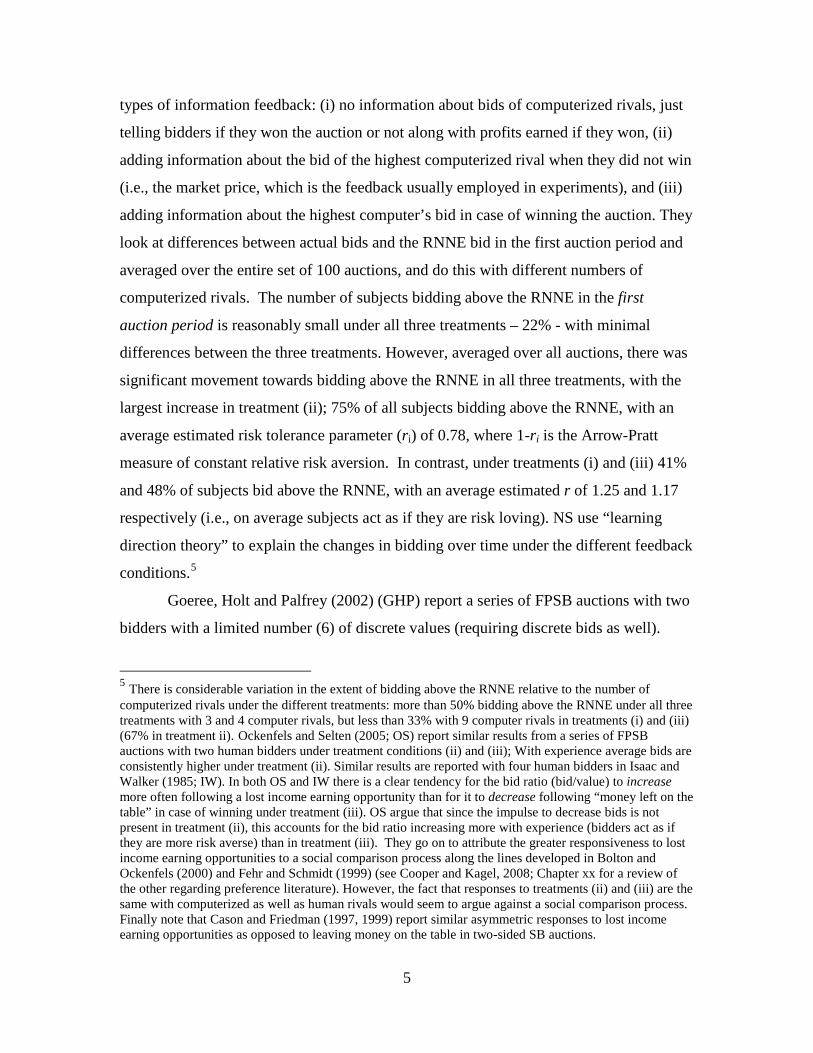
Dorsey and Razzolini (2003; DR) look at IPV auctions in which a single human
bidder competes in a series of FPSB auctions with three simulated buyers who bid
according to the RNNE. They compare bids in this setting to an equivalent lottery
procedure in which the same subjects essentially pick their preferred probability of
winning against their computerized rivals, with expected profits conditional on winning
being computed for them for each probability level chosen. Mean lottery-equivalent bids
are compared to mean auction bids over the relevant range of valuations. As shown in
Figure 2, mean bids are essentially the same between the two procedures over the interval
[0, 750], the first three quarters of the uniform distribution from which valuations were
drawn. In the remaining interval the lottery equivalent bids are consistently lower than
the auction bids, suggesting that probability miscalculations (how close rivals’ valuations
are to your own) play some role in bidding above the RNNE at higher valuations. DR
also compared bids in FPSB auctions, where subjects are told the probability of winning
the auction for each possible valuation, with the lottery equivalent procedure. In this case
bids under the two procedures overlapped over the entire range of valuations, which
supports their probability miscalculation hypothesis. Finally, note in Figure 2 the humped
back nature of the deviations from the RNNE over the range of possible valuations, with
mean bids essentially equal to the RNNE over lower valuations, above the RNNE (with
the difference growing) for middle valuations, with these differences decreasing over the
upper 25% of valuations, only to fall below the RNNE at the very highest valuations. We
will return to this point later. Armantier and Treich (2009) study the same issues with
similar manipulations, reaching even stronger conclusions that biased probabilistic beliefs
are the primary driving force behind bidding above the RNNE, with risk aversion playing
a lesser role than previously believed.4
[Insert Figure 2 here]
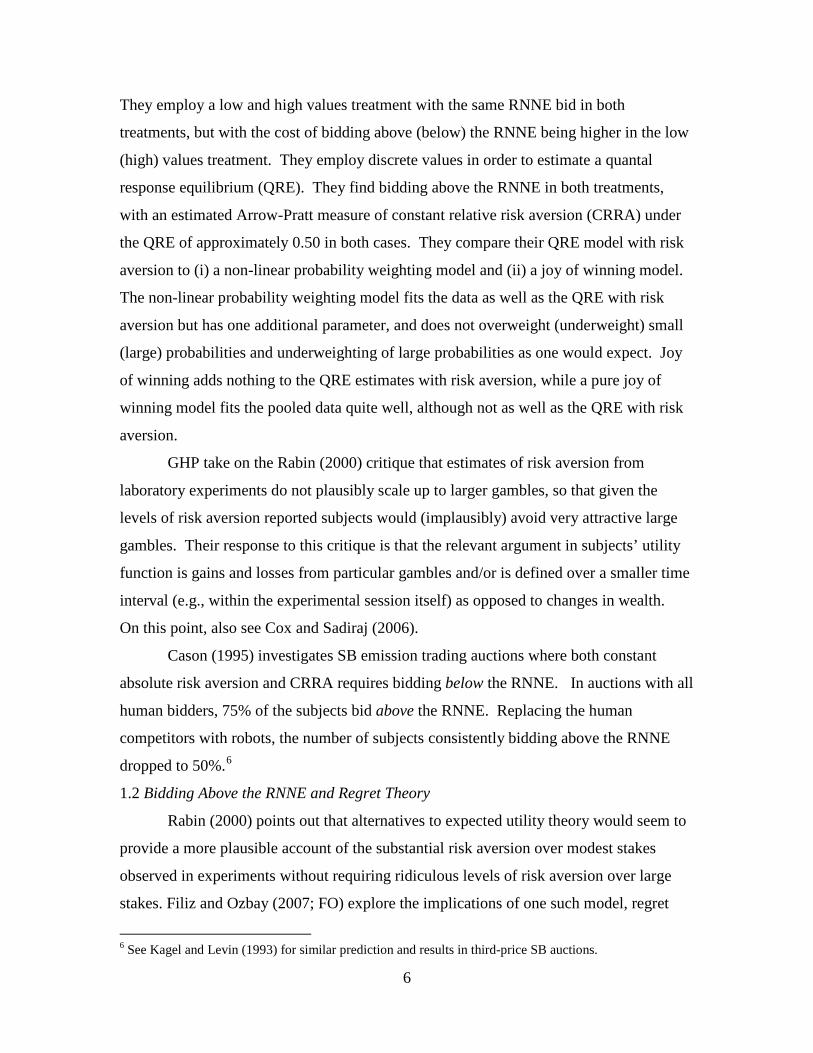
Neugebauer and Selten (2006; NS) compare different information feedback
treatments in a series of FPSB auctions against computerized rivals. They focus on three
4 Elbittar (2009) looks at FPSB auctions with two bidders who know the rank of their valuation. Estimating bid functions assuming constant relative risk aversion, both low and high value subjects bid as if they are significantly less risk averse after information about their ranking is released. That is, information about relative rankings seems to alleviate the strategic uncertainty associated with FPSB auctions, inducing both higher and lower ranked subjects to bid lower relative to their valuations, which certainly seems counter-intuitive for the lower valued bidder.
5
types of information feedback: (i) no information about bids of computerized rivals, just
telling bidders if they won the auction or not along with profits earned if they won, (ii)
adding information about the bid of the highest computerized rival when they did not win
(i.e., the market price, which is the feedback usually employed in experiments), and (iii)
adding information about the highest computer’s bid in case of winning the auction. They
look at differences between actual bids and the RNNE bid in the first auction period and
averaged over the entire set of 100 auctions, and do this with different numbers of
computerized rivals. The number of subjects bidding above the RNNE in the first
auction period is reasonably small under all three treatments – 22% - with minimal
differences between the three treatments. However, averaged over all auctions, there was
significant movement towards bidding above the RNNE in all three treatments, with the
largest increase in treatment (ii); 75% of all subjects bidding above the RNNE, with an
average estimated risk tolerance parameter (ri) of 0.78, where 1-ri is the Arrow-Pratt
measure of constant relative risk aversion. In contrast, under treatments (i) and (iii) 41%
and 48% of subjects bid above the RNNE, with an average estimated r of 1.25 and 1.17
respectively (i.e., on average subjects act as if they are risk loving). NS use “learning
direction theory” to explain the changes in bidding over time under the different feedback
conditions.5
Goeree, Holt and Palfrey (2002) (GHP) report a series of FPSB auctions with two
bidders with a limited number (6) of discrete values (requiring discrete bids as well).
5 There is considerable variation in the extent of bidding above the RNNE relative to the number of computerized rivals under the different treatments: more than 50% bidding above the RNNE under all three treatments with 3 and 4 computer rivals, but less than 33% with 9 computer rivals in treatments (i) and (iii) (67% in treatment ii). Ockenfels and Selten (2005; OS) report similar results from a series of FPSB auctions with two human bidders under treatment conditions (ii) and (iii); With experience average bids are consistently higher under treatment (ii). Similar results are reported with four human bidders in Isaac and Walker (1985; IW). In both OS and IW there is a clear tendency for the bid ratio (bid/value) to increase more often following a lost income earning opportunity than for it to decrease following “money left on the table” in case of winning under treatment (iii). OS argue that since the impulse to decrease bids is not present in treatment (ii), this accounts for the bid ratio increasing more with experience (bidders act as if they are more risk averse) than in treatment (iii). They go on to attribute the greater responsiveness to lost income earning opportunities to a social comparison process along the lines developed in Bolton and Ockenfels (2000) and Fehr and Schmidt (1999) (see Cooper and Kagel, 2008; Chapter xx for a review of the other regarding preference literature). However, the fact that responses to treatments (ii) and (iii) are the same with computerized as well as human rivals would seem to argue against a social comparison process. Finally note that Cason and Friedman (1997, 1999) report similar asymmetric responses to lost income earning opportunities as opposed to leaving money on the table in two-sided SB auctions.
6
They employ a low and high values treatment with the same RNNE bid in both
treatments, but with the cost of bidding above (below) the RNNE being higher in the low
(high) values treatment. They employ discrete values in order to estimate a quantal
response equilibrium (QRE). They find bidding above the RNNE in both treatments,
with an estimated Arrow-Pratt measure of constant relative risk aversion (CRRA) under
the QRE of approximately 0.50 in both cases. They compare their QRE model with risk
aversion to (i) a non-linear probability weighting model and (ii) a joy of winning model.
The non-linear probability weighting model fits the data as well as the QRE with risk
aversion but has one additional parameter, and does not overweight (underweight) small
(large) probabilities and underweighting of large probabilities as one would expect. Joy
of winning adds nothing to the QRE estimates with risk aversion, while a pure joy of
winning model fits the pooled data quite well, although not as well as the QRE with risk
aversion.
GHP take on the Rabin (2000) critique that estimates of risk aversion from
laboratory experiments do not plausibly scale up to larger gambles, so that given the
levels of risk aversion reported subjects would (implausibly) avoid very attractive large
gambles. Their response to this critique is that the relevant argument in subjects’ utility
function is gains and losses from particular gambles and/or is defined over a smaller time
interval (e.g., within the experimental session itself) as opposed to changes in wealth.
On this point, also see Cox and Sadiraj (2006).
Cason (1995) investigates SB emission trading auctions where both constant
absolute risk aversion and CRRA requires bidding below the RNNE. In auctions with all
human bidders, 75% of the subjects bid above the RNNE. Replacing the human
competitors with robots, the number of subjects consistently bidding above the RNNE
dropped to 50%.6
1.2 Bidding Above the RNNE and Regret Theory
Rabin (2000) points out that alternatives to expected utility theory would seem to
provide a more plausible account of the substantial risk aversion over modest stakes
observed in experiments without requiring ridiculous levels of risk aversion over large
stakes. Filiz and Ozbay (2007; FO) explore the implications of one such model, regret
6 See Kagel and Levin (1993) for similar prediction and results in third-price SB auctions.
7
theory (Loomes and Sugden, 1982; Bell, 1982) in an experiment looking at bidding in
FPSB auctions.7 In their analysis they note that the information bidders receive at the
end of the auction may generate one of two types of regret: (1) “Losers’ regret” if a
losing bidder could have won the item with a higher bid and earned positive profit and (2)
“Winner’s regret” if a winning bidder could have earned more by bidding less (money
left on the table). They first demonstrate that loser’s regret by itself will generate bidding
above the RNNE and that winner’s regret, by itself, will generate bidding below the
RNNE. To isolate the effect of these two factors, and to judge their relative strength,
they conduct a series of one-shot, FPSB auctions in which following completion of the
auction (i) losers learn the winning bid but the winner learns nothing about others’ bids
(Losers’ regret), (ii) winners learn the second highest bid but losers learn nothing about
the winner’s bid (Winner’s regret), and (iii) a control treatment in which bidders learn
nothing about others’ bids (No regret).
They run one-shot as opposed to repeated auctions on the grounds that their
theory relies on bidders anticipating future regret in terms of their current decisions,
while repeated auctions introduce the possibility of regret from outcomes in previous
rounds. To gather sufficient data they solicit bids for 10 possible valuations from each
bidder, and use the average bid (across bidders in several auctions) at each of these
valuations as the dependent variable in estimating linear bid functions.8 The estimated
slope of the bid function in the control treatment (no information provided) is 0.79, just
within the 95% confidence interval for the RNNE value of 0.75 in auctions with four
bidders. The slope estimated from the winner’s regret treatment is just below this (0.77),
but is not significantly different from the no information treatment. However, the slope
of the loser’s regret treatment is 0.87, which is significantly higher than the no
information treatment. Although averaging bids across subjects with the same valuations
does not bias the estimated slope coefficients, it no doubt biases the standard errors of the
7 See Engelbrecht-Wiggans (1989) for an earlier discussion of the potential effect of regret on bids in first-price private value auctions. 8 Linear bid functions were estimated with no intercept. There were four bidders in each auction.
8
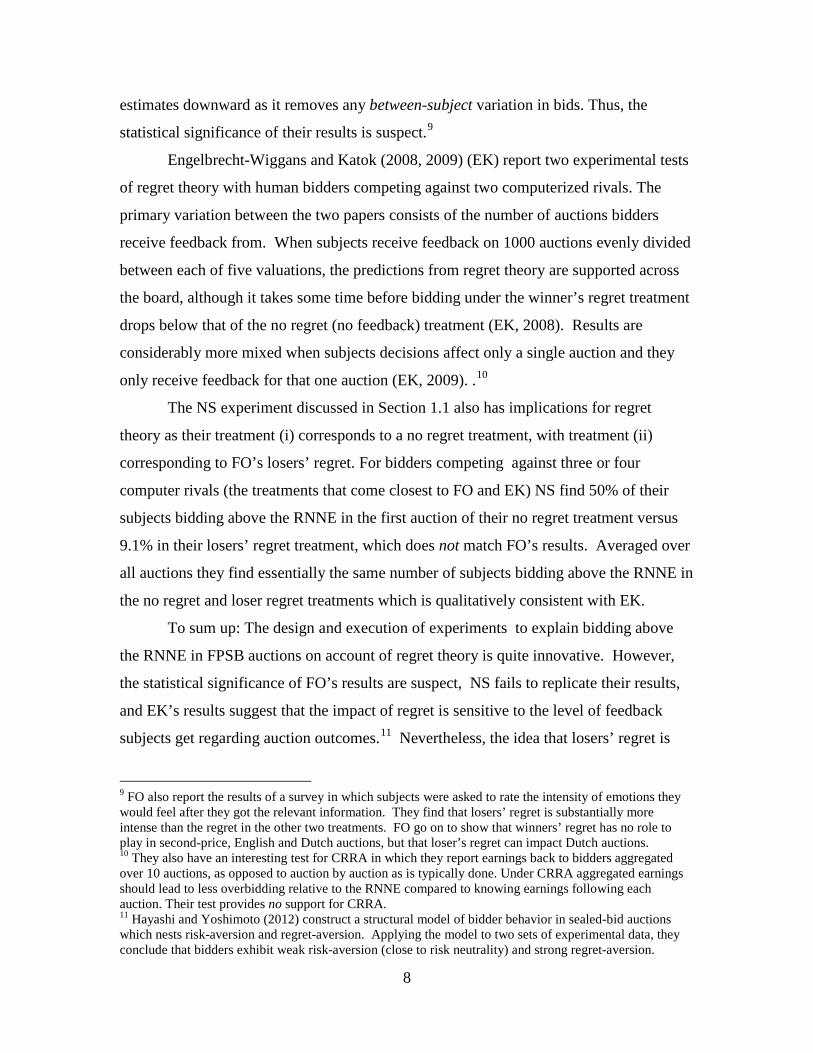
estimates downward as it removes any between-subject variation in bids. Thus, the
statistical significance of their results is suspect.9
Engelbrecht-Wiggans and Katok (2008, 2009) (EK) report two experimental tests
of regret theory with human bidders competing against two computerized rivals. The
primary variation between the two papers consists of the number of auctions bidders
receive feedback from. When subjects receive feedback on 1000 auctions evenly divided
between each of five valuations, the predictions from regret theory are supported across
the board, although it takes some time before bidding under the winner’s regret treatment
drops below that of the no regret (no feedback) treatment (EK, 2008). Results are
considerably more mixed when subjects decisions affect only a single auction and they
only receive feedback for that one auction (EK, 2009). .10
The NS experiment discussed in Section 1.1 also has implications for regret
theory as their treatment (i) corresponds to a no regret treatment, with treatment (ii)
corresponding to FO’s losers’ regret. For bidders competing against three or four
computer rivals (the treatments that come closest to FO and EK) NS find 50% of their
subjects bidding above the RNNE in the first auction of their no regret treatment versus
9.1% in their losers’ regret treatment, which does not match FO’s results. Averaged over
all auctions they find essentially the same number of subjects bidding above the RNNE in
the no regret and loser regret treatments which is qualitatively consistent with EK.
To sum up: The design and execution of experiments to explain bidding above
the RNNE in FPSB auctions on account of regret theory is quite innovative. However,
the statistical significance of FO’s results are suspect, NS fails to replicate their results,
and EK’s results suggest that the impact of regret is sensitive to the level of feedback
subjects get regarding auction outcomes.11 Nevertheless, the idea that losers’ regret is
9 FO also report the results of a survey in which subjects were asked to rate the intensity of emotions they would feel after they got the relevant information. They find that losers’ regret is substantially more intense than the regret in the other two treatments. FO go on to show that winners’ regret has no role to play in second-price, English and Dutch auctions, but that loser’s regret can impact Dutch auctions. 10 They also have an interesting test for CRRA in which they report earnings back to bidders aggregated over 10 auctions, as opposed to auction by auction as is typically done. Under CRRA aggregated earnings should lead to less overbidding relative to the RNNE compared to knowing earnings following each auction. Their test provides no support for CRRA. 11 Hayashi and Yoshimoto (2012) construct a structural model of bidder behavior in sealed-bid auctions which nests risk-aversion and regret-aversion. Applying the model to two sets of experimental data, they conclude that bidders exhibit weak risk-aversion (close to risk neutrality) and strong regret-aversion.
9
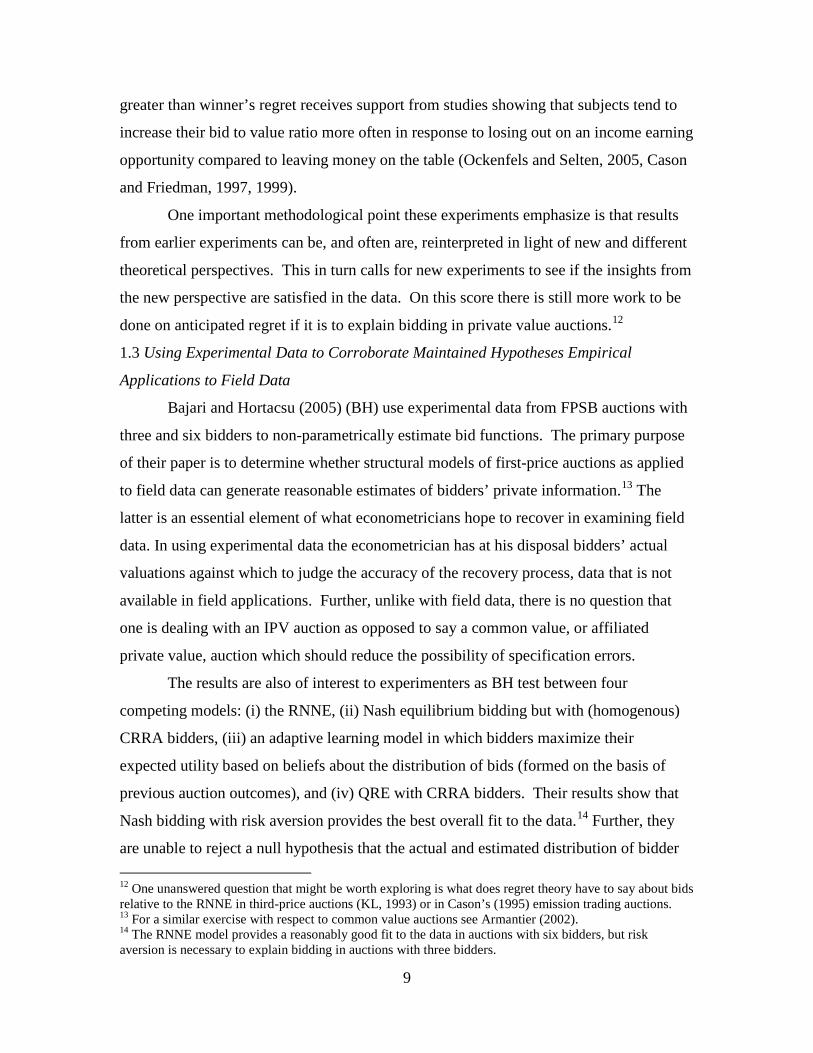
greater than winner’s regret receives support from studies showing that subjects tend to
increase their bid to value ratio more often in response to losing out on an income earning
opportunity compared to leaving money on the table (Ockenfels and Selten, 2005, Cason
and Friedman, 1997, 1999).
One important methodological point these experiments emphasize is that results
from earlier experiments can be, and often are, reinterpreted in light of new and different
theoretical perspectives. This in turn calls for new experiments to see if the insights from
the new perspective are satisfied in the data. On this score there is still more work to be
done on anticipated regret if it is to explain bidding in private value auctions.12
1.3 Using Experimental Data to Corroborate Maintained Hypotheses Empirical
Applications to Field Data
Bajari and Hortacsu (2005) (BH) use experimental data from FPSB auctions with
three and six bidders to non-parametrically estimate bid functions. The primary purpose
of their paper is to determine whether structural models of first-price auctions as applied
to field data can generate reasonable estimates of bidders’ private information.13 The
latter is an essential element of what econometricians hope to recover in examining field
data. In using experimental data the econometrician has at his disposal bidders’ actual
valuations against which to judge the accuracy of the recovery process, data that is not
available in field applications. Further, unlike with field data, there is no question that
one is dealing with an IPV auction as opposed to say a common value, or affiliated
private value, auction which should reduce the possibility of specification errors.
The results are also of interest to experimenters as BH test between four
competing models: (i) the RNNE, (ii) Nash equilibrium bidding but with (homogenous)
CRRA bidders, (iii) an adaptive learning model in which bidders maximize their
expected utility based on beliefs about the distribution of bids (formed on the basis of
previous auction outcomes), and (iv) QRE with CRRA bidders. Their results show that
Nash bidding with risk aversion provides the best overall fit to the data.14 Further, they
are unable to reject a null hypothesis that the actual and estimated distribution of bidder 12 One unanswered question that might be worth exploring is what does regret theory have to say about bids relative to the RNNE in third-price auctions (KL, 1993) or in Cason’s (1995) emission trading auctions. 13 For a similar exercise with respect to common value auctions see Armantier (2002). 14 The RNNE model provides a reasonably good fit to the data in auctions with six bidders, but risk aversion is necessary to explain bidding in auctions with three bidders.
10
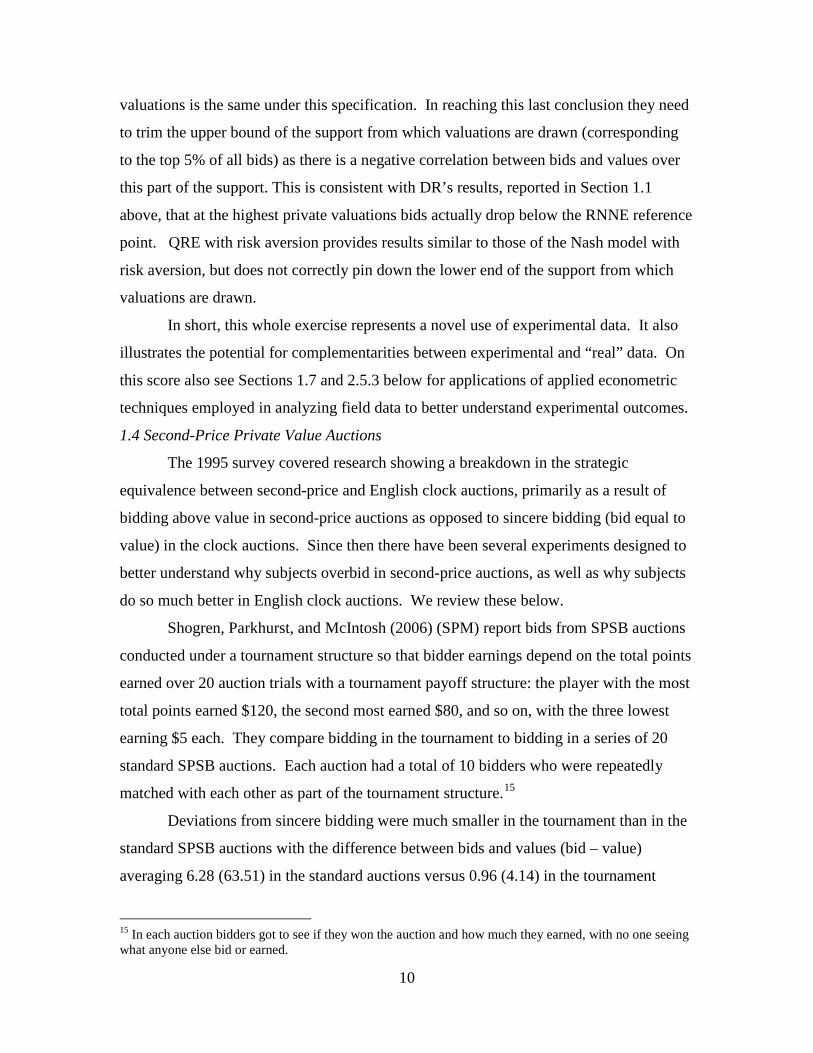
valuations is the same under this specification. In reaching this last conclusion they need
to trim the upper bound of the support from which valuations are drawn (corresponding
to the top 5% of all bids) as there is a negative correlation between bids and values over
this part of the support. This is consistent with DR’s results, reported in Section 1.1
above, that at the highest private valuations bids actually drop below the RNNE reference
point. QRE with risk aversion provides results similar to those of the Nash model with
risk aversion, but does not correctly pin down the lower end of the support from which
valuations are drawn.
In short, this whole exercise represents a novel use of experimental data. It also
illustrates the potential for complementarities between experimental and “real” data. On
this score also see Sections 1.7 and 2.5.3 below for applications of applied econometric
techniques employed in analyzing field data to better understand experimental outcomes.
1.4 Second-Price Private Value Auctions
The 1995 survey covered research showing a breakdown in the strategic
equivalence between second-price and English clock auctions, primarily as a result of
bidding above value in second-price auctions as opposed to sincere bidding (bid equal to
value) in the clock auctions. Since then there have been several experiments designed to
better understand why subjects overbid in second-price auctions, as well as why subjects
do so much better in English clock auctions. We review these below.
Shogren, Parkhurst, and McIntosh (2006) (SPM) report bids from SPSB auctions
conducted under a tournament structure so that bidder earnings depend on the total points
earned over 20 auction trials with a tournament payoff structure: the player with the most
total points earned $120, the second most earned $80, and so on, with the three lowest
earning $5 each. They compare bidding in the tournament to bidding in a series of 20
standard SPSB auctions. Each auction had a total of 10 bidders who were repeatedly
matched with each other as part of the tournament structure.15
Deviations from sincere bidding were much smaller in the tournament than in the
standard SPSB auctions with the difference between bids and values (bid – value)
averaging 6.28 (63.51) in the standard auctions versus 0.96 (4.14) in the tournament
15 In each auction bidders got to see if they won the auction and how much they earned, with no one seeing what anyone else bid or earned.
11
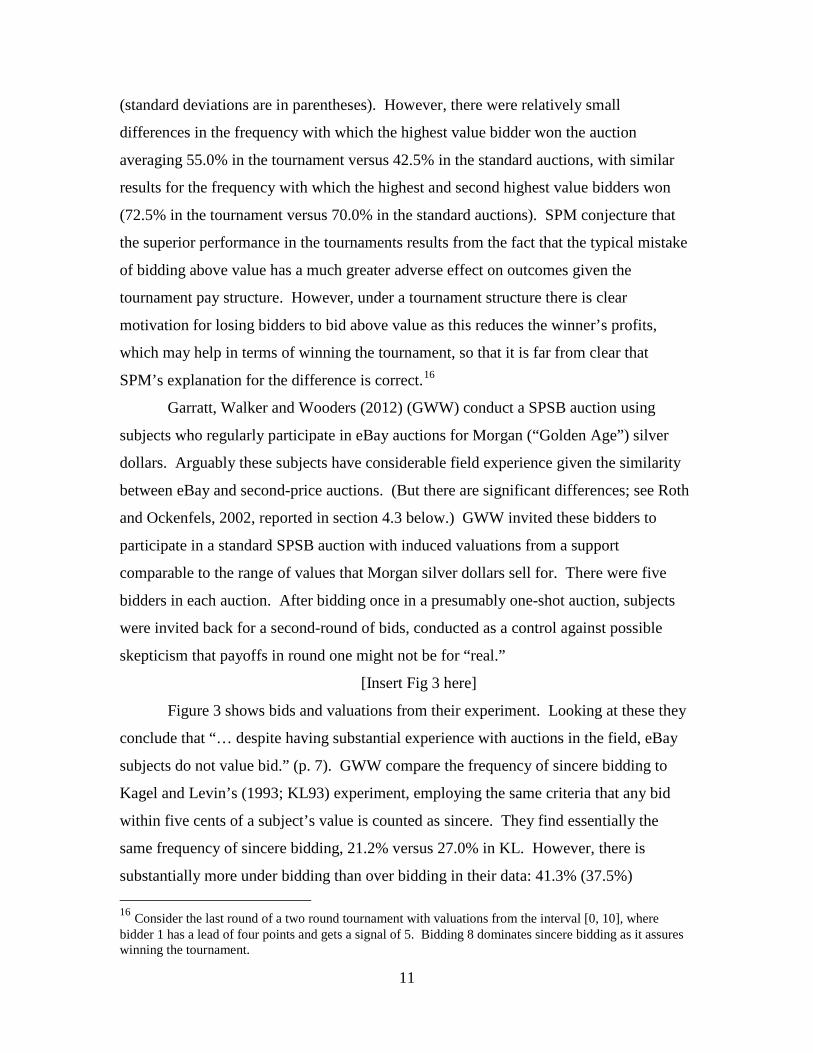
(standard deviations are in parentheses). However, there were relatively small
differences in the frequency with which the highest value bidder won the auction
averaging 55.0% in the tournament versus 42.5% in the standard auctions, with similar
results for the frequency with which the highest and second highest value bidders won
(72.5% in the tournament versus 70.0% in the standard auctions). SPM conjecture that
the superior performance in the tournaments results from the fact that the typical mistake
of bidding above value has a much greater adverse effect on outcomes given the
tournament pay structure. However, under a tournament structure there is clear
motivation for losing bidders to bid above value as this reduces the winner’s profits,
which may help in terms of winning the tournament, so that it is far from clear that
SPM’s explanation for the difference is correct.16
Garratt, Walker and Wooders (2012) (GWW) conduct a SPSB auction using
subjects who regularly participate in eBay auctions for Morgan (“Golden Age”) silver
dollars. Arguably these subjects have considerable field experience given the similarity
between eBay and second-price auctions. (But there are significant differences; see Roth
and Ockenfels, 2002, reported in section 4.3 below.) GWW invited these bidders to
participate in a standard SPSB auction with induced valuations from a support
comparable to the range of values that Morgan silver dollars sell for. There were five
bidders in each auction. After bidding once in a presumably one-shot auction, subjects
were invited back for a second-round of bids, conducted as a control against possible
skepticism that payoffs in round one might not be for “real.”
[Insert Fig 3 here]
Figure 3 shows bids and valuations from their experiment. Looking at these they
conclude that “… despite having substantial experience with auctions in the field, eBay
subjects do not value bid.” (p. 7). GWW compare the frequency of sincere bidding to
Kagel and Levin’s (1993; KL93) experiment, employing the same criteria that any bid
within five cents of a subject’s value is counted as sincere. They find essentially the
same frequency of sincere bidding, 21.2% versus 27.0% in KL. However, there is
substantially more under bidding than over bidding in their data: 41.3% (37.5%) 16 Consider the last round of a two round tournament with valuations from the interval [0, 10], where bidder 1 has a lead of four points and gets a signal of 5. Bidding 8 dominates sincere bidding as it assures winning the tournament.
12
underbidding (overbidding) in GWW versus 5.7% (67.2%) in KL. GWW are able, at
least qualitatively, to resolve this discrepancy after they break their data down into eBay
only buyers versus eBay sometime sellers, as sellers tend to underbid much more often
than buyers do (50.9% versus 29.5%). There is a corresponding discrepancy in the
frequency of overbidding, 45.5% for buyers versus 32.1% for sellers, with both sets of
differences statistically significant at the 10% level using a non-parametric Mann-
Whitney test.17
The fact that frequent sellers underbid as opposed to those with no selling
experience tending to overbid has certain parallels to Burns (1985) study comparing
professional wool buyers to students in a continuous double auction market. In that
experiment the students performed much better than the wool buyers (earning more
money with more efficient outcomes), in large measure because the wool buyers ignored
subtle differences between the laboratory experiment and the wool market. The
connection here is that people who sell on eBay will typically only buy if the price is
below their value, as otherwise they cannot profit from resale, and one cannot expect
them to ignore these habits when put into a new situation. This is consistent with the
psychology literature which suggests that in deductive reasoning processes people
typically employ short-cuts, developing mental models of situations and reasoning about
them in the context of the model (Johnson-Laird, 1999). Thus, it is easy to see how
Burns’ wool buyers might behave in ways that are more appropriate to their customary
environment which was similar to, but not exactly the same, as the laboratory
environment. Similarly, it is easy to see how e-Bay sellers, who make a living by buying
low and selling high, might deviate from sincere bidding by bidding less than their
induced values, while buyers, as is typical of standard laboratory subjects, bid above their
induced values. In short, there is no particular reason to think that experienced
professionals will perform much better than student subjects when placed in a laboratory
17 The difference in overbidding between buyers and sellers is significant at the 5% level in a regression analysis. Subjects were told that they could lose part, or all of, their $15 participation fee in case they won the auction with the second-highest bid above their value. GWW’s results have been cited several times as demonstrating that the tendency to overbid in SPSB auctions disappears for experienced bidders. It is hard to see how this conclusion could be reached once one looks at the detailed data, or the aggregate data conditional on bidders’ eBay experience.
13
setting, unless there are strong and relevant similarities between the field setting they are
familiar with and the laboratory environment.18
Andreoni, Che, and Kim (2007; ACK) report the highest rate of sincere bidding in
SPSB auctions we are aware of – 77.3% overall (85.5% in the last 10 periods) – in
auctions with four bidders and a uniform distribution of valuations. They find that
sincere bidding drops substantially, largely replaced by overbidding, when subjects know
their rivals resale values. They attribute this result to spite.19 While spite might explain
overbidding when rivals valuations are known, this does not provide a credible
explanation for overbidding absent this information, as there is minimal overbidding in
English clock auctions, which are strategically equivalent, and in which spite (as well as
joy of winning) should play just as strong a role.
Cooper and Fang (2008; CF) look at bidding in a series of two player second-
price auctions with bidders valuations drawn from an approximate normal distribution.
Their primary treatment variable consists of noisy information about rival’s valuations,
which in some cases is provided exogenously, and in other cases can be purchased. In
the control treatment, with no information about rival’s valuations, just under 40% of all
bids are sincere, with overbidding accounting for most of the deviations. Unlike ACK,
with exogenously provided information about rival’s valuations the rate of sincere
bidding increases, especially with less noisy information. The probability of overbidding
is reduced in response to costly mistakes (overbidding that causes subjects to lose
money), with the apparent stability of bidding above value resulting from the infrequency
of costly mistakes.
CF also find that subjects tend to buy costly information about rivals valuations
(since the game has a dominant strategy, at least from a game theoretic perspective this
involves throwing money away), with these purchases diminishing over time. There is
18 On this score also see Dyer, Kagel, and Levin (1989; DKL) along with Dyer and Kagel (1996; DK). Also see Fréchette (2010) for a survey of differences in laboratory behavior between professionals and students. 19 ACK employ an (augmented) dual market technique with subjects bidding in each of three markets with the same valuations. In the first market bidders only have information about the common distribution from which values were drawn. In the second market precise information about one other bidder’s value is provided and in the third market information about all other bidders’ values is provided. ACK also explore the impact of information about rivals’ values in first-price auctions where the theory makes clear predictions, which are largely satisfied, at least qualitatively.
14
considerable heterogeneity in these purchases with subjects who overbid the most buying
information more often. This suggests a split in the population between more “rational”
types who neither overbid nor pay to buy essentially worthless information, and less
rational types who commit both types of mistakes.
Georganas, Levin, and McGee (2010) look at the effect of penalties for
deviations from sincere bidding. This involves multiplying any realized losses by a factor
β, where β is at times greater than 1, equal to 1 or less than 1. These penalties have no
impact on the dominant strategy. Although Ss fail to discover the dominant strategy, they
respond “sensibly” to changes in the value of β, getting closer to the sincere bidding
when β = 20, and further away when β = 0.1 (see Figure 4). The impact of the change in
β is immediate and occurs even though bidders do not typically lose money when
deviating from sincere bidding. These responses are consistent with the notion that
subjects bid above value in SPSB auctions out of the mistaken notion that it increases the
likelihood of winning with minimal adverse income effects, as winners pay the second-
highest bid (see Kagel, Harstad, and Levin, 1987). In terms of this argument, what
changing β does is to alter the potential cost of such wins, which in turn alters bids in the
expected direction. Although joy of winning can also explain bidding above value (with
changes in β impacting the cost of doing so), joy still cannot explain why bidding above
value is so limited in English clock auctions when β = 1, whereas it is so prevalent in the
SPSB auctions.
[Insert Fig 4 here]
1.5 Asymmetric Private Value Auctions
While much of the auction literature has focused on bidders that are ex-ante
symmetric, in many auctions it is commonly known that one or more bidders (the strong
bidders) are likely to have higher valuations for the auctioned item than the other (weak)
bidders. This extension of the private values model raises interesting theoretical
questions (see Maskin and Riley, 2000) that have been explored in a handful of
experimental studies reviewed below.
Pezanis-Christou (2002) investigates a model with two risk- neutral bidders (i = 1,
2) each demanding a single unit. Bidders values are independent draws from a uniform
distribution, with support [0, 100] for the strong bidder and support [-100, 100] or [-300,
15
100] for the weak bidder, so that the underlying support for the strong bidder first-order
stochastically dominates (FOSD) the weak bidder. Negative bids are not allowed, with
the weak bidder not allowed to bid when receiving a negative value. Each session
consisted of either 60 or 72 auctions in which subjects’ type changing between auctions,
along with changes in the support for weak bidders’ values.
FPSB and SPSB auctions were run. Key comparative static predictions
investigated are: (i) In the FP auctions the strong types bid less aggressively than weak
types for the same private valuation, (ii) Efficiency is greater in the SPSB auctions, and
(iii) Expected revenue is higher in the SP auctions. The intuition underlying (iii) is that
since there is a positive probability that weak bidder will not bid (as a result of a negative
value), strong bidders in the FP auctions maximize their expected earnings by placing
very low bids (“low balling”) when they get low values. In contrast, sincere bidding
remains a dominant strategy in the SP auction, resulting in higher revenue on average.
Both the frequency of low-balling and the revenue differences should be greater when the
weak bidder has a greater likelihood of drawing a negative value (with support [-300,
100]).
As predicted, strong bidders shave their bids more than weak bidders do in the FP
auctions under both treatments; where bid shaving is defined as the ratio εi = (vi – bi)/vi
where vi is bidder i’s value. And they shave more when weak bidders draws are from [-
300, 100]. About 46% of all SP bids were sincere, which is substantially larger than in
previous experiments, with 40% of bids above value. However, SP revenues were close
to their predicted level, indicating that whatever overbidding there was had to be
relatively small.
As predicted, the SP auctions have higher efficiency averaging 97% versus 95%
with weak bidders support [-100, 100] and 99% versus 96% with support [-300, 100].20
However, contrary to the theory, average revenue was greater in the FP auctions in both
cases. Although average revenue in the SPSB auctions was approximately equal to its
predicted value, revenue in the FP auctions was well above the RNNE prediction.
Pezanis-Christou attributes this failure of the theory to bidders’ difficulty in recognizing
the profitable opportunities from low-balling in the FP auctions. However, he does not
20 Efficiency is measured by the ratio of the [winner’s value]/[highest value] * 100.
16
attribute this to risk aversion as (i) with the weak bidders draws from the interval [-300,
100] the revenue ranking is not affected by risk aversion, (ii) simulations assuming both
bidders are extremely risk averse cannot account for the reversal of the revenue ranking
with weak bidders draws from the interval [-100, 100], and (iii) the extent to which
strong types bid above the RNNE in the FPSB auctions was decreasing over time,
suggesting that subjects were employing an adaptive bidding strategy as opposed to a
static, fully-optimizing one.21
Güth, Ivanova-Stenzel and Wolfstetter (2005; GISW) conduct an experiment in
which bidders values were drawn from a uniform distribution with support [50, 150] for
weak types versus [50, 200] for strong types, running both first- and second-price sealed
bid auctions. As predicted under the RNNE, efficiency is consistently higher in the SP
auctions averaging 98%, 99%, and 99% versus 97%, 97%, and 98% over the three phases
of the experiment.22 Although the theory predicts that weak bidders’ payoffs will be
higher in the FP auction, and strong bidders’ payoffs higher in the SP auction, both types’
average payoffs are significantly higher in SP auctions. Bids are close to predicted levels
in the SP auctions (sincere bidding), but as typically reported, are substantially higher
than the RNNE in the FP auctions. The latter accounts for the failure of weak bidders’
payoffs to be higher in FP auctions.
A closer look at bid patterns shows that strong bidders in FP auctions generally
obey first-order rationality, as there are few bids above 150, the maximum possible
valuation for weak bidders. Further, weak bidders shave their bids less than strong
bidders at higher valuations (v ≈ 100). Although, this satisfies a key qualitative
prediction of the theory, the pattern differs from the predicted one as the differences in
bid shaving between weak and strong bidders does not increase monotonically over
higher valuations, and the differences are not nearly as large as the theory predicts.
When given a choice, both weak and strong bidders overwhelming chose the second-
price auction, consistent with the significantly higher payoffs for both types under this
format.
21 Note, however, that the revenue reversal remains even after looking at bidding in the last 30 auctions, where learning should have tended to stabilize. 22 No statistical tests are reported for this.
17
Chernomaz (2012) studies asymmetries resulting from two otherwise symmetric
bidders merging to submit a single bid based on the highest of their private valuations.23
This strong bidder competes against a single weak bidder. Each bidder draws a private
value from a common uniform distribution, but by virtue of using the higher of their two
private values, the value distribution for the strong bidder FOSD the weak bidder.
Subjects participate in a series of FPSB auctions under each of three treatments: (i) They
bid as separate entities based on their private values in an auction with three bidders. (ii)
“Merged” firms let each subject bid separately, with no communication, based on the
higher of their two valuations. (iii) Merged firms submit a single agreed upon bid after
they have the opportunity to communicate via an instant messaging system. Subjects’
roles as weak or strong bidders remain fixed throughout a session, as do the pairings for
the “merged” firm. The dual market technique is employed so that in each auction bids
under all three treatments are based on the same valuations with the market to be paid off
on determined randomly.
Between treatment predictions consist of the following: In equilibrium, the strong
type bids less than the weak type with the same valuation, resulting in less efficient
allocations compared to the symmetric (three bidder) auctions. Following the “merger”,
both weak and strong types bid lower than in the symmetric (three bidder) auctions. As a
result, revenue decreases and bidders’ profits increase, with the weak bidder getting a
larger absolute increase than the strong bidders after splitting their earnings. This last
result has implications for the incentive to merge and bid jointly in a fully blown model
where joint bidding is determined endogenously.24
The experimental results show bidding above the RNNE in both the symmetric
and asymmetric auctions. Strong types bid less aggressively than in the symmetric
auctions, although the difference is not as large as the theory predicts. Weak types bid the
same, or slightly higher, than in the symmetric auctions. Chernomaz shows that this
difference can be partly accounted for by the greater incentive strong types have to 23 There are a couple of different ways to think about what’s going on here. The firms have merged so that the bidder with the higher private value is the firm’s value. Alternatively, there is a consortium of bidders who bid jointly and agree to allocate the item to the bidder with the highest value, along with some agreed upon device for splitting the profits. All of this is in the background, as in order to simplify the experimental design, which “merged” firm bids is determined by the experimenter, with profits split equally in case of a joint bid. 24 This result is similar to results from horizontal-mergers in a Cournot oligopoly (Levin, 1990).
18
reduce bids. Contrary to the RNNE prediction, efficiency is higher with joint bidding
than in the symmetric benchmark case. This can be explained by the reduction from three
to two bidders, so that any inherent noise in bids is less disruptive to efficiency in the two
bidder case, as bidders’ valuations are further apart on average than in the three bidder
case.25 Strong bidders benefit from joint bidding at least as much as the weak bidders
(even after accounting for splitting their profits), indicating that the incentive to bid
jointly is stronger than predicted. Finally, there are essentially no differences in bids
when members of the “merged” firm bid individually versus bidding jointly. But for
some unknown reason, weak bidders tend to submit higher bids when the “merged” firm
bids jointly.
Goeree and Offerman (2004; GO) explore the revenue raising properties of the
Amsterdam auction when bidders have asymmetric valuations.26 The Amsterdam
auction has two stages: Stage one consists of an English clock auction until all but two
bidders have dropped out. The price at which the last bidder dropped is called the bottom
price and serves as a reserve price in stage two. Stage two consists of either a first- or
second-price SB auction. Further, and this is the unique element, in the second phase
both bidders receive a premium which is a proportion of the difference between the
lowest stage two bid and the bottom price. With asymmetric valuations, the Amsterdam
auction provides endogenously determined incentives for weak bidders compete against
stronger rivals. GO compare both a FP and SP Amsterdam auction with a FPSB, an
English clock auction and Myerson’s (1981) optimal auction design. Treatments consist
of symmetric valuations and weakly asymmetric and strongly asymmetric valuations,
with four bidders in all auctions (three weak and one strong bidder in the asymmetric
auctions).
The FPSB auction generates significantly more revenue than the other auction
formats with symmetric valuations (including the optimal auction) as subjects bid well
25 This is partly an artifact of how efficiency is typically measured when comparing efficiency between different auction structures. One solution is to normalize efficiency measures by the difference from random bidding in each case. 26 The Amsterdam auction has been used to sell real estate in the Dutch capital for centuries. Premium auctions of this sort are regularly employed in Europe for a variety of items.
19
above the RNNE.27 In the weakly asymmetric case the FPSB, the Amsterdam FP and the
Optimal auction all raise significantly more revenue than the other two formats (with the
FPSB ahead by a nose). In the strongly asymmetric case the Amsterdam auction raises
significantly more revenue than the FPSB and the English auction, with the Amsterdam
SP raising 10% more revenue than the Amsterdam FP, and only slightly less revenue
(7%) than the Optimal auction. English auctions consistently have the highest efficiency
but with strong asymmetries, absent some sort of positive incentives for weak bidders,
strongly discourages participation as weak bidders (correctly) anticipate that they have
little chance of winning (Klemperer, 2002).28
Summing Up: Tests of revenue predictions in asymmetric private value auctions are
confounded by the fact that subjects tend to bid well above the RNNE in FPSB auctions
but bid close to the dominant strategy in SPSB auctions with only two bidders. Bid
functions tend to move in the right direction, at least qualitatively, strong bidders tend to
bid less than weak bidders for comparable valuations in FPSB auctions. Efficiency tends
to be lower in FP compared to SP auctions which is the same result reported for
symmetric FP and SP auctions (reviewed in Kagel, 1995). One secondary result of these
experiments is that they show closer conformity to sincere bidding in SPSB auctions with
two bidders than typically found with larger numbers of bidders. With strong
asymmetries, the Amsterdam auction raises more revenue than a FPSB auction, and
generates almost as much revenue as Myerson’s optimal auction design, but requires
much less information on the part of the auctioneer than the optimal auction. 29
1.6 Sequential Auctions
27 Net revenues are reported for the Amsterdam auctions, defined as the winner’s payment less the premiums paid to the stage two bidders. The premium was set at 0.3 in the experiment. 28 Hu, Offerman and Onderstal (2011) compare the collusive properties of FPSB and English clock auctions to that of the Amsterdam SP auction. Corns and Schotter (1999), in a proof of principle experiment, demonstrate that proper price preference rules in favor of historically disadvantaged bidders can both increase their representation and reduce procurement costs. Ayers and Cramton (1996) report the results of what amounts to a “natural experiment” on the revenue raising effects of price preferences in one of the Federal Government’s air wave rights auctions. 29 Given asymmetric valuations, with weak types bidding more aggressively than strong types, it is natural to think of auctions with resale opportunities, which has motivated a growing theoretical literature (see Hafalir and Krishna, 2008; also Haile, 2003 and Garratt and Troeger, 2006). These models have started to become explored experimentally (Georganas and Kagel, 2011; Lange et al, 2011; Pagnozzi and Saral, 2014).
20
Experimental research on single unit demand sequential auctions has been
devoted to exploring the declining-price anomaly reported in field data: Prices of
homogenous auctioned items decrease systematically over the course of selling multiple
items (Ashenfelter, 1989, Ashenfelter and Genesove, 1992). Declining prices are an
anomaly because economic intuition suggests that prices of identical items sold in a
sequence at the same time and place should be the same when each bidder demands a
single item. Weber (1983) proves this to be the case for risk neutral bidders. Further,
although intuition suggests that risk aversion may cause prices to decline, McAfee and
Vincent (1993) demonstrate that this can only be guaranteed if buyers’ have strictly
increasing absolute risk aversion, a questionable assumption. One advantage of
controlled laboratory experiments on this topic is that one can insure that bidders have
single unit demands, which is not assured when looking at field data. This is important
since with multiple unit demands, there are circumstances under which decreasing prices
would be expected to occur.
Keser and Olson (1996; KO) report the first sequential auction experiment with
unit demands with paid subjects.30 Each auction consisted of eight bidders with known
supply of four units bidding in a sequence of FPSB auctions. Each bidder made a bid for
the first unit, with the highest bidder receiving that unit at the price bid. The winning
bidder was no longer permitted to bid, with the auction continuing with new bids
solicited for a second unit. This process was repeated for all four units. Prices of units
sold were announced following the sale of each unit. Values were iid from a uniform
distribution. Four sessions with 20 auction periods each were conducted with subjects
not permitted to bid above their values.
The symmetric RNNE bid function for unit l under this design with support [0, 1]
is
( ) ( )1
l n kb v vn l
−=
− −,
30 In an earlier paper, Burns (1985) compared bidding in a sequential auction between wool buyers and students in which both groups were motivated “by a desire to succeed in their chosen field.” Both groups started out with declining average prices, with the students eventually converging to constant average prices. In contrast, the wool buyers continued to have declining average prices throughout the session. Burns attributed the latter to rules of thumb relevant to field settings but not the more austere conditions of her experimental markets.
21
where v is the bidder’s valuation, n is the number of bidders and k the number of units
sold, so that bids on later units are substantially closer to bidders’ values than earlier
units. However, expected prices remain constant as bidders with higher values get units
earlier than those with lower values.
Table 1 reports realized and predicted prices for each of the four units. There is
some variation in predicted prices as a consequence of the random draws used in the
experiment. Both average and median realized prices decline for later units consistent
with the declining price anomaly. Further, prices were higher than the RNNE for all four
units, only more so for early units. Overall, average efficiency was 98% compared to
close to 85% based on randomly allocating units among the six highest value bidders.
KO classify individual bidders as risk averse if the number of bids above the RNNE
benchmark is greater than the number of bids below it. By this measure, 84% and 81%
of all subjects were risk averse with respect to unit 1 and 2 bids, with these percentages
decreasing to 72% and 53% for bids on units 3 and 4.31
[Insert Table 1 here]
We are aware of two replications of the KO experiment. In Salmon and Wilson
(2008) sold two units in auctions were four bidders for up to 20 periods using an English
clock procedure. This was used as a control treatment for the second-chance offer
auctions discussed in Section 4.3 below. They report average prices of 335 for the first
unit sold versus 273 for the second, compared to the equilibrium prediction of 270 for
both units.
Neugebauer and Pezanis-Christou (2007; NPC) report a series of FP sequential
auctions with eight bidders and four units supplied. Values were iid from a uniform
distribution with support [0, 100], with winning prices announced following each unit
sold. One major difference from the KO experiment is the number of auctions in a
session – 100 here as opposed to 20 in KO.32 NPC measure efficiency in terms of the
proportion of allocations to bidders whose value ranking was lower than the order in
which units were offered – yielding an average aggregate efficiency of 72%.
31 KO report two other treatments designed to represent the impact of agents bidding on behalf of principals, with agents penalized for failure to obtain items. 32 NPC also have treatments with uncertain supply, where the RNNE is predicted to result in decreasing prices.
22
Misallocations were greater for units 1 and 2 than 3 and 4, indicating that the highest
value bidders had adopted a “wait and see” strategy regarding sales of early units, giving
bidders with lower values a chance to win these early units. One consequence of this is
that average prices were approximately constant across units, ranging from a high of 51.7
on unit 1 to a low of 49.5 on the unit 4. So that in this case the “right” result for prices is
achieved for the wrong reason – systematic deviations from the predicted order in which
units were sold with lower valued bidders tending to buy earlier units. One side note
here: Like KO average prices were decreasing across units in the first 20 auctions in
NPC, the total number of auctions in KO’s sessions, as it took some experience for higher
valued bidders to learn the benefits of the wait and see strategy.
Summary: Multiple unit sequential auctions typically exhibit the decreasing price
anomaly observed in field settings. Observing decreasing prices in the laboratory
suggests that its presence in field settings cannot be solely attributed to supply or value
uncertainty, the presence of buyers’ agents in the bidding pool, or other factors that may
contribute to the phenomena in less structured field settings. These results establish an
important connection between laboratory and field settings. What’s missing with respect
to this line of research are direct comparisons of single-unit sequential auctions with, for
example, simultaneous or uniform price auctions in terms of the relative impact on
revenue and efficiency in order to get some idea of which auction mechanism is likely to
perform best in field settings.
1.7 Procurement Auctions
In procurement auctions the lowest bid wins, but this is not what differentiates
them from the buyers’ auctions (high bid wins) discussed so far. Rather, many business-
to-business (B2B) auctions allow for nonbinding (buyer-determined) auctions in which
the buyer does not commit to award the contract to the lowest bidder. Rather, the buyer
reserves the right to select the winner based on bid (price) and “quality.” Quality is
typically treated as exogenous and consists of factors that cannot be easily quantified,
such as reputation and past relationships, so that no explicit scoring rule is announced in
advance.33 Research on these types of auctions, which are quite common for firms
33 For an experiment in which sellers can vary quality characteristics and compete on that dimension in addition to price see Chen-Ritzo et al. (2005).
23
purchasing goods and services in B2B auctions (Jap, 2002), is just beginning, the results
of which are reported on below.
Engelbrecht-Wiggans, Haruvy, and Katok (2007; EWHK) address the question of
under what circumstances does a buyer-determined (BD) mechanism increases the
buyer’s surplus as opposed to a price-determined (PD) mechanism where the buyer
commits to awarding the contract to the lowest bidder. They consider an IPV auction in
which quality Q = C + γX where C (cost) is uniformly distributed on (0, 100), X is
uniformly distributed on (0, 1), and γ is a constant, so that C and Q are positively
correlated. This specification turns a two dimensional problem in terms of seller’s costs
and quality into a one dimensional problem in which each seller knows their own Qi as
do buyers, prior to the start of the auction. Each seller bids a price B(Ci, Qi) with the
buyer selecting the seller with the highest score Qi - B(Ci, Qi). Under the RNNE, FPSB
and SPSB auctions generate the same expected buyer surplus, with the superiority of the
BD mechanism varying as a function of the number of competitors (N) and the extent to
which cost is correlated with quality (γ). Three treatments are studied: (1) N = 2 and γ =
100 so that average buyers’ surplus is greater under BD than under PD, (2) N = 2 and γ =
300 so that buyers’ surplus is greater under PD than BD, and (3) N = 4 and γ = 300 so
that average buyers’ surplus is greater under BD. FPSB auctions are employed
throughout.
Aggregate results comparing buyer surplus confirm these comparative static
predictions, with stronger results for experienced than inexperienced bidders. Efficiency,
defined as the frequency with which the highest scoring bidder win’s the auction, is
consistently higher under BD than under PD, but consistently lower than the point
prediction under BD (between 81-89% versus 100% predicted). One important
shortcoming of this experiment relative to the target environment is that both buyers and
sellers know Qi with certainty prior to the start of the auction, which is almost certainly
not the case in most field settings. There are, however, problems in establishing clear
analytic predictions when Qi is uncertain or is not known by other bidders. Nevertheless,
both the analytic and experimental results serve to disabuse practitioners of the common
notion that buyer-determined auctions will always give them the best of both possible
worlds: the intense price-based competition of price-based auctions and the ability to
24
account for subjective quality characteristics as in more traditional approaches to
procurement.
Haruvy and Katok (2013; HK) consider BD auctions with and without
information about other bidders’quality, using both FPSB and English auctions. They
use the same experimental set-up as in EWHK focusing on the treatment with γ = 300
and N = 4. With full information, each bidder knows all other bidder’s qualities (Q) as
well as whether their own Q is the highest. Under private information bidders only
know their own Q. Given the IPV assumption, under the RNNE expected buyer surplus
is the same under full-information in the English auction and with private information in
the FPSB auction (as in the RET). Further, as with standard English auctions, bidders
have a dominant strategy to bid down to their cost of production before exiting the
auction. Analytic results are not available for English auctions with private information
regarding Q or in FPSB auctions with full information regarding Qs. However,
numerical analysis based on linear approximations of the relevant bid functions and the
draws employed in the experiment show that: (i) Efficiency is lowest in the FPSB
auctions with full information, near 100% in the English auctions with private
information, and 100% in the other two cases, and (ii) Predicted buyer surplus is lowest
in the English auction with private information regarding Q, highest under the FPSB
auction with full information, with expected surplus under the other two treatments
falling approximately half way between the other two cases.
Results show that realized buyer surplus is quite close to predicted surplus in the
English auctions with full-information, but significantly higher than predicted in the other
three treatments, with the highest surplus achieved in the FPSB auction with private
information. The latter corresponds to the standard FPSB auction results in which bids
typically exceed the RNNE (in this case, are below the RNNE), so that buyer surplus is
higher in the FPSB auctions. The present result no doubt rests on many of the same
factors underlying this result in standard auctions. Actual buyer surplus under English
auctions with private information about quality is significantly higher than under English
auctions with public information about quality. This provides support for the idea that
English auctions with information on bid ranks, as opposed to precise bid information,
25
often employed in BD auctions, is surplus enhancing.34 Efficiencies hover in the mid
eighties in all four treatments, with little difference between any of the four cases.35
Shachat and Swarthout (2010; SS) compare a FPSB auction with an English
auction with bid credits that can, potentially, implement Myerson’s (1981) optimal
auction design. In this experiment sellers’ costs and quality are independently determined
draws so that cost and quality may be negatively correlated. As in the experiments
reported on above, both sellers and the buyer know each firm’s quality prior to bidding,
with buyers selecting the firm with the greatest difference between quality and cost.
Buyer subjects determine the bid credits. All auctions involve two bidders. Bid
functions for the FPSB auctions are nonlinear, which typically cause more problems for
bidders than the usual linear bid functions. The English auctions have the usual weakly
dominant strategy of remaining active until price reaches costs, after accounting for bid
credits in this case.
Under the Nash equilibrium the FPSB auctions are predicted to be more efficient,
with average winning quality, seller profit and social surplus a bit higher as well. The
tradeoff is that in the English auctions with optimal bid credits average auction prices will
be lower and average buyer surplus will be higher than in the FPSB auctions. Contrary to
these predictions, efficiency is higher and both buyers and sellers earn greater surpluses
under the English auction (while buyers tend to be too generous with their bid credits).
This is the result of closer conformity to theoretical predictions in the English auctions
compared to the FPSB auctions (a pattern reported in almost all experiments comparing
the two auction institutions). The experiment suffers from the fact that bid credits as well
as the auction mechanism both change between the two treatments so that one cannot
distinguish which of these two factors is driving the results.
In BD auctions, the buyer knows the quality of their incumbent supplier but have
yet to fully screen potential competitors who are invited to participate in the auction, as
34 See Elmaghraby, Katok, and Santamarỉa (2010) for a BD experiment comparing rank feedback with price feedback in BD auctions. 35 In the English auctions with public information there is jump bidding (a bid that is greater than the minimum bid increment). As a result losing bidders sometimes stop short of their cost and winning bidders overshoot the second-best bid. Jump bidding tends to lower efficiency, but the two effects tend to cancel each other out with respect to buyer surplus.
26
full screening is costly.36 Wan, Beil and Katok (2012; WBK) look at the strategic impact
of (full) post-auction screening on incumbent’s bids in a stylized model with one
incumbent whose quality is known and one potential new supplier whose quality is
unknown. There is also asymmetry in the incumbent and entrant’s costs, with the former
potentially a bit more expensive than the latter. Qualification costs are known and are
added to the entrant’s costs, reflecting the cost of switching. There is common knowledge
regarding the probability that the entrant will meet qualification requirements. Behavior
is studied within the context of an English auction with the focus on incumbents’
behavior.
Potential entrants have a dominant strategy to bid truthfully and are replaced by
computers. Three types of equilibria are studied: (1) Incumbents do not compete, bidding
the maximum (reserve) price, (2) Incumbents compete down to their costs, and (3)
Incumbents bid somewhere in between these two extremes (but above their cost). WBK
employ a restricted treatment in which either case (1) or (2) above holds with incumbents
restricted to playing one or the other of the two equilibrium outcomes, and an unrestricted
treatment in which all three possibilities are present and incumbents are free to compete
down to whatever price level they wish.37 The motivation for the restricted treatment is
that there are relatively low profits, along with a complicated piecewise linear bidding
strategy, for case (3).38
The comparative static predictions of the restricted treatment are satisfied
qualitatively in the data. For example, with low qualification costs and a low probability
of qualifying, the incumbent should bid the reserve price 100% of the time regardless of
whether it has low or high costs, and subjects do so 85% of the time. And with high
qualifying costs and the same low probability of qualifying, the incumbent should always
compete with low costs and bid the reserve at high costs, with this comparative static
prediction satisfied qualitatively as well. However, the point predictions are very far off
36 One of the services provided by the company conducting the auction is to identify potentially qualified suppliers. But it is not uncommon in BD auctions for there to be an extended period after the auction has finished where buyers do a thorough screening of low bidders before awarding the contract. 37 In the restricted treatment the incumbent seller makes a bid and then the clock auction is played out. That is, there are no repeated decisions regarding continuing to bid or dropping out, which would be expected to enhance the learning process. 38 There is also a treatment looking at buyers’ choice of a BD or PD auction, which will not be discussed here.
27
in this case as incumbents bid the reserve 63% of the time at low costs (as opposed to 0%
predicted) and bid the reserve 85% of the time with high costs (with 100% predicted).
Further, with high costs of qualifying and high probability of qualifying the predicted
outcome is for always entering at low costs and not entering at high costs, with the
respective entry probabilities being 20% at low costs versus 40% at high costs, changes
in the right direction but well away from the point prediction. Winning rates and contract
prices are quite close to aggregate predicted values for the unrestricted treatment, but
mask a good deal of variability in bid patterns relative to those predicted for any given
cost realization. In spite of the noise in the experimental outcomes, this paper begins to
capture some of the key strategic considerations which are at the heart of what is different
about BD auctions: There are real switching costs to contracting with new suppliers so
that incumbent bidders face strategic issues in determining how hard to compete given
uncertainties about these switching costs and entrants’ costs of production.
There are a number of issues in BD auctions that have yet to be explored. One
important issue is the effect of BD auctions on longer term relationships between buyers
and their suppliers, as the latter are generally unhappy about participating in these
auctions and claim that they can harm longer term relationships, with negative effects on
longer run costs and quality. Unfortunately, this is one issue which more than likely
needs to be looked at in field data. However, what is know from experiments studying
incomplete contracts (and other regarding behavior in general) is that this may well be the
case. But then the question is one of long run benefits versus costs. A second issue
concerns uncertainty buyers and sellers have regarding sellers’ quality characteristics, as
it is rare for these factors to be explicitly quantified before the auction takes place. As
such it would seem important to have a good idea of the extent to which buyers employ
BD or PD auctions in field settings, the types of auctions employed (FPSB or English), as
well as some characterization of the economic conditions that appear to favor one type of
auction over the other, to help guide what kinds of experiments to conduct.
1.8 Cash Balance Effects and the Role of Outside Earnings
In the typical auction experiment subjects bid in a series of auctions with payoffs
following each auction period. As a consequence bidders’ cash balances will vary over
the course of the auction which, for a variety of reasons, may impact bidding; e.g., if
28
subjects are risk averse or have earnings targets or earning aspirations that they bring to
the experiment. Further, since these cash balances are endogenous, absent proper
instruments they cannot simply be included as a right hand side variable in estimating bid
functions since this will result in biased estimates for the variables of interest.
Ham, Kagel and Lehrer (2005; HKL) investigate cash balance effects in the
context of a FPSB auction with affiliated private values (see Kagel, Harstad and Levin,
1987).39 HKL introduce exogenous variation in cash balances by simultaneously
enrolling subjects in a lottery which has both positive and negative payoffs (with positive
expected value). In this way they create their own instrumental variable to study the
effects of cash balances on bids. Instrumental variables for endogenously varying cash
balances consisted of a number of exogenous variables (e.g., ranking of bidders’ values)
produced during the experiment. They also varied the number of bidders in each auction
with either 4 or 6 bidders competing in an experimental session in a between groups
design.
Their results show a small, but statistically significant, negative cash balance
effect on bids; i.e., the larger cash balances are the lower subjects bid, other things equal.
The quantitative effect of cash balances on the bid factor (the difference between a
bidders value and what they bid) is to increase it from $1.76 to $2.36 in auctions with 4
bidders, and from $1.27 to $1.70 with 6 bidders (evaluated at the mean value for cash
balances). KHL also estimate a time trend variable (1/t where t is the number of auction
periods) to capture any learning/adjustments on the part of bidders, which shows that,
other things equal, bid factors decrease over time. This is consistent with NS’s result
(section 1.1 above) that bids tend to increase with experience and feedback regarding
auction outcomes.
HKL estimate the impact of not including cash balances in the bid function. It
biases the time trend coefficient downward – so that there is less of an increase in bids
over time. In addition, since in auctions with larger numbers of bidders, subjects have
lower earnings and smaller increases in their cash balances (holding the support from 39 The advantage of affiliated private values is that except for end point effects, bidders do not know if they have a high or low signal value. This is valuable since in IPV auctions bidders with low valuations know they have little chance of winning the auction which result in a number of “throw away” bids. The affiliated private values model largely eliminates such bids except near the end points of the underlying distribution, as with affiliation bidders do not know if they have a relatively high or low value.
29
which values are drawn constant), the impact of increased numbers of bidders is biased
upwards (as with larger N and a constant support bidders earn smaller profits).
HKL attribute the negative cash balance effect to target income earnings and/or
income aspirations on bidding. They conjecture that the mechanism underlying this
effect is that subjects, who are recruited for the experiment with the promise of cash
earnings, enter the auction with some target income earnings in mind and quickly
recognize that they must win an auction to realize these earnings, which promotes higher
bids at first. However, as cash balances accumulate, bidders come closer to their target
earnings which motivates them to take a chance on a bigger score by lowering their bids,
even though this reduces their chances of winning. This effect is partly offset by the
feedback regarding lost profit opportunities, which induces more aggressive bidding over
time. This conjecture concerning the mechanism behind the cash balance effect remains
to be investigated directly. However, it does receive indirect support from at least one
independent study.
Turocy and Watson (2012) (TW) report an experiment comparing bids in a first-
price IPV auction using the typical resale value frame compared to having an “outside
price” frame. With resale values, the typical experimental design, bidders values are
specified as resale values (the auction winner gets the difference between their resale
value and the bid; all other bidders earn zero profits for that auction). With outside prices
each bidder draws an iid outside price comparable to drawing resale values. Subjects then
bid for the item with the high bidder’s earnings equal to the max of the support from
which values are drawn minus the winning bid; with all other bidders earning the
difference between the max of the support minus their outside price.40
The outside price treatment does two things: (i) it frames the problem differently
as winning now involves an opportunity cost (what you would have earned by not
winning given your outside price) and (ii) everyone is assured of earning a profit in each
auction period. TW find that bids are consistently lower in the outside price treatment
than in the standard resale value treatment; winning bids averaged 3.77 in the resale
frame vs 3.40 in outside price frame but still well above the RNNE ($3.03). TW attribute 40 In the resale value case, payments are made each period. But in the outside price frame, in order to keep the expenses comparable, they are paid for n randomly determined auctions.
30
the lower bidding under the outside option exclusively to the first factor as a result of
differences , which they attribute to differences between losers and winner’s regret
(always getting a payoff reduces loser’s regret). This is quite similar to HKL’s
conjecture, since with everyone assured of earning a profit this should help eliminate
anxieties about achieving a reasonable level of positive earnings regardless of whether
they win or lose the auction. 1.9 An Unresolved Methodological Issue
In reviewing the auction literature one does not have to look very far to identify
two distinctly different ways of treating the data from different experimental sessions.
One approach (one we have usually followed) is to enroll a relatively large number of
subjects into each experimental session and to run several auctions simultaneously,
randomly remixing subjects between groups in each auction. In reporting aggregate
auction data (e.g., average revenue), we have pooled the data (after, perhaps allowing for
a learning period) and conducted either parametric, or non-parametric, statistical tests for
treatment effects. In reporting more disaggregated data (e.g., estimating bid functions for
treatment effects) the data are treated as a time series-cross sectional data set, with
regression estimates based on (standard) random effect models with subject as the
random effect, thereby accounting for obvious serial dependency in individual bid
patterns (e.g., some subjects consistently bid well above the RNNE in FPSB auctions,
others less so).
A second approach is to take the subjects within a given experimental session and
put them into subgroups randomly rematching within the subgroups as opposed to over
the entire sample population. For example, in a study of FPSB auctions with four
bidders, with 16 subjects in each session, the investigator would form two 8 subject
subgroups and randomly mix between them (as opposed to mixing over all 16 subjects in
the session). The motivation for this is to obtain two “independent” sets of observations
per session (the data for each 8 person subgroup) instead of only one independent group
(the data for the 16 subjects in the session as a whole). The data analysis then proceeds
on the basis of the aggregate behavior of these “independent” groups. The concern here
is that in randomly rotating among all 16 bidders in the session, the repeated interactions
between subjects this generates session level effects that will dominate the data. This
31
practice eschews the use of appropriate panel data techniques to correct for dependencies
across and between subjects within a given experimental session, as well as to control for
potential session level effects.
There are several important and unresolved issues in choosing between these two
procedures. In both cases experimenters are trying to squeeze as much data as they can
from a limited subject-payment budget, as well as the time and energy devoted to
conducting experiments. With the reader fully aware of our own biases on this matter we
note the following: First, advocates of repeated matching of the same smaller subset of
subjects (i) often implicitly deceive subjects as they commonly do not report the rotation
rule employed to subjects and (ii) if subjects are as sensitive to repeated matching effects
as proponents of this technique assume, it seems plausible that repeated play within a
small subset might generate super-game effects that will contaminate the data (whereas
the models employed commonly assume one-shot games). Second, and more
importantly, there have been a few experiments which have devoted time and effort to
determine the severity of possible session level effects from random rematching for the
group as a whole. More often than not these studies find no differences, e.g. Cooper et al.
(1993; footnote 13, p. 1308), Duffy and Ochs (2009). Also see Walker et al. (1987) and
Brosig and Reiβ (2007) who find no differences when comparing bids in auctions with all
human bidders versus humans bidding against computers who follow the RNNE bidding
strategy.
More generally we think experimenters should treat this “independence” issue as
an empirical one rather than a doctrinal one determined on the basis of prior beliefs. In
this respect experimenters need to be sensitive to potential session level effects and to
employ appropriate econometric techniques (see, for example, Frechette, 2012) as well as
the old inter-ocular eyeball technique in looking for, and adjusting for, possible session
level effects.
II Single Unit Common Value Auctions
In common value auctions (CVA) the value of the item is the same to all bidders. What
makes CVAs interesting is that although bidders don’t know the true common-value they
receive signals (estimates) that are correlated (affiliated) with that value. Mineral rights
auctions (e.g., outer continental shelf - OCS - oil lease auctions), are usually modeled as a
32
CVA. There is a common value element to most auctions. Bidders for a painting may
purchase it for their own pleasure, a private value element, but also for investment and
eventual resale, the common value element.
Experimental research on CVAs has focused on the “winner's curse.” Although all
bidders obtain unbiased estimates of the item's value, they typically win in cases where
they have (one of) the highest signal value(s). Unless this adverse selection problem is
accounted for, it will result in winning bids that are systematically too high, earning below
normal or negative profits - a disequilibrium phenomenon. Oil companies claim they fell
prey to the winner's curse in early OCS lease sales, with similar claims made in a variety of
other settings (e.g., free agency markets for professional athletes and corporate takeovers).
Economists are naturally skeptical of such claims as they involve out-of-equilibrium play.
Experiments reviewed in Kagel’s (1995) survey clearly showed the presence of a winner’s
curse for inexperienced bidders under a variety of circumstances, and with different
experimental subjects: average undergraduate or MBA students (Bazerman and Samuelson,
1983; Kagel and Levin, 1986), extremely bright (Cal Tech) undergraduates (Lind and Plott,
1991), experienced professionals in a laboratory setting (Dyer et al, 1989), and auctions in
which it is common knowledge that one bidder knows, with certainty, the value of the item
(Kagel and Levin, 1999). Papers reviewed there also dealt with several alternative
explanations for the winner’s curse – limited liability for losses (Hansen and Lott, 1991,
Kagel and Levin, 1991, Lind and Plott, 1991) and joy of winning (Holt and Sherman,
1994).
We pick up the story here with experiments investigating the ability of English
auctions to raise revenue compared to FPSB auctions and the effects of an insider who has
better information than rival bidders, with the focus on the comparative static predictions of
the model in these cases. We look at behavior of very experienced bidders who have
overcome the worst effects of the WC, bidding in “almost” CV auctions where one bidder
values the item more than others (with this being common knowledge), and bidding in
auctions with both private and common value elements for all bidders. New results on the
closely related “takeover” game are reported with the focus on sorting out between
different explanations for the winner’s curse (WC). We report on the impact of
33
demographic and ability variables on the likelihood of falling prey to the WC, and what the
lab results may or may not tell us with respect to behavior in field settings.
The auctions reported on here, unless otherwise noted, use the following
experimental design: The common value, xo is the same for all bidders and is chosen
randomly from a uniform distribution with support [ v , v ]. Each bidder i receives a
private information signal, ix , about the unknown value of the item based on an iid from a
uniform distribution with support [xo – ε, xo + ε].
2.1 English Auctions
Levin, Kagel, and Richard (1996; LKR) implement an irrevocable exit,
ascending-price (English clock) auction. Prices start at v , the lowest possible value for xo,
and increase continuously. Bidders are counted as actively bidding until they drop out of
the auction and are not permitted to reenter after that.41 The last bidder earns a profit
equal to xo less the price at which the last bidder dropped out. Bidders observe the prices
at which their rivals drop out of the bidding. The irrevocable exit procedure, in
conjunction with the public posting of drop-out prices, insures that in equilibrium bidders
can infer their rivals’ signal values from the drop-out prices.
The analysis focuses on signals in the interval v + ε ≤ x ≤ v – ε. In a symmetric
RNNE the bidder who holds the lowest signal value (xL) drops out of the auction once the
price reaches xL.42 This drop out price reveals xL to the remaining bidders. Given the
uniform distribution of signal values around xo, and the fact that in a symmetric
equilibrium any remaining bidder j wins only when she holds the highest signal, each
bidder j ought to use (xL + xj)/2 (a sufficient statistic for xo) as their drop out price in the
symmetric RNNE. Drop out prices other than xL contain no additional information and
should be ignored. Expected profits in the English auction are reduced by about 50%
41 Prices started at v as any other price rule would reveal information about xo. Prices increased by smaller and smaller increments as bidders dropped out, with brief pauses following each drop out. 42The intuition behind this is roughly as follows: Given symmetry, the low signal holder knows that those remaining in the auction have higher signal values so that his estimate of xo is higher than xL. But the low signal holder can't profit from this additional information since not dropping at xL pushes the price up, so that winning at a higher price, when others drop at equilibrium prices, assures the low bidder negative expected profit.
34
compared to a FPSB auction when more than two bidders are competing, so that the
English auction is predicted to raise significantly more revenue compared to a FP auction.
Earlier experimental results from FP auctions with xL publicly announced (Kagel
and Levin, 1986;KL, 1986) showed that when bidders suffered from a winner’s curse
(WC), announcing xL lowered revenue (contrary to the theory’s prediction) as bidders
with higher signal values recognized that they were overestimating the common value.
However, once bidders had adjusted to the WC, and were making reasonable profits
relative to the RNNE benchmark, revealing xL increased revenue via the linkage principle
as the theory predicted. The key difference between LKR’s English clock auctions and
these earlier FPSB auctions is that information dissemination is endogenous in the clock
auctions rather than exogenous, when xL is publicly announced. As such higher signal
holders must be able to recognize and process the relevant information, and low signal
holders must recognize the futility of remaining active once the price exceeds their signal
value in order for the results to generalize.
[Insert Table 2 here]
Table 2 shows averages of predicted and actual changes in revenue between
English and FP auctions for inexperienced bidders with the results classified by the
number of bidders.43 Average revenue is predicted to be higher in the English auctions in
all cases for the set of signal values actually drawn, with significantly higher average
revenue predicted for n = 4 for all values of ε and for n = 7 with ε = $12.44 However, for
these inexperienced bidders, with the exception of n = 4 and ε = $24, actual revenue is
lower in the English auctions, with significantly lower average revenue for n = 4 and 7
with ε = $6 (p < 0.05) and for n = 7 and ε = $12 (p < 0.10).
These perverse revenue effects in terms of Nash equilibrium bidding theory are
associated with negative average profits in both the FP and English auctions (see Table
2). The negative average profits indicate that inexperienced bidders suffered from a WC
in both FP and English auctions, but that the curse was relatively stronger in the FP
43Common-value auctions involve pure surplus transfers so that revenue differences are calculated as: [πE - πF] where πE and πF correspond to profits in English and FP auctions, respectively. This effectively normalizes for sampling variability in xo by subtracting it from the price. 44 One-tailed t-tests are conducted for predicted revenue increases since the symmetric RNNE makes unambiguous predictions regarding revenue. Two-tailed t-tests are used for determining statistical significance of actual revenue changes since the presence of a WC promotes lower revenue in English auctions.
35
auctions. These results serve to generalize those reported for FP auctions with xL publicly
announced (KL, 1986). However, the generalization is not complete as average profits in
the English auctions were negative compared to positive average profits in the FP
auctions with xL publicly announced. This suggests that information dissemination in the
English auction is noisier than with xL publicly announced. This probably results from
two factors: (i) in the English auction bidders may not completely recognize the
relationship between the first drop-out price and xL and (ii) there is some out of
equilibrium play with low signal holders dropping out sometimes above and sometimes
below their signal value. 45
For more experienced bidders, English auctions raised average revenue with n =
4, with a statistically significant increase for ε = $18 (see Table 3). However, for n = 7,
there was essentially no difference in revenue between the FP and English auctions. The
significant increase in average revenue in English auctions with n = 4 was associated with
the elimination of the worst effects of the WC in the FP auctions, as bidders earned a
substantial share (more than 50%) of predicted profit. In contrast, with n = 7 bidders
earned a relatively low share (21%) of predicted profits in the FP auctions, indicating
substantially stronger residual traces of a WC, and highlighting the importance of largely
eliminating the WC in order for English auctions to raise revenue as the theory predicts.
[Insert Table 3 here]
LKR develop an econometric model to characterize how bidders process
information in the English auctions. As noted, the Nash bidding model predicts that
bidders with higher signal values will average their own signal value with the first drop-
out price observed, ignoring all intermediate drop-out prices. What they found, however,
is that bidders placed weight on their own signal and the immediate past drop out price,
ostensibly ignoring xL and any earlier drop out prices. Further, as more bidders dropped
out, subjects placed less and less weight on their own signal and more weight on the last
drop-out price. This pattern, although inconsistent with the Nash model, is consistent
with bidders acting “as if” they were averaging their own signal with the signal values 45 To further investigate this question Kagel and Levin (unpublished data) conducted some additional sessions with inexperienced bidders in which xL was publicly announced prior to bidding in the English auctions. In auctions with 6 bidders and ε = $12, average profits in the standard English auction were -$1.55, with average profits in auctions with xL announced of $1.56 (t = 1.46, d. f. = 30, p < .10, 1-tailed test).
36
underlying the drop out prices of all earlier bidders. They attribute the adoption of this
signal averaging rule to the fact that (i) it is easy and quite natural to use and (ii) it yields
results quite similar to the Nash rule without requiring that bidders explicitly recognize
the adverse selection effect of winning the auction and/or knowing anything about
sufficient statistics. One unanswered question raised by this analysis is if the signal-
averaging rule would still be used with distribution functions where it leads to markedly
different outcomes from the Nash equilibrium. In this case bidders would have more
opportunity to recognize and respond to the profit opportunities inherent in abandoning
the signal-averaging rule.
2.2 Auctions with Insider Information
The standard CVA model assumes that all bidders are ex-ante symmetric with
respect to the quality of their signals (estimates) regarding the common-value. It is quite
natural to ask how robust the equilibrium is to the insertion of one bidder, an insider, who
is better informed than the other bidders, outsiders. The easiest place to start this analysis
is to assume that it is commonly-known that there is a single insider with a better, more
precise, estimate of the true value (at the extreme, an insider who knows the true value).
Evaluating auction performance with an insider compared to the symmetric
baseline depends quite critically on the baseline chosen. Wilson (1967) employed a
symmetric baseline in which all bidders have only public information so the seller
extracts the entire surplus in the resulting mixed strategy equilibrium (also see Hausch,
1987 and Hendricks et al., 1994 for similar models). Introducing an insider into this
environment reduces the seller’s revenue, as the insider can, and does, bid below the true
value, earning positive profits. Since ex-post efficiency is not an issue in a pure
common-value model, the insider’s gains must be the seller’s loss. We are unaware of
any experiments that have investigated these predictions of the Wilson-type model.
In contrast Kagel and Levin (1999; KL 1999) used the symmetric bidding model
characterized in Section 2.1 as their baseline. Their “insider” treatment consisted of a
single bidder who knows the true value with certainty, with all other bidders aware of this
fact. “Outsiders” continued to draw signal values as in the symmetric bidding model.
They did this to see if the presence of an insider who knows the true value would help
bidders recognize the adverse selection effect conditional on winning thereby mitigating,
37
or possibly even eliminating, the WC. Although this hypothesis failed (inexperienced
outsiders suffered from as strong a WC as inexperienced bidders with symmetric
information), the experiment led to a very surprising and significant discovery: With
more experienced subjects who had learned to overcome the worst effects of the WC,
earning substantial positive profits in FPSB auctions with symmetric information, the
introduction of an insider actually increased seller’s revenues, as opposed to the decrease
predicted in a Wilson-type model. Table 4 reports these results.
[Insert Table 4 here]
This surprising outcome, particularly given the theoretical results from Wilson-
type models, might have led some skeptics to dismiss this new finding, arguing that “in
laboratory experiments anything can happen.” However, a further examination of the
model revealed that the data are consistent with the model’s predictions and to the
discovery of the mechanism underlying this effect. Unlike in Wilson-type models, in
KL’s symmetric information benchmark model all bidders have private information, so in
equilibrium bidders make positive profits. As a result the introduction of a perfectly
informed insider eliminates those baseline cases where the winning bidder makes very
large profits, as the insider bids closer to the true value, on average, than bidders in the
symmetric information baseline. (Evidence for this can be seen in the much smaller
variance in average profits between asymmetric versus symmetric information setups
reported in Table 3.) Further, unlike the early Wilson-type models, both insiders and
outsiders earn positive average profits in equilibrium, as both agents have private
information (insiders do not know the outsiders’ private information signals). What the
two types of models do have in common is that conditional on winning, insiders make
much larger average profits compared to outsiders as they have superior information.46
KL (1999) argue that many “real world” cases are more realistically modeled with
outsiders having some proprietary information and not just public information. In these
circumstances, it may well be the case that the introduction of a single well-informed
insider increases average sellers’ revenue, and that both insiders and outsiders earn
46 There is no analytic solution, or even readily calculated numerical solutions, to the system of differential equations that characterizes the Nash equilibrium in KL (1999). However, see Campbell and Levin (2006) for a model which solves for the Nash equilibrium analytically, in which the introduction of an insider may raise revenue as well.
38
economic rents. This potential for an insider to raise average revenue in a CVA had not
been recognized in the literature prior to this.
2.3 Common Value Auctions with an Advantaged Bidder
The standard CVA model assumes that all bidders have exactly the same value for
the item. But how robust, theoretically and in practice, are the properties and performance
of auctions to slight departures from this assumption? In many common value auctions it
is common knowledge that one (or more) bidder(s) (advantaged bidders) get an extra
payoff relative to the other (regular) bidders; e.g., in the FCC regional air wave rights
auctions, Pacific Telephone was widely believed to place a higher value on the West
Coast regional area than their potential rivals because of their familiarity with the region
and their existing customer base (Klemperer, 1998). Economic theory suggests that with
two bidders and a SPSB or English auction even the tiniest private value advantage can
have an “explosive” effect on auction outcomes, with the advantaged bidder always
winning and earning very high profits (sharply reduced revenue) (Bikchandani, 1988;
Klemperer, 1998). However, the question of whether or not these predictions will
emerge depends critically on bidder behavior. It is here where experiments can help sort
out when, where and why we ought to be concerned about such explosive effects.
Avery and Kagel (1997; AK) investigated the explosive effect of a small private
value advantage in a SP “wallet-game” auction. Two bidders bid in a SPSB auction for
the value of a wallet with two cells, where each of them privately observes the content of
only one of the cells. Let x1 and x2, represent the privately observed signals by the first
and second bidder respectively. The value of winning the wallet for these bidders is: V1
= x1 + x2 = V2. Bidding twice their observed signal, b(xi) = 2xi, i = 1, 2 is both a unique
symmetric equilibrium as well as an ex-post equilibrium in which bidders have no
regret.47 Further, it is distribution free and independent of risk preferences.
With a private value advantage, the valuation of the advantaged bidder (say
bidder 1) becomes: V1 = x1 + x2 + Δ (or V1 = x1 + x2 + Δx1, in the multiplicative form)
where Δ > 0, is presumed small. Essentially what the private-value advantage does is to
destroy the symmetric equilibrium of the SP auction. In the resulting asymmetric
47 The winner earns xHigh + xLow and pays 2xLow for a net gain of xHigh – xLow > 0. However, if the loser wins she earns xHigh + xLow and pays 2xHigh for a net gain of xLow – xHigh < 0. Thus, even after learning both signals, no one regrets the outcome (given the equilibrium strategy of the other bidder).
39
equilibrium the private-value advantage has a “snowball” effect resulting in the
advantaged bidder winning all the time, bidding too high for the disadvantaged bidder to
profitably unseat him. This does not happen in a FPSB auction but does in a SP auction
as the high bidder does not have to pay what he bids.
In the experiment, the effect of the Δ value advantage on bids and prices was
proportional rather than explosive as, controlling for signal values, the difference in bids
between advantaged and disadvantaged bidders was closer to the private value advantage
of $1 than to the $3 difference predicted under the explosive effect. In effect, both
advantaged and disadvantaged bidders were bidding closer to the naïve expected value of
the item conditional on their signal value, with the advantaged bidder simply adding their
private value advantage to their estimate. AK explore a number of alternative
explanations for this outcome. None fit as well as the naïve behavioral model in which
advantaged bidders simply add their private value advantage to their estimate of the
common value.
Rose and Levin (2008; RL) investigate the effect of a private value advantage in
the two-person wallet game, this time using an English clock auction. The key
motivation for this experiment is that in virtually all experimental work behavior is much
closer to equilibrium predictions in English clock auctions compared to sealed-bid
auctions (KHL, 1987; LKR; KL, 1999). As such there is a clear need to explore the
model in an English auction before concluding that small asymmetries do not matter very
much, particularly since English auctions are far more common than SPSB auctions. RL
do not find any evidence of the explosive effect either, with players clearly suffering
from the winner’s curse in both the symmetric and asymmetric auctions, as evidenced by
the frequency with which they lost money. When tested against the data, the Nash
equilibrium model and the expected value hypothesis (naïve expectations) are both
rejected, although the expected value hypothesis provides a better fit than the Nash
model.
Rose and Kagel (2008; RK) explore the effects of a private value advantage in an
English clock auction under the same single structure employed in LKR. They employ
twice-experienced subjects who have come to earn relatively large positive profits in
FPSB auctions. This is important since virtually all research in CVAs shows that when
40
bidders suffer from an obvious WC, as they did in the control treatments in AK and RL,
the comparative static predictions of the Nash model fail to hold. However, once bidders
have learned to overcome the worst effects of the WC, the theory’s comparative static
predictions tend to hold.48
Here too bidders’ responses to the private value advantage are closer to
proportional than explosive as advantaged bidders won only slightly more often than
would be expected based on chance factors alone. Further, there are no significant
differences in revenue between the pure CVAs and almost CVAs. RK show that the same
behavioral model employed in AK, with advantaged bidders simply adding their private
value advantage to their estimate of the common value, better organizes the data than
does the Nash model with its explosive outcome. From a broader perspective these
results demonstrate that adjustment to equilibrium under a trial and error learning process
(which seems to be how subjects learn to overcome the WC in FPSB auctions; see KL,
1986) provides no assurance that after near equilibrium behavior is achieved, the
comparative static predictions of the theory will be satisfied.
Takeover battles for control of a company when bidders already have
stakes/shares (toeholds) in the target company are quite similar to almost CVAs.49
Consider the wallet game when each of the two bidders for the firm has an i.i.d. signal
and where the common value of the firm is the sum of the two signals. In addition every
bidder already owns a share Qj, j = 1, 2, of the target firm. In this setup the (relative)
ratio of the shares, Qj /(Q1+Q2) has a dramatic impact on the predicted outcome as (i) the
probability of winning the auction by bidder j is Qj /(Q1+ Q2), (ii) increasing a bidder’s
share, Q, makes that bidder more aggressive and (iii) increasing a bidder’s toehold
increases her profits regardless of her signal. Thus, although the equilibrium does not
lead to the explosive outcome when both bidders have positive toeholds, behavior is quite
sensitive to even small disparities in the relative size of bidders’ shares. This is quite
surprising as it predicts the same equilibrium outcome regardless of the absolute size of
the toeholds as long as the relative ratio is the same; e. g., the same outcome is predicted
48 In employing an English clock auction with four bidders RK are also able to address Klemperer's concerns regarding the use of ascending price auctions on bidders’ reluctance to enter the bidding process. Regular bidders were not deterred from bidding. 49 The discussion here, as well as the experiment that follows is based on Bulow et al. (1999).
41
when bidders 1 and 2 hold 20% and 10% shares as when they hold 0.2% and 0.1%
shares!
Georganas and Nagel (2011) explore the predictions of the toehold model using
an English clock auction. They find that larger toeholds raise the probability of winning
and the profits of their owners as the theory predicts, and that revenue tends to fall the
larger the discrepancy between the shares of the two players’ toeholds. However, as in
the almost CVA, these results are not nearly as dramatic as the theory predicts. The paper
concludes that laboratory subjects do not respond to small toeholds or to small disparities
in toeholds to the extent that the theory predicts.
Summary: The results of all four experiments reported on here agree that contrary to what
theory predicts, a private value advantage leads to proportionate as opposed to explosive
effects in almost common value SPSB and English auctions. This is true even with
experienced bidders who earn a respectable share of RNNE profits in pure CVAs so that
they have overcome the worst effects of the WC. The apparent reason for these failures is
that bidders do not fully appreciate the adverse selection effect conditional on winning,
which is exacerbated for regular bidders when facing an advantaged rival. As such, the
behavioral mechanism underlying the explosive effect is not present, and there are no
forces at work to replace it.
This leaves us quite skeptical of finding similar effects outside the lab under the
conditions the theory specifies. Indeed, it would seem to require very sophisticated
bidders for the explosive effect to be realized under these conditions. As such we would
expect that bidders outside the laboratory would employ alternative strategies available to
them in the less structured environment they operate in to press their private value
advantage. PacTel appears to have done something like this in the FCC major trading
area (MTA) sale of broadband personal communication licenses for Los Angeles and San
Francisco. PacTel, which held a substantial private value advantage, publicly announced
their intentions to top their opponents bids, while obviously having the resources and a
sufficiently large private value advantage to make such an announcement credible (see
Cramton, 1997), a strategy that lies outside the formal theory. As a side note, PacTel got
the licenses in question but they were only partially successful in obtaining rock bottom
prices, as there was rivalrous bidding based on the personalities of the leading bidders,
42
another element left out of the formal theory. Further, as Cramton (1997) notes, there
may also be some incentive under these circumstances for predatory bidding on the part
of rivals that would work against the revenue reducing forces implied by the explosive
effect and indeed seem to have been at play in the MTA broadband sales.
2.4 New Results in the Takeover Game: Theory and Experiments
The systematic overbidding resulting in a WC for inexperienced bidders has
attracted the attention of theorists in efforts to explain the WC within a generalized Nash
bidding model that permit a more relaxed belief system. Eyster and Rabin (2005; ER)
generalize the Nash model by introducing the notion of a “cursed equilibrium” in which
bidders correctly predict, and best respond to, the distribution of others’ bids, but do not
correctly perceive how these other bids depend on other bidders’ signals. This model
rationalizes deviations from the standard Nash equilibrium depending on the degree of
“cursedness” bidders suffer from.
Crawford and Iriberri (2007; CI) rationalize the WC within the context of a level-
k reasoning model. Roughly, they allow different levels of “sophistication” where they
define a level-0 player as a bidder who picks randomly from the allowable set of actions,
with more sophisticated players best responding to all other players being one level less
sophisticated than they are (so level-1 best responds to level-0, and level-2 best responds
to level-1). The remarkable thing about this approach is that (i) a combination of level-1
and level-2 players explains the high frequency of WC for inexperienced bidders in
FPSB auctions and (ii) the estimated frequencies of the two player types closely matches
the frequencies reported in a variety of other, unrelated, experiments (having (i) without
(ii) would simply be an exercise in data fitting).50 Both the ER and CI models apply to
CVAs and the closely related “take over” game.
Nash equilibrium bidding in CVAs requires complicated calculations of best
responding to other bidders actions, involving both beliefs about others rationality and
strategic uncertainty. To circumvent these complications Charness and Levin (2009; CL)
employ a modified version of the takeover game turning it into an individual decision
50 As CI note, their model cannot explain the winner’s curse in SP CVAs or the persistent overbidding in FP private value auctions. Nevertheless, this paper is important because it shows a totally unanticipated result for FP CVAs. The failure to explain overbidding in SP CVAs can be rationalized by the fact that subjects simply do not understand SP auctions very well, whether private or common value.
43
making problem where avoiding the WC does not depend on beliefs about other bidders’
actions. In the takeover game (first studied in Samuelson and Bazerman, 1985) there are
two players, a buyer (the acquiring firm) and a seller (the target firm). The buyer knows
that the target's value, VS, is a random variable uniformly distributed in the interval [$0,
$100]. The value of the target firm to the buyer, VB, is VB = 1.5VS. The buyer does not
know VS when placing their bid, but knows that the seller does and that the seller
employs the dominant strategy of only accepting offers that are greater than, or equal to
VS. In spite of the simplicity of this game, which abstracts from many of the
complications embodied in a multi-player auction context, subjects still suffer from not
recognizing the adverse selection effect conditional on winning and succumb to the WC,
bidding somewhere between the unconditional expected value to the seller of 50 and the
unconditional expected value to the acquirer of 75 (as opposed to the optimal bid of zero;
see Kagel, 1995; and KL, 2002 for summaries of results from these experiments).
CL transform the game into an individual-choice task where subjects make a bid
and then choose one of 100 ‘cards’ numbered {0, 1, 2,…, 99}, that are displayed face-
down on the computer screen. The same rules apply as in the takeover game in that if the
card chosen is less than or equal to the bid, players receive 150% of the current value of
the card less their bid, and zero otherwise. However, there are no other human agents
whose behavior bidders need to establish beliefs for, either in the sense of ER or CI.51
CL find average bids to be 38.9, which is lower than the 50-75 average typically
reported when the game is framed in terms of sellers accepting or rejecting bids. Further,
there is a higher proportion of very low bids in the 0-9 range (around 25%) than typically
reported.
To further simplify choices, CL modify the game even further, employing just
two possible card values, 0 or 99. This treatment circumvents the need to use Baye’s law
to construct posterior beliefs, as well as the need to recognize the implications of the
firm’s values being drawn from a uniform distribution. Now, without any calculations, it
should be clear that 0 dominates any bid except for 99. Further, in choosing between 0
and 99 the choice of 99 involves a rather unattractive gamble between a positive profit of
51 Also see Tor and Bazerman (2003) who argue that the WC in the takeover game results from buyers ignoring sellers’ cognitive processes.

44
49.5 or a negative profit of 99, with both outcomes equally likely, for an expected profit
of negative 24.25.
[Insert Figure 5 here] Figure 5 reports the results from this last treatment under two sets of instructions,
with one providing more detail than the other. While there are relatively few bids other
than 0 and 99, 47% of all bids are 99. Since the latter may reflect a need for some
“action” as opposed to always bidding zero, CL further modify the game so that the card
values are either 20 or 119. Now, bidding 20 yields positive expected profit. This results
in an even further reduction in the frequency of non-optimal bids to 30%.52 Finally, CL
have subjects choose between lotteries whose payoffs are equivalent to the 0-99 and 20-
119 treatments to rule out risk loving as a possible explanation for non-optimal bids.
CL note that taken literally, converting the takeover game to an individual choice
problem rules out both the ER and CI models as an explanation for the winner’s curse,
since there are no other players whose actions must be taken into account. However,
assuming that subjects still frame the situation as a two-player game, with the computer
as the second player, results from the two-card treatments are inconsistent with both
models as they predict all bids will be 0 (in the 0 or 99 treatment) or 20 (in the 20 or 99
treatment). CL conclude that the fundamental problem underlying the winner’s curse is
the failure to fully account for payoffs contingent on winning the auction.
One possible limitation of CL’s results is that in transforming the problem into an
individual choice task, this still leaves open the possibility that models which incorporate
best response behavior, but allow for inconsistent beliefs, may explain the WC in
auctions. To address this issueIvanov, Levin and Niederle (2010) employ a SPSB CV
auction called the maximal game in which two players receive an iid signal, with the
common value of the item equal to the highest signal drawn. The maximal game is
dominant solvable in two iterations, so that overbidding (the WC) can only be
rationalized by cursed (or k-level) beliefs if a bidder believes that others are using
dominated strategies (in this case bidding below their signal values). They investigate
this by (i) exogenously disallowing underbidding and (ii) by having subjects bid against
52 There is little change over time in the frequency of 0 bids or bids of 20 in the 0-99 and 20-99 treatments respectively. Further, it does not appear that many subjects consistently bid 0 or 20 in these treatments.
45
their own bid from previous auctions. Neither of these two treatments eliminates the
WC. There is minimal tendency toward downward correction of bids in both treatments
as well. These results, together with CL, strongly suggest that the WC in laboratory
experiments represents a more fundamental departure from Nash equilibrium bidding
than simple inconsistency of beliefs. Quantal response equilibrium, which relaxes the
requirement for strict best responding, is at odds with their data as well.
2.5 Additional Common Value Auction Results
2.5.1 Super Experienced Bidders: Kagel and Richard (2001; KR) investigate bidding for
super-experienced bidders - subjects who had participated in at least two, and up to four,
prior CVA sessions. These super-experienced bidders had learned to overcome the worst
effects of the WC in FPSB auctions, rarely bidding above the expected value conditional
on winning. However, they still earned less than 50% of the Nash profits (at a cost of
between $2.50 - $3.50 per auction, conditional on winning). KR examine a number of
elements that might be responsible for the continued shortfall relative to the RNNE
benchmark.
They first look at the bid function itself, which is quite complicated over the full
support from which signals are drawn, to see if it is for the shortfall in profits relative to
the RNNE benchmark. They find that bidders use sensible piecewise linear bid functions
rather than the more complicated Nash bid function. But simulations show that there
exists a symmetric rule of thumb equilibria (RTE) (in which bidders are restricted to
using piecewise linear bid functions of the sort estimated) in which profits are equal to or
greater than the RNNE benchmark. As such, bidders’ inability to account for the
complexities of the Nash bid function cannot account for the marked reduction in their
earnings. KR also show that subjects are not best responding to bids in excess of the
RTE as large sample estimates of best responding requires a piecewise linear bid function
very close to the symmetric RTE benchmark. Losses relative to best responding averaged
20% and 44% in auctions with 4 and 7 bidders, respectively. Thus, very experienced
bidders still suffer from a WC, albeit one that is much less pronounced and more subtle
than the negative average profits inexperienced bidders suffer from.
KR suggest two primary reasons for these continuing losses relative to the RNNE
and the RTE benchmarks. First, best responses are highly variable in small samples of the
46
sort that bidders would have seen, sometimes pointing in the wrong direction (bid higher
than best responding based on large sample estimates) and sometimes implying overly
passive bidding (bid below x - ε). This makes best responding far more problematic than
the large sample estimates suggest, and could lead bidders to simply ignore any feedback
once consistently positive profit levels were achieved. Second, large sample best
responses require winning half as many auctions as were actually won. This involves a
rather dramatic change in bidding, assuming that bidders are able to identify this fact, so
that here too subjects may be reluctant to deviate from a rule of thumb that has proved
capable of generating acceptable profit levels (compared to their inexperienced selves) in
such a high variance environment.
2.5.2 Auctions with Both Common and Private Value Elements: One of the
simplifications in standard auction theory is that bidders are dealing with either a pure
common value or a pure private value environment. However, most real world auctions
have both private and common value elements. For example, bidders for oil leases may
have a single estimate for the common-value of the oil in the ground that is affiliated with
other bidders’ estimates and, in addition, have an idiosyncratic cost of extracting the oil
and delivering it for refining. The theoretical difficulty with multiple signals for all
bidders is how to combine them into a single statistic that can be mapped into a bid.53
Goeree and Offerman (2003) develop one such model, and investigate it experimentally
(Goeree and Offerman, 2002; GO).54
GO employ a series of FPSB auctions, the main objectives of which are to evaluate
those factors their model predicts will raise efficiency and revenue. These consist of (i)
reducing the variance in the signals for the CV component, which ought to make the
auction more efficient as it moves the environment closer to a pure private value auction,
(ii) increasing the number of bidders which, in their model, reduces the weight bidders
place on the CV component of their signal, thereby increasing efficiency, and (iii) releasing
public information that reduces the importance of the CV element, thereby increasing
revenue as in a pure CVA and improving efficiency as well. In all treatments, both the
53 This section is clearly related to that of common value auctions with an advantaged bidder. However, in this case bidders have two independent signals, one for the common value and one for the private value. 54 In their formulation the common value component depends on the average of bidders common value signals.
47
“rational” bid function in which bidders fully account for a potential WC, and a naive bid
function in which bidders fail to do so, predict the same winner as they are both functions
of the same summary statistic, so there is no efficiency loss in their design due to a WC.
[Insert Figure 6 here]
GO report that the winner’s curse is alive and well in their experiment as bids lie in
between the naïve and Nash benchmarks (see Figure 6) even for experienced bidders, and
lie closer to the naïve benchmark the less important a bidder’s private value is relative to
the common value.55 The WC serves primarily to raise revenue and reduce bidders’ profits,
with realized efficiency roughly at the level predicted under the RNNE. The latter occurs
because (i) almost all bidders suffer from a WC and (ii) the degree of suffering is roughly
the same across bidders, so that the private value element of a bidder’s signal serves to
dictate who wins the auction. As predicted, efficiency increases the smaller the variance in
the signals for the CV component and with increases in the number of bidders. Ignoring
their low variance treatment, with its minimal scope for a WC, public information
regarding the CV component increases bidders’ profits in four out of five treatments,
consistent with the comparative static prediction of the naive bidding model and the results
reported in KL (1986).
2.5.3 Selection Bias, Demographic, and Ability Effects: The transition from inexperienced
bidders suffering persistent losses to experienced bidders earning respectable profits in
CVA experiments is characterized by large numbers of bidders going bankrupt, with
these bankrupt bidders much less likely to return as experienced subjects. Further, the
WC involves a judgmental error – the failure to account for the adverse selection effect
conditional on winning – so that it joins a growing literature suggesting that limited
cognitive abilities might help to explain many of the observed deviations from full
rationality reported in experiments. Casari, Ham and Kagel (2007; CHK) conduct an
experiment designed to better understand the process whereby experienced bidders learn to
avoid the WC, as well as the impact of cognitive ability and demographic effects on
learning to overcome the WC. Cognitive ability is measured by Scholastic Aptitude and
American College Test (SAT/ACT) scores collected from university records. University
55 Bankrupt bidders from inexperienced subject sessions were not invited back for experienced sessions. This generates potential selection effects discussed in the next subsection.
48
records also provided information regarding college major, grade point average (GPA),
and gender.
Subjects participated in two sessions approximately one week apart. To better
understand the learning process, starting cash balances were randomly varied across
bidders, with additional random shocks generated via a lottery with positive expected
value (similar to the HKL experiment reported in section 1.6 above). Further, some
sessions followed standard experimental procedures inviting all subjects back for
additional sessions without any special inducements to return, while others recruited
subjects who were committed to returning and were provided strong incentives to do so
in the form of relatively large show-up fees (to be paid at the end of session two), with
half of session one’s earnings withheld until completion of session two. In this way CHK
hoped to distinguish between learning via market selection effects (less able bidders
going bankrupt, exiting the market and not returning for subsequent experimental
sessions) versus individual bidders learning to avoid the WC.
CHK report a number of substantive as well as methodological results: First, not
surprisingly, ability as measured by SAT/ACT scores matter in terms of avoiding the
WC. However, the nature of these ability effects are different from what one might
expect as (i) composite SAT/ACT scores were consistently more significant than either
math or verbal scores alone and (ii) the biggest and most consistent impact was that
subjects with below median scores were more susceptible to the WC, as opposed to those
with very high scores doing exceptionally well. Second, there were clear demographic
effects as inexperienced women were much more susceptible to the WC than men, even
after controlling for ability and college major, factors that are not typically controlled for
in investigating gender effects in experiments.56 However, women learned faster than
men so that this difference disappeared with experienced bidders. Economics and
business majors were much more susceptible to the WC than other majors, and continued
to earn lower profits even as experienced bidders controlling for SAT/ACT scores and
gender. Controlling for selection effects, bidders are capable of substantial individual
learning, even those subjects who start out being most susceptible to the WC. However,
more able bidders were more likely to return as experienced subjects, with this factor
56 Similar gender effects are identified by Charness and Levin (2009) in the closely related takeover game.
49
dominating learning between weeks one and two for those sessions that did not employ
special inducements to get subjects to return. As such previous studies that have not
controlled for selection effects are likely to have substantially overestimated the amount
of individual subject learning that occurs when moving from inexperienced to
experienced bidders.
CHK also find that standard econometric estimators for dealing with selection
effects in field data do not identify them in their data, in spite of having a relatively large
sample by experimental standards and well identified econometric models. However, the
different experimental treatments built into the experimental design serve to identify,
measure, and verify these effects. The latter is not surprising, since at least as far back as
Fisher (1935) statisticians have understood that experimental design could permit the
identification of casual effects.
As to why economics and business majors were more susceptible to the winner’s
curse, CHK suggest that this is more than likely a personality effect, with business and
economics students by nature more aggressive in business-type transactions. An
alternative hypothesis, that ‘little knowledge is a dangerous thing,’ is rejected on the
grounds that subjects were drawn primarily from introductory economics classes which
do not cover issues like the WC. The gender effect is much more difficult to explain. Two
known factors that immediately come to mind, that women tend to be more risk averse
than men and that men tend to be overrepresented in the upper tail of mathematical
reasoning, fail as (i) risk aversion cannot explain succumbing to the WC since it involves
earning negative expected profits and (ii) the estimated bid functions show that
mathematical ability does not play a critical role in succumbing to the WC (and was
controlled for in the statistical analysis). CHK conjecture that the greater susceptibility of
women to the WC may reflect a relative lack of experience with strategic interactions
compared to men, perhaps as a result of women shying away from competition more than
men (Niederle and Vesterlund, 2007; see Chapter xx as well). This relative lack of
familiarity might induce more aggressive bidding as a consequence of the failure to fully
think through its implications.
Remark: CHK also compared their sample population to the university population from which their sample was drawn. The most interesting result here is that 20.2% of their sample were in the top 5% (of the national average) with respect to composite SAT/ACT
50
scores (versus 4.9% for the university), with less than 8.9% scoring below the median (versus 20.9% for the university), indicating that much brighter students enrolled in their experiment. These results suggest that subjects who voluntarily enroll in economics experiments more than likely over represent high ability students. 2.5.4 Is the Winner’s Curse Confined to College Sophomores? One inevitable question
raised by laboratory experiments is whether the behavior reported is confined to the
typical population of convenience, undergraduate students, as opposed to “real people” in
field settings. Kagel’s (1995) survey addressed this question in two ways: First, it
reported a number of striking similarities between anomalous field data and the
experimental outcomes that could be directly attributed to the WC.57 Second, results
from a laboratory experiment comparing experienced bidders from the construction
industry with student subjects showed both suffered from a strong WC (Dyer, Kagel and
Levin, 1989). Follow up research suggested two key factors, which are not mutually
exclusive, behind the executives performance in the lab and their apparent success in the
field (Dyer and Kagel, 1996; DK): One is that the executives had learned a set of
situation-specific rules of thumb which permit them to avoid the WC in the field, but
which could not be applied in the laboratory, such as their specialized experience with a
given branch of the construction industry, or familiarity with the architect responsible for
supervising the work. Second, the bidding environment created in the experiment, which
is based on theoretical work, is not fully representative of the environment encountered in
the construction industry; e.g., repeated play elements present in the field typically permit
bidders to pull winning bids that are clearly too low relative to the expected cost of the
project, and to do so without penalty.
Harrison and List (2008; HL) report results that appear to be at odds with the
contactor results. In their experiment they compare bids by sports card dealers with non-
dealers in a laboratory type setting under the symmetric information structure employed
in KL (1986) (each bidder gets a random signal from the interval [xo – ε, xo + ε]) as well
as the asymmetric information structure employed in KL (1999) (one bidder knows the
true value, xo, with certainty while all other bidders get a signal drawn from the interval
[xo – ε, xo + ε]). Subjects bid in a single auction after having participated in at least 10
57 To be sure there are alternative explanations for the field data (see KL, 1986), but the WC is a much more straightforward explanation than the alternatives offered.
51
practice auctions, with examples run until subjects were confident with the rules of the
auction. Treatments included two different values of ε ($6 and $12) and two different
levels of competition – auctions with 4 and 7 bidders.58
Their results show that with symmetric information dealers rarely suffer from a
WC, while non-dealers do, with these differences statistically significant at conventional
levels. Further, there are significant differences in the estimated bid function between
dealers and non-dealers, with much of the difference resulting from the sharper
discounting of bids relative to value with ε = $6 for dealers.59 In contrast, in the
asymmetric information laboratory treatment HL are unable to reject a null hypothesis
that dealers in their role as outsiders bid differently from non-dealers, with dealers
suffering from a non-negligible frequency of the WC (in 25%-30% of all auctions).
HL interpret their results as follows: The absence of a WC with symmetric
information is consistent with the notion that dealers have experience in comparable
settings. Further, since this experience is generated in the field and not in the lab, it
supports the notion that “… context-specific experience does appear to carry over to
comparable settings, at least with these types of auctions.” (HL, p. 839) However, once
dealers are taken out of their comfort zone, bidding as outsiders in the asymmetric
information auctions, a role HL argue dealers rarely occupy in field settings, they look
very much like the student subjects. At a minimum HLs results provide additional
evidence for very limited learning generalizability: Dealers having adapted to adverse
selection effects in field settings with symmetric information do not recognize the
heightened adverse selection effect when an insider is present, succumbing to the WC.
This is consistent with the psychology literature on learning generalizability which
indicates that learning transfer, unless specifically taught for, does not generalize easily
58 Subjects were not provided with any starting capital balances or participation fees to cover potential losses. Rather a second experiment, not announced until the first experiment was completed, was used to insure that subjects went home with positive earnings. Given the potential impact of limited liability for losses on bids (Kagel and Levin, 1991), failure to announce in advance how potential losses would be covered is problematic at best. 59 Shaving of bids relative to signal values averaged 40% (82%) for non-dealers versus 93% (88%) for dealers with ε = $6 ($12).
52
across different domains, and the more different the domains the harder to obtain positive
learning transfer.60
Given the limited learning generalizability identified in HLs data, in conjunction
with the psychology literature on the subject and DKLs results with construction
contractors we offer the following alternative explanation of HL’s results: It may well rest
on a heuristic that travels well as HL claim, but one that is not related to the WC. Rather
it rests on a heuristic that adventitiously protects dealers from the WC in the symmetric
information case. Namely dealers are in the habit of buying low and selling high; e.g.,
List and Lucking-Reiley (2000) show that dealers bid just under $50 for cards with a
retail value of $70 in a Vickrey auction (also see GWW, 2004). Applying such large
discount factors could very well protect dealers from a winner’s curse. In contrast non-
dealers, who buy for own use, would not be in the habit of applying such a large discount
factor. We are not sure how to sort out their explanation from ours. However, we would
note that, to the extent dealers have experience with buying and selling objects with a
significant CV component (as there are established markets and prices for sports cards
and sports memorabilia) there is little scope for any kind of an adverse selection effect for
dealers, as elaborated on below.
Remark: HL also report a treatment in which subjects bid to purchase an unopened package of Leaf sports cards, packages containing 10 cards of unknown value, and an established retail price of between $9-$10. They argue that this represents a CVA, which we agree with. However, it is not one in which there is any scope for a WC since the cards have an established market value; i.e., there is no scope for an adverse selection effect based on different estimates of value that anyone but a very poorly informed buyer might have. As such, this exercise is comparable to auctioning off a $10 bill. Plots of bid distributions bear this out as there is not a single bid above $10 for dealers and only a handful of bids above $10 for non-dealers. HL also make a number of broader and related claims, at least one of which deserves further discussion. They claim that the absence of a WC among dealers in both the Leaf trading card treatment and in the more abstract laboratory treatment with symmetric information is “… consistent with the conclusion that dealers in the field do not fall prey to the winner’s curse providing tentative support for the hypothesis that naturally occurring markets are not in disequilibrium because of the WC” (HL, p. 823-24, italics in the original). Here, we would remind the reader that the term “winner’s curse” was initially coined by three petroleum geologists (Capen, Clapp and Campbell, 60 For a good primer from the psychology literature on learning generalizability see Salomon and Perkins (1989). Or as the Noble laureate Richard Feynman (2005, p. 39) put it: “I don't know what's the matter with people: they don't learn by understanding; they learn by some other way - by rote, or something. Their knowledge is so fragile.”
53
1971) reporting on results from early outer continental shelf (OCS) oil lease auctions in an effort to explain low (or below normal) returns on these leases. The debate that this assertion set off for OCS leases, as well as similar claims in other settings, is what originally motivated experimental work investigating the WC.61 The fact that these experiments showed that the WC is alive and well, persistent and robust, indicate that it is likely to exist at least in the start up phase of auction markets with a strong CV element. Finally, let us assume, that HL are correct that in relatively settled markets with very experienced bidders survivors no longer fall prey to the WC. To us this is similar to arguing that in a population ravaged by an infectious disease the disease no longer exists since the survivors have developed immunity to it. This does not, however, imply that should a significant variation of the disease strike the surviving population that they will be able to do any better than the original population. The auction analogy is that market participants who no longer show symptoms of a WC will not necessarily exhibit equilibrium responses to significant changes in the environment, such as increased numbers of rivals, the introduction of an insider with better information about the common value, or an almost CV element. III. Multi-Unit Demand Auctions
Theoretical and experimental research up to 1995 focused almost entirely on
auctions where each bidder demands a single unit of a homogenous commodity. Not
much changes in the theory if there are multiple units for sale as long as individual
bidders continue to demand a single unit. However, in auctions where bidders demand
multiple units, outcomes can change rather dramatically. The FCC air wave right
(spectrum) auctions in the 90’s provided the main incentive to better understand auctions
where bidders demand multiple units, raising a host of new issues, many of which are of
public policy importance. (The extensive use of Internet auctions also has played a major
role in stimulating auction research; see Section 4.3 below.) Where and how can one
design efficient multi-unit demand auctions? Are efficient multi-unit demand auctions
very different from optimal (revenue maximizing) auctions? Multi-unit demand auctions
also call attention to a much richer strategic environment where bidders may exercise
demand reduction, bidding “passively” on some units in order to obtain other units at low
prices. They also call attention to the difficult case of complements, with strong
synergies generated as a consequence of winning multiple units, and the potential role of
package bidding to help achieve more efficient outcomes.
61 For example, auctions for book publication rights (Dessauer, 1981), professional baseball's free agency market (Cassing and Douglas, 1980; Blecherman and Camerer, 1998), corporate takeover battles (Roll, 1986), and real estate auctions (Ashenfelter and Genesove, 1992).
54
In looking at multi-unit demand auctions we need to distinguish between small
scale, traditional laboratory experiments designed to investigate some of the new
theoretical/behavioral issues identified in the literature as opposed to market design
issues. In the latter the laboratory serves as a “wind tunnel” for comparing different
mechanisms for specific public policy purposes. There are limited numbers of
comparable market design experiments against which to evaluate results (and often not
much emphasis on the behavioral mechanisms behind the results reported). We will
review the more traditional small scale experiments that focus on behavioral issues, with
market design issues covered in Roth (Chapter xx, this volume).
3.1 Auctions with Homogeneous Goods - Uniform-Price and Vickrey Auctions
In multiple-unit, uniform-price (UP) auctions items are allocated to the high
bidders at a price equal to the highest rejected bid. With bidders demanding multiple
units, if the goods are substitutes, bidders have an incentive to reduce demand in an effort
to obtain more favorable prices on the items actually won (Ausubel and Cramton, 1996;
Engelbrecht-Wiggans and Kahn, 1998). The argument for demand reduction is
essentially the same as a monopsonist who takes account of the fact that with increased
demand, the price they pay will increase as well. Cramton (1997) argues that the first
nationwide FCC spectrum auctions could be best modeled as UP auctions of this sort.
Kagel and Levin (2001; KL, 2001) experimentally investigate the sensitivity of
bidders to these demand reduction possibilities, comparing behavior under a sealed-bid
uniform-price (SBUP) auction with an English clock auction in which bidders receive
information regarding rivals’ drop-out prices as the auction progresses. They study
behavior in the simplest possible setting while still preserving the essential strategic
elements of more complicated auctions: A human subject with flat demand for two units
of a homogeneous commodity competes against different numbers of rivals demanding a
single unit of the commodity, with the role of single unit buyers played by computers
whose bids are equal to their private value (the dominant strategy).
With IPV draws from a uniform distribution, and supply of two units, the
equilibrium prediction for the “large” (human) bidder is to bid her value on unit 1 and to
55
bid sufficiently low on unit 2 so as to not affect the market price.62 This holds
irrespective of the value of the item, the number of computer rivals, or whether a SB or
English auction format is used. For the SB auctions this requires bidding zero on the
second unit, which is far from transparent. In contrast, the optimal bidding strategy in the
clock auctions requires dropping out on the second unit at a price p ∈ [0, v2] where v2 is
the drop-out price of the second highest computer rival. This has exactly the same
consequences as dropping out at 0, but the feedback information provided by rivals
dropping out, and the flexibility in the dropping rule, makes the optimal bidding strategy
substantially more transparent.63
Results from this experiment showed clear evidence of demand reduction in the
UP auctions, but with substantially more demand reduction in the English auctions:
30.8% of all unit 2 bids were pivotal (higher than v2, thereby setting the market price) in
the sealed-bid auctions compared to 11.4% in the clock auctions.64 However, there were
even more striking differences between the two auction formats as: (i) There was a much
higher frequency of bidding above value on the first (and even the second) unit in the SB
auctions (comparable to the results for SPSB auctions) and (ii) there were relatively few
bids at 0 in the SB auctions, required to insure not being pivotal. Figures 7 and 8
illustrate these differences between the two UP formats with five computer rivals.
[Insert Figs 7 and 8 here]
KL show that the primary basis for the superior performance of the clock auction
over the SB version results from the feedback information regarding the computer’s drop
62 With bidders having the same value for two units we refer to the higher bid as the bid on unit 1 and the lower bid to the bid on unit 2. 63 For example, assume a support for values of between [0, 100] with the values for both units for the human bidder, vh, of 90. Suppose that h has no formal understanding of the optimal bidding strategy and decides to remain active as long as p ≤ vh. Suppose that v2 drops out at 50. Now h has two options, drop at 50 and earn an instant profit of 40 or remain active in an effort to win both units. In the latter case there are two events to consider (i) the highest computer rival (v1) drops prior to p = vh in which case h’s expected profit is 40 (as 70 is the expected drop price for v1) or (ii) v1 ≥ vh ≥ 90 in which case h’s expected profit is zero. Thus, dropping at p = v2 dominates waiting and trying to win two units. This is not to say that these calculations are trivial but they are far more transparent than the ex ante calculations underlying the optimal bidding strategy in the SB auctions. Further, if h remains active once p > v2 it should be increasingly transparent that she is competing against herself, which should lead to dropping out before the price is equal to vh, which might help promote learning over time. 64 Results are pooled over auctions with 3 and 5 computer rivals. All data are for the last 12 auctions in a session. Subjects were never told that the computers were following a dominant strategy, just that they would drop out at their randomly drawn values.
56
out prices. They did this in two ways. First, they conducted a clock version of the
auction in which there was no feedback, with the auction ending when the last bidder
dropped out. In this case the clock was of no help to bidders as there was massive
overbidding on both units, quite similar to what was found in the SB auctions. They also
conducted a UPSB auction in which v2 was posted in a prominent place on bidders’
computer screens. Subjects were not told how to use the information, just what it was
and that it had been suggested that the information might prove helpful in determining
how to bid. This treatment went a long way to moving the SB outcomes closer to the
clock results as (i) it essentially eliminated the overbidding on unit 1 and (ii) resulted in a
level of demand reduction closer to the one reported for the clock auctions.
KL also compared outcomes in the uniform-price auctions to a dynamic
Vickrey/Ausubel auction (Ausubel, 2004). This dynamic version of the Vickrey auction
with drop-out information provided employs a “clinching” metaphor from sports leagues
to characterize prices paid.65 It generates sincere (value) bidding in iterated deletion of
dominated strategies and, under KL’s demand structure, raises more revenue than the UP
auctions. Results from the Ausubel auctions are shown in Figure 9, where outcomes are
reasonably close to sincere bidding.
[Insert Figure 9 here]
Using bidders’ actual earnings relative to predicted earnings as a measure of how
close bidders were to optimal outcomes, KL establish a clear ranking for the three auction
institutions studied: the UPSB auctions are furthest from the maximum predicted (only
13.6% of all subjects averaging within 5% of maximum possible profits), the UP clock
auction with feedback is next (46.5% of all subjects averaging within 5% of maximum
possible profits), with the Ausubel auction closest to the maximum (85.2% of all subjects
averaging within 5% of maximum possible profits).66 KL conclude that like the UP
65 Clinching works as follows: With 2 objects for sale, suppose at a given price, p, the human bidder (h) still demands two units, but the aggregate demand of all other bidders has dropped from 2 to1. Then, in the language of team sports, bidder h has clinched a unit no matter how the auction proceeds. As such, at that moment, h is awarded one unit at the clinching price, p. The auction continues with the supply reduced from 2 to 1 and h’s demand reduced to one unit. This process repeats itself until all units are allocated. In this way the auction sequentially implements the Vickrey rule that each bidder pays the amount of the kth highest rejected bid, other than his own, for the ktht unit won. 66Given the use of computer rivals, actual profit relative to predicted profit provides a suitable metric for comparing outcomes across institutions. Z statistics using individual subjects as the unit of observation show all three of these differences to be statistically significant at better than the 1% level.
57
clock auction with feedback, the Ausubel auction benefits from the clock procedure with
feedback to prevent overbidding. However, unlike the uniform price clock auction, the
Ausubel auction encourages non-strategic bidding (full demand revelation), something
that bidders are inclined to do even in the uniform-price auctions. Thus, the closer to
optimal performance observed in the Ausubel auction partly results from an institution
that accommodates itself to bidders’ natural tendencies, rather than any adjustments on
bidders’ part to the strategic requirements of the institution.
Remark: KL’s UPSB auction included explicit advice against subjects bidding above their values, along with examples as to how this could lead to losses. The motivation for this was to speed up equilibrium outcomes on unit 1 bids, a “nuisance” factor in terms of KL’s primary interest in demand reduction on unit 2 bids. Referees criticized these procedures as biasing the SB auctions too strongly in favor of equilibrium outcomes, in response to which additional sessions were run dropping the advice. As anticipated the primary impact was to reduce the frequency of unit 1 bids above value, with essentially no impact on the overall frequency of demand reduction. The point of this remark is that by the turn of the century with experiments firmly entrenched in the economist’s tool kit, and behavioral economics making its way onto the stage, referees and editors of a major journal were concerned with biasing procedures in favor of the theory. From our personal experience this reflects a significant (and welcome) shift from earlier referees (and journal) biases in favor of experimental outcomes supporting a theory, with little regard, in some cases, to procedures that favored the theory.
There have been a number of subsequent experiments using all human bidders
investigating demand reduction in UP auctions. List and Lucking-Reiley (2000; LLR)
look at demand reduction in a field experiment with subjects bidding for sports cards in a
UPSB auction. Each auction had two subjects bidding for two identical units with supply
of two units (subjects participated in a single auction). Since LLR do not know bidders’
value for the sports cards, they employed a parallel series of SB Vickrey auctions (in
which sincere bidding is a dominant strategy) as the reference point against which to
evaluate demand reduction in the UP auctions. Their design also has an equilibrium in
which subjects bid their value on both units (Ausubel and Cramton, 1996), but argue
against this equilibrium on the grounds that it is a knife edge case, so that any small
reduction in value for the second unit, which is likely to be present, would eliminate it.
58
They employed two types of sports cards – one with low ($3) and one with high ($70)
book value – and conducted separate auctions for dealers and non-dealers.
LLR find that unit 2 bids are systematically lower in the UP compared to the
Vickrey auctions, with these differences statistically significant for the high valued cards
for both dealers and non-dealers: $41.77 versus $30.60 for dealers, $28.82 versus $16.62
for non-dealers. They also found that unit 1 bids were consistently higher in the UP
auctions, with these differences statistically significant for the higher valued sports cards.
This stands in marked contrast to the sincere bidding predicted for unit 1bids in both
cases.
Porter and Vragov (2006) replicate the LLR experiment, only with induced values
and adding a UP clock auction to the mix. Sessions consisted of 30 auctions, with new
randomly drawn valuations and auction partners in each auction. There is supply of two
units with two bidders each demanding two units, sometimes with different values,
sometimes with the same values. In the latter case they have the same multiple
(symmetric) Nash equilibrium problem as LLR.
Their results largely replicate those reported so far. First, for the UPSB auctions
there is rather massive overbidding with respect to unit 1 bids and relatively large scale
demand reduction with respect to unit 2 bids (see Figure 10). For the clock auctions unit
2 prices are close to their starting price and well below prices in the sealed-bid auctions,
consistent with strong demand reduction. Their SB Vickrey auctions exhibited substantial
bidding above value for both units (see Figure 11), consistent with the results reported for
SPSB auctions.
[Insert Figures 10 and 11 here]
Engelmann and Grimm (2009) (EG) also investigate bidding for two homogenous
items in auctions with two bidders each with flat demand for both units. They look at
demand reduction in both UP clock and SB auctions, and compare outcomes with a
dynamic Vickrey (Ausubel) auction and a static Vickrey auction.67 Their experimental
design is hampered by the fact that subject pairings remain fixed over the full set of 10 67 EG also report on discriminatory auctions with this design. One of their most interesting results in this case involves submitting different bids on the two items (bid spreading), where bidders should submit equal bids for both items. In this case, 58% of unit 2 bids are below the RNNE without any discernable time trend, which is inconsistent with risk aversion (Grimm and Englemann, 2005). Kagel and Levin (2005) also report bid spreading where it should not occur in multi-unit demand auctions with synergies.
59
auctions in each treatment, which leads to scattered efforts to promote collusive
outcomes. However, after factoring out these collusive efforts, their primary results are
well in line with those reported in KL: (1) there is more demand reduction in the UP
clock auctions than in the UPSB auctions, (2) there is close to sincere bidding in the
Ausubel auction, and (3) there is a higher frequency of bidding above value on unit 1 bids
in the UPSB auction than in the UP clock auction or the Ausubel auction. Based on this
last result, they note that contrary to the theory, the UPSB auction generates higher
revenue but lower efficiency than the Ausubel auction, so that there might be a tradeoff
between these competing objectives for a government seller, a point that KL (2001) noted
as well. Like LLR they find more overbidding on unit 1 in the UPSB auctions than in the
static Vickrey auction. The one inconsistency with earlier results is that they find
surprisingly little learning within and across auction formats, in contrast to the modest
learning reported in KL.
Remark: The one anomalous finding in these experiments is that unit 1 bids in the UPSB auctions exceed those in the SB Vickrey auction. Levin (2005) argues that with two bidders each demanding two units with supply of two units there is a very appealing low revenue (implicitly collusive) Nash equilibrium that is also an ex-post equilibrium in which both bidders bid above their private value on unit 1 and zero on their unit 2 bids. Although bidding above value on unit 1 involves a weakly dominated strategy, this alternative equilibrium is attractive on a number of grounds: 1. It is an ex-post equilibrium so it is distribution free; 2. The equilibrium has no-regret, so there is less incentive to correct actions than the one focused on in the papers employing this design; 3. It allows a wide range of bidding (any high bid on the first unit will work) so it is easier to coordinate on; 4. It has a more equitable distribution of payoffs which is favorable to maintaining collusion. Engelbrecht-Wiggans, List and Reiley (2005; EWLR), in their response to Levin’s comment, argue that (i) the data in LLR are inconsistent with the beliefs underlying this alternative equilibrium, as it depends on both agents bidding zero on unit 2, while nearly three-fourths of all unit 2 bids were strictly positive in their experiment68, and (ii) there is a similar equilibrium in weakly dominated strategies for their SB Vickrey auctions resulting in incentives to bid above value there as well. The alternative equilibrium identified in Levin (2005) collapses once there are three or more bidders (with two units supplied) and/or with a positive reserve price. EWLR (2006) report an experiment of this sort with three or five bidders, the results of which show that unit 1 bids in the UP auction are statistically indistinguishable from the Vickrey auction.
68 However, bidding zero on unit 2 is also possible in LLR’s equilibrium since the underlying distribution of values is unknown and bidding errors can, at least partially, account for positive bids on unit 2, since deviations from Levin’s proposed equilibrium can only be positive.
60
Summing Up: UPSB and clock auctions with homogenous goods generate demand
reduction as the theory predicts. But there is substantially more demand reduction and
closer to equilibrium bidding in clock auctions. The key mechanism behind this
difference appears to be the feedback provided by other bidders’ drop-out prices in the
clock auction (KL, 2001). Ausubel’s version of the dynamic Vickrey auction eliminates
much of this demand reduction, with close to equilibrium outcomes (sincere bidding) as
well. The SB Vickrey auction generates overbidding relative to induced values, as do
unit 1 bids in the UPSB auctions, consistent with the results typically reported for SPSB
auctions. All of these results hold up both with simulated (computer) bidders and with all
human bidders. More generally, these results support the notion that bidding is closer to
equilibrium predictions in dynamic auctions with feedback as opposed to SB versions of
the same auction mechanism.
3.2 More on Multi-Unit Demand Vickrey Auctions
The 1995 survey summarized research showing that sincere bidding emerges
quickly for most bidders in single-unit English clock auctions in contrast to the persistent
overbidding in SPSB auctions. In auctions where bidders demand a single unit, the clock
auction and SPSB auctions are strategically equivalent, with both yielding sincere
bidding in weakly dominated strategies. In multi-unit demand auctions where bidders
have weakly diminishing marginal valuations, the SB Vickrey auction and the dynamic
Ausubel auction with drop-out prices reported are no longer strategically equivalent.
Rather the SB Vickrey auction generates sincere bidding in weakly dominated strategies
whereas the Ausubel auction requires iterated deletion of dominated strategies, a weaker
solution concept.69 Nevertheless, the research summarized in this section shows that the
Ausubel auction with drop-out information generates outcomes much closer to sincere
bidding than either the SB Vickrey auction or an Ausubel auction with no drop-out
information provided (the latter is strategically equivalent to the SB Vickrey auction).
While this may not be surprising from a behavioral perspective, it is surprising from a
mechanism design perspective which typically calls for employing a mechanism with the
69 While the first solution requires agents’ rationality alone the later must add the requirement of common-knowledge of rationality, a far from trivial addition. Thus, the first solution concept is much more robust and desirable from a mechanism design standpoint.
61
strongest possible solution concept. This suggests a possible tradeoff between the
simplicity and transparency of a mechanism and the strength of its solution concept when
agents are not fully rational or are still learning. This has important implications for the
market design literature. In addition to summarizing these results, we report results from
studies that have looked at generalized versions of the SB Vickrey auction suitable for
dealing with synergies between items.
Kagel, Kinross and Levin (2001; KKL) investigate different versions of the
Vickrey auction in which a human bidder with flat demand for two units competes
against computer rivals each demanding a single unit. They compared outcomes in a SB
Vickrey auction with bidding in the dynamic Vickrey/Ausubel auction with drop-out
information provided (hereafter referred to as the Ausubel auction). As anticipated, in the
static Vickrey auction there was a high frequency of bidding above value for both units,
with bidding above value on unit 1 more severe than unit 2. Comparing these results
with those for the Ausubel auction, it’s clear that the Ausubel auction comes closer to
sincere bidding than the Vickrey auction, resulting in significant improvements in
efficiency (but lower revenue) than in SB Vickrey auctions than in the Ausubel auction.70
One weakness with the KKL experiment is that with computers bidding their
value, it only takes a single round of deletion of dominated strategies by the human
bidder to achieve sincere bidding. With all human bidders it requires several more
rounds of deletion of dominated strategies to arrive at sincere bidding. As such it is quite
natural to ask whether the results with computerized rivals will extend to auction
environment with all human bidders. Kagel and Levin (2009) address this question,
looking at all three auction formats with four (human) bidders, each demanding two units
and with supply of 2 or 3 units. Bidders’ valuations were iid from a common uniform
distribution. The results essentially replicate those reported in KKL as (i) there is
substantially more sincere bidding in the Ausubel auction than in the other two auction
formats and (ii) there is massive overbidding relative to valuations in the SB Vickrey
auctions resulting in a relatively high frequency of negative profits conditional on
winning. Finally, note that it is the ascending prices in the Ausubel auction in
70 Average efficiencies were 97.5% and 97.9% in the sealed-bid auctions with three and five computer rivals, compared to 99.1% and 99.3% in the Ausubel auctions. Although these differences are small, they are statistically significant in both cases.
62
conjunction with the provision of dropout information that underlies both the greater
transparency of the auction rules and the weakening of the solution concept.71
Manelli, Sefton, and Wilner (2006) compare a SB Vickrey auction with the
Ausubel auction for the private values case, reporting overbidding in the Vickrey auction
and closer to sincere bidding in the Ausubel auctions.72 EG also compare the SB Vickrey
auction with the Ausubel auction, reporting little difference between the two auction
formats, including rather limited bidding above value on unit 1 bids in the SB auctions.
The latter is at odds with results reported for the other multi-unit SB Vickrey auctions
reported in this section, as well as Porter and Vragov’s (2006) results reported in the
previous section. The best explanation we have to offer for this difference is sampling
variability or subject pool effects, as EG’s experiment involved Swiss and German
university students whereas the other studies reported on this issue involved U. S.
university students.73
In concluding this section, we briefly review results from studies looking at
generalized versions of the SB Vickrey auction with complementarities between items,
the Vickrey-Clarke-Groves (VCG) mechanism (Vickrey, 1961, Clarke, 1971, and
Groves, 1973). These are package auctions that permit XOR bids, with bidders bidding
for as many packages as they wish, but only winning on one of their bids; e.g., in the
simple case of two items, A and B, with values VA, VB and VAB (where VAB is the value
of getting both A and B with VAB > (VA+ VB)) with XOR bids agents are permitted to bid
for A alone, for B alone, and for the package containing both A and B, but can win only
one of the packages bid on. The VCG mechanism is designed to produce sincere bidding
and maximum efficiency, using suitably generalized Vickrey pricing rules to allocate
items. There are a number of technical issues associated with implementing the VCG
71 The drop-out information enriches the strategy space relative to the SB Vickrey auction by allowing bidders to have strategies that are contingent upon other players’ drop-out prices. This enrichment also opens the door to different kinds of “misbehavior.” 72 The primary focus of this paper is on comparing the advantages of the Ausubel auction to the static Vickrey auction in the presence of a significant common-value component. 73 A closely related experiment that deserves mention here is Kagel, Pevnitskaya, and Ye (2007) who compare the Ausubel auction to the strategically equivalent survivor auction in which the Ausubel auction is essentially implemented through a series of SB auctions. In spite of the similarity in structure and information feedback between the two auction formats, the Ausubel auction achieves significantly higher levels of sincere bidding and efficiency than the survivor auction to begin with, so that only with experience does the survivor auction comes close to the performance of the Ausubel auction.
63
mechanism, as well as potential tradeoffs between efficiency and seller revenue that are
of concern in using it, discussion of which goes well beyond the scope of the present
review (see Ausubel and Milgrom 2006). Rather, our primary interest is to report the
results of an experiment applying the SB version of the VCG mechanism.
The experiment with the most complicated demand structure investigating the SB
VCG mechanism is Chen and Takeuchi (2010) (CT). In each auction bidders compete
for four items, resulting in a total of 15 possible packages to bid on. Human subjects
compete against two computer bidders who bid sincerely in one treatment and randomly
in another, under two different information conditions - with and without information on
how the computers were bidding. Sincere bidding is a weakly dominant strategy
regardless of what the computers do or the information provided about their bidding
strategy. Subjects participated in 10 auctions under each treatment condition.74 The
auction interface automatically computed the value of each of the 15 possible packages
so that bidding on all packages was relatively easy.
Optimal bidding in this case requires subjects to bid their value on all 15
packages. Subjects consistently failed to do so, with the average frequency of bidding on
possible packages going from a low of 65%-66% for single item packages to a high of
83%-86% for combinations of items (83% for the package with all four items). This
confirms one of the potential concerns with the VCG mechanism (and package bidding
mechanisms in general), the complexity associated with formulating bids for all possible
packages of interest. Conditional on making a bid, subjects generally underbid with 57%
classified as under-bidders, 32% as sincere bidders, and 12% over-bidders. Losing
bidders were significantly more likely to increase the number of packages they bid on as
well as their bid to value ratio in the next auction, with winning bidders decreasing their
bid to value ratio (albeit, to a smaller degree than losing bidders). These bid changes
indicate that the dominant strategy is not transparent, with subjects adjusting their
behavior according to a trial and error learning process.75
74 CT also compared the static VCG mechanism to an ascending price (iBEA) mechanism. 75 Isaac and James (2000b) and Morgan (2002) study a SB VCG auction with two items and synergies, involving only three possible packages to bid on. Subjects bid on almost all possible packages in both studies.
64
Remark: The studies reported here have been concerned with behavioral issues within a market design context. In a market design experiment it is perfectly reasonable for the instructions and working examples to point out the benefits of different bidding strategies in describing how the underlying mechanism works, and what it’s supposed to do, and should be considered part of the mechanism. Whether or not this would completely clear up the problems with the SB Vickrey mechanism identified here is problematic as (1) KL (2001) report substantial bidding above value on unit 1 in UPSB auctions with instructions intended to dissuade subjects from doing so and (2) Kagel, Lien, and Milgrom (2010) (reported on in section 3.3) show that subjects bid on only a small percentage of profitable packages early on even though they were informed of the benefits of doing so. The key point here is that one part of market design is to identify mechanisms that are aligned closely with agents’ natural tendencies in order to come closer to achieving a desired outcome.
3.3 Auctions with Synergies
Most of the work in this area has been concerned with market design issues,
particularly with respect to those raised in the FCC spectrum auctions. Here we cover
several small-scale experiments concerned with underlying behavioral issues in the
presence of synergies.
Kagel and Levin (2005; KL, 2005) look at a simple model of auctions with
synergies comparing UP clock auctions to SB auctions. Their experimental design is
similar to KL (2001) for the case of substitute goods - humans demanding two units of a
commodity compete against computer rivals each demanding a single (and bidding their
value – the dominant strategy for single-unit buyers). The standalone values for h, the
human bidder, are the same (vh), but winning both units generates synergies equal 3vh.
The UP auction creates incentives for demand reduction for the “large” bidder similar to
those discussed in section 3.1. However, there is an opposing incentive to bid
aggressively to capture the synergy bonus, which becomes stronger at higher valuations.
The net effect of these two competing forces is as follows: (1) at lower valuations, the
demand reduction force dominates so that h bids zero on unit 2 (drastic demand
reduction), (2) at the highest valuations the synergy force dominates so that h “goes for
it,” bidding high enough to insure winning both units, and (3) at middle valuations the
two forces are at peak tension, with h bidding above the stand-alone value of both units
(but short of “going for it”) in the SB auction and “going for it,” conditional on rivals’
observed drop-out prices, in the clock auction. In both cases h faces an exposure problem
65
for these middle valuations; the possibility of winning a single unit at a price above its
standalone value and earning negative profits. Depending on the size of the potential
loss, and risk preferences, bidders may refrain from suitably aggressive bidding, resulting
in inefficient outcomes and relatively low revenue.
KL look at bidding in auctions with three and five compute rivals. Given the
complexity of the auction environment, they employed a limited number of values for the
human bidder designed to span the strategy space and to induce maximum differences in
behavior between the SB and clock auctions, while providing bidders with considerable
experience at each value.76 The lowest vh, $3.00, calls for complete demand reduction in
both SB and clock auctions. The highest vh, $5.10, requires “going for it,” and insures a
secure (minimum) profit in each auction. The two middle values make different
predictions between SB and clock auctions: With vh = $4.00, in the SB auction h should
bid the same on both units at prices modestly above their standalone values. The clock
auction also requires bidding above value on both units, but with a cutoff value v2 ≤ P*>
vh (where v2 is the second-highest computer value), in which h goes for it, winning both
units with positive expected profit; otherwise h drops out on both units at the cutoff point
P*. At the other middle value, vh = $4.40, h “goes for it” (b1 = b2 ≥ $7.50) in the SB
auctions, regardless of the number of computer rivals. In the clock auction h continues to
employ a cutoff strategy but with a higher cutoff value.
Bidding is substantially closer to optimal play in the clock auctions (see Table 5),
consistent with the evidence from virtually all other auction environments. Further, in
most cases bidders behave sensibly, though not optimally: The highest valuation, where
optimal play is relatively transparent, generates the highest level of optimal play,
comparable to the levels reported in any experimental auction environment. Estimated
demand functions for the SB auctions are monotonically increasing in bidders’
valuations. And in the clock auctions, there is a higher frequency of “going for it” at the
two middle valuations when the optimal play requires it than at the lowest valuation,
where demand reduction should occur.
[Insert Table 5 here]
76 Since single-unit bidders have a dominant strategy independent of h’s valuation, KL could employ a limited number of values for h without distorting equilibrium predictions.
66
Nevertheless, there is much out-of-equilibrium play in both the SB and clock
auctions, with the most interesting and dramatic differences for the two middle valuations
with its exposure problem. In the clock auctions the primary deviation from optimal play
consists of demand reduction as opposed to “going for it” as the theory predicts. In
contrast, in the SB auctions bidders consistently bid above value on both units (often well
above what they should bid and with different bids on each item). This suggests that the
clock auction makes it much more transparent to bidders that they are liable to lose
money as a consequence of bidding above value. While this clearly helps to generate
close to equilibrium play in single unit demand auctions, in the present case it may hold
bidders back from achieving maximum profit, generating deviations from the equilibrium
outcome.
Absent the possibility of package bids, multi-unit demand bidders with synergies
face an exposure problem. For single-unit demand bidders to win against a multi-unit
demand bidder, the sum of what they are willing to pay must beat the larger player’s bid,
so that smaller bidders must coordinate their bids to reach the threshold needed to beat
the multi-unit demand bidder. However, each small bidder has an incentive to let the
other one bid more aggressively in order to the item at the lowest possible costs. This is
referred to as the threshold problem. There is no threshold problem in UP auctions for
single-unit demand bidders since under the UP rule no small bidder can obtain a unit at a
lower price than the other small bidder. However small bidders face a threshold problem
in discriminatory (pay what you bid) auctions. All of this extends to cases where
“regional” bidders with synergies, but more limited (non-overlapping) market areas (e.g.,
the North and the South), compete against a larger global bidder who has positive
demand and synergies over the entire market area.
Chernomaz and Levin (2012; CL) investigate bidding in a highly stylized version
of just such an environment. They look at a FPSB auction with and without package
bidding. Despite the general preference for iterative auctions, FPSB auctions have been
used in a number of cases (Cantillon and Pesendorfer 2007, Epstein et al. 2002), having
several attractive features such as their resistance to collusive behavior. They consider
two regional bidders each demanding a single item competing against a global bidder
with flat demand for two items. They employ a two-by-two experimental design, varying
67
the auction rules (with and without package bidding) and the synergy level (0% and
50%). The two local bidders are restricted to having the same value for their respective
items (based on a single random draw), which under the symmetric RNNE should result
in the same bids. The global bidders value for winning a single unit is sg, drawn from the
same distribution, with the value for winning both units vg = 2βsg, where β represents the
synergy value. This highly structured environment permits solving analytically for
equilibrium outcomes.77 Among other things, with single-item bidders having the same
valuations, under the RNNE there is no exposure problem for the global bidder as he
either wins both items or loses both. But local bidders still faces a threshold problem
with package bidding which, somewhat surprisingly, is present even with no synergies, as
absent the ability to coordinate their bids, the marginal benefit to single-unit bidders for
raising their bids is lower than without package bids. This, in turn induces the global
bidder to bid less, which in turn adversely impacts revenue and efficiency. The threshold
problem is so strong in this model that sellers using package auction are predicted to raise
substantially less revenue than selling the items separately under the two synergy levels
studied.
Changes in revenue are qualitatively consistent with the model as less aggressive
bidding with package bidding has a substantial negative effect on revenue. This is
primarily driven by the strong response of single item bidders to the threshold problem,
which is much more severe in FPSB auctions given their limited ability to coordinate bids
(compared to an ascending price auction), which induces the global bidder to bid less as
well. This, in conjunction with the negligible positive effect of package bids on
efficiency when synergies are present, lead CL to sound a cautionary note regarding the
efficacy of FPSB auctions in environments such as this.
Katok and Roth (2004) also look at auctions with synergies comparing a
descending price (Dutch) auction with an ascending, UP auction. Each auction has three
bidders with supply of two homogenous units; one “big” bidder who has a high value for
both items and two small bidders who each want one unit. The Dutch auction is, in
effect, a package auction since the winner gets to choose how many units to purchase,
thereby mitigating the exposure problem (which is very much present in their UP
77 CL require the global bidder to place the same bid on both items in the absence of package bids.
68
auctions). As already noted, the UP auction mitigates the threshold problem since under
the UP rule no small bidder can obtain a unit at a lower price than the other small bidder.
Summary: To date there have been very limited small-scale experimental studies
focusing on multi-unit demand auctions with synergies. The results of the experiments
reported here confirm the existence of an exposure problem in the presences of synergies
which results in less aggressive bidding, with smaller than predicted synergies realized.
The introduction of package bidding in CLs SB auctions introduces significant threshold
problems for local bidders. Results from the few VCG package auction experiments
reported at the end of the previous section suggest that this is not a viable alternative to
dealing with multi-unit demand auctions with synergies, as the frequency of sincere
bidding is relatively low and subjects only bid on a small percentage of the packages
available (even in auctions with very few items), both of which can severely compromise
the promised efficiency gains. Further, the VCG mechanism can result in very low
revenues as well, which are politically unacceptable.
Kagel, Lien and Milgrom (2010, 2014; KLM) report results comparing a
combinatorial clock auction (CCA) mechanism which permits package bidding with a
simultaneous ascending clock auction (SAA) mechanism. They have two regional
bidders (demanding multiple units with synergies) competing against a global bidder with
demand for all items (with synergies over all items). What is relevant here is: (1) KLM
identify a clear threshold problem in some of the CCA auctions. However, the magnitude
of the effect was relatively small, and in some cases was mitigated by local bidders
bidding on packages including items which had zero own value (but positive value to the
other local bidder). While rarely getting caught holding any zero value items, this forces
other local bidders to increase their bid if they hope to win any items (KLM, 2014). (2)
Similar to the results reported in CT for the VGM mechanism with package bidding,
subjects bid on only a tiny fraction of the packages available to them even though they
were explicitly encouraged to do so and had a computer interface that made placing bids
very easy. This package selection problem also underlies inefficiencies in package
auctions as bidders tend to bid on their most profitable packages as well as their “named”
packages (i.e., for regional bidders all the items they have positive value for and for the
global bidder all items), as the named packages are typically quite profitable. This
69
generates high revenue and efficiency as long as the “named” packages constitute the
efficient outcome (i.e., either of the two regional bidders getting all their named items or
the global bidder getting all items). However, in cases where the efficient outcome
requires that all bidders obtain one or more items, or the items be split between a regional
bidder and the global bidder, there are marked reductions in efficiency under the CCA
(and relative to the SAA). What drives this last result is that when the named package is
no longer the most profitable package, the amount bid on the named package must be
greater than the bid on the most profitable package (since the latter contains fewer items).
This, in conjunction with the CCA auction assigning packages to maximize seller
revenue means that, other things equal, the CCA algorithm would pick a bidder’s named
package over the bidder’s most profitable package, which reduces efficiency when the
named package no longer coincide with the bidders most profitable package. Similar
package selection problems can be found other multi-unit demand auctions with strong
synergies (Brunner et al., 2010, Goeree and Holt, 2010, and Scheffel et al. (2012)).
3.4 Sequential Auctions
Robert and Montmarquette (1999; RM) study sequential auctions in which each
of eight bidders have positive demand for mi units, where mi is iid from a Poisson
distribution with a maximum mi of 15, and with a total supply of 15 units in each auction.
Once mi is determined, the value for each of the mi units is iid from a uniform distribution
on [0, 100], and ranked in decreasing order for a downward sloping demand curve for
each bidder. RM compare bidding in three types of sequential auctions: Dutch
(descending-price), English (ascending-price) and mixed Dutch and English. A round of
Dutch auctions was conducted as follows. The first unit was offered at the highest
possible price of 100 with the price lowered by one ECU every two seconds until a unit
was purchased. The second unit was then offered at an initial selling price of 5 ECUs
above the winning price for the first item, with this process repeated until all 15 units
were sold. Bidders knew when a unit was purchased and the price at which it was
purchased. English auctions followed similar rules with starting prices 5 ECUs below the
winning price for the previous unit. In the Dutch-English auctions the first unit was sold
following Dutch auction rules, with the second unit sold using English auction rules, with
this process repeated until all units were sold.
70
RM characterize the properties of a symmetric RNNE yielding an efficient
allocation for each of the three auctions as a reference point against which to evaluate
bids. Unfortunately, there is no assurance that the equilibrium identified is unique.
However, their model does demonstrate that there are sufficiently rich strategies to
induce an efficient allocation in these complicated, multi-unit sequential auctions, with
the equilibrium outcomes generating the same expected revenue (assuming risk-neutral
bidders) across the three auction formats. In addition, the model offers sharp predictions
about bidding: In each auction, the winner is the individual with the highest (re-indexed)
valuation for the unit supplied in that stage, with the price paid for each unit higher
(relative to its value) as fewer items remain to be sold. Finally, the theoretical model
predicts increasing prices.
Efficiency is measured in the usual way as the sum of the valuations of the 15
units allocated divided by the sum of the 15 highest valuations. Losses, relative to full
efficiency, averaged 0.84%, 0.94% and 0.45% for the Dutch, English and mixed auctions
respectively. This compares to average efficiency losses of 14.3% in each auction under
completely random bidding and 2.3% for budget constrained random bidders (whose bids
are restricted to be between 0 and their valuation), suggesting that bidders were at least in
part following the equilibrium bidding strategy. All three auction types had decreasing
average prices in contrast to the increasing average prices the model predicts. Using
simulations based on structurally estimated bid functions, RM note that at the start of
each auction the standard deviation associated with the distribution of winning bids is
quite large, which initiates a bias pushing winning bids higher than predicted at the
beginning of an auction sequence, forcing adjustments later on that are responsible for the
declining prices. They suggest that this is the result of the complexity associated with
bidding on early units with so many units available to bid on. Their auction is, no doubt,
quite complex.
Brosig and Reiß (2007; BR) look at the effects of capacity constraints on bidding
in sequential auctions.78 They argue that although many real life auctions run
independently of each other, from the point of view of bidders, they form sequences of
78 Pitchik and Schotter (1988) have an earlier paper on budget-constrained bidders in sequential auctions. Their subjects have full information about each others values and budget constraints as their experiment focuses on testing between different equilibrium refinements.
71
auctions once capacity considerations are taken into account in procurement auctions, or
credit constraints are accounted for in ascending price auctions.79 BR’s experimental
work focuses on isolating the role of opportunity costs on bids in this sort of
environment.
They study an IPV auction with two bidders and two consecutive FPSB
procurement auctions, where it is common knowledge that bidders only have the capacity
to undertake a single project. Bidders learn their own project completion costs for
projects A and B (where A is the first project bid on), with both their costs and their
competitor’s costs randomly drawn from the same uniform distribution with support [20,
100]. Bids greater than 100 were not accepted. BR employ a 2 × 2 design, varying the
nature of the opponent (human or computer rival) and information feedback (no feedback
or feedback regarding winners and prices). In all cases potential bidders on project B
know if anyone entered and won on project A.
Equilibrium outcomes are reasonably complicated in this setup, but most of the
key implications are reasonably clear. First, consider a bidder with a cost advantage
(lower cost) for project B. They would prefer that the other bidder win project A, since
in this event they would be the only bidder on project B, earning 100 – CB (where CB) is
their cost for completing project B. As such, if they bid on A they should bid the
maximum amount, 100. However, a bidder with a cost advantage for project B might
decide to skip bidding on A if their cost advantage is large enough. In contrast, bidders
with a cost advantage for project A always participate in the first auction as they can,
potentially earn more than their largest possible payoff in B. Bids in this case are always
higher than in a standard single item procurement auction since one’s competitor does not
always bid on A, and submits higher bids than in the single item case if he does
participate. Further, conditional on meeting competition when bidding on project B, bids
are lower than in the single item case since it implies that competitor’s completion costs
are skewed to the low side given that he skipped bidding on project A. 79 BR refer to two empirical studies as providing support for their design: Jofre-Bonet and Pesendorfer (2000, 2003) found that firms that did not win a highway paving contract earlier in a sequence of auctions were more likely to enter a subsequent auction than firms that had already won a contract. De Silva et al. (2002) found that in auctions held by the Oklahoma Department of Transportation firms that lost in morning auctions bid more aggressively in the afternoon auctions compared to firms that had won in the morning. Also see DK who report that the overhead rate attached to bids by general contractors are positively related to the number of jobs already won.
72
BR’s data shows minimal differences in results when competing against human or
computerized rivals, and with and without information feedback, so the data analysis is
pooled over these treatments. The pooled results show that more than 70% of the entry
decisions on project A are correct, which is significantly better than an “always enter A
rule.” Further, the higher a subject’s expected cost of an incorrect entry, the higher the
average frequency of correct entry. As predicted, bids on A are higher than in single item
(control) auctions. Conditional on CA > CB, close to 77.9% of all bids are exactly at the
predicted level of 100, with an additional 12.6% in the interval [99,100). However,
subjects do not appear to correctly update their beliefs about their competitor’s costs
according to Bayes rule when meeting competition for project B since, if anything, bids
tend to be higher than in the single item case.
Leufkens, Peeters, and Vorsatz (2006; LPV) consider the impact of positive
synergies between items when bidding in a sequential private value auction. There are
two stochastically equivalent objects for sale using a SPSB auction with values iid from a
uniform distribution on [0,100], with the same four bidders participating in both auctions.
Valuations for the second auction were unknown when bidding in the first auction, but
winning the first auction increased the winner’s value in the second auction by a factor s
> 1. LPV investigate three treatments: a baseline with no synergies (s = 1), one with mild
synergies (s = 1.5) and one with strong synergies (s = 2.0). Subjects participated in 50
rounds of two auctions each.
Their model predicts that with s > 1 all bids in round 1 will be above bidders’
valuations. However, if bidding is symmetric (as assumed), round-one efficiency will not
be affected. Their results show that positive synergies reduce round-one efficiency, with
the percentage of auctions won by the high value holder decreasing from 92.4% to
84.4%, to 77.8% for s = 1, 1.5 and 2, respectively. These efficiency reductions are not
very surprising given the presence of the exposure problem, in conjunction with
heterogeneity in bidder risk preferences. As predicted the larger the synergy factor, the
higher bids are above value in round one, with average and median overbids of
4.23/8.12/12.16 and 0.00/4.30/7.0 with s = 1, 1.5 and 2 respectively. They found no
statistical support for the prediction that prices would decrease between rounds one and
two in the presence of positive synergies.
73
LPV’s experiment is notable for the introduction of synergies into a sequential
auction framework where predicted outcomes could be solved analytically. The main
weakness in their design is that there is huge uncertainty as bidders have no idea what
their round two values are when bidding in round one, which creates an unrealistically
severe exposure problem for bidders in round one. This, in turn, may have a strong
impact on actual behavior that is not captured by the assumption of risk neutral bidders.
The papers reported on in this section have only begun to scratch the surface with
respect to more complicated issues in sequential auctions. This leaves a number of
unexplored questions to be investigated.
IV Additional Topics
4. 1. Collusion in Auctions
An issue of enduring concern in auctions is the possibility of collusion. This is
not just an intellectual/theoretical exercise as collusion has been identified in a number of
cases: Krishna (2002) reports that in the 1980s 75% of the cartel cases in the United
States involving collusion were related to auctions. Klemperer (2002) argues that the
issues of primary importance in practical auction design have to do with discouraging
collusion, entry deterrence and predatory behavior. Collusion is a difficult topic to study
in the laboratory since it is almost impossible to effectively introduce side payments, and
experimental sessions have a natural end point which is likely to induce some unraveling.
Research reviewed in the 1995 survey involved providing subjects with explicit
opportunities (even encouragement) to discuss and coordinate bidding strategies. We
take up work since then, much of which still focuses on opportunities for bidders to
discuss collusive strategies with impunity, and nearly all of which involve auctions with
multiple units for sale.80
Sherstyuk (2002) looks at tacit collusion in ascending-price auctions. She gives
tacit collusion its “best chance” by incorporating a number of facilitating factors: small
numbers of bidders (three with supply of two units) and repeated play between the same
set of bidders. She compares a weak bid improvement rule (rivals need only match a bid
in order to have standing as the high bidder with tied bids settled randomly) versus a
80 See Hu, Offerman, and Onderstal (2009) for the sole single-unit auction study we have identified since the 1995 survey.
74
strict bid improvement rule, under either a narrow or wider support for bidders private
valuations (the increase in bidder profits resulting from collusion is greater with the
narrow support). Discussions were prohibited.
Her results show that with a weak improvement rule and the narrower support,
prices are quite low, although it takes some time to converge to the reserve price (see
Figure 12a).81 Collusion largely results from bid matching. In contrast, with the narrow
support and a strict bid improvement rule, prices are substantially higher (compare prices
between the 90-100 cases in Figures 12a and b). With strict bid improvements, collusion
tends to take the form of a bid rotation rule.
[Insert Figure 12 here]
In contrast, with the wider support, prices are close to the CE throughout
regardless of the bid improvement rule, which she concludes results from the smaller
increase in profits available with collusion with the wider support. However, this
conclusion is premature since in a companion treatment with California Institute of
Technology students with the weak bid improvement rule, there are high levels of
collusion regardless of which of the two supports employed (University of Melbourne
students were used earlier). There are at least two important differences between these
two subject populations (i) the Cal Tech students were veteran experimental subjects, the
Melbourne students were all inexperienced subjects and (ii) Cal Tech students are among
the brightest subjects one can enroll in experiments. In this respect it is particularly
unfortunate that she did not run strict improvement sessions with the Cal Tech subject
population and did not run experienced subject sessions with the Melbourne students.
Goswami, Noe and Rebello (1996) (GNR) look at collusion in multi-unit share
auctions designed to resemble Treasury bill auctions. They compare the effect of
nonbinding pre-play communication between bidders in UP versus discriminatory
auctions. In each auction there were 100 units for sale, with a value of 20 for all bidders.
There were 11 bidders in each auction, with bidders specifying the number of units they
were willing to purchase at each of three possible prices: 10, 15 and 20, with each bidder
able to bid for up to 100 units. In the class of symmetric, pure strategy, Nash equilibria
81 For similar results but almost immediate convergence to the reserve price see Sherstyuk (1999). In these auctions bidders’ values were common knowledge.
75
for the UP auction, there exists both a CE and a collusive equilibrium in which bidders
extract full surplus from the auction. (There are also a variety of other collusive equilibria
without full surplus extraction.) The collusive equilibria do, however, require a great deal
of delicate bid coordination. For example, in the most collusive equilibrium each of the
11 bidders demands 9 units at a price of 20, with all other bids at 10. This strategy profile
results in each bidder getting 9 units at the lowest possible price of 10 (with one
additional unit assigned randomly). It is easy to see that any unilateral deviation to get a
larger share results in raising the price to 20, significantly lowering profits. In the
discriminatory auction there is a unique symmetric Nash equilibrium in undominated
strategies with all bids at 15.82
All sessions had at least 12 auctions, with a single set of bidders in each session.
In the communication treatments bidders were allowed to speak to each other in between
every other round. Following each auction bidders were told the actual market clearing
price, their own allocation and their own payoff.
There were essentially no differences in clearing prices between the
discriminatory auctions with and without communication: none cleared at the lowest
price of 10, with 65% clearing at 15 without communication versus 69% with
communication (with the remainder clearing at the price of 20). In contrast, in the UP
auctions with communication 36% cleared at 10 versus 0% without, and another 30%
clearing at 15 with communication versus 16% without. As such average prices were
substantially lower in the UP auctions with communication than without, with no
difference with and without communication for the discriminatory auctions. Naïve
collusive outcomes predominated; e.g., all bidders agreeing to place all bids at 10, as
opposed to the rather elaborate self enforcing collusive Nash equilibrium.83 The results
suggest that UP share auctions are more susceptible to collusion than discriminatory
share auctions.
Sade, Schnitzlein, and Zender (2006) (SSZ) conduct an experiment similar to
GNRs but with different results, as average revenue is quite similar between the
82 There is also a Nash equilibrium with all bids at 20, but since bidders earn zero profits with discriminatory pricing, bidding 20 is dominated. 83 Unfortunately there is no direct accounting for the number of auctions that actually achieved the self enforcing collusive equilibria. But the impression one gets is that none of them did.
76
discriminatory and UP formats. One key difference between SSZ and GNR is that in SSZ
there were four possible prices of 17, 18, 19, and 20 versus three possible prices of 10,
15, and 20 in GNR. Thus, there were fewer alternatives to coordinate on in GNR and the
potential profits from collusion were substantially higher in GNR, both of which would
tend to promote collusion.
One interesting sidelight of the SSZ experiment is their use of both students and
finance industry professionals, with the professionals generating higher average revenue
(under both mechanisms) than the students, even though they had the same opportunities
to collude. Regulations precluded cash payments to the professionals, so they were
rewarded with prizes bearing the logos of the sponsoring universities. As such “winning”
might have been more salient for the professionals.
Phillips, Menkhaus, and Coatney (2003) (PMC) study collusion in a series of
sequential English auctions designed to mimic livestock auctions.84 Several facilitating
practices were employed: the same set of bidders over a series of seven auctions,
knowledge about the number of units for sale, and communication via an online chat
program. They investigate auctions with six and two bidders and between 19 and 30
(homogenous) units for sale in any given auction. Bidders had identical negatively
sloped demand curves, with a reservation price set 20 points below the average price had
all units been sold to the highest value bidders at their induced values. Collusion
increased with bidder experience so we focus on bidding in the last auction in each
session.
The six bidder control treatment yields average prices at 77% of a norm in which
each unit is sold at its valuation going from the highest to lowest value. Communication,
with or without bidder identification, reduced average prices to between 50% and 52% of
this norm. These lower prices were accomplished primarily through bid rotation rules
that communication facilitated. Further, while there was some cheating over the last
several units in each set of auctions, it did not destroy effective rotation in subsequent
auctions and/or lead to substantial unraveling in the last auction (see Figure 13).
Information about quantity for sale had no impact compared to the control treatment.
84 In auctions with two buyers, individual bidder demands were augmented in order to keep aggregate demand constant compared to the six bidder treatment. See Menkhaus, Phillips, and Coatney (2003) for a related experiment.
77
[Insert Figure 13 here]
The baseline treatment with two bidders had average prices at 75% of the norm in
which each unit is sold at its valuation going from the highest to lowest value.
Communication reduced average prices to 58% of this norm. Unlike the six bidder
auctions, information about quantity for sale without any opportunity for communication
had almost the same effect as communication with average prices at 61% of the norm.
PMC, using the chat records for support, suggest that the somewhat smaller effect of
communication in the two buyer auctions resulted from disputes as bidders compared
their relative gains, whereas it was too difficult to go beyond a simple bid rotation rule in
the six buyer case. Note that collusion might have been even more effective in this study
had there been no reserve price in place. Further, as a subsequent paper shows, in seller
active auctions (where live sellers replace the experimenter), who decide in advance how
many units to offer for sale, the number varies (sometimes quite widely) between auction
periods, which significantly disrupts the collusive effect of a constant supply with small
numbers of buyers (Phillips and Menkhaus (2009). It remains to be seen if this would
have a similar effect when small numbers of buyers are allowed to communicate.
Kwasnica and Sherstyuk (2007) (KS) look at collusion in simultaneous ascending
multi-unit demand (SAA) auctions. The experiment is inspired by Brusco and Lopomo
(2002) (BL) who show that there exist collusive Nash equilibria in SAA auctions
whereby bidders start bidding on their highest valued item and, if there are no competing
bids, stop bidding. This equilibrium is supported by the threat of competition and higher
prices if rivals do not cooperate.85 Although this equilibrium does not require repeated
interactions with the same set of bidders, KS look for it in a repeated play setting as (i)
this adds collusive opportunities via bid rotation to the strategy set and is more relevant to
many auction settings outside the lab and (ii) it is no doubt substantially more difficult to
achieve BL style collusion in one-shot games.86 Their experimental design involved two
85 See BL for a full characterization of the Nash equilibrium, which also holds for strong synergies between items and when two or more bidders have higher values for the same unit. Cramton and Schwartz (2002) provide evidence for BL type collusion in the FCC’s auctions for spectrum licenses. EG (section 3.1) report attempts at collusion in their SAA auctions with repeated matching. 86 On this last point KLM report two clear instances of such a collusive outcome in CCA auctions with random rematching in each auction. Bidding stopped after only a couple of rounds with all (experienced) bidders earning reasonable profits. The facilitating practices in KLM consisted of announcing provisional
78
objects for sale, with complementarities between items in some sessions, along with an
uncertain end point and no opportunity for discussions between bidders. In the no
complements case they define collusion as occurring with prices below 50% of the CE; in
the case of complements, when both items are awarded to the bidder with the highest
value for the package at a price equal to the second highest valuation. (The standard for
complements is more problematic since bidders face an exposure problem which in and
of itself may prevent an efficient allocation.)
KS’s strongest results are in auctions with two bidders: Absent complements 10%
of the auctions with inexperienced bidders, and 55% with experienced bidders, are
classified as collusive, with a number of auctions reasonably closely following the BL
mechanism for tacit collusion. Collusion was reasonably frequent in markets with two
bidders and modest complements, averaging 31% of all auctions with inexperienced
subjects. But was much less common with larger complementarities: 0 out of 16 auctions
with inexperienced subjects and 2 out of 11 auctions with experienced subjects. In the
case of complements, collusion was achieved through bid rotation rules.87 In contrast,
none of their five bidder auctions were collusive, regardless of bidder experience and the
presence or absence of complements.
Li and Plott (2009) (LP) study collusion in multi-unit demand SAA auctions with
eight bidders and eight items. Their strategy is to induce collusion by using an
‘incubator’ technology and then study factors capable of mitigating the collusion. Their
incubator technology involves: (i) Bidders valuations being “aligned” and “folded” so
that each pair of bidders has a unique item they value the most, with bidder i’s second
highest valued item very close to bidder j’s highest valued item and vice versa (in this
way it’s easy for a bidder to retaliate should her closest rival compete for her highest
valued item), (ii) There is complete information about all bidders’ valuations, and (iii)
The same set of bidders compete over several auctions with an unknown end point and
there are no opportunities for discussion between rivals. Under these conditions there
winners and determining provisional allocations randomly (as opposed to maximizing the number of players with no items) in case of multiple (tied) allocations that maximize seller revenue. 87 Interestingly, BL style tacit collusion can be achieved in the case of large complements but not with moderate complements.
79
exists a collusive Nash equilibrium of the sort specified in BL, as well as a Nash
equilibrium with competitive prices.
Once collusion is established, LP explore several remedies including (i) dropping
bidder identification, (ii) removing information about rivals values, (iii) using a fixed end
point for the auction as opposed to a soft ending (bidding continues until no new bids are
entered for 30 seconds), (iv) removing several items for sale (thus increasing competitive
pressure) and (v) changing bidders expectations by having some pairs of bidders with the
highest value for the same item. Remedies (i) – (iii) alone had minimal impact. Adding
treatment (v) to remedies (i) – (iii) reliably broke up collusion, with competitive
outcomes continuing after the aligned and folded preference structure was reinstated (but
not announced).88
Offerman and Potters (2006) (OP) look at whether auctioning of entry licenses
induces collusion in the product market. Standard economic arguments hold that entry
fees constitute a sunk cost so that they will not affect pricing in the product market.
However, many companies claim that they will have to charge higher prices in the
product market in order to recoup entry fees. In addition, OP note that if entry rights are
auctioned off, this will result in selecting bidders with the highest profit expectations in
the product market, which might foster tacit collusion as this is one way of achieving
these higher profits.
OP employ a product market with price-setting duopolists with differentiated
products, with a unique stage-game Nash equilibrium in which each duopolist charges a
price of 60 ECUs and earns a profit of 5000 in each period. This compares with the joint
profit maximizing collusive outcome with both firms charging 150 and earning profits of
9000.89 Subjects received feedback following each period about their own and their
opponent’s price, quantity, revenue, cost and profit but were not allowed to discuss
strategies. There were three treatments: (1) an auction treatment in which four subjects
bid for entry rights, with the two highest bidders paying their bids, (2) a fixed cost
treatment where the entry rights were randomly assigned at an exogenously determined
88 Brown, Sullivan, and Plott (2009) show both theoretically, and in an experiment, that switching to a simultaneous descending price auction in which all bids are final, serves to break up the collusive Nash equilibrium within the incubator structure. 89 Demand was simulated in the product market with price taking consumers.
80
entry fee comparable to the average fees in the auction treatment, and (3) a baseline
treatment in which the entry rights were assigned randomly with no entry fees. In all
three treatments, subjects first played the duopoly game for 10 periods against the same
opponent. After that each subject was randomly assigned to a group of four which
included their rival from the first 10 periods. These groups remained fixed until the end
of the experiment (20 more periods) with entry licenses, valid for five periods, auctioned
off at the start of each block of five periods. The two remaining subjects received a fixed
payment of 1000 per period, compared to expected earnings of 5000 in the (competitive)
stage game Nash equilibrium.
[Insert Figure 14 here]
Figure 14 shows average prices in periods 1-10, which were approximately the
same, before the three different entry treatments were introduced. In the first of the two
five period blocks with entry (periods 11-20) average prices were significantly higher in
both the auction and fixed cost treatments compared to the baseline treatment (p < .10),
but not significantly different from each other. These differences from the baseline
treatment were much less pronounced in the last ten entry periods, and were no longer
statistically significant (p > .10). Average winning bids were close to 20,000, the net
expected profit from the stage game Nash equilibrium, so that auction winners earned
excess profits. The role of entry fees in fostering collusion is supported by Spearman rank
order correlations between entry fees and average prices, which were positive and
statistically significant at the 10% level in periods 11-20 for the auction treatment (p =
.14 for the fixed cost treatment) and significant at the 5% level or better for both
treatments in periods 21-30. Finally, the data show that collusion is “clustered” so that
some groups had prices close to the stage game Nash equilibrium while others set prices
at higher levels. As such it would be more accurate to say that entry fees increased the
probability of collusion than that they increased the degree of collusion.90 Further, the
similarity in outcomes between the auction treatment and the fixed cost treatment would
support industry arguments that entry fees by themselves will lead to higher prices (via
tacit collusion) in concentrated industries.
90 There is considerably more to this rich experiment than reported on here including a monopoly treatment in which monopoly rights are bid for or simply awarded.
81
Summary: All of the auctions considered here involved the same set of subjects
competing in a series of auctions, usually with an unannounced end point. Repetition
with the same cohort appears to be a key facilitating factor, a factor likely to be at play in
field settings as well. Communication between bidders reliably facilitates collusion,
which seems hardly surprising. However, Whinston (2006) notes there is little in formal
economic theory about the way in which prohibitions on (nonbinding) price agreements
prevent anticompetitive prices, with the published empirical work offering surprisingly
little evidence that preventing oligopolists from talking has a substantial effect on the
prices they charge. In contrast to this, the experimental data show quite strong effects
when certain facilitating practices are in place. SB, pay what you bid type, auctions are
more collusion proof than ascending price auctions which provide easier opportunities to
detect and punish non-cooperators. Competitive pressures seem to play a role as well as
suggested by the role played in breaking up collusion in LP and the role played (in the
form of the support from which values were drawn) in Sherstyuk (2002).
4.2. Bidder’s Choice Auctions: Creating Competition Out of Thin Air
The National Association of Realtors defines a bidders’ choice auction as:91
“A method of sale whereby the successful high bidder wins the right to choose a property (or properties) from a grouping of similar or like-kind properties. After the high bidder’s selection, the property is deleted from the group, and the second round of bidding commences, with the high bidder in round two choosing a property which is then deleted from the group and so on, until all properties are sold.”
This type of bidding is very popular when selling time-shares, condominiums, and
building lots. Goree, Plott and Wooders (2004; GPW) were the first to study this type of
auction experimentally, noting that it can create competition between bidders who are
interested in different items. They illustrate this with the following example: Consider the
case of two bidders and two items, with each bidder interested in a different item. In a
standard SAA revenue is zero when bidders prefer different items, which occurs with
probability one half. In contrast, in the first stage of an ascending price right to choose
91 See http://www.aaauctionservice.com/glossery_files/glossery.htm
82
(ARTC) auction there is always competition since bidders, not knowing their rival’s
preferences, run the risk that the stage-one winner will take their preferred item. GPW
show that if bidders are risk neutral, the ARTC will raise the same average revenue as the
SAA, but if they are risk averse, the ARTC will raise more revenue, which may account
for its popularity.
In GPW there are four bidders in each auction, with two items for sale, A and B.
Each bidder had a 50% chance that either item A or B (but not both) will be their
“preferred item,” drawn iid from a uniform distribution with support [20, 920].92 The
value for their non-preferred item was effectively set to zero, so that each bidder had
positive value for only one of the two items in any given auction (zero substitution
possibilities between items). In the ARTC, after the first item was sold, bidders observed
the item chosen, with the remaining item sold in an ascending price auction. In the SAA,
items were sold simultaneously through two ascending price auctions, with bidders
restricted to bidding in only one of the two auctions at any given time. Revenues were
19.3% higher in the ARTC than in the SAA, with 100% efficiency in the SAA versus
98.4% efficiency in the ARTC. The estimated coefficient of relative risk aversion, 1-r, is
0.39, consistent with the higher revenues in ARTC.
Eliaz, Offerman, and Schotter (2008; EOS) studied an RTC auction with four
different items for sale, with two buyers for each type of good who only value that good
(zero substitution possibilities between goods for all buyers). In the RTC auction, all
eight buyers participate in a SPSB auction in which the winner has the right to pick which
item she wants, paying the second-highest bid price from among the eight bids submitted.
The item selected is announced so that the other buyer interested in that particular item
exits the auction. This process repeats itself with the remaining bidders until all four
items are sold. The control treatment involves four separate good-by-good (GBG)
auctions, in which the two bidders interested in each item compete in four separate SPSB
auctions. Two GBG treatments were employed, one with no minimum bid requirement
and one with a revenue maximizing minimum bid requirement. With risk neutral
92 There were no restrictions on the probabilities so that it was possible to have less than two bidders whose preferred item was A or B.
83
bidders, expected revenue is the same between the RTC and GBG (with no minimum bid
requirement), with risk aversion generating higher expected revenue in the RTC auction.
The RTC auctions raised significantly more revenue than either the unrestricted or
optimal GBG formats (40.4% and 13.9% higher revenue respectively). Average
efficiency was comparable between the RTC and unrestricted GBG auctions (98.2%
versus 98.3%) and higher than in the optimal GBG* auctions (87.9%). To test whether
risk aversion was the source of the higher revenue in the RTC auctions, EOS employed a
no information RTC (NIRTC) auction where, after each phase, bidders were not informed
as to which item was sold and losing bidders were not eliminated from the auction.
Winning bidders whose good was taken in the previous phase are randomly assigned one
of the goods (with zero value for that bidder). As a result, following the first item sold,
buyers are essentially bidding in a SP auction in which the high bidder wins a lottery that
awards her most preferred good with positive probability and a zero value item with the
complementary probability. Risk neutral buyers will bid the expected value, but risk
averse bidders will bid strictly less than the expected value of the item. Assuming
homogeneous risk averse bidders, the RTC auction with risk aversion provides a better fit
to the data than with risk neutrality. However, the NIRTC auction with risk aversion
provides a worse fit to the data. Thus, EOS reject risk aversion as the key factor behind
higher revenue in RTC versus GBG auctions. Rather, their preferred explanation rests on
probability (mis-) weighting with subjects acting as if they face fiercer competition than
they actually do.
Salmon and Iachini (2007; SI) examine a “pooled” RTC auction, with a number
of similarities to the NIRTC auctions in EOS. They conduct a discriminatory SB auction
with multiple units for sale with all bidders submitting a single bid at the same time.
Bidders’ values are perfectly correlated across items, so that each bidder has the exact
same ordinal ranking across items. (Think of selling several condominiums in a given
building, each of which is ranked from highest to lowest based on its scenic view. But
because of the location of the building relative to where bidders work, bidder i ranks each
apartment uniformly higher than bidder j.) Thus, unlike the other RTC auctions reported
on, there are some substitution possibilities between items, albeit with common ordinal
preferences over the goods.
84
Bids are ranked from highest to lowest with the high bidder getting first choice,
the second highest bidder second choice, and so on, with all winners paying what they
bid. Following Menezes and Monteiro (1998), assuming symmetric bidding strategies, SI
solve for bid functions numerically for both risk neutral and loss averse bidders.93 Loss
aversion is relevant here since bidders can lose money when bidding according to the
RNNE, as a bid designed to get a higher valued unit may end up securing a unit with a
lower value, with bidders paying what they bid. They compare outcomes in the pooled
RTC auctions to an SAA in which subjects are restricted to holding the high bid on one
item at a time.94
Their results show that revenue is uniformly, and substantially, higher in the
pooled RTC auctions than in the SAA (41.8% higher), well above the revenue predicted
under the RNNE for the RTC auctions. In fact, bidders suffer persistent losses, with
bidder profits well below those in the SAA. Revenue and prices in the SAA are very
close to those predicted under the efficient allocation. Efficiency is essentially the same
between the two auction formats, averaging around 95% in both cases. Looking at
individual bids in the RTC auction, the shape is essentially the same as the theory
predicts, but bid functions are displaced upward relative to where they would be under
risk neutrality. SI explore a number of alternative explanations for this upward
displacement of the bid function, with their preferred explanation consisting of a
probability (mis-) weighting model: In this case “attentional” bias whereby bidders focus
most of their attention on winning their most preferred 2 or 3 units in the auction, largely
ignoring the possibility of being “stuck” with lower valued units. Finally, SI note that
assuming their results translate outside the laboratory, the kind of pooled auction format
they employ would have trouble sustaining itself, as persistent losses would reduce
incentives to bid in these auctions, as well as generating defaults on bids.
Summary: The three RTC experiments reported on provide strong evidence for their
revenue raising ability compared to either an SAA or a GBG format. The results reported
93 The loss averse specification uses the utility function and parameter values reported in Tversky and Kahneman (1992). SI note that there is little difference between risk neutral and risk averse bidding given their parameter values. 94 Their SAA follows the format employed in the FTC spectrum auctions, with a countdown clock that resets every time a new bid is submitted. The auction ends when no new bids are submitted for any items, with winning bidders paying what they bid.
85
in EOS and SI lie totally outside what theory predicts. The losses associated with the
pooled RTC auctions in SI would seem to limit their use in field settings. The total lack
of substitutability between commodities in the GPW and EOS experiments seems
unrealistic for the situations these auctions are intended to represent. Thus, there is scope
to explore either an ascending, or sequential, RTC auction in which bidders demand a
single unit but the items have some degree of substitutable, comparing outcomes to either
an SAA or GBG auction. Nevertheless, the results of these three experiments are an
exciting new application of experimental methodology designed to better understand the
basis for RTC auctions found in field settings. On a theoretical level both EOS and SI
attribute the higher than predicted revenue to bidders systematically misweighting
probabilities of one sort or another, which ties back to results reported elsewhere in this
survey (see, especially Section 1.1) on bidding above the RNNE in FPSB auctions.
4.3 Internet Auction95
Internet auctions provide new opportunities to conduct experiments, with
considerable potential for applications. Lucking-Reiley (1999; LR) used the Internet to sell
collectable trading cards under the four standard auction formats (Dutch, English, FPSB
and SPSB auctions), investigating the RET. He finds that Dutch auctions produce 30%
higher revenue than FP auctions, a reversal of previous laboratory results, and that English
and SP auctions produce roughly the same revenue. These results are interesting but lack
the controls present in more standard laboratory experiments; i.e, there may well be a
common value element to the trading cards, and Dutch auctions provide an opportunity to
use the game cards immediately, which cannot be done until the fixed closing time in the
FP auctions.
eBay auctions have a fixed closing time with many bidders submitting bids just
seconds before the closing time (sniping), while others increase their bids over time in
response to higher bids. In contrast, Amazon auctions automatically extend the closing time
in response to late bids (as “soft” closing), with much less last minute bidding than in
comparable eBay auctions. These differences raise two questions addressed by Roth and
Ockenfels (2002; RO): (1) Why the sharp differences in last minute bidding between the
95 Bajari and Hortacsu (2004) and Ockenfels, Reiley, and Sadrich (2006) provide surveys of theoretical, empirical, and experimental work on Internet auctions.
86
two auction designs and (2) since eBay has a number of characteristics similar to a standard
SP auction, why the increased bidding by the same bidder over time?
RO suggest several (rational) reasons for sniping in (essentially) private value eBay
auctions with their fixed deadline: (i) implicit collusion on the part of snipers in an effort to
get the item at rock bottom prices since congestion will result in some of the last minute
bids not being recorded at the web site and/or (ii) a best response to incremental bidding on
the part of less sophisticated bidders in an effort to avert a bidding war. They also note that
motivation for sniping for items with a significant CV component could result from (i)
better informed bidders’ efforts to conceal their superior information on high valued
collectables and/or (ii) bidders updating their valuation of items as bids come in. Because
there are a number of other differences between eBay and Amazon than their ending rules,
as well as the difficulty of clearly distinguishing between private value and CV auctions in
field settings, Ariely, Ockenfels, and Roth (2005; AOR) conduct a laboratory experiment in
which the only difference between auction institutions is the ending rule for private value
goods – a dynamic eBay auction with either a .8 or 1.0 probability that a late bid will be
accepted and an Amazon style auction with a .8 probability that a late bid will be accepted,
in which case the auction is automatically extended. Their results show quite clearly that
there is more late bidding in both eBay auctions compared to the Amazon auction. Further,
there is significantly more late bidding in the eBay treatment where last minute bids would
be recorded with probability 1 than with probability .8, which rules out tacit collusion as
the only basis for sniping, and more than likely represents, at least in part, best responding
to incremental bidding on the part of less sophisticated bidders.
Ely and Hossain (2009) compare sniping with “squatting” (a single early bid) in a
series of eBay auctions (actual bids they made for recently released movie DVDs). Their
experiment represents an attempt to look at more general equilibrium effects of sniping
versus the alternative of squatting. They corroborate that sniping is a best response to
naïve bidding of the sort studied in AOR. But sniping does not lead to large increases in
surplus in their experiment because of multiple eBay auctions for the same item, with
early bids (squatting) deterring entry into that particular auction. At the same time they
recognize that sniping would be more effective if instead of done randomly, as in their
experiment, it was directed at eBay auctions with the lowest standing bid.
87
Salmon and Wilson (2008) investigate the practice of second-chance offers to non-
winning bidders in Internet auctions when selling multiple (identical) items. They compare
a two-stage game with a SP auction followed by an ultimatum game between the seller and
the second-highest bidder versus selling the two items in a sequential English auction. As
predicted the auction-ultimatum game mechanism generates more revenue than the
sequential English auction, providing a potential explanation for the practice of second-
chance offers to losing bidders.
Shahriar and Wooders (2011; SW) study “buy-it-now” (BIN) options popular in
eBay and Yahoo and other Internet auctions.96 They employ an English clock auction
(with a soft close) and a BIN price that must be exercised prior to the start of the auction.
For a private value auction when bidders are risk averse a suitably chosen BIN will raise
revenue as it extracts a risk premium from bidders wishing to avoid uncertainty over
whether they will win and the price paid (Reynolds and Wooders, 2009). In contrast, for
CV auctions, if bidders are sophisticated and do not suffer from a WC, there is no BIN that
raises revenue for risk neutral or risk averse bidders.
SW’s results support the risk aversion predictions for the private values case as
auctions with a BIN option raised average revenue by 6.8% compared to the control
treatment, and by 11.9% conditional on the BIN being accepted (p < .01 in both cases).
The BIN was accepted in 45% of the auctions. Introducing a BIN that is a little above the
(unconditional) expected value of the item in an ascending-price CV auction raises revenue
by 4.2% (p > .10), but consistent with a WC is accepted in 78.9% of the auctions. Further,
bidders tend to drop out earlier when the BIN was not accepted compared to controls, even
though rejection of the BIN is completely uninformative. SW explain these anomalous
results through an extension of the naïve bidding model developed in KL (1986) in which
bidders make no adjustment to the adverse selection effect conditional on winning the item
and fall prey to the WC.
Ivanova-Stenzel and Kroger (2008; ISK) investigate BIN auctions in which a seller
(played by one of the participants) offers a BIN to one of the two potential buyers. If the
buyer rejects the BIN, a SPSB auction with no reserve price results with both bidders
96 Different Internet auction platforms adopt different BIN options. In eBay bidders have a chance to get the item at a fixed price before any bids are placed. In Yahoo the BIN can be exercised after bidding starts.
88
active. With two risk neutral buyers and a risk neutral seller, it is optimal for the seller to
offer a BIN price greater than or equal to the mid-point of the uniform support underlying
buyers’ valuations, which will not be accepted. However, with risk averse (or impatient)
buyers, the BIN may be accepted when it offers the buyer a higher probability of getting
the item, albeit at a higher price (Matthews, 2003). Further, if sellers are risk averse they
may offer a BIN as it reduces the variance in revenue.
ISK report a substantial number of BIN prices below the mid-point of the support
of buyers’ valuations, as well as a substantial number of BIN prices that were above a risk
neutral bidder’s threshold for acceptance. Allowing for (heterogeneous) risk averse buyers,
with risk aversion estimates in line with those reported in the literature, rationalizes many
of these acceptances. However, accounting for risk aversion does not achieve nearly the
same level of success for sellers: Simulations show that 29% of all BINs are below
reasonable estimates of buyers risk preferences (even accounting for risk loving buyers),
with one-third of all sellers offering a BIN below this threshold more than half the time.
Alternative explanations in terms of “noise” in the data are rejected on the grounds that the
observed distribution of BIN prices is far from uniform, as one would expect based on
random selection, and do not decline over time as subjects gain experience. Rather, ISK
liken the persistence of the low BINs to a “seller’s curse,” resulting from a failure to
account for the adverse selection effect of low BINs selecting low value buyers to exercise
the option.97
4.4 Entry into Auctions98
Most of the theoretical literature on auctions treat the number of bidders, N, as
fixed. The fixed N paradigm simplifies the analysis and allows for easy comparisons of
revenue and efficiency between different auctions mechanisms, and is an essential
assumption underlying the RET. The key motivation for looking at endogenous entry is
that it’s both costly and time consuming to prepare bids so that it is part and parcel of the
auction process. As such it should not be swept under the rug by assuming an
exogenously determined number of entrants. Further, casual observation shows that the
97 Grebe et al (2009) repeat the ISK experiment with two buyers and one seller using true eBay rules (an English auction with proxy bidding possible and a hard close), subjects with eBay experience, and induced valuations. 98 Most of the research on this topic is in the context of a private value auction environment.
89
number of bidders in similar situations can vary a lot, leaving the impression that it is
governed by a stochastic, rather than a deterministic, process. A natural question, both
theoretically and experimentally, is how sensitive are the typical auction results to
dropping the fixed N assumption, as opposed to allowing for endogenous entry.99
There have been two main approaches to modeling auctions with entry. Both start
by assuming N potential entrants and an entry cost, c, (e.g. bid preparation costs) since
otherwise all potential bidders enter and we are back in the fixed N setup. The first
approach assumes that ex-ante bidders are symmetrically informed so that any
information bidders’ have before they enter the auction is public information, learning
their private information signals only after incurring the entry cost. In this case the
theory has focused on two types of equilibria: A deterministic, asymmetric equilibrium in
which bidders use pure entry strategies with exactly n* bidders, the number of bidders
that can enter profitably, entering the auction. The remaining (N– n*) bidders remain out
and have no further impact on the auction (see Smith, 1982, 1984, Engelbrecht-Wiggans,
1987, 1993, and McAfee and McMillan, 1987). The second model Levin and Smith
(1994; LS) has a unique symmetric mixed strategy equilibrium that determines a
probability of entry, q*, which leaves all bidders just indifferent between entering and
staying out.100 This results in entry being a random variable that is governed by a
binomial distribution with N and q* as the two parameters, with q* depending on the
expected rewards from entry relative to its cost, q* = Q*(c, N).101 We refer to the first
equilibrium as ‘‘deterministic” and to the second as ‘‘stochastic.” A second modeling
approach is to assume that the N potential bidders obtain information about their type
before they decide to enter. This approach generates a unique pure strategy equilibrium
characterized by a cutoff value, which is a function of a bidders’ type, which determines
who enters and who stays out (see, for example, Palfrey and Pevnitskaya, 2008). Here,
the realized number of entrants is a random variable governed by a binomial distribution
99 Endoginizing entry decisions also forces one to take account of bidders’ preferences over auction institutions (Mathews, 1987, McAfee and McMillan, 1987). 100 There are an enormous number of asymmetric equilibria involving subsets of bidders that enter, or stay out, deterministically while the rest enter with the same probability. 101 This approach also allows for symmetric risk-averse bidders. For example if u(x) = xρ where ρ being the CRRA parameter than in equilibrium q* = Q*(c, N| ρ).
90
with N and q*, where q* in this case represents the probability of a player’s type
exceeding the cutoff level.
Smith and Levin (2001; SL) conduct an experiment to examine whether their
stochastic bidding model predicts better than the deterministic model. The experiment
focuses on entry so that payoffs match a bidder’s expected gain in the symmetric RNNE
after entering. That is, there is no bidding phase after entry. Their model provides a rich
set of comparative static predictions to use in discriminating between the stochastic and
deterministic models.102 Each experimental session consisted of a series of market
periods with subjects electing to enter the ‘‘market’’ or stay out, with the latter paid a
fixed sum of money representing the opportunity cost of entry. Before each period, the
number of potential entrants, N, the cost of entering, c, and the schedule of payoffs
conditional on entering (which were deceasing with the number of entrants, n) were
publicly announced. Subjects received feedback regarding the total number of entrants
after each round of play. There were two main treatments, one with a small number of
potential entrants (N = 4) and one with a larger number of potential entrants (N = 8), with
four different costs of entry within each treatment.103 Payoffs were such that at each cost
level there was room for “profitable” entry by at least one bidder but not more than three
bidders.
The aggregate data strongly support the stochastic model. First, the deterministic
model predicts that the number of bidders actually entering the auction is, other things
equal, independent of the potential number of entrants (N) as opposed to the stochastic
model’s prediction that average entry will increase with larger N.104 This prediction is
satisfied for all cost levels, with the increases significantly different from zero for three of
the four cost levels. Further, although the average increase in entry rates was somewhat
102 There is a large, closely related, earlier experimental literature on coordination games (see Ochs, 1995, and Rapoport et al, 1998, and references therein). The key difference between SL’s experiment and these earlier ones is linking the payoff structure to what would have been earned in the RNNE of a well defined auction market. These predictions are sensitive to bidders’ risk preferences. However, the apparent risk premium demanded by subjects was close to zero, so that predictions for the risk-neutral case are used throughout. 103 Entry costs of {$0.50, $1.00, $1.50, $4.00}. 104 There are two competing forces at work here: larger N decreases the probability of any given bidder entering, but there are more potential entrants. The net effect is an increase in n under their treatment conditions. LS were not able to prove this holds in general, but conjecture that it increases asymptotically monotonically to a fixed n as N increases.
91
greater than predicted in the stochastic model, none were significantly greater than
predicted. Both models predict that the average number of entrants will fall as entry costs
increase, but by varying degrees. At each of the cost levels with sufficient numbers of
observations to perform exact tests, the observed reduction in entrants is significantly
smaller than the deterministic prediction. In contrast, although there is a tendency for
entry rates to decrease more than predicted in the stochastic model, in no case were the
differences large enough to reject the stochastic model’s prediction. The stochastic model
predicts that subjects will enter with sufficient frequency to reduce expected profits to
zero, since in equilibrium bidders are indifferent between entering and staying out.
Profits for entrants averaged -$0.02 per subject, per period, over all auctions, very close
to the zero-profit prediction and substantially below the $0.34 profit level of the
deterministic model.105 Finally, the stochastic model predicts that the total surplus
generated in the auction will increase when the number of potential entrants decreases,
whereas the deterministic model predicts no change. Simulating seller revenue and
adding it to bidders’ actual profits to compute total surplus, for all cost levels reductions
in N caused social surplus to increase. This provides strong empirical support for one of
the most intriguing policy implications of the stochastic model: Other things equal thicker
markets are less efficient due to increased costs of entry, so that society may benefit from
measures designed to limit somewhat the number of potential bidders.
While the preceding shows that the stochastic model organizes the aggregate data
rather well, substantially better than the deterministic model, there were also some
significant deviations from the stochastic model at the individual subject level. The
stochastic model assumes that bidders are symmetric, which implies that for each
treatment they all employ the same (symmetric) entry probability. The data soundly
reject this. Among inexperienced subjects this hypothesis is rejected (at the 5% level)
26% of the time, and is rejected 33% of the time for experienced subjects, far greater than
the 5% expected rejection rate. Thus, it does not appear that all subjects rely on the
common entry probability, q*, underlying the stochastic model. The failure to find a
105 These are “pure economic profits” above and beyond the return for staying out.
92
uniform probability of entry across all subjects invites further research to identify a more
accurate, stochastic asymmetric entry model.106
The main weakness of the LS model is that its symmetric equilibrium uses a
mixed strategy. When the N potential bidders are risk-neutral, or symmetrically risk
averse, a mixed strategy equilibrium is unavoidable. Palfrey and Pevnitskaya (2008; PP)
purify the mixed strategy equilibrium by assuming that the number of potential entrants,
N, are drawn from a population with heterogeneous (homegrown) risk preferences. As
such there is a critical level of risk-aversion (the cut off level) for which bidders who are
more risk-averse select to stay out in order to avoid entry costs, while the less risk averse
enter.
PP explore an environment with either 4 or 6 potential bidders in an IPV FPSB
auction. Sessions with no entry costs and fixed numbers of bidders served as the control
treatment. Entry costs, ω, were represented by a fixed payoff for staying out. Varying N,
the upper bound of the support from which valuations were drawn, ū, and the value of the
outside option, they employed treatments where the RNNE entry probability, q*, was
either .5 or .35, representing “high” and “low” anticipated entry rates. Bidders’ types,
needed to purify the mixed strategy equilibrium, are determined by their risk preferences,
with bidders who are more risk tolerant entering the auction, after which they learn their
value for the item.
Comparing auctions with endogenous versus exogenous entry, as predicted the
estimated slopes of the bid functions are smaller with endogenous entry in 11 out of 12
cases, consistent with the prediction that with endogenous entry the more risk averse
subjects choose to stay out of the auction. Further, comparing estimated slopes of bid
functions for different realized values of n, slopes are larger with q* = .5 than .35 in all
cases, again consistent with the prediction that with higher entry rates more risk averse
bidders enter the auctions, resulting in more aggressive bidding. PP conclude that
subjects who enter the auction are, on average, less risk averse than those who stay out.
However, entry rates were consistently higher than RNNE rate, indicating excess
entry, and resulting in average profits for entrants that were substantially and consistently
lower than the outside option (approximately 50% less). One potential source of this
106 On this score also see Ochs (1995).
93
excess entry is that not entering is boring, with entering providing some entertainment
value. To test this, PP employ a treatment in which non-entrants have the opportunity to
play a simple computer game. While the average entry rate declined significantly from
.61 to .54 (with q* = .50), it was still significantly above the predicted upper bound for
entry. One important difference between this experiment and SL who got close to risk
neutral entry rates is that potential entrants were better informed about the expected value
of entering versus staying out in SL (due to the fact that entrants shared the expected
payoff for entry without actually bidding). The importance of clear information
concerning expected profits will be shown in the next experiment reported on here.
Finally, the most direct test of the cut-off entry model would be to examine
individual subject behavior: Do the same, least risk-averse, subjects almost always enter
under the same treatment conditions? Unfortunately, the authors do not provide this data.
Ivanova-Stenzel and Salmon (2008; ISS) compare bidding in a FPSB auction with
an English clock auction when bidders have a choice as to which auction to enter. That
is, they take endogenous entry to its logical conclusion by having bidders choose which
of two different auction formats to bid in. In this case the cost of entry is the opportunity
cost of participating in the other auction. The key question posed in this experiment is
whether revenue equivalence can be restored through competition between auction
formats.
Bidders first participated in a “learning phase,” where they bid in both the clock
auction and the FPSB auction with exogenously determined numbers of bidders, in order
to provide subjects with experience with both auction formats. Further, to insure that
bidders knew the likely payoffs from the two formats, at the end of the learning phase
they received feedback regarding the session-wide average profit for each format for all
values of n. In the second phase subjects split into two groups of six bidders each and
proceeded to bid in 30 rounds of auctions, choosing which auction to participate in.107
Their main result is that the clock auctions attracted more bidders than the SB auctions,
so that average revenue was essentially the same in both formats, as was average
107 To assure competitiveness one bidder was assigned to each format without any choice so that each of the remaining four bidders could not enter and find herself the only bidder in that market. See ISS for a number of other important details regarding the innovative procedures employed.
94
efficiency. However, winning bidders earned slightly more money on average in the
clock auctions.
ISS conclude that the key result in their study is not the approximate revenue
equivalence, but rather that revenue in the English auctions increases sufficiently with
endogenous entry to call into question the assumed revenue superiority of the FPSB
auction, as bidders’ arbitrage between mechanisms. This may well be true in a laboratory
study where subjects are well informed regarding expected profits between the two
mechanisms, as well as in field settings where bidders have extensive experience with
both mechanisms. However, LR’s field experiment investigating the same issue showed
that FPSB auctions consistently raised more revenue than e-Bay “English” auctions,
consistent with inexperienced bidders’ lack of information regarding expected cost of
participating in the two auction institutions. Alternatively, LR’s English auctions took
considerably more time to complete than the FPSB auctions, so that bidders anxious to
get their playing cards sooner rather than later, would prefer the FPSB auction. This
alternative explanation is consistent with the fact that in slow moving English auctions,
bidders commonly resort to jump bids to speed things up (Isaac, Salmon, and Zillante,
2005), while LR’s eBay auctions had a fixed ending time.
Several other entry related studies are worth mentioning. Goeree, Offerman and
Sloof (2013) study multi-unit demand auctions when two incumbent firms face a
potential negative externality in the form of a new entrant who, if winning items, will
compete in the resulting product market.108 Their paper compares entry rate in a UP clock
auction with that of a SB discriminatory auction. Their results show that both auction
formats induced similar high levels of entry. However, the mechanism behind the entry
rates differed between the two auctions: In the ascending price auctions entry levels are
between those predicted by the preemptive equilibrium in which incumbents completely
block entry and the demand reduction equilibrium in which at least one of the incumbents
always permits. In the discriminatory auctions there is more entry than predicted because
of incumbents’ failure to coordinate their bids to deter entry. As a result potential
108 The experiment was inspired by developments in spectrum auctions in both the US and Germany.
95
entrants’ prospects for successfully entering the market were similar between the two
formats.109
Kagel, Pevnitskaya, and Ye (KPY, 2008) look at entry in markets with indicative
bidding. Indicative bidding is a two-stage process sometimes used in the sale of business
assets with very high values. In the first stage the auctioneer solicits a large group of
interested buyers to submit non-binding bids, with the highest of these non-binding bids
used to establish a short list of final (second-stage) bidders. These short-listed bidders
then engage in extensive studies to acquire more information about the asset for sale,
after which they submit firm and final bids (typically in a FPSB auction). Ye (2004)
shows that there does not exist a symmetric increasing equilibrium with indicative
bidding. As a result the most qualified bidders may not be selected to be on the short-list,
which may result in substantial efficiency losses. In contrast, there are a number of
alternative two-stage bidding procedures that, in theory at least, guarantee that the short-
list consists of those bidders with the highest preliminary (first-stage) valuations, while
preserving the best properties of indicative bidding; namely, avoidance of the costly asset
valuation process for all but the short-listed bidders. Most prominent among these is a
binding UP first-stage auction in which the highest rejected first-stage bid establishes an
entry fee (Ye, 2004) for stage-two bidders. This is the type of situation tailor made for an
experiment since there is no guarantee that the alternatives to indicative bidding will
produce fully efficient outcomes, nor any other way to evaluate the efficiency losses
associated with indicative bidding.
KPY’s results show that indicative bidding performs as well as the UP auction in
terms of those bidders with the highest first-stage valuations bidding in stage-two. This is
a result of (1) sufficient heterogeneity in first-stage bids so that entry is not 100%
efficient under the UP auction and (2) first-stage bids under indicative bidding highly
correlated with first-stage values, resulting highly efficiency entry. The latter is reflective
of the fact that bidders with low first-stage values lost money, on average, as a result of
entry, while those with higher valuations consistently earned positive profits. Further, 109 Hu et al. (2013) report results from a single-item experiment in which a potential entrant, if she wins the auction, imposes a negative externality on two incumbents. Entry rates are significantly higher in the FPSB auction compared to the clock auction, consistent with the model’s prediction. Although actual entry rates are a bit higher under each auction format compared to predicted levels, they are not materially different from the predicted entry rate differential under the two auction formats.
96
indicative bidding does better on other dimensions as it yields higher average profits and
fewer bankruptcies in the initial auction periods due to systematic overbidding in the UP
auctions. Although these higher revenues are good for sellers in the short-run, they
would more than likely destroy its long run viability. KPY report similar problems with a
discriminatory first-stage auction. These results suggest a trade-off between types of
mechanisms: One with clear equilibrium predictions insuring efficiency in theory, but
involving relatively complex rules and calculations for bidders, the other with no clear
equilibrium prediction but with relatively simple rules. The results are similar to those
reported in KL (2010) for multi-unit demand Vickrey type auctions where a mechanism
with a weaker solution concept achieves higher efficiency than one with a stronger
solution concept due to its relative transparency (see section 3.2 above).
Goeree, Offerman, and Schram (2006; GOS) compare revenue between FPSB
auctions versus simultaneous ascending auctions (SAA) for selling heterogeneous
licenses under a market structure mimicking the 2002 Dutch sale of air wave rights
auctions, a market with strong incumbents and relatively weak potential entrants. The
key question addressed in this relatively uncompetitive situation is whether a FPSB
auction would be more attractive to potential entrants than an ascending price auction,
thereby generating more revenue and a more competitive aftermarket. Klemperer (2002)
predicts this outcome on the grounds that the uncertainty inherent in the SB format
encourages incumbent (strong) bidders to shave their bids less, while the ascending
auction format discourages entrants as strong bidders simply “trail” weaker ones,
overbidding them by the minimum amount required until they drop out. GOS confirm
Klemperer’s concerns, as in auctions with endogenous entry of weak bidders, their
probability of winning was higher, and their rate of entry was higher in the FPSB
auctions.110 However, revenue was essentially the same between the two auction formats
as was efficiency.
V Summary and Conclusions
Experimental research in auctions has continued apace along with the extensive
theoretical work on auctions since the appearance of Kagel’s survey in The Handbook of
110 Three different FP formats were employed – all licenses sold at the same time, sequential sale of licenses and a simultaneous descending (Dutch auction) format. Entry rates were lower, with the probability of winning essentially the same, under the sequential FP format compared to the SAA.
97
Experimental Economics in 1995. Results reported in the original, 1995 survey focused
on the Revenue Equivalence Theorem and initial investigations of the winner’s curse, so
they could be easily summarized. In contrast, it is impossible to summarize the work
reported on here in a few sentences given the much broader scope of the issues covered
since 1995. We anticipate a continued flow of auction experiments given the many
applications of auctions: privatization of government assets, the continued growth of
online and business-to-business auctions, and theorists’ attempts to better understand the
many variations in auction design in practice, and to design better auction institutions.
1
References
Andreoni, J., Y. K. Che, and J. Kim. 2007. Asymmetric information about rivals’ types in standard auctions: An experiment. Games and Economic Behavior 59:240-259. Ariely, D., A. Ockenfels, and A. E. Roth. 2005. An experimental analysis of ending rules in internet auctions. RAND Journal of Economics 36:890-907. Armantier, O. 2002. Deciding between the common and private values paradigm: An application to experimental data. International Economic Review 43:783-801. Armantier, O. and N. Treich.. 2009 Subjective probabilities in games: An application to the
overbidding puzzle. International Economic Review 50:1079-1102. Ashenfelter, O. 1989. How auctions work for wine and art. Journal of Economic Perspectives 3:33-36. Ashenfelter, O. and D. Genesove. 1992. Testing for price anomalies in real estate auctions. American Economic Review: Papers and Proceedings 82:501-505. Ausubel, L. M. 2004. An efficient ascending-bid auction for multiple objects. The American Economic Review 94:1452-1475. Ausubel, L. M. and P. C. Cramton. 1996. Demand reduction and inefficiency in multi-unit
auctions. Mimeograph. University of Maryland. Ausubel, L and Milgrom, P. 2006. The lovely but lonely Vickrey auction. In Combinatorial Auctions, P. Cramton, Y. Shohani and R. Steinberg (eds). MIT Press. Avery, C. and J. H. Kagel. 1997. Second-price auctions with asymmetric payoffs: An experimental investigation. Journal of Economics and Management Strategy 46:573-604. Ayers, I and Cramton, P. 1996 “Deficit reduction through diversity: How affirmative action at
the FCC increased auction competition” Stanford Law Revue , 48 (April): 761- 813.
Bajari, P. and A. Hortacsu. 2005. Are structural estimates of auction models reasonable? Evidence from experimental data. Journal of Political Economy 113:703-741. Bajari, P. and A. Hortacsu. 2004. Economic insights from internet auctions. Journal of Economic Literature 42:457-486. Bazerman, M. H. and W. F. Samuelson. 1983. I won the auction but don’t want the prize. Journal of Conflict Resolution 27:618-634.
2
Bell, D. E. 1982. Regret in decision making under uncertainty. Operations Research 30:961-981. Bikchandani, S. 1988. Reputation in repeated second-price auctions. Journal of Economic Theory 46:97-119. Blecherman, B. and C. F. Camerer. 1998. Is there a winner’s curse in the market for Baseball Players? Mimeograph. Brooklyn Polytechnic University. Bolton, Gary E. and Axel Ockenfels. 2000. ERC: A theory of equity, reciprocity and
competition. American Economic Review, 90, 166-193. Brosig, J. and J. P. Reiss. 2007. Entry decisions and bidding behavior in sequential first-price procurement auctions: An experimental study. Games and Economic Behavior 58:50-74. Brown, A. L., H. Sullivan, and C. R. Plott. 2009. The nature of collusion facilitating and collusion breaking power of simultaneous ascending price and simultaneous descending price auctions. Economic Inquiry. 47 (3), 395-424 Brusco, S. and G. Lopomo. 2002. Collusion via signaling in simultaneous ascending bid auctions with heterogeneous objects, with and without and complementarities. Review of Economic Studies 69:407-436. Brunner, C., J. K. Goeree, C. A. Holt, and J. O. Ledyard. 2010 An experimental test of flexible
combinatorial spectrum auction formats. American Economic Journal: Microeconomics,2(1), 39-57
Bulow, J. M. Huang and P. Klemperer. 1999. Toeholds and takeovers. Journal of Political Economy 107:427-454. Burns, P. 1985. Experience and decision making: A comparison of students and businessmen in a simulated progressive auction. In Research in Experimental Economics, V. L. Smith (ed.) Jai Press, Greenwich, CT. Camerer, C. 1995. Individual decision making, in The Handbook of Experimental Economics, .
J. H. Kagel and A. E. Roth (eds) Princeton University Press. Campbell, C. and D. Levin. 2006. When and why not to auction. Economic Theory 27:583-596. Cantillon, E. and M. Pesendorfer. 2007. Combination bidding in multi-unit auctions. CEPR discussion paper No. 6083. Capen, E. C., R. V. Clapp, and W. M. Campbell. 1971. Competitive bidding in high-risk situations. Journal of Petroleum Technology 23: 641-653. Casari, M., J. C. Ham, and J. H. Kagel. 2007. Selection bias, demographic effects and ability effects in common value auction experiments. American Economic Review 97:1278- 1304.
3
Cassing, J. and R.W. Douglas. 1980. Implications of the auction mechanism in baseball’s free agent draft. Southern Economic Journal 47:110-121. Cason, T. N. 1995. An experimental investigation of the seller incentives in the EPA’s emission
trading auction. American Economic Review 85: 905-922. Cason, T. N. and D. Friedman. 1997. Price formation in single call markets. Econometrica 65:
311-345. Cason, T. N. and D. Friedman. 1999. Learning in a laboratory market with random supply and
Demand. Experimental Economics 2: 77-98. Charness, G. and D. Levin. 2009. The origin of the winner’s curse: A laboratory study. American Economic Journal: Microeconomics, 1: 207-236. Chen, Y. and K. Takeuchi. 2010. Multi-object auctions with package bidding: An experimental comparison of iBEA and Vickrey. Games and Economic Behavior 68:557-579. Chen-Ritzo, C. H., T. P. Harrison, A. M. Kwasnica, and D. J. Thomas. 2005. Better, faster, cheaper: An experimental analysis of a multi-attribute reverse auction mechanism with restricted information feedback. Management Science 51: 419-434. Chen-Ritzo, Ching-Hua, Terry P. Harrison, Anthony M. Kwasnica, and Douglas J. Thomas,
2005. Better, faster, cheaper: An experimental analysis of a multi-attribute reverse auction mechanism with restricted information feedback, Management Science, 52: 1753-1762.
Chernomaz, K. 2012. On the effects of joint bidding in independent private value auctions: An experimental study.. Games and Economic Behavior, 76:690–710
Chernomaz, K. and D. Levin. 2012. Efficiency and synergy in a multi-unit auction with and
without package bidding: An experimental study. . Games and Economic Behavior, 76: 611–635
Clarke, E. 1971. Multi-part pricing of public goods. Public Choice 11:19-33. Cooper, D. J. and H. Fang. 2008. Understanding overbidding in second price auctions: An experimental study. Economic Journal, 118: 1572-1595. Cooper, D. J. and J. H. Kagel. 2008. Other regarding preferences: a selective survey. Working
paper. Cooper, R. W., D. DeJong, R. Forsythe, and T. Ross. 1993. Forward induction in the battle of the sexes games. American Economic Review 83:1303-1316.
4
Coppinger, V. M., V. L. Smith, and J. A. Titus. 1980. Incentives and behavior in English, Dutch and sealed-bid auctions. Economic Inquiry 43:1-22. Corns, A. and A. Schotter. 1999. Can affirmative action be cost effective? An experimental examination of price-preference auctions. American Economic Review, 89, 291-305. Cox, J. C. and V. Sadiraj. 2006. Small- and large-stakes risk aversion: implications of concavity
calibration fro decision theory. Games and Economic Behavior 56: 45-60. Cramton, P. C. 1997. The FCC spectrum auctions: An early assessment. Journal of Economics and Management Strategy 6:431-495. Cramton, P. and J. A. Schwartz. 2002. Collusive bidding in the FCC spectrum auctions. Contributions to Economic Analysis and Policy 1:1-20. Crawford, V. and N. Iriberri. 2007. Level-k auctions: Can boundedly rational strategic thinking explain the winner’s curse? Econometrica 75:1721-70. De Silva, D. G., T. Dunne, and G. Kosmopoulou. 2002. Sequential bidding in auctions of construction contracts. Economic Letters 76:239-244. Dessauer, J. P. 1981. Book publishing. New York: Bowker. Dorsey, R. and L. Razzolini. 2003. Explaining overbidding in first price auctions using controlled lotteries. Experimental Economics 6:123-140. Duffy, J. and Ochs, J. 2009. Cooperative behavior and the frequency of social interactions. . Games and Economic Behavior. 66: 785-812 Dyer, D., J. H. Kagel, and D. Levin. 1989. A comparison of naive and experienced bidders in common value offer auctions: A laboratory analysis. Economic Journal 99:108-115. Dyer, D. and J. H. Kagel. 1996. Bidding in common value auctions: How the commercial construction industry corrects for the winner’s curse. Management Science 42:1463- 1475. Elbittar, A. A.. 2009 Impact of valuation ranking information on bidding in first-price auctions: a
laboratory study. Journal of Economic Behavior and Organization 69 (1), 75-85 Eliaz, K., T. Offerman, and A. Schotter. 2008. Creating competition out of thin air: An experimental study of right-to-choose auctions. Games and Economic Behavior 62:383- 416. Elmaghraby, Wedad, Elena Katok and Natalia Santamaŕia. 2010. A laboratory investigation of
rank feedback in procurement auctions. Manufacturing & Services Operations Management 14:128-144.
5
Ely, J. C. and T. Hossain 2009. Sniping and squatting in auction markets. AEJ Microeconomics,
1: 68-96. Engelbrecht-Wiggans, R. 1987. On optimal reservation prices in auctions. Management Science 33:763-770. Engelbrecht-Wiggans, R. 1989. The effect of regret on optimal bidding in auctions. Management
Science 35:685-692 Engelbrecht-Wiggans, R. 1993. Optimal auctions revisited. Games and Economic Behavior 5:227-239. Engelbrecht-Wiggans, R. and C. M. Kahn. 1998. Multi-unit auctions with uniform prices. Economic Theory 12:227-258. Engelbrecht-Wiggans, R., J. A. List, and D. H. Reiley. 2005. Demand reduction in Multi-unit auctions: Evidence from a sportscard field experiment: Reply. American Economic
Review 95:472-476. Engelbrecht-Wiggans, R., J. A. List, and D. H. Reiley. 2006. Demand reduction in multi-unit auctions with varying numbers of bidders: Theory and evidence from a field experiment. International Economic Review, 47:203-231. Engelbrecht-Wiggans, R. and E. Katok. 2008. Regret and feedback information in first-price
sealed-bid auctions. Management Science, 54 : 808-819. Engelbrecht-Wiggans, R. and E. Katok. 2009 A direct test of risk aversion and regret in first
price sealed-bid auction. Decision Analysis, 6 : 75-86. Engelbrecht-Wiggans, R., E. Haruvy, and E. Katok. 2007 A comparison of buyer-determined and price-based multi-attribute mechanisms. Management Science, 26: 629-641.. Engelmann, D. and Grimm, V. 2009. Bidding behaviour in multi-unit auctions – An
experimental investigation and some theoretical insights. Economic Journal, 119: 855-882.
Engel, R. 2009. First price auctions, lotteries, and risk preferences across institutions. Unpublished paper.
Epstein, R., L. Henríquez, J. Catalán, G. Y. Weintraub, and C. Martínez. 2002. A combinational auction improves school meals in Chile. Interfaces 32:1-14. Eyster, E. and M. Rabin. 2005. Cursed equilibrium. Econometrica 73:1623-1672. Fehr, Ernst and Klaus M. Schmidt. 1999. A theory of fairness, competition and cooperation. Quarterly Journal of Economics, 114: 817-68.
6
Feynman, R. P. 2005. Classic Feynman: All the Adventures of a Curious Character. New York: W. W. Norton. Filiz, E. and E. Y. Ozbay. 2007. Auctions with anticipated regret. American Economic Review 97:1407-1418. Fisher R. A. 1935. The Design of Experiments Edinburgh: Oliver and Boyd.
Fréchette, G. 2012. Session effects in the laboratory. Experimental Economics, 15: 485-498 Fréchette, Guillaume R. (2010) “Laboratory Experiments: Professionals versus Students” in The
Methods of Modern Experimental Economics, Guillaume Fréchette and Andrew Schotter (editors), Oxford University Press, forthcoming.
Garratt, R., M. Walker, and J. Wooders.. 2012 Behavior in second-price auctions by highly experienced eBay buyers and sellers. Experimental Economics, 15: 44-57 Garratt, R. and T. Troeger. 2006. Speculation in Standard Auctions with Resale. Econometrica,
74: 753-769. Georganas, S. and J. H. Kagel.. 2011 Asymmetric Auctions with Resale: An Experimental Study.
Journal of Economic Theory.146: 359-371 Georganas, S., D. Levin and P. McGee. 2010. Do irrelevant payoffs affect behavior when a
dominant strategy is available: experimental evidence from second-price auctions. Ohio State University working paper.
Georganas, S. and R. Nagel. 2011. Auctions with Toeholds: An experimental study.
International Journal of Industrial Organization. .29: 34-45 Goeree, J. K., C. A. Holt, and T. R. Palfrey. 2002. Quantal response equilibrium and overbidding in private-value auctions. Journal of Economic Theory 104:247-272. Goeree, J. K. and T. Offerman. 2002. Efficiency in auctions with private and common values: An experimental study. American Economic Review 92:625-643. Goeree, J. K. and T. Offerman. 2003. Competition bidding in auctions with private and common values. Economic Journal 113:598-614. Goeree, Jacob K. and Theo Offerman. 2004. The Amsterdam auction. Econometrica, 72, 281-
294. Goeree, J. K., C. Plott, and J. Wooders. 2004. Bidders’ choice auctions: Raising revenues
through the right to choose. Journal of the European Economics Association 2:504-515. Goeree, Jacob K., Theo Offerman, and Arthur Schram. 2006. Using first-price auctions to sell
7
heterogeneous licenses. International Journal of Industrial Organization, 24: 555-581. Goeree, Jacob K. and Holt, Charles A. 2010. "Hierarchical Package Bidding: A Paper & Pencil
Combinatorial Auction." Games and Economic Behavior, 70 (1):146-169.
Goeree, J. K., T. Offerman, and R. Sloof. 2013. Demand reduction and preemptive bidding in
multi-unit license auctions. Experimental Economics, 16: 52-87 Goswami, G., T. H. Noe, and M. J. Rebello. 1996. Collusion in uniform-price auction: Experimental evidence and implications for treasury auctions. The Review of Financial Studies 9:757-785. Grebe, Tim, Radosveta Ivanova-Stenzel, Sabine Kröger. 2009. Buy-it-now prices in eBay
auctions – The field in the lab. SFB/TR 15 Discussion Paper No. 294 Grimm, V. and D. Engelmann 2005. Overbidding in first-price private value auctions revisited:
Implications of a multi-unit auctions experiment, in Advances in Public Economics: Utility, Choice and Welfare, U. Schmidt and S. Traub (eds). Dordrecht: Springer, pp 235-54.
Groves, T. 1973. Incentives in teams. Econometrica 41:617-631. Güth, W., R. Ivanova-Stenzel, and E. Wolfstetter. 2005. Bidding behavior in asymmetric auctions: An experimental study. European Economic Review 49:1891-1913. Hafalir, I. E. and V. Krishna. 2008. Asymmetric Auctions with Resale. American Economic
Review, 98: 87-112. Haile, P. A. 2003. Auctions with Private Uncertainty and Resale Opportunities. Journal of
Economic Theory, 108: 72-110. Ham, J. C., J. H. Kagel, and S. F. Lehrer. 2005. Randomization, endogeneity and laboratory experiments: The role of cash balances in private value auctions. Journal of Econometrics 125:175-205. Hansen, R. G. and J. R. Lott, Jr. 1991. The winner’s curse and public information in common value auctions: Comment. American Economic Review 81:347-61. Haruvy, Ernan and Elena Katok. 2013 Increasing revenue by decreasing information in
procurement auctions. Production and Operations Management, 22: 19-35
Harrison, G. W. and J. A. List. 2008. Naturally occurring markets and exogenous laboratory experiments: A case study of the winner’s curse,” Economic Journal, 118: 822-843.
Hausch, D. B. 1987. An asymmetric common value auction model. RAND Journal of Economics 18:611-621.
8
Hendricks, K., R. H. Porter, and C. A. Wilson. 1994. Auctions for oil and gas leases with an informed bidder and a random reservation price. Econometrica. 62:1415-1444. Holt, C. and S. Laury. 2002. Risk aversion and incentive effects. American Economic Review 92,
1644-1655. Holt, C. A. Jr. and R. Sherman. 1994. The loser’s curse and bidder’s bias. American Economic Review 84:642-652. Hu, Y, Kagel, J. H., Xu, X., and Ye, L. 2013. Theoretical and Experimental Analysis of Auctions
with Negative Externalities. Games and Economic Behavior 82: 269-91. Isaac, R. M. and D. James. 2000a. Just who are you calling risk averse? Journal of Risk and Uncertainty. 20:177-187. Isaac, R. M. and D. James. 2000b. Robustness of the incentive compatible combinatorial auction. Experimental Economics 3:31-53. Isaac, R. M. and J. M. Walker. 1985. Information and conspiracy in sealed bid auctions. Journal
of Economic Behavior and Organization 6: 139-159. Isaac, R. Mark, Timothy C. Salmon and Arthur Zillante. 2005. An experimental test of
Alternative models of bidding in ascending auctions. International Journal of Game Theory, 33, 287-313.
Ivanov, A., D. Levin, and M. Niederle. 2010. Can relaxation of beliefs rationalize the winner’s
curse?: an experimental study. Econometrica 78: 1435-1452. Ivanova-Stenzel, Radosveta and Sabine Kröger. 2008. Price formation in a sequential selling
mechanism. Journal of Economic Behavior & Organization, 67, 832-843. Ivanova-Stenzal, R., and T. C. Salmon. 2008. Revenue equivalence revisited. . Games and Economic Behavior, 64: 171-192 James, D. 2007. Stability of risk preference parameter estimates within the Becker-DeGroot-
Marschak procedure. Experimental Economics, 10, 123-142. Jap, S. D. 2002. Online reverse auctions: issues, themes and prospects for the future. Journal of
Academic Marketing Science 30: 506-525. Jofre-Bonet, M. and M. Pesendorfer, 2000. Bidding behavior in a repeated procurement auction. Euorpean Economic Review Revised 44:1006-1020. Jofre-Bonet, M. and M. Pesendorfer, 2003. Estimation of a dynamic auction game. Econometrica 71:1443-1489.
9
Johnson-Laird, P. N. 1999. Deductive reasoning. Annual Review of Psychology 50:109-135. Kagel, J. H. and D. Levin. 1986. The winner’s curse and public information in common value auctions. American Economic Review 76:894-920. Kagel, J. H., R. M. Harstad, and D. Levin. 1987. Information impact and allocation rules in auctions with affiliated private values: A laboratory study. Econometrica 55:1275-1304. Kagel, J. H. and D. Levin. 1991. The winner’s curse and public information in common value auctions: Reply. American Economic Review 81:362-369. Kagel, J. H. and D. Levin. 1993. Independent private value auctions: Bidder behavior in first-, second- and third-price auctions with varying numbers of bidders. Economic Journal 103:868-879. Kagel, J. H. and D. Levin. 1999. Common value auctions with insider information. Econometrica 67:1219-1238. Kagel, J. H., S. Kinross, and D. Levin. 2001. Comparing efficient multi-object auction institutions. Working paper, Ohio State University. Kagel, J. H. and D. Levin. 2001. Behavior in multi-unit demand auctions: Experiments with uniform price and dynamic Vickery auctions. Econometrica 69:413-454. Kagel, J. H. and J. F. Richard. 2001. Super-experienced bidders in first-price common value auctions: Rules of thumb, Nash equilibrium bidding and the winner’s curse. Review of Economics and Statistics 83:408-419. Kagel, J. H. and D. Levin. 2002. Bidding in common value auctions: A survey of experimental research. In Common Value Auctions and the Winner’s Curse. Princeton University Press. Kagel, J. H. and D. Levin. 2005. Multi-unit demand auctions with synergies: Behavior in sealed- bid versus ascending-bid uniform-price auctions. Games and Economic Behavior 53:170-207. Kagel, J. H., S. Pevnitskaya, and L. Ye. 2008. Indicative bidding: An experimental analysis. Games and Economic Behavior 62:697-721. Kagel, J. H., Y. Lien, and P. Milgrom. 2010. Ascending prices and package bidding: An experimental analysis. American Economic Journal: Microeconomics 2: 160-85. Kagel, J. H., Y. Lien, and P. Milgrom. 2014. Ascending Prices and Package Bidding: Further Experimental Analysis. Games and Economic Behavior 85: 210-231.
10
Kagel, J. H., S. Pevnitskaya, and L. Ye. 2007. Survival auctions. Economic Theory 33:103-119. Kagel, J. H. and D. Levin. 2009. Implementing efficient multi-object auction institutions: An experimental study of the performance of boundedly rational agents. Games and Economic Behavior 66:221-237. Kagel, J. H. 1995. Auctions: a survey of experimental research. In The Handbook of
Experimental Economics, Alvin E. Roth and John H. Kagel, Editors, Princeton University Press.
Katok, E. and A. E. Roth. 2004. Auctions of homogeneous goods with increasing returns: Experimental comparison of alternative “Dutch” auctions. Management Science 50:1044-1063. Keser, C. and M. Olson. 1996. Experimental examination of the declining-price anomaly. In Economics of the Arts: Selected Essays. V. Ginsburg and P-M Menger (eds). Amsterdam: Elsevier. Klemperer, P. 1998. Auctions with almost common values: The ‘Wallet Game’ and its applications. European Economic Review 42:757-769. Klemperer, P. 2002. How (not) to run auctions: The European 3G Telecom auctions. European Economic Review 46:829-845. Krishna, V. 2002. Auction Theory. Academic Press. Kwasnica, A. M. and K. Sherstyuk. 2007. Collusion and equilibrium selection in auctions. Economic Journal, 117: 120-145. Lange, A., J. A. List, and M. K. Price.. 2011 Auctions with Resale When Private Values Are
Uncertain: Theory and Empirical Evidence. International Journal of Industrial Organization, 29: 54-64.
Leufkens, K., R. Peeters, and M. Vorsatz. 2006. Sequential auctions with synergies: An
experimental study. METEOR Research Memorandum 06/040, Maastricht University. Levin, D. 1990. Horizontal mergers: The 50 percent benchmark. American Economic Review 80:1238-1245. Levin, D. 2005. Demand reduction in Multi-unit auctions: Evidence from a sportscard field experiment: A comment. American Economic Review 95:467-471. Levin, D. and J. Smith. 1994. Equilibrium in auctions with entry. American Economic Review 84:585-599. Levin, D., J. H. Kagel, and J. F. Richard. 1996. Revenue effects and information processing in English common value auctions. American Economic Review 86:442-460.
11
Levin, D. and J. H. Kagel. 2005. Almost common-value auctions revisited. European Economic Review 49:1125-1136. Li, J. and C. R. Plott.. 2009. Tacit collusion in auctions and conditions for its facilitation and prevention: Equilibrium selection in laboratory experimental markets. Economic Inquiry, 47 (3), 425-448 Lind, B. and C. R. Plott. 1991. The winner’s curse: Experiments with buyers and with sellers. American Economic Review 81:335-346. List, J. A. and D. Lucking-Reiley. 2000. Demand reduction in multi-unit auctions: Evidence from a sportscard field experiment. American Economic Review 90:961-972. Loomes, G. and R. Sugden. 1982. Regret theory: An alternative theory of rational choice under uncertainty. Economic Journal 92:805-824. Lucking-Reiley, D. 1999. Using field experiments to test equivalence between auction formats: Magic on the Internet. American Economic Review 89:1063-1080. Manelli, A. M., M. Sefton, and B. S. Wilner. 2006. Multi-unit auctions: A comparison of static and dynamic mechanisms. Journal of Economic Behavior and Organization 61: 304-23. Maskin, E. and J. Riley. 2000. Asymmetric auctions. Review of Economic Studies 67:413-438. Mathews, T. 2003. The impact of discounting on an auction with a buy-out option: A theoretical analysis motivated by eBay’s Buy-It-Now feature. Journal of Economics (Zietschrift für Nationalökonomie) 81:25-52. McAfee, R. P. and J. McMillan. 1987. Auctions with entry. Economic Letters 23:343-347. McAfee, R. P. and D. Vincent. 1993. The declining price anomaly. Journal Economic Theory 60:191-212. Mellers, B. A. and A. D. J. Cooke. 1996. The role of task and context in preference measurement. Psychological Science 7:76-82. Menezes, F. M. and P. K. Monteiro. 1998. Simultaneous pooled auctions. Journal of Real Estate Finance and Economics 17:219-232. Menkhaus, D. J., O. R. Phillips and K.T. Coatney. 2003. Shared agents and competition in laboratory English auctions. American Journal of Agricultural Economics 85:829-839. Morgan, J. 2002. Combinatorial auctions in the information age: an experimental study. Advances in Applied Microeconomics 11:191-207. Myerson, E. 1981. Optimal auction design. Mathematics of Operations Research. 6:58-73.
12
Neugebauer, T. and R. Selten. 2006. Individual behavior and first-price auctions: The importance of information feedback in computerized experimental markets. Games and Economic Behavior 54:183-204. Neugebauer, T. and P. Pezanis-Christou. 2007. Bidding behavior at sequential first-price auctions with(out) supply uncertainty: A laboratory analysis. Journal of Economic Behavior & Organization 63: 55-72. Niederle, M. and L. Vesterlund. 2007. Do women shy away from competition? Quarterly
Journal of Economics 122:1067-1101.
Ochs, J. 1995. Coordination problems. In J. H. Kagel and A. E. Roth (ed) Handbook of Experimental Economics. Princeton University Press, Princeton. 195-251. Ockenfels, A. and R. Selten. 2005. Impulse balance equilibrium and feedback in first price
Auctions. Games and Economic Behavior 51: 155-170. Ockenfels, A., D. H. Reiley and A. Sadrich. 2006. Online auctions. In Handbook of Information Systems. T. Hendershott (ed). Elsevier, xxxx. 571-628. Offerman, T. and J. Potters. 2006. Does auctioning of entry licenses induce collusion? An experimental study. Review of Economic Studies 73:769-791. Pagnozzi, M, and K. J. Saral. 2014 “Multi-object auctions with resale: an experimental analysis.” Working paper, Università di Napoli Frederico II. Palfrey, T. and S. Pevnitskaya. 2008. Endogenous entry and self-selection in private value auctions: An experimental study. Journal of Economic Behavior and Organization 66:731-747. Pezanis-Christou, P. 2002. On the impact of low-balling: Experimental results in asymmetric auctions. International Journal of Game Theory 31:69-89. Phillips, O. R., D. J. Menkhaus, and K. T. Coatney. 2003. Collusive practices in repeated English auctions: Experimental evidence on bidding rings. American Economic Review 93:965-979. Phillips, O. R. and D. J. Menkhaus. 2009. Maintaining tacit collusion in repeated ascending
auctions. Journal of law and Economics 52: 91-110. Pitchik C. and A. Schotter. 1988. Perfect equilibria in budget-constrained sequential auctions: An experimental study. Rand Journal of Economics 19:363-388.
13
Porter, D. and R. Vragov. 2006. An experimental examination of demand reduction in multi-unit versions of the uniform-price, Vickery, and English auctions. Managerial and Decision Economics 27:445-458. Rabin, M. 2000. Risk aversion and expected utility theory. Econometrica 68:1281-1292. Rapoport, A., D. Seale, I. Erev, and J. Sundali. 1998. Equilibrium play in large group market entry games. Management Science 44:119-141. Reynolds, S. S. and J. Wooders. 2009. Auctions with a buy price. Economic Theory 38: 9-39. Riley, J. G. and W. F. Samuelson. 1981. Optimal auctions. American Economic Review 71:381-392. Robert, J. and C. Montmarquette. 1999. Sequential auctions with multi-unit demand: Theory, experiments and simulations. CIRANO working paper, 99s-46. Roll R. 1986. The hubris hypothesis of corporate takeovers. Journal of Business 59:197-216. Rose, S. L. and J. H. Kagel. 2008. Bidding in almost common value auctions: An experiment. Journal of Economic Management Strategy17: 1041-1058. Rose, S. L. and D. Levin. 2008. An experimental investigation of the explosive effect in almost
common value auctions. Journal of Economic Behavior and Organization, 67: 927-946. Roth, A. E. and A. Ockenfels. 2002. Last-minute bidding and the rules for ending second-price auctions: Evidence from eBay and Amazon auctions on the internet. American Economic Review 92:1093-1103. Sade, O., C. Schnitzlein, and J. F. Zender. 2006. Competition and cooperation in divisible good auctions: An experimental examination. Review of Financial Studies 19:195-235. Salmon, T. C. and B. J. Wilson. 2008. Second chance offers versus sequential auctions: Theory and behavior. Economic Theory 34:47-67. Salmon, T. C. and M. Iachini. 2007. Continuous ascending vs. pooled multiple unit auctions. Games and Economic Behavior 61:67-85. Salomon, G. and D. N. Perkins. 1989. Rocky roads to transfer: Rethinking mechanisms of a neglected phenomenon. Education Psychologist 24:113-142. Samuelson, W.F. and M.H. Bazerman. 1985. The winner’s curse in bilateral negotiations, in V.L. Smith (ed.), Research in Experimental Economics, 3. Greenwich, CT.: JAI Press.
14
Scheffel, Tobias, Ziegler, Georg, and Martin Bichler. 2012. "On the impact of package selection in
combinatorial auctions: an experimental study in the context of spectrum design." Experimental
Economics, 15: 4, pp. 667-692.
Shahriar, Q. and J. Wooders.. 2011 An experimental study of auctions with a buy price under
private and common values.. Games and Economic Behavior. 72 (2), 558-573 Shachat, Jason and J. Todd Swarthout. 2010. Procurement auctions for differential goods. Decision Analysis, 7: 6-22. Shogren, J. F., G. M. Parkhurst, and C. McIntosh. 2006. Second-price auction tournament. Economics Letters 92:99-107. Smith, J. 1982. Equilibrium patterns of bidding in OCS lease sales. Economic Inquiry 20:180-190. Smith, J. L. 1984. Further results on equilibrium patterns of bidding in OCS lease sales. Economic Inquiry 22:142-146. Smith, J. and D. Levin. 2001. Entry coordination in auctions and social welfare: An experimental investigation. International Journal of Game Theory 30:321-350. Tor, A and M. H. Bazerman. 2003. Focusing failures in competitive environments: Explaining decision errors in the Monty Hall game, the acquiring a company game, and multiparty ultimatums. Journal of Behavioral Decision Making 16:353-374. Turocy, T. L. and E. Watson.. 2012. Reservation values and regret in laboratory first-price
auctions:Context and bidding behavior. Southern Economic Journal 78(4): 1163-1180. . Turocy, T. L., E. Watson and R. C. Battalio. 2007. Framing the first-price auction. Experimental Economics 10:37-52. Tversky, A. and D. Kahneman. 1992. Advances in prospect theory: Cumulative representation of uncertainty. Journal of Risk and Unvertainty 5:297-323. Walker, J. M., V. L. Smith, and J. C. Cox. 1987. Bidding behavior in first-price sealed-bid auctions: Use of computerized Nash competitors. Economic Letters 23:239-244. Whinston, M. D. 2006. Lectures on Antitrust Economics. MIT Press. Wilson, B. R. 1967. Insider competitive bidding with asymmetric information. Management Science 13:816-820. Vickrey, W. 1961. Counterspeculation, auctions, and competitive sealed tenders. Journal of Finance 16:8-37.
15
Wan, Zhixi, Damian R. Beil, and Elena Katok.2012. When does it pay to delay supplier
qualification? Theory and experiments. Management Science 58 (11), pp. 2057-2075 Weber, R. J. 1983. Multiple-object auctions, in Auctions, Bidding and Contracting: Uses and
Theory, R. E. Engelbrecht-Wiggans, M. Shubik, and R. Stark (eds). New York University Press.
Ye, L. 2004. Optimal auctions with endogenous entry. Contributions to Theoretical Economics 4:1-27.
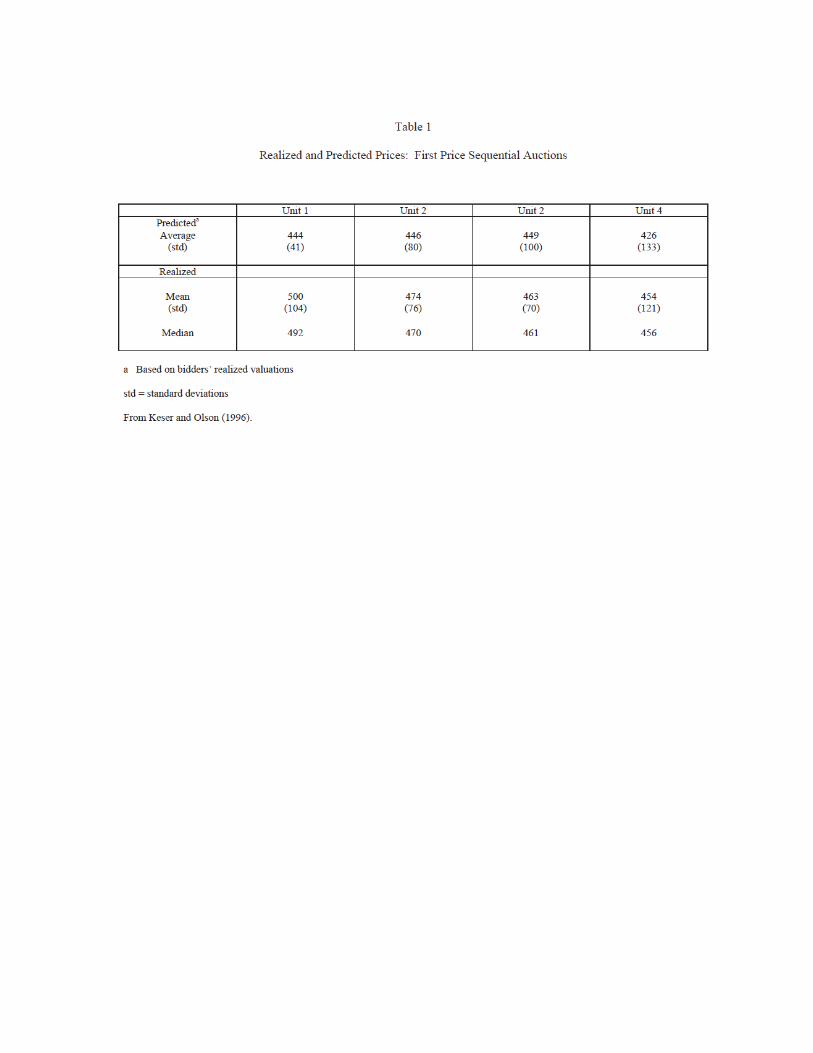
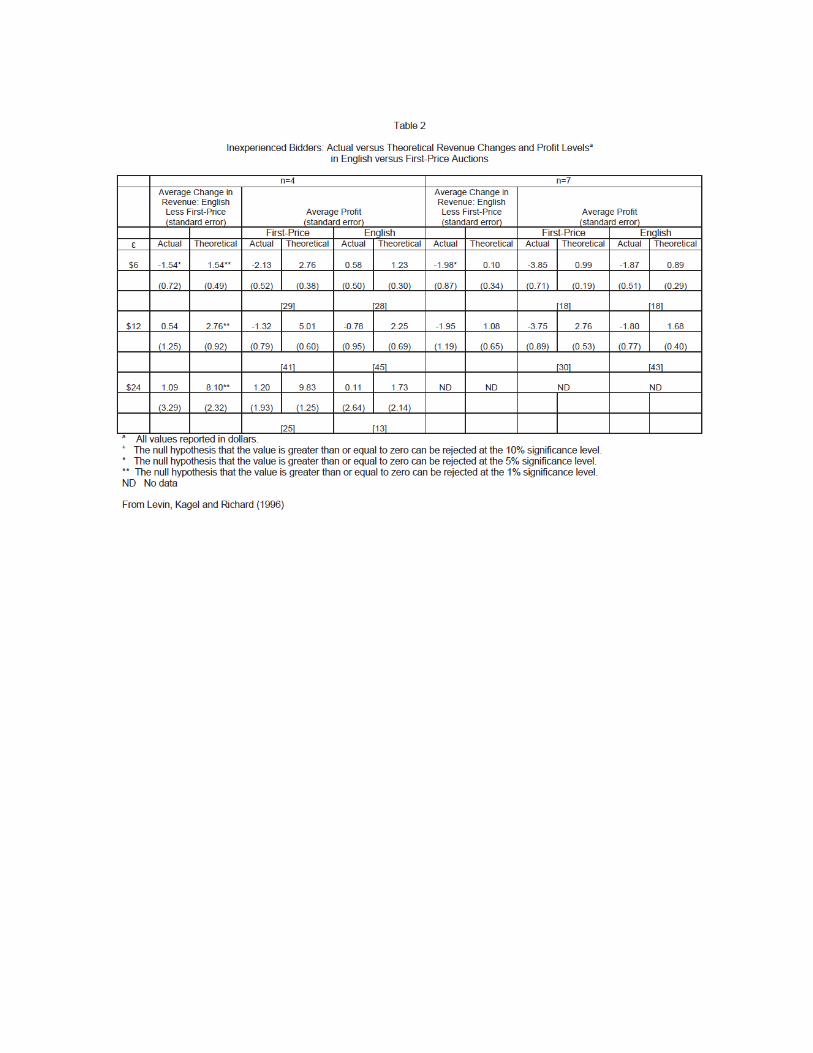
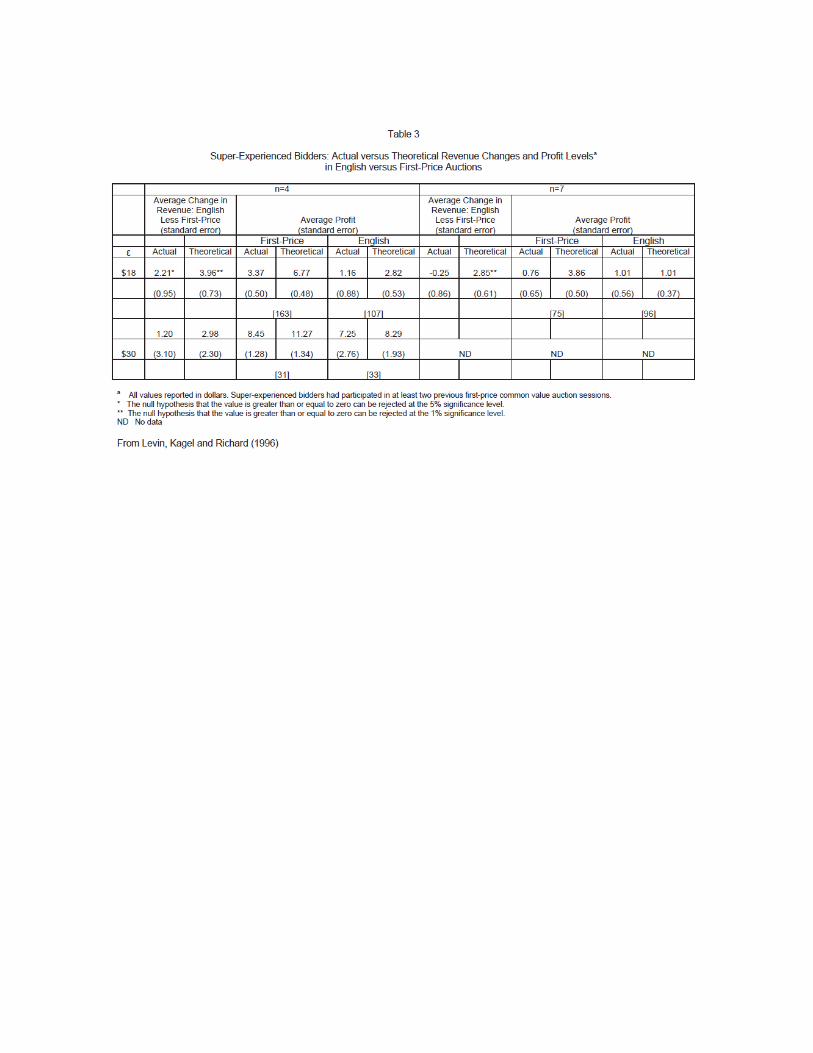
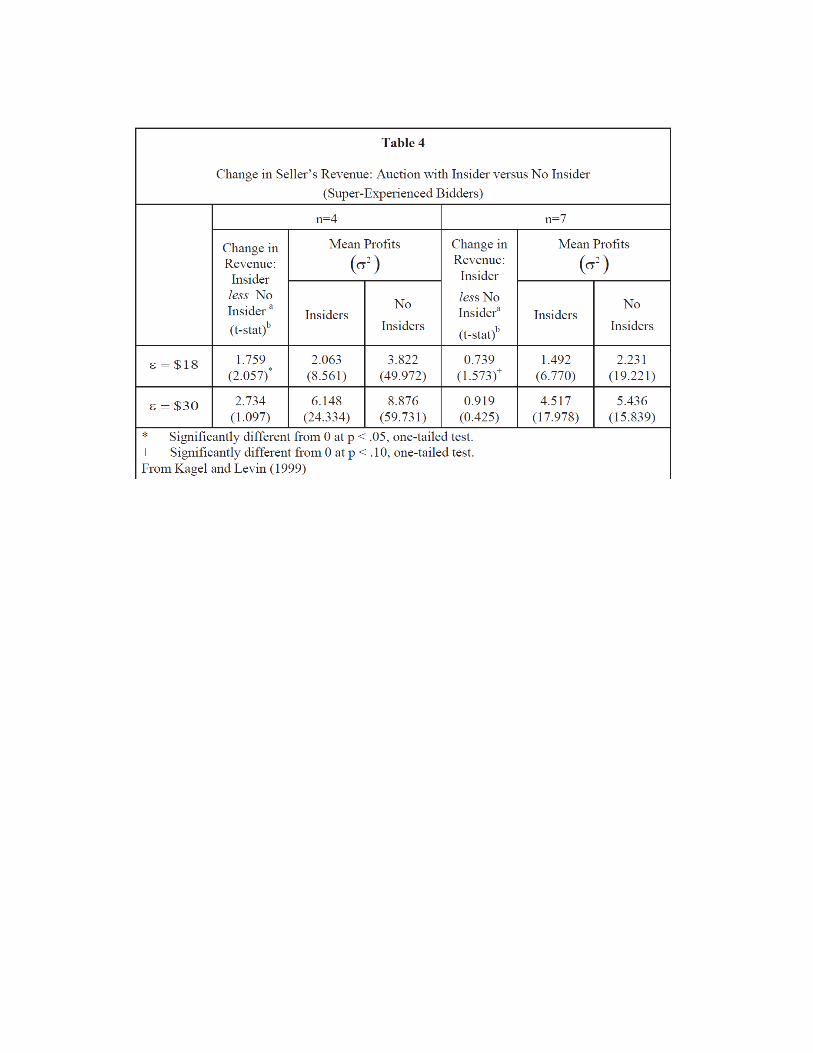
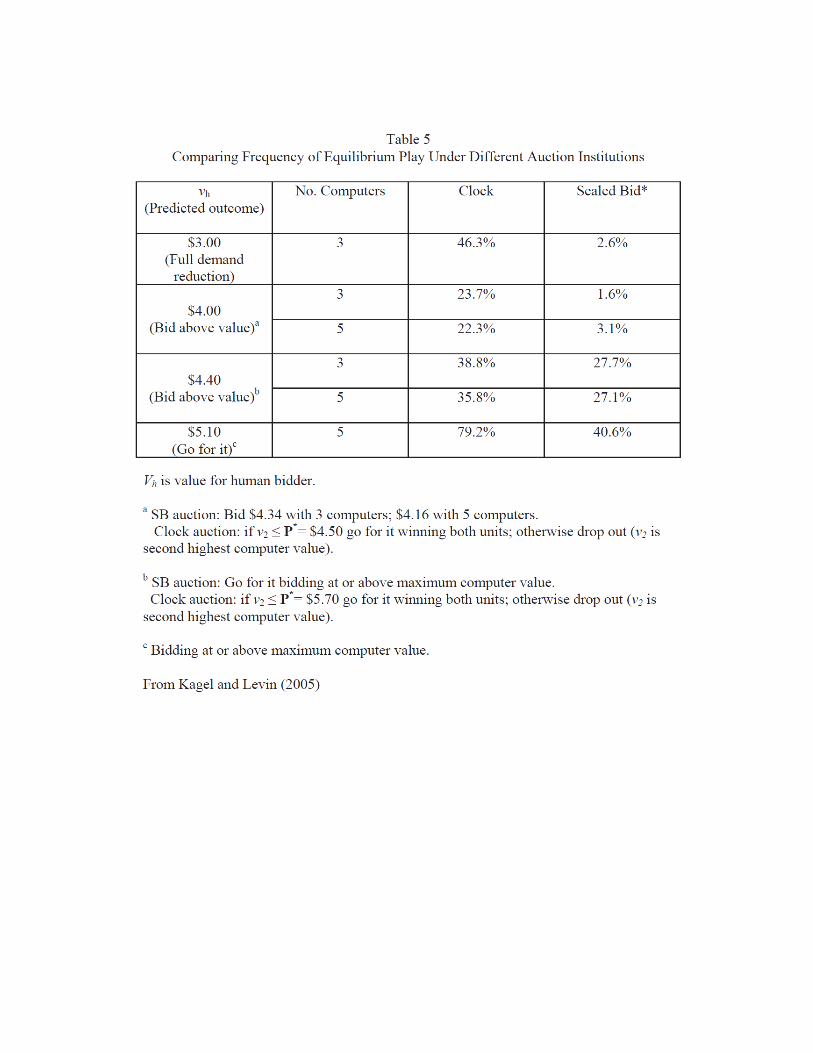
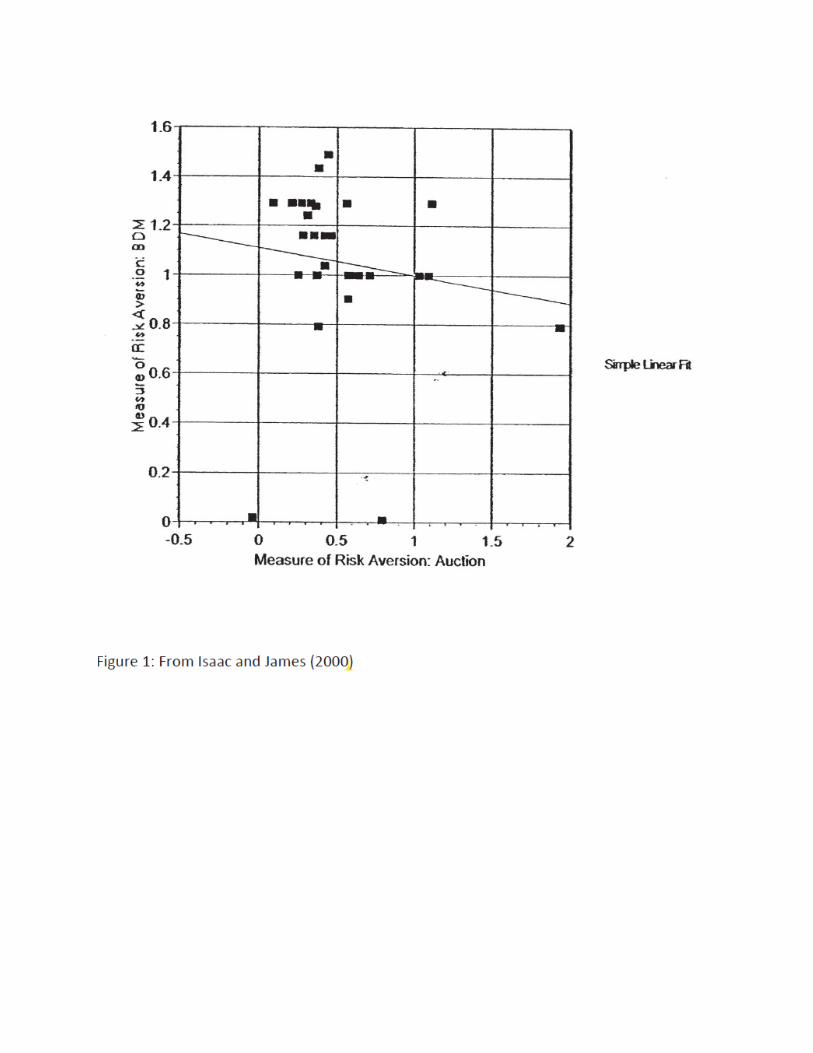
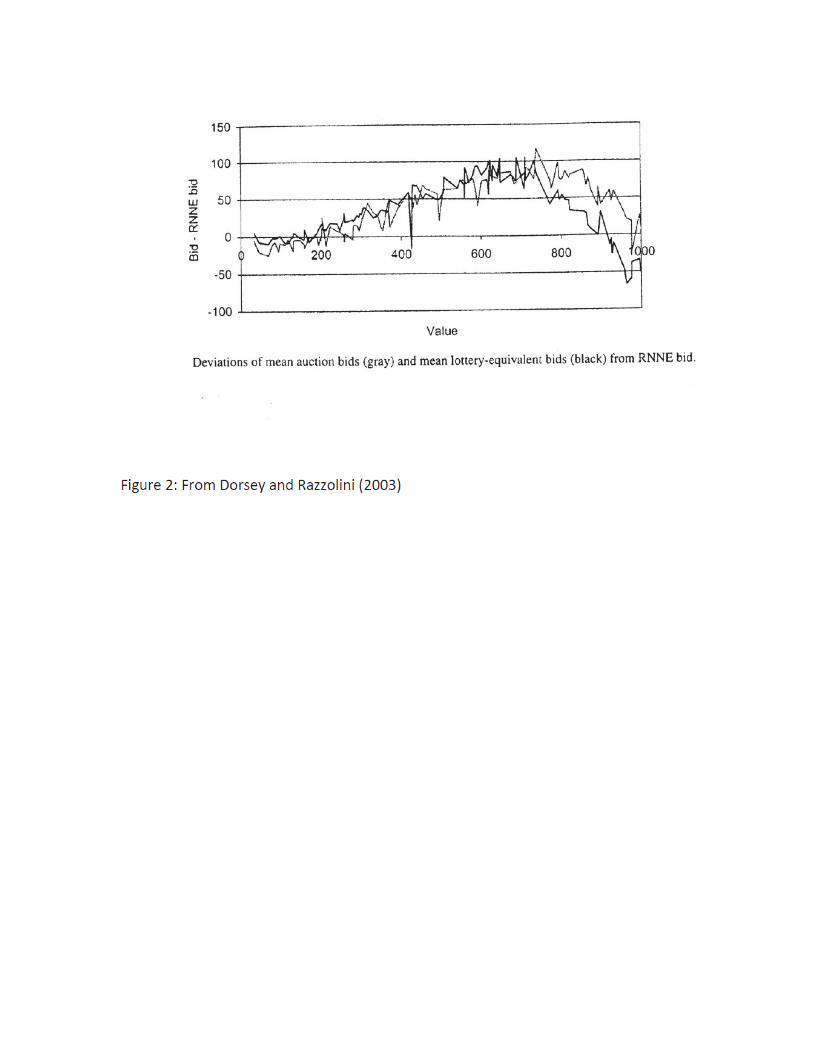
Figure 3: Bids and values in second-price internet auctions. From Garrat, Walker and Wooders (2012)
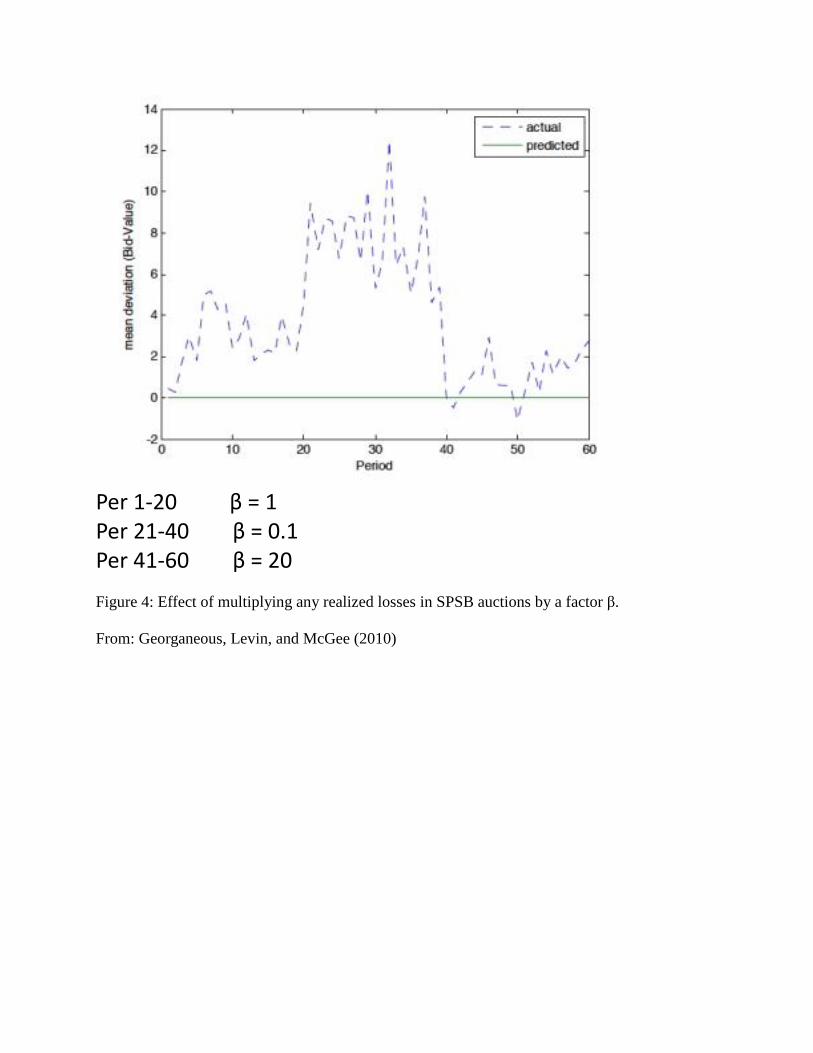
Per 1-20 β = 1
Per 21-40 β = 0.1
Per 41-60 β = 20
Figure 4: Effect of multiplying any realized losses in SPSB auctions by a factor β.
From: Georganeous, Levin, and McGee (2010)
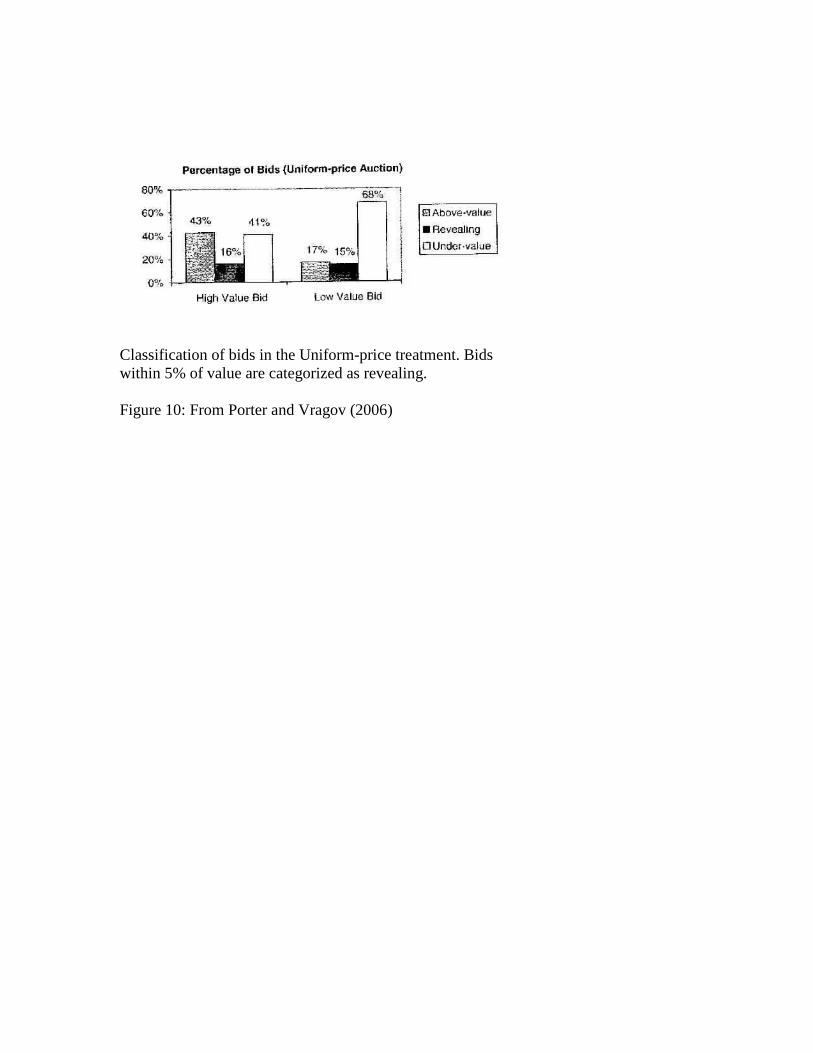
Classification of bids in the Uniform-price treatment. Bids within 5% of value are categorized as revealing. Figure 10: From Porter and Vragov (2006)
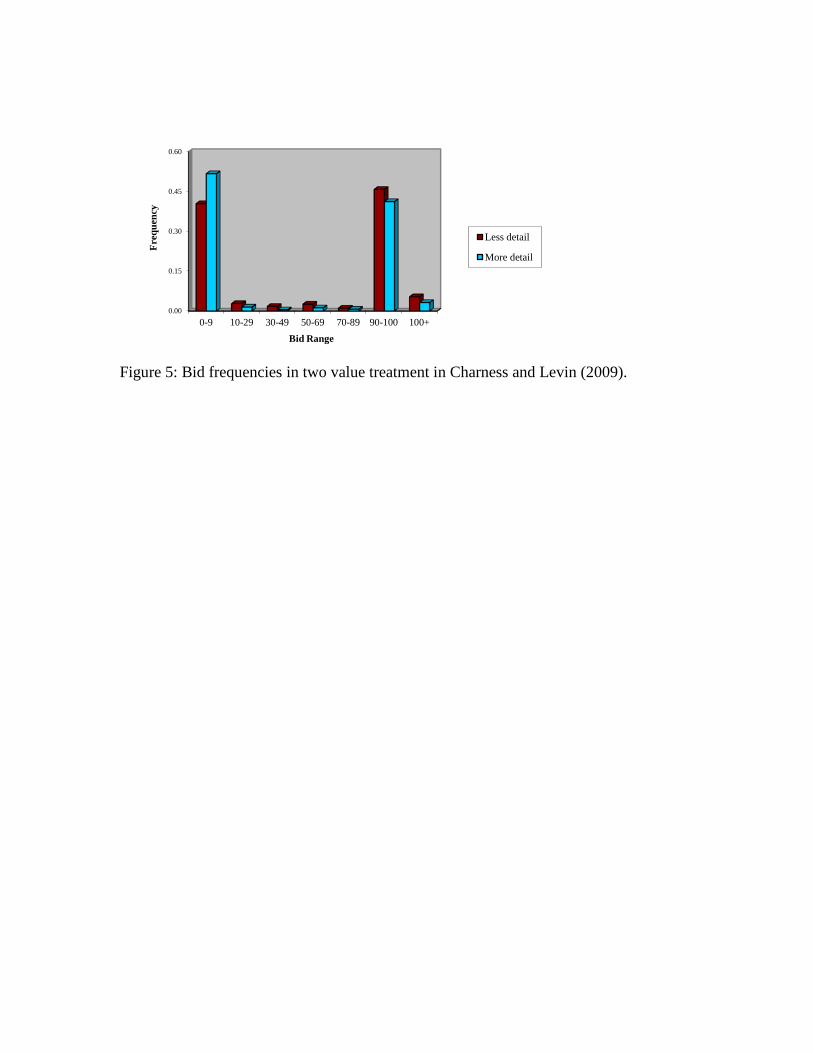
Figure 5: Bid frequencies in two value treatment in Charness and Levin (2009).
0.00
0.15
0.30
0.45
0.60
0-9 10-29 30-49 50-69 70-89 90-100 100+
Freq
uenc
y
Bid Range
Less detail
More detail
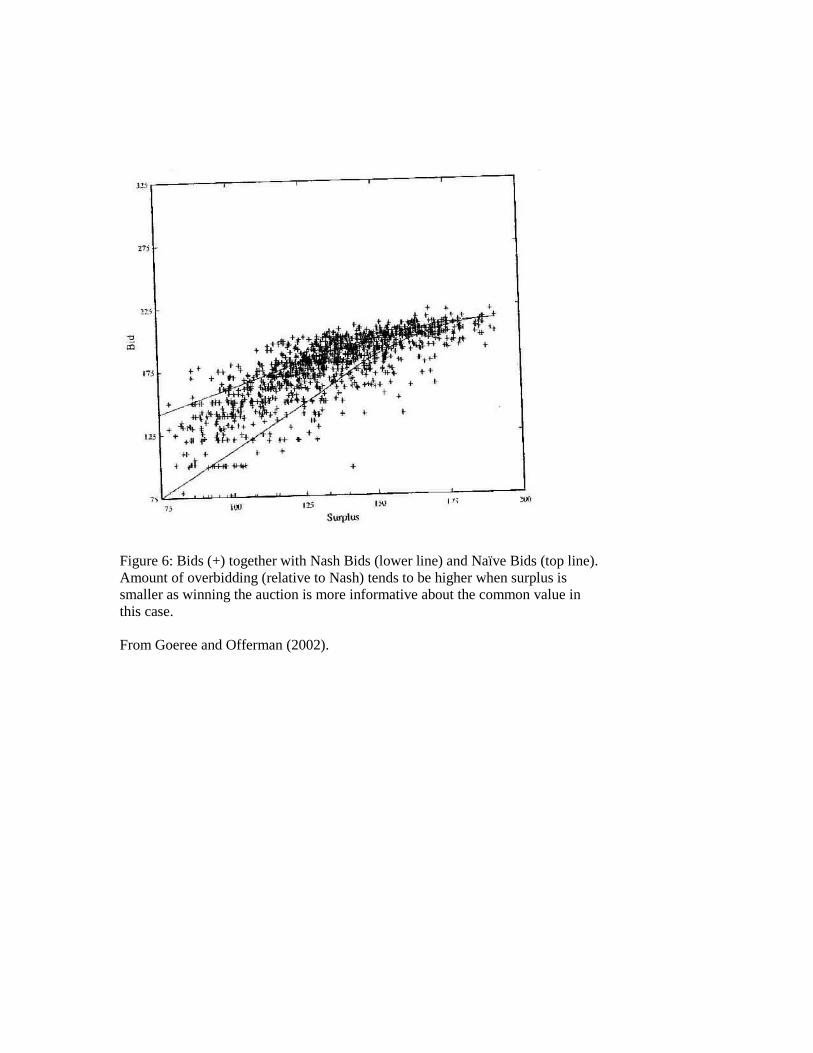
Figure 6: Bids (+) together with Nash Bids (lower line) and Naïve Bids (top line). Amount of overbidding (relative to Nash) tends to be higher when surplus is smaller as winning the auction is more informative about the common value in this case. From Goeree and Offerman (2002).
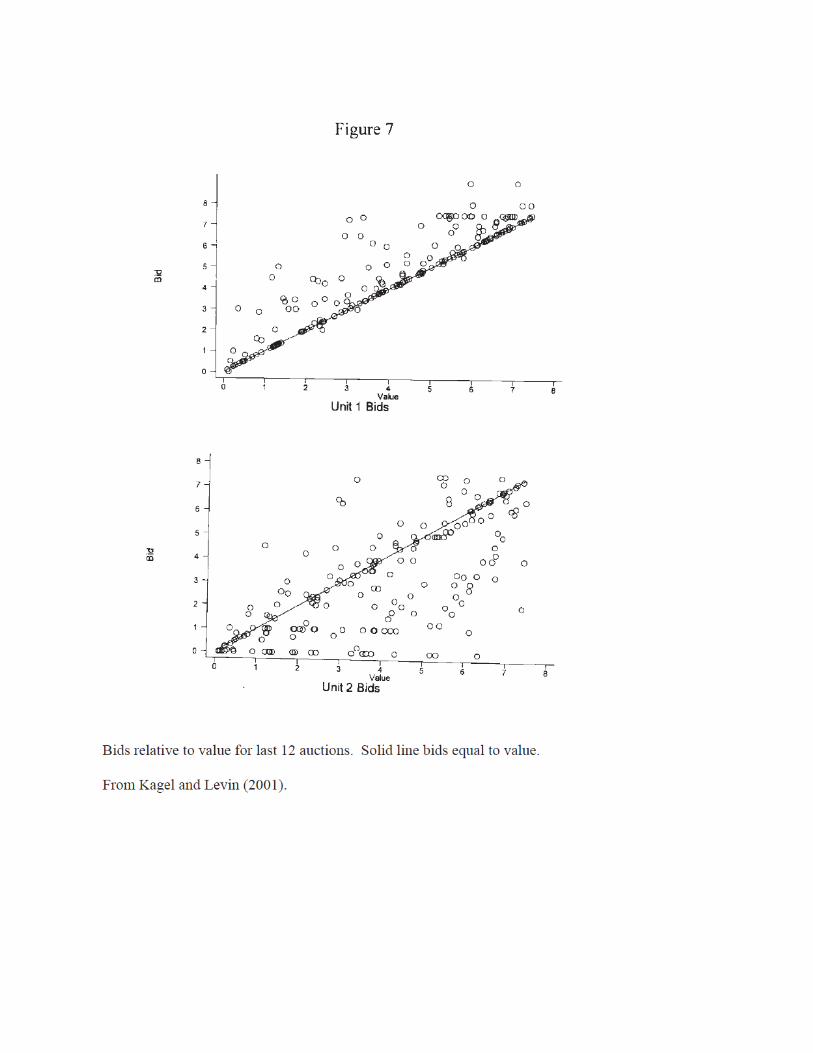
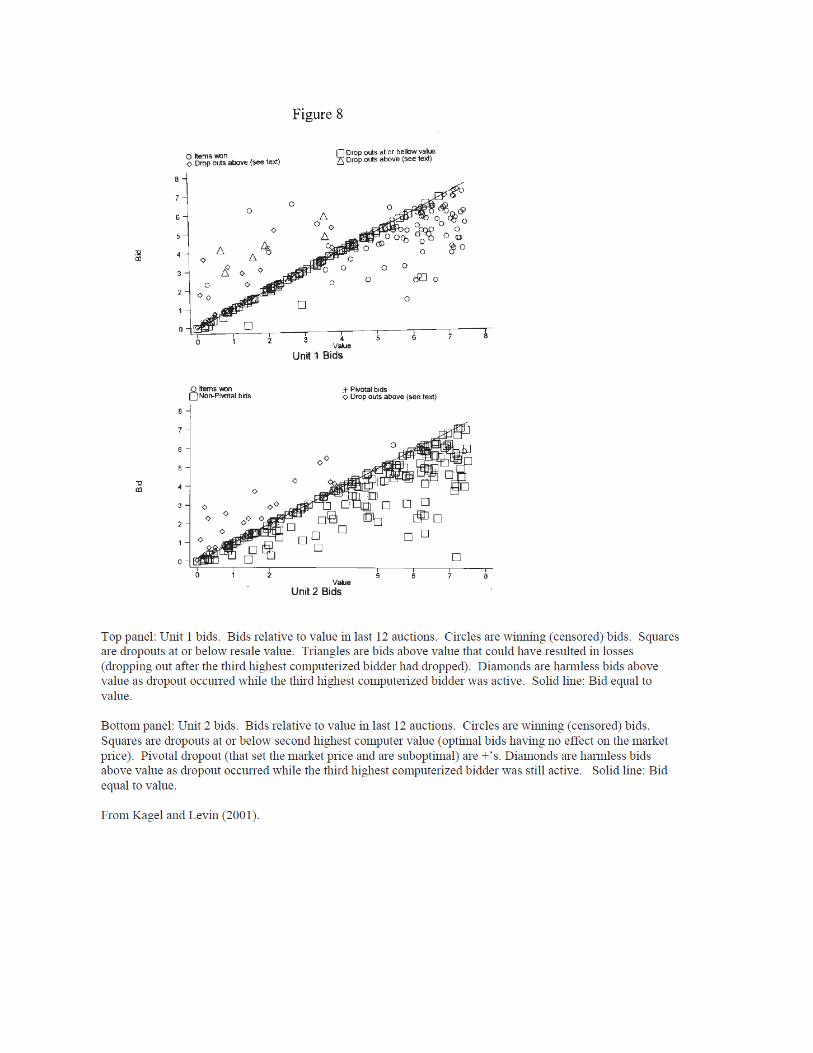
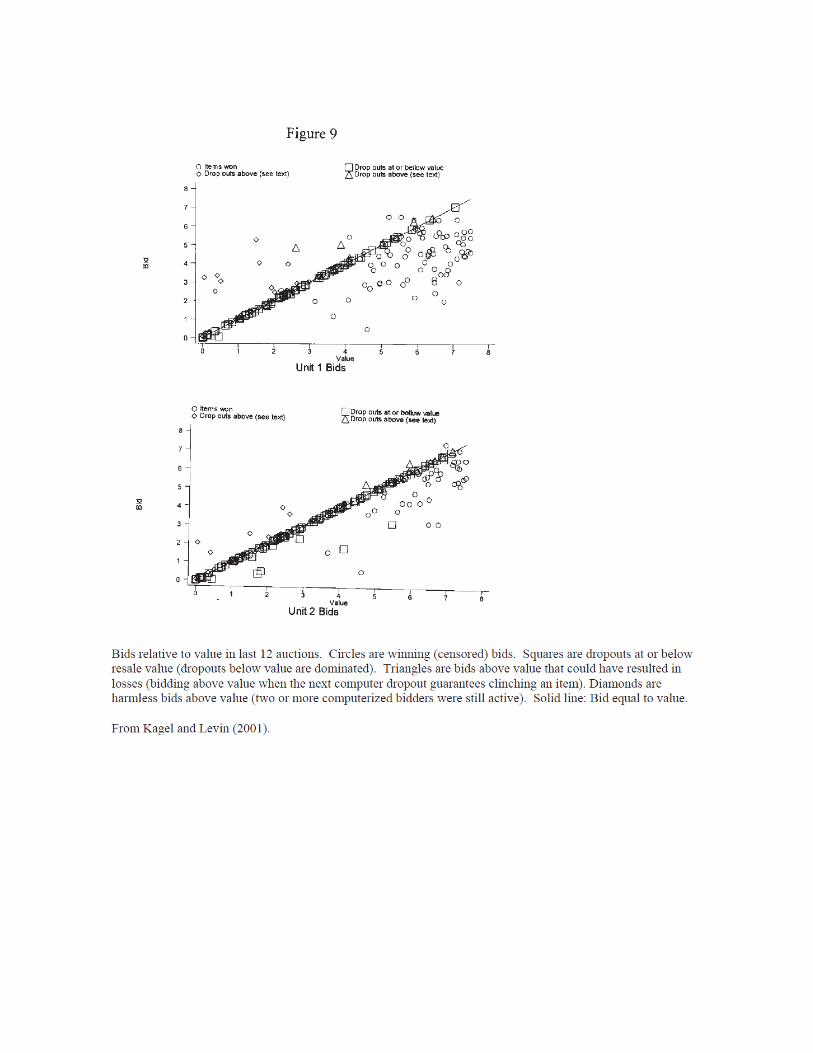

Classification of bids in the Uniform-price treatment. Bids within 5% of value are categorized as revealing. Figure 10: From Porter and Vragov (2006)
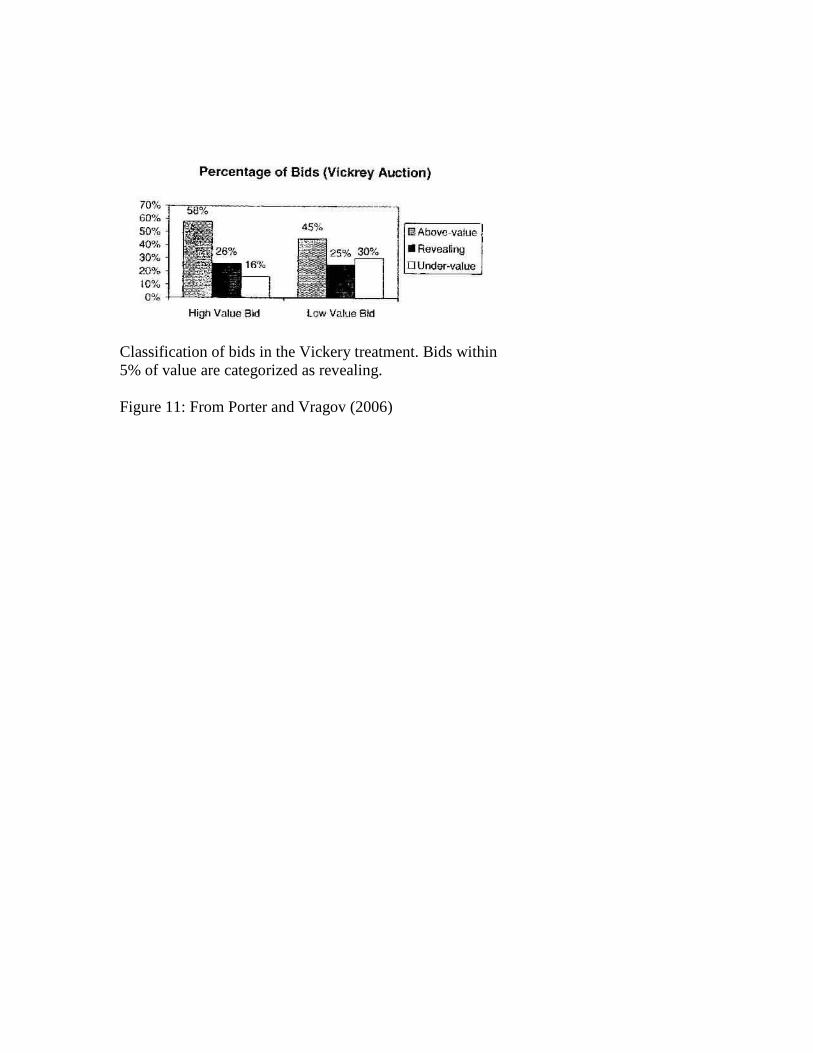
Classification of bids in the Vickery treatment. Bids within 5% of value are categorized as revealing. Figure 11: From Porter and Vragov (2006)
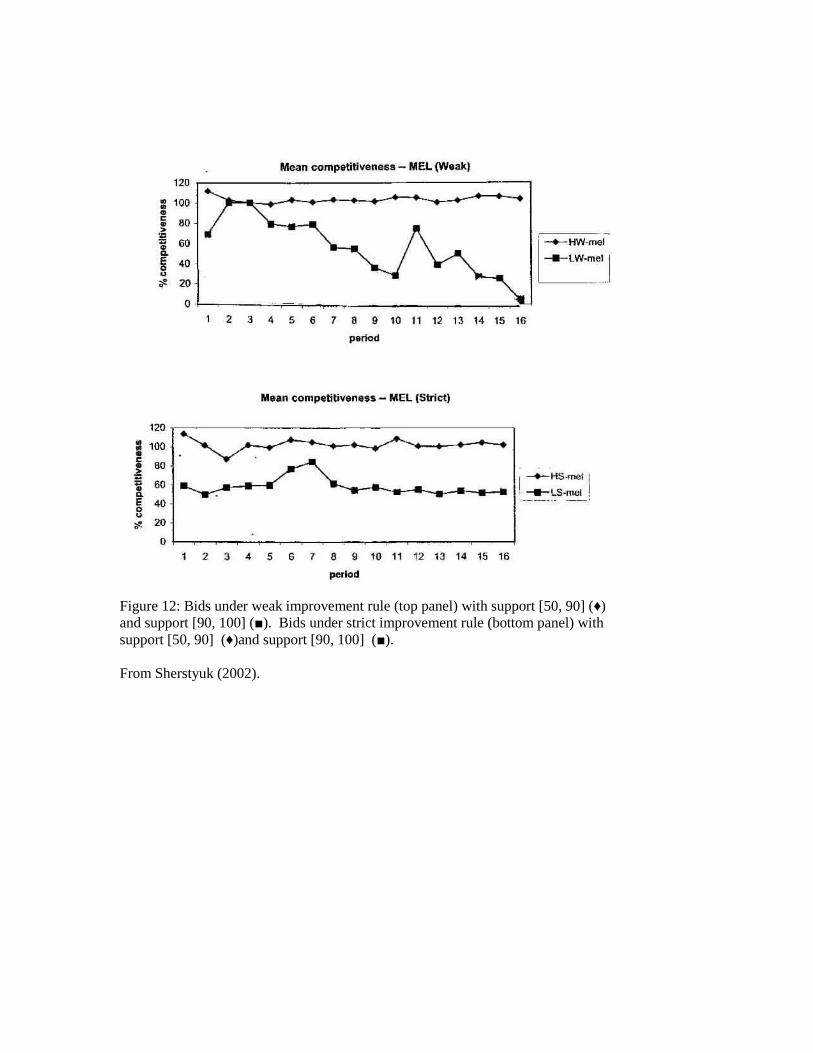
Figure 12: Bids under weak improvement rule (top panel) with support [50, 90] (♦) and support [90, 100] (■). Bids under strict improvement rule (bottom panel) with support [50, 90] (♦)and support [90, 100] (■). From Sherstyuk (2002).
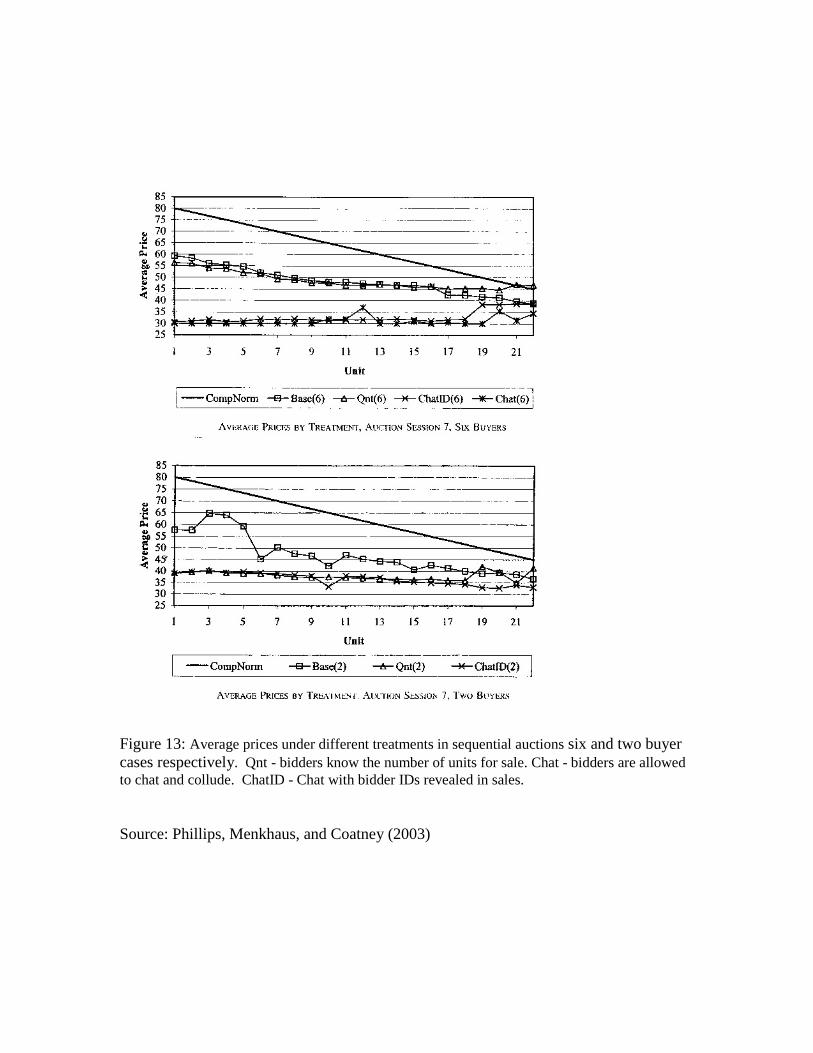
Figure 13: Average prices under different treatments in sequential auctions six and two buyer cases respectively. Qnt - bidders know the number of units for sale. Chat - bidders are allowed to chat and collude. ChatID - Chat with bidder IDs revealed in sales. Source: Phillips, Menkhaus, and Coatney (2003)
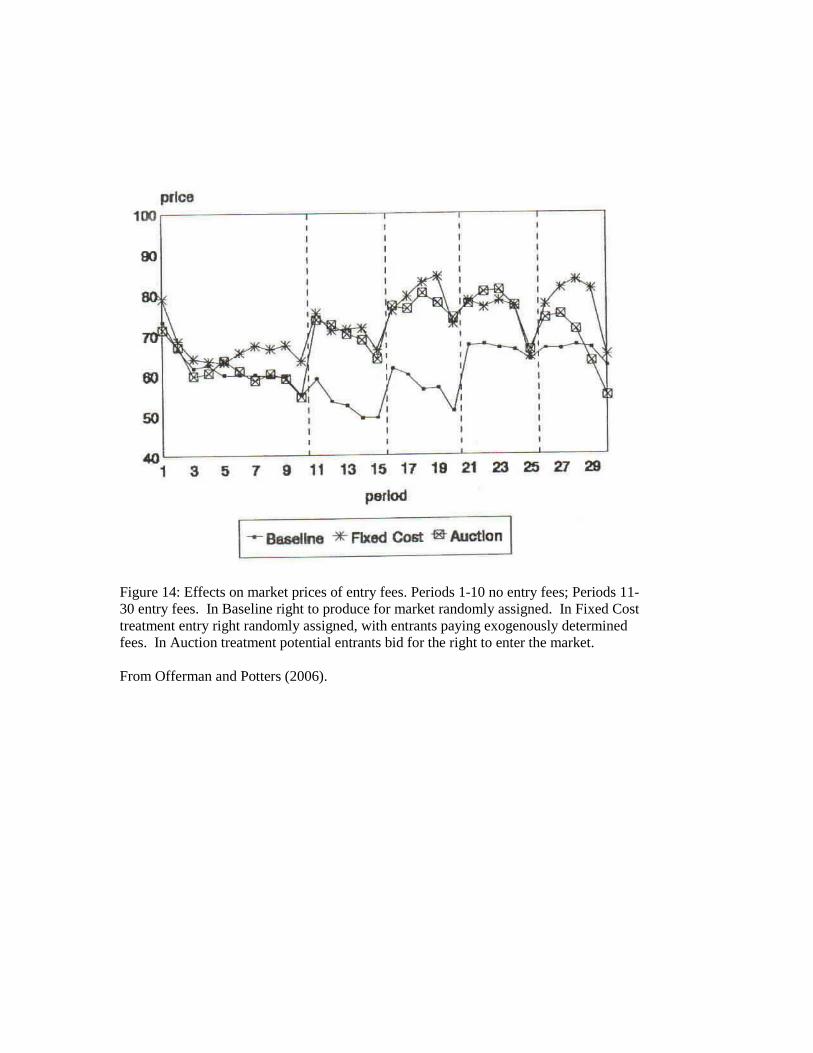
Figure 14: Effects on market prices of entry fees. Periods 1-10 no entry fees; Periods 11- 30 entry fees. In Baseline right to produce for market randomly assigned. In Fixed Cost treatment entry right randomly assigned, with entrants paying exogenously determined fees. In Auction treatment potential entrants bid for the right to enter the market. From Offerman and Potters (2006).


![Auctions with Resale Opportunities: An Experimental StudyMore recently, Georganas [4] and Jabs-Saral [12] have studied English auctions with resale using experiments. While Georganas](https://img.pdfslide.us/doc/110x75/60d28e1285c227190248211b/auctions-with-resale-opportunities-an-experimental-more-recently-georganas-4.jpg)