Embed Size (px)
Citation preview
Auburn University Series 3-2000
Economics of Poultry Litter Utilization and Optimal Environmental Policy for PhosphorusDisposal in Georgia1
Krishna P. Paudel Visiting Assistant Professor
Department of Agricultural Economics and Rural SociologyComer 209B
Auburn University AL 36849, USA
Christopher S. McIntoshAssociate Professor
Department of Agricultural Economics and Rural SociologyUniversity of Idaho
Idaho Falls, ID 83402, USA
1 This paper was presented as a selected paper at the annual meeting of Southern AgriculturalEconomics Association meeting held in Lexington, KY, on January 29 - February 2, 2000.
Abstract:
Poultry litter can be used as plant nutrients or cattle feed. Both of these alternatives may increasephosphorus concentration in the nearby watershed. Use of phosphorus consistent litterapplication rule in nutrient management combined with permit system has potential to curtail theover production of litter and prevent the possible contamination of water.
Economics of Poultry Litter Utilization and Optimal Environmental Policy for PhosphorusDisposal in Georgia
The poultry industry generates about 12 billion dollars in revenue (with 29,910,000 total
chickens) to the state of Georgia and ranks as the number one agricultural industry in the state
(NASS). Based on the total value generated from the poultry industry, Georgia ranks as the
number one poultry producer in the United States. The poultry industry is responsible for 50
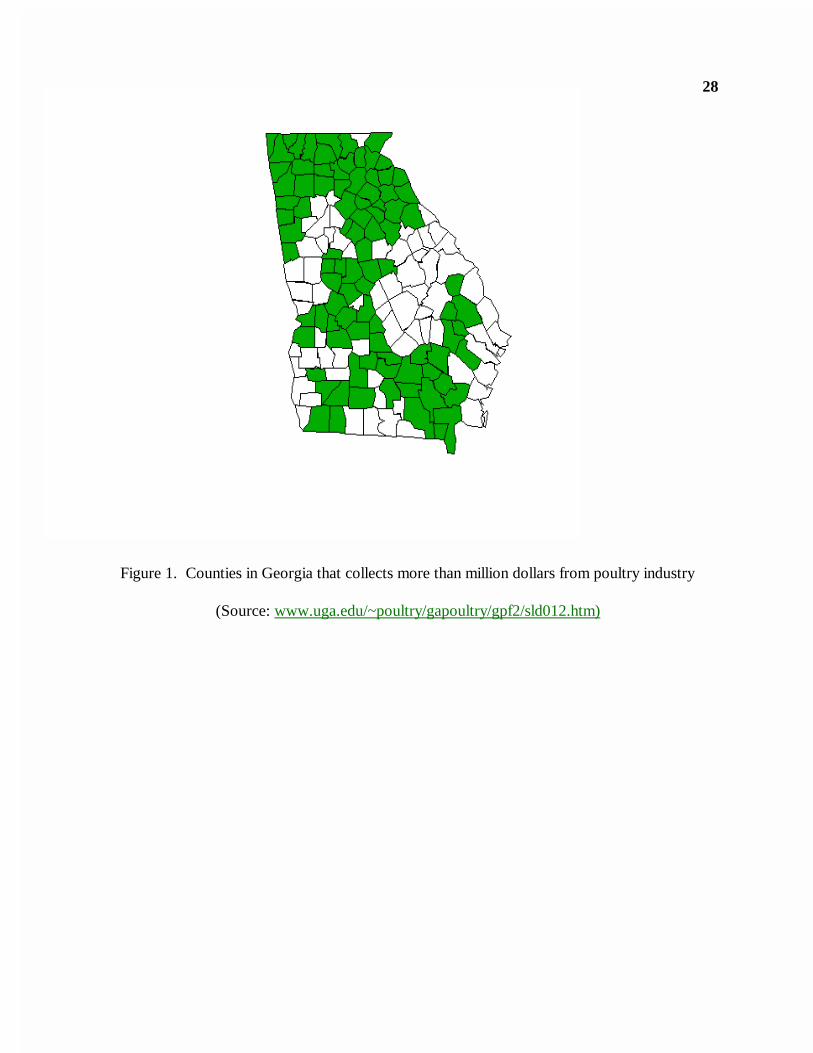
percent of the total GDP generated from agricultural enterprises in Georgia. More than half of
the counties in Georgia produce poultry products worth more than one million dollars (figure 1).
With this large amount of poultry production comes problems in disposing of the byproducts;
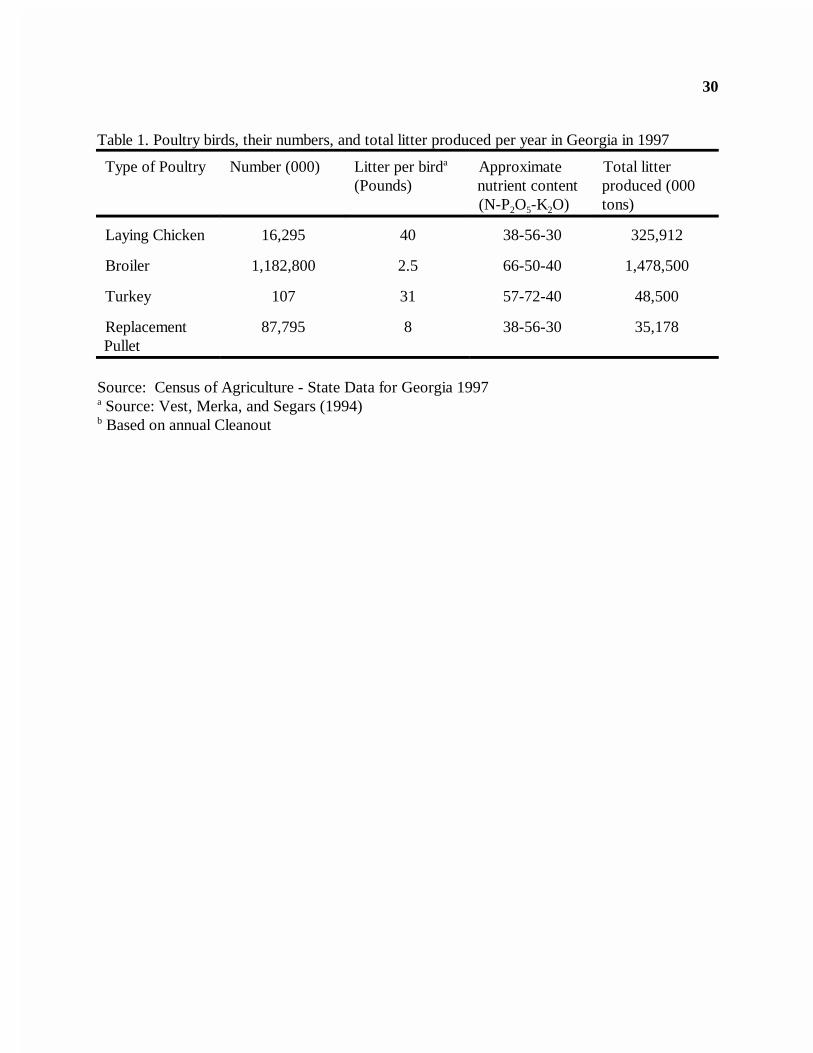
litter and dead chickens. The Georgia poultry industry produces about 1.83 million tons of litter
every year (table 1). The main problem associated with these byproducts is the lack of proper
ways to dispose this huge amount of litter. In this paper, we will analyze the possible alternatives
for poultry litter disposal and examine the economic and environmental benefits associated with
them. The poultry industry in Georgia includes the production of broiler, layers, pullets, and
turkeys. Of these, broiler production is the largest in terms of animal numbers, revenue
generated, and the amount of litter produced. Thus we will focus our analysis on the disposal of
broiler litter.
The broiler industry generates 39 percent of total GDP in the state of Georgia. The top
five counties in the state, based on the sale of broilers, are Franklin, Banks, Madison, Gordon, and
2
Habersham. Approximately 46 percent of the total broiler production is concentrated in an eight
county area of the central Piedmont region of Georgia. This has led to an ever increasing and
fairly localized stock of broiler litter that threatens the safety of both surface and ground water.
The locally concentrated production of poultry waste is a problem to both private and public
sectors in this region. The long term environmentally consistent alternative utilization of poultry
waste will determine the profitability and stability of poultry farms in this concentrated area. There
is also a positive benefit associated with poultry litter as there exists a profitable opportunity for
the processing and marketing of this by-product.
Poultry litter is rich in the major plant nutrients, nitrogen, phosphorus, and potash.
Poultry litter can, therefore, be used as a substitute for chemical fertilizers in the production of
row crops and pasture grasses. The substitution of poultry litter for chemical fertilizers can
provide benefits in two ways, it provides the needed plant nutrients and has potential to increase
soil productivity due to continuous addition of an organic source of nutrients. Since most of the
nutrients applied by poultry litter are not extracted in the same year as applied, the carryover of
nutrients from one year to another must be considered. In this analysis, we will compare the costs
and revenue of applying poultry litter versus chemical fertilizers in the production of the major
row crop grown in Georgia (cotton).
Other alternative uses of poultry litters include its use as a livestock feed, as a fuel source
and as a plant bedding material. We examine the costs associated with processing poultry litter
for selected alternative uses in an effort to determine the most profitable use of poultry litter. We
also calculate the alternative use of poultry litter which provides the maximum revenue to the
poultry farmers with the minimum environment pollution.
3
In this study, we examine environmentally benign methods for disposal of poultry litter in
cattle feed and as a source of nutrients in crop production. We then suggest few policy
instruments to aid in controlling poultry litter disposal for amounts beyond what is required for
crop production and cattle feed in the state.
Poultry Litter as Fertilizer
The alternative use of poultry litter requiring the least value-added processing is as a
source of plant nutrients. Poultry litter can be considered the most valuable of animal wastes
because of its low moisture and high nutrient content. The average amount of nitrogen,
phosphorus and potash (N-P-K) in broiler litter was estimated to be 3-3-2 (Wood). The average
amounts of the major nutrients (N-P-K) present in the different classes of poultry litter are shown
in table 1. Significant amounts of secondary plant nutrients are also found in broiler litter. Any
kind of poultry litter can be used as source of plant nutrients although broiler litter is by far the
most plentiful.
The value of broiler litter in crop production is generally based on nitrogen content. Most
of the nitrogen in poultry litter is not immediately available to plants because it exists in an organic
form. Nitrogen gets carried over even after two years poultry litter application. When litter is
applied according to the nitrogen requirement of the crop, phosphorus gets over-applied. This
results in potential leaching of nitrogen and leaching and runoff of phosphorus which are
detrimental to surface and ground water quality. However, if litter is applied according to the
phosphorus requirements of the crop, both problems can be ameliorated. If litter is applied to
match the phosphorus needs of the crop, then remaining amount of nitrogen not supplied by
poultry litter could be supplied using inorganic fertilizers. The most economical nutrient
4
management strategy is applying poultry litter based on the minimum amount of the major
nutrient needed for crop production. A phosphorus-consistent policy has been implemented in
Texas where the threshold phosphorus concentration in the soil is set at 200 ppm. At levels
beyond this threshold, phosphorus application is based on the amounts of major nutrients that the
crop takes out of the soil during the growing season.
Due to the low nutrient content of litter, and thus high volumes required, it is not
economical to transport poultry litter long distances for use as a source of plant nutrients.
Therefore, most of the litter produced in Georgia is currently applied to pasture or row crops
located near the poultry production facilities. As shown in the figure 1, poultry production occurs
in almost every county in the state, although a higher concentration occurs in the northern part of
the state. Carpenter states that more than 90 percent of all poultry wastes are directly land
applied. Another option for processing and disposal of litter would be to compost the litter The
problem with composting is that the process results in a loss of nutrients, especially nitrogen.
This loss in nutrient content effectively reduces the value of the litter and may make composting
unprofitable for broiler producers. This view is supported by Vervoort and Keeler who found
that unless environmental constraints are considered, it is not profitable to compost poultry litter.
The most environmentally benign and economically relevant disposal option for poultry
litter is that of land application based on soil phosphorus levels and plant phosphorus needs. A
relevant question, therefore, is how far can poultry litter be transported to apply as sources of
plant nutrients based on the phosphorus need of a crop. Bosch and Napit studied the economic
viability of transporting broiler litter from counties of surplus to counties of deficit supply. They
first look at the situation where litter is applied to all crop and pasture land. They also examine a
5
scenario where litter is applied only in 50 percent of total crop area available. The results of this
study show that the value of litter as a fertilizer was higher than the costs associated with the
transfer of litter even to a distance of 50 miles. Additional savings could be obtained if poultry
litter is applied according to phosphorus content.
Donald et al. used the rule of thumb and estimated the amount of litter produced by
broilers to be around 0.5 to 0.7 pounds per pound of meat produced. Under Alabama growing
conditions, they found that broilers produced 0.52 pounds of litter per pound of meat. With a
total of 5.9 billion pounds of broilers produced in Georgia during 1997, this would equal 3.07
billion pounds of litter.
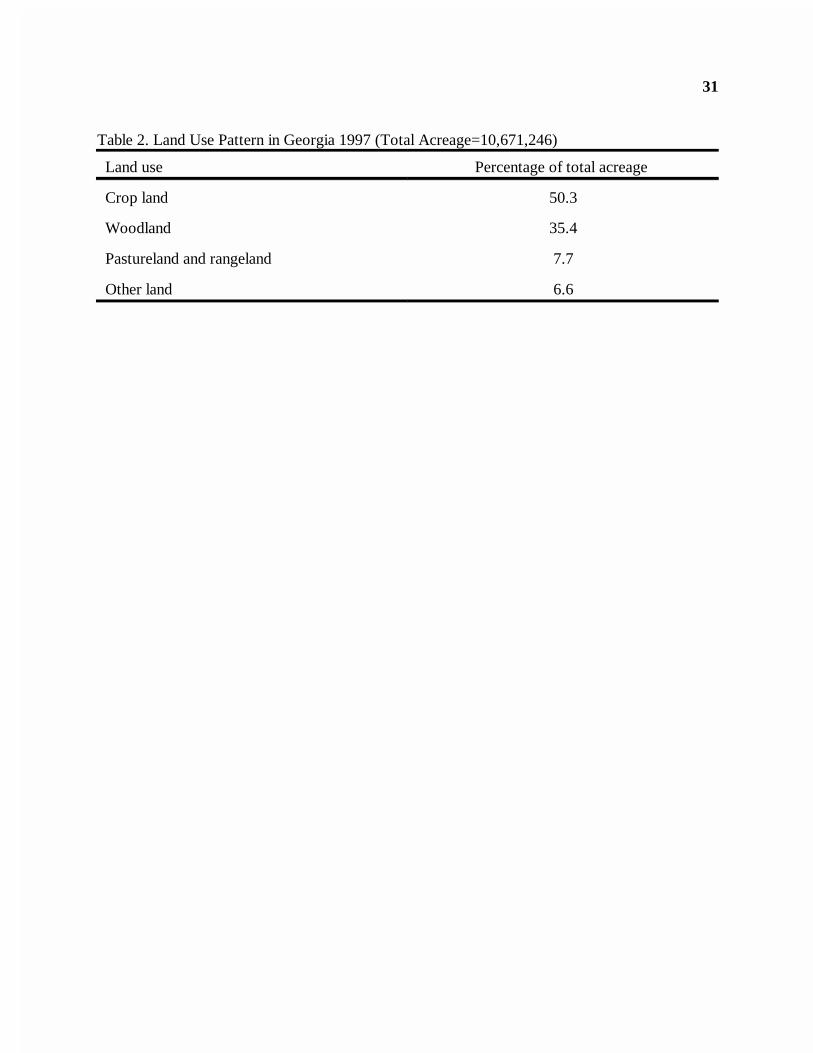
Currently, poultry litter is applied to about half of the crop production area in north
Georgia (Givan). The total crop land acreage in Georgia was 5,367,637 in 1997. Pasture and
range land account for 7.7 percent of the total land acreage in the state (table 2). Both pasture
and crop land are currently receiving applications of poultry litter. According to Givan almost all
poultry producers use poultry litter to fertilizer their land. The amount of litter application per
acre is traditionally based on nutrient content in the litter.
The nutrient content of litter varies due to moisture, temperature, amount and kind of
litter, the amount of soil picked up in cleaning up house, the number of flocks of broilers fed on
the litter and the conditions under which manure was stored and handled before spreading.
Mitchell et al. analyzed samples of poultry litter with 20 percent moisture content obtained from
147 broiler houses over 11 years and found the percentage of nitrogen (N), phosphorus (P2O5)
and potash (K2O) to be 3.9, 3.7, and 2.5 percent, respectively.
Based on this result the fresh sample of broiler litter will contain 3.1-3.0-2.0 or 60:60:40
6
pounds of N-P2O5 -K2O ton of poultry litter. As stated before, not all nutrients are available to
the crop when broiler litter is applied. Here, we will assume that broiler litter is broadcast applied
to the crop or field. When litter is applied this way, only 75 percent of the inorganic nitrogen
(ammonium nitrogen) is available to crop. We assume the inorganic nitrogen content in the litter
to be around 0.9 percent while the organic nitrogen is about 2.2 percent (Mitchell, Donald, and
Payne). We also assume that organic nitrogen from litter is available only 50 percent in the first
year, 12 percent in the second year, and 5 percent in the third year. In addition, it is assumed that
phosphorus and potash are available only 75 percent of the original application amount. These
assumptions are consistent with the previous studies (Mitchell, Donald, and Payne; Hammond,
Segars, and Goul).
Due to the concern over phosphorus run-off and eutrophication, litter should be applied to
crops based on the phosphorus content of the litter and soil, and the phosphorous needs of the
crop. This will help to overcome the criticism of poultry litter application and its link to
phosphorus pollution in nearby water sources.
Land Application Potential in Georgia
Cotton is a major row crop in Georgia. It accounts for 8 percent of total GDP generated
by agricultural enterprises in the state. Continuous application of chemical fertilizer and
conventional tillage has reduced the productivity in cotton in Georgia (Trimble; Paudel). Poultry
litter application helps to enhance soil productivity as it is a source of organic matter in soil.
Continuous application of poultry litter can enhance the productivity of soil and help to maintain a
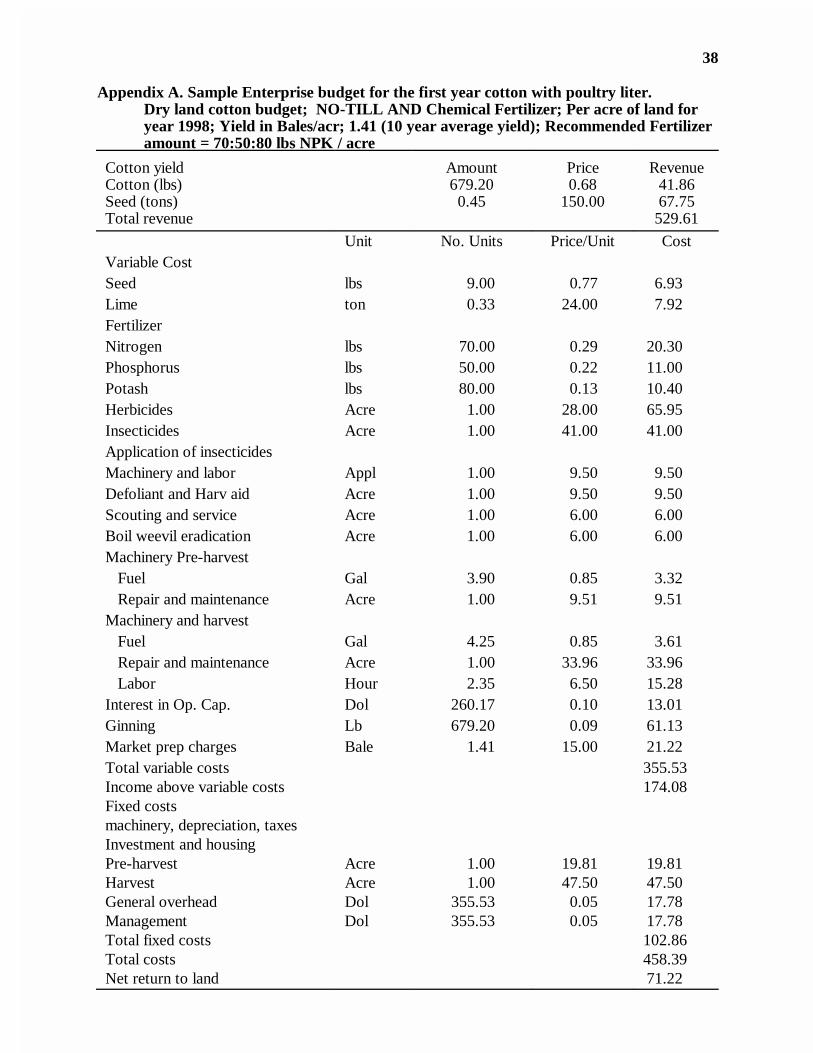
favorable soil structure. To examine the economics of applying litter to cotton, and because of a
7
three-year assumption for complete nutrient recovery, cotton enterprise budgets were prepared
for a three year application cycle. In addition to utilization of litter, it is suggested that no-till
practices be used to reduce phosphorous runoff. We analyze net returns and break-even
transportation distances under two scenarios - application of poultry litter consistent with
phosphorus levels with no-till and application of chemical fertilizer with no-till in cotton.
A specific assumption used in preparing the enterprise budgets is that poultry litter is
applied on an average size cotton farm in Georgia. It is assumed that these farms have all
necessary farm machinery and equipment. Litter transportation cost in the Georgia Piedmont area
is $0.10 per ton per mile (Kriesel, McIntosh, and Miller) . The cost of litter is $10 per ton
(GASS). The University of Georgia Cooperative Extension Service recommends that nitrogen,
phosphorus, and potash in the Piedmont region for dryland cotton be applied at the rate of
70:50:80 pounds per acre of N-P2O5 -K2O.
If it is assumed that poultry litter supplies nutrients as well as improves soil structures due
to increase organic matter, soil productivity should increase if poultry litter is applied continuously
at a responsible rate. Paudel reports that an increase in organic matter by 1 percent increases
input efficiency which boosts yield by 3 percent. Assuming that organic matter in the Piedmont
region is, at present, at one percent, continuous application of poultry litter has the potential to
increase yield up to 12 percent above current levels. However, Paudel also states that even with
no-till and continuous poultry litter application, the maximum organic matter level that can be
attained in Piedmont soils is 2.5 percent. It takes about 300 years for organic matter to reach that
level. Increases in organic matter help to improve soil tilth and decrease the soil erosion by
increasing soil infiltration.
8
If poultry litter were applied to all cotton acreage in GA, this would utilize approximately
1.66 million tons of litter. However, the major cotton growing area in the state is in the coastal
plains region where cotton is grown under irrigation. Given the distance from the major poultry
producing region (in the north) transportation costs become an issue. While cotton is the major
field crop, there are other crops grown within reasonable distances of the major poultry litter
producing region. Within 200 miles surrounding the major poultry litter production area, crops
such as corn and winter wheat are grown extensively. The use of broiler litter in these two crops
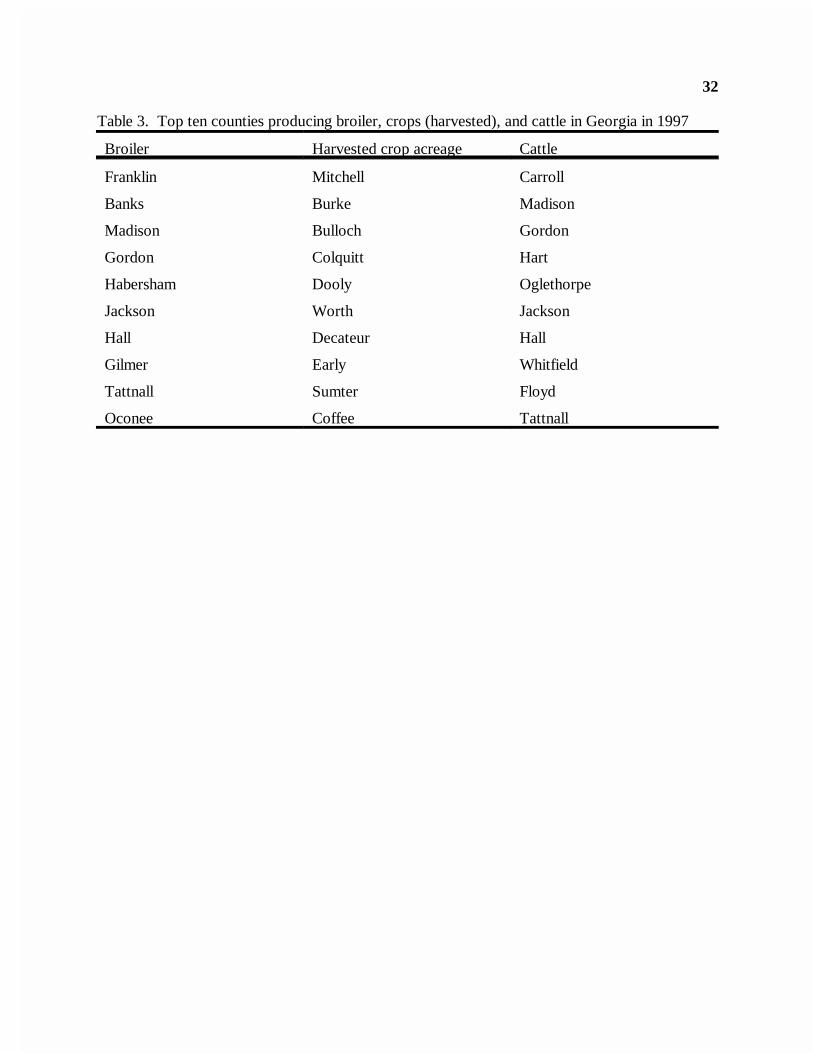
could provide an alternative solution for poultry waste disposal problems in the region. Table 3
shows the ten counties with the highest acreage of crop production, number of beef cattle, and the
number of broilers. Total poultry litter use based on the phosphorus requirements of these three
crops (both irrigated and dryland) are presented in table 4. Table 4 also shows the total acreage
(irrigated and dryland), recommended amount of major plant nutrients, and phosphorus consistent
poultry litter application rates for cotton, corn, and wheat. The nutrient needs not met by poultry
litter are assumed to be supplied through application of chemical fertilizers.
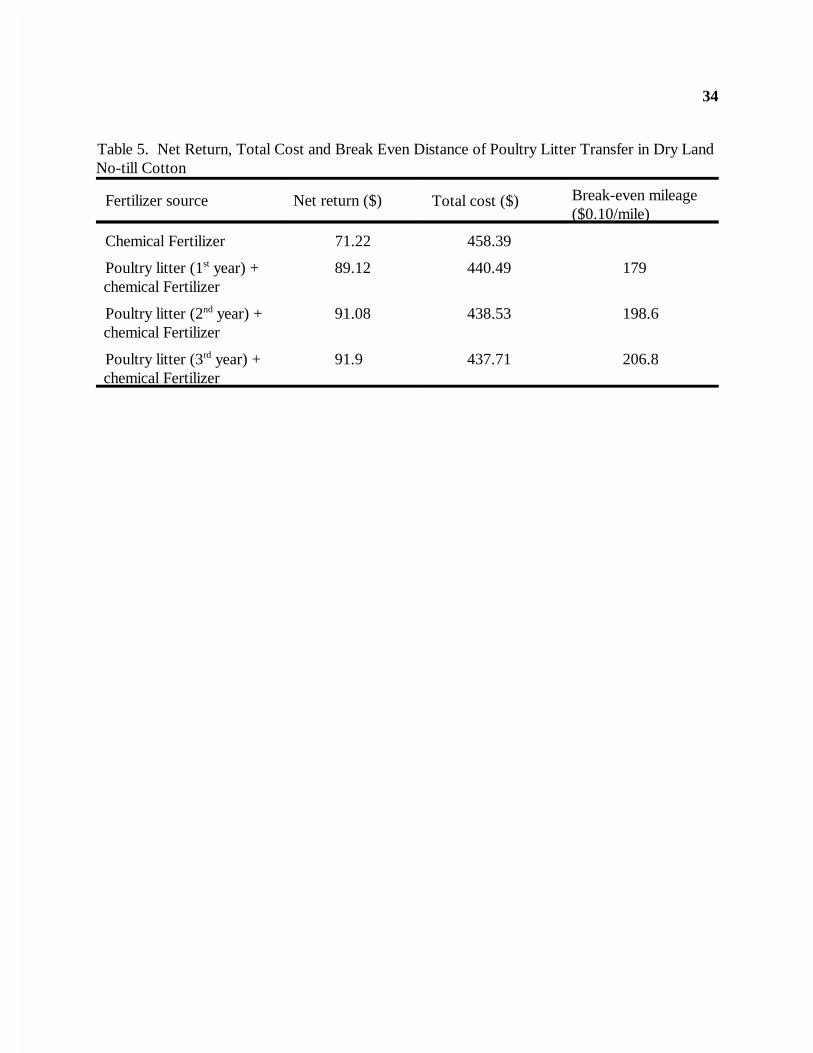
Break-even transportation distances are calculated for cotton for illustration purposes.
The summary of three years net returns, total costs and breakeven transportation distances are
shown in table 5. A specific enterprise budget prepared for the first year of poultry litter
application to no-till cotton is shown in appendix A.
The total potential amount of litter utilized in the production of cotton, corn, and wheat
(using phosphorus consistent application rates) are shown in table 3. If poultry litter were applied
to all major crops, approximately 2.4 million tons of broiler litter could be utilized. This amount
exceeds the combined production of litter from all poultry sources in the state. It should be noted
9
that in addition to the potential use in row crop production, poultry litter is currently applied to
7.5 percent of pasture and range land in the state.
Poultry Litter as an Animal Feed
A second alternative market for broiler litter is as cattle feed. Poultry litter is a good
source of protein, energy, and minerals. Processing of broiler litter for cattle feed can be done by
ensiling it with corn or sorghum, heat treatment to form pellets or simply stacking litter for at
least 20 days before mixing with other feed ingredients. According to Ruffin and McCaskey,
poultry litter is worth four times more if used as cattle feed than if used for plant nutrients. We
analyze the economic feasibility of processing broiler litter for cattle feed, especially for the
production of stocker cattle.
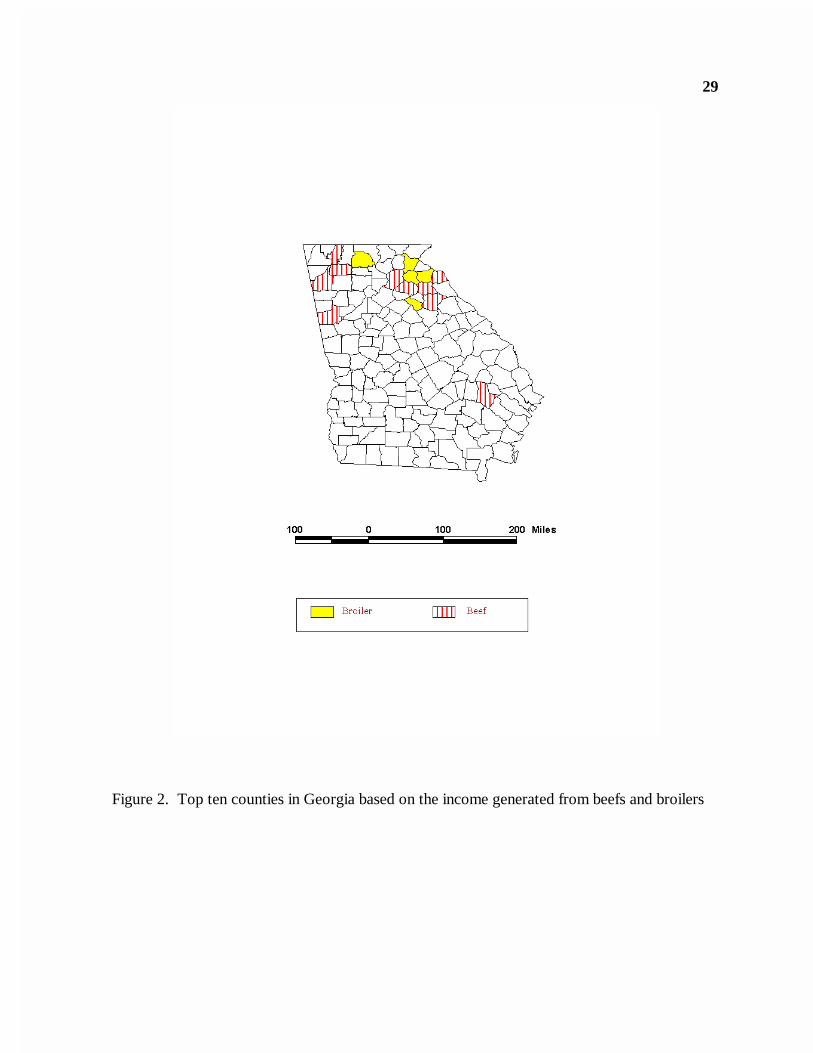
The beef cattle industry generated $238 million in the state of Georgia in 1997. The share
of feed cost in cattle production is, on average, 22 percent of the total expenses. Broiler litter can
be used directly or in combination with grains in animal rations. Since the broiler industries and
cattle farms are located mostly in the nearby states (Figure 2), the use of litter as a feed ingredient
seems one of the best alternative disposal method with a minimum transportation cost. Further,
pasture land used for raising beef cattle can also receive applications of poultry litter as a nutrient
source for winter annuals (although such practice is not encouraged if the feed ration already
contains of poultry litter). Use of broiler litter as cattle feed may reduce the total cost of cattle
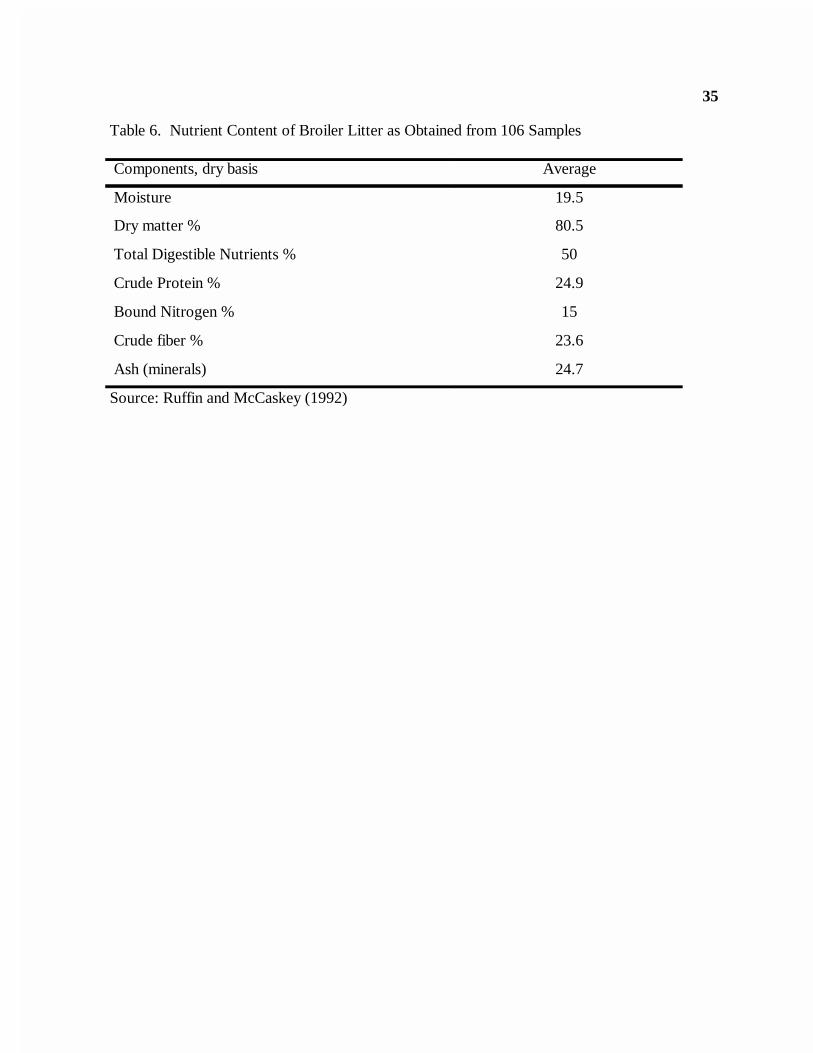
feed and provide an alternative sink for broiler litter disposal. The average nutrient content of
broiler litter varies, as there are no regulations on the amount of bedding material used and the
number of batches of birds housed between clean-out. The average nutrient content of the broiler
10
litter as obtained from 106 samples of dry broiler litter are shown in table 6 (Ruffin and
McCaskey).
At present, the feeding of broiler litter is regulated by the Board of Agricultural and
Industries by regulations that went into effect on January 1, 1977. According to the regulations,
broiler litter should not be fed to dairy cows, nor should it be fed to stockers less than 15 days
before slaughter. Because of the high amounts of uric acid in broiler litter, it should not be fed to
calves below 400 pounds.
Gerken examined the use of broiler litter for cattle feed in Virginia. He found that the
amount of poultry litter being fed to livestock ranged from 20 to 40 percent of the diet on a dry
matter basis. Litter could provide all necessary nutrients needed for cattle production. In
addition, Gerken found that the use of poultry litter in cattle diets can reduce overall feed costs
and thus increase profits from cattle enterprises.
Ruffin and McCaskey noted that poultry litter exhibited variability in nutrient content due
to the content of other materials mixed with litter. Suitable litter for feeding should have 12 to
25 percent moisture, at least 18 percent but not more than 25 percent crude protein and less than
28 percent ash. Beef cattle should be fed poultry litter after reaching 450 pounds and continue to
be fed litter until 2 weeks before slaughter. The ration could contain 50 to 80 percent litter. If
vitamins and anti-bloat ingredients are added, diets containing litter were found to be more
economical than conventional diets, and Ruffin and McCaskey showed that litter as a feed
ingredient is indeed worth more than four times that of litter as fertilizer. Litter was also found to
be less costly substitute for grains normally incorporated in conventional feed rations.
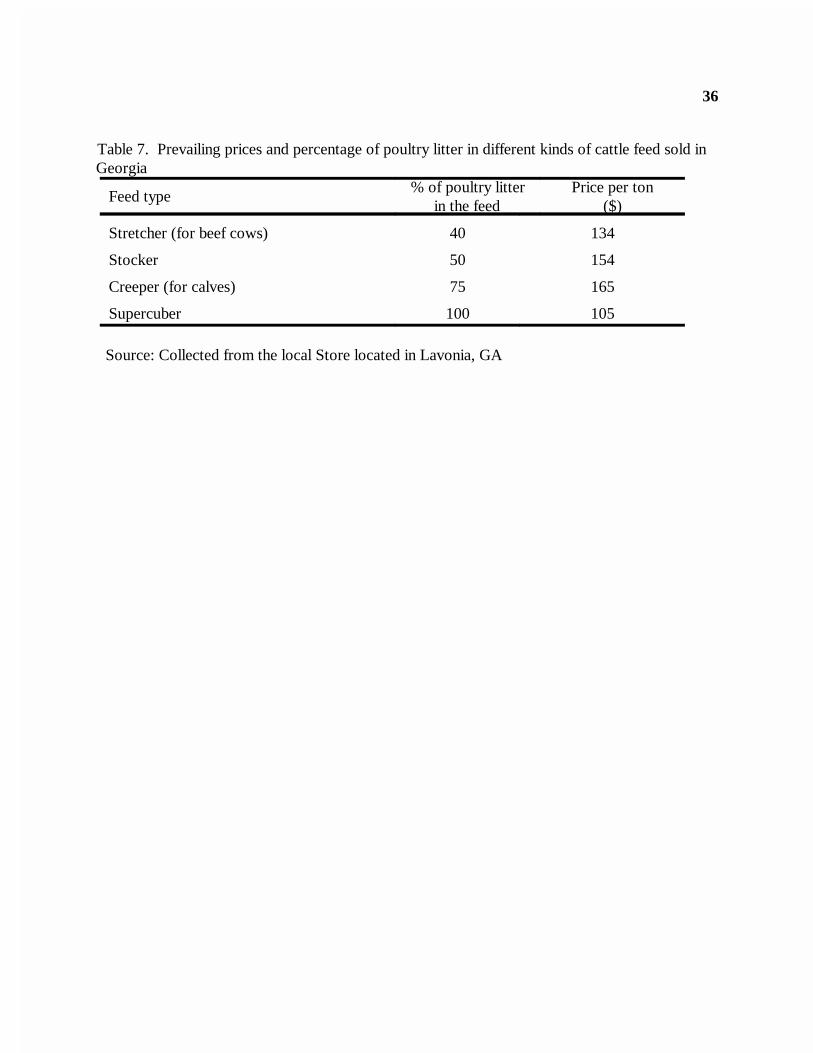
Hardy and Freeman determined the market potential for range cubes formed from broiler
11
1Borvatec is an anti-bloating compound added in ration.
litter. Their study showed that the average retail price for range cubes was around $186 per ton.
Wholesale prices charged by suppliers were found to be approximately $158 tons per ton. They
conclude that there exists a viable market for poultry litter as cattle feed. The prevailing market
price of different kinds of cattle feeds containing broiler litter as part of the ration in North
Georgia is presented in table 8.
In this study, we assumed that only 35 percent of total poultry litter produced in Georgia
could be used as cattle feed. This assumption is necessary as only reasonably good quality litter is
suitable for use as a feed ingredient. This assumption is also consistent with Ruffin and
McCaskey. At this percentage, a total of 517,475 tons of Georgia broiler litter would be suitable
for use in cattle feed. The proportion of broiler litter and grain in the ration depends on types of
cattle (for example, brood cows versus stocker steers). A reasonable ration for stockers would
consists of litter and corn in 50:50 mix. Other necessary feed additives such as an anti-bloat agent
and vitamin A should be added to increase the digestibility and supply needed nutrients.
A feed ration made with the mixture of cracked corn and broiler litter should be fed daily
at the rate equivalent to three percent of total body weight of the stocker cattle. Generally,
vitamin A is added at 15,000 International Units per pound of feed. Rumensin or Borvatec1
should be added to the ration at a rate of 150 mg per day for animals weighing less than 700
pounds and 200 mg per day for animals weighing more than 700 pounds. The Alabama
Cooperative Extension Service (Walter and Marshall) report that, on average, 45.15 tons of feed
containing poultry litter and cracked corn in a 50:50 proportion is sufficient to feed 65 stockers
12
for an increase of 384 pounds weight per animal. Generally, stockers are purchased with the
starting weight of approximately 400 pounds and sold when they reach 784 pounds. This means
that for a heard of 65 stockers 22.6 tons of broiler litter would be necessary (along with other
feed supplements) to achieve a total gain of 26,880 pounds weight. Stockers raised this way are
also fed with winter annuals in addition to a broiler litter and grain mixed ration. However, if one
wants to raise stockers entirely on grain and broiler litter then it is necessary to feed 88.73 tons of
ration mixed in a proportion of 50:50 litter and grain for the same number of cattle.
The total number of stockers in Georgia equaled to 613,950 in 1997, which could have
consumed 212,993 tons of broiler litter. The economic value of broiler litter fed to the livestock
equals $4.26 million even without considering environmental benefit associated with it.
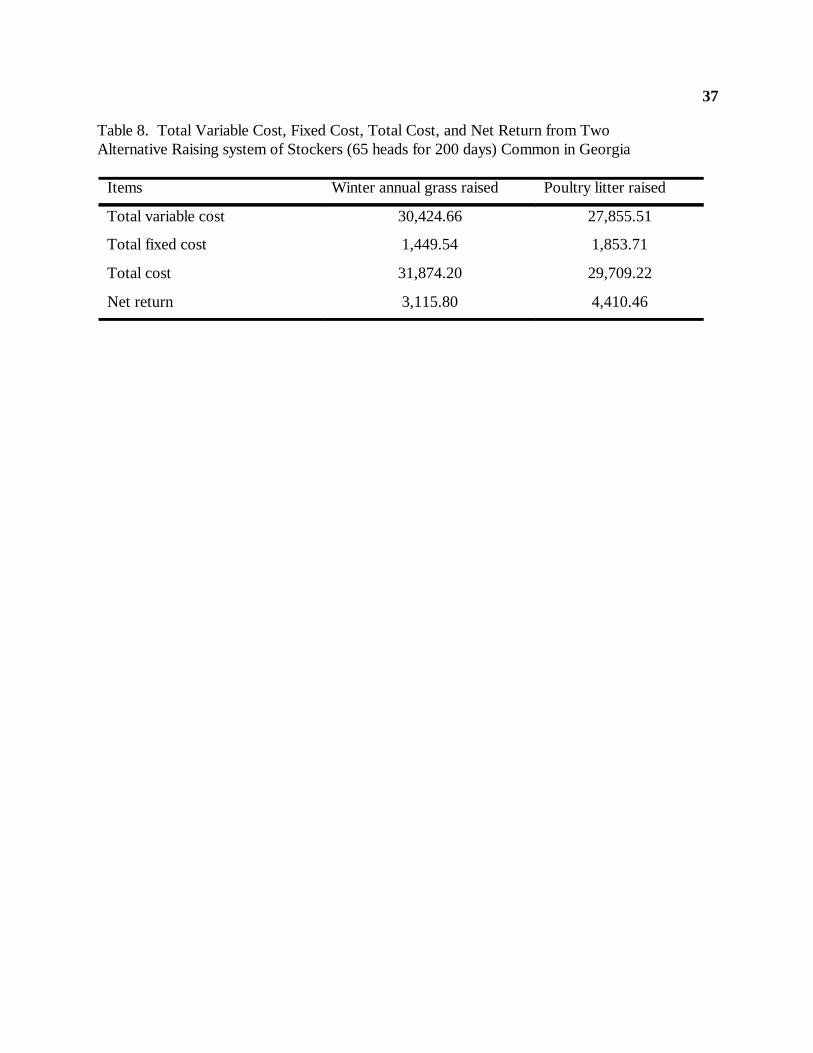
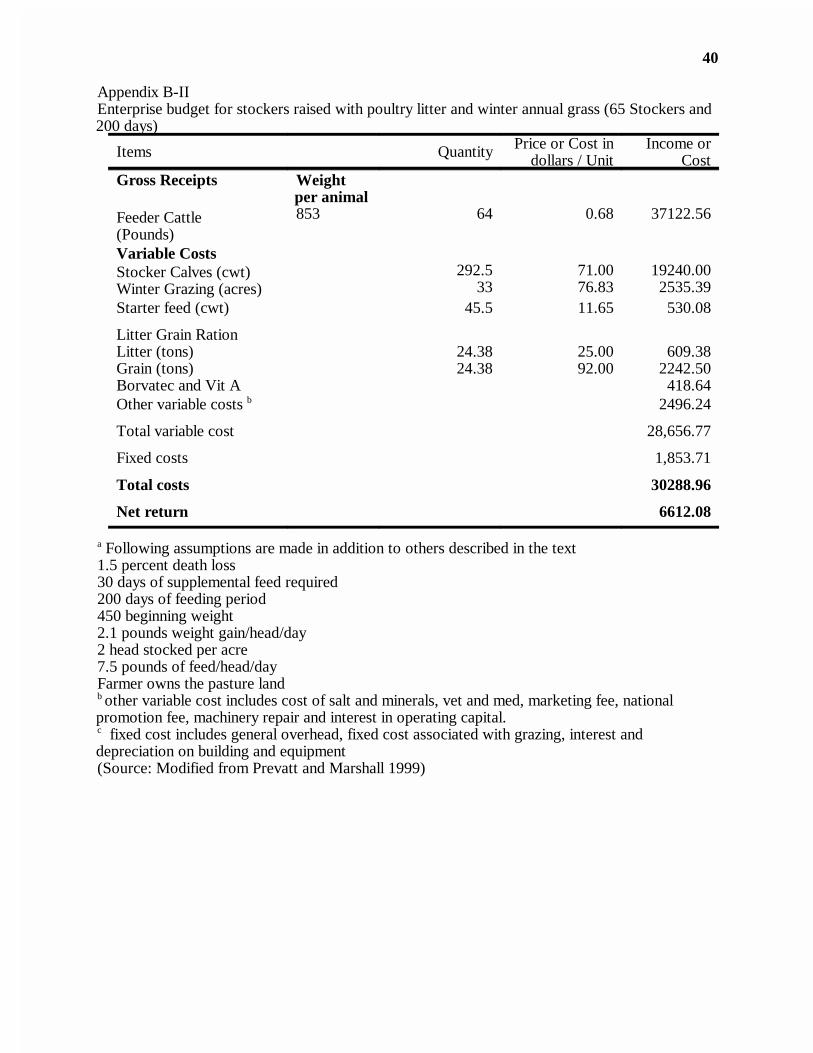
Among several alternatives for raising stockers in Georgia, three major alternatives for
raising cattle are i) winter grazing with grain supplements, ii) winter grazing with poultry litter,
and iii) dry lot feeding of a ration including poultry litter. Here we compare the cost of raising 65
head of stockers utilizing winter annual grasses with the same numbers of stockers utilizing winter
annual grasses with broiler litter and grain. The enterprise budgets for these activities are shown
in the appendices B-I and B-II.
Assumptions used in preparing the enterprise budgets for winter annual fed cattle are that
farmers purchase stockers when they are 450 pounds then raise them for 200 days selling the
stockers at approximately 784 pounds. We assume a 1.5 percent death loss. Stockers are
stocked at a rate of 1.11 head/acre of pasture land. Cattle farmers are assumed to have all the
necessary equipment and to properly depreciate the equipment when calculating the costs.
In case of poultry litter fed option, stockers are purchased when they are 450 pounds of weight
13
and raised for 200 days selling the stockers when they get approximately 853 pounds. The weight
gain per day per animal is 2.1 pounds. We considered 2 percent shrink in the final weight. Cattle
are fed approximately 7.5 pounds of poultry litter and grain mixed ration per day.
With the prevailing price of $25 per ton of broiler litter suitable for cattle feed and, a
farmer can achieve a 112 percent higher net return when the ration contains poultry litter than
when ration consists of the traditional combination of winter annuals and grains. The budgets
indicate that stockers fed with broiler litter generated a 10 percent higher return for each dollar
invested while cattle raised with poultry litter generated 22 percent higher return for each dollar
invested in the 65 animal herd.
Poultry Litter and Pollution
The U.S. Environmental Protection Agency (EPA) says that hog, chicken, and cattle wastes have
polluted 35,000 miles of rivers in 22 states and contaminated groundwater in 17 states. With an
increase number of poultry related factory farms in Georgia, river and groundwater pollution are
potentially serious problems. An increasing number of federal and state laws address poultry
waste, but environmental regulations are not keeping pace with poultry litter production in
Georgia or elsewhere in the USA.
The greatest concentration of poultry in Georgia is in 7 adjacent counties. The cumulative
supply of poultry litter located in such a geographically concentrated area poses a serious threat to
ground and surface water quality. The nitrogen content of litter is available in organic form such
as nitrates. Nitrates are water soluble and thus have the potential to leach into ground water.
Contamination of drinking water by nitrogen has been shown to contribute to blue baby disease
14
(Hubbard and Sheridan; Bouwer).
Phosphorus is subject to runoff into surface waters and hence also poses serious health
risks. Current water treatment in the US is done through primary and secondary processes. To
remove nitrogen and phosphorus, water should go through the tertiary treatment which may cost
as much as six times higher than the current water treatment regimes (Sedlack).
Nitrogen leaching from poultry litter should not be problem if litter is applied at
recommended rates. The EPA has set standards for drinking water such that nitrogen should not
occur in concentrations above 10 ppm while the standard for phosphorus is to be 0.05 to 1 ppm
for lakes and stream, respectively. Composting of litter works well in reducing the concentration
of nitrates being lost, but does not reduce the concentration of phosphorus in the runoff (Radcliff
et al.). In addition, since composting lowers the nutrient content of the litter it also decreases its
commercial value (Vervoort and Keeler).
Various forms of inorganic phosphorus are a source of eutrophication. The
concentrations of inorganic phosphorus that will result in problems are those above 0.02 mg per
liter (resulting in the potential for algae bloom), and above 0.1 mg per liter (in what is termed an
excessively enriched region).
Govindasamy et al. examined the implications of phosphorus loading policies for pasture
land. They measure the economic opportunity costs of a phosphorus management policy that
targets soil with high amounts of phosphorus. The effect of a litter application tax on the optimal
allocation of poultry litter is examined. They conclude that restricting litter applications on soils
with elevated phosphorus levels will significantly reduce the net return generated from forage
production. They also found that the magnitude of the tax, whether small or large, does not affect
15
the level of poultry litter application on per acre basis.
The amount of water soluble phosphorus in litter varies, but fresh broiler litter contains
about 0.52 grams of phosphorus per pound of litter (Moore). Water soluble phosphorus can be
reduced substantially with the addition of amendments such as alum, lime, or ferrous products.
The application of alum to poultry litter results in lower atmospheric ammonium, and better
weight gain and lower energy use by the broilers. Addition of alum can decrease phosphorus
runoff from land-applied litter as well as increasing the profitability of poultry production
(Moore). The down-side of adding alum in the production process is to increase the cost of
production and the cost of the litter.
The soluble phosphorus from broiler litter is more likely to remain on sandy soils than on
clay soils. Soluble phosphorus content is higher on no-till soils than on conventionally tilled areas.
However, the runoff of phosphorus is greater in conventionally tilled soil than on no-till.
Therefore, phosphorus runoff could be minimized if no-till management practices are followed
and if litter is applied to clay soils (Cox). At present only 15 percent of total land in cotton
cultivation is under no-till management practice (CTIC).
Williams et al. (1998) explored ways to recycle poultry litter that were environmentally
sound, economically feasible, and socially acceptable. They found that poultry litter could be used
on a commercial basis as an amendment to improve soils contaminated with petroleum
hydrocarbons by providing optimum air porosity, carbon co-substrate, and inorganic nutrients for
the bio-remediation. Both laboratory and field evaluations showed the significant removal of
contamination when poultry litter was used for this purpose.
Poultry litter production and consumption can be restricted by using policy tools such as
16
taxes, subsidies, or environmental standards. Even if markets for poultry litter become well
established, farmers have to be aware of the total amount of poultry litter produced so that the
total litter production does not exceed the demand from environmentally benign disposal
alternatives.
We examine the impact of imposing a standards based tax and permit system for
controlling the total amount of poultry litter produced in Georgia. If a standards based tax is
imposed at the farm level, such policies tend to be infeasible in controlling nonpoint pollution
(Moxey and White). To control nonpoint sources of water pollution, alternatives such as
emission charges based on estimates, taxes based on inputs or output, cross compliance
requirements, marketable permits, deposit refund systems, subsidies for mitigating inputs, legal
liability, easements and cost sharing programs should be implemented (McCann and Easter).
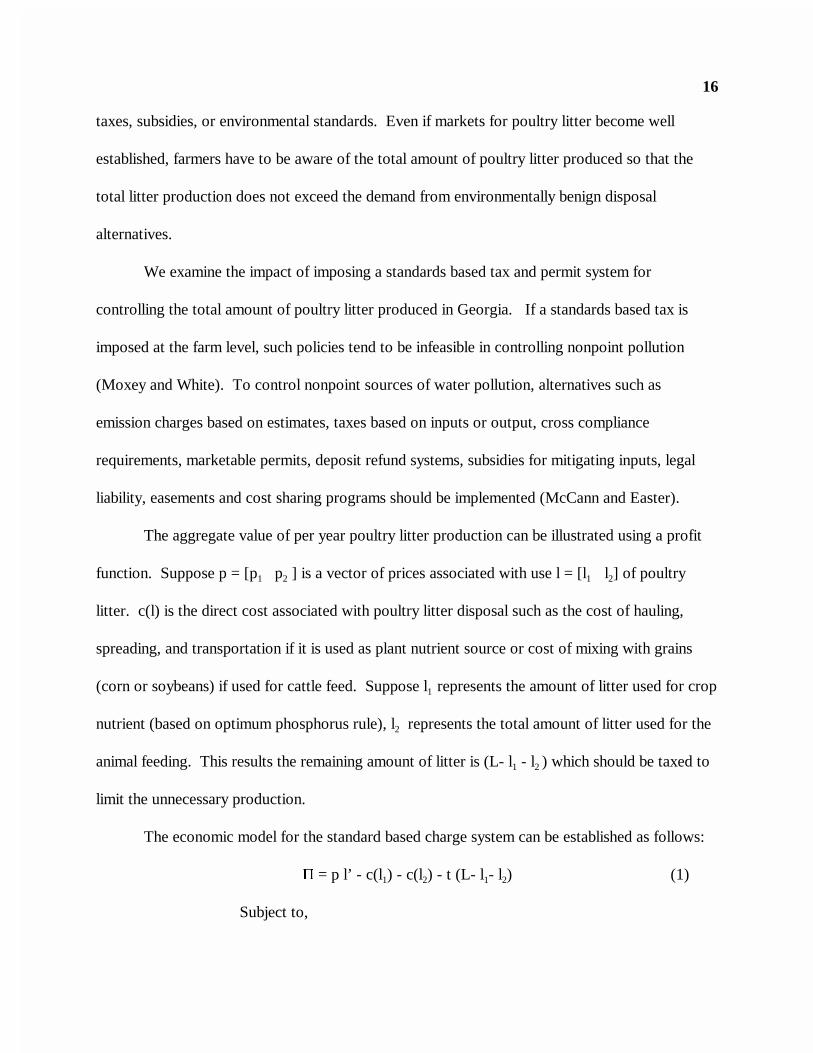
The aggregate value of per year poultry litter production can be illustrated using a profit
function. Suppose p = [p1 p2 ] is a vector of prices associated with use l = [l1 l2] of poultry
litter. c(l) is the direct cost associated with poultry litter disposal such as the cost of hauling,
spreading, and transportation if it is used as plant nutrient source or cost of mixing with grains
(corn or soybeans) if used for cattle feed. Suppose l1 represents the amount of litter used for crop
nutrient (based on optimum phosphorus rule), l2 represents the total amount of litter used for the
animal feeding. This results the remaining amount of litter is (L- l1 - l2 ) which should be taxed to
limit the unnecessary production.
The economic model for the standard based charge system can be established as follows:
� = p l’ - c(l1) - c(l2) - t (L- l1- l2) (1)
Subject to,
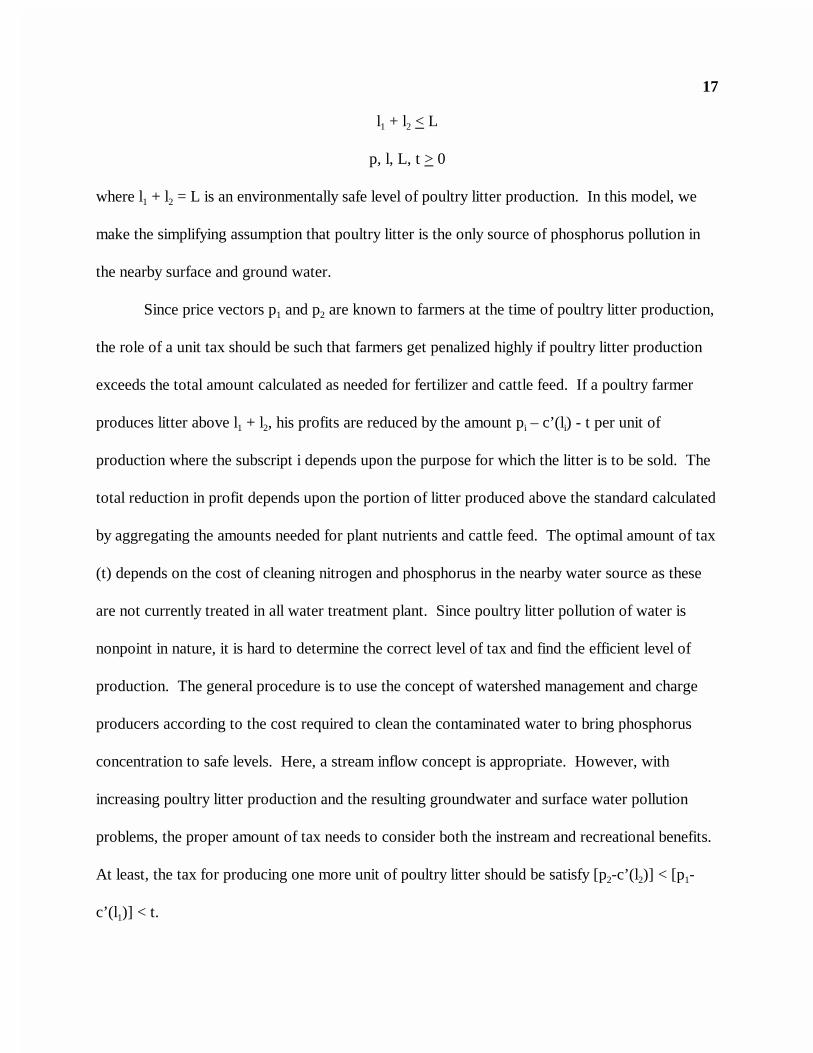
17
l1 + l2 < L
p, l, L, t > 0
where l1 + l2 = L is an environmentally safe level of poultry litter production. In this model, we
make the simplifying assumption that poultry litter is the only source of phosphorus pollution in
the nearby surface and ground water.
Since price vectors p1 and p2 are known to farmers at the time of poultry litter production,
the role of a unit tax should be such that farmers get penalized highly if poultry litter production
exceeds the total amount calculated as needed for fertilizer and cattle feed. If a poultry farmer
produces litter above l1 + l2, his profits are reduced by the amount pi – c’(li) - t per unit of
production where the subscript i depends upon the purpose for which the litter is to be sold. The
total reduction in profit depends upon the portion of litter produced above the standard calculated
by aggregating the amounts needed for plant nutrients and cattle feed. The optimal amount of tax
(t) depends on the cost of cleaning nitrogen and phosphorus in the nearby water source as these
are not currently treated in all water treatment plant. Since poultry litter pollution of water is
nonpoint in nature, it is hard to determine the correct level of tax and find the efficient level of
production. The general procedure is to use the concept of watershed management and charge
producers according to the cost required to clean the contaminated water to bring phosphorus
concentration to safe levels. Here, a stream inflow concept is appropriate. However, with
increasing poultry litter production and the resulting groundwater and surface water pollution
problems, the proper amount of tax needs to consider both the instream and recreational benefits.
At least, the tax for producing one more unit of poultry litter should be satisfy [p2-c’(l2)] < [p1-
c’(l1)] < t.
18
Another method to limit poultry litter production to environmentally safe levels is to
distribute permits to poultry producers. Such permits should be tradable on the open market and
should be freely transferable. Several authors report that a permit system is better than the
standard based tax system to control either nonpoint or point sources of pollution. Permits also
promote technical change (promote compliance through changing production systems or patterns)
and are easy to implement as one does not have to use a trial and error method as in the tax
system.
Permits would be the superior policy tool to control poultry litter related pollution in
Georgia. An efficient implementation of this system achieves the targeted level of pollution at a
minimum resource cost. If a permit system is based on the level of phosphorus in the litter, the
permissible levels can be modified after each year depending upon the level of phosphorus in the
soil. Therefore, this system has the potential to be efficient even in a dynamic setting. Also, the
level of information intensity needed for the regulation is minimal. Since the total numbers of
permits are initially distributed based on the level of total poultry litter utilized in fertilizer and
cattle feed, it is not difficult to set the new standard even in the face of economic change. The
advantage of setting the poultry litter production using the permit system is to continuously search
for phosphorus reducing technology in poultry litter. Since the permit raises revenue for the
government, it is also a politically attractive tool for operation in regulating poultry litter
production.
Assigning Permits
Limited numbers of poultry producers can potentially affect the water quality for many
19
Max(l1,l2,l3......li) M
J
j1
3j(Mi
li) � Mi
i1
�i(li). (2)
FOC: MJ
j1
3�
j(Mi
l oi ) < M
i
i1
��
i(loi ).
consumers in the state of Georgia. Because the action of poultry litter producers potentially
pollute recreation and drinking water for many people in the surrounding area, we deal this
problem as a multilateral externality. Further, water pollution resulting from poultry litter is
equally experienced by all consumers in the poultry production and litter application area so we
formulate our model as if we are dealing with the public goods. We also assume that the
regulator has very little information about the nature of the derived profit function of the poultry
producers and cannot tell which particular firms is more likely to handle the burden of reducing
the litter production.
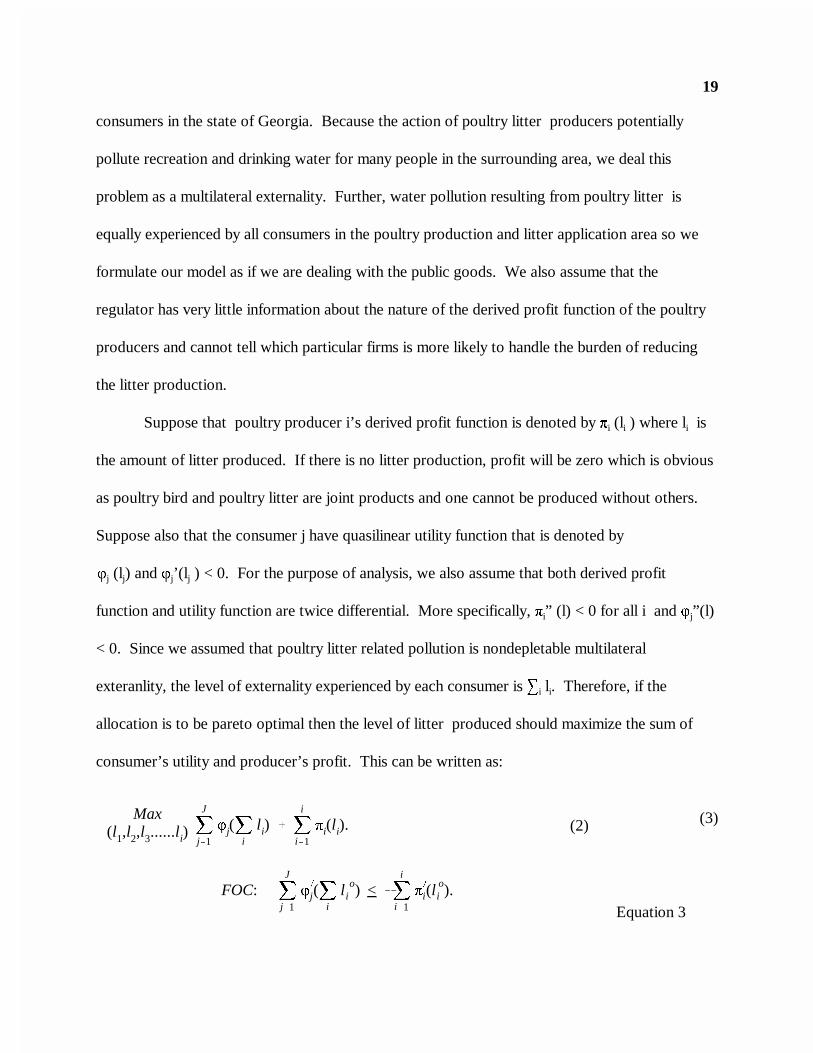
Suppose that poultry producer i’s derived profit function is denoted by �i (li ) where li is
the amount of litter produced. If there is no litter production, profit will be zero which is obvious
as poultry bird and poultry litter are joint products and one cannot be produced without others.
Suppose also that the consumer j have quasilinear utility function that is denoted by
3j (lj) and 3j’(lj ) < 0. For the purpose of analysis, we also assume that both derived profit
function and utility function are twice differential. More specifically, �i” (l) < 0 for all i and 3j”(l)
< 0. Since we assumed that poultry litter related pollution is nondepletable multilateral
exteranlity, the level of externality experienced by each consumer is �i li. Therefore, if the
allocation is to be pareto optimal then the level of litter produced should maximize the sum of
consumer’s utility and producer’s profit. This can be written as:
(3)
Equation 3
20
Maxli > 0(�i(li) � p �
l (l̄ jhj)) .
��
i(li) p �
l .
p �
l Mi
3�
i(lo)
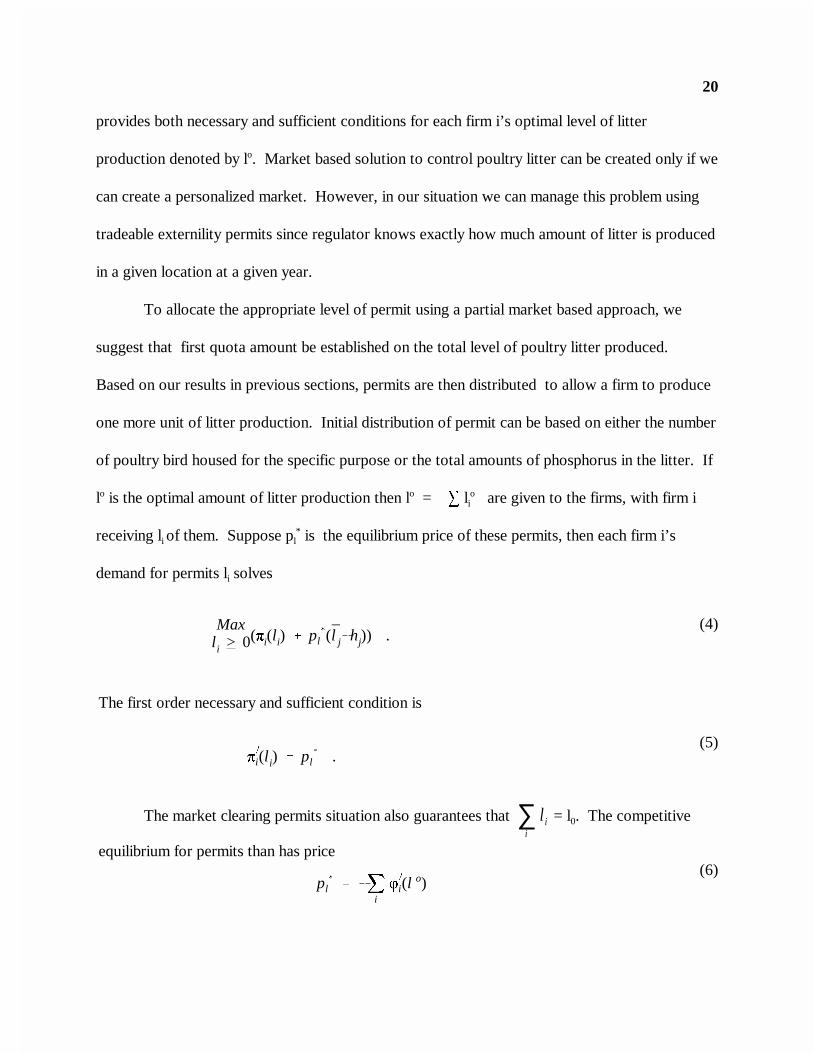
provides both necessary and sufficient conditions for each firm i’s optimal level of litter
production denoted by lo. Market based solution to control poultry litter can be created only if we
can create a personalized market. However, in our situation we can manage this problem using
tradeable externility permits since regulator knows exactly how much amount of litter is produced
in a given location at a given year.
To allocate the appropriate level of permit using a partial market based approach, we
suggest that first quota amount be established on the total level of poultry litter produced.
Based on our results in previous sections, permits are then distributed to allow a firm to produce
one more unit of litter production. Initial distribution of permit can be based on either the number
of poultry bird housed for the specific purpose or the total amounts of phosphorus in the litter. If
lo is the optimal amount of litter production then lo = � lio are given to the firms, with firm i
receiving li of them. Suppose pl* is the equilibrium price of these permits, then each firm i’s
demand for permits li solves
(4)
The first order necessary and sufficient condition is
(5)
The market clearing permits situation also guarantees that = l0. The competitive lii
∑equilibrium for permits than has price
(6)
21
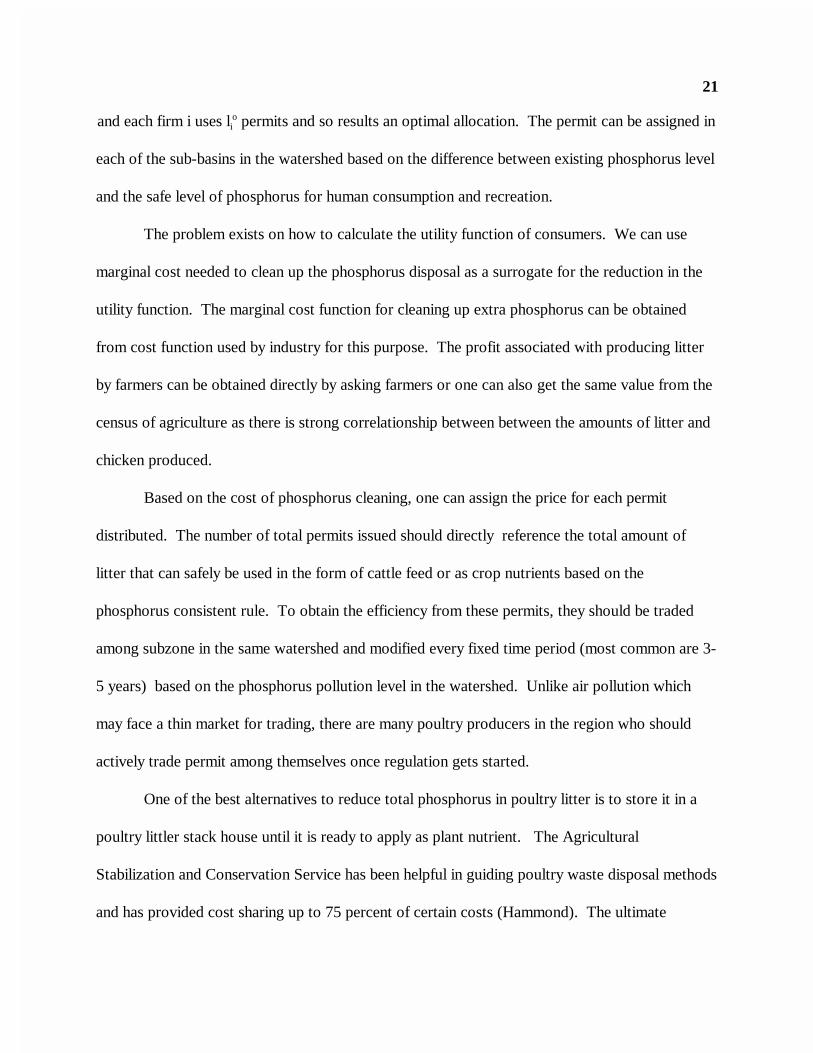
and each firm i uses lio permits and so results an optimal allocation. The permit can be assigned in
each of the sub-basins in the watershed based on the difference between existing phosphorus level
and the safe level of phosphorus for human consumption and recreation.
The problem exists on how to calculate the utility function of consumers. We can use
marginal cost needed to clean up the phosphorus disposal as a surrogate for the reduction in the
utility function. The marginal cost function for cleaning up extra phosphorus can be obtained
from cost function used by industry for this purpose. The profit associated with producing litter
by farmers can be obtained directly by asking farmers or one can also get the same value from the
census of agriculture as there is strong correlationship between between the amounts of litter and
chicken produced.
Based on the cost of phosphorus cleaning, one can assign the price for each permit
distributed. The number of total permits issued should directly reference the total amount of
litter that can safely be used in the form of cattle feed or as crop nutrients based on the
phosphorus consistent rule. To obtain the efficiency from these permits, they should be traded
among subzone in the same watershed and modified every fixed time period (most common are 3-
5 years) based on the phosphorus pollution level in the watershed. Unlike air pollution which
may face a thin market for trading, there are many poultry producers in the region who should
actively trade permit among themselves once regulation gets started.
One of the best alternatives to reduce total phosphorus in poultry litter is to store it in a
poultry littler stack house until it is ready to apply as plant nutrient. The Agricultural
Stabilization and Conservation Service has been helpful in guiding poultry waste disposal methods
and has provided cost sharing up to 75 percent of certain costs (Hammond). The ultimate
22
solution may be to utilize all of these options in addition to permits in order enhance the water
quality in the state. Most of the poultry operations in Georgia are large in size and need permits
from the government for the land application (Hammond). Small operations may not need
permits for land application but policies should be executed such that poultry farmers are not
allowed to pollute nearby water sources and litter application should be restricted near water,
especially within 100 feet of streams, ponds, springs and wells, and water supplies. Site-specific
land management plans should be followed for the best application of poultry litter as crop
nutrients at the crop field.
Conclusions
Three possible scenarios for poultry litter disposal and control were outlined in this
manuscript. Cotton cultivated in the state is potentially able to utilize all the broiler litter
produced even when littler is applied according to the phosphorus content and crop requirements.
Farmers are not applying poultry litter as extensively as this result would indicate because they
have imperfect information about the total cost and benefit associated with poultry litter
application. The complete adoption of poultry litter as a nutrient source may take several years
unless the government provides some incentives for increased litter utilization.
The first alternative is for producers to dispose of poultry litter so that he/she can achieve
the highest profit. In the present market scenario, farmers can sell poultry litter as cattle feed in
the highest price. At the current market price of poultry litter ($16 per ton) it is cheaper for
farmers to use litter for crop nutrients than to use chemical fertilizers.
Permits should be distributed to poultry farmers so that the aggregate production does not
23
exceed the environmentally safe level of phosphorus in soil. Permits also contain all properties
that an effective policy should have. A permit system is, therefore, a preferred system for
inducing poultry farmers to produce the right level of phosphorus. Detailed economic and
environmental impacts of poultry litter need to consider the impact that contaminated water may
have on recreational benefits. This study also did not address the odor related issues in
calculating the permit prices or taxes. All of these should be considered to find the economically
profitable and environmentally responsible poultry litter production in Georgia.
24
References
Bosch, D.J. and K.B. Napit. “The Economics of Transporting Broiler Litter to Achieve More
Effective Use as a Fertilizer.” Journal of Soil and Water Conservation 47(1992):342-346.
Bouwer, H. “Agricultural Chemicals and Groundwater Quality.” Journal of Soil and Water
Conservation 45(1990):184-189.
Carpenter, G.H. “Current litter practices and future needs.” in Proceedings 1992 national
Poultry Waste Management Symposium, edited by Blake, J.P., Donald, J.O., and D.H.
Patterson, 1992.
Conservation Tillage Information Center. Conservation Tillage in Georgia, West Lafayette,
Indiana, 1998.
Cox, F.R. “Maximum non-hazardous soil phosphorus concentrations from application of poultry
house litter.” Complete project report submitted to the U. S. Poultry and Egg Association,
Tucker, GA, 1995.
Donald, J.O., J.P. Blake, F. Wood, K. Tucker, and D. Harkins. “Broiler Litter Storage.” Alabama
Cooperative Extension Service, Circular ANR-839, 1994.
Fleming, R.A., B.A. Babcock, and E. Wang. “Resource or waste? The economics of swine
manure storage and management.” Review of Agricultural Economics 20(1998):96-113.
Georgia Farm Reports, Georgia Agricultural Statistics Service, 1997.
Givan, B., Personal Communication, Department of Agricultural and Applied Economics, The
University of Georgia, Athens, GA 30602.
Gerken, H. J. “Utilization of poultry waste by feeding cattle.” Proceedings, 1990 National
25
Poultry litter Waste Management Symposium, page 115-122, 1990.
Govindasamy, R., M.J Cochran, and E. Buchberger. “Economic Implication of Phosphorus
Loading Policies for Pasture Land Application of Poultry Litter.” Water Resource Bulletin
30(1994):901-910.
Hammond, W.C. “Georgia’s Agricultural Waste Regulation.” Circular 819-11, Extension
Publication, College of Agricultural and Environmental Sciences, University of Georgia,
Athens, GA 30602, 1993.
Hardy, W.E. Jr. and B.W. Freeman. “An evaluation of the market potential for range cubes
formed from chicken litter.” Department of Agricultural Economics and Rural Sociology,
Alabama Agricultural Experiment Station, Auburn University, 1993.
Hubbard, R.K. and J.M. Sheridan. “Nitrate Movement to Groundwater in the Southeastern
Coastal Plain.” Journal of Soil and Water Conservation 44(1989):20-27.
Kriesel, W., C.S. McIntosh, and W.P. Miller. “The Potential for Beneficial Re-Use of Sewage
Sluge and Coal Combustion By-Products.” Journal of Environmental Management
42(1994):299-315.
McCann, L.M.J. and K.W. Easter. “ Differences Between Farmer and Agency Attitudes
Regarding Phosphorus Pollution in The Minnesota River Basin.” Review of Agricultural
Economics 21(1999):189-207.
Mitchell, C.C. Jr., J.O. Donald, and J. Martin. “The value and use of poultry waste as fertilizer.”
Alabama Cooperative Extension Service, Auburn University, Circular ANR 244, 1992.
Mitchell,C.C., J.O. Donald, and V.W.E. Payne. “Work Sheet Poultry Waste as a Fertilizer.”
26
Alabama Cooperative Extension Service, Auburn University, Circular ANR 244a, 1992.
Moore, P.A. Jr. “Phosphorus Precipitation in poultry litter with Al, Ca, and Fe Amendments.”
Complete project report submitted to the U. S. Poultry and Egg Association, Tucker, GA,
1995.
Moxey, A. and B. White. “Efficient Compliance with Agricultural Nitrate Pollution Standards.”
Journal of Agricultural Economics 45(1994):27-37.
National Agricultural Statistics Service (NASS), Census of Agriculture, 1997.
Paudel, K.P. Economic Analysis of Residue Management System in Cotton, Doctoral
Dissertation, University of Georgia, Athens, GA, 1999.
Prevatt, J.W. and J. Marshall. Fall Stocker Budget Alabama 1998-1999. Published by Alabama
Cooperative Extension Service, Auburn University, AL 36849, 1999.
Radcliff, D.E., M.L. Cabrera, and W.C. Merka. “Application of High Rates of Composted Litter
to Pastures to Enhance Litter Utilization Without Environmental Contamination.”
Completed project report submitted to the U.S. Poultry and Egg Association, Atlanta,
GA, 1996.
Ruffin, B.G. and T.A. McCaskey. “Feeding Broiler litter to Beef Cattle.” Alabama Cooperative
Extension Service, Auburn University, AL 36849, Circular ANR 557, 1992.
Sedlack, R. Phosphorus and Nitrogen Removal from Municipal Wastewater: Principles and
Practice. 2nd edition , Lewis Publishers, Boca Raton, Florida, 1991.
Vest, L and J. Dyer. “Many Factors Affect Broiler Litter’s Mineral Composition.’ Poultry Digest
September 1993, page 30-32.
27
Vest, L., J. Dyer, and W. I. Segars. “Poultry waste Georgia’s 50 Million Dollar forgotten Crop.”
I-206.ga Georgia Cooperative Extension Service, The University of Georgia, College of
Agricultural and Environmental Sciences, Athens, GA 30602, July 1994, Page 1-10.
Vervoort R.W. and A.G. Keeler. “Economics of Land Application of Broiler Litter and
Composted Broiler Litter.” Journal of Environmental Management, Forthcoming
Vervoort, R.W., D.E. Radcliff, M.L.Cabrera, M. Latimore, Jr. “Nutrient losses in surface and
subsurface flow from pasture applied poultry litter and composted poultry litter.” Nutrient
Cycling in Agroecosystems 50(1998):287-290.
Williams, C.M., J.L. Grimes, and R.L. Mikkelsen. “The Use of Poultry Litter as Co-Substrate and
Source of Inorganic Nutrients and Microorganisms for the Ex-Situ Biodegradation of
Petroleum Compounds.” Completed project report submitted to the U.S. Poultry and
Egg Association, Tucker, Georgia, 1998.
Wood, C.W. “Broiler Litter as Fertilizer: Benefits and Environmental Concerns.” Proceeding
1992 National Poultry Waste Management Symposium, Page 304-312, 1992.
28
Figure 1. Counties in Georgia that collects more than million dollars from poultry industry
(Source: www.uga.edu/~poultry/gapoultry/gpf2/sld012.htm)
29
Figure 2. Top ten counties in Georgia based on the income generated from beefs and broilers
30
Table 1. Poultry birds, their numbers, and total litter produced per year in Georgia in 1997
Type of Poultry Number (000) Litter per birda
(Pounds)Approximatenutrient content(N-P2O5-K2O)
Total litterproduced (000tons)
Laying Chicken 16,295 40 38-56-30 325,912
Broiler 1,182,800 2.5 66-50-40 1,478,500
Turkey 107 31 57-72-40 48,500
ReplacementPullet
87,795 8 38-56-30 35,178
Source: Census of Agriculture - State Data for Georgia 1997a Source: Vest, Merka, and Segars (1994) b Based on annual Cleanout
31
Table 2. Land Use Pattern in Georgia 1997 (Total Acreage=10,671,246)
Land use Percentage of total acreage
Crop land 50.3
Woodland 35.4
Pastureland and rangeland 7.7
Other land 6.6
32
Table 3. Top ten counties producing broiler, crops (harvested), and cattle in Georgia in 1997
Broiler Harvested crop acreage Cattle
Franklin Mitchell Carroll
Banks Burke Madison
Madison Bulloch Gordon
Gordon Colquitt Hart
Habersham Dooly Oglethorpe
Jackson Worth Jackson
Hall Decateur Hall
Gilmer Early Whitfield
Tattnall Sumter Floyd
Oconee Coffee Tattnall
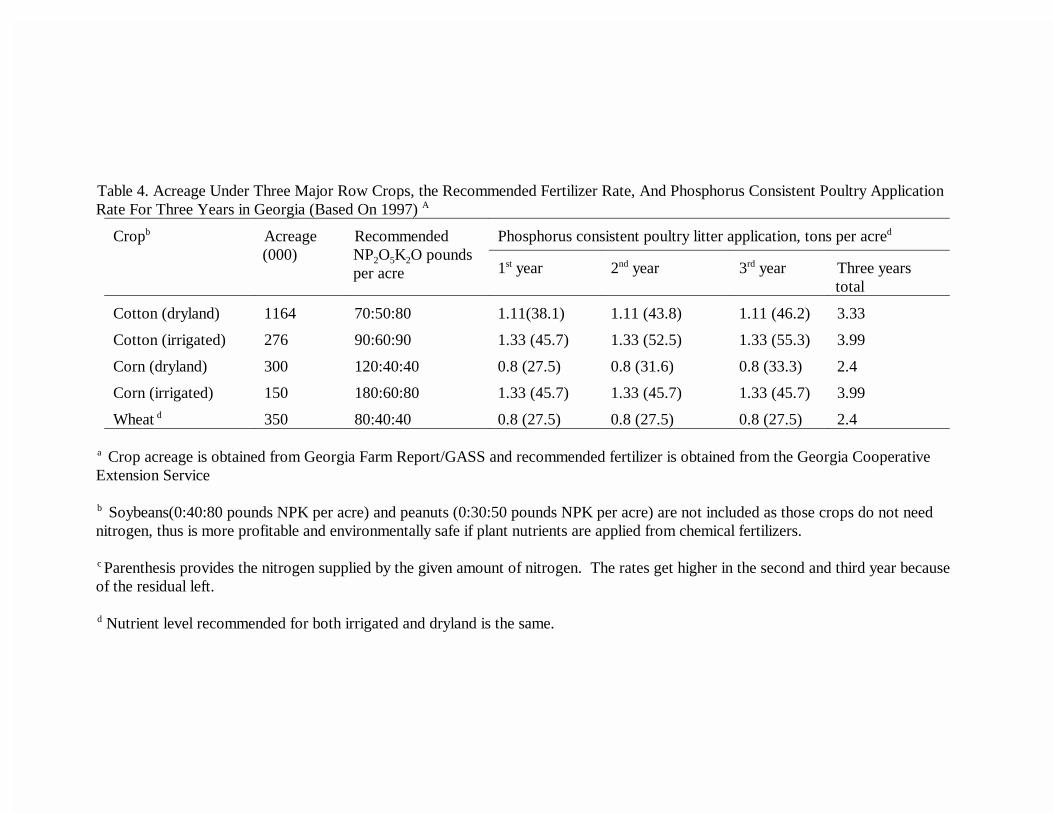
Table 4. Acreage Under Three Major Row Crops, the Recommended Fertilizer Rate, And Phosphorus Consistent Poultry ApplicationRate For Three Years in Georgia (Based On 1997) A
Cropb Acreage(000)
RecommendedNP2O5K2O poundsper acre
Phosphorus consistent poultry litter application, tons per acred
1st year 2nd year 3rd year Three yearstotal
Cotton (dryland) 1164 70:50:80 1.11(38.1) 1.11 (43.8) 1.11 (46.2) 3.33
Cotton (irrigated) 276 90:60:90 1.33 (45.7) 1.33 (52.5) 1.33 (55.3) 3.99
Corn (dryland) 300 120:40:40 0.8 (27.5) 0.8 (31.6) 0.8 (33.3) 2.4
Corn (irrigated) 150 180:60:80 1.33 (45.7) 1.33 (45.7) 1.33 (45.7) 3.99
Wheat d 350 80:40:40 0.8 (27.5) 0.8 (27.5) 0.8 (27.5) 2.4
a Crop acreage is obtained from Georgia Farm Report/GASS and recommended fertilizer is obtained from the Georgia CooperativeExtension Service
b Soybeans(0:40:80 pounds NPK per acre) and peanuts (0:30:50 pounds NPK per acre) are not included as those crops do not neednitrogen, thus is more profitable and environmentally safe if plant nutrients are applied from chemical fertilizers.
c Parenthesis provides the nitrogen supplied by the given amount of nitrogen. The rates get higher in the second and third year becauseof the residual left.
d Nutrient level recommended for both irrigated and dryland is the same.
34
Table 5. Net Return, Total Cost and Break Even Distance of Poultry Litter Transfer in Dry LandNo-till Cotton
Fertilizer source Net return ($) Total cost ($) Break-even mileage($0.10/mile)
Chemical Fertilizer 71.22 458.39
Poultry litter (1st year) +chemical Fertilizer
89.12 440.49 179
Poultry litter (2nd year) +chemical Fertilizer
91.08 438.53 198.6
Poultry litter (3rd year) +chemical Fertilizer
91.9 437.71 206.8
35
Table 6. Nutrient Content of Broiler Litter as Obtained from 106 Samples
Components, dry basis Average
Moisture 19.5
Dry matter % 80.5
Total Digestible Nutrients % 50
Crude Protein % 24.9
Bound Nitrogen % 15
Crude fiber % 23.6
Ash (minerals) 24.7
Source: Ruffin and McCaskey (1992)
36
Table 7. Prevailing prices and percentage of poultry litter in different kinds of cattle feed sold inGeorgia
Feed type% of poultry litter
in the feedPrice per ton
($)
Stretcher (for beef cows) 40 134
Stocker 50 154
Creeper (for calves) 75 165
Supercuber 100 105
Source: Collected from the local Store located in Lavonia, GA
37
Table 8. Total Variable Cost, Fixed Cost, Total Cost, and Net Return from Two Alternative Raising system of Stockers (65 heads for 200 days) Common in Georgia
Items Winter annual grass raised Poultry litter raised
Total variable cost 30,424.66 27,855.51
Total fixed cost 1,449.54 1,853.71
Total cost 31,874.20 29,709.22
Net return 3,115.80 4,410.46
38
Appendix A. Sample Enterprise budget for the first year cotton with poultry liter.Dry land cotton budget; NO-TILL AND Chemical Fertilizer; Per acre of land foryear 1998; Yield in Bales/acr; 1.41 (10 year average yield); Recommended Fertilizeramount = 70:50:80 lbs NPK / acre
Cotton yieldCotton (lbs)Seed (tons)Total revenue
Amount679.200.45
Price0.68
150.00
Revenue41.8667.75
529.61
Unit No. Units Price/Unit CostVariable CostSeed lbs 9.00 0.77 6.93Lime ton 0.33 24.00 7.92FertilizerNitrogen lbs 70.00 0.29 20.30Phosphorus lbs 50.00 0.22 11.00Potash lbs 80.00 0.13 10.40Herbicides Acre 1.00 28.00 65.95Insecticides Acre 1.00 41.00 41.00Application of insecticidesMachinery and labor Appl 1.00 9.50 9.50Defoliant and Harv aid Acre 1.00 9.50 9.50Scouting and service Acre 1.00 6.00 6.00Boil weevil eradication Acre 1.00 6.00 6.00Machinery Pre-harvest Fuel Gal 3.90 0.85 3.32 Repair and maintenance Acre 1.00 9.51 9.51Machinery and harvest Fuel Gal 4.25 0.85 3.61 Repair and maintenance Acre 1.00 33.96 33.96 Labor Hour 2.35 6.50 15.28Interest in Op. Cap. Dol 260.17 0.10 13.01Ginning Lb 679.20 0.09 61.13Market prep charges Bale 1.41 15.00 21.22Total variable costs 355.53Income above variable costs 174.08Fixed costsmachinery, depreciation, taxesInvestment and housingPre-harvest Acre 1.00 19.81 19.81Harvest Acre 1.00 47.50 47.50General overhead Dol 355.53 0.05 17.78Management Dol 355.53 0.05 17.78Total fixed costs 102.86Total costs 458.39Net return to land 71.22

39
Appendix B-I
Enterprise budget for stockers raised with winter annual grass (65 stockers for 200 days)
Items Quantity Price or cost indollars /unit
Income orcost
Gross receiptsFeeder cattle(Pounds)
Weight peranimal
804 64 0.68 34,990.00Variable costsStocker calves(cwt)Winter grazing (acres)
292.5
59
71.00
76.83
20,767.50
4,532.00Hay (ton) 9.75 60.00 585.00
Grain and supplemental 97.5 10.50 1,023.75Other variable costs b 4,100.44Fixed costs c 1,449.54
Total costs 31,874.20
Net return 3,115.88
a Following assumptions are made in addition to others described in the text1.5 percent death loss30 days of supplemental feed required200 days of feeding period450 beginning weight 1.11 animal stocked per acreFarmer owns his own pasture landb other variable cost includes cost of salt and minerals, vet and med, marketing fee, nationalpromotion fee, machinery repair and interest in operating capital.C fixed cost includes the annualized value of fixed cost of farm machinery, general overhead, andfixed cost of pasture associated with winter grazing .(Source: Modified from Prevatt and Marshall 1999)
40
Appendix B-IIEnterprise budget for stockers raised with poultry litter and winter annual grass (65 Stockers and200 days)
Items Quantity Price or Cost indollars / Unit
Income orCost
Gross Receipts
Feeder Cattle(Pounds)
Weightper animal853 64 0.68 37122.56
Variable CostsStocker Calves (cwt)Winter Grazing (acres)
292.533
71.0076.83
19240.002535.39
Starter feed (cwt) 45.5 11.65 530.08
Litter Grain RationLitter (tons)Grain (tons)Borvatec and Vit A
24.3824.38
25.0092.00
609.382242.50 418.64
Other variable costs b 2496.24
Total variable cost 28,656.77
Fixed costs 1,853.71
Total costs 30288.96
Net return 6612.08
a Following assumptions are made in addition to others described in the text1.5 percent death loss30 days of supplemental feed required200 days of feeding period450 beginning weight 2.1 pounds weight gain/head/day2 head stocked per acre7.5 pounds of feed/head/dayFarmer owns the pasture landb other variable cost includes cost of salt and minerals, vet and med, marketing fee, nationalpromotion fee, machinery repair and interest in operating capital.c fixed cost includes general overhead, fixed cost associated with grazing, interest anddepreciation on building and equipment(Source: Modified from Prevatt and Marshall 1999)