Embed Size (px)
Citation preview
1
Auburn University Crops: Cotton Research Report 2016 Research Report No. 41 Alabama Agricultural Experiment Station, 2017 Paul Patterson, Director Auburn University Auburn, AL
In cooperation with the Alabama Cooperative Extension System (Alabama A&M University and Auburn University)

2
Editors: K. S. Lawrence Professor Entomology and Plant Pathology Auburn University, AL T. Cutts Assistant professor/ Extension Agronomist Crop, Soil and Environmental Sciences Auburn University, AL
Authors L. K. Anderson Extension Specialist Associate Professor Department of Animal Sciences Auburn University, AL K. Balkcom National Soil Dynamics Lab Auburn University, AL T. Cutts Assistant professor/ Extension Agronomist Crop, Soil and Environmental Sciences Auburn University, AL D. Delaney Extension Agronomist Crop, Soil and Environmental Sciences Auburn University, AL J. A. Tredaway Extension Specialist /Assistant Professor Crop, Soil and Environmental Sciences Auburn University, AL K. Glass Advisor, III, Natural Resources Program Crop, Soil and Environmental Sciences Auburn University, AL W. Groover Graduate Student Entomology & Plant Pathology Auburn University, AL
C. Hicks Regional Extension Agent II EV Smith Research Center Bay Minette, AL A. Jacobson Assistant Professor Entomology & Plant Pathology Auburn University, AL K. S. Lawrence Professor Entomology and Plant Pathology Auburn University, AL S. Li Extension Weed Scientist & Assistant Professor Crop, Soil and Environmental Sciences Auburn University, AL J. Koebernick Assistant professor Crop, Soil and Environmental Sciences Auburn University, AL P. Mask Asst. Director Agriculture, Forestry, and Natural Resources Assistant Dean for Extension Auburn University, AL B. A. Dillard Regional Extension Agent II

3
ACES-AFNR-Field Geneva, AL E. McGriff Regional Extension Agent II ACES-AFNR-Field Cherokee, AL B. Meyer Director, Agronomy and Cooperative Services Agri-AFC Decatur, AL J. Kelton Regional Extension Agent I ACES-AFNR-Field Headland, AL D. Monks Professor, Director AAES Res. Stations Crop, Soil and Environmental Sciences Auburn University, AL C. Norris Director Tennessee Valley Research Extension Center Belle Mina, AL
G. Pate Director E.V. Smith Research Center Shorter, AL A. Price Weed Scientist Station Superintendent National Soil Dynamics Lab Auburn University, AL T. Reed Extension Specialist Franklin County Russellville, AL R. Smith Professor and Extension Entomologist, Emeritus Entomology & Plant Pathology Auburn University, AL S. Till Graduate Student
Entomology & Plant Pathology Auburn University, AL D. B. Weaver Professor Crop, Soil and Environmental Sciences Auburn University, AL N. Xiang Post-doctoral Fellow Entomology & Plant Pathology Auburn University, AL A. Bouselmi Regional Extension Agent I ACES-AFNR-Field Abbeville, AL A. Hagan Professor Entomology and Plant Pathology Auburn University, AL J. W. Kloepper Professor Entomology and Plant Pathology Auburn University, AL S. W. Park Assistant Professor Entomology and Plant Pathology Auburn University, AL Y. Wang Assistant Professor Biosystems Engineering Auburn University, AL P. A. Donald Affiliate Professor Entomology and Plant Pathology Auburn University, AL D. Dodge Graduate Student Entomology & Plant Pathology Auburn University, AL D. Dyer Graduate Student

4
Entomology & Plant Pathology Auburn University, AL M. Hall Graduate Student Entomology & Plant Pathology Auburn University, AL M. Foshee Graduate Student Entomology & Plant Pathology Auburn University, AL D. Schrimsher Agronomist, Agri-AFC Decatur, AL C. Chen Associate Professor Crop, Soil and Environmental Sciences Auburn University, AL M.R. Liles Professor Biological Sciences Auburn University, AL J. Jones Associate Director Ag Rsch/Extension Center Fairhope, AL D. Moore Director, Research/extension Ctr Prattville, AL S. Scott Associate Director Research/extension Ctr E.V. Smith, AL T. Sandlin Crop Specialist Crop, Soil and Environmental Sciences Belle Mina, AL S. H. Wang Post-doctoral Fellow
Biosystems Engineering Auburn University, AL J. Zhang Post-doctoral Fellow Biosystems Engineering Auburn University, AL K. Wilkins Regional Extension Agent II ACES-AFNR-Field Bay Minette, AL R. Yates Regional Extension Agent II ACES-AFNR-Field Linden, AL C. Dillard Extension Specialist Cooperative Extension System Auburn University, AL M. Runge Extension Program Associate Agricultural Economics & Rural Sociology Auburn University, AL W. Birdsong Extension Specialist Cooperative Extension Systems Headland, AL L. Wells Director, Research/extension Ctr Headland, AL B. Miller Superintendent Cooperative Extension Systems Brewton, AL M. Pegues Extension Specialist Cooperative Extension Systems Headland, AL C. Smith

5
ACES Horticulture Auburn, AL S. Duke Graduate Student Entomology & Plant Pathology Auburn University, AL

6
Acknowledgements This publication is a compilation of research conducted by Auburn University, the Alabama Agricultural Experiment Station, and the USDA Agricultural Research Service and National Soil Dynamics Laboratory. Research contained in the AU crops research reports was partially funded through the Alabama Cotton Commission, the Alabama Wheat and Feed Grains Producers, the Alabama Soybean Producers, and private industry grants. All funding is appreciated.
Confidential Report Publication, display or distribution of data contained herein should not be made without prior written approval. Mention of a trademark product does not constitute a guarantee of the product by Auburn
University and does not imply its approval to the exclusion of other products.

7
Table of Contents I. Cotton Variety Trials ........................................................................................... 9
Enhancing Cotton Variety Selection through On-Farm Evaluations, 2016 ......................................... 9
Evaluation of Liberty Plus Dual Magnum in Liberty Link, Extend, and WideStrike Cotton Varieties . 15
Breeding Cotton for Yield and Quality in Alabama ....................................................................... 16
2016 Cherokee County Cotton Variety Trial Dry Land .................... Error! Bookmark not defined. Varietal Response of Glufosinate Tolerant Cotton to Glufosinate and Other Tank Mixes .................. 18
Develop a Customized CRISPR-Cas9 System for Cotton and Generate Transgenic Cotton Varieties with Enhanced Drought Tolerance .............................................................................................. 20
II. Cultural Management ....................................................................................... 25
Continued Support of Long-term Crops Research ......................................................................... 25
On-Farm Grid Soil Sampling Demonstration for Variable Rate Nutrient Applications in Cotton Systems .................................................................................................................................... 27
Comparison of On-Farm Irrigation Scheduling Practices in Southeast Alabama Crop Production ...... 29
III. Disease Management ....................................................................................... 30
Potassium Rate and Source Effect on Target Leaf Spot ................................................................. 30
Potassium Rate Effects on Leaf Spots and Yield ........................................................................... 32
Evaluation of Commercial Cotton Cultivars for Resistance to Fusarium Wilt and Root-knot Nematode, 2016 ......................................................................................................................................... 34
Verticillium Wilt On-farm Cotton Cultivar Evaluations, 2016 ........................................................ 36
Fungicide Treatments to Combat Seedling Disease in North Alabama, 2016 ................................... 38
An Evaluation of Fungicide Combinations for Cotton Seedling Disease Management in North Alabama, 2016 .......................................................................................................................... 40
IV. Weed Management .......................................................................................... 42
Evaluation of Cotton Tolerance on Early Postemergence (EPOST) Applied Chloroacetamide Herbicides ................................................................................................................................ 42
Cotton Growth Responses to Various Soil Herbicides Containing Fomesafen and Fluridone ............. 43
Cotton Responses to 2, 4-D and Dicamba Applie Preemergence ..................................................... 46
Pigweed Resistance Screening in Alabama ................................................................................... 48
Evaluation of Sprayer Cleaning Procedures Following Application of 2, 4-D and Dicamba .............. 52
V. Insect Management ........................................................................................... 53
Determining Which Insecticide Provides the Most Cost-effective Control of Plant Bugs Infesting Cotton ...................................................................................................................................... 53
State Pheromone Trapping Program for Cotton Bollworm, Tobacco Budworm, and Heliothis Armigera (The Old Boll Worm) ................................................................................................................. 55
Managing Seedling Thrips in the Era of Resistance to At-Planted Seed Treatments .......................... 57
Controlling the Stink Bug Complex on Cotton in the Absence of Phosphate Chemistry .................... 61

8
Cotton Production with Reduced Inputs for 2016 .......................................................................... 67
Validating Treatment Thresholds and Determining Border Effect of Brown Marmorated Stink Bugs in Cotton ...................................................................................................................................... 71
VI. Nematode Management .................................................................................. 75
Varietal and Nematicidal Application Responses in North Alabama soils, 2016 ............................... 75
Cotton Variety Selection with and without Velum Total for Root-knot Nematode Management in Central Alabama, 2016 ............................................................................................................... 77
Cotton Variety Selection with and without Velum Total for Reniform Management in North Alabama, 2016 ......................................................................................................................................... 79
Cotton Seed Treatment Combinations for Rotylenchulus reniformis Control and Yield Increase in North Alabama, 2016 ................................................................................................................. 81
Nematicide Combinations for Rotylenchulus reniformis Management in North Alabama, 2016 ......... 83
Evaluation of Velum Total on Cotton for Root-knot Management in Central Alabama, 2016 ............ 85
Evaluation of Velum Total on Cotton for Reniform Nematode Management in North Alabama, 2016 87
A Potential New Biological Nematicide for Reniform Management in North Alabama, 2016 ........... 89
A Potential New Biological Nematicide for Root-knot Management in North Alabama, 2016 ........... 91
Varietal and Nematicidal Application Responses in Central Alabama Soils, 2016 ............................ 93
Cotton Variety Evaluation with and without Velum Total for Root-Knot Management in South Alabama, 2016 .......................................................................................................................... 95
Determination of Role of Salicylic Acid in Nematode-Induced Hypersensitive Responses ................ 97
Isolation of a Root Signal, Attracting a Semi-endoparasitic Nematode Rotylenchulus reniformis ..... 101
VII. Extras ............................................................................................................. 103
Continued Development of ACES Auburn Univ. Exp. Station Information Transfer for Alabama Row Crops, 2016 ............................................................................................................................ 103
Alabama Crop Production Mobile App Upgrade ......................................................................... 105
Agriculture Discovery Day ....................................................................................................... 107

9
I. Cotton Variety Trials
Enhancing Cotton Variety Selection through On-Farm Evaluations, 2016
D. Delaney, T. Cutts, D. Monks, and K. Glass
Enhancing Cotton Variety Selection in on-farm trials, was conducted in 2016. Cotton varieties
were supplied by: Delta and Pine Land, Bayer, Phytogen, and Americot seed companies. On-
farm trials were planted, maintained, and harvested by cooperating producers. Varieties included
were either Roundup Flex or glytol-tolerant and plots were initiated from late April through late
May, 2016. Trials were conducted by personnel in Alabama Cooperative Extension and Auburn
University at various on-farm locations throughout Alabama. The farm locations are selected
based on representative cotton acreage in the state, and the trial entries are the top performing
varieties for Alabama. The 2016 On-Farm Variety trials were hugely successful this year and
reflected the tremendous yields seen across Alabama. A summary of the data we collected is
presented in Tables 1 - 13.
Table 1. Cotton Lint Yield Means at 9 On-Farm Locations in Alabama in 2016. County Environment Lint Yield (lbs/A) Cherokee Dryland 1784 Macon Irrigated 1727 Franklin Dryland 1621 Chilton Dryland 1610 Washington Dryland 1562 Fayette Dryland 1433 Escambia Dryland 1385 Elmore Dryland 1285 Shelby Dryland 619 *MEANS ARE NOT SIGNIFICANTLY DIFFERENT.

10
Table 2. Cotton Lint Yield and Fiber Quality Means Across 9 On-Farm Locations in Alabama in 2016.
Variety Lint Yield (lbs/A)
Locations (#)
Lint Turn-Out (%)
Micronaire Fiber Length (in.)
Strength (g/tex)
Uniformity (%)
DP 1639 B2XF 1707 3 46 4.9 1.14 31.3 83 DP 1614 B2XF 1686 3 46 4.6 1.17 30.4 83 DP 1646 B2XF 1632 4 45 4.6 1.24 30.7 83 PHY 312 WRF 1629 2 45 3.7 1.20 31.9 84 PHY 333 WRF 1532 8 44 4.1 1.17 30.8 83 DP 1538 B2XF 1529 5 44 4.4 1.12 28.4 83 DP 1518 B2XF 1512 2 44 4.3 1.15 29.3 83 PHY 575 WRF 1492 2 41 3.9 1.19 29.9 83 DP 1522 B2XF 1455 2 44 4.5 1.17 32.9 83 PHY 495 WRF 1439 7 44 4.3 1.11 31.6 84 DP 1555 B2RF 1435 2 47 4.7 1.18 33.0 83 NG 5007 B2XF 1408 6 44 4.2 1.14 28.7 82 PHY 444 WRF 1385 8 45 3.6 1.24 31.4 84 ST 6182 GLT 1380 8 47 4.4 1.17 29.8 83 ST 4848 GLT 1367 9 44 4.2 1.14 30.9 83 FM 1739 GLT 1343 4 46 4.7 1.19 33.5 83 NG 3406 B2XF 1324 7 43 4.4 1.14 29.6 83 DP 1553 B2XF 1301 5 45 4.3 1.17 29.9 84 PHY 552 WRF 1267 2 45 4.1 1.18 34.2 84 PHY 487 WRF 1141 3 44 4.2 1.12 31.0 83 ST 4946 GLB2 1082 2 43 4.2 1.17 33.1 84 Average 1431 5 45 4.3 1.17 31.1 83 * MEANS NOT SIGNIFICANTLY DIFFERENT. ** LINT TURN-OUTS ON TABLE TOP GINS ARE TRADITIONALLY HIGHER THAN COMMERCIAL GINS. LINT YIELD AND LINT TURN-OUT SHOULD BE CONSIDERED ON A RELATIVE BASIS.
Table 3. Cotton Lint Yield Rank by Variety and Location in Alabama in 2016

11
Variety Avg Rank
Rank Cherokee Chilton Elmore Escambia Fayette Franklin Macon Shelby Washington
DP 1646 B2XF 2 + + 1 4 + + 1 + 1 DP 1555 B2RF 3 + + 4 2 + + + + + FM 1739 GLT 4 + 2 + 3 + + + 7 2 DP 1639 B2XF 4 + 5 + + + 3 + + 4 DP 1538 B2XF 4 + + 2 7 2 5 + + 6 PHY 333 WRF 5 4 1 8 + 4 1 2 9 9 NG 5007 B2XF 5 7 12 3 + 1 + + 1 5 DP 1553 B2XF 5 + 9 5 6 + + 5 2 + PHY 495 WRF 6 3 3 + 10 9 2 + 5 8 PHY 444 WRF 6 5 6 6 1 6 20 3 4 + NG 3406 B2XF 7 10 4 9 5 7 + + 3 11 ST 6182 GLT 7 1 8 12 9 5 + 4 10 7 DP 1614 B2XF 8 2 11 + + + 11 + + + PHY 487 WRF 8 + + 7 + 10 + + 8 + ST 4848 GLT 8 9 7 10 8 8 18 6 6 3 DP 1518 B2XF 9 + + + + 3 14 + + + PHY 575 WRF 10 + 10 + + + + + + 10 ST 4946 GLB2 10 + + + + + 9 + 11 + PHY 312 WRF 11 6 + + + + 15 + + + DP 1522 B2XF 14 8 + + + + 19 + + + PHY 552 WRF 14 + + 11 + + 17 + + + Total Entries 10 12 12 10 9 20 6 12 11 * '+' INDICATES VARIETY NOT PLANTED AT LOCATION. ** VARIETY MEANS NOT SIGNIFICANTLY DIFFERENT. VARIETIES AT SINGLE LOCATION EXCLUDED.
Table 4. Cotton Lint Yield by Percent (%) Rank Across On-Farm Locations in Alabama in 2016 Variety Lint Yield (lbs/A) Locations (#) % #1 % #2 % #3 % Top 3 DP 1646 B2XF 1632 4 75% 0% 0% 75% FM 1739 GLT 1343 4 0% 50% 25% 75% NG 5007 B2XF 1408 6 33% 0% 17% 50% PHY 333 WRF 1531 8 25% 13% 0% 38% NG 3406 B2XF 1324 7 0% 0% 14% 14% ST 6182 GLT 1380 8 13% 0% 0% 13% ST 4848 GLT 1367 9 0% 0% 11% 11%
*Varieties planted at 4 or more locations. Varieties at less than 4 locations excluded.
Table 5. 2016 Cotton On-Farm Variety Trial – Cherokee County, Alabama
Variety Rank Lint Yield (lbs/A)
Lint Turn-Out (%) Micronaire Length
(in.) Strength (g/tex)
Uniformity (%)
ST 6182 GLT 1 1933 48 4.4 1.20 31.1 84 DP 1614 B2XF 2 1920 47 4.7 1.21 31.1 85 PHY 495 WRF 3 1809 46 4.3 1.13 34.1 84 PHY 333 WRF 4 1780 46 4.0 1.20 31.3 83 PHY 444 WRF 5 1774 45 3.6 1.26 33.6 87 PHY 312 WRF 6 1760 45 3.9 1.21 33.6 85 NG 5007 B2XF 7 1756 45 4.3 1.19 29.5 83 DP 1522 B2XF 8 1716 44 4.8 1.18 32.0 85 ST 4848 GLT 9 1713 46 4.3 1.20 31.6 84 NG 3406 B2XF 10 1656 44 4.6 1.16 30.6 84 * LINT TURN-OUTS ON TABLE TOP GINS ARE TRADITIONALLY HIGHER THAN COMMERCIAL GINS. LINT YIELD AND LINT TURN-OUT SHOULD BE CONSIDERED ON A RELATIVE BASIS.
Table 6. 2016 Cotton On-Farm Variety Trial – Chilton County, Alabama
Variety Rank Lint Yield (lbs/A)
Lint Turn-Out (%) Micronaire Length
(in.) Strength (g/tex) Uniformity (%)
PHY 333 WRF 1 1883 44 4.0 1.15 29.4 83 FM 1739 GLT 2 1708 46 4.5 1.20 32.5 84 PHY 495 WRF 3 1677 43 3.7 1.09 32.5 83 NG 3406 B2XF 4 1673 42 4.2 1.10 29.9 84 DP 1639 B2XF 5 1635 43 4.8 1.11 31.0 84 PHY 444 WRF 6 1630 44 3.5 1.20 30.0 85 ST 4848 GLT 7 1592 43 4.0 1.06 28.8 82 ST 6182 GLT 8 1537 46 4.2 1.15 28.2 83 DP 1553 B2XF 9 1518 42 4.2 1.13 29.3 84 PHY 575 WRF 10 1502 41 3.7 1.16 28.9 84 DP 1614 B2XF 11 1492 43 4.5 1.12 29.9 81

12
NG 5007 B2XF 12 1472 43 4.2 1.10 27.5 82 * LINT TURN-OUTS ON TABLE TOP GINS ARE TRADITIONALLY HIGHER THAN COMMERCIAL GINS. LINT YIELD AND LINT TURN-OUT SHOULD BE CONSIDERED ON A RELATIVE BASIS.
Table 7. 2016 Cotton On-Farm Variety Trial – Elmore County, Alabama
Variety Rank Lint Yield (lbs/A)
Lint Turn-Out (%) Micronaire Length
(in.) Strength (g/tex) Uniformity (%)
DP 1646 B2XF 1 1537 45 4.6 1.24 30.7 83 DP 1538 B2XF 2 1457 47 4.7 1.10 31.7 83 NG 5007 B2XF 3 1390 45 4.5 1.12 29.4 80 DP 1555 B2XF 4 1365 48 4.6 1.18 33.7 83 DP 1553 B2XF 5 1279 45 4.4 1.19 30.1 84 PHY 444 WRF 6 1250 45 4.0 1.27 30.9 83 PHY 487 WRF 7 1223 44 5.1 1.11 29.1 81 PHY 333 WRF 8 1207 44 4.4 1.19 33.0 84 NG 3406 B2XF 9 1204 43 4.7 1.13 28.4 83 ST 4848 GLT 10 1190 45 4.8 1.14 30.7 82 PHY 552 WRF 11 1189 45 4.2 1.18 34.9 84 ST 6182 GLT 12 1132 48 4.3 1.16 30.7 84 * LINT TURN-OUTS ON TABLE TOP GINS ARE TRADITIONALLY HIGHER THAN COMMERCIAL GINS. LINT YIELD AND LINT TURN-OUT SHOULD BE CONSIDERED ON A RELATIVE BASIS.
Table 8. 2016 Cotton On-Farm Variety Trial – Escambia County, Alabama
Variety Rank Lint Yield (lbs/A)
Lint Turn-Out (%) Micronaire Length
(in.) Strength (g/tex) Uniformity (%)
PHY 444 WRF 1 1537 43 3.8 1.25 30.7 85.2 DP 1555 B2XF 2 1504 46 4.7 1.17 32.2 84.0 FM 1739 GLT 3 1502 48 4.5 1.18 32.7 81.9 DP 1646 B2XF 4 1448 44 n/a n/a n/a n/a NG 3406 B2XF 5 1374 43 4.6 1.10 28.5 82.6 DP 1553 B2XF 6 1351 44 4.4 1.17 28.7 84.3 DP 1538 B2XF 7 1344 45 4.8 1.09 26.4 83.9 ST 4848 GLT 8 1305 44 4.6 1.15 29.8 83.6 ST 6182 GLT 9 1252 47 4.7 1.26 34.2 81.6 PHY 495 WRF 10 1236 44 4.6 1.11 30.2 84.7 * LINT TURN-OUTS ON TABLE TOP GINS ARE TRADITIONALLY HIGHER THAN COMMERCIAL GINS. LINT YIELD AND LINT TURN-OUT SHOULD BE CONSIDERED ON A RELATIVE BASIS.
Table 9. 2016 Cotton On-Farm Variety Trial – Fayette County, Alabama
Variety Rank Lint Yield (lbs/A)
Lint Turn-Out (%) Micronaire Length
(in.) Strength (g/tex) Uniformity (%)
NG 5007 B2XF 1 1574 44 4.1 1.13 28.8 81.2 DP 1538 B2XF 2 1550 44 3.6 1.16 27.6 82.4 DP 1518 B2XF 3 1487 41 4.4 1.08 26.7 81.2 PHY 333 WRF 4 1470 43 3.8 1.14 29.1 81.7 ST 6182 GLT 5 1413 47 4.4 1.09 25.8 80.9 PHY 444 WRF 6 1391 43 3.5 1.24 29.8 82.9 NG 3406 B2XF 7 1360 42 4.4 1.15 28.1 82.8 ST 4848 GLT 8 1352 44 4.0 1.14 28.5 82.3 PHY 495 WRF 9 1303 45 4.5 1.10 30.1 83.9 * LINT TURN-OUTS ON TABLE TOP GINS ARE TRADITIONALLY HIGHER THAN COMMERCIAL GINS. LINT YIELD AND LINT TURN-OUT SHOULD BE CONSIDERED ON A RELATIVE BASIS.
Table 10. 2016 Cotton On-Farm Variety Trial – Franklin County, Alabama

13
Variety Rank Lint Yield (lbs/A)
Lint Turn-Out (%) Micronaire Length
(in.) Strength (g/tex) Uniformity (%)
PHY 333 WRF 1 2107 45 4.1 1.21 29.7 83 PHY 495 WRF 2 1947 43 4.6 1.21 29.3 85 DP 1639 B2XF 3 1887 46 4.6 1.13 33.2 84 DP 1538 B2XF 5 1724 45 4.6 1.14 29.2 82 ST 5115 GLT 8 1692 43 4.3 1.17 32.1 84 ST 4946 GLB2 9 1685 43 4.3 1.20 34.1 85 PHY 487 WRF 10 1660 45 3.8 1.16 34.0 85 DP 1614 B2XF 11 1646 48 4.6 1.17 30.2 82 ST 5115 GLT 12 1618 42 4.2 1.16 31.4 82 DP 1518 B2XF 14 1537 43 4.1 1.22 31.9 84 PHY 312 WRF 15 1498 44 3.4 1.19 30.1 83 PHY 552 WRF 17 1345 44 4.0 1.18 33.4 83 ST 4848 GLT 18 1308 46 3.9 1.19 34.2 85 DP 1522 B2XF 19 1194 43 4.2 1.16 33.8 82 PHY 444 WRF 20 1163 44 3.1 1.26 31.8 83 * LINT TURN-OUTS ON TABLE TOP GINS ARE TRADITIONALLY HIGHER THAN COMMERCIAL GINS. LINT YIELD AND LINT TURN-OUT SHOULD BE CONSIDERED ON A RELATIVE BASIS.
Table 11. 2016 Cotton On-Farm Variety Trial – Macon County, Alabama
Variety Rank Lint Yield (lbs/A)
Lint Turn-Out (%) Micronaire Length
(in.) Strength (g/tex) Uniformity (%)
DP 1646 B2XF 1 1795 45 4.4 1.18 30.2 81 PHY 333 WRF 2 1759 46 4.4 1.16 31.1 82 PHY 444 WRF 3 1749 47 3.7 1.22 32.4 84 ST 6182 GLT 4 1699 48 4.5 1.17 30.5 84 DP 1553 B2XF 5 1696 47 4.2 1.20 30.3 83 ST 4848 GLT 6 1663 45 4.3 1.16 32.0 83 * LINT TURN-OUTS ON TABLE TOP GINS ARE TRADITIONALLY HIGHER THAN COMMERCIAL GINS. LINT YIELD AND LINT TURN-OUT SHOULD BE CONSIDERED ON A RELATIVE BASIS.
Table 12. 2016 Cotton On-Farm Variety Trial – Shelby County, Alabama
Variety Rank Lint Yield (lbs/A)
Lint Turn-Out (%) Micronaire Length
(in.) Strength (g/tex) Uniformity (%)
NG 5007 B2XF 1 672 44 4.2 1.15 28.8 83 DP 1553 B2XF 2 662 45 4.3 1.15 30.9 83 NG 3406 B2XF 3 596 44 4.1 1.12 30.6 84 PHY 444 WRF 4 588 45 3.2 1.21 32.3 84 PHY 495 WRF 5 587 45 4.2 1.09 35.0 83 ST 4848 GLT 6 572 44 3.8 1.12 31.8 83 FM 1739 GLT 7 542 45 4.6 1.20 34.8 84 PHY 487 WRF 8 541 44 4.2 1.08 30.0 83 PHY 333 WRF 9 536 44 3.8 1.17 31.6 85 ST 6182 GLT 10 533 47 4.3 1.14 29.4 83 ST 4946 GLB2 11 479 42 4.0 1.13 32.0 83 * LINT TURN-OUTS ON TABLE TOP GINS ARE TRADITIONALLY HIGHER THAN COMMERCIAL GINS. LINT YIELD AND LINT TURN-OUT SHOULD BE CONSIDERED ON A RELATIVE BASIS.

14
Table 13. 2016 Cotton On-Farm Variety Trial – Washington County, Alabama
Variety Rank Lint Yield (lbs/A)
Lint Turn-Out (%) Micronaire Length
(in.) Strength (g/tex) Uniformity (%)
DP 1646 B2XF 1 1750 44 n/a n/a n/a n/a FM 1739 GLT 2 1621 46 4.9 1.18 33.0 83.2 ST 4848 GLT 3 1611 43 4.3 1.11 30.3 83.2 DP 1639 B2XF 4 1599 44 5.2 1.19 29.8 81.6 NG 5007 B2XF 5 1586 42 4.1 1.13 28.3 82.6 DP 1538 B2XF 6 1569 43 4.5 1.13 29.8 83.9 ST 6182 GLT 7 1539 45 4.0 1.16 28.5 83.7 PHY 495 WRF 8 1516 42 4.6 1.07 30.3 82.3 PHY 333 WRF 9 1510 40 3.9 1.15 31.1 83.4 PHY 575 WRF 10 1482 40 4.1 1.21 30.9 82.9 NG 3406 B2XF 11 1403 41 4.1 1.23 30.9 82.8 * LINT TURN-OUTS ON TABLE TOP GINS ARE TRADITIONALLY HIGHER THAN COMMERCIAL GINS. LINT YIELD AND LINT TURN-OUT SHOULD BE CONSIDERED ON A RELATIVE BASIS. **FIBER QUALITY ANALYSIS FOR THIS LOCATION PENDING.

15
Evaluation of Liberty Plus Dual Magnum in Liberty Link, Extend, and WideStrike Cotton Varieties
J. A. Tredaway, and A. Price
A field study was conducted at the Prattville Research Station in Prattville, AL to evaluate
treatments with and without Liberty, three cotton varieties including Liberty Link (LL),
WideStrike (WS), and Dicamba Tolerant cotton (DGT), and two nozzle types including a flat-fan
(FF) and a turbo teejet induction (TTI). Cotton varieties planted were LL variety Stoneville 4848,
WS variety Phytogen 333, and DGT variety Americot NG3406 B2XF. Liberty was applied at a
rate of 29 fl. oz./A and Dual Magnum at 21 fl.oz./A were applied at the 4-leaf and 8-leaf stages
of cotton. Herbicide induced injury was evaluated on a scale of 0-100% with 0 = no injury and
100% = total plant death. Cotton injury was evaluated at 7, 14, 21, and 28 days after treatment
(DAT). Herbicide injury was higher, on average, for all treatments on WS cotton varieties. Injury
ratings were also higher, on average, for treatments applied with TTI nozzles. Although injury
ratings were also higher for certain treatments, there were no differences in cotton yield and no
correlation between herbicide induced injury and cotton yield.

16
Breeding Cotton for Yield and Quality in Alabama
D. B. Weaver and J. Koebernick Cotton breeding at Auburn University began in 2001 with emphasis on yield and fiber quality
with an additional objective of identifying resistance to Rotylenchulus reniformis, reniform
nematode, and incorporating resistance into adapted genotypes. In August 2016, David Weaver
retired and Jenny Koebernick began as his successor.
Field experiments for 2016 included advanced and preliminary trials at the Plant Breeding Unit
(PBU) in Tallassee, and the Prattville Experiment Field with cultivar development as the
objective. Experimental lines developed for reniform nematode resistance were evaluated in both
nematode and non-nematode infested fields at Tennessee Valley Research and Extension Center
in Belle Mina. The Regional Breeders Testing Network (RBTN) was planted at Prattville, with
23 elite breeding lines evaluated for yield, agronomic traits and fiber quality traits against 5
adapted cultivars. Two elite Auburn lines were included in the test.
The results of the advanced trials gave one clear candidate to be advanced to the 2017 RBTN,
AU90098. It had yield superior to the checks in both locations tested and had good fiber quality
with fiber length of 1.21 inches, strength of 32 g/tex and a micronaire of 4.5. Preliminary trial
results demonstrated several superior lines for advancement into the 2017 advanced trials. The
nematode trial data is still being analyzed but the mean data indicate several promising lines to
pursue and incorporate within the cultivar development program. These lines have good yield
and quality. The yield and fiber quality means for the RBTN are in Table 1.

17
Table 1. Regional breeders testing network (RBTN) 2016 mean lint yield and fiber quality results from Prattville, AL. Entry Genotype Lint Yield Micronaire Length Uniformity Strength Elongation
lb/ac
in % g/tex %
1 TAM13Q-18 1003 b-f* 4.9 h-k 1.11 h-k 83.0 fg 30.6 f-j 5.9 g-j 2 TAM11L-24 1030 a-f 4.7 kl 1.27 a 86.2 a 34.5 a 5.2 lm 3 PD07040 764 g 5.0 g-j 1.16 cde 84.0 c-f 31.6 d-g 5.5 jkl 4 PD09084 1164 abc 5.1 f-i 1.13 e-i 84.8 bcd 32.3 cde 6.1 e-h 5 PD08028 1222 a 4.9 ijk 1.12 f-j 83.9 c-f 32.5 b-e 6.4 c-f 6 PD09046 1082 a-e 4.6 lm 1.21 BC 84.6 b-e 34.0 ab 5.0 m 7 Ark 0812-87ne 1172 abc 5.4 a-d 1.14 d-h 84.8 bcd 29.5 h-k 6.6 bcd 8 Ark 0818-23 931 d-g 5.2 c-f 1.14 d-i 84.2 c-f 31.0 d-h 6.2 d-h 9 Ark 0824-89 1028 a-f 5.5 ab 1.18 bc 85.5 ab 33.6 abc 6.1 d-h 10 Ark 0822-48 843 fg 5.6 a 1.15 c-f 84.3 b-e 30.9 e-i 6.9 ab 11 Ark 0819-89 1003 b-f 5.4 bcd 1.14 d-i 84.6 b-e 32.3 cde 6.8 abc 12 NM 13G1029 894 e 4.6 lm 1.13 e-i 83.0 fg 30.9 e-i 6.0 f-i 13 NM 13G2019 1116 a-d 4.9 ijk 1.15 d-g 84.1 c-f 31.8 def 6.5 b-e 14 AU77082 1128 a-d 5.4 a-d 1.11 h-k 83.8 c-f 30.4 f-j 5.6 i-l 15 AU82074 1104 a-e 4.8 kl 1.13 e-i 83.6 def 29.1 jk 5.8 h-k 16 GA 2011113 834 fg 5.3 c-f 1.09 jk 83.5 ef 31.9 def 6.0 f-i 17 GA 2012050 833 fg 5.1 f-j 1.14 d-i 84.9 bc 32.6 bcd 6.4 b-f 18 GA 2012082 924 d-g 5.1 e-i 1.13 d-i 84.4 b-e 30.4 f-j 6.3 d-g 19 GA 2012141 1103 a-e 5.3 c-f 1.15 def 84.7 b-e 31.1 d-h 6.2 d-h 20 MD 16-1 1186 abc 5.2 d-g 1.05 l 83.5 ef 29.1 jk 6.0 f-i 21 MD 16-2 1224 a 4.5 m 1.17 cd 84.3 c-f 34.2 a 6.1 e-h 22 MS 0152-3-11 1028 a-f 5.1 e-h 1.14 d-i 83.5 ef 29.0 jk 5.9 g-j 23 MS 0043-28-1 1137 a-d 5.3 b-e 1.08 k 83.5 ef 30.0 hij 6.0 f-i 24 DP 393 CK 1098 a-e 5.2 c-f 1.09 jk 84.2 c-f 30.5 f-j 7.2 a 25 DP 493 CK 1082 a-e 5.4 abc 1.04 l 81.9 g 28.4 k 5.4 klm 26 FM 958 CK 1083 a-e 4.9 jk 1.11 g-k 83.5 ef 30.1 g-j 5.4 klm 27 SG 105 CK 970 c-g 5.2 c-f 1.11 ijk 84.0 c-f 29.6 h-k 6.2 d-h 28 UA 222 CK 1207 ab 5.2 c-f 1.12 f-i 84.2 c-f 29.3 ijk 7.2 a LSD 95.4 0.22 0.035 1.25 1.62 0.45 *Within groups, means followed by the same letter do not differ at P=0.05
18
Varietal Response of Glufosinate Tolerant Cotton to Glufosinate and Other Tank Mixes
T. Sandlin, and J. Tredaway
Fourteen varieties of cotton were evaluated in this study for tolerance to glufosinate in
combination with other tank mixes. Cotton varieties were from three different companies and
were comprised of Stoneville: 4747 GLB2, 4848 GLT, 4946 GLB2; Phytogen: 333 WRF, 444
WRF, 499 WRF, 495 W3RF; Deltapine: 1518 B2XF, 1522 B2XF, 1612 B2XF, 1614 B2XF,
1725 B2XF, 15R513B2XF, 16R229B2XF. Each set of these varieties were treated with one of
the following combinations: (1) 29oz/A glufosinate (Liberty) + 32oz/A glyphosate (Roundup
Powermax II) (2) 29oz/A glufosinate (Liberty) + 32oz/A glyphosate (Roundup Powermax II) +
16oz/A S-Metolachlor (Dual Magnum) (3) 29oz/A glufosinate (Liberty) + 32oz/A glyphosate
(Roundup Powermax II) + 16oz/A s-metolachlor (Dual Magnum) + 0.5lb/A acephate (orthene).
Plots were planted on May 16th and treatments were applied on June 10th at approximately third
true leaf. Percent leaf burn was rated at three and seven days after application. Plots were
harvested on October 13th. Percent leaf burn increased in number at seven days for all varieties
versus the three-day rating. It is believed that percent leaf burn ratings were elevated for all
varieties in this test due to stressful environmental conditions. All varieties recuperated quickly
and new growth was unaffected. On average, percent leaf burn increased in number for all
companies represented as the number of products added to the tank mix increased (Table 1).
Percent leaf burn increased in number for most varieties as tank mix partners increased (Table 2).
Few significant differences were noted in lint yield in this test. Differences that were present are
not attributed to treatment effects (Table 3). Results from this study indicate that cotton response
to glufosinate in combination with the tank mixes in this test differ not only by brand but can
also differ by variety within and between brands. Extremes in environmental conditions can play
a significant role in the level of crop response observed from the treatments applied in this study.

19
Table 1. Average percent leaf burn of brand by herbicide treatment seven days after application. Brand Liberty + Roundup
average % leaf burn
Liberty + Roundup + Dual Magnum average
% leaf burn
Liberty + Roundup + Dual Magnum +
Orthene average % leaf burn Stoneville 14% 25% 29% Phytogen 56% 64% 72% Deltapine 25% 34% 46%
Table 2. Percent leaf burn of variety by herbicide treatment seven days after application.
Variety Liberty + Roundup % leaf burn
Liberty + Roundup + Dual Magnum %
leaf burn
Liberty + Roundup + Dual Magnum + Orthene
% leaf burn Stoneville 4747 GLB2 7.5 17.5 21.3 Stoneville 4848 GLT 16.3 28.8 36.3 Stoneville 4946 GLB2 17.5 30.0 30.0 Phytogen 333 WRF 60.0 61.3 77.5 Phytogen 444 WRF 51.3 65.0 72.5 Phytogen 495 W3RF 51.3 68.8 62.5 Phytogen 499 WRF 60.0 60.0 75.0 Deltapine 1518 B2XF 26.3 40.0 53.8 Deltapine 1522 B2XF 27.5 37.5 40.0 Deltapine 1612 B2XF 27.5 33.8 47.5 Deltapine 1614 B2XF 21.3 25.0 37.5 Deltapine 1725 B2XF 26.3 38.8 46.3 Deltapine 15R513 B2XF 20.0 30.0 57.5 Deltapine 16R229 B2XF 26.3 32.5 36.3
Table 3. Cotton lint yield pounds per acre of variety by herbicide treatment. Variety Liberty + Roundup Lint
yield lbs/acre Liberty + Roundup +
Dual Magnum Lint yield lbs/acre
Liberty + Roundup + Dual Magnum +
Orthene Lint yield lbs/acre
Stoneville 4747 GLB2 1630.2 1789.9 1892.2 Stoneville 4848 GLT 1845.8 1774.6 1766.5 Stoneville 4946 GLB2 1895.3 1963.3 1759.5 Phytogen 333 WRF 1942.7 1800.0 2009.4 Phytogen 444 WRF 1630.6 1710.5 1726.2 Phytogen 495 W3RF 1810.1 1902.2 1890.3 Phytogen 499 WRF 1783.1 1792.3 1868.8 Deltapine 1518 B2XF 1803.8 1819.5 1930.8 Deltapine 1522 B2XF 1758.1 1837.5 1899.0 Deltapine 1612 B2XF 1708.5 1735.4 1679.4 Deltapine 1614 B2XF 1809.5 1693.1 1935.0 Deltapine 1725 B2XF 1897.5 1817.7 1995.9

20
Deltapine 15R513 B2XF 1711.9 1662.6 1898.1 Deltapine 16R229 B2XF 1886.8 1813.6 2103.9
Develop a Customized CRISPR-Cas9 System for Cotton and Generate Transgenic Cotton Varieties with Enhanced Drought
Tolerance
Y. Wang, S. W. Park, C. Chen, S. Li, J. W. Kloepper, M. R. Liles, S. H. Wang, and J. Zhang
1. Accomplishments to date 1.1. Develop a customized CRISPR-Cas9 genome engineering system for cotton. a. Analysis of drought-resistance related genes The mitogen-activated protein kinase (MAPK) cascades are conserved pathways through which extracellular stimuli are transduced into intracellular responses in all eukaryotes [1, 2]. In plants, MAPK cascades have been shown to regulate a number of essential biological processes, including stress responses such as drought [3]. Based on the sequence homology and conserved phosphorylation motifs, MAPKs are classified into four major groups (A-D). A novel stress-responsive group D MAPK from cotton, GhMPK16, is reported to be involved in disease resistance and drought sensitivity through induction of chemical and biological signals [4]. Ectopic expression of GhMPK16 in Arabidopsis led to obvious more drought-sensitive plants. Therefore, inactivation or a decrease in the expression of this gene is speculated to decrease the drought-sensitivity and thus improve the drought resistance in different environments. As reported by Guo et al. [4], GhMPK16 is also related with pathogen resistance against fungi and bacteria, and thus the knockout of this gene is undesirable from this sense. Fortunately, sequence analysis revealed that the promoter region (785 bp) contains several motifs probably related to pathogen and drought tolerance separately. Among these motifs, the Box-W1 element is a fungal elicitor responsive element (Fig. 1), and the MBS element is responsible for MYB binding site involved in drought-inducibility. To decrease drought sensitivity while reserving its pathogen sensitivity, the MBS box is a rational choice as the target sequence to be knocked out.

21
Fig. 1. Taken from Figure 5 in Shi et al. [4]. Nucleotide sequence of the promoter region of GhMPK16. The predicted transcription initiation site is indicated (+1, A). The start codon is marked with an asterisk, and the putative core promoter consensus sequences (TATA-box and CAAT-box) are highlighted in grey. The putative cis-acting elements are indicated by boxes and their corresponding names are given above each element. Arrows indicate the direction of the cis-element. Box-W1 is a fungal elicitor responsive element, ERE is an ethylene-responsive element, the MBS binding site is involved in gene induction in response to drought-inducibility and the TCA-element is a cis-acting element involved in SA-responsive. b. Development of CRISPR-Cas9 system for cotton To construct the CRISPR-Cas9 system to delete the MBS box in Gossypium hirsutum, the plasmid HBT-pcoCas9 which harbors the plant codon–optimized Cas9 gene under the hybrid constitutive 35SPPDK promoter was used as the mother vector [5]. The 352 bp fragment containing the U6 polymerase III promoter and 20 nt sequence (5’CAATTTATATAATTCCAGTT-3’) targeting on the MBS box region, was amplified from pUC119-gRNA using primers YW1759 and YW1760 (Table 1; Lane 1, Fig. 2a). Primers YW1761 and YW1762 were used to amplify the 175 bp fragment (Lane 2, Fig. 2a) containing the 20 nt targeting sequence with the terminator. Then the whole sequence, including the promoter, 20nt sequence, and the terminator was amplified using YW1759 and YW1762 through SOE (Splicing by Overlap Extension), and was inserted into the EcoRI site of HBT-pcoCas9 through Gibson Assembly. Positive plasmid was verified through colony PCR (cPCR) and named as pCotton1 (Lanes 1, 3, 7 and 8, Fig. 2b). Table 1 Primers used in this study.
Primers Sequence (5’-3’) YW1759 GATGATAAGCTGTCAAACATGAGAATTCAGAAATCTCAAAATTCCG YW1760 AACTGGAATTATATAAATTGAATCACTACTTCGTCTCT YW1761 CAATTTATATAATTCCAGTTGTTTTAGAGCTAGAAATAGC YW1762 GAAACAGCTATGACCATGATTACGAATTCTAATGCCAACTTTGTACA a) b) Fig. 2. Construction of plasmid pCotton1. a) Amplification of fragment containing the promoter and the 20 nt targeting sequence (Lane 1) and the fragment containing the 20 nt sequence with the terminator (Lane 2); b) Positive plasmid verification through colony PCR. Genetic mutations in plants can be introduced through the non-homologous end-joining (NHEJ) or homology directed repair (HDR) by providing a DNA editing template [6]. Higher repair efficiency was observed with NHEJ than HDR in Arabidopsis [5]. pCotton1 was designed as the
M 1 2 3 4 5 6 7 8 M 1 M 2
22
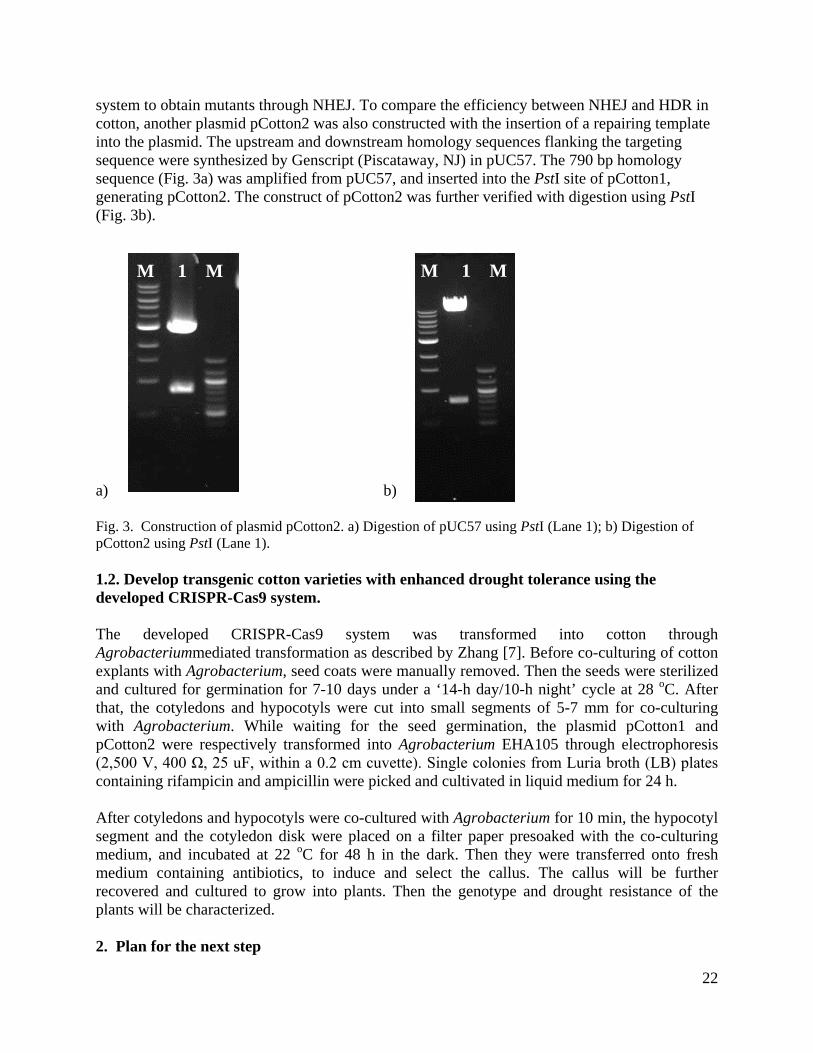
system to obtain mutants through NHEJ. To compare the efficiency between NHEJ and HDR in cotton, another plasmid pCotton2 was also constructed with the insertion of a repairing template into the plasmid. The upstream and downstream homology sequences flanking the targeting sequence were synthesized by Genscript (Piscataway, NJ) in pUC57. The 790 bp homology sequence (Fig. 3a) was amplified from pUC57, and inserted into the PstI site of pCotton1, generating pCotton2. The construct of pCotton2 was further verified with digestion using PstI (Fig. 3b). a) b) Fig. 3. Construction of plasmid pCotton2. a) Digestion of pUC57 using PstI (Lane 1); b) Digestion of pCotton2 using PstI (Lane 1). 1.2. Develop transgenic cotton varieties with enhanced drought tolerance using the developed CRISPR-Cas9 system. The developed CRISPR-Cas9 system was transformed into cotton through Agrobacteriummediated transformation as described by Zhang [7]. Before co-culturing of cotton explants with Agrobacterium, seed coats were manually removed. Then the seeds were sterilized and cultured for germination for 7-10 days under a ‘14-h day/10-h night’ cycle at 28 oC. After that, the cotyledons and hypocotyls were cut into small segments of 5-7 mm for co-culturing with Agrobacterium. While waiting for the seed germination, the plasmid pCotton1 and pCotton2 were respectively transformed into Agrobacterium EHA105 through electrophoresis (2,500 V, 400 Ω, 25 uF, within a 0.2 cm cuvette). Single colonies from Luria broth (LB) plates containing rifampicin and ampicillin were picked and cultivated in liquid medium for 24 h. After cotyledons and hypocotyls were co-cultured with Agrobacterium for 10 min, the hypocotyl segment and the cotyledon disk were placed on a filter paper presoaked with the co-culturing medium, and incubated at 22 oC for 48 h in the dark. Then they were transferred onto fresh medium containing antibiotics, to induce and select the callus. The callus will be further recovered and cultured to grow into plants. Then the genotype and drought resistance of the plants will be characterized. 2. Plan for the next step
M 1 M M 1 M

23
Now, we developed the CRISPR-Cas9 system for cotton, and we carried out the transformation with Agrobacterium to obtain the transgenic cell lines. Next, we will continue the work as proposed to recover the plants from transgenic cells and characterize the genotype of the transgenic plants. Furthermore, we will characterize the transgenic variety for their drought resistance.
Induction and selection of stable transgenic cell lines Fig. 4. Development of transgenic cotton varieties through co-culturing with Agrobacterium harboring the developed CRISPR-Cas9 system. References
1. I.E. Somssich, MAP kinases and plant defence, Trends in Plant Science, 2 (1997) 406-408. 2. C. Widmann, S. Gibson, M.B. Jarpe, G.L. Johnson, Mitogen-activated protein kinase: conservation of a
three-kinase module from yeast to human, Physiological reviews, 79 (1999) 143-180. 3. J. Colcombet, H. Hirt, Arabidopsis MAPKs: a complex signalling network involved in multiple biological
processes, Biochemical Journal, 413 (2008) 217-226. 4. J. Shi, L. Zhang, H. An, C. Wu, X. Guo, GhMPK16, a novel stress-responsive group D MAPK gene from
cotton, is involved in disease resistance and drought sensitivity, BMC molecular biology, 12 (2011) 1. 5. J.-F. Li, J.E. Norville, J. Aach, M. McCormack, D. Zhang, J. Bush, G.M. Church, J. Sheen, Multiplex and
homologous recombination-mediated genome editing in Arabidopsis and Nicotiana benthamiana using guide RNA and Cas9, Nat. Biotechnol., 31 (2013) 688-691.
Seeds Remove seed coat Germination (for 7 - ) d 10
Explants cut Co - culture (for 10 min) Co - culture ( for 48 h)
Recovery of plants from transgenic cells
Genetic detection and drought - resistance test.

24
6. T. Gutschner, M. Hämmerle, G. Genovese, G.F. Draetta, L. Chin, Cas9 protein engineering for cell cycle-specific genome editing to enhance homology directed repair, Cancer Res., 76 (2016) 71-71.
7. B. Zhang, Transgenic cotton, Humana Press, 2013.

25
8.
II. Cultural Management
Continued Support of Long-term Crops Research
D. P. Delaney, K. Balkcom, and T. Cutts The “Old Rotation” experiment (circa 1896) is the oldest, continuous cotton study in the world
and the third oldest field crops experiment in the U.S. on the same site. With the renewed
interest in cover crops, we believe that this is the oldest “cover crop” study in the U.S. and it is
beginning to get more international attention. Many students at Auburn are using this study for
special-problems research, as well as graduate students from other Universities in Alabama,
while soils from the Old Rotation have been shared with researchers in Ohio, Louisiana and
Texas.
Corn and cotton yields reflect soil moisture and N availability more than any other factors.
There was a response to irrigation in 2016 by cotton, corn and soybean. Wheat always follows
corn and soybean is double-cropped behind wheat. Wet spring weather contributed to delayed
planting of summer crops, while extremely hot and dry late summer weather contributed to lower
yields for later planted crops, esp. double-cropped soybeans.
Six soil moisture monitors were installed and monitored again in 2016 to optimize irrigation
amounts and timing. A camera overlooking the Old Rotation allows visitors to the Old Rotation
web site to view a live image of crops growing on the Old Rotation.
http://cses.auburn.edu/old-rotation/live-cam/

26
Crop yields on the OLD ROTATION in 2016. Plot No.
Description Clover dry matter* (lb/a)
Wheat (bu/a)
Corn (bu/acre)
Cotton lint (lb/acre)
Soybean (bu/acre)
Irrigated Non- irrigated
Irrigated Non- irrigated
Irrigated Non- irrigated
Irrigated Non- irrigated
1 no N/no legume 0 0 723 334 2 winter legume 1764 3900 1389 798 3 winter legume 1232 2549 1389 854 4 cotton-corn 2066 2967 1690 1014 5 cotton-corn + N 1388 3203 1342 1023 6 no N/no legume 0 0 685 404 7 cotton-corn 1271 2901 44.3 65.5 8 winter legume 1140 2665 1333 967 9 cotton-corn + N 1597 2370 178.8 74.6 10 3-year rotation - - 45.6* 50.3 25.9 11 3-year rotation 0 0 1183 835 12 3-year rotation 3039 3217 188.7 73.5 13 cont. cotton/no
legume, +N 0 0 798 826
Mean 1687 2971 137.3 71.2 1170 784 *Winter legume and wheat ares not irrigated. Average total N fixed by legume is 60 lb. N/acre.

27
On-Farm Grid Soil Sampling Demonstration for Variable Rate Nutrient Applications in Cotton Systems
B. A. Dillard, J. Kelton, R. Yates, C. Hicks, T. Sandlin, K. Wilkins
Variable-rate (VR) fertilizer and lime applications in cotton production are being utilized
throughout Alabama due to the economic benefits for growers using this technology. VR
applications can increase yield uniformity across a field, reduce total amounts of material
being applied, and, ultimately, lead to higher profit returns. To implement variable-rate
applications on-farm, it is necessary to know in-field soil variabilities that traditional soil
sampling techniques cannot provide. Grid soil sampling within a field can allow for the
development of a prescription map to tailor nutrient applications to site-specific needs
rather than uniform applications across a field. Most growers that adopted some type of
VR applications have relied on a third party to sample fields; however, the added costs of
this service can make it impractical for some producers, particularly smaller operations.
With easier technology and grid soil analysis offered through the Auburn University Soils
Lab, growers now have the ability to sample their own fields which can reduce costs for
adopting VR applications. The objective of this project is to demonstrate to growers
effective sampling methods for implementing grid soil sampling to allow for site-specific
nutrient applications.
There is a need for reduced input costs for Alabama cotton production in order for the
state’s growers to continue to be profitable. Using variable rates for fertilizer and lime
applications within a field can reduce overall production costs while maximizing yield
potentials. Use of grid soil sampling can be an expensive initial investment but with net
savings in inputs during the season. Growers who choose to grid soil sample themselves
can reduce some of these upfront costs while still being able to utilize VR applications.
By demonstrating to producers how they can implement grid sampling, we expect to see
an increase in VR adoption, increase in cotton yield, and reduced inputs of fertilizer and
lime for those fields using variable-rate applications.
28
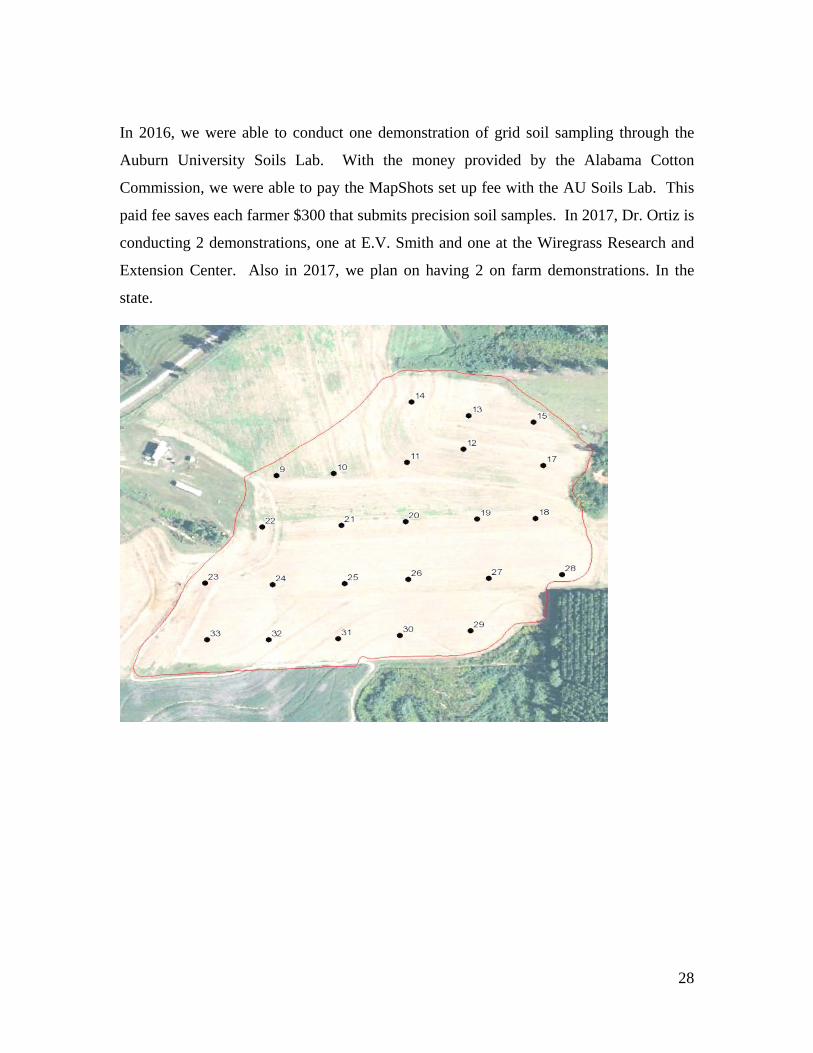
In 2016, we were able to conduct one demonstration of grid soil sampling through the
Auburn University Soils Lab. With the money provided by the Alabama Cotton
Commission, we were able to pay the MapShots set up fee with the AU Soils Lab. This
paid fee saves each farmer $300 that submits precision soil samples. In 2017, Dr. Ortiz is
conducting 2 demonstrations, one at E.V. Smith and one at the Wiregrass Research and
Extension Center. Also in 2017, we plan on having 2 on farm demonstrations. In the
state.

29
Comparison of On-Farm Irrigation Scheduling Practices in Southeast Alabama Crop Production
B. A. Dillard, J. Kelton, and A. Bouselm
The objective for the first year was to “blind fold” the farmers and evaluate their irrigation practices by the data from the soil moisture probes. In 2017, we will be conducting research at the Wiregrass Research & Extension Center to compare different irrigation scheduling methods while monitoring them with soil moisture probes. We will also be back onto the farms with these probes to compare farmers from last year to this year with using the moisture probes.

30
III. Disease Management
Potassium Rate and Source Effect on Target Leaf Spot
D. Delaney, A. Hagan, and T. Cutts Target leaf spot in cotton has become a major problem in many areas of south & central
Alabama. Soil fertility/plant pathology work in Texas has shown that potassium rate and source
can affect leaf retention and improve plant health in cotton. Their results indicate that a liquid
formulation of potassium fertilizer applied in a 4 X 4 band one month prior to planting decreased
the occurrence of certain leaf spot diseases and increased cotton yield significantly. These
benefits were realized even when the soil test level was ‘high’ and no potash was recommended.
Methods
As part of a regional effort, an experiment was conducted at the EV Smith Field Crops Unit
under irrigation with varying application methods and rates of potassium applied pre-plant. The
10 treatments in the trial included factorial combinations of five rates of K (0, 40, 80, 120, or 160
lb/A) and two application methods (liquid K injected 6-8 inches deep and 4 inches away from the
seed furrow, or dry K surface broadcast) applied 3 weeks before planting. Soil samples were
taken in increments from 0-6, 6-12, and 12-24 inches before K application and sent to a central
lab for testing.
PHY 499WRF was planted in 36-inch rows in mid-May and managed under irrigation for high
yields with lush growth conducive to Target Spot infestation. Stand counts and early season
vigor measurements were taken. Leaf samples were taken at First Bloom + 2 weeks and sent to a
central lab for analysis. Ratings were taken of Target Spot when severe enough to rate. At
maturity, measurements were taken of first fruiting branch, total nodes, plant height and nodes
above cracked boll. After defoliation, cotton was harvested and weighed, followed by ginning of
samples, with turnout and seed weights recorded. Lint samples were sent for Cotton
Incorporated for quality analysis.
Results
Although pre-application soil samples showed K levels rated in the Low to Very Low Ranges,
there were no differences in yield (p < 0.10) noted between the different K application rates or
methods, with lint yields averaging 1135 lb/A for the trial.

31
Significant differences were noted for seedling Vigor, with the 120 lb/A K treatment slightly less
vigorous than the 40 lb rate. There was a small but statistically significant interaction of K rates
and placement with no clear trend (0.42 – 0.44) for lint turnout. Broadcast dry K applications
increased micronaire vs deep liquid (4.41 vs 4.26), while increasing rates also increased
micronaire (40 lb K = 4.20 vs 160 lb K = 4.43).
There were also no significant differences noted for Target Spot ratings, early defoliation, or lint
length, strength or uniformity, but there were small but significant differences for lint color noted.

32
Potassium Rate Effects on Leaf Spots and Yield
C. Hicks, B. Dillard, K. Wilkins, W. Birdsong, M. Runge, G. Harris
The objective of this study was to determine the best potassium rates for two new cotton cultivars, DeltaPine 1646 B2XF and Phytogen 444 WRF. Fiber quality data, petiole potassium percentage and leaf spot ratings were also taken. The study was conducted at the following Auburn University Research Stations: Tallassee, Prattville, Brewton, Headland and Fairhope. Soil samples were taken at each location before planting. Tests were replicated four times in randomized complete blocks. Potassium source was 0-0-60 and the foliar potassium source was KNO3. Foliar potassium applications were made the first and third weeks of bloom at 5 lbs K/acre. Petiole samples were taken one week after the last foliar application.
Table 1. Lint Yields lb/acre by Treatment
Location 1/2 Soil
Test Rate
Soil Test Rate
Soil Test Rate plus two foliar
app
2X soil
test rate
2X soil
test rate split
Brewton 1305 a 1348 a 1350 a 1322 a 1233 a Fairhope 1341 b 1492 ab 1459 ab 1691 a 1667 a Prattville 1001 a 1006 a 1044 a 1021 a 960 a Headland 1685 a 1643 a 1701 a 1740 a 1569 a
*Numbers in the same row with the same letter are not significantly different.
Table 2. Fiber Quality by Treatment Treatment MIC LEN STR UNIF ½ Soil Test Rate 4.10667 a 1.193333 a 30.4567 b 83.7967 ab Soil Test Rate 4.15667 a 1.197000 a 30.9100 ab 83.6433 b Soil Test Rate + 2 Foliar App 4.06667 a 1.197667 a 30.7300 ab 84.1500 ab 2X Soil Test Rate 4.19000 a 1.197667 a 31.1467 a 84.3433 a 2X Soil Test Rate in Split App 4.18667 a 1.192333 a 31.0667 ab 83.9800 ab
*Numbers in the same row with the same letter are not significantly different.
Table 3. Fiber Quality by Variety Variety MIC LEN STR UNIF PHY 444 3.81200 b 1.201600 a 32.0240 a 84.5960 a DP 1646 4.47067 a 1.189600 b 29.7000 b 83.3693 b
*Numbers in the same column with the same letters are not significantly different.

33
Figure 1. Petiole percent by variety. Table 4. Plant, Harvest Date and K rates used.
Figure 2. Visual Leaf Spot Ratings.
Summary Fairhope was the only location with a significant lint yield difference. The 2X soil test rate and 2X soil test rate in split applications resulted in significantly higher lint yields than the ½ soil test rate at Fairhope. No other differences for lint yield were seen among treatments or variety. Percent petiole K was not significant by treatment, but Phytogen 444 WRF had significantly higher percent of petiole potassium than DeltaPine 1646 B2XF. Further investigation is needed to detect any yield response by treatment across environment.
0.00.51.01.52.02.53.03.54.04.5
1/2 Soil TestRate
Soil Test Rate Soil Test Rateplus 2 Foliar
Apps
2X Soil TestRate
2X Soil TestRate Split
Leaf Spot Visual Average Ratings (1-5 scale with 5 being more leaf spots)
DP 1646
PHY 444
Location Plant Date 2016
Harvest Date 2016
Soil Test Recommended K
Rate used Brewton May 5 Oct 5 120 lbs Fairhope May 9 Sept 29 120 lbs Prattville May 10 Nov 7 40 lbs Headland May 6 Oct 20 140 lbs Tallassee May 13 Sept 23 100 lbs

34
Evaluation of Commercial Cotton Cultivars for Resistance to Fusarium Wilt and Root-knot Nematode, 2016
K. S. Lawrence, K. Glass, D. Monks
Fourteen cotton cultivars were evaluated for resistance to Fusarium wilt and Root-knot
nematodes at the Plant Breeding Unit near Tallassee, AL on a Kalmia loamy sand (80% sand,
10% silt, 10% clay). The field has a history of continuous cotton production and natural
infestations of the causal agents of Fusarium wilt (Fusarium oxysporum f. sp. vasinfectum) and
root-knot nematode (Meloidogyne incognita). Plots consisted of one row with 1m row spacing,
four replications, and rows were 6 m long with 3 m alleys. Sixteen commercially available
cotton varieties commonly grown in the region were tested for resistance or tolerance to
Fusarium wilt and the root-knot nematode and compared to a susceptible check Rowden and a
resistant check M-315. Fertilizer and pesticide management practices were applied as necessary
according to the Alabama Cooperative Extension System recommendations. The trial was
planted 1 June. Four disease incidence evaluations were made throughout the growing season on
July 13, July 27, August 17, and Sept. 1. Root-knot egg counts were obtained from three whole
root systems per plot at 63 DAP. Plots were harvested 11 Nov. Data were analyzed by ANOVA
using PROC GLIMMIX with SAS 9.4 (SAS Institute, Inc., Cary, NC) and means compared with
Tukey’s HSD test at the alpha ≤ 0.05 level.
Fusarium wilt incidence ranged from 0.9 to 56 % for the two control M-315 resistant and the
susceptible check Rowden, respectively. All varieties were statistically similar to the resistant
check, M-315, although ST 6182 GLT did support the most Fusarium wilt of the commercial
varieties available to producers. Root-knot nematode eggs ranged from 345 on the resistant
check to 2758 eggs on the Americot NG 3522 B2XF which was a larger population than the
susceptible check Rowden supported. Although no statistically significant differences were
identified between varieties, there is a broad range of egg reproduction factors. Root-knot
nematode eggs per gram of root fresh weight ranged from 23.7 per gram in the resistant check to
159.5 eggs per gram in Americot NG 3522 B2XF with the greatest eggs/g root. Seed cotton
yields among varieties were very low in the non-irrigated field. Ranking the cotton yields

35
indicted PHY 495 W3RF produced the highest yield followed by ST 6182 GLT, DP 1614 B2XF,
Americot NG 3522 B2XF, PHY 552 WRF, and ST 4848 GLT.
Table 1. Commercial cotton variety response to Fusarium wilt and Meloidogyne incognita
nematode in central Alabama, 2016. Meloidogyne incognitay Fusarium wilt Seed cotton
yield Variety Eggs total Eggs/ g root % incidence lb/A DP 1553 B2XF 623 35 6.3 b 1002 DP 1614 B2XF 1355 82 9.2 b 1394 DP 1639 B2XF 1480 59 7.9 b 327 DP 1646 B2XF 732 44 4.2 b 1002 ST 4848 GLT 1030 80 9.9 b 1242 ST 6182 GLT 868 67 17.3 b 1634 DynaGro DG 3526 B2XF 1001 61 9.2 b 1212 Americot NG 3522 B2XF 2758 160 7.2 b 1300 PHY 312 WRF 737 35 2.3 b 951 PHY 444 WRF 1005 35 5.2 b 1176 PHY 552 WRF 704 48 8.2 b 1242 PHY 495 W3RF 650 60 7.1 b 1822 Rowden 1409 113 56.5 a 755 M-315 435 24 0.9 b 276 zObservations followed by the same letters within a column are not significantly different. yData were analyzed by ANOVA using PROC GLIMMIX with SAS 9.4 (SAS Institute, Inc., Cary, NC) and means compared with Tukey’s HSD test at the α≤0.10 level.

36
Verticillium Wilt On-farm Cotton Cultivar Evaluations, 2016
K. S. Lawrence, B. Meyer, T. Raper, T. Cutts, T. Sandlin, and C. Burmester Twenty-four cotton cultivars were planted and evaluated for resistance to Verticillium dahliae.
The trial was planted on the Tate farm in northern Alabama. Plots were one row each,
approximately 500 feet long and replicated 4 times. The field was irrigated with a drip tape
irrigation system. Disease ratings were taken September 16. In 10 ft sections of in each plot, total
number of plants were determined, and stems were cut longitudinally to assess disease incidence.
Disease severity ratings of foliar symptoms were evaluated on a scale from 1 to 5 with 1= no
foliar wilting, 3= interveinal chlorosis and necrosis of the leaves, and 5=completely defoliated
plants. The trial was harvested on 11 Nov. Analysis of variance was conducted using SAS 9.4
(SAS Institute), and means were compared using Tukey-Kramer Honest Significant Difference
(HSD) (α ≤ .10).
Verticillium wilt pressure was moderate to high during the 2016 season with 37 to 81%
Verticillium wilt present in each plot. The cultivars with the lowest incidence of Verticillium
wilt were PHY 243 WRF and ST 4747 GLB2 with the 5 and 11% of the plants infected with
Verticillium. ST 4747 GLB2 was the cultivar with the lowest disease severity (<2) rating in the
last three years of testing. This year PHY 243 WRF, PHY 223 WRF, and PHY 308 WRF, were
the three cultivars with severity ratings significantly less than and ST 6182 GLT and similar to
our standard resistant cultivar ST 4747 GLB2. These three PHY cultivars and the ST 4747GLB2
yielded up to 35% higher than the most susceptible ST 6182 GLT low yielding cultivar. ST
4747 GLB2, PHY 312 WRF, PHY 333 WRF, and PHY 499 WRF all produced yields over 3400
lb/A.

37
Table 1. Commercial cotton variety response to Verticillium dahliae on the Tate farm in northern Alabama, 2016.
Cultivar
Disease incidencex Disease severityy Seed cotton lb/A
CROPLAN X1516 B2XF 41 a-d z 2.3 ab 2773 CROPLAN 3885 B2XF 69 a 2.8 ab 2087 DP 1612 B2XF 50 abc 2.8 ab 3375 DP 1614 B2XF 38 a-d 2.9 ab 2999 DP 1518 B2XF 26 a-d 1.9 ab 3368 DP 1522 B2XF 33 a-d 2.3 ab 3409 DPLX 15R513 B2XF 21 a-d 2.5 ab 3360 DPLX 15R535 B2XF 28 a-d 2.0 ab 3327 DPLX 16R225 NRB2XF 30 a-d 2.1 ab 2779 PHY 223 WRF 25 a-d 1.8 b 3169 PHY 243 WRF 5 d 1.7 b 3408 PHY 308 WRF 16 bcd 1.8 b 2882 PHY 312 WRF 17 a-d 2.6 ab 3537 PHY 333 WRF 18 a-d 2.5 ab 3452 PHY 339 WRF 26 a-d 2.0 ab 3328 PHY 444 WRF 32 a-d 2.6 ab 3520 ST 4747 GLB2 11 cd 2.0 ab 3594 ST 4946 GLB2 22 a-d 2.6 ab 3372 ST 4848 GLT 18 a-d 2.4 ab 2901 ST 4949 GLT 27 a-d 2.4 ab 2995 ST 5032 GLT 22 a-d 2.5 ab 3192 ST 5115 GLT 35 a-d 2.7 ab 3093 ST 6182 GLT 59 ab 3.7 a 2308 ST 1776 GLT 41 a-d 3.0 ab 2826 x Disease incidence is the percent number of plants with vascular discoloration in a 10 ft of row. y Disease severity ratings ranged from 1-5 with 1 = no disease or foliar wilting, 3 = interveinal chlorosis and necrosis of the leaves with 40-60 % defoliation and 5 = 70 -100 % defoliation. z Column numbers followed by the same letter are not significantly different at P=0.1 as determined by the Tukey-Kramer method.

38
Fungicide Treatments to Combat Seedling Disease in North Alabama, 2016
D. Dyer, K. S. Lawrence, S. Till, D. Dodge, W. Groover, N. Xiang, and M. Hall
Six fungicides treatments were tested for their ability to control seedling disease on cotton
caused by R. solani. This test was conducted at Auburn University’s Tennessee Valley Research
and Education Center, which is located near Belle Mina, AL. This field has been planted to
cotton for over 16 years. The field contains a Decatur silt loam soil type with consist of 24%
sand, 49% silt, and 28% clay. All treatments were applied to the cotton as seed treatments and
the cotton variety used during the test was NexGen 3406 B2XF. Base fungicide treatments
consisted of Metalaxyl, Fludioxonil, and Myclobutanil. Premium fungicide treatments consisted
of Metalaxyl, Difenoconazole, Myclobutanil, and Azoxystrobin. Metalaxyl, Difenoconazole,
Myclobutanil and Fludioxonil are products of Albaugh LLC, Ankeny, Iowa. This test was
planted on the 19th of April, planting depth was 2.5 cm and the soil temperature at the time of
planting was 25°C. R. solani inoculum was applied to the test at the time of planting. Each test
plot consisted of 4 rows that were 7 m long with a row spacing of 1-meter, the test replicated 5
time and arranged in a randomized complete block design. The test was maintained throughout
the season with standard insecticide, herbicide, and fertilizer practices recommended by the
Alabama Cooperative Extension System. Test plots were watered as needed through the use of a
lateral irrigation system. Plant stands were determined by counting the total number of seedlings
in the 7 meters of row. These counts were conducted at 15 and again at 30 days after planting
(DAP). The test was harvested and yield data was collected on the 28 of September. Data was
analyzed with SAS 9.4 using PROC GLIMMIX and LS-means were compared using Tukey’s
method (P ≤ 0.1). Average monthly high temperatures for the area from the time of planting
until harvest were 24, 27, 34, 34, 33, and 33°C and average monthly low temperatures were 11,
15, 21, 22, 22, and 18°C. The average high temperature through the growing season was 31°C
which is normal for area. Rainfall accumulation for each month during the growing season was
8.43, 3.45, 4.06, 6.93, 12.73, and 0.30 centimeters with a total rainfall amount of 35.91 cm.
The average plant stand 15 DAP for the non-inoculated plots was 73 and average stand for plots
inoculated with R. solani was 64. Both the inoculated and non-inoculated plots were within the
optimal range of 8-12 plants per meter of row at 15 DAP. The average plant stand counts at 30

39
DAP were 69 for the non-inoculated plots and 62 for the plots inoculated with R. solani. Both
the inoculated and non-inoculated plots were within the optimal range of 8-12 plants per meter of
row at 30 DAP. The highest stand counts occurred in the treatment of base fungicide + premium
fungicide + Biost Nematicide for both inoculated and non-inoculated plots. This three-way
combination treatment supported a greater stand than the untreated control and base fungicide in
the natural disease incidence plots and, the base fungicide + premium fungicide + SAR, and the
Base fungicide + Vibrance CST in the inoculated plots. In the non-inoculated plots, the treatment
of base fungicide + premium fungicide and the base fungicide + premium fungicide + SAR
supported the highest yield producing 584 and 581 kg per ha more than the control. In the
inoculated plots the highest yield was shown in the base fungicide and the base fungicide +
premium fungicide + SAR treatment which produced 37 and 54 kg per ha more than the control.
Stand 15 DAP x Stand 30 DAP Seed cotton yield
kg/ha
Treatment Non-inoculated Inoculated Non-inoculated Inoculated Non-inoculated Inoculated Untreated 73 ab w 60 a 66 b 61 bc 4508 ab 4234 ab Base fungicide z 74 ab 68 a 66 b 66 ab 4718 ab 4271 a Base fungicide Bio ST VPH 78 a 65 a 71 ab 63 abc 4396 b 4197 ab
Base Fungicide Premium Fungicide y 75 a 65 a 71 ab 68 ab 5092 a 4237 ab
Base Fungicide Premium Fungicide SAR
66 b 62 a 70 ab 54 c 5089 a 4288 a
Base Fungicide Vibrance CST 73 ab 64 a 68 ab 54 c 4284 b 4101 a
Base Fungicide Premium Fungicide BioST Nematicide
73 ab 66 a 74 a 71 a 4624 ab 3898 b
z Base fungicide treatments consisted of Metalaxyl, Fludioxonil, and Myclobutanil. y Premium fungicide treatments consisted of Metalaxyl, Difenoconazole, Myclobutanil, and Azoxystrobin x Total number of plants in a 7-meter row. w Means followed by the same letter do not significantly differ according to Tukey’s method (P ≤ 0.1)

40
An Evaluation of Fungicide Combinations for Cotton Seedling Disease Management in North Alabama, 2016
M. Foshee, K.S. Lawrence, N. Xiang, W. Groover, S. Till, D. Dodge, D. Dyer, M. Hall
Seed treatment fungicides were evaluated for the management of cotton seedling disease at the
Tennessee Valley Research and Education Center in Belle Mina, AL. The field had a history of
cotton seedling disease and was naturally infested with Rhizoctonia solani, Pythium spp., and
Thielaviopsis basicola. The soil type was a Decatur silt loam (24% sand, 49% silt, 28% clay).
Plots were planted on 19 Apr with a soil temperature of 64°F at a 10 cm depth and adequate soil
moisture. Plots consisted of 2 rows, 7.6 m long with 1.0 m row spacing and were arranged in a
randomized complete block design with five replications. Blocks were separated by a 6.1m wide
alley. All plots were maintained throughout the season with standard herbicide, insecticide, and
fertility production practices as recommended by the Alabama Cooperative Extension System.
Plots were irrigated with a sprinkler system as needed. Seedling stand was determined 29 days
after planting (DAP). Plots were harvested on 10 Oct. Data was analyzed using the SAS 9.4
program and means compared using Fisher’s protected least significant difference test (P <
0.10). Monthly average maximum temperatures from planting in Apr through harvest in Oct
were 72, 80, 88, 91, 91, 85, and 75°F with average minimum temperatures of 45, 55, 63, 66, 64,
57, and 46°F, respectively. Rainfall accumulation for each month was 4.4, 4.8, 4.3, 3.9, 3.3, 3.9,
and 3.4 cm with a total of 28 cm over the entire season. The rainfall was adequate in July and
Sept. but very dry in August.
Seedling disease pressure was moderate in 2016 due to precipitation and moisture being
normally distributed. Plant stand at 29 DAP was highest for the RTU-Baytan-Thiram +
Allegiance FL + Gaucho 600 when compared to the industry standard Allegiance FL + Gaucho
600 and the untreated control, but did not differ from treatments 1, 2, 3, 5, 6, 7, 8, 10, and 11.
Plant stands were good ranging from 3.5 to 2.3 plants per foot of row. Rhizoctonia solani, P.
ultimum, and Fusarium spp. were isolated from the diseased seedlings. Seed cotton yields were
very good and similar between all fungicides. Eight of the twelve treatment plots had higher
yield than the nontreated plots. Yields varied by 716 lb/ac at harvest with an average of 464 lb/ac
increase of seed cotton produced over all the fungicide treatments as compared to the nontreated
control.

41
Fungicide seed treatment Rate (oz/cwt) Stand/ 25 ft rowz,y
Seed cotton (lb/ac) y
1. Apron XL + Maxim 4 FS + Systhane WSP + A21606B + Gaucho 600
0.31 + 0.08 + 0.84 + 3.33 + 12.8 oz/cwt
60a 3803
2. Apron XL + Maxim 4 FS + Systhane WSP + A21606B + Gaucho 600
0.31+ 0.08 + 0.84 + 4.08 + 12.8 oz/cwt
52ab 4173
3. Allegiance FL + EverGol Prime + Spera + Vortex + Gaucho 600
0.75 + 0.33 + 1.8 + 0.08 + 12.8 oz/cwt
58ab 3463
4. Allegiance FL + EverGol Prime+ Spera 240 FS + L1979-A + Gaucho 600
0.75 + 0.33 + 1.8 + 0.15 + 12.8 oz/cwt
40b 3684
5. Allegiance FL + EverGol Prime + Spera 240 FS + L1979-A + Gaucho 600
0.75 + 0.33 + 1.8 + 0.3 + 12.8 oz/cwt 54ab 3552
6. Allegiance FL + EverGol Prime + Spera 240 FS + L1979-A + EverGol Energy + Gaucho 600
0.75 + 0.33 + 1.8 + 0.3 + 1.0 + 12.8 oz/cwt
52ab 3752
7. Albaugh Premium Fungicide Nematicide Overtreatment + Gaucho 600
1.9 + 11.3 + 12.8 oz/cwt 58ab 3909
8. Albaugh Premium Fungicide Overtreatment + Gaucho 600
1.9 + 5.25 + 12.8 oz/cwt 51ab 4179
9. RTU-Baytan-Thiram + Allegiance FL + Gaucho 600 3.0 + 0.75 + 12.8 oz/cwt 62a 4050 10. Vitavax-PCNB + Allegiance FL + Gaucho 600 6.0 + 0.75 + 12.8 oz/cwt 50ab 3868 11. EverGol Prime + Gaucho 600 0.64 + 12.8 oz/cwt 48ab 4011 12. Allegiance FL + Gaucho 600 1.5 + 12.8 oz/cwt 44b 3493 13. Nontreated -- 50ab 3715 14. Range Trial Averages -- 52 3819 zStand was the number of seedlings in 25 feet of row at 29 days after planting. yMeans followed by same letter do not significantly differ according to Fishers LSD test (P < 0.10).

42
IV. Weed Management Evaluation of Cotton Tolerance on Early Postemergence (EPOST)
Applied Chloroacetamide Herbicides
J. A. Tredaway, and A. Price A field study was conducted at the Prattville Research Station in Prattville, AL to evaluate
EPOST applications of Dual Magnum, Outlook, and Warrant. Liberty Link (LL) Stoneville 4848
variety was planted. Dual Magnum was applied at a rate of 21 fl. oz./A, Outlook at 12 fl. oz./A
and Warrant at 48 fl. oz./A to cotton in the 4-leaf stage. Herbicide induced cotton injury was
evaluated on a scale of 0-100% with 0 = no injury and 100% = total plant death. Herbicide
injury evaluations were conducted on 7, 14, 21, and 28 days after treatment (DAT). Cotton
injury was highest with Warrant at 7 and 14 dat. Injury was less than 10% with all three
herbicides at the 28 DAT evaluation. Although injury ratings were higher for certain treatments,
there were no differences in cotton yield across treatments. There was also no correlation
between herbicide induced injury and cotton yield which suggests that injury caused by
treatments was strictly visual and not affecting the growth of the cotton plant.

43
Cotton Growth Responses to Various Soil Herbicides Containing Fomesafen and Fluridone
S. Li
Fomesafen (Reflex 2SL) is a widely-used soil herbicide in cotton and soybean with excellent
pigweed control efficacy. Despite of the occurrence of PPO resistance pigweed in several
southern states, fomesafen is still recommended by many extension specialists and crop
consultants for pre-emgernce (PRE) pigweed control. However, fomesafen injury on cotton has
been a long-time concern being it is difficult to predict. Fluridone and fluridone-based products
(Brake herbicides) are developed by SePro and have obtained registration in several cotton-
growing states. They provide an alternative mode-of-action to control herbicide resistant
pigweed and have shown promising results. However, the injury potential of fluridone-based
products on cotton requires further evaluation in Alabama due to lack of data. Field trials were
conducted at three (Shorter AL, Fairhope AL and Hawkinsville GA) in 2016 to evaluate cotton
tolerance to 13 treatments containing different rates of fomesafen and fluridone-based products.
Experimental design was RCBD with 4 replications. Thirteen treatments were evaluated and all
of them were applied PRE within 3 days after planting.
Cotton stand was not significantly affected by herbicide treatments at Shorter and Fairhope at 20-
26 days after planting (DAP), but this was not the case at Hawkinsville where 4X and 8X rates of
fomesafen (64 and 128 oz/A Reflex), fomesafen + acetochlor (16 oz/A Reflex + 48 oz/A
Warrant) and fomesafen + diuron (16 oz/A Reflex + 20 oz/A Direx) significantly reduced cotton
stand as compared to non-treated control (NTC). Also, these four treatments reduced cotton
seedling height at 20-26 DAP with most of the height reduction observed at Hawkinsville.
Cotton injury varied from less than 10% to over 90% (figure 1), with 100% being completely
dead; fomesafen at 2X, 4X and 8X rates produced more injury than other treatments. Fomesafen
+ acetochlor and fomesafen + diuron also caused unacceptable injury at Hawkinsville. At the end
of the season, 4X and 8X rates of fomesafen reduced over 50% of cotton yield at Hawkinsville as
compared to NTC, while 8X rate fomesafen reduced 40% yield at Shorter (Figure 2). These data
suggested more cotton injury, stand count, height and yield reduction were found in

44
Hawkinsville where sand fraction was the highest among all locations. Higher rates of fomesafen
tend to cause greater negative impact on cotton growth and yield. Meanwhile, fluridone-based
products (Brake FX and F16) did not show any negative effect on cotton growth at any location
in this study. Although results regarding fluridone-based products (Brake herbicides) are mostly
positive and both Brake FX and F16 have been registered in Alabama, the high purchasing cost
($25/A for Brake F16 and $32/A for Brake FX) is the major obstacle for Alabama cotton farmers
to use these herbicides in their production. More research will be conducted to evaluate variety
tolerance to various soil herbicide treatments.
Figure 1. Cotton injury at 20-22 days after planting (100% being completely dead)
Figure 2. Cotton yield as affected by treatments containing fomesafen (Reflex) and fluridone. Asterrisk * indicates significant reduction as compared to non-treated control.
0%15%30%45%60%75%90%
105%120%% of injury Cotton visual injury at 20-22 DAP
Fairhope AL

45

46
Cotton Responses to 2, 4-D and Dicamba Applie Preemergence
S. Li As of Jan 17, 2017, Xtendimax with vaporgrip (Monsanto), Enlist duo (Dow agrosciences) and
Engenia (BASF) have been registered by EPA in US cotton and soybean. These new
technologies will bring better options for Alabama farmers to control resistant and problematic
weeds, such as pigweed, morningglory, sicklepod, horseweed, cuttleaf evening primose and
groundcherry, etc. Field trials and demonstrations conducted by Steve Li’s team haven shown
2,4-D and dicamba combined with glufosinate showed excellent growth suppression on very
large pigweeds than current options. However, herbicide drift and off-target injury have been the
greatest concern regarding using 2,4-D and dicamba in row crops. One specific risk farmers have
to deal with is applying 2,4-D or dicamba very close to planting cotton to burndown existing
weeds such as horseweed or marestail, then plant a wrong cotton variety that are not tolerant to
2,4-D or dicamba by error. This is likely to happen since only selected varieties in Deltapine and
Phytogen product line are tolerant to these auxin herbicides. Moreover, if one used 2,4-D or
dicamba to burndown existing weeds at planting, then crop stand is not acceptable, replanting
variety with the same tolerance is required. If such tolerant variety is unavailable due to seed
shortage, he may have to plant sensitive variety which may cause negative impact on crop
growth. Therefore, experiment was conducted at Shorter, Fairhope and Jay FL to evaluate
sensitive cotton responses to 2,4-D and dicamba residues in soil. Treatments included 2,4-D 1
pt/A and 2 pt/A applied 3-4 weeks before planting, 2,4-D 0.1 pt/A, 0.3 pt/A, 0.5 pt/A and 1 pt/A
applied immediately after planting. All treatments were sprayed over soil surface and irrigated
within 3 days of application.
Cotton stand at Fairhope was not affected by any of these treatments at 24 DAP, but in Shorter,
2,4-D 1pt/A applied at planting, dicamba 0.5 and 1 pt/A applied at planting reduced cotton stand
as compared to NTC. Dicamba 1pt/A applied at planting reduced seedling height at Shorter 21
DAP. At 51 DAP, this treatment still reduced cotton height at Shorter when compared to NTC.
Fairhope cotton height was not affected by herbicide treatments at 50 DAP. At the end of season,
only dicamba 1 pt/A applied at planting reduced cotton yield at Shorter (Figure 3). No other
treatment reduced cotton yield at Fairhope and Jay FL. The results of this study indicated high

47
rates of dicamba have higher potential to injury cotton and cause yield reduction than 2,4-D, due
to longer soil persistence (Figure 4). Therefore, more attention is needed after dicamba is applied
to the soil immediately prior to or at planting to prevent cotton injury caused by planting error.
Figure 3. Cotton yield as affected by 2,4-D and dicamba residues in soil at three locations.
Asterisk * indicated significant lower than NTC.
Figure 4. Averaged cotton yield over three trial locations.
0%20%40%60%80%
100%120%140%160%
% o
f NTC
Cotton Yield as affected by 2,4-D and dicamba soil residues
Fairhope
EV Smith
Jay
*
0%20%40%60%80%
100%120%140%
% o
f NTC
Averaged cotton yield over 3 locations
48
Pigweed Resistance Screening in Alabama
S. Li Palmer Amaranth has gained resistance to multiple mode of action (MOA) of herbicides. In the
last three years, PPO-resistant palmer has been identified in multiple southern states, seriously
threatening cotton production. Therefore, a statewide survey of Palmer Amaranth was conducted
in 2015 and 2016 to quantify the level of herbicide resistant Palmer infestation in Alabama
cotton. A total of 59 seed samples of Palmer amaranth or spiny amaranth were collected from 59
fields in multiple counties. Screening work on 2015 collected populations has been completed
while 2016 collected populations are still under screening. Palmer Amaranth seeds collected
from fields were cleaned and planted in 4 inch cups with organic medium in greenhouse, and
sprayed in spray chamber when these seedlings were 1 inch tall. NIS @ 0.25% v/v was included
in all treatments. Data collection was conducted 14-21 days after treatment.
Data from this herbicide screening study indicated that herbicide resistant Palmer Amaranth is
widely presented in Alabama in many counties. EPSPS inhibitor (Roundup) and ALS inhibitor
(Staple, Cadre, Envoke, etc.) resistances are most common resistances found in this screen study,
with 2X rates of Roundup, Staple LX, Cadre and Envoke failed to kill more than 25% of
pigweed seeds collected from all locations. Cobra (PPO inhibitor) and Liberty (GS inhibitor) are
still working on most of the Palmer populations. However, these two MOA have taken too much
pressure and resistance are likely to develop in Palamer Amaranth against these two MOA. The
population from Limestone county survived 4X rates of Cobra, Goal and Reflex (Picture 1-3).
Since PPO resistance pigweed has started to spread out in TN, AR, MO, MS and possible NC
and SC, we need to prepare for managing this new resistance in field and minimize its impact in
Alabama cotton production.

49
* Liberty 32 and 64 oz/A killed all pigweed seedlings in 2015 resistance screening (100% overall mortality). Cobra 32 and 64 oz/A killed all 2015 populations except for one from Limestone county (90% overall mortality). This population of pigweed will be further evaluated in 2017 in field. Table 2. 2016 Palmer Amaranth resistance screening results. Number shown in this table represents Palmer Amaranth seedling mortality (number of killed/total number germinated) Roundup Envoke Staple LX Cobra Cadre Liberty # County 64 oz/A 0.3 oz/A 8 oz/A 32 oz/A 8 oz/A 64 oz/A 1 Henry 0% 60% 0% 100% 17% 0% 2 Henry 6% 43% 0% 100% 20% 100% 3 Houston 42% 17% 0% 67% 100% 100% 4 Baldwin 0% 33% 10% 100% 50% 100% 5 Baldwin 52% 42% 86% 100% 100% 4% 6 Henry 0% 0% 3% 100% 71% 53% 7 Henry 50% 0% 50% 100% 11% 63% 8 Geneva 0% 0% 14% 100% 0% 83% 9 Elmore 0% 0% 0% 100% 0% 78% 11 Henry 0% 0% 60% 75% 15% 33% 12 Geneva 8% 0% 15% 40% 0% 89% 13 Geneva 0% 0% 9% 67% 0% 33% 15 Geneva 0% 5% 33% 100% 0% 92% 16 Henry 22% 0% 0% 0% 8% 100% 17 Baldwin 11% 71% 100% 100% 100% 10% 18 Henry 0% 40% 0% 33% 0% 80%
Table 1. 2015 Palmer Amaranth resistance screening results. Number shown in this table represents seedling mortality (number killed/total number germinated) Roundup Staple LX Cadre # County 64 oz/A 128 oz/A 8 oz/A 16 oz/A 8 oz/A 16 oz/A 1 Elmore County 0% 0% 0% 0% 33% 20% 3 Henry County 0% 17% 0% 10% 0% 11% 4 Henry County 0% 50% 0% 11% 0% 27% 5 Henry County 0% 38% 0% 11% 25% 22% 6 Dallas County 0% 25% 7% 27% 0% 0% 7 Russell County 8% 88% 0% 22% 0% 20% 8 Limestone County 4% 33% 2% 0% 7% 8% 9 Chilton County 0% 0% 0% 0% 0% 0% 10 Talladega County 0% 79% 0% 15% 67% 20% 11 Autauga County 0% 33% 0% 0% 0% 0% 12 Autauga County 17% 67% 8% 18% 0% 0% 13 Henry County 0% 18% 0% 6% 5% 11% 14 Talladega County 15% 25% 7% 14% 0% 14% 15 Talladega County 5% 8% 5% 14% 6% 3% 16 Shelby County 0% 5% 0% 5% 6% 9% 17 Henry County 5% 21% 0% 7% 0% 5% 18 Shelby County 18% 9% 0% 30% 0% 14% 19 Madison County 21% 8% 6% 18% 59% 50% Overall mortality 5% 29% 2% 12% 12% 13%

50
19 Henry 0% 0% 0% 100% 0% 75% 20 Barbour 7% 0% 42% 100% 0% 100% 21 Henry 0% 0% 0% 100% 50% 83% 22 Escambia 0% 0% 6% 100% 0% 100% 23 Houston 0% 17% 67% 100% 20% no data 24 Houston 0% 20% 14% 75% 0% 69% 25 Baldwin 0% 0% 14% 100% 60% 50% 27 Baldwin 0% 14% 40% 100% 60% 100% 28 Geneva 0% 0% 0% 100% 0% 20% 32 Henry 0% 0% 0% 100% 80% 67% 33 Henry 0% 33% 92% 100% 100% 100% 34 Henry 0% 10% 100% 100% 0% 40% 35 Henry 0% 33% 0% 100% 0% no data 36 Henry 0% 0% 0% 100% 0% 33% 38 Limestone 38% 0% 0% 100% 0% 100% Overall mortality 8% 14% 24% 89% 28% 67%

51
Picture 1. Palmer population from Limestone county 21 days after 4X rate of Cobra (64 oz/A)
Picture 2. Palmer population from Limestone county 21 days after 4X rate of Goal (96 oz/A)
Picture 3. Palmer population from Limestone county 21 days after 4X rate of Reflex (96 oz/A)
This population from Limestone county will be further evaluated in field for PPO resistance confirmation.

52
Evaluation of Sprayer Cleaning Procedures Following Application of 2, 4-D and Dicamba
S. Li
The objective of this project is to compare sprayer cleaning efficacy using common cleaning
practices, such as household ammonium and tank cleaners. And develop sprayer cleaning
recommendation for 2,4-D and dicamba to be used in future resistant crops. Treatments to be
evaluated include:
1. Water (triple rinse)
2. 3% ammonium (1st rinse) + Roundup PM @ 2 pt/A (2nd rinse) + Water (3rd rinse)
3. 3% ammonium (1st rinse) + Ag spray tank cleaner (2nd rinse) + Water (3rd rinse)
4. 3% ammonium (1st rinse) + Another common tank cleaner (2nd rinse) + Water (3rd rinse)
This project will be conducted from Jan-Apr 2017 at EV Smith REC at Shorter AL, on three
commercial ag sprayers. Rinsate from each cleaning step will be collected and analyzed by
analytical instruments on Auburn campus. Quantitative data from laboratory will be used to
determine best cleaning protocol. Meanwhile, collected rinsate from each rinse and treatment
will be sprayed on top of sensitive plants, such as tomatoes, to determine the effect of remaining
herbicide (2,4-D and dicamba) on these sensitive bioassays. Visual injury, bioassay height and
dry weight will be collected 1 month after application. If any cleaning method tested in this
project shows promising results, they may be furthered tested on farmer’s sprayer for efficacy as
compared to regular procedures.

53
V. Insect Management
Determining Which Insecticide Provides the Most Cost-effective Control of Plant Bugs Infesting Cotton
T. Reed This study was conducted at the Tennessee Valley Research and Extension Center at Belle Mina
and at the Prattville Agricultural Research Unit. Plots at Belle Mina were planted April 23rd
using the variety ST 4747 GLB2. Plots were 8 rows wide and 25 feet long with a 40 inch row
spacing. Treatments were arranged in a RCB design with 4 replications of each insecticide
treatment and 12 replications of the unsprayed treatment. Insecticide treatments and rates at Belle
Mina and Prattville are shown in Tables 1 and 2. Treatments were applied July 22 using TX6
conejet nozzles and a spray volume of 9.5 gallons per acre. Tarnished plant bugs (TPB’s) were
sampled August 1 by placing a 3-foot-long drop cloth between two rows and shaking both rows
vigorously. Two drop cloth samples were taken in each plot. Plots at Prattville were planted
April 18 using the variety ST 6182 GLT. Plots were 4 rows wide and 30 feet long with a 36 inch
row spacing. Treatments were arranged in a RCB design with 4 reps for each treatment.
Treatments were applied July 6 using a CO2 backpack sprayer that delivered 10 gallon spray/acre
at 40 PSI using TX6 conejet nozzles. Plots were sampled using a 3-foot-long drop-cloth on July
8 and July 13.
Results: Total numbers of TPB’s per 12 row feet and seed cotton yields at Belle Mina are
presented in Table 1.
Table 1. Number of plant bugs recovered per 12 row feet 10 days following application of different cotton insecticides and yields. Belle Mina, AL, 2016 Trt # Treatment Insecticide Rate/Acre Plant bugs/12 feet Lbs seed cotton/acre 1 Orthene 97 0.55 lb 4.0 CD 4314 B 2 Bidrin 8 3.2 oz 4.5 CD 4490 AB 3 Bidrin 8 + Bifenthrin 4 6.4 oz 5.8 CD 4442 AB 4 Bifenthrin 4 6.4 oz 22.0 A 3881 C 5 Transform 50 WG 1.5 oz 3.5 CD 4369 B 6 Transform 50 WG + Diamond 4 6 oz 0.0 D 4402 B 7 Diamond 4 6 oz 2.3 CD 4685 A 8 Centric 40 WG 2 oz 5.8 CD 4400 B 9 Untreated - 13.1 B 3803 C P>F = 0.0007 0.0001 LSD 0.1 = 7.04 251.6

54
There was a statistically significant treatment effect with respect to the total number of TPB’s 10
DAA (P>F=0.0007) and yields (P>F=0.0001). All insecticide treatments except bifenthrin had
significantly fewer TPB’s than the untreated plots. The number of TPB’s in the bifenthrin
treatment was significantly greater than that in the unsprayed plots. The most expensive
treatment, Transform + Diamond, had no TPB’s on the sampling date. All insecticide treatments
except bifenthrin had a significantly greater yield than that in the unsprayed plots. The yield in
the Diamond 6 oz/acre treatment (4685 lbs/ac) was significantly greater than that in 5 of the
other insecticide treatments, but not significantly greater than that in the Bidrin and Bidrin +
bifenthrin treatment.
Total numbers of TPB immatures per 12 row feet at Prattville 48 hours post-application are presented in Table 2. Table 2. Number of Plant bug nymphs recovered per 12 row feet 48 hours post-application of different cotton insecticides, Prattville, AL, 2016 Trt # Treatment Insecticide Rate/Acre Plant bugs/12 feet 1 Centric 40 WG 2 oz 2.0 B 2 Transform 50 WG 1.5 oz 0.5 B 3 Diamond 4 6 oz 6.0 A 4 Transform 50 WG + Diamond 4 1.5 oz + 6.0 oz 0.8 B 5 Orthene 97 0.55 lb 2.8 B 6 Untreated - 5.5 A P>F = 0.0019 LSD 0.1 = 2.74 There were very few TPB’s present on the second sampling date and numbers for this date are
not presented. There was a statistically significant treatment effect with respect to the number of
TPB’s at Prattville (P>F= 0.0019). Diamond is an insect growth regulator which did not have
sufficient time to reduce TPB numbers and the TPB count for this treatment was statistically
similar to that in the unsprayed plots. The mean number of TPB nymphs in the Centric,
Transform, Transform + Diamond and Orthene treatments all had significantly fewer TPB’s than
the Diamond and the unsprayed treatments but they were not significantly different from each
other.

55
State Pheromone Trapping Program for Cotton Bollworm, Tobacco
Budworm, and Heliothis Armigera (The Old Boll Worm)
T. Reed, A. Jacobson, and R. Smith A statewide pheromone trapping program was conducted in 2016 to assess the moth activity
level for 3 species of lepidoptera which can be pests of cotton. Species monitored were, cotton
bollworm (CBW), tobacco budworm (TBW) and the potentially invasive species Heliothis
armigera (HA), the African or Old World bollworm. All moths collected in HA traps and many
moths caught in CBW traps were tested using a DNA based technique to confirm the species
present. The trapping program was conducted from the 3rd week of June through the 2nd week of
September. Counties in which traps were placed are presented in the results section.
Results: Cotton bollworm (CBW) moth trap catch numbers were much higher in Baldwin,
Elmore and Autauga counties than at the other 4 trapping sites. Baldwin county CBW moth
numbers began increasing the 4th week of June (132) and ranged from 282 to 347/week for the
next 4 weeks. CBW moth numbers at the Baldwin county site then declined the 1st week of
August (136), peaked at 549 the 3rd week of Aug. then declined to 158 or less for the remainder
of the year. CBW moth trap catches at the Elmore county site jumped the 1st week of July (419)
and except for the 2nd week of Aug (6 caught) the CBW moth catch ranged from 200 to 612
through the 4th week of Sept. The CBW trap catch numbers in Autauga county (Prattville
Research unit) peaked the 1st two weeks of Sept. The CBW moth catch at the Macon county site
peaked the 1st week of Aug. at 229. The CBW trap catch in Limestone County (Belle Mina
Station) began increasing the 4th week of June (78 caught) and peaked the 1st week of Aug. at
181. The only reported economic infestation of cotton bollworms on soybeans in AL in 2016 was
in a few fields in north AL in the Hillsboro area within 25 miles of the Belle Mina trapping site.
These larvae were in the 6th instar stage on Aug. 6 indicating that eggs were deposited by moths
about July 25 when the CBW moth trap catch at Belle Mina was 83 for the week. The Henry
county trapping site at the Wiregrass Research Station caught very few CBW moths all season
(total of 70). However, there were reports of CBW damage to Phytogen cotton near the Headland
trapping site. Numbers of CBW moths trapped at the Escambia county site at the Brewton

56
Research station were also low all season and numbers ranged from 40 the 2nd week of Aug. to 2
the 3rd week of Sept.
The Tobacco budworm (TBW) moth trap catch was highest in Elmore county with the largest
numbers collected the 3rd week of June (227), the 3rd week of July (236) and the 1st and 2nd
weeks of Aug. (ca. 150/week). The TBW moth catch in Baldwin county reached 121 the 2nd
week of July then declined for 3 weeks and rebounded to 143 the 2nd week of Aug. before
declining again. The Henry county TBW moth catch was highest the 3rd week of June (58), the
1st and 2nd weeks of July (45) and the 3rd week of Aug. (42). The Limestone county TBW catches
showed peaks at 38 the 1st week of July, 70 the 4th week of July and 55 the first week of Sept.
The Macon county site peaked the 1st week of August at 66. The next highest sampling period
was the 3rd week of Aug with 19 collected. The highest number of TBW moths were collected at
the Autauga county site the 4th week of July (53), the 2nd week of Aug. (41) and the 2nd week of
Sept. (67).
Heliothis armigera (HA) moths were trapped in Baldwin, Escambia and Henry counties. All
moths collected in traps baited with Heliothis armigera as well as numerous moths caught in
Helicoverpa zea traps were tested and no moths were found to be HA moths.

57
Managing Seedling Thrips in the Era of Resistance to At-Planted Seed Treatments
T. Reed, R. Smith and C. Hicks
This study was conducted at the Belle Mina station and the Prattville Research Unit. Plots were
planted at Belle Mina on April 23, 2016 and were arranged in a RCB design with 4
reps/treatment. (Exception: The untreated plots planted into a wheat residue were replicated 8
times). The variety used was Phytogen 339 WRF. Plots were 4 rows wide (38 inch row spacing)
and 25 feet long. Treatments are provided in Table 1. All treatments except 8, 9 and 11 were
planted into a wheat cover-crop residue. Treatments 8, 9 and 11 were tilled prior to planting.
Velum Total and Admire Pro were applied in-furrow on top of the seed using 6502 flat fan
nozzles that applied 12 gallons of water per acre. Nozzles were turned to line up parallel with
the furrow and all the water went into the furrow. Thrips damage ratings were made on May 13,
18 and 25 when plants were at the 1 to 2, 2 to 3 and 4th true leaf stage, respectively. Damage
ratings were made on a scale of 0 to 5 with 0 being no damage and 5 being severe damage. A
foliar overspray of Orthene 97 at a rate of 6 oz/acre was applied May 11 at the 1 to 2 true leaf
stage using TX 6 conejet nozzles and 20 gallons water/acre. Plots received 4 inches of
supplemental irrigation. Plots were harvested on October 7, 2016.
Plots were planted at Prattville April 20. Experimental design was similar to that at Belle Mina
with 4 reps of all treatments. Plots were 4 rows wide and 25 feet long with a 36 inch row
spacing. Foliar Orthene Treatments were applied May 5 and 10 using a CO2 back pack sprayer,
7.9 gallon water/acre, 40 psi and TX6 conejet nozzles.
Results: Thrips damage ratings and yields at Belle Mina are presented in Table 1. Thrips damage
ratings did not reach the economic threshold in any plots until May 25 (42 days after planting).
The no insecticide-no crop residue treatment had a significantly lower yield than all the
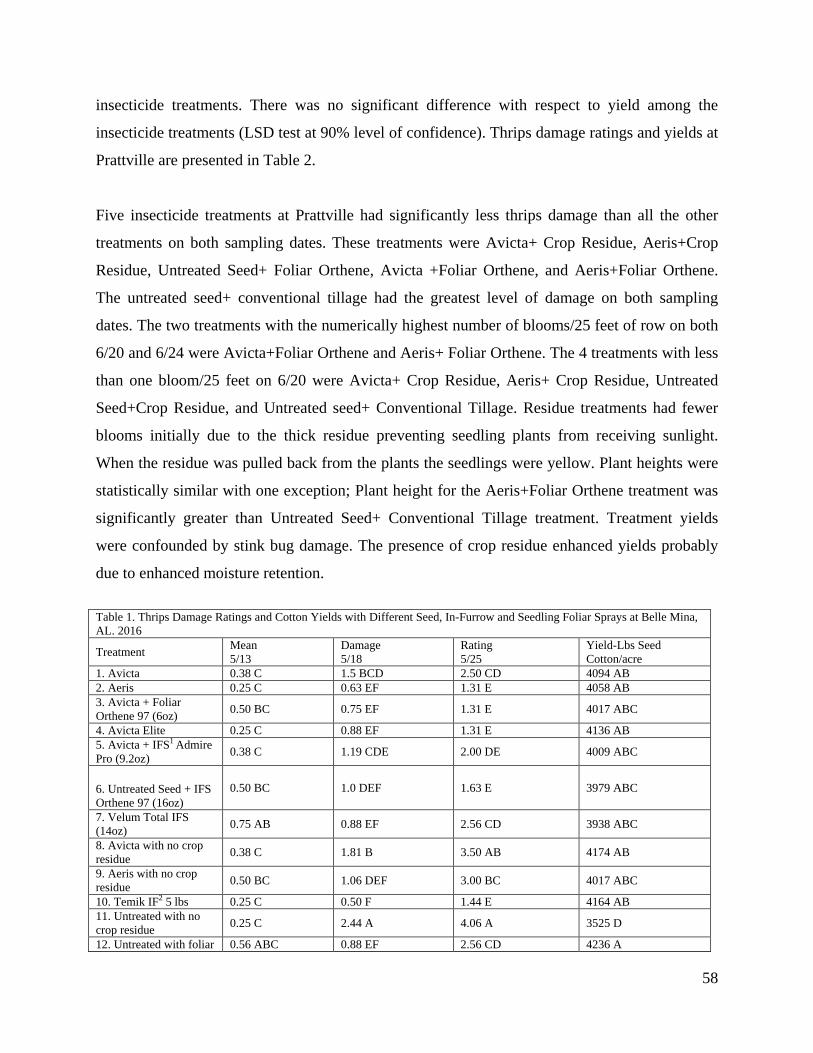
58
insecticide treatments. There was no significant difference with respect to yield among the
insecticide treatments (LSD test at 90% level of confidence). Thrips damage ratings and yields at
Prattville are presented in Table 2.
Five insecticide treatments at Prattville had significantly less thrips damage than all the other
treatments on both sampling dates. These treatments were Avicta+ Crop Residue, Aeris+Crop
Residue, Untreated Seed+ Foliar Orthene, Avicta +Foliar Orthene, and Aeris+Foliar Orthene.
The untreated seed+ conventional tillage had the greatest level of damage on both sampling
dates. The two treatments with the numerically highest number of blooms/25 feet of row on both
6/20 and 6/24 were Avicta+Foliar Orthene and Aeris+ Foliar Orthene. The 4 treatments with less
than one bloom/25 feet on 6/20 were Avicta+ Crop Residue, Aeris+ Crop Residue, Untreated
Seed+Crop Residue, and Untreated seed+ Conventional Tillage. Residue treatments had fewer
blooms initially due to the thick residue preventing seedling plants from receiving sunlight.
When the residue was pulled back from the plants the seedlings were yellow. Plant heights were
statistically similar with one exception; Plant height for the Aeris+Foliar Orthene treatment was
significantly greater than Untreated Seed+ Conventional Tillage treatment. Treatment yields
were confounded by stink bug damage. The presence of crop residue enhanced yields probably
due to enhanced moisture retention.
Table 1. Thrips Damage Ratings and Cotton Yields with Different Seed, In-Furrow and Seedling Foliar Sprays at Belle Mina, AL. 2016
Treatment Mean 5/13
Damage 5/18
Rating 5/25
Yield-Lbs Seed Cotton/acre
1. Avicta 0.38 C 1.5 BCD 2.50 CD 4094 AB 2. Aeris 0.25 C 0.63 EF 1.31 E 4058 AB 3. Avicta + Foliar Orthene 97 (6oz) 0.50 BC 0.75 EF 1.31 E 4017 ABC
4. Avicta Elite 0.25 C 0.88 EF 1.31 E 4136 AB 5. Avicta + IFS1 Admire Pro (9.2oz) 0.38 C 1.19 CDE 2.00 DE 4009 ABC
6. Untreated Seed + IFS Orthene 97 (16oz)
0.50 BC 1.0 DEF 1.63 E 3979 ABC
7. Velum Total IFS (14oz) 0.75 AB 0.88 EF 2.56 CD 3938 ABC
8. Avicta with no crop residue 0.38 C 1.81 B 3.50 AB 4174 AB
9. Aeris with no crop residue 0.50 BC 1.06 DEF 3.00 BC 4017 ABC
10. Temik IF2 5 lbs 0.25 C 0.50 F 1.44 E 4164 AB 11. Untreated with no crop residue 0.25 C 2.44 A 4.06 A 3525 D
12. Untreated with foliar 0.56 ABC 0.88 EF 2.56 CD 4236 A

59
Orthene 97 (6oz) 13. untreated 0.88 A 1.98 AB 4.06 A 3725 CD P>F = 0.066 0.000 0.000 0.039 LSD 0.1 = 0.36 0.56 0.87 314 1 IFS = In-Furrow Spray 2 IF = In-Furrow Granules Table 2. Thrips Damage Ratings and Cotton Yields with Different Seed, In-Furrow and Seedling Foliar Sprays at Prattville, AL. 2016 Treatment Mean
Damage Rating 5/17/16
Mean Damage Rating 5/24/16
Bloom count 6/20/16
Bloom Count 6/22/16
Plant Height (cm) 6/24/16
Seed Cotton Yield Lb/acre
1. Avicta 3.25 b 3.13 bc 2.1 a-d 13.8 ab 14.5 ab 2583.3 abc 2. Aeris 3.50 b 3.38 b 2.7 a-d 13.5 ab 14.7 ab 2925.0 abc 3. Avicta + Admire Pro (7.2 oz)
3.38 b 3.13 bc 4.7 ab 14.5 ab 15.5 ab 2116.7 c
4. Aeris + Admire Pro (7.2 oz)
3.25 b 3.25 b 3.3 abc 11.3 abc 15.7 ab 2158.3 c
5. Avicta + Orthene IF (8 oz)
3.63 b 3.50 b 2.1 a-d 8.5 bcd 16.0 ab 3008.3 abc
6. Aeris + Orthene IF (8 oz)
3.38 b 3.38 b 4.0 abc 15.3 ab 15.2 ab 2658.3 abc
7. Avicta + Crop Residue
2.25 c 2.00 d .7 cd 4.8 cd 15.2 ab 3275.0 a
8. Aeris + Crop Residue 1.75 c 1.38 d .7 cd 3.8 cd 16.4 ab 3158.3 ab 9. Aeris + Velum IF (14 oz)
3.13 b 3.00 bc 4.2 abc 12.0 ab 15.5 ab 2308.3 bc
10. Untreated Seed + Velum IF (14 oz)
3.75 b 4.13 ab 3.1 abc 11.3 abc 14.5 ab 2883.3 abc
11. Untreated Seed + Crop Residue
3.88 b 4.25 ab .3 d 2.5 d 14.0 ab 2725.0 abc
12. Untreated Seed + Conv Till
4.50 a 4.88 a .7 cd 4.3 cd 13.5 b 2525.0 abc
13. Untreated Seed + Orthene Foliar (6 oz)
2.25 c 1.63 d 1.4 bcd 13.5 ab 16.4 ab 2391.7 abc
14. Avicta + Orthene Foliar (6 oz)
2.25 c 2.13 cd 6.0 ab 15.8 ab 15.5 ab 2933.3 abc
15. Aeris + Orthene Foliar (6 oz)
1.88 c 1.25 d 6.8 a 17.8 a 16.7 a 2891.7 abc
LSD P = .10 .490 .741 1.14-3.61 4.74 481.65 1.53-1.69 Standard Deviation .412 .623 .23t 3.98 346.77 .04t 2 IF = In-Furrow Granules

60

61
Controlling the Stink Bug Complex on Cotton in the Absence of
Phosphate Chemistry
R. Smith
The objective of this study was to determine if and how stink bugs can best be managed or
controlled with only pyrethroid chemistry.
A stink bug trial was conducted at the Wiregrass Research Center, Headland, AL to measure
control using only the pyrethroid chemistry under various intervals, thresholds and timing. This
test was conducted in a design consisting of 8 rows of PHY-499 cotton planted April 25,
adjacent to a peanut field.
The various treatments (intervals, timing, and thresholds) were applied in a random manner to
replicate plots (8 rows x 50 feet). Four replicates were utilized for each treatment. Weekly
damaged bolls counts were made during boll production season and yields were taken. Sweep
net samples were taken as needed to determine the number and species of stink bugs present.

62
Controlling The Stink Bug Complex On Cotton In the Absence of Phosphate Chemistry
WREC - 2016
Spray Interval
Week of Bloom Flag Color Trt Treatment/Rate 3 4 5 6 7
Orange 1 Bidrin 6oz. (0.375lbs) (7/14) - (7/27) - (8/11) White 2 Bifenthrin 6.4oz. (0.08lbs) (7/14) - (7/27) - (8/11)
Yellow 3 Bifenthrin 6.4oz. (0.08lbs) (7/14) (7/20) (7/27) (8/3) (8/11) Green 4 Bifenthrin 6.4oz. (0.08lbs) (7/14) (7/20) - (8/3) (8/11) Red 5 Untreated - - - - -
Summary % S.B. Damaged Bolls (Row 1)
5 Observation Dates Survey Date
Trt# 20-Jul 27-Jul 3-Aug 11-Aug 17-Aug Mean (Row 1)
Row 1 Row 7 1 30 55 30 55 60 30 46 2 20 28 38 53 58 15 39 3 28 32 18 20 48 20 29 4 28 22 32 38 55 28 35 5 40 65 80 90 58 52 67 SB/20 Sweeps (Row 2 and 3) Trt# 20-Jul 27-Jul 3-Aug 11-Aug Mean
1 0.0 2.0 0.5 2.0 1.2 2 0.5 2.8 0.2 2.5 1.5 3 0.2 0.8 0 0.2 0.3 4 0.5 0.2 2.4 0.2 0.8 5 2.5 9.0 7.0 3.7 5.6
Stink Bugs/80 Sweeps (Life Stage and Species)
BSB SGSB Date N A N A
July 20 0 8 0 7 July 27 0 30 0 23 Aug 3 0 9 0 27 Aug 11 0 6 0 30
All adults BSB peaked on July 27 SGSB peaked between July 27 and Aug 11

63
S.B. Trial - WREC - 2016 Yields (lbs seed cotton/plot)
lbs. Seed Cotton
Per Acre
Rows 1 and 2 Replicates
Trt # 1 2 3 4 Mean 1 Bidrin x 3 app 15.8 11.0 13.4 14.2 13.6 1972 2 Bifenthrin x 3 app 12.8 13.6 11.4 15.8 13.4 1943 3 Bifenthrin x 5 app 18.5 14.8 17.2 16.0 16.6 2407 4 Bifenthrin x 4 app 13.6 16.2 17.2 14.8 15.5 2248 5 Untreated 5.8 7.6 9.2 6.4 5.8 841 lbs. Seed
Cotton Per Acre
Rows 7 and 8
Replicates Trt # 1 2 3 4 Mean
1 Bidrin x 3 app 17.4 11.8 17.2 15.0 15.4 2233 2 Bifenthrin x 3 app 14.6 13.2 13.6 17.6 14.8 2146 3 Bifenthrin x 5 app 16.4 14.8 16.2 15.4 15.7 2276 4 Bifenthrin x 4 app 17.0 16.2 15.2 8.6 16.8 2436 5 Untreated 8.8 11.8 14.2 16.0 12.7 1842
This trial was conducted under extremely high stink bug pressure due to the proximity of the trial
to an adjacent host crop (peanuts). The trial was initiated on July 14th, about the third week of
bloom, when the stink bug damaged boll count was 20% internal injury. On that date, 1.3 stink
bugs, consisting of both the brown and southern green species, were found per 20 sweeps. The
number of stink bugs increased to 2.4, 7.5, and 8.2 per 20 sweeps in the untreated plots during
the following three weeks. All stink bugs captured by sweep net were in the adult stage. The
brown species increased through July and then declined in number. The southern green species
continued to increase weekly, peaking in early August. The brown species made up 67% of the
population on July 27, but decreased to only 15% of the population on August 3 and remained at
that level for the duration of trial.
Insecticide treatments used in this trial were Bidrin applied three times on weeks 3, 5, and 7 of
bloom; bifenthrin applied three times on weeks 3, 5, and 7 of bloom; bifenthrin applied five
times on weeks 3, 4, 5, 6, and 7 of bloom; bifenthrin applied four times based on thresholds
(applied on weeks 3, 4, 6, and 7 of bloom); and, an untreated. A stink bug survey and damage
boll count was made weekly between July 20 and August 17.
A final survey was conducted on Aug 17, by sampling bolls on rows 7 and 8 from the field
border. All previous surveys were made by collecting bolls from rows 1 and 2 adjacent to the

64
edge of field adjoining peanuts. The distance from the cotton to the peanuts was approximately
15 feet of mowed grass field border. Bolls collected from rows 7 and 8 ranged from 15 to 30%
internal damage compared to 52% in the untreated. Damaged bolls from rows 7 and 8 in all
treatments were less than one half the level found in rows 1 and 2 on Aug 17.
The damage in the untreated plots were 52% in rows 7 and 8 compared to 80% in rows 1 and 2.
This supports previous observations and data that have indicated that stink bugs cause much
more damage on field borders than farther into fields. This data suggests that when controls are
applied for stink bugs based on thresholds, most of the damage is limited to the first 6 to 10 rows
around the edges of fields. It also suggests that border sprays to cotton planted adjacent to other
stink bug hosts crops could greatly reduce inter field damage and/or the need for field wide
applications.
When combining the boll damage by treatment across all five observation dates, all treatments
(29 to 46 %) reduced boll damage compared to the untreated at 67%. However, no treatment
(phosphate or pyrethroid) held damage on field borders below suggested threshold levels. The
lowest damage was when bifenthrin was applied on a weekly interval. Bifenthrin (39%)
compared favorably with Bidrin (46%) on a season long basis when both were applied on weeks
3, 5, and 7 of bloom.
Stink bug numbers, as captured by sweep net, were lower season long in all treated plots when
compared to the untreated. The means recorded from the four-weekly survey made between July
20 and Aug 11 range from 0.3 to 1.5 stink bugs per 20 sweeps compared to 5.6 in the untreated.
The mean from Bidrin treated plots was 1.2/20 sweeps compared to 1.5 in the bifenthrin when
both were applied on the same schedule (week 3, 5, and 7 of bloom). One additional application
of bifenthrin reduced the mean to 0.8/20 sweeps while the weekly application of bifenthrin (total
of 5 applications) only left 0.3 stink bugs per 20 sweeps.
Yields from this trial coincide closely with the level of damaged bolls and the number of stink
bugs captured by sweep net. Yields were taken by harvesting rows 1 and 2 on the border and
rows 7 and 8 in each plot. Cotton harvested from rows 1 and 2 had 1972 lbs. of seed cotton in
the Bidrin treated plots, compared to 1943 in the bifenthrin plots. The untreated only yielded 841

65
lbs. Four applications of bifenthrin yielded 2248 and five applications yielded 2407. The fourth
application of bifenthrin increased yields by 305 lbs. of seed cotton over three applications. The
fifth application of bifenthrin increased yields by 464 lbs. over three applications and 159 lbs.
over the four applications.
Yields from rows 7 and 8 of each plot were higher in all plots than yields from rows 1 and 2.
However, the treatment/application effect on yields from rows 7 and 8 were not as closely related
to boll damage or numbers of stink bugs as found in rows 1 and 2. All sprayed plots out yielded
the untreated in rows 7 and 8. However, the yields did not correlate with the numbers of
applications. Yields from the untreated plots in rows 7 and 8 was 1842 lbs. of seed cotton while
the treated plots varied from 2146 (3 app bifenthrin) to 2436 (4 app of bifenthrin). Plots
receiving Bidrin (3 app) yielded 2233lbs and those treated with bifenthrin (5 app) yielded 2276
lbs.
Conclusions
1. Stink bugs are a major economic pest of cotton in the coastal plains region of Southern
Alabama.
2. Cotton fields planted adjacent to alternative stink bug host crops such as peanuts are
susceptible to high levels of injury.
3. Borders of cotton fields adjacent to crops such as peanuts are at the greatest risk of economic
damage.
4. The heaviest injury to cotton field borders is usually confined to the first 10 to 15 rows (30 to
45 feet)
5. Treatments applied to field borders may reduce the damage and the number of treatments
required over entire fields.
6. In this trial, bifenthrin pyrethroid was as effective as Bidrin when applied on the same
schedules.
7. Additional applications regardless of the chemical selected, may be required to protect field
borders from stink bug injury when cotton fields are located near other host crops or
overwintering sites.

66

67
Cotton Production with Reduced Inputs for 2016
R. Smith The objective of this study was to evaluate variables in a reduced input cotton production system
such as the economic importance of managing the bug complex (plant and stink bugs) and
caterpillars (bollworm and budworm).
Trials were conducted in a replicated small plot (8 rows x 35 feet) reduced input cotton trial at
the Prattville Ag Research Unit. We compared a conventional variety (UA 222) to a full season
variety (DP 1555 B2RF) with weed and insect technology. Input costs were recorded and yields
taken.
Cotton Economic Study Prattville Agricultural Research Unit 2016
Trt. No. Variety Target Pest 1 UA 222 None 2 UA 222 Bugs Only 3 UA 222 Worms Only 4 UA 222 Bugs and Worms 5 DP 1555 B2RF None 6 DP 1555 B2RF Bugs Only 7 DP 1555 B2RF Worms Only 8 DP 1555 B2RF Bugs and Worms
Plant date: April 29
Replant Skips May 16
Vigor and Thrips Damage Rating Made: May 23
1. UA 222 had slightly less vigor than DP 1555 B2RF (may be due to 2 year old seed)
2. Thrips damage was below threshold in all plots when a rating was made on May 23
when plants were at the 2 – 3 true leaf stage.
Plant Bug Survey Made: July 8
A drop cloth sample was made on random plots in both UA 222 and DP 1555 B2RF.
About 3 immature plant bugs were found per 5 row feet. Populations were similar in both UA
222 and DP 1555 B2RF. An application of Diamond at 9oz.ac.was made on July 11 to all plots
receiving bug treatments.
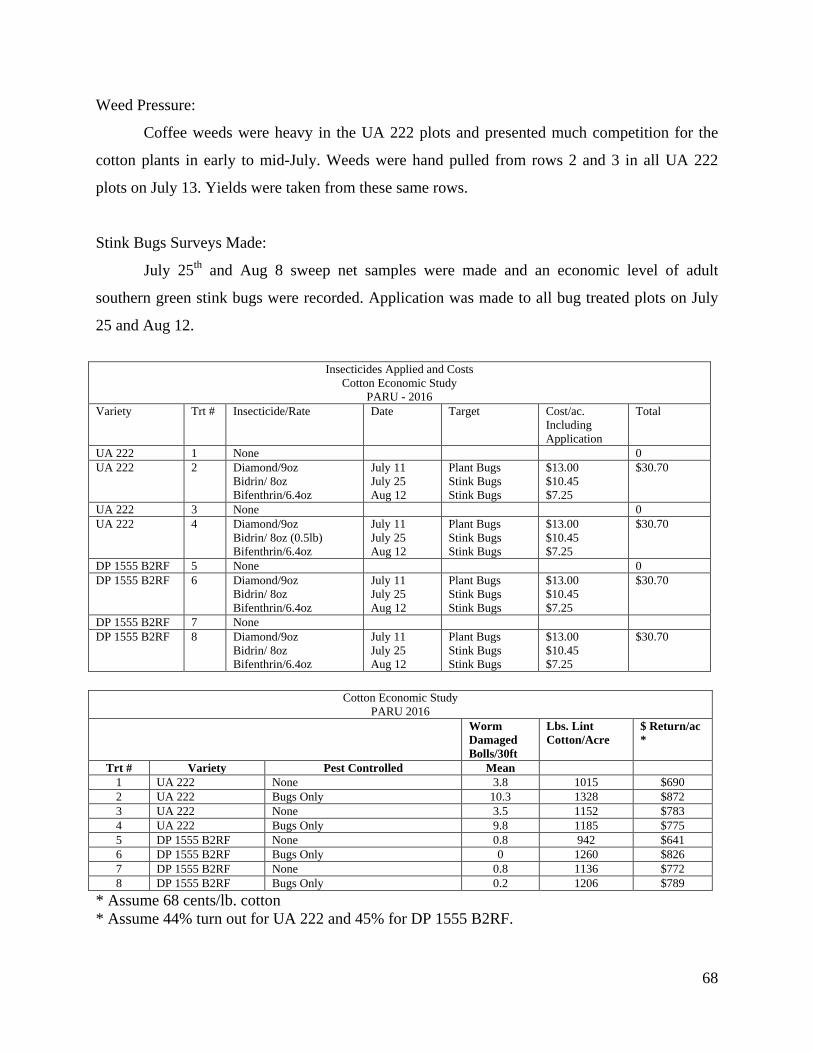
68
Weed Pressure:
Coffee weeds were heavy in the UA 222 plots and presented much competition for the
cotton plants in early to mid-July. Weeds were hand pulled from rows 2 and 3 in all UA 222
plots on July 13. Yields were taken from these same rows.
Stink Bugs Surveys Made:
July 25th and Aug 8 sweep net samples were made and an economic level of adult
southern green stink bugs were recorded. Application was made to all bug treated plots on July
25 and Aug 12.
Insecticides Applied and Costs
Cotton Economic Study PARU - 2016
Variety Trt # Insecticide/Rate Date Target Cost/ac. Including Application
Total
UA 222 1 None 0 UA 222 2 Diamond/9oz
Bidrin/ 8oz Bifenthrin/6.4oz
July 11 July 25 Aug 12
Plant Bugs Stink Bugs Stink Bugs
$13.00 $10.45 $7.25
$30.70
UA 222 3 None 0 UA 222 4 Diamond/9oz
Bidrin/ 8oz (0.5lb) Bifenthrin/6.4oz
July 11 July 25 Aug 12
Plant Bugs Stink Bugs Stink Bugs
$13.00 $10.45 $7.25
$30.70
DP 1555 B2RF 5 None 0 DP 1555 B2RF 6 Diamond/9oz
Bidrin/ 8oz Bifenthrin/6.4oz
July 11 July 25 Aug 12
Plant Bugs Stink Bugs Stink Bugs
$13.00 $10.45 $7.25
$30.70
DP 1555 B2RF 7 None DP 1555 B2RF 8 Diamond/9oz
Bidrin/ 8oz Bifenthrin/6.4oz
July 11 July 25 Aug 12
Plant Bugs Stink Bugs Stink Bugs
$13.00 $10.45 $7.25
$30.70
Cotton Economic Study
PARU 2016 Worm
Damaged Bolls/30ft
Lbs. Lint Cotton/Acre
$ Return/ac *
Trt # Variety Pest Controlled Mean 1 UA 222 None 3.8 1015 $690 2 UA 222 Bugs Only 10.3 1328 $872 3 UA 222 None 3.5 1152 $783 4 UA 222 Bugs Only 9.8 1185 $775 5 DP 1555 B2RF None 0.8 942 $641 6 DP 1555 B2RF Bugs Only 0 1260 $826 7 DP 1555 B2RF None 0.8 1136 $772 8 DP 1555 B2RF Bugs Only 0.2 1206 $789
* Assume 68 cents/lb. cotton * Assume 44% turn out for UA 222 and 45% for DP 1555 B2RF.

69
Yield/Returns – Cotton Economic Study Insect Control Versus Variety
Variety Insect Control Yield (lbs. lint/ac) Return (above insect costs) UA 222 Bugs 1256 $827 UA 222 None 1083 $738 DP 1555 B2RF Bugs 1233 $808 DP 1555 B2RF None 1039 $707 Across Varieties lbs. lint/ac.
Difference +184 Bug Sprayed 1245 No insect control 1061 Variety Difference lbs. lint/ac.
Difference +34 UA 222 1170 DP 1555 B2RF 1136
Insecticide applications for control of plant bugs and stink bugs were applied to the designated
plots in this trial.
No economic level of worm infestations was detected therefore no controls specifically for worm
control were made. An end of season worm damage boll count was made. Very low numbers of
worm damaged bolls were found in any of the DP 1555 B2RF Plots. The highest number of
worm damaged bolls were found in the UA 222 conventional variety plots that had been sprayed
for bugs. Insecticides targeted for bug control, especially stink bugs, generally suppress
beneficial insect numbers that assist in controlling bollworms.
Since no worm controls were applied, treatments number 2 and 4 (UA 222) and 6 and 8 (DP
1555 B2RF) were identical in treatment for bugs only. In all treatments, the plots treated for bugs
had higher yields and returns than those that did not. The returns on the bug treatments were
greater than the cost of bug control ($30.70).
When calculating across varieties the bug treated plots out yielded the untreated by 184 lbs. of
lint. When looking at the varietal comparison, regardless of direct control, the UA 222 yielded 34
more lbs. of lint than did the DP 1555 B2RF. Both varieties yielded above 1100 lbs. of lint per
acre.

70
There were two major factors at play in the yield results from this trial. One was whether the plot
was sprayed for bugs or not. The second was the location of these replicated plots within the trial
area. Plots on the perimeter of the trial encountered much heavier stink bug pressure and damage
than plots located nearer the center of the trial. This is due to the nature of stinkbug infestations.
Stink bugs do not randomly distribute across fields such as plant bugs. Stink bugs are weak or
“lazy” flyers and therefore settle into the perimeter rows of cotton or other host crops.
Observations indicate that the heaviest stink bug injury occurs first and heaviest within the first
12-15 feet of a field border.
Therefore, under heavy stink bug pressure such as experienced at the Prattville research farm in
both 2015 and 2016, it is very difficult to do replicated small plot research with cotton.
Furthermore, the Prattville research station may be the only cotton research farm in the U.S.
cotton Belt that is heavily infested with the brown marmolated stink bug in addition to our native
brown and southern green species.

71
Validating Treatment Thresholds and Determining Border Effect of
Brown Marmorated Stink Bugs in Cotton
R. Smith, and S. Duke
The objective of this study was twofold. First to define the width of the cotton field border that
was susceptible to BMSB injury. Second was to determine if a new stink bug threshold is needed
since older more mature bolls are at risk of damage from this species.
Brown Marmorated Stink Bug Prattville Agricultural Research Unit Trt # Rows From Edge Control Regime Rep I Rep II Rep III Rep IV 1 0 – 8 Untreated 101 207 304 401 2 9 – 16 Untreated 105 202 308 402 3 17- 24 Untreated 109 209 303 406 4 0 – 8 Threshold 104 201 307 404 5 9 – 16 Threshold 108 205 305 405 6 17- 24 Threshold 103 203 309 409 7 0 – 8 Maximum Control 107 204 301 407 8 9 – 16 Maximum Control 102 208 302 408 9 17- 24 Maximum Control 106 206 306 403

72
New Home Const.
Hedgerow and BARNS/SHEDS
Cotton Disease Trial
407 M
408 M
409 T
404 T
405 T
406 U
401 U
402 U
403 M
307 T
308 U
309 T
304 U
305 T
306 M
301 M
302 M
303 U
Tree Line
207 U
208 M
209 U
204 M
205 T
206 M
201 T
202 U
203 T
107 M
108 T
109 U
104 T
105 U
106 M
101 U
102 M
103 T
U = Untreated T = Threshold M = Maximum Control Planted May 4 Variety DP 1555 Plot Size 8 Rows x 50 Ft. Corn
Collected 10 bolls per plot weekly beginning the third week of bloom. Boll were examined for
internal stink bug injury. Insecticide controls were applied based on predetermined thresholds or
schedules.
Spray Dates for Brown Marmorated Stink Bug – Cotton Prattville
7/28 – M & T
8/2 – M & T
8/12 – M Only
8/17 – M & T
8/24 – M & T
9/6 – M Only

73
Sprays were bifenthrin @ 6.4 oz. /A
M = Maximum Control = 6 Applications
T = Established Threshold of 10% internal boll damage = 4 Applications
U = Untreated
BMSB Trial
% Boll Damage 7/25 8/1 8/8 8/15 8/22 9/6 Mean Untreated 14 a 40 a 33 a 54 a 27 a 21 a 32 a Threshold 8 a 35 a 8 b 33 b 17 a 11 ab 19 b Maximum 15 a 31 a 13 b 37 ab 22 a 7 b 21 b Application Dates: Threshold: 7/28, 8/2, 8/17, 8/24 (4 Total) Maximum 7/28, 8/2, 8/12, 8/17, 8/24, 9/6 ( 6 Total)
BMSB Trial Yield by Treatment and Location (lbs. Seed Cotton/AC)
Border Middle Interior Untreated
2465 3698 3422 Threshold (4 App)
3074 4379 3944 Maximum ( 6 App)
3089 3959 4684
BMSB Trial No. Stink Bugs/ 20 Sweeps
(Samples Taken From Untreated Plots) Brown SGSB BMSB
Date I A I A I A July 19 0 .5 .5 .2 0 0.1 Aug 1 0 .1 .6 1.2 .2 1.1 Aug 8 0 .1 0 1.4 .3 .4
Aug 10 * 0 0 0 .3 .3 .9 Aug 15 * 0 0 0 0 0 .3
* Counts made by walking slowly and observing BMSB Trial
Factors Affecting Damage and Yields
1. Proximity of plot to border and/or end of trial area
2. Treatments made to adjacent plots (untreated with 4 sides treated) (Example plot 202 UT)
3. Location of plot in relation to other host crops (cotton/corn)
4. Treated or untreated (# of applications)
BMSB Trial
Conclusions
1. Trial was conducted under heavy stink bug pressure by both BMSM and SGSB.

74
2. Pyrethroids (bifenthrin) gave good control of both BMSB and SGSB when used on tight
schedule (weekly on borders).
3. We may need additional late season applications to control BMSB.
4. No good scouting method for quantifying number of BMSB’s.
5. Cotton borders adjacent to overwintering habitat not the only factor to consider when
other early season hosts (corn) are present.
6. A high percent of bolls with external feeding signs had internal damage, even in a dry
season.
7. Stink bug damaged bolls do not open as rapidly as do undamaged bolls (likely due to
delayed fiber development).
8. As population of BMSB’s spread they will likely be a major economic pest of cotton on
field borders or adjacent to other host crops.

75
VI. Nematode Management Varietal and Nematicidal Application Responses in North Alabama
soils, 2016
K.S. Lawrence, M. Hall, D. Dodge, D. Dyer, W. Groover, S. Till, N. Xiang Velum Total in-furrow spray applications combined with seed treatments were evaluated for
reniform nematode management. Applications were applied to two Stoneville cotton varieties,
ST 4946GLB2 and ST 4747GLB2. The field site is located on the Tennessee Valley Research
Center near Belle Mina, AL. This field has been cultivated in cotton for over 16 years and was
artificially infested with the reniform nematode in 1997. The soil is a Decatur silt loam. Gaucho,
Aeris, and Fluopyram were applied as seed treatments prior to planting, and Velum Total was
applied as an in-furrow spray with 8002 flat-fan nozzles angled diagonally across the seed
furrow immediately preceding the seed. Plots were planted on 5 May with a soil temperature of
69°F at 4-in depth and adequate soil moisture. Plots consisted of 4 rows measuring 25-ft long
with 40-in row spacing and were arranged in a randomized complete block design with five
replications. A 15-ft wide alley separated blocks. All plots were maintained throughout the
season with standard herbicide, insecticide, and fertility production practices as recommended by
the Alabama Cooperative Extension System. Plots were irrigated with a sprinkler system as
needed. Seedling stand and vigor were determined at 33 days after planting (DAP) on 7 Jun.
Samples were collected for nematode analysis by digging up 4 random plants per plot on 7 Jun.
Nematodes were extracted from the root systems using 6% NaOCl and collecting the nematodes
on a 25 µm sieve. Plots were harvested on 23 Oct. Data were statistically analyzed using SAS
9.4 PROC GLIMMIX and means compared using Tukey-Kramer (P < 0.10). Monthly average
maximum temperatures from planting in May through harvest in Oct were and 82.3, 90.1, 91.6,
88.1, 84.8, and 75.5°F with average minimum temperatures of 60.1, 69.2, 71.7, 67.6, 63.1, and
51.6°F, respectively. Rainfall accumulation for each month was 4.62, 3.48, 4.18, 2.16, 0.98, and
2.2 in with a total of 17.62 in over the entire season. The rainfall was adequate in Jul but very dry
in Aug and Sep.
Reniform nematode disease pressure was moderate for irrigated cotton in 2016. No significant
variety by treatment interactions were revealed by data analysis, indicating both varieties

76
responded similarly to nematicide treatments across replications. Plant stand at 33 DAP was
similar for all nematicide applications, and all stand counts with the exception of the untreated
control (1) fell within the acceptable range of 2-4 plants per foot of row. All treatments
demonstrated improved vigor compared to the untreated control (1). Both Velum Total
applications at 14 oz/A (3) and 18 oz/A (4), Velum Total + Aeris combination (5), and the
Gaucho + Fluopyram combination (7) reduced reniform eggs per gram of root compared to the
Gaucho treatment (2) alone. Seed cotton yields ranged from a low of 2143 to 2910 lb/A;
however, yields were statistically similar across all nematicide treatments as well as both
varieties.
xStand indicates the number of seedlings in 25 ft of row 33 days after planting (DAP). yPlant vigor ratings ranged from 1-6 with 1 indicating strong proliferation and 6 representing extremely poor vitality. zColumn numbers followed by the same letter are not significantly different within nematicide or variety treatments at P ≤ 0.1 as determined by the Tukey-Kramer method.
Treatment and Rate Standx Vigory
Root-knot eggs/g root
Seed cotton lbs/A
1. Untreated Control 49 az 4.9 a 3528 abc 2143 a
2. Gaucho 12.8 oz/cwt seed 53 a 3.1 b 8163 a 2797 a
3. Velum Total 14 fl oz/A 52 a 2.5 b 2628 bc 2586 a
4. Velum Total 18 fl oz/A 54 a 2.7 b 1171 c 2821 a 5. Velum Total 14 fl oz/A + Aeris 25.6 oz/ cwt seed 59
a 2.5
b 931 c 2840
a
6. Aeris 25.6 oz/ cwt seed 56 a 2.6 b 6595 ab 2607 a 7. Gaucho 12.8 oz/cwt seed + Fluopyram 8.5 oz/cwt seed 59
a 2.8
b 1465 c 2901
a
Varieties
‘ST 4946’ (tolerant) 56 A 3.1 A 2956 A 2740 A
‘ST 4747’ (susceptible) 53 A 2.9 A 4039 A 2602 A

77
Cotton Variety Selection with and without Velum Total for Root-knot Nematode Management in Central Alabama, 2016
W. Groover, K. S. Lawrence, N. Xiang, S. Till, D. Dodge, D. Dyer, and M. Hall
Five cotton varieties were evaluated along with Velum Total for control of the root-knot
nematode. This test was conducted at the Plant Breeding Unit Research Station near Tallassee,
Alabama. The field has a substantial population of the root-knot nematode (Meloidogyne
incognita race 3). The soil type is Kalmia loamy sand, which contains 80% sand, 10% silt, and
10% clay. Seed varieties received standard seed treatment as sold based upon variety, and
Velum Total was applied in-furrow with 8002 flat fan nozzles angled diagonally across the seed
furrow after seed at a rate of 14 oz/acre on right two rows of each plot. Plots were planted on 16
May, and consisted of 4 rows that were 25 feet long with 36-inch row spacing. Seed was planted
at 1-inch depth. The plots were arranged in a randomized complete block design with five
replications of each treatment and a 20-feet-wide alley. All plots were maintained as
recommended via the Alabama Cooperative Extension System with typical pesticide and fertility
production practices, and an overhead irrigation system was used for watering as needed.
Nematode densities and stand measurements were taken in the root-knot nematode infested field
at 28 DAP (days after planting). Nematodes were extracted from the cotton roots using 6% NaCl
and collected on a 25 um sieve. Harvest took place on 4 October at 141 DAP. Data was
statistically analyzed by SAS 9.4 (SAS Institute Inc.) using ANOVA and means were compared
using Tukey-Kramer with P ≤ 0.1. Monthly average maximum temperatures from planting in
May through harvest in October were 82.3, 90.9, 93.5, 92, 92.1, and 85°F with average minimum
temperatures of 57.5, 66.3, 69.9, 70.5, 64.9, and 51.2°F, respectively. Average temperatures
from May to October was 69.9, 78.6, 81.7, 81.3, 78.5, and 68.1°F. Rainfall accumulation for
each month was 1.76, 2.82, 2.94, 4.12, 0.95, and 0.23 in., respectively.
Deltapine 1646 B2XF with Velum Total (VT) stand was statistically higher than Deltapine 1538
B2XF untreated, Stoneville 6182 GLT untreated, and Stoneville 4848 GLT with VT. Root-knot
nematode eggs per gram of root were statistically lower with the addition of Velum Total in

78
varieties Deltapine 1538 B2XF and Deltapine 1646 B2XF when compared to the untreated
varieties. Deltapine 1646 B2XFwith VT yield was statistically higher than four other treatments,
which were untreated Deltapine 1538 B2XF, Phytogen 333 WRF, Stoneville 4848 GLT, and
Stoneville 6182. Of the five varieties screened, both Stoneville 4848 and Stoneville 6182 GLT
yields were statistically higher with the addition of Velum Total.
Cotton Varietyy Stand Eggs/g root lb/A seed cotton Deltapine 1538 B2XF Velum Total 80 abcx 1030 bc 4598 ab Deltapine 1538 B2XF Untreated 73 bcd 2091 a 4069 bcd Deltapine 1646 B2XF Velum Total 87 a 558 c 4725 a Deltapine 1646 B2XF Untreated 81 abc 1514 ab 4373 abc Phytogen 333 WRF Velum Total 84 ab 1200 bc 4365 abc Phytogen 333 WRF Untreated 77 abc 650 b 4048 bcd Stoneville 4848 GLT Velum Total 63 d 830 bc 4451 ab Stoneville 4848 GLT Untreated 76 abc 1382 abc 3956 cd Stoneville 6182 GLT Velum Total 80 abc 855 bc 4191 abc Stoneville 6182 GLT Untreated 72 cd 1039 bc 3500 d
yVelum Total was added to all varieties at a rate of 14 oz/acre in-furrow spray. xColumn numbers followed by the same letter are not significantly different at P≤0.1 as determined by Tukey’s multiple-range test.

79
Cotton Variety Selection with and without Velum Total for Reniform Management in North Alabama, 2016
W. Groover, K.S. Lawrence, N. Xiang, S. Till, D. Dodge, D. Dyer, and M. Hall
Twelve cotton varieties were evaluated along with Velum Total for control of the reniform
nematode. This test was conducted in the field at the Tennessee Valley Research and Extension
Center near Belle Mina, Alabama. The field was infested with the reniform nematode in 1997
and has been cultivated in cotton for over 17 years. The soil type is Decatur silt loam, which
contains 24% sand, 49% silt, 11% clay and 1% organic matter. Seed varieties contained a
standard seed treatment as sold based upon variety. Velum Total was applied in-furrow with
8002 flat fan nozzles angled diagonally across the seed furrow after seed at a rate of 14 oz/acre
on right two rows of each plot. Plots were planted on 4 May, and consisted of 4 rows that were
25 feet long with 36-inch row spacing. Seeds were planted at 1-inch depth. The plots were
arranged in a randomized complete block design with five replications of each treatment and a
20-feet-wide alley. All plots were maintained as recommended via the Alabama Cooperative
Extension System with typical pesticide and fertility production practices, and an overhead
irrigation system was used for watering as needed. Nematode densities were measured in the
reniform infested field at 34 days after planting (DAP). Nematodes were extracted from the
cotton roots using 6% NaCl and collected on a 25-um sieve. Harvest occurred on 5 October at
154 DAP. Data was statistically analyzed by ANOVA using SAS 9.4 (SAS Institute Inc.) and
means were compared using Tukey-Kramer with P ≤ 0.1. Monthly average maximum
temperatures from planting in May through harvest in October were 81.14, 92.84, 93.92, 88.16,
92.48, and 83.84°F with average minimum temperatures of 58.82, 68.54, 72.32, 71.96, 65.3, and
53.78°F, respectively. Average temperatures from May to October were 69.98, 80.78, 83.12,
81.86, 78.98, and 68.72°F. Rainfall accumulation for each month were 3.45, 4.06, 6.93, 12.73,
0.3, and 1.09 in., respectively.

80
Velum Total significantly reduced reniform eggs per gram of root compared to untreated in eight
of the twelve cotton varieties tested. When looking at yield, seven of the twelve varieties tested
saw a statistically significant increase in yield with the addition of Velum Total compared to the
untreated cotton. These varieties were Phytogen 312 WRF, Phytogen 444 WRF, Phytogen
495W3RF, Phytogen 552 WRF, Deltapine 1614 B2XF, Nexgen 3522 B2XF, and Stoneville 6182
GLT.
Cotton Varietyy Eggs/g root lb/A Seed Cotton Phytogen 312 WRF Velum Total 1310 cx 3364 a Phytogen 312 WRF Untreated 1 0318 b 2750 bcdef Phytogen 444 WRF Velum Total 2446 bc 3077 abc Phytogen 444 WRF Untreated 7306 b 2236 fgh Phytogen 495 W3RF Velum Total 154 c 2649 cdefg Phytogen 495 W3RF Untreated 20182 a 1969 h Phytogen 552 WRF Velum Total 222 c 2905 abcde Phytogen 552 WRF Untreated 4873 b 2104 gh Deltapine 1553 B2XF Velum Total 244 c 2755 bcdef Deltapine 1553 B2XF Untreated 5391 b 2271 fgh Deltapine 1614 B2XF Velum Total 288 c 2919 abc Deltapine 1614 B2XF Untreated 5800 b 1996 h Deltapine 1639 B2XF Velum Total 735 c 2742 cdef Deltapine 1639 B2XF Untreated 5929 b 2273 fgh Deltapine 1646 B2XF Velum Total 418 c 3051 abcde Deltapine 1646 B2XF Untreated 7875 b 2344 efgh Dynagrow 3526 B2XF Velum Total 201 c 2521 defgh Dynagrow 3526 B2XF Untreated 2682 bc 2245 fgh Nexgen 3522 B2XF Velum Total 298 c 3316 ab Nexgen 3522 B2XF Untreated 3202 bc 2530 cdefg Stoneville 4848 GLT Velum Total 1055 c 2695 cdefg Stoneville 4848 GLT Untreated 5438 b 2135 gh Stoneville 6182 GLT Velum Total 407 c 2981 abcd Stoneville 6182 GLT Untreated 3303 bc 2175 fgh
yVelum Total was added to all varieties at a rate of 14 oz/acre in-furrow spray. xColumn numbers followed by the same letter are not significantly different at P≤0.1 as determined by Tukey’s multiple-range test.

81
Cotton Seed Treatment Combinations for Rotylenchulus reniformis Control and Yield Increase in North Alabama, 2016
W. Groover, K.S. Lawrence, N. Xiang, S. Till, D. Dodge, D. Dyer, and M. Hall Allegiance FL, Fluopyram 600 FS, Poncho/Votivo 2nd Gen., Avicta 500FS and Velum Total
were evaluated for combinations in Rotylenchulus reniformis (reniform nematode) control and
yield increase on cotton. This test was planted in the field at the Tennessee Valley Research and
Extension Center near Belle Mina, Alabama. This field was infested with the reniform nematode
in 1997 and has been cultivated in cotton for over 17 years. The soil type is Decatur silt loam,
which contains 24% sand, 49% silt, 11% clay and 1% organic matter. Seed treatments were
applied by Bayer Crop Science to variety ST 4747 GLB2. All treatments were put on as a seed
treatment, except for Velum Total, which was applied as an in-furrow spray at planting. Seed
treatments were applied pre-planting, and planting occurred on 4 May. Plots consisted of 4 rows
that were 7 meters long with 1-meter row spacing. Seed was planted at 2.54 cm depth. The plots
were arranged in a randomized complete block design with five replications of each treatment
and a 6-meter-wide alley. All plots were maintained as recommended via the Alabama
Cooperative Extension System with typical pesticide and fertility production practices, and an
overhead irrigation system was used for watering as needed. Plant stand, vigor, and nematode
population data was collected at 34 days after planting (DAP). Only living plants were included
in stand counts for data collection. Nematodes were extracted from the cotton roots using 6%
NaCl and collected on a 25 um sieve. Harvest occurred on 5 October at 154 DAP. Data was
statistically analyzed by ANOVA in SAS 9.4 (SAS Institute Inc.), and means were compared
using Tukey-Kramer with P ≤ 0.05. Monthly average maximum temperatures from planting in
May through harvest in October were 27.3, 33.8, 34.4, 31.2, 33.6, and 28.8°C with average
minimum temperatures of 14.9, 20.3, 22.4, 22.2, 18.5, and 12.1°C, respectively. Average
temperatures from May to October was 21.1, 27.1, 28.4, 27.7, 26.1, and 20.4°C. Rainfall
accumulation for each month was 3.5, 4.1, 6.9, 12.7, 0.3, and 1.1 cm, respectively.

82
Plant stands ranged from 41 to 52 plants per 7 meters of row, which is slightly below the optimal
range of 8 to 12 plants per meter of row. Stand was statistically higher for the untreated control
(1) stand than Poncho/Votivo + Fluopyram 600 FS (2). Plant vigor ranged from 3 to 4.4, with
Poncho/Votivo + Velum Total (6) at 3.0 statistically higher than Poncho/Votivo + Fluopyram
600 FS (2), at 4.4. Reniform egg densities were substantial at 34 DAP. Reniform egg densities
were statistically greater for the untreated control (1) than the Poncho/Votivo + Velum Total
treatment (6). Yield was greater for the Poncho/Votivo + Velum Total treatment (6) than all
other treatments in yield, at 3,052 kilograms per hectare.
No. Treatmentz Rate 34 DAP Standy
34 DAP Vigorx
Reniform Eggs/g Root
154 DAP kg/hectare
1 Untreated Control 52 aw 3.8 ab 9327 a 2136 bc 2 Poncho Votivo 2nd Gen. 0.424 mg ai/seed
Fluopyram 600 FS 0.25 mg ai/seed 41 b 4.4 b 6398 ab 2079 c 3 Poncho Votivo 2nd Gen. 0.424 mg ai/seed
Fluopyram 600 FS 0.2 mg ai/seed 50 ab 3.8 ab 2795 ab 2570 b 4 Fluopyram 600 FS 0.2 mg ai/seed 44 ab 4.6 b 2150 ab 2030 c 5 Avicta 500 FS 0.15 mg ai/seed 45 ab 3.8 ab 8521 ab 1934 c 6 Poncho Votivo 2nd Gen. 0.424 mg ai/seed
Velum Total 450 g ai/ha 47 ab 3.0 a 227 b 3052 a zAll treatments include Gaucho at 0.375 mg ai/seed, Spera at 54.8 mL/100kg, Proline 480 SC at 5 g ai/100 kg, Evergol Prime at 5 g ai/100 kg, and Allegiance FL at 48.9 mL/100 kg. yStand was the number of seedlings in 7 meters of row. xVigor ratings ranged from 1 to 6 with 1 being the best and 6 being the worst. wColumn numbers followed by the same letter are not significantly different at P≤0.05 as determined by Tukey’s multiple-range test.

83
Nematicide Combinations for Rotylenchulus reniformis Management
in North Alabama, 2016
W. Groover, K.S. Lawrence, N. Xiang, S. Till, D. Dodge, D. Dyer, and M. Hall Gaucho, Fluopyram 600 FS, Aeris Seed Applied System, Trilex Advanced FS300, and Velum
Total combinations were evaluated in Rotylenchulus reniformis (reniform nematode) control and
yield increase on cotton. This test was planted in the field at the Tennessee Valley Research and
Extension Center near Belle Mina, Alabama. This field was infested with the reniform nematode
in 1997 and has been cultivated in cotton for over 17 years. The soil type is Decatur silt loam,
which contains 24% sand, 49% silt, 11% clay and 1% organic matter. Seed treatments were
applied by Bayer Crop Science to variety ST 4747 GLB2. All treatments were put on as a as a
seed treatment, except for Velum Total, which was applied as an in-furrow spray at planting.
Seed treatments were applied pre-planting, and planting occurred on 4 May. Plots consisted of 4
rows that were 7 meters long with 1-meter row spacing, and seeds planted at 2.54 cm depth. The
plots were arranged in a randomized complete block design with five replications of each
treatment and a 6-meter-wide alley. All plots were maintained throughout the season with
standard herbicide, insecticide, and fertility production practices as recommended by the
Alabama Cooperative Extension System, and an overhead irrigation system was used for
watering as needed. Plant stand, vigor, and nematode population data were collected at 34 days
after planting (DAP). Only living plants were included in stand counts for data collection.
Nematodes were extracted from the cotton roots using 6% NaCl and collected on a 25-um sieve.
Harvest occurred on 5 October at 154 DAP. Data was statistically analyzed by ANOVA in SAS
9.4 (SAS Institute Inc.) and means were compared using Tukey-Kramer with P ≤ 0.05. Monthly
average maximum temperatures from planting in May through harvest in October were 27.3,
33.8, 34.4, 31.2, 33.6, and 28.8°C with average minimum temperatures of 14.9, 20.3, 22.4, 22.2,
18.5, and 12.1°C, respectively. Average temperatures from May to October was 21.1, 27.1, 28.4,

84
27.7, 26.1, and 20.4°C. Rainfall accumulation for each month was 3.5, 4.1, 6.9, 12.7, 0.3, and
1.1 cm, respectively.
Plant stands ranged from 34 to 55 plants per 7 meters of row, which is slightly below the optimal
range of 8 to 12 plants per meter of row. Plant vigor ranged from 3.6 to 5.6, with all seed
treatments significantly increasing plant vigor over the untreated control (1). In contrast, stand
was statistically lower for the untreated control (1) treatment than all other treatments. Reniform
nematode egg densities were substantial at 34 DAP. Reniform egg numbers were statistically
higher with the Gaucho treatment (2) at 4,545 eggs per gram of root than the Aeris Seed Applied
System + Trilex Advanced FS300 + Fluopyram 600 FS + Velum Total treatment (6) at 263 eggs
per gram of root, but there were no significance differences between other treatments. Yield was
significantly lower for the untreated control (1), which was 340 kg/hectare, than any other
treatment. This yield is surprisingly low as there was no other disease pressure in the field
besides the reniform nematode, so it is unclear why the low yield occurred for this treatment.
There were no statistical differences between the other five treatments.
No Treatmentz Rate 34 DAP Standy
34 DAP Vigorx
Reniform Eggs/g root
154 DAP kg/hectare
1 Untreated Control 34 bw 5.6 a 3863 ab 340 b 2 Gaucho 0.375 mg ai/seed 53 a 4.2 b 4545 a 1979 a 3 Gaucho 0.375 mg ai/seed
Fluopyram 600 FS 0.25 mg ai/seed 55 a 3.6 b 1030 ab 2632 a 4 Aeres Seed Applied System 0.75 mg ai/seed
Trilex Advanced FS300 47.3 mL/cwt 50 a 4.0 b 3863 ab 2053 a 5 Aeris Seed Applied System 0.75 mg ai/seed
Trilex Advanced FS300 47.3 mL/cwt
Fluopyram 600 FS 0.2 mg ai/seed 53 a 4.0 b 2016 ab 2164 a
6 Aeris Seed Applied System 0.75 mg ai/seed
Trilex Advanced FS300 47.3 mL/cwt
Fluopyram 600 FS 0.2 mg ai/seed
Velum Total 335.3 mL ai/ha 55 a 3.8 b 263 b 2869 a
zAll treatments include Spera 24.9 mL/cwt, Proline 480 SC at 2.37 mL ai/cwt, Evergol Prime at 2.37 mL ai/cwt, and Allegiance FL at 22.2 mL ai/cwt. yStand was the number of seedlings in 7 meters of row. xVigor ratings ranged from 1 to 6 with 1 being the best and 6 being the worst. wColumn numbers followed by the same letter are not significantly different at P≤0.05 as determined by Tukey’s multiple-range test.

85
Evaluation of Velum Total on Cotton for Root-knot Management in
Central Alabama, 2016
N. Xiang, K.S. Lawrence, W. Groover, D. Dodge, D. Dyer, S. Till, and M. Hall Velum Total was evaluated for the management of root-knot nematode on cotton in a naturally
infested field in the Plant Breeding Unit of the E V Smith Research Center near Tallassee, AL.
The soil is Kalmia loamy sand with 80% sand, 10% silt, and 10% clay. All nematicides except
Velum Total were seed treatments and applied by Bayer Crop Science. Plots consisted of 2 rows,
7 m long with 0.9 m spacing and were arranged in a randomized complete block design with five
replications. Blocks were separated by a 6-m-wide alley. All plots were maintained with standard
herbicide, insecticide, and fertility production practices throughout the season as recommended
by the Alabama Cooperative Extension System. Seedling stand was determined at 27 days after
planting (DAP) on 24 May. Shoot and root fresh weights of 4 root systems from each plot were
determined at 36 DAP. Nematode population densities were determined by extracting eggs from
4 root systems per plot at 36 DAP. Plots were harvested on 3 Oct. Data were analyzed in SAS
9.4 by Proc Glimmix procedure using Tukey-Kramer method with significant level P ≤ 0.05.
Monthly average maximum temperatures from planting in May through harvest in October were
27.9, 32.7, 34.2, 33.3, 33.4, and 29.4°C with average minimum temperatures of 14.2, 19.1, 21.1,
21.4, 18.3, and 10.7°C, respectively. Temperature was normal based on heat units. Rainfall
accumulation for each month was 1.76, 2.82, 2.94, 4.12, 0.95, and 0.23 cm with a total of 12.82
cm over the entire season. The rainfall was limited and dry throughout the growing season.
Nematode disease pressure was severe for conducting nematode research on early-planted cotton
in 2016. Aeris + Fluopyram 600 FS + Velum Total (10) significantly increased plant stand as
compared to Aeris (2) at 27 DAP. Shoot fresh weight, ranging from 14.0 g to 24.9 g, and root

86
fresh weight, ranging from 1.3 g to 2.6 g, were statistically similar among all the treatments at 36
DAP. Root-knot nematode eggs per gram of root were statistically similar among all the
treatments. All Velum Total treatments numerically reduced root-knot nematode numbers
compared to Gaucho and that average was 66%. Cotton yield varied by 986 kg/ha. The
treatments Aeris + Fluopyram (8) and Aeris + Velum Total 385.8 g ai/ha (5) significantly
increased seed cotton yield as compared to Aeris + Velum Total (7).
27 DAP 36 DAP 36 DAP Meloidogyne incognita (36 DAP) Seed Cotton No. Nematicidez Standy/ row SFWx RFWw Eggs/g rootv kg/ha 1 Gaucho 0 .03 mg ai/seed 74 abu 16.3 1.7 11248 2706 ab 2 Aeris seed applied system 0.75 mg ai/seed 69 b 18.9 1.8 10634 2568 ab 3 Aeris seed applied system 0.75 mg ai/seed 76 ab 17.7 1.8 7311 2949 ab
Velum Total 257.2 g ai/ha 4 Aeris seed applied system 0.75 mg ai/seed 77 ab 19.2 1.7 1969 2977 ab
Velum Total 321.5 g ai/ha 5 Aeris seed applied system 0.75 mg ai/seed 82 ab 14.4 1.5 2010 3371 a
Velum Total 385.8 g ai/ha 6 Aeris seed applied system 0.75 mg ai/seed 82 ab 24.9 2.1 4246 2754 ab
Velum Total 450 g ai/ha 7 Aeris seed applied system 0.75 mg ai/seed 83 ab 24.6 2.6 1831 2400 b
Velum Total 578.7 g ai/ha 8 Aeris seed applied system 0.75 mg ai/seed 77 ab 14.0 1.3 11063 3386 a
Fluopyram 600 FS 0.2 mg ai/seed 9 Aeris seed applied system 0.75 mg ai/seed 82 ab 16.3 1.7 8543 2765 ab
Fluopyram 600 FS 0.2 mg ai/seed Velum Total 321.5 g ai/ha 10 Aeris seed applied system 0.75 mg ai/seed 89 a 17.6 1.9 1034 2630 ab
Fluopyram 600 FS 0.2 mg ai/seed Velum Total 385.8 g ai/ha zNematicide treatments included a base fungicide-insecticide application of 54.8 ml/100kg of Spera, 5g ai/100kg of Proline 480 SC, 652 ml/100kg
of Secure plus seed gloss 661, 5 g ai/100kg of Evergol prime, 48.9 ml/100kg of Allegiance FL, and 0.03 mg ai/seed of Gaucho. yStand was the number of seedlings per row. xSFW means shoot fresh weight (g) per 4 cotton plants. wRFW means root fresh weight (g) per 4 root systems. vEggs/g root means root-knot nematode eggs per gram of root. uMeans followed by same letter do not significantly differ according to Tukey-Kramer test (P≤0.05).

87
Evaluation of Velum Total on Cotton for Reniform Nematode Management in North Alabama, 2016
N. Xiang, K.S. Lawrence, W. Groover, D. Dodge, D. Dyer, S. Till, and M. Hall
Velum Total was evaluated for the management of reniform nematode on cotton in a naturally
infested field at Tennessee Valley Research and Education Center in Belle Mina, AL. The soil is
a Decatur silt loam (24% sand, 28% clay, and 49% silt). All nematicides except Velum Total
were seed treatments and applied to Stoneville 4747 GLT by Bayer Crop Science. Plots
consisted of 2 rows that were 7-m long with 0.9-m spacing and were arranged in a randomized
complete block design with five replications. Blocks were separated by a 6-m-wide alley. All
plots were maintained with standard herbicide, insecticide, and fertility production practices
throughout the season as recommended by the Alabama Cooperative Extension System. Seedling
stand, vigor, plant height, biomass including shoot and root fresh weights of 4 cotton plants per
plot, and nematode population densities were determined at 33 days after planting (DAP) on 7
June. Plots were harvested on 6 Oct. Data were analyzed in SAS 9.4 by Proc Glimmix procedure
with significant level P ≤ 0.05. Means were separated by Tukey-Kramer test. Monthly average
maximum temperatures from planting in May through harvest in October were 26.7, 31.1, 32.8,
32.8, 29.4, and 23.4°C with average minimum temperatures of 12.8, 17.2, 18.9, 17.8, 13.9, and
7.8 °C, respectively. Rainfall accumulation for each month was 4.8, 3.9, 3.3, 3.9, and 3.4 cm
with a total of 23.7 cm over the entire season. The rainfall was adequate in May but became
limited through the remainder of the season.
Nematode disease pressure was severe for conducting nematode research on early-planted cotton
in 2016. Plant stand, vigor, and plant height, were statistically similar among all the treatments at
33 DAP. Plant biomass was significantly increased by Aeris + Velum Total (7) as compared to
Gaucho control (1). Reniform nematode eggs per gram of root was significantly reduced by

88
Velum Total (5) and Aeris + Fluopyram + Velum Total (8) as compared to Aeris (2). Difference
in cotton yield varied by 1575 kg/ha numerically from Gaucho being the lowest and Velum Total
578.7 g ai/ha the highest. All the Velum Total treatments, Velum Total (5), Velum Total (6),
Aeris + Velum Total (7), and Aeris + Fluopyram 600 FS + Velum Total (8), significantly
increased seed cotton yield compared to Gaucho control (P ≤ 0.10) and that average increase was
47%. Two of the seed treatments, Aeris (2) and Aeris + Admire pro (3), also significantly
increased seed cotton yield compared to Gaucho control (P ≤ 0.10) and that average increase was
37%.
33 DAP Reniform nematode Seed Cotton
No. Nematicidez Standy/ row Vigorx Heightw Biov Eggs/g rootu kg/ha
1 Gaucho 0.03 mg ai/seed 44 4.4 11.6 9.4 b 3415ab 1442 bt 2 Aeris seed applied system 0.75 mg ai/seed 47 4.2 12.9 13.8 ab 5580 a 2294 a 3 Aeris seed applied system 0.75 mg ai/seed 46 3.4 13.8 14.8 ab 1899 ab 2266 a
Admire pro systemic pro 361.7 mg ai/ha 4 Aeris seed applied system 0.75 mg ai/seed 52 3.8 12.6 12.3 ab 2888 ab 1918 ab
Fluopyram 600 FS 0.2 mg ai/seed 5 Velum Total 450 g ai/ha 48 3.8 14.4 17.3 ab 954 b 2506 a 6 Velum Total 578.7 g ai/ha 47 3.8 13.1 14.6 ab 1364 ab 3017 a 7 Aeris seed applied system 0.75 mg ai/seed 47 3.8 14.4 18.4 a 1367 ab 2819 a
Velum Total 450 g ai/ha 8 Aeris seed applied system 0.75 mg ai/seed 53 3.2 12.9 17.4 ab 333 b 2638 a
Fluopyram 600 FS 0.2 mg ai/seed Velum Total 450 g ai/ha zNematicide treatments included a base insecticide application of 54.8 ml/100kg of Spera, 5g ai/100kg of Proline 480 SC, 652 ml/100kg of Secure plus seed gloss 661, 5g ai/100kg of Evergol prime, 48.9 ml/100kg of Allegiance FL, and 0.03 mg ai/seed of Gaucho. yStand was the number of seedlings per row. xVigor ratings from 1 to 6 with 6 being the best and 1 the worst. wHeight means plant height (cm). vBio means plant biomass including shoot fresh weight (g) and root fresh weight (g). uEggs/g root means reniform nematode eggs per gram of root at 33 DAP. tMeans followed by same letter do not significantly differ according to Tukey-Kramer test (P ≤ 0.10).

89
A Potential New Biological Nematicide for Reniform Management in North Alabama, 2016
D. Dyer, K. S. Lawrence, S. Till, D. Dodge, W. Groover, N. Xiang, and M. Hall
Five rates and combinations of a biological nematicide were tested for their control of the
reniform nematode on cotton. The field site where this test was conducted is located at Auburn
University’s Tennessee Valley Research and Education Center, Belle Mina, AL. This field has
been cultivated in cotton for over 16 years and was infested with the reniform nematode in 1997.
The field contains a Decatur silt loam soil type, which consists of 24% sand, 49% silt, and 28%
clay. All nematicides were applied to the crop as seed treatments. BioST nematicide and
experimental treatments are products of Albaugh LLC, and the BioST nematicide is part of a
seed treatment platform being launched by Albaugh in 2017. Seed treatment rate designations
were assigned by the manufacturer, but quantitative application rates were not specified. The
cotton variety used during this test was NexGen 3406 B2XF. The test was planted on 4 May,
planting depth was 2.5 centimeters and the soil temperature at the time of planting was 24°C.
Each test plot consisted of two rows that were 7 meters long with a 1-meter row spacing. The
test was replicated 5 times and arranged in a randomized complete block design. The test was
maintained throughout the season with standard insecticide, herbicide, and fertilizer practices as
recommended by the Alabama Cooperative Extension System. Average monthly high
temperatures for the area from the time of planting until harvest were 27, 34, 34, 33, 33, and
29°C and average monthly low temperatures were 15, 21, 22, 22, 18, and 12°C. Rainfall
accumulation for each month during the growing season was 3.45, 4.06, 6.93, 12.73, 0.30 and
1.09 centimeters with a total rainfall amount of 28.58 centimeters. Test was watered throughout
the season as needed by a lateral irrigation system. Seedling stands were counted 30 days after
planting (DAP). Nematode samples were taken 45 DAP by digging up four plants at random for

90
each plot. Nematodes were extracted by soaking the roots in a 6% NaOCl solution on a shaker
table for four minutes, and the nematodes were collected on a 25-µm sieve. The test was
harvested and the yield data was collected on 5 October. Data was analyzed with SAS 9.4 using
PROC GLIMMIX and LS-means were compared using Tukey-Kramer’s method (P ≤ 0.1).
In this test, plant stands were similar for all treatments and ranged from 7.6 to 8.9 plants per
meter of row. Forty-five days after planting, the total reniform nematode egg numbers ranged
from 1,450 to 7,330 with the Fluopyram and BioST Nematicide Concentrate + Experimental 2
treatments showing significantly lower numbers as compared to the untreated control. Biomass
in this test ranged from 8.42 grams to 15.87 grams with the high rate treatment of BioST
nematicide showing significantly higher biomass than the control. Biomass was decreased in
this study, compared to the control, by treatments of the BioST Nematicide concentrate and the
BioST Nematicide concentrate + Experimental product 2. Yield ranged from 2091 to 2754 kg/ha.
Yield was 663 kg/ha greater for the high rate of the BioST nematicide than the untreated control.
Reniform nematode eggs
Seed treatment Stand z
30 DAP total eggs y per g of root Biomass x Seed cotton yield kg./ ha
Control 63 a 7330 a 7176 a 11.46 b 2091 b Fluopyram 59 a 1450 b 1831 b 10.23 bc 2251 b Abamectin 55 a 3588 ab 3824 ab 10.55 bc 2130 b BioST Nematicide low 60 a 6591 ab 7617 a 10.72 bc 2159 b BioST Nematicide High 60 a 7161 a 5293 ab 15.87 a 2754 a BioST Nematicide Concentrate 59 a 3080 ab 4720 ab 8.42 c 2147 b BioST Nematicide Concentrate + Experimental product 1 59 a 5652 ab 7195 a 8.56 c 2251 b
BioST Nematicide Concentrate + Experimental product 2 53 a 1719 b 2517 ab 9.47 bc 2351 ab zStand is the total number of plants in 7 meters of row. Means followed by the same letter do not significantly differ according to Tukey-Kramer’s method (P ≤ 0.1) yTotal number of eggs that were found on the four plants that were sampled at 45 DAP. xBiomass is the total weight of the plant in grams.

91
A Potential New Biological Nematicide for Root-knot Management in North Alabama, 2016
D. Dyer, K. S. Lawrence, S. Till, D. Dodge, W. Groover, N. Xiang, and M. Hall
Five rates and combinations of a biological nematicide were tested for their control of the root-
knot nematode on cotton. The field site where this test was conducted is located on Auburn
University’s Plant Breeding Unit in Tallassee, AL. This field contains a Kalmia loamy sand soil
type made up of 80% sand, 10% silt, and 10% clay. All nematicides tested were applied to the
crop as seed treatments. BioST nematicide and Experimental products 1 and 2 are products of
Albaugh LLC. Seed treatment rate designations were assigned by the manufacturer, but
quantitative application rates were not specified. The cotton variety used during this test was
NexGen 3406. The test was planted on 26 April at a planting depth of 2.5 centimeters. The soil
temperature at the time of planting was 21.7°C. Each test plot consisted of two rows measuring
7 meters long with 1-meter row spacing. The test was replicated five times and arranged in a
randomized complete block design. The test was maintained throughout the season with
standard insecticide, herbicide, and fertilizer practices as recommended by the Alabama
Cooperative Extension System. The average monthly high temperatures for the area from the
time of planting until harvest were 24.2, 27.9, 32.7, 34.2, 33.3, 33.4, 29.4°C and the average
monthly low temperatures for the area were 10, 14.2, 19.1, 21.1, 21.4, 18.3, and 10.7°C. Rainfall
accumulation for each month during the growing season was 20.62, 4.47, 7.16, 7.47, 10.46, 2.41,
and 0.58 centimeters with a total rainfall amount of 53.44 centimeters. The test was watered
throughout the season as needed by a center-pivot irrigation system. Seedling stand counts were
taken 30 days after planting (DAP). Nematode samples were taken 45 DAP by digging up four
plants at random from each plot. Nematodes were extracted from cotton roots by soaking the

92
roots in a 6% NaOCl solution on a shaker table for 4 minutes, and the nematodes were collected
on a 25-µm sieve. Nematode population density is demonstrated below as both total eggs
extracted from the root systems of the four plants as well as nematode eggs per gram of root.
The test was harvested and yield data collected on 4 October. Data was analyzed with SAS 9.4
using PROC GLIMMIX and LS-means were compared using Tukey-Kramer’s method (P ≤ 0.1).
Root-knot nematode disease pressure on cotton was high in this field during 2016. Plant stands
were similar for all treatments in this test, ranging from 10.5 to 11.7 plants per meter of row.
When samples were taken 45 DAP, total root-knot nematode egg densities ranged from 38,378 to
75,056, and the root-knot nematode eggs per gram of root ranged from 16,214 to 26,930. Total
nematode egg densities were significantly higher for BioST Nematicide concentrate +
Experimental treatment 1 than the control, Fluopyram, Abamectin, and BioST Nematicide
concentrate + Experimental product 2 treatments. The control, Abamectin, and BioST
Nematicide concentrate + Experimental product 2 treatments supported lower nematode egg
population density per gram of root when compared to the BioST Nematicide concentrate +
Experimental product 1 treatment. In this study, plant biomass ranged from 19.1 to 27.8 grams.
Treatments of BioST nematicide in a concentrated form increased biomass compared with
Fluopyram or the high rate of BioST nematicide. Yields were statistically greater than the
control for Fluopyram, BioST high rate, and Abamectin treatments by 466, 462, and 633 kg/ha
respectively.
Root-knot nematode eggs
Treatment Stand z
30 DAP total y per g of root Biomass x Seed cotton yield kg/ha
Control 74 a 41823 b 16908 b 21.5 ab 3168 c Fluopyram 79 a 37389 b 19525 ab 19.1 b 3634 ab Abamectin 81 a 38378 b 17463 b 22.4 ab 3801 a BioST Nematicide Low rate 77 a 48899 ab 20105 ab 21.3 ab 3377 bc BioST Nematicide High rate 76 a 47586 ab 23057 ab 19.5 b 3630 ab BioST Nematicide Concentrate 82 a 58339 ab 20631 ab 27.8 a 3190 c BioST Nematicide Concentrate + Experimental product 1 77 a 75056 a 26930 a 23.9 ab 3152 c
BioST Nematicide Concentrate + Experimental product 2 80 a 41561 b 16214 b 22.3 ab 3462 abc

93
zStand is the total number of plants in 7 meters of row. Means followed by the same letter are not significantly different according to Tukey-Kramer’s method (P ≤ 0.1) yTotal number of eggs that were found on the four plants that were sampled at 45 DAP. xBiomass is the total weight of the plant in grams.
Varietal and Nematicidal Application Responses in Central Alabama Soils, 2016
K.S. Lawrence, M. Hall, D. Dodge, D. Dyer, W. Groover, S. Till, N. Xiang
Nematicidal applications were evaluated on two varieties of cotton for southern root-knot
nematode management. Treatments were applied to two Stoneville cotton varieties, ST
4946GLB2 and ST 4747GLB2; ST 4946GLB2 typically exhibits good tolerance in the presence
of the root-knot nematode, whereas ST4747GLB2 demonstrates only fair tolerance to the root-
knot nematode. The field site is located at the Plant Breeding Unit in Tallassee, Alabama. The
soil type is a Kalmia loamy sand. Gaucho, Aeris, and Fluopyram were applied as seed
treatments prior to planting, and Velum Total was applied as an in-furrow spray with 8002 flat-
fan nozzles angled diagonally across the seed furrow immediately preceding the seed. Plots were
planted on 26 Apr 2016 with a soil temperature of 67 °F at 1-in depth and adequate soil moisture.
Plots consisted of 4 rows measuring 25-ft long with 36-in row spacing and were arranged in a
randomized complete block design with five replications. A 10-ft wide alley separated blocks.
All plots were maintained throughout the season with standard herbicide, insecticide, and fertility
production practices as recommended by the Alabama Cooperative Extension System. Plots
were irrigated with a center pivot sprinkler system as needed. Seedling stand and vigor were
determined at 28 days after planting (DAP) on 24 May. Samples were collected for nematode
analysis by digging up 4 random plants per plot on 2 Jun. Nematodes were extracted from the
root systems using 6% NaOCl and collected on a 25 µm sieve. Plots were harvested on 3 Oct.

94
Data were statistically analyzed using SAS 9.4 PROC GLIMMIX and means compared using
Tukey-Kramer (P < 0.10). Monthly average maximum temperatures from planting in Apr
through harvest in Oct were and 83.4, 82.3, 90.9, 93.5 92.0, 92.1, and 82.7°F with average
minimum temperatures of 59, 57.5, 66.3, 69.9, 70.5, 64.9, and 51°F, respectively. Rainfall
accumulation for each month was 1.5, 1.76, 2.82, 2.94, 4.12, 0.95, and 0 in with a total of 14.09
in over the entire season. The rainfall was adequate in Jul but very dry in Aug, Sep, and Oct.
Root-knot nematode disease pressure was intense for cotton in 2016. No significant variety by
treatment interactions were revealed by data analysis, indicating both varieties responded
similarly to nematicide treatments. Plant stand at 28 DAP was similar for all nematicide
applications, and all stand counts fell within the acceptable range of 2-4 plants per foot of row.
The untreated control (1) and Velum Total 14 fl oz/A (3) treatments demonstrated increased
vigor compared to the Velum Total + Aeris (5) and Gaucho + Fluopyram (7) treatments. Both
‘ST 4946’ and ‘ST 4747’ vigor ratings were similar across all nematicide treatments. Nematode
population densities per gram of root were similar for both the tolerant ‘ST4946’ and susceptible
‘ST 4747’ varieties. The Velum Total 18 fl. oz./A treatment (4) significantly reduced nematode
eggs per gram of root compared to the untreated control (1). Seed cotton yields varied by 798
lb/A; however, yields were not significantly different across nematicide treatments as well as
both varieties.
wDue to no varietal interaction indicated through data analysis, treatments are compared with each other. xStand indicates the number of seedlings in 25 ft of row 28 days after planting (DAP). yPlant vigor ratings ranged from 1-6 with 1 indicating strong proliferation and 6 representing extremely poor vitality. zColumn numbers followed by the same letter are not significantly different within nematicide or variety treatments at P ≤ 0.1 as determined by the Tukey-Kramer method.
Treatment and Ratew Standx Vigory Root-knot eggs/g root Seed Cotton (lb/A) 1. Untreated Control 82 az 2.5 c 14,977 a 1939 a 2. Gaucho 12.8 oz/cwt seed 79 a 2.9 bc 12,591 ab 1814 a 3. Velum Total 14 fl oz/A 81 a 2.6 c 3615 ab 2079 a 4. Velum Total 18 fl oz/A 87 a 3.0 bc 2318 b 2612 a 5. Velum Total 14 fl oz/A + Aeris 25.6 oz/ cwt seed 81 a 3.8 a 9168 ab 2293 a 6. Aeris 25.6 oz/ cwt seed 81 a 3.2 b 10,963 ab 1956 a 7. Gaucho 12.8 oz/cwt seed + Fluopyram 8.5 oz/cwt seed 83 a 4.1 a 7663 ab 2294 a Varieties ‘ST 4946’ (tolerant) 83 A 3.2 A 7039 A 2178 A ‘ST 4747’ (susceptible) 81 A 3.1 A 10,474 A 2104 A

95
Cotton Variety Evaluation with and without Velum Total for Root-
Knot Management in South Alabama, 2016
S. Till, K.S. Lawrence, N. Xiang, W. Groover, D. Dodge, D. Dyer, and M. Hall Ten cotton varieties were evaluated along with Velum Total for control of the root-knot nematode at the Gulf Coast Research and Extension Center near Fairhope, Alabama. The field was artificially inoculated with root-knot nematode in 2013 and inoculation has been repeated in subsequent years. A control field of the same ten varieties was also planted in an adjacent field that is absent of root-knot nematode. The soil is a Malbis sandy loam, which contains 59% sand, 31% silt, 10% clay. The root-knot field trial was installed as a split plot design (variety and nematicide treatments) with five replications. Plots were planted on 12 May, and consisted of 4 rows, 25 feet long with 36-inch row spacing and 20-foot-wide alleys. Seed varieties contained standard seed treatment as sold based upon variety, and Velum Total was applied in-furrow to two rows in each plot with 8002 flat fan nozzles angled diagonally across the seed furrow at a rate of 14 oz/acre. The other two rows were left untreated. Seed was planted at a 1-inch depth. The control field consisted of 2-row plots arranged in a randomized complete block design replicated five times. All plots were maintained as recommended by the Alabama Cooperative Extension System with typical pesticide and fertility production practices, and an overhead irrigation system was used for watering as needed. Nematode densities were measured in the root-knot field at 46 days after planting (DAP) by digging up four random samples for both treated and untreated rows. Nematodes were extracted from the cotton roots using 6% NaOCl and collected on a 25 um sieve. Plots were harvested on 31 Oct, and data were subjected to

96
analysis of variance in SAS 9.4 (SAS Institute Inc.) using the PROC GLIMMIX procedure and means compared using Tukey-Kramer with P ≤ 0.10. Monthly average maximum temperatures from planting to harvest (May through Oct) were 82.7, 88.9, 90.1, 89.2, 88.7, and 83.4°F with average minimum temperatures of 63.9, 71.1, 74.8, 74.2, 70.7, and 58.3°F, respectively. Rainfall accumulation for each month was 2.31, 3.39, 2.91, 3.95, 0.00, and 0.00 in. respectively, with a total of 12.56 in. over the entire growing season. Root-knot disease pressure ranged from moderate to heavy for irrigated cotton at the Gulf Coast Research and Extension Center. ST 4848 GLT with Velum Total supported fewer eggs/g of root than both DP 1555 B2RF and PHY 444 WRF without the nematicide. Velum Total treated CR 3885 B2XF and DP 1555 B2RF yielded significantly better than untreated PHY 444 WRF, ST 4848 GLT, PHY 552 WRF, and treated PHY 552 WRF in the root-knot field. The root-knot nematode-resistant DP 1558 NR B2RF, both with and without Velum Total, yielded significantly better than PHY 552 WRF with Velum Total and PHY 444 WRF without Velum Total. In the field without root-knot infestation, DP 1555 B2RF had significantly higher yield than all but three varieties, CR 3885 B2XF, DP 1646 B2XF, and PHY 444 WRF.
Nematicide Variety Eggs/g of rooty Lbs/A seed cotton
With Root-knot Nematode
No Root-knot Nematode
No nematicide CR 3885 B2XF 2076 ab 2628 abcd 3572 ab Velum Totalz CR 3885 B2XF 672 ab 3557 a
No nematicide DP 1538 B2XF 3533 ab 2802 abcd 2860 b Velum Total DP 1538 B2XF 953 ab 3165 abcd
No nematicide DP 1555 B2RF 6777 a 2802 abcd 4095 a Velum Total DP 1555 B2RF 1952 ab 3514 a
No nematicide DP 1558NR B2RF 1363 ab 3412 abc 3064 b Velum Total DP 1558NR B2RF 983 ab 3354 abc
No nematicide DP 1646 B2XF 2943 ab 3093 abcd 3528 ab Velum Total DP 1646 B2XF 663 ab 3485 ab
No nematicide PHY 333 WRF 1660 ab 2802 abcd 2991 b Velum Total PHY 333 WRF 1324 ab 2643 abcd
No nematicide PHY 444 WRF 5216 a 1902 d 3267 ab Velum Total PHY 444 WRF 1298 ab 2715 abcd
No nematicide PHY 552 WRF 5926 ab 2105 cd 3049 b

97
Determination of Role of Salicylic Acid in Nematode-Induced Hypersensitive Responses
S. W. Park, and K. Lawrence
The proposed study is to understand the innate immune response of cotton plants toward reniform nematode (Rotylenchulus reniformis) infections, in order to deposit genetic repertoires for the development of new, sustainable transgenic lines which will boost cotton’s own disease resistance capacity. Towards this, our studies aim to substantiate if cotton roots (i.e., Lonren-1 line) are able to confer hypersensitive responses (HR) upon R. reniformis infections, which are the most eminent and effective defense machinery in plants. HR is characterized by rapid cellular suicide (programed cell death, PCD) in the local region surrounding infections, which limits pathogen establishment and spread. SPECIFIC AIMS Phenotyping R. reniformis-induced HR in the Lonren-1 roots. Establishing a confocal microscopy technique for co-imaging the real-time interactions of nematodes with cotton roots.
Velum Total PHY 552 WRF 2674 ab 1873 d
No nematicide ST 4848 GLT 1463 ab 2193 bcd 3209 b Velum Total ST 4848 GLT 1614 b 2860 abcd
No nematicide ST 6182 GLT 1559 ab 2585 abcd 2759 b Velum Total ST 6182 GLT 1725 ab 2817 abcd
zVelum Total was applied as an in-furrow spray at a rate of 14 oz/acre. yData was log transformed in order to satisfy model assumptions. xColumn numbers followed by the same letter are not significantly different at P≤ 0.10 as determined by Tukey’s multiple-range test.

98
Cellular characterization of HR: reactive oxygen species (ROS) burst (rapid production) at the region of cotton roots infected by R. reniformis. Aim 1. The lateral roots of Lonren-1 are hypersensitive towards R. reniformis infections. As an initial step to access HR associated with i) cotton, ii) root tissues and/or iii) nematodes, we monitored the morphological response of roots in two cotton lines (Lonren-1 and Barbren) towards R. reniformis infections (Fig. 1). Note that Lonren-1 is referred to as the HR developing line, while Barbren is considered as a tolerance line (Nematropica 41:68). Indeed, the infected (‘+’) roots of Lonren-1 formed an extended taproot system with vastly smaller lateral roots, whereas Barbren showed reduced taproot, yet normal lateral root system. The R. reniformis-mediated shortening of lateral roots in Lonren-1 is caused by perhaps rapid HR development in the localized area of infections. Aim 2. Real-time co-imaging of Lonren-1 roots and R. reniformis interactions. To define the molecular fingerprints of HR development in cotton roots, we developed a cell biological mean to co-image ‘realtime’ interacttions between cotton roots and nematodes (Fig. 2). This is possible as nematodes are autofluorescent at an excitation of 488nm wavelength, emitting a green color, while cotton roots are stained with propidium-iodide (PI) solution that is excited at 516nm excitation, producing a red color. It is worth noting that our imaging technique utilizing a confocal laser scanning microscope (Nikon) is the first and successful attempt to feed ‘live’ images in a single cell level of cotton roots, and their interactions/ responses to other organisms (e.g., nematodes). Using this technique, our analyses revealed that Lonren-1 roots develop rapid (< 24 hr), and localized cell death (LCD, collapse) at the site of R. reniformis infections (Fig. 3, see yellow arrow). Since nematodes are biotrophic, or transient biotrophic pathogens (keep host cells alive), these results corroborate for the first time the cell biological signature of ‘rootassociated HR’.
Fig 1 .
Fig 2 .

99
Aim 3. R. reniformis interactions stimulate localized ROS burst in the root tissues of Loren-1, but not Barben. To further substantiate if the LCD (shown in Fig. 3) is ‘true’ HR occurring as a part of defense response (HR) or, otherwise, disease symptom (chlorosis), this sub-aim tackled if the LCD accompanies ‘biphasic oxidative burst’, the most well described, distinctive molecular and metabolic fingerprints of HR. Towards that, we have employed a cell-permeable H2O2-specific fluorescent probe (2’,7’-dichlorofluorescin diacetate, green), and displayed the sequential co-imaging with PI-stained roots and nematode autofluorescence (Fig. 4). This unique approach unraveled, in further support of our physiological and cellular observations, that some cells in close proximity to R. reniformis-infection site accumulate H2O2 (green, green arrowhead) or some are dead (red, white arrowhead), indicating that the LCD is highly likely HR, developed likely by systemic and programmed cell necrosis mechanisms. In contrast, the same analysis revealed that the cell damage in root tissues of Barbren at/nearby the site of R reniformis infection is if any minimal and has little sign of ROS burst, proposing a novel mode of defense response that explains possible tolerance phenotype of Barbren to R. reniformis infections. Note that red dots indicate the PI-stained membrane of nucleolus (live cells). FUTURE DIRECTIONS: We will perform further characterization of Lonren-1 root-associated HR e.g.,) by determining i) chromatin condensation, ii) DNA laddering, iii) HR-associated marker gene expression, and iv) system biology analysis of Lonren-1 against a susceptible cotton line (SG747) as well as a tolerance line (Barbren). The later system biology studies will also elucidate and uncover molecular principle of unknown mode of defense manifesting in Barbren.
Fig 3 .
Fig 4 .

100

101
Isolation of a Root Signal, Attracting a Semi-endoparasitic Nematode Rotylenchulus reniformis
S. W Park
Plant-parasitic nematodes have received only limited study as cotton pathogens, and thus little is known about how they recognize and interact with host cells (e.g., cotton roots). Recent studies from our group have shown a presence of signal molecules in cotton root extracts, needed for cotton root-reniform interactions/infections. We hence hypothesized that cotton roots secrete metabolic compounds that signal and attract reniform nematodes. Discovery of the signal molecule(s) will not only increase our basic understanding on plant-nematode interactions, but also assist the development of unique strategies and resources to control nematode diseases. We believe that the proposed activities are well aligned with the cotton commission’s mission, particularly research that tackles the immediate and long-tern needs of its industry and producers in increasing production efficiency and profitability. We aimed to define if cotton plants produce underground signal chemicals in the short-distance communication with nematodes. It has long been recognized that chemotaxis (a movement in the direction of higher
concentrations of semiochemicals) is the primary means by which nematodes locate host plants (Parasite 15:310). Nematodes are indeed motile animals, undulating in the dorsal ventral direction (snake-like motion), and commonly referred to move ~1 meter through the soil within
their lifetime (apsnet.org). However, it is unclear if the movement of nematodes is autonomous or need environmental matrices such as water, wind, insects and/or animals. 1. Establishment of the novel nematode behavioural assay. To substantiate if nematodes can i) sense and ii) deliberately move towards chemical cues, we developed the agar assay plate of which surface a) is hydrophilic (0.02% agar, Fig. 1A) enough to evade the surface tension of nematodes (adhesion, shown in e.g., 0.1% agar; Fig. 1B), and b) forms the shape of a volcano in the middle (Fig. 1C). Nematodes are then placed around the slope (of volcano), and their behavioural movements are monitored in response to plant-derived
Fig 1. Development and optimization of nematode behavioural assay.

102
compounds introduced on the top (of volcano, Fig. 1D). Note that nematodes and plant compounds are closely positioned, but yet not directly contact each other. Root exudates signal and attract parasitic Fig 2. Cotton root exudates signal and attract R. reniformis movement. Times in A) and nematodes. In response to B) indicate hr-post-R. reniformis inoculation, and red arrowheads indicate R. reniformis. water, reniform nematodes gradually slid away from the top (Fig. 2A), because of gravity on the slope. In [TC1]contrast, reniform nematodes stayed on the slope, and/or crawled up to the top, upon the application of cotton root extracts or exudates (Fig. 2B), underpinning that cotton roots secret underground signal compounds seducing nematodes (hereafter named as ‘nematode attractant’
Interestingly, reniform nematodes exhibited little if any response to the extracts and exudates prepared from nonhost plants such as peanut (data not shown), proposing the host specific production of nematode attractants. 3. Cotton root exudates are complex mixtures of diverse chemical compounds. As an initial step to identify nematode attractant, we began to iteratively follow the activity of attractant in parallel to the fractionation of cotton root exudates. Root exudates,
collected in watercontaining beakers for 24 hr (Fig. 3A), were then separated into hydrophilic and hydrophobic fractions by 5% MeOH, of which only hydrophilic fraction displayed the activity nematode attractant (Figs. 3B and 3C). Root exudates are complex mixtures of diverse in/organic compounds (J Plant Nutr Soil Sci 174:3). In our preliminary studies, the preparatory HPLC of cotton root exudates repeatedly showed the broaden shape of peaks (Fig. 4), indicating that cotton roots release a wide range of metabolic compounds as ‘rhizodeposits’. FUTURE DIRECTION: Hence, the identification of long sought plant semiochemicals that signal and seduce nematodes will be best approached from the point of view of chemical biology, using analytical separations and sequential enrichment processes as the principal discovery tool (via multiple HPLC applications).
Fig 3. Chemotaxis activity of R. remiformis are found in the hydrophilic fraction of co tton root exudates.
Fig 4 . HPLC separation of the hydrophilic frac - tion of cotton root exudates.
103
HPLC isolation of nematode attractant(s) from cotton root exudates. As an additional, albeit, discovery driven aim, In the future studies, the enrichment of nematode attractants will be prioritized; 1 (or 2) min interval fractions by HPLC separations will be collected throughout the retention time of 10 to 30 min, and each fraction will be subsequently subjected to the nematode behavioural assay. All fractions attracting nematodes will then be pooled together, and applied to the second round HPLC separations; the same experiment procedures (i.e., HPLC nematode behavioural assay) will keep being repeated until one single peak with nematode attraction activity will be isolated.
VII. Extras
Continued Development of ACES Auburn Univ. Exp. Station Information Transfer for Alabama Row Crops, 2016
T. Cutts, D. Monks, D. Delaney, and C. Dillard
The www.alabamacrops.com website was developed to serve as a central site for research and
extension information on Alabama field crops. The effort has been successful for delivering
several types of information including IPM guides, research updates and reports, and extension
information. The site has been especially useful for rapid delivery of crop variety and pest
control information. Single-year variety yield data sets are often analyzed and posted 3 weeks

104
before publication of the full Official Variety Report, providing current information to producers,
county agents, crop advisors, and industry representatives on how well specific entries performed
across the state. IPM Guides were also available on-line weeks before paper publication.
The Alabama Crops site also serves as the hub for crops-related sites in areas such as Soil
Testing, Newsletters, on-farm research trial reports, and on-farm variety trials. Our Web
Manager Mr. Jon Brasher develops and manages the www.alabamacrops.com site and assists in
the development and maintenance of the Alabama Official Variety Testing web site. The web
site includes links to information on, but not limited to: cotton, corn, soybeans, forages, wheat,
small grains, stored grains, IPM guides, OVT research information, on-farm research and
development, hay and pasture weed control, enterprise budgets, precision ag, soil fertility, plant
diagnostics and soil testing. A Crops Calendar keeps users informed of training opportunities,
conferences, and meetings. Twitter and Facebook feeds notify participants when new
information is posted.
Jon’s assistance to the Agronomic Crops team has been expanded to planting and harvesting on-
farm tests, equipment maintenance and management, and a variety of other team activities. Jon
has been trained to analyze, tabulate, and prepare research and demonstration results for posting
to the web site.
Funding for this project was secured from the Alabama Cotton Commission, Alabama Soybean
Producers, and Alabama Wheat and Feed Grains Committee for 2016 and will be requested for
2017. Common feedback has been that this website has been a major improvement in how we
deliver our row crop information through the web.
Web statistics for the period of January 1st through December 31st indicate that the Alabama
Crops web site had 15,895 visits and 22,659 page views in 2016. A visit is a series of actions that
begins when a visitor views their first page from the server, and ends when the visitor leaves the
site or remains idle beyond the idle-time limit. Views are hits to any file classified as a page.
The analytical software used to evaluate web traffic was changed after 2015, and different
metrics were used. Therefore, numbers from 2016 are not comparable to previous years. After

105
the home page, the pages for the Alabama Variety Testing Program and Alabama Corn
Production were the most visited.
Alabama Crop Production Mobile App Upgrade
T. Cutts, B. Dillard, and M. Runge

106
Original Features:
Original features on the Alabama Crops app include sections for: Crop Production News,
Profit Profiles, Contact a Crop Specialist, Calendar, Submit a Photo/Question, and
AlabamaCrops.com link.
To date, the app has been downloaded over 400 times and has been advertised at many grower
events throughout the state.
Recently Added:
A crop comparison tool was recently added to allow growers to compare 2 potential crops
for planting on farm. Producers can use the data from ACES budgets or each user can
customize their own numbers such as yield and inputs to compare variable input costs and
potential profit from two crops.
Things to come:
We are working with the app developer to give the Agronomics Team the ability to set up
push notifications at planned intervals for upcoming events to make farmers aware of meetings
and remind them as meeting time approaches without actively having to check the Alabama
Crops App calendar.
IPM section that will allow farmers to access IPM guides with drop down menus. With
drop down menus, growers could select the crop, then either disease, weed control, or insect
control. This would bring up the ipm guide and section for that particular crop/issue. For
example, a grower wanting herbicide options for wheat production could easily access the ipm
section for chemical weed control in wheat.

107
Agriculture Discovery Day
D. Monks, L. K. Anderson, G. Pate, C. Smith, C. Hicks, and P. Mask Objective:
Conduct education awareness of traditional Alabama agriculture and advanced production
technologies for the community and producers.
Activity:
The Alabama Cooperative Extension System, AU College of Agriculture, and Alabama
Experiment Station conducted the 4th annual Agricultural Adventure Discovery Day to promote

108
our industry and educate Alabamians on its importance to our economy and livelihood. This
event was at the EV Smith Research Center on October 8th, 2017. Extensive planning went into
making this year’s event a success and events included various education venues and tours for
youth and adults. Advertisement was very effective in increasing overall attendance from past
years.
Events included:
1- Cotton picking & ginning;
2- Peanut digging and boiling;
3- Farm and wild life animal interactive activities;
4- Fish production in pond raceways;
5- Field corn maze, picking, shucking, & grinding;
6- Small grain grinding;
7- Forestry, pine straw harvest, and tree identification;
8- Hay bale maze;
9- Precision ag activities & pedal car races;
10- Food safety & prep by a local chef;
11- Wildflowers and honey bee education;
12- Trailer tour of the farm, displays by sponsors, and other activities.
2016 Results:
The 2016 Ag Adventure Discovery Day drew over 2300 participants, up from 1900+ in 2016.
We have had an increase of 300 to 400 participants each year and hope to reach 2500 at the 2017
event. This does not include over 200 volunteers that work together to make it possible. The
overall budget is just over $40,000 which does not include donations of food, supplies, etc. We
appreciate the support that you have provided and feel that this continues to be a major
educational event for the state. We have begun to see more visitors from western Georgia and
southern Tennessee as a destination event as well.