Embed Size (px)
Citation preview
Michigan Department of Natural Resources 2007-22 Status of the Fishery Resource Report Page 1
Au Sable River, Mio Dam to Alcona Pond T26N, R5E Section 33
2007
Steven P. Sendek and Andrew J. Nuhfer, MDNR Fisheries Division
Environment The Mio Dam to Alcona Pond backwaters reach of the Au Sable River is located in the west half of Oscoda County and the southeast corner of Alcona County between the towns of Mio and Glennie (Figure 1). This 23.9-mile reach flows through glacial moraines creating a scenic river valley with forested banks of second growth mixed hardwoods and conifers with impressive stands of white and red pine. Most land along this stretch of river is public access land composed of ownership by National Forest, State of Michigan and Consumers Energy lending a very "wild", undeveloped character. Private ownership is limited to less than 1.5 miles of this river reach, with most riverside structures used only seasonally. The entire reach is designated as a State Natural River and as a Federal Wild and Scenic River. Both of the designations impose various restrictions on riparian development to protect the environment and its aesthetic quality. This stretch of river drains a 1,361 square mile watershed catchment. Mean annual discharge at the Mio Dam is 988 cubic feet per second (cfs) (Blumer et al, 2006). Other attributes of this reach include an average width of 164.7 feet (Lawler, Matusky and Skelly, 1991), 90% of the river depths less than 3 feet with a maximum depth of 14 feet (Affiliated Researchers, 2005), a total surface area of 477.1 acres (MDNR unpublished data) and an average gradient of 4.7 feet per mile (Zorn and Sendek, 2001). There are twelve tributaries that enter the river within this reach including Wolf Creek*, Cherry Creek, Loud Creek*, Perry Creek*, Cauchy Creek*, Comins Creek *, Glennie Creek*, Nine Mile Creek*, O'Brien Lake outlet, Blockhouse Creek*, Penoyer Creek*, and Lost Creek ("*" denotes a state designated trout stream). These tributaries in addition to ground water inputs contribute an additional 120 cfs (annual mean discharge) before exiting Alcona Dam. The geology of this region is of glacial origin with major deposits of outwash sand and gravel, fine textured end moraine and coarse textured end moraine. These soils along with the "hilly" nature of the area provide an excellent source of ground water. This ground water provides the river a very stable flow regime when it is not influenced by dams. Upstream of Mio Pond at Parmalee Bridge, the 10 percent exceedence flow (high flow) of 1200 cfs is only 2.1 times higher than the 90 percent exceedence flow (base flow) of 554cfs (USGS data). These geological formations and the fact that Mio Dam interrupts the sediment transport of the stream results in a stream bed consisting largely of cobble and gravel. Sand and clay deposits are also present due to the glacial geology of the region. This segment of the Au Sable River is located between Mio and Alcona Dams, which are owned and operated by Consumers Energy Company. Mio Dam was constructed in 1917 and produces a maximum pond head of 29 feet and a surface area of 860 acres. The location and structural design of Mio Dam and Alcona Dam significantly alter the riverine environment through fragmentation of habitats. Dams prevent migration between important habitat types, such as spawning sites, thermal refuges and wintering areas. These dams also affect water quality, temperature regimes, natural flow patterns, sediment transport, and woody debris transport. The impoundments provide habitats for

Michigan Department of Natural Resources 2007-22 Status of the Fishery Resource Report Page 2 organisms that might not otherwise be present in the system (Zorn and Sendek, 2001). Past peaking operations at Mio Dam (prior to 1966) caused extreme daily flood and drought conditions with daily flows ranging from 400 cfs to 1,500 cfs (MDNR unpublished data). At night when the demand for electrical power was low, water flow through the dam was greatly reduced to store water in Mio Pond for electrical generation. Large volumes of water were then released in the morning when electrical demand was higher. This peaking mode of operation caused environmental damage downstream including accelerated stream bed scour, dewatering of riffles and bank erosion. These flow fluctuations had adverse effects on biotic communities including plants, larval and juvenile fishes, and invertebrates. In 1966 the Michigan Department of Conservation (Michigan Department of Natural Resources) and Consumers Power made a verbal agreement to change the operation of Mio Dam from peaking mode to run-of-river mode. Run-of-river mode means that instantaneous inflow of water into Mio impoundment is equal to instantaneous outflow of water. This mode of operation is intended to mimic the natural flow regime of the river. The agreement was followed for the most part but periods of unnatural flows were still observed (MDNR, unpublished data). Run of river was formally established in 1994 as part of the Federal Energy Regulatory Commission licensing of the Consumer Power Company Au Sable River hydroelectric projects through a settlement agreement between Consumers Power Company (Consumers Energy), Michigan Department of Natural Resources, Michigan State Historic Preservation Officer, United States Department of Interior - Fish and Wildlife Service, United States Department of Interior - National Parks Service, and United States Department of Agriculture - Forest Service. The Au Sable River is a cold water stream but Mio Dam significantly alters the water temperature regime of the river below the dam. The structural design of the dam only allows water from the upper 2/3 of the water column (above the thermocline) to be discharged downstream. Mean monthly water temperatures are about 2 degrees Celsius warmer downstream of the dam compared to riverine temperatures several miles upstream of the impoundment near Red Oak (Table 1a). In addition water downstream of the dam cools down only about 1.2 degrees C at night whereas unimpounded water upstream of the dam cools down an average of 2.2 degrees C. Unimpounded streams in Michigan typically cool down substantially during summer nights, thereby reducing thermal stress on coldwater species such as trout. The dam also delays spring warm-up and fall cool-down. Elliot (1994) reported an upper thermal limit for brown trout growth at about 67.1 degrees F with an upper incipient lethal temperature, i.e. the temperature beyond which death occurs, of 76.5 degrees F (24.7 degrees C). Affiliated Researchers (2005) found that 89.3% of the river reach between Mio Dam and 4001 bridge from June through September had water temperatures at or above 70 degrees F (21.1 degrees C), which are stressful temperatures for brown trout and rainbow trout. Maximum daily water temperatures below the Mio dam reach or exceed 24 degrees C in many years and during very hot periods even minimum daily water temperatures are higher than 24 degrees C (Figure 3). The highest maximum daily water temperatures observed below Mio between 1997 and 2006 have ranged from 22.5 degrees C in 2000 up to 26 degrees C in 2001. Further downstream at McKinley maximum daily water temperatures as high 26 degrees C also occur but nighttime cooling is substantially greater (Figure 4). Abundance of trout in Michigan streams is generally quite low when average July water temperatures exceed 20 degreesC (68 degrees F) (Figure 2). Mean monthly July temperatures downstream of the Mio Dam exceeded 20 degrees C in 8 of 10 years from 1997 to 2006 (Table 1b). Mean August

Michigan Department of Natural Resources 2007-22 Status of the Fishery Resource Report Page 3 temperatures also often exceed this level so the time that trout must endure stressfully high temperatures can be quite long in some years (Figures 3 and 4). Abdella (2001) found that total number of young-of-year rainbow and brown trout in this reach of the Au Sable River decreased significantly from June through August. High water temperatures are a plausible explanation for the high mortality rates for young trout. Woldt and Rutherford (2002) reported that only 1.7% of young-of-year steelhead present in early July in the Manistee River below Tippy Dam survived to late July due to stressful high temperatures (mean = 20.3 degrees C). The warmer water temperatures downstream of Mio Dam also create an environment suitable to other species such as walleye and smallmouth bass that prey on brown and rainbow trout (DePhilip 2001). Walleye inhabit both the impoundment backwaters and the river, and are known to feed on stocked trout. McRae and Diana (2005) hypothesized that low levels of emergent vegetation, high water temperatures, and decreased daily fluctuation in water temperature limited densities of young-of-year trout in the Au Sable River downstream of the Mio dam. The river corridor between Mio Dam and Alcona Dam is a very popular destination for many forms of recreational use including fishing, canoeing, kayaking, hunting, trapping, horseback riding, hiking and bird watching. At times the river can be very congested, with summer watercraft use on this reach estimated at 11,503, with a mean of 114 watercraft per day (Johnson and Nelson 1996). Three canoe liveries operate primarily on the reach with several other liveries having incidental use. Developed access to the river is provided through four sites, two of which are operated by the State of Michigan (M-33 and Comins Flats) and two by the U.S. Forest Service (McKinley and U.S. Forest Service Road 4001) (Figure 1). Walk in access is available throughout the entire reach. The Michigan Shore to Shore Hiking and Horseback Riding Trail parallels the entire reach with various access points. The U.S. Forest Service maintains several primitive campsites along this reach. In 1995, during a routine monitoring of the groundwater flowing beneath the Hoskins Manufacturing Plant northeast of Mio, investigators found ground water contamination in the form of tetrachloroethylene (PCE), chromium and nickel. Hoskins manufactured thermoelectric nickel and chromium alloys in the form of wire, strip and ribbon. Further investigations have found this groundwater contamination plume has traveled over ½ mile to the east and is upwelling into Perry Creek. Hoskins Manufacturing went out of business in 2002, deferring all clean up to the Federal Government and the State of Michigan. On site clean-up is presently occurring with removal of contaminated sediments and building materials. The extent of the ground water contaminations is not fully delineated at this time. It is unknown what the potential impact will be to Perry Creek or the Au sable River, but studies are planned to evaluate this potential threat.
History Early fisheries management within this river reach began in 1938 with the stocking of 27,400 fall fingerling brown trout into Comins Creek, Glennie Creek, Perry Creek and Wolf Creek (Table 2). Through 2006, a total of 1,132,987 brown trout, 1,119,183 rainbow trout, 53,827 arctic grayling and 1,850 brook trout have been stocked in the Au Sable River between Mio Dam and Alcona Pond and its tributaries (Table 2). This stocking program has been successful in establishing and maintaining a very popular fishery for brown trout and rainbow trout. Stocking of fingerling walleye in adjacent Mio and Alcona Ponds has augmented a small population of walleye in the river.

Michigan Department of Natural Resources 2007-22 Status of the Fishery Resource Report Page 4 The first fisheries survey of the Au Sable River watershed was conducted in 1924 by Dr. Carl L. Hubbs and Professor Thomas Langlois both from the University of Michigan. This survey was part of a statewide effort to identify and document the fish communities throughout the state and to recommend fisheries management actions to improve these fisheries. This survey was conducted shortly after the construction of the six hydroelectric dams on the mainstream Au Sable River which blocked the seasonal migration of fish from Lake Huron into the upper reaches of the river. Two of the sample sites in this survey were located within the Mio to Alcona reach, the first below Mio Dam and the second at Comins Landing. Fish were collected by the use of various seines ranging in size from 4-foot common minnow seines to 50- foot bag seines. Seventeen species of fish were captured and identified (Table 3) with the fish species comprised mostly of cool and warm water types. Virtually no game fish were captured. Game species collected were rainbow trout (1 fish), northern pike (2 fish), and rock bass (2 fish). Common shiner, longnose dace, mottled sculpin, white sucker, and hog sucker were the most common species found. A survey of returns of tagged brown trout to the angler creel was conducted during 1948. Approximately 5,000 jaw-tagged brown trout ranging from 7.0 to 12.8 inches were stocked in the reach between Mio Dam and McKinley Bridge. A creel census clerk checked for tags in angler-harvested fish on one weekend day throughout the 1948 trout season and voluntary reports of tagged fish were reported verbally and by mail. Recoveries of a total of 2.6% of tagged brown trout were reported by this survey (Shetter 1962). About 70% of reported tag recoveries were made during 1948 but a few tagged fish were recovered four years later. The next formal survey of this reach was conducted in September 1962 by Buddy L. Jacob, Michigan Department of Conservation. This survey was conducted during a scheduled repair of Mio Dam when the river flow downstream was greatly reduced. These low water levels in the river allowed wading crews to conduct mark and recapture population estimates at 13 stations. At 11 of these sites the sampling was conducted with the use of tow-barge DC electrofishing gear, and at the other two sites the fish were marked after capture with electrofishing gear and recaptured by a rotenone treatment. Each sampling site was approximately 1,100 feet long. Over-all, 27 species of fish were captured and identified (Table 3). At the 11 electrofishing sample sites, the average number of brown trout over 7 inches in length was estimated at 198 per mile. At two additional stations estimates of all species of fish were made by collecting for marking with electrofishing gear and recapture with rotenone. Twenty six species were identified with an average 2,352 fish per acre and an average of 38.37 lbs per acre (Table 4). Brown trout standing crop was 2.17 lbs per acre at the Davis Landing site and 6.38 lbs acre at the Cherry Creek site. Rainbow trout were 2.01 lbs per ac at Davis Landing site and 0.51 lbs per ac at the Cherry Creek site. The most abundant species at the Cherry Creek site based on biomass was round whitefish (10.7 lbs per ac) and suckers (10.5 lbs per ac of white sucker and hog sucker combined)(Table 4). During the summer of 1962, prior to the electrofishing survey, 4,950 legal-sized rainbow trout and 1,200 legal-sized brown trout were marked by fin-clipping and stocked in the 10 miles of river immediately below Mio Dam. Two hundred-fifty nine brown trout were captured during the shocking effort of which 13 (5%) retained recognizable marks. Eleven rainbow trout were also captured with 5 (45%) having fin clips. Thus in 1962 the trout population was supported principally by natural

Michigan Department of Natural Resources 2007-22 Status of the Fishery Resource Report Page 5 recruitment of yearlings from tributary streams and hatchery stockings appeared to contribute little to the trout population. There was little natural reproduction in the mainstream study area. In 1972, J.Scott Richards conducted a follow-up survey to the 1924 effort conducted by Hubbs and Langlois. This study was part of a watershed wide investigation into the effects of human use and development on the biology of the Au Sable River (Coopes et al. 1974). The goal of this survey was to determine the overall effect on the distribution of fish species resulting from the increased use and development in the watershed since the 1920's; i.e. do changes in fish distribution and abundance indicate substantial habitat change and in particular, have conditions for trout changed, and if so, in what way? To validate comparisons, an attempt was made to duplicate as closely as possible the 1924 collection efforts of Hubbs and Langlois, with collections conducted with similar seines and during the same time period. Richards collected 23 species of fish as compared to 17 species of fish collected by Hubbs and Langlois at the same sites (Table 3). Most fish species were representative of cool or warm water fish communities. As in the 1924 survey few game fish were captured. Gamefish in the collection included brook trout (2), brown trout (3), rock bass (1), bluegill (1) and smallmouth bass (2). The most common species included common shiner, mimic shiner, white sucker, blacknose dace and blackside darter. Richards reported that species diversity was slightly higher immediately below Mio dam in 1972 compared to 1924. At Comins Landing species diversity was slightly lower in 1972 compared to 1924. Michigan DNR personnel used a 17 foot outboard power boom shocker using pulsed DC current to collect fish during electro-fishing surveys in 1987, 1988 and, 1989. The surveys conducted in November 1987 and June 1988 were made to determine if any yearling Arctic grayling (Thymallus arcticus) stocked in 1987 and 1988 had survived. The August 1989 survey was conducted to gather fisheries data in response to reports of poor angler catches and to collect fish community information in preparation of the Federal Energy Regulatory Commission process to re-license the six Consumers Power Company hydro-electric projects located on the Au Sable River. Boom shocking was conducting during November 1987 and June 1988 by making one pass in a downstream direction throughout the entire reach of the Au Sable River between the Mio Dam and McKinley Bridge. Electrofishers attempted to capture all fish observed. During August 1989 sampling extended from Mio Dam to Alcona Pond and took place over 3 days of shocking. Only one Arctic grayling was captured during the November 1987 survey. Most Arctic grayling stocked disappeared within 6 months, with downstream migration from stocking sites, competition from other fish species, and predation listed as possible causes of the failure of the Arctic grayling reintroduction (Nuhfer 1991). Suckers and redhorse were the most common fishes collected from the Au Sable River during the electrofishing surveys made each year from 1987-89 (Table 5). The three most common sucker species were white sucker, northern hog sucker and greater redhorse. Greater redhorse had not been noted in any significant numbers in previous surveys. The brown trout catch per hour was much higher in November 1987 (38.7/hour) compared to the June 1988 survey (8.4/hour) and the August 1989 survey (11.7/hour). Brown trout ranging from 4.3 inches to 25.6 inches long were captured. The catch per hour for rainbow trout was very low ranging from 0.5 to 2.9 fish per hour with the size ranging from 5.8 inches to 20.5 inches. Brown trout were 2.0 inches larger than the state average mean length at age. Rainbow trout were over 3 inches longer than the state average mean length at age. Walleye were

Michigan Department of Natural Resources 2007-22 Status of the Fishery Resource Report Page 6 also captured in significant numbers (9.2 to 11.6 fish per hour) and were much more common than in previous surveys. These fish most likely originated from fingerling walleye plantings in the Mio impoundment upstream and Alcona Pond located downstream. Round whitefish abundance appeared low compared to Jacob's 1962 survey but direct comparisons were not possible between his population estimates and boom shocking CPE data. Consumers Power Company conducted a fisheries survey in 1990 (Lawler, Matusky and Skelly Engineers 1991) with the specific objective to collect fish in selected riverine areas both upstream and downstream of the projects including species composition and relative abundance, to provide population estimates of fisheries resources in each area, and to document the presence of any threatened or endangered fish species. Two stream stretches were sampled, the first approximately 4.5 miles below Mio Dam at Meadow springs, and the other approximately ½ mile upstream of U.S.F.S. road 4001 bridge at Gabions (Figure 1). Fish population estimates were obtained through three pass depletion electrofishing from two boom shocker boats. Supplemental sampling was also conducted to better estimate species composition and abundance. At the upstream site near Meadow Springs, 23 fish species were captured during the survey (Table 3). Total fish biomass for this site was 183 lbs per acre (Table 4). Game fish captured included black crappie, brook trout, brown trout, largemouth bass, rainbow trout, rock bass, smallmouth bass, and walleye. These game fish represented slightly more than 4% of the total catch by number and slightly more than 1% of the total biomass. The mean population estimate for brown trout was 6.8 per acre or 119 per mile, with a biomass estimate of 1.77 lbs per acre (Table 4). The most abundant species by number were hog sucker, white sucker, common shiner, blackside darter, and creek chub. The most abundant species by weight were white sucker, hog sucker and greater redhorse. These three species comprised 97% of total biomass at this site. At Gabions, the downstream site, 19 fish species were captured (Table 3). Total fish biomass for this site was nearly 30 lbs per acre (Table 4). Low numbers of game fish were captured, including brown trout, largemouth bass, rock bass, and smallmouth bass. These game fish represented less than 0.3% of the total number and less than 3% of the total biomass. The mean population estimate for brown trout was less than 0.7 fish per acre or 12 fish per mile, with a biomass of 0.78 lbs per acre. The most common species by number in descending order of abundance were creek chub, log perch, blacknose dace, longnose dace, and blackside darter. The most abundant species by weight were hog sucker, creek chub, and white sucker. These three species comprised 72% of total biomass at this site. Summary of historic surveys (1924-1990) All fisheries community surveys conducted in the Mio to Alcona reach of the Au Sable River between 1924 and 1990 revealed a diverse fish community comprised of from 17 to 23 species (Table 3). Catostomidae species were the predominant species based on biomass. This river reach is too cold to support significant populations of warmwater gamefish species (Centrarchidae). Numbers of coolwater gamefish species such as northern pike and walleye captured in surveys were generally quite low. Walleye over winter in Alcona Pond before moving upstream into the river in the spring and some remain there throughout the summer where they occupy habitats similar to those used by brown

Michigan Department of Natural Resources 2007-22 Status of the Fishery Resource Report Page 7 trout (DePhilip 2001). The overlap in habitats used by trout and walleye during spring and summer poses a potentially high risk of mortality for stocked trout (Abdella 2001; DePhilip 2001). Brown trout and rainbow trout standing crops estimated in 1962 and 1990 surveys were very low with the highest total biomass occurring near Cherry Creek (6.9 lbs per acre) (Table 4). All historic surveys indicate that few young-of-year trout in the mainstem Au Sable River below Mio survive from hatching to late summer. However, this river reach has consistently produced trophy-sized trout and a popular angling fishery. If trout were not stocked here there would be no significant angling fishery for other gamefish species. MDNR has never surveyed fish populations in coldwater tributaries to the mainstem between Mio and Alcona with electrofishing gear to determine if they provide refuge from warm water temperatures in the mainstem or have potential to provide significant recruitment to the mainstem. However, their small size and discharge indicates low habitat suitability for large trout (Table 6). A June 26, 2007 survey to estimate the discharge of the 12 named tributaries to the Au Sable between Mio and Alcona Dams revealed that 8 of the 12 were either not flowing or were discharging less than 1 cfs. With the possible exception of Perry Creek (flow 6.5 cfs) none of these tributaries were large enough to provide thermal refugia for large fish. Total discharge of the 12 named tributaries was less than 15 cfs on June 26, 2007. This is only about 1.5% of the flow of the mainstem Au Sable River so it is obvious that these tributaries do not have the potential to provide significant cooling to the mainstem even though July and August water temperatures measured in six of the "larger" tributaries were colder than the mainstem Au Sable River (Table 6). A radio telemetry study of large brown trout in this reach conducted in 1996 and 1997 did not detect movement into tributaries during hot periods of the summer (DePhillip 2001). It is likely that some young-of-year trout emigrate from tributaries into the mainstem but the extremely low numbers of young-of-year trout captured in late summer or fall surveys suggests that few of them survive. Abdella (2001) reported that young of year abundance in the river declined steadily each month over the summer as river temperatures increased. History of angling quality and regulations Angler perceptions of angling quality for trophy-sized trout have varied over time. This river reach has always produced some large trophy-sized trout catches but the fact that regulations were modified seven times between 1965 and 1979 indicates that anglers were not always satisfied with the quality of the fishery. Prior to 1965, general statewide trout regulations were applied to this reach. These regulations allowed use of bait, minimum size limits were low, and creel limits were relatively high. After the 1962 fisheries survey (Table 4) fisheries unit manager Buddy Jacob recommended higher minimum size limits, a reduced creel limit, and no bait angling. At this time some anglers believed that this river reach provided the best trophy trout fishing in the eastern U.S. It was hypothesized that restrictive regulations would produce even more trophy-sized trout because growth rates were high compared to many other streams. Gary Schnicke, who succeeded Buddy Jacob, recommended even more restrictive regulations because he believed that angler harvest was responsible for declines in the number and average of size of trout. A summary of trout regulations applied to the reach from the power line downstream of M33 and McKinley Bridge is shown in Table 7.

Michigan Department of Natural Resources 2007-22 Status of the Fishery Resource Report Page 8 The desires of anglers who wished to fish with bait and harvest smaller fish were accommodated by applying general statewide stream angling regulations to the remainder of the reach between Mio Dam and 4001 bridge near the upstream end of Alcona Pond. Thus, a 0.3-mile river reach from Mio Dam to the power line and a 7.5-mile reach from McKinley Bridge to 4001 Bridge was regulated under general trout angling rules until 2000. In 2000, MDNR Fisheries Division revised the statewide trout regulations in an attempt to match the biological potential of this stream to one of seven angling regulation types. The general regulation sections from Mio to the power line and McKinley Bridge to 4001 Bridge were converted to Type 2 regulations, which increased the minimum size limit for brown trout and rainbow trout from 8 inches to 12 inches. The creel limit was reduced from 10 to 5 fish per day with no more than 3 larger than 15 inches. Bait angling was permitted. The river reach from the power line to McKinley, had regulations different from any of the seven classification types. Proposals to place this section into any one of the seven classification types received strong public reaction as there were diverse opinions on what regulations should be placed on this section. It was decided that the best method to address this issue was to maintain the present regulation until additional biological and social information could be collected to better guide the decision-making process as to the most appropriate regulation classification. Recent stocking history During the mid 1990s anglers perceived a decline in the trout population and its associated fishery. Hypotheses for reduced survival of the stocked trout included possible increases in stream temperatures, low fitness of hatchery trout strains, and increased predation from walleye. A walleye fingerling stocking program was initiated in 1985 in Mio Pond and in 1988 in Alcona Pond. MDNR is subject to a circuit court agreement to stock walleye in the ponds to provide additional angling opportunities. The amount of trout mortality attributable to walleye predation is unknown but believed to be relatively low. A large amount of electrofishing effort was required to locate the large walleye implanted with radio transmitters for the DePhilip (2001) study. Trout stocking rates in the river were increased dramatically beginning in 1995 in an attempt to improve the trout fishery. Past experiences with increasing the stocking rate on the Muskegon River below Croton Dam to 200 yearlings per acre per year significantly improved total trout numbers in the stream. A new stocking proposal was prescribed which increased the stocking rate of brown trout and rainbow trout to 66 yearlings per acre per species in 1995-96 and then to 100 yearlings per acre per species beginning in 1998 (Table 2). An average of 49,000 yearling brown trout and 51,000 yearling rainbow trout were stocked per year between 1998 and 2006.
Current Status The Au Sable River between Mio Dam and Alcona Pond is commonly referred to as the "Mio Trophy Waters" due to its reputation of holding a significant population of large brown trout. Anglers fish the river from shore, wading, from float tubes, and from canoes and boats. Fishing is presently regulated under three categories of angling regulations. Type 2 trout angling regulations are presently in place

Michigan Department of Natural Resources 2007-22 Status of the Fishery Resource Report Page 9 from Mio Dam downstream to the power line at (T26N, R2W, Sec.4) and from McKinley Bridge downstream to U.S. Forest Service Road 4001 Bridge (Figure 1). In Type 2 waters anglers may fish from the last Saturday in April through September 30 of each year with bait, artificial lures and flies. Minimum size limits are 12 inches for brown trout and rainbow trout and 10 inches for brook trout. Daily possession limit is 5 trout in combination with no more the 3 fish 15 inches or larger. Prior to 2000, these two reaches were managed under general statewide trout stream regulations (8-inch minimum size limit on all trout species, bait permitted, and creel limit of 10 trout with no more than 3 over 16 inches long). The second regulation category is from the power line at (T26N, R2W, Sec. 4) to McKinley Bridge and is classified as the "Au Sable River Research Area". The regulations include an open season from the last Saturday in April through September 30; artificial lures or flies only, a minimum size limit 15 inches for brown trout, and 12 inches for all other trout, and a possession limit of 2 trout (Table 7). The third category is the reach between 4001 bridge and Alcona Pond which is not classified as a designated trout stream. Thus, this reach is open to fishing all year with an 8-inch minimum size limit and a 5 fish possession limit, no more than three of which may be 15 inches or longer. The reach of river from Mio Dam to Alcona Pond is very popular with anglers using artificial flies, artificial lures and bait. A creel survey was conducted in 1999 and 2000 between M-33 Bridge and U.S.F.S. Bridge 4001 during the trout fishing season (Table 8). The census work shifts covered the period from 6:00 am to midnight. The total fishing pressure over the entire reach was estimated at 30,595 angler hours and 9,656 angler trips in 1999 and 34,734 angler hours over 9,127 trips in 2000. Rainbow trout were caught more frequently than brown trout. In 1999 anglers harvested 2,400 rainbow trout and released nearly 17,000. Anglers harvested 463 brown trout in 1999 and released an additional 7,300. In 2000, anglers harvested 955 brown trout and 335 rainbow trout. The large decline in rainbow trout harvest was primarily due to the higher minimum size limit applied to rainbow trout when regulations changed to Type 2 in the reaches from M-33 to the power line and downstream from McKinley Bridge. Other species in the catch were walleye, smallmouth bass, rock bass, brook trout, largemouth bass, northern pike and suckers. Detailed information on monthly harvest and release of all fish species is provided in the appendices to this report. Total harvest of brown trout averaged over 1999-2000 represents only about 1.5% of the average number of brown trout stocked annually into the Mio to Alcona reach. For rainbow trout the analogous percentage was 5%. However, after the minimum size limit on rainbow trout increased to 12 inches in the upstream and downstream zones in 2000 the total of 335 fish harvested represented only 0.7% of the average annual number of rainbow trout stocked. Angling pressure was highest in the 0.3-mile stretch between M-33 and the power line based on effort per mile (26,829 angler hours per mile) (Table 9). About 41% of angling effort occurred in the two zones with more liberal regulations. Angling pressure per mile was over 10 times lower in all three reaches downstream of the power line (Table 9). Anglers fishing the quality regulation water (designated as "Au Sable River Mainstream, Research Area" in 2000) harvested 101 brown trout (6.9 per mile) in 1999 and in 2000 they harvested 841 brown trout (57 per mile). Rainbow trout in the quality regulation water were harvested at a rate of 31 per mile in 1999 and 10 per mile in 2000. Catch and release rates in the quality regulations water were 148 brown trout per mile and 769 rainbow trout per mile in 1999. Numbers of brown trout and rainbow trout released per mile in 2000 were 259 and 572, respectively. Anglers generally released about 90% or more of the trout they caught in all zones (Table 10). The ration of the cost of stocking trout in this reach compared to estimated value of the

Michigan Department of Natural Resources 2007-22 Status of the Fishery Resource Report Page 10 fishery generated is very favorable. MDNR Fisheries Division estimates the cost of stocking the 100,000 yearling brown and rainbow trout at $73,000 ($0.73 each) per year. Average expenditures by Michigan anglers per trip, not including expenditures for equipment and other expenses, has been estimated at $27 per trip (USFWS and USCB 2002). Thus, the annual trip expenditures alone of anglers fishing the Au Sable River below Mio exceed $250,000 (Average of 9,391 angler days x $27) so the total economic value generated by the fishery is certainly substantially higher. A series of 5 trout population estimates were conducted in early November of 1999, 2000, 2001, 2002 and 2005 to evaluate the results of the increased trout stocking rates. A 4.75-mile stretch of river from the M33 access site to Meadow Springs (Figure 1) with an estimated area of 95 acres was sampled each year by electrofishing. Sampling was done with the use of two jet drive electrofishing boats, with one chase boat to assist in processing fish captured. Sampling was conducted over two days with the first day the marking run and the second day the recapture run. Brown trout, rainbow trout and brook trout populations were estimated by the Chapman-Peterson formula and fish ages were obtained through scale analysis. Due to the limitations of the survey equipment and the size, depth and current velocity of the Au Sable River below Mio Dam, the trout population was most likely under-sampled. However, the data obtained in this survey are still very useful and provide a basis for management decisions. Total trout biomass in this 4.75-mile stretch averaged 23.7 lbs/acre with 16.2 lbs/acre of brown trout and 7.5 lbs/acre of rainbow trout. Brown trout comprised the largest portion of the trout population with a 5 year average population estimate of 2,992 for an average of 630 brown trout per mile. Brown trout total length ranged from 3 inches to 25 inches. All age classes up to age 7 were present in the population with age 1 fish being the most numerous (Table 11). The length-frequency histogram shown in Figure 5 shows that brown trout less than 12 inches long predominate in the population. The histogram does not include fish less than 8 inches long because there were very few trout less than 8 inches long by November. Brown trout total annual survival rate estimates computed from the survey data and scale samples collected from 1999 to 2002 were determined to be biased due to several factors. The average estimated annual survival of age-1 brown trout to age 2 was 72% (Table 12). Information collected from many other Michigan rivers indicates that this estimate is greatly inflated, probably due primarily by upstream emigration of age-2 brown trout into the sampling reach. The median annual survival rate of age-1 brown trout at Michigan's fixed Stream Status and Trends Program (SSTP) sites (35 sites) is only about 30% (T. C. Wills, MI Department of Natural Resources, personal communication). The SSTP sampling sites are located on Michigan's better trout streams throughout the state so it is not credible that survival of brown trout in the thermally-stressful waters of the Au Sable could be surviving nearly 2.5 times better. Moreover, past studies conducted in MI and elsewhere have clearly demonstrated that stocked hatchery brown trout stocked into streams and rivers do not survive as well as their wild counterparts (Berg and Jørgensen 1991; Weiss and Schmutz 1999; Avery et al. 2001) particularly during the first year after stocking (Alexander and Peterson 1983). Brown trout survival from age 2 to age 3 (November to November) averaged 23%, which is about half the median survival rate observed at SSTP sites. The most plausible reasons for lower-than-median survival rate estimates for age-2 fish include thermal stress as well as aging error due to formation of false annuli during hot periods when growth ceases. Most of these fish were too small to be legally harvested by anglers so presumably mortality was due to predation and other factors. Average survival from age 3 to age 4

Michigan Department of Natural Resources 2007-22 Status of the Fishery Resource Report Page 11 was high in 1999 and 2000, 54% compared to a median of 30% at SSTP sites. The fact that most of these fish were larger than the 15-inch size limit over an entire fishing season indicates that angling mortality was low. This conclusion is supported by angler census data collected in 1999 and 2000 (Table 8). Age-3-and-older brown trout in the Au Sable River below Mio are larger than the preferred prey size for most predators so it is not surprising that their survival rates are relatively high. Age 4 and age 5 brown trout also survived well from 1999 and 2000 to the subsequent year. Survival of trout that were 3 years old or older was substantially lower in 2001, possibly because summer water temperatures were substantially higher in both 2001 and 2002 compared to 1999 and 2000 (See Figure 3 and Figure 4). Brown trout in the Au Sable below Mio are larger at a given age than the average size of trout in Michigan streams where the fishery is supported primarily by natural reproduction (Table 13). Part of this size difference is due to the larger size of yearling trout reared in the hatchery compared to those hatched and reared in the wild. However, annual growth increments (inches a trout grows per year) for brown trout were also generally well above the state average (Table 14) (Schneider 2000). Brown trout growing at a state average rate grow about 3 inches per year in streams. Data in Table 14 shows growth rates for each stocked cohort from 1999 to 2001. From 1999 to 2001 age-1 brown trout annual growth increments ranged from 1.7 to 4.0 inches; age-2 brown trout growth increments ranged from 3.6 to 5.5 inches; and age-3 brown trout grew 4.8 inches. Formation of false annuli during thermally stressful periods may again have caused some errors in age determination that could have contributed to this large variation in apparent growth rates. The yearlings stocked in 1999 and 2000 generally grew much faster than an average of 3 inches per year for several years after planting (Table 14). Slow growth of the cohort stocked in 2001 was a notable exception to the overall pattern. These fish grew 1.3 inches less than a state-average increment. The extremely warm water conditions that prevailed from late June 2002 through the first 3 weeks of August 2002 may account for the slow growth rate (Figures 3 and 4). Our data support the hypothesis that warm summer water temperatures below Mio Dam have a limiting and negative effect on both growth rates and survival (See discussion of survival above). However, the present stocking rates combined with relatively high survival rates for older brown trout and higher-than-average mean length at age generates more trophy-sized brown trout per mile than are found in upstream reaches of the mainstem Au Sable River that are more thermally suitable for trout. Panel A of Figure 6 illustrates that substantially more brown trout 15 inches or longer per mile were present below Mio on the Au Sable than at Stephan Bridge during four years when population estimates were available at both sites for the same years. However, on a per acre basis density of brown trout over 15 inches long are very similar (Figure 6 Panel B). The rainbow trout population in the Mio to Meadow Springs reach averaged 1,379 individuals and 290 rainbow trout per mile (Table 15). Rainbow trout sizes ranged from 4 inches to 24 inches with the majority of the fish in the 9 to 12 inch range (Figure 7). Most of the population was composed of age-1 with a moderate number of age-2 and very few age-3 fish present (Table 15). Only about 2% of rainbow trout survive to the fall at age-3 (Table 12). It is most likely that this poor survival is mostly attributed to natural mortality or emigration. The highest estimate of angler harvest (2,400 in 1999 before regulation changes) represents only 5% of the annual number of rainbow trout planted in this reach (See Tables 2 and 8). In 2000, estimated rainbow trout harvest was only 0.7% of average annual plantings.

Michigan Department of Natural Resources 2007-22 Status of the Fishery Resource Report Page 12 Rainbow trout total annual survival rate estimates computed from the survey data and scale samples collected from 1999 to 2002 were determined to be biased for the same reasons discussed above for brown trout. Computed estimates of annual survival of rainbow trout from age 1 to age 2 were very high in 2000 and 2001, averaging 75% (Table 12). It is certain that these high survival estimates reflect immigration of age 2 fish into the sampling reach as well as aging error due to formation of false annuli formed when fish are stressed by warm water. For example, annual survival of age-1 rainbow trout in the mainstem Au Sable at Stephan Bridge managed under a no-kill flies-only regulation has averaged only about 25% over the past decade. Estimated survival from age 2 to 3 in the Au Sable River below Mio averaged only about 2%. We could not compute a valid estimate of average survival from age 3 to 4 because only one age-4 rainbow trout was captured during the four annual surveys used to estimate survival. The paucity of rainbow trout longer than 12 inches clearly demonstrates that overall survival of rainbow trout is very low. Rainbow trout growth rates (annual increments) were much lower than those for brown trout even though the mean growth index in November 2005 was +2.7 inches above state mean length at age (Table 13). Hatchery-reared yearling rainbow trout planted in the spring are about 2.5 - 4 inches longer than their wild counterparts (depending upon the year) and hence they remain larger than the state average, which is based on naturally reproduced fish, even if they grow relatively slowly. Rainbow trout in streams growing at a Michigan state-average rate grow about 3 inches a year. Rainbow trout stocked in 1999 grew from 1.4 to 2.2 inches a year over their lifetime (Table 14). However, age-2 rainbow trout captured in November 2001 were an average of 0.1 inches shorter than age-1 rainbow trout captured in November 2000. This clearly indicates that false annuli laid down during stressfully warm water periods resulted in aging errors and hence errors in estimates of mean length at age. Mortality due to angler harvest was negligible (0.7 % of the numbers of rainbow trout planted annually) after new regulations were adopted in 2000 (Table 8) so angler cropping of fish over the minimum size limit of 12.0 inches can not account for the slow growth estimate. High summer temperatures during the summers of 2001 and 2002 again appear to be the most likely cause of the "apparent" lack of growth of fish stocked in 2000 and 2001. A negative association between high summer temperatures and abundance of rainbow trout over 12 inches long has also been observed in the Manistee River downstream of the Hodenpyl impoundment (Tonello and Nuhfer 2004). Other management actions undertaken in the Au Sable River between Mio Dam and Alcona Pond have included the placement of large woody debris (LWD) under U.S. Forest Service administration and, stabilization of eroding banks and other actions to reduce erosion into the tributaries at poorly designed road/stream crossings. The Au Sable River Watershed Restoration Committee was formed in 1987 to oversee those activities. Huron Pines RC&D administers the Partnership Agreement, which to date has been signed by 27 private, public and governmental organizations (Brad Jensen, Huron Pines RC & D, personal communication). Under this direction, a strategy to inventory erosion sites with in this reach was initiated in 1987 with the identification of 71 erosion sites. Classification of these sites includes 2 severe, 28 moderate and 41 minor. In addition several road/ stream crossings have been upgraded through efforts of the U.S. Forest Service and Oscoda and Alcona County Road Commissions. Beginning in 1998 a medium lift helicopter was used to transport and place whole trees (large woody debris, LWD) into the river channel to restore structure and function to this riparian ecosystem. Historically, the Au Sable River channel was complex, with a variety of depths, velocities, and

Michigan Department of Natural Resources 2007-22 Status of the Fishery Resource Report Page 13 substrates, and abundant cover provided by large wood in the river. Large woody debris in the river channel has been identified as lacking as a result of historic logging practices and Mio Dam which halts downstream movement of LWD (Zorn and Sendek 2001). The first helicopter lift demonstration project was conducted in 1998 where approximately 100 whole trees were placed in 6 miles of river downstream from Mio Dam at a cost of $30,000. This project was a partnership between Huron Pines (RC&D council), Michigan Department of Natural Resources, and the U.S. Forest Service. All trees lifted into the river remained in place two years later and blended in with the natural surroundings of the river. GIS-based photo-monitoring was done to evaluate the success of this restoration (Jennings et al. 2005). Approximately 80% of the trees have remained in place. Tree complexes were less likely to be moved downstream than individual trees. However, it's important to note that those trees that have moved from their original locations remain in the system. Thus, helicopter placement of whole trees remains a viable approach to restoring aquatic habitat within forested ecosystems in the upper Midwest. It was determined to be cost effective (comparable to traditional techniques), mimics natural disturbance processes, and introduces an efficiency of operation whereby large-scale restoration can be done across the landscape (river system) (Robert Stuber, USFS Fisheries Biologist, personal communication). This large-scale landscape level project is felt to be integral to aquatic ecosystem restoration in Northern Michigan (Stuber et al., 2004). It is consistent with Michigan DNR management direction for riparian zones and trout streams (Tonello et. al., 2004) and with the management options listed in Zorn and Sendek's (2001) Au Sable River Watershed Assessment ("Improve channel diversity by adding woody debris …in reaches where channel diversity is low, or in reaches where natural contributions of LWD have been reduced.") and Sendek's (2004) Au Sable River Watershed Management Plan. Even though site-specific fish population response to the treatment is inconclusive (Klungle and Hayes, 2004), there is a plethora of information regarding the importance of large wood in riverine ecosystems (Gregory et. al., 2000). From 1998 through 2006, a total of 948 whole trees were placed in 12.5 miles of river between the power line and McKinley (Table 16). Funding has been provided by Consumers Energy licensing settlement funds and the U.S. Forest Service. Additional placements of LWD are planned. This reach of river has exceptional water quality with regard to high volumes of clean-clear water, but the stream is thermally challenging for cold water species management due to the operation of Mio Dam. These water temperatures push the thermal tolerance limits for cold water species and are the major factor limiting trout survival and growth. Stream temperature monitoring has shown that during June, July and August, Mio Dam is in violation of its licensing operation agreement as the waters released downstream of the dam during those months are warmer than allowed. Fisheries data have shown that very slight changes in water temperature near the lethal upper limit for salmonids can have dramatic effects on species composition and biomass. Investigations into the potential to pass cold water into the tailwater from Mio Pond are ongoing. Data are being collected during the summer of 2007, including air and water temperatures. This information will be used in a model to predict the potential cooling effects on downstream water temperatures by passing cold water from the upstream pond. Model results should be available in 2009. As part of the 1994 FERC/Consumers Energy Settlement Agreement, Consumers Energy has agreed to maintain certain water quality standards including water temperatures. One million-seven hundred thousand dollars (in 1994 dollars) has been set aside to address water quality violations of the agreement for all

Michigan Department of Natural Resources 2007-22 Status of the Fishery Resource Report Page 14 ten of Consumer's Energy projects on the Au Sable, Manistee and Muskegon Rivers. Modifications to the discharge configurations of the projects may be incorporated if the action results in a significant water temperature improvement and the modification fits into the budget constraints in the agreement.
Analysis and Discussion The Mio Dam to Alcona Pond section of the Au Sable River is a very unique and rare resource in the state in that it is a large river with some of the most seasonally stable stream flows in the nation, with high volumes of water and nearly all riparian lands in public ownership. Historic logging practices inflicted severe environmental degradation, but for the most part have healed or are in the process of healing. The presence of hydro electrical generating dams both above and below this river reach fragments the biological communities from other communities upstream and downstream; provides environmental conditions that allow other aquatic species to exist and in some situations, thrive where they would not have under normal conditions; alters natural stream temperature patterns; and interferes with the natural transport of sediment, nutrients and large woody debris. The fish community has remained relatively stable through time with some changes in species composition and biomass that are most likely results of subtle changes in stream temperatures and fish stocking practices. This stream reach is relatively productive with moderate species diversity. If trout species were not stocked here the fish community would consist primarily of cool and warm water fish species. Numerically, a majority of fish are small-bodied members of the families Cyprinidae, Percidae, and Cottidae species (Table 3). Catostomidae species compose most of the biomass of fishes in this reach. Fish collections made after 1962 suggest that round whitefish abundance has declined, perhaps indicating that contemporary water temperatures are warmer (See Tables 4 and 5). High summer water temperatures are also the probable reason that few naturally reproduced trout, which are fairly abundant in late spring and early summer; survive to the fall. Brown trout and rainbow trout populations have varied through time both in size structure and density. Prior to 1997, trout stocking rates were low ranging from 8 to 15 yearlings per acre for brown trout and 2 to 40 per acre for rainbow trout. In 1962 naturally reproduced trout were common in fish collections although density in terms of both numbers and biomass were low (Table 4). Average brown trout biomass was estimated at approximately 5 lbs per acre out of a total average biomass of 38 lbs per acre. Fish collections made in the late 1980's captured few naturally reproduced trout and electrofishing CPE's indicated that trout densities were quite low (Table 5). In 1998, trout stocking densities were increased to 200 yearlings per acre in an attempt to increase trout populations and improve fishing. Trout population surveys conducted in 1999, 2000, 2001, 2002 and 2005 estimated that average trout biomass was substantially higher than found in previous population surveys (Table 4). There were no historic estimates of survival but recent estimates indicate that brown trout survival is reasonably high while rainbow trout survival is very low. A few age-7 and age-8 brown trout were sampled in the population resulting in some brown trout in the population exceeding 25 inches in length. Poor survival of rainbow trout results in a population composed primarily of age-1 fish that range up to 13 inches long (Figure 7).
Michigan Department of Natural Resources 2007-22 Status of the Fishery Resource Report Page 15 Brown trout growth rates are faster than state average growth rates for older fish. Trout growing at an average Michigan rate grow approximately 3 inches per year. The average of growth increment for yearling brown trout from 1999 to 2001 was 2.7 inches (Table 14). Annual growth increments were very large for age 2 brown trout (4.5 inches) and age-3 brown trout (4.8 inches) (Table 14). Yearling brown trout typically are planted at a larger size than wild fish of the same age. This size advantage coupled with fast growth of age 2 and older fish results in older brown trout being considerably larger than Michigan state average lengths at age (Table 13). Most brown trout grow to a size where they may be legally harvested in type-2 regulation waters (12 inches) when they are 3 years old or about 2 years after they are stocked. In the quality regulation water brown trout grow to legal harvest size (15 inches) when they are 4 years old or about 3 years after they are stocked. Rainbow trout appear to grow rapidly during the year they are stocked (based on length frequency data shown in Figure 7). This growth presumably occurs primarily during the spring when the waters remain cool and again in the fall when they cool down again. False annuli laid down when growth stops during hot water periods precludes accurate estimates of mean length at age or annual growth increments for older fish. Warm summer water temperatures downstream of Mio Dam may also cause high mortality of larger rainbow trout or induces them to emigrate. A similar paucity of larger rainbow trout has been observed in the Manistee River downstream of Hodenpyl Dam where angling pressure is extremely light (Tonello and Nuhfer 2004). During warmer summers, rainbow trout larger than 12 inches are rarely caught by either anglers or survey gear downstream of Hodenpyl Dam but during cooler summers the angling fishery for large rainbows is often very productive. This fish community in the Au Sable River between Mio Dam and Alcona Pond provides a very popular sport fishery that has received nation-wide acclaim for trophy size brown trout and high catch rates of rainbow trout even though the brown trout and rainbow trout populations are dependent on stocking. Little game fishing opportunity would exist in this river reach if it was not stocked with trout. Angler access is found throughout this reach with formal and informal access sites managed by the U.S. Forest Service, State of Michigan and Consumers Energy. The large size and character of the river allows for anglers to fish from shore, wade riffles and shallows, float-tube, canoe or boat. Diverse but restrictive angling regulations allow for protection of this unique trophy brown trout population while affording limited harvest of trout and non trout species. Catch rates are good for most of the angling season but do drop during mid summer, most likely due to high mid-summer stream temperatures (Appendix 1). In mid summer the high use of recreational watercraft causes conflicts with anglers. Water temperatures decline in fall and catch rates increase dramatically (see Appendices) but the fishing season ends on September 30. Because spawning success is low, the closed season serves no biological need and thus unnecessarily reduces the recreational potential of this fishery. Recent habitat management has focused on placement of whole trees into the river channel to restore river channel diversity and provide cover for fish. Mio Dam disrupts natural sediment transport by trapping sediment in the impoundment. This increases the erosive power of the river downstream of the dam resulting in increased scour of the stream bed and banks. Past peaking flows magnified this erosion. The Mio impoundment also collects the large woody debris from upstream reaches, causing a lack of large woody debris in the Mio to Alcona reach. Run-of-river flows have reduced the erosion, and bank stabilization projects at several erosion sites has reduced new sediment inputs into the

Michigan Department of Natural Resources 2007-22 Status of the Fishery Resource Report Page 16 channel. Efforts to transport and place whole trees into the river channel are restoring instream channel diversity.
Management Direction Michigan Department of Natural Resources is committed to the conservation, protection, management, use and enjoyment of the state's natural resources for current and future generations. Managing the state's resources is based on the principles of ecosystem management where ecosystem management is a process that integrates biological, social and economic factors into a comprehensive strategy aimed at protecting and enhancing sustainability, diversity and productivity of natural resources. The Mio to Alcona reach of the Au Sable River is a pristine, unique and exceptional riverine resource. The key value of the Mio to Alcona reach of the Au Sable River lies the quality trout fishing opportunities that the river provides, particularly for trophy-sized brown trout, high catch rates of rainbow trout, and a pristine environment with large tracts in public ownership. This section of river is nationally renowned for it trout fishing and is ideal for all types of anglers including shore, wading and boating anglers. Management actions should be directed at maintaining or improving these key values while providing diverse fishing opportunities for the angling public. Limiting factors A combination of high mean summer water temperatures coupled with little cooling at night is the most likely factor limiting survival, standing stocks, and natural reproduction of brown trout. High summer water temperatures are also the most likely factor limiting both survival and growth rates of rainbow trout during mid summer. Eaton et al. (1995) developed estimates of maximum temperature tolerances for 30 freshwater fish species based on a national dataset of temperature and fish presence. They defined maximum tolerance as the 95th percentile of the maximum weekly mean temperature where each species was found. This analysis yielded a maximum weekly temperature tolerance of 24.1 degrees C for brown trout and 24.0 degrees C for rainbow trout. These temperatures were exceeded in August 2001 below Mio on the Au Sable and weekly mean temperatures approaching these limits are common. Wehrly et al. (2007) estimated the 7-d upper tolerance level for maximum daily mean temperature for brown trout presence at 23.3 degrees C. Thus, the thermal potential of the Mio to Alcona reach of the Au Sable River to consistently support high densities and biomass is limited (See Figure 2). Mean daily summer water temperatures below Mio Dam reached or exceeded 22.0 degrees C (71.6 degrees F) for 30 or more summer days during hot years since USGS began collecting temperature data (Table 1c). Our analysis of flow contributed to the mainstem Au Sable River by small tributaries in this reach conclusively demonstrated that they do not offer any potential for significant cooling. Due to extreme downstream water temperatures created by the operation of Mio Dam, the Au Sable River between Mio Dam and Alcona Pond will need to be stocked annually with yearling brown trout and rainbow trout to maintain the trout fishery. Thus, trout reproduction is not currently a key value of this system and the closed fishing season of the present regulations is unnecessarily reducing the recreational potential of the Mio tailwater. Studies are presently underway to determine the potential to pass cold water that is present in the upstream impoundment to the tailwater. All efforts should be taken to comply with the license

Michigan Department of Natural Resources 2007-22 Status of the Fishery Resource Report Page 17 requirements for discharged water temperatures. Until a remedy to excessive tailwater temperatures is prescribed, natural reproduction will not be high enough to support a quality trout fishery. Stocking rates should continue at 100 yearlings per acre each for brown trout and rainbow trout. Size at stocking is critical with a 6.5-inch minimum average length at stocking in order to assure adequate survival to successive year classes. Strains of trout should be selected that perform best (survival and growth) in riverine environments that are thermally challenged. Angler values have been changing over the past two decades (Sendek 2004). A growing segment of anglers are willing to reduce or even give up the ability to harvest fish in order to improve the number and size of fish they catch. Fisheries Division has been receiving an increasing number of requests from these anglers to provide more quality angling opportunities. Fisheries managers should seek opportunities that can accommodate these new angling interests while still understanding that the majority of the angling public does harvest fish. In addition it is also recommended that habitat restoration efforts be continued, including bank stabilization where appropriate, and restoration of instream channel diversity through addition of large woody debris. Regulations We recommend retaining Type 2 trout regulations from Mio Dam to the power line and from McKinley Bridge to 4001 Bridge. Regulations for the reach from the power line to McKinley Bridge could be converted to one of the standard gear-restricted regulations, i.e. Types 5, 6, or 7. The primary purpose of regulations that restrict terminal tackle to artificial lures or flies is to reduce mortality of angler-caught fish that are released. Both lures and flies have been permitted on this reach of the Au Sable River for both biological and social reasons. The average mortality of trout released after capture with artificial lures or artificial flies is essentially identical. Allowing both lures and flies to be fished provides additional angling opportunities. Wydoski (1977) reviewed many hooking mortality studies of inland trout and reported that the mortality of trout released after capture on barbed artificial flies (average from 17 studies) was 4.02% as compared to 6.1% for trout caught on barbed artificial lures (average from 24 studies). Hooking mortality tends to be greater at higher water temperatures (Klein 1965; Hunsaker et al. 1970; Dotson 1982; Plumb et al. 1988). Hence, high water temperatures downstream from Mio dam probably increase hooking mortality to rates higher than the averages reported by Wydoski (1977). Michigan fisheries managers use a formal process to evaluate streams for inclusion in gear-restricted stream regulation Types 5, 6, and 7 (MDNR, Fisheries Division 2003). Biological and physical factors as well as social considerations are all incorporated into this process. The flowchart shown in Figure 8 describes how biological criteria are incorporated into the stream selection process. The following narrative will describe how we followed the flow chart to make the decision that the reach of the Au Sable from the power line to McKinley Bridge is a good candidate for a gear-restricted regulation type. First the angler fishery is dominated by trout so we proceed down to the next box. The mean length of age-2 brown trout and rainbow trout are both above the Michigan state average, which leads down the flow chart to the natural mortality rate box. Natural mortality rates for brown trout are not high (Table 12) so the flowchart was followed to the fishing mortality decision box for brown trout. Mortality

Michigan Department of Natural Resources 2007-22 Status of the Fishery Resource Report Page 18 rates for age-1 rainbow trout are high (Figure 7) such that few fish grow larger than 12 inches. However, social factors such as the popularity of the current fishery again led us to the fishing mortality decision box. Angler census data indicate that fishing mortality of both brown trout and rainbow trout is low but again, social and political factors point toward the stream segment being a good candidate for further consideration for a gear-restricted type regulation. Physical considerations incorporated into the decision process are shown in Figure 9. The stream reach is 14.7 miles long and there is excellent assured public access. Thus, this reach is clearly a very good candidate for gear-restrictive regulations. The next stage of the process is to select which of the gear-restricted type regulations, 5, 6, or 7 should be applied. The following pages of this report list different potential regulation options and their implications for the brown trout and rainbow trout fisheries of the mainstem Au Sable River from the power line to McKinley Bridge. We used a population simulation model to make predictions about the probable effects of applying different regulation types on this reach of the Au Sable. Model inputs included hooking mortality, natural mortality, growth rates, size limits, fishing effort, recruitment, and rates of voluntary release of legal-sized trout. We based the natural mortality and growth rates used in the model on fishery survey data. Effects of different regulation types were modeled at four rates of voluntary release of legal-sized trout, no release, 50% release, 75% release, and 100% release (no-kill). Angling effort inputs to the model were adjusted so that simulated total catches (harvest + catch and release) approximated the catch estimates from the creel census conducted in 1999 and 2000. Other assumptions of the model include the following:
• The size distribution of fish within an age group follows a normal distribution. • An annual time step is reasonable to depict population dynamics (including growth). • Instantaneous rates are additive. • No density dependent changes in growth or mortality occur. • Recruitment is constant (~50,000 yearling brown trout and 50,000 yearling rainbow trout
stocked each year). • Hooking mortality is equal for all sizes of fish. • The mean size is representative of the time when the bulk of the fishing occurs.
All these assumptions are reasonable based on our knowledge of fisheries dynamics in Michigan rivers including the Au Sable. Option: Type 6 regulations Implications:
• Open to angling all year • Possession limit of 2 trout/day and possession season (Last Saturday in April through
September 30) remain the same for brown trout (BNT) but rainbow trout (RBT) can be harvested all year.

Michigan Department of Natural Resources 2007-22 Status of the Fishery Resource Report Page 19
• Artificial lures and flies are the only permissible terminal tackle, i.e. no change from present gear restrictions.
• Minimum size limit for BNT would be reduced from 15 inches to 12 inches. • Harvest of brown trout would probably increase • Catches of brown trout over 12 inches long are predicted to decrease from 4 to 13% depending
upon the rate of voluntary release of legal-sized fish (Figure 10). • We believe that the voluntary release rate for legal-sized brown trout is substantially higher
than zero. Hence, catches of 12-inch-or-longer brown trout are expected to be very similar under either Type 6 or Type 5 regulations (Figure 10).
• Catches of brown trout larger than 15 inches might decline from 7 to 23% depending upon the rate of voluntary release of legal-sized fish (Figure 11).
• Again, we believe that the voluntary release rate is substantially higher than zero so the difference in total annual catches of brown trout over 15 inches under Type 6 or Type 5 regulations may be very similar.
• Minimum size limit for RBT remains the same (12 inches). • Size limit for RBT in NON-gear restricted waters located upstream and downstream are also 12
inches so Type 6 regulations simplify enforcement of size limits. • Limited angler harvest of stocked RBT could still occur. Estimated angler harvest in the gear-
restricted reach was 459 RBT in 1999 and 146 in 2000 (Table 8). • The difference in catches of 12-inch-or-longer rainbow trout (catch + release) under Type 6
regulations are predicted to be very similar to catches under Type 5 or Type 7 regulations because high natural mortality rates rather than angling mortality have the most influence on the population (Figure 12).
• Catches of 15-inch-or-longer rainbow trout under Type 6 regulations is predicted to be lower than under Type 5 regulations if there was no voluntary release of legal-sized fish, but note that the numbers of fish caught of this size is very small so the difference between the regulations would likely be undetectable (Figure 13). Moreover, if 50% or more of anglers voluntarily release legal-sized fish then the predicted difference in total annual catches of 15 inch or longer rainbow trout under Type 6 versus Type 5 regulations is less than 10 fish (Figure 13).
Option: Type 5 regulations Implications:
• Open to angling all year • Possession limit of 2 trout/day and possession season (Last Saturday in April through
September 30) remain the same as the present regulation for brown trout (BNT) but rainbow trout (RBT) may be harvested all year.
• Artificial flies are the only permissible terminal tackle. • An opportunity to fish for trophy trout with artificial lures would be lost. • Recreational use of the reach by anglers may decline due to the loss of the opportunity to fish
with artificial lures and reduced opportunities to harvest a few RBT. • Minimum size limit for BNT would remain at 15 inches. • Harvest of brown trout would probably remain the same. • Angler catches of brown trout over 15 inches would probably not change.

Michigan Department of Natural Resources 2007-22 Status of the Fishery Resource Report Page 20
• If voluntary release of legal-sized fish is 50% then predicted angler catches of brown trout over 15 inches long (harvest + catch and release) would be 13% higher than under Type 6 regulations (Figure 11).
• The minimum size limit for RBT would increase from 12 inches to 15 inches. • A 15 inch minimum size limit on RBT would eliminate most harvest of RBT because high
natural mortality rates preclude most fish from growing this large. • Predicted angler catches (harvest + catch and release) of 12 inch and longer RBT would
increase slightly from 4% to 13% depending upon what percentage of legal-sized fish are voluntarily released (Figure 12).
• Predicted angler catches of 15 inch and longer RBT would increase from 9% to 31% depending upon voluntary release rates but numerical differences in catch would be very small (Figure 13).
Option: Type 7 (No Kill) regulations Implications:
• Open to angling all year • No harvest of any trout species • Artificial flies are the only permissible terminal tackle. • An opportunity to fish for trophy trout with artificial lures would be lost. • Recreational use of the reach by anglers may decline due to the loss of the opportunity to fish
with artificial lures and lost opportunities to harvest a few trout. • The abundance and size structure of RBT populations would not change significantly because
high natural mortality rates result in few RBT surviving long enough to grow to a large size. • Predicted angler catches of RBT 12-inches or longer would be very similar to catches under
either Type 5 or Type 6 regulations (See Figures 12 and 13). • Predicted angler catches of BNT over 15 inches long would increase about 25% compared to
catches under Type 6 regulations and by about 15% compared to catches under Type 5 regulations if half of legal-sized BNT are presently being voluntarily released (Figure 11).
• Predicted angler catches of BNT over 15 inches long would increase about 14% compared to catches under Type 6 regulations and by about 8% compared to catches under Type 5 regulations if 75% of legal-sized BNT are voluntarily released (Figure 11).
References Abdella, J.A. 2001. The distribution of brown trout and walleye in relation to habitat on an impounded reach of the Au Sable River, Michigan. Masters Thesis, University of Michigan. Ann Arbor, Michigan. Affiliated Researchers. 2005. Methods and findings Michigan habitat improvement program, project 01-022, aquatic temperature mapping of the Au Sable River from Mio dam to 4001 bridge. Affiliated Researchers, Oscoda, Michigan. Alexander, G. R., and D. R. Peterson. 1983. Trout of Newton Creek, Clare County, Michigan: A transitional zone trout stream. Michigan Academician 16:43-61.

Michigan Department of Natural Resources 2007-22 Status of the Fishery Resource Report Page 21 Avery, E. L., A. Niebur, and D. Vetrano. 2001. Field performance of wild and domestic brown trout strains in two Wisconsin rivers. Wisconsin Department of Natural Resources Research Report 186:1-16. Berg, S. and J. Jørgensen. 1991. Stocking experiments with 0+ and 1+ trout parr, Salmo trutta L., of wild and hatchery origin: 1. Post-stocking mortality and smolt yield. Journal of Fish Biology 39:151-169. Blumer, S.P., C.R. Whited, J.M. Ellis, R.J. Minnerick, and R.L. LeuVoy. 2006. Water resources data Michigan water year 2005. United States Department of Interior, Geological Survey, Water Resources Division, Water-Data Report. MI-05-1, Lansing , Michigan. Coopes, G.F., M. Quigley, J.S. Richards, N. Ringle, and G.E. Burgoyne, Jr. 1974. Au Sable River watershed project biological report (1971-1973). Michigan Department of Natural Resources, Ann Arbor. DePhillip, M.M. 2001. Daily and seasonal movements of large brown trout and walleye in an impounded reach of the Au Sable River, Michigan. Michigan Department of Natural Resources, Fisheries Research Report 2056. Ann Arbor. Dotson, T. 1982. Mortalities in trout caused by gear type and angler-induced stress. North American Journal of Fisheries management 2:60-65. Eaton, J. G., J. H. McCormick, B. E. Goodno, D. G. O'Brien, H. G. Stefany, M. Hondzo, and R. M. Scheller. 1995. A field information-based system for estimating fish temperature tolerances. Fisheries 20:10-18. Elliott, J. M. 1994. Quantitative ecology and the brown trout. Oxford University Press, Oxford. Gregory, S.V., A.M. Gurnell, K.J. Gregory, S. Bolton, L.A. Medvedeva, A. Semenchenco, A.N. Mahkinov, D. Sobota, J. Baurer, and K. Staley 2000. Bibliography: World literature on wood in streams, rivers, and riparian areas, Version 1.0. International Conference on Wood in World River, Oregon State University, Corvallis. Jennings, H.E., M.X. Hudy, R.J. Stuber, W.P. Fowler, and M. Joyce. 2005 Use of a GIS-based methodology for long-term monitoring of whole trees placed in the Au Sable and Manistee River, Michigan. 66th Annual Meeting of the Midwest Fish and Wildlife Conference, Grand Rapids, MI. Johnson, P. and C.M. Nelson. 1996. Estimated summer 1994 watercraft use on the Au Sable River from Mio access site to the upper end of Alcona Pond. Contract report prepared by Michigan State University for the United States Department of Agriculture, Forest Service, Mio Ranger District. Hunsaker, D., L. F. Marnell, and F. P. Sharp. 1970. Hooking mortality of Yellowstone cutthroat trout. Progressive Fish-Culturist 32:231-235.

Michigan Department of Natural Resources 2007-22 Status of the Fishery Resource Report Page 22 Klein, W. D. 1965. Mortality of rainbow trout caught on single and treble hooks and released. Progressive Fish-Culturist 27:171-172. Klungle, M.M. and D.B. Hayes. 2004. Evaluation of whole tree additions in the Manistee and Au Sable Rivers. 2004 Annual Meeting of the American Fisheries Society, Madison, WI. Lawler, Matusky and Skelly Engineers. 1991. Results of fall 1990 and spring 1991 electrofishing in the Au Sable, Manistee and Muskegon Rivers. Consumers Power Company, Jackson Michigan. McRae, B.J., and J. S. Diana. 2005. Factors influencing density of age-0 brown trout and brook trout in the Au Sable River, Michigan. Transactions of the American Fisheries Society 134:132-140. MDNR Fisheries Division. 2003. Criteria for selection of trout streams with gear restriction regulations. Michigan Department of Natural Resources, Fisheries Division. Nuhfer, A.J. 1991. Evaluation of the introduction of the Arctic grayling, into Michigan lakes and streams. Michigan Department of Natural Resource, Fisheries Division, Fisheries Research Report 1985. Ann Arbor. Schneider, J. C. (ed.) 2000. Manual of fisheries survey methods II: with periodic updates. Michigan Department of Natural Resources, Fisheries Special Report 25, Ann Arbor. Sendek, S.P. 2004. Au Sable River Management Plan: River Management Plan 01, August, 2004. Michigan Department of Natural Resources, Fisheries Division, Lansing, Michigan. Sendek, S.P. 2004. Guidelines for selection of quality non-trout fishing lakes. MDNR Fisheries Division. Shetter, D. S. 1962. Recoveries by anglers of legal-sized trout stocked during different seasons of the year in Michigan streams. Transactions of the American Fisheries Society 91:145-150. Stuber, R.J., W.P. Fowler, M. Joyce, H. Jennings, D.B. Benjamin, D. Smith, M. Johnson, K. Kruger, M. Tonello, S. Sendek, M. Holtgren, and D.S. Battige. 2004 Helicopter Placement of Whole Trees; A Collaborative Approach to Restoration of Large Wood in the Au Sable and Manistee Rivers, Michigan. Paper presented at the 2004 Biennial Symposium of the River Management Society, May 3-7, 2004, Squaw Valley, California. Tonello, M., C. Freiburger, A. Nuhfer, and S. Sutton. 2004. Riparian Zone Management and Trout Streams: 21st Century and Beyond. Michigan Department of Natural Resources, Fisheries Division, Lansing, Michigan. Tonello, M. A. and A. J. Nuhfer. 2004. Manistee River Hodenpyl Dam to Red Bridge. Michigan Department of Natural Resources, Status of the Fishery Resource Report 2004-2, Ann Arbor. USFWS (U.S. Department of the Interior, Fish and Wildlife Service) and USCB (U.S. Department of Commerce, U.S. Census Bureau). 2002. 2001 National Survey of Fishing, Hunting, and Wildlife-

Michigan Department of Natural Resources 2007-22 Status of the Fishery Resource Report Page 23 Associated Recreation: Michigan, revised March 2003. FHW/01-MI-Rev, U.S. Government Printing Office, Washington D.C. Wehrly, K. E., L. Wang, and M. Mitro. 2007. Field-based estimates of thermal tolerance limits for trout: Incorporating exposure time and temperature fluctuation. Transactions of the American Fisheries Society 136:365-374. Weiss, S. and S. Schmutz. 1999. Performance of hatchery-reared brown trout and their effects on wild fish in two small Austrian streams. Transactions of the American Fisheries Society 128:302-316. Woldt, A. P. and E. S. Rutherford. 2002. Production of juvenile steelhead in two central Lake Michigan tributaries. Michigan Department of Natural Resources, Fisheries Research Report 2060, Ann Arbor. Wydoski, R. S. 1977. Relation of hooking mortality and sublethal hooking stress to quality fishery management. Pages 43-87 in R. A. Barnhart and T. D. Roelofs, editors. Catch-and-release fishing as a management tool. Humbold State University, California cooperative Fishery Research Unit, Arcata. Zorn, T.G., and S.P. Sendek. 2001. Au Sable River Assessment. Michigan Department of Natural Resources, Fisheries Division, Special Report 26, Ann Arbor.

Page - 1 -
List of tables
Table 1a – Summer water temperatures (Celsius) upstream and downstream of the Mio Dam
during 2005-06. The upstream site is near Red Oak and the downstream site is immediately
below Mio dam. Mean range is defined as the average of the daily temperature range (daily
maximum temperature minus daily minimum temperature). Upstream and downstream are
designated as up and down. Data from USGS web site.
Table 1b. – Mean monthly summer water temperatures in the Au Sable River downstream of the
Mio Dam and near McKinley Bridge 1997-2006. Data from USGS web site.
Table 1c. – Number of summer days (June, July and August) that mean daily water temperature
exceeded 20 0C, 22
0C and 24
0C in the Au Sable River downstream of the Mio Dam and near
McKinley Bridge 1997-2006. Data from USGS web site.
Table 2. – Trout plantings into the Au Sable River and tributaries between Mio dam and Alcona
Pond 1938-2006.
Table 3. – Fish species captured on four fish community surveys. See text for survey methods.
Table 4. Summary of fish population estimates in the Mio to Alcona reach of the Au Sable River,
September 1962 and October 1990.
Table 5 – Fish species caught by boom shocker electrofishing between Mio Dam and McKinley
Bridge.
Table 6 – Stream discharge (cfs) near the mouth of tributaries to the mainstem Au Sable River
between Mio Dam and Alcona Pond on June 26, 2007. Mean water July and August 2007
temperatures (0F ) for six streams were summarized from hourly temperature recordings made
with Onset electronic thermometers. Streams are arranged in the table from upstream (Wolf
Creek) to downstream (Lost Creek). Discharge of the Au Sable River immediately downstream
of Mio Dam was near the median level for this date, i.e. 863 cfs at noon.
Table 7 -Quality Trout Angling Regulations- Power line (T26N, R2E, Sec. 4) to McKinley
Bridge 1965-2007.
Table 8. – Angler catches of brown trout and rainbow trout and angler effort in the Au Sable
River between M-33 Bridge and 4001 Bridge from the last Saturday in April through 30-
September in 1999 and 2000. Two standard errors are given in parenthesis. Angler catches of
other fish species are shown in appendices to this report.
Table 9. – Angler catches of brown trout and rainbow trout and angler effort per mile in the Au
Sable River from the last Saturday in April through 30-September in 1999 and 2000.
Table 10. – Percentage of brown trout and rainbow trout released by anglers fishing in the Au
Sable River from the last Saturday in April through 30-September in 1999 and 2000.
Table 11.─Brown trout population estimates by age in the Au Sable River between the Mio dam
and Meadow Springs and weighted mean length at age. This 4.75-mile long reach has a surface
area of 95 acres.

Page - 2 -
Table 12. - Annual survival rates for brown trout and rainbow trout in a 4.75 mile reach of the Au
Sable River between Mio dam and Meadow Springs.
Table 13 - Average total length (inches) at age, and size relative to the state average, for trout
sampled from the Au Sable River below Mio Dam during November 2005.
Table 14. - Annual growth increments (inches) for yearling brown trout and rainbow trout
stocked from 1999 through 2001. Annual increments are from November to November of the
next year when populations were estimated.
Table 15.─Rainbow trout population estimates by age in the Au Sable River between the Mio
dam and Meadow Springs. Estimates were conducted during the first week of November each
year. This 4.75-mile long reach has a surface area of 95 acres.
Table 16. - Numbers of trees placed in the Mio Dam to McKinley section of the Au Sable River
from 1998 to 2006.
Page - 3 -
List of figures
Figure 1. – Location Map. Mio Dam to Alcona Pond
Figure 2 – Brook trout and brown trout density (numbers per acre) in 125 Michigan rivers. Data
are from the Michigan Rivers Inventory (MRI) database. Sites where no trout were captured
were omitted from the graphic.
Figure 3 – Summer maximum and minimum daily water temperatures in the Au Sable River
downstream of Mio dam 1999-2002. Data from USGS.
Figure 4 – Summer maximum and minimum daily water temperatures in the Au Sable River near
McKinley Bridge 1999-2002. Data from USGS.
Figure 5 � November brown trout average population density by inch group for fish 8-inches or
longer (5-year average of 1999-2002 + 2005) in a 4.75 mile reach of the Au Sable River between
Mio dam and Meadow Springs.
Figure 6. – Comparisons of brown trout density in the Au Sable River upstream and downstream
of Mio Dam.
Figure 7 � November brown trout average population density by inch group for fish 8-inches or
longer (5-year average of 1999-2002 + 2005) in a 4.75 mile reach of the Au Sable River between
Mio dam and Meadow Springs.
Figure 8 – Biological criteria for selection of trout streams with gear restriction regulations.
Figure 9 - Physical criteria for selection of trout streams with gear restriction regulations.
Figure 10.─Predicted angler catches of brown trout 12 inches or longer under Type 5, 6, or 7
regulations at different rates of voluntary release of legal-sized fish. Catches include both
harvested and released fish. Release of all fish is equivalent to a Type 7 regulation.
Figure 11.─Predicted angler catches of brown trout 15 inches or longer under Type 5, 6, or 7
regulations at different rates of voluntary release of legal-sized fish. Catches include both
harvested and released fish. Release of all fish is equivalent to a Type 7 regulation.
Figure 12.─Predicted angler catches of rainbow trout 12 inches or longer under Type 5, 6, or 7
regulations at different rates of voluntary release of legal-sized fish. Catches include both
harvested and released fish. Release of all fish is equivalent to a Type 7 regulation.
Figure 13.─Predicted angler catches of rainbow trout 15 inches or longer under Type 5, 6, or 7
regulations at different rates of voluntary release of legal-sized fish. Catches include both
harvested and released fish. Release of all fish is equivalent to a Type 7 regulation.

Page - 4 -
Table 1a. – Summer water temperatures (Celsius) upstream and downstream of the Mio Dam during 2005-
06. The upstream site is near Red Oak and the downstream site is immediately below Mio dam. Mean
range is defined as the average of the daily temperature range (daily maximum temperature minus daily
minimum temperature). Upstream and downstream are designated as up and down. Data from USGS web
site.
Monthly means Monthly maximum Monthly minimum Mean range
Month/yr Up Down Up Down Up Down Up Down
June 05 19.0 20.2 23.0 24.0 13.5 15.0 2.3 1.4
June 06 17.3 19.5 22.3 21.5 13.2 16.5 2.3 1.2
July 05 19.5 21.6 22.5 24.5 15.0 19.0 2.2 1.0
July 06 17.3 19.5 22.6 24.7 15.7 19.0 2.2 1.3
Aug 05 18.0 20.1 22.5 23.5 14.0 16.5 1.9 1.2
Aug 06 17.7 19.4 24.7 24.1 13.9 16.2 2.0 1.0
Table 1b. – Mean monthly summer water temperatures in the Au Sable River downstream of the Mio
Dam and near McKinley Bridge 1997-2006. Data from USGS web site.
June July August
Year Mio Dam McKinley Mio Dam McKinley Mio Dam McKinley
1997 19.0 18.6 20.4 19.9 17.5 17.2
1998 17.7 17.7 21.0 20.4 19.8 19.3
1999 19.8 19.6 21.5 21.4 19.5 18.8
2000 18.5 18.1 19.5 19.2 19.2 18.7
2001 18.8 18.6 21.1 20.6 21.0 20.3
2002 18.2 18.3 22.1 22.4 20.5 20.3
2003 17.9 17.6 20.2 20.0 21.1 20.3
2004 17.8 17.7 19.8 19.6 18.4 18.0
2005 20.2 20.2 21.6 21.4 20.1 19.8
2006 19.5 19.2 21.3 21.1 19.4 19.6
Table 1c. – Number of summer days (June, July and August) that mean daily water temperature
exceeded 20 0C, 22
0C and 24
0C in the Au Sable River downstream of the Mio Dam and near
McKinley Bridge 1997-2006. Data from USGS web site.
Days 20.0+ 0C (68
0F) Days 22.0+
0C (71.6
0F) Days 24.0+
0C (75.2
0F)
Year Mio Dam McKinley Mio Dam McKinley Mio Dam McKinley
1997 29 25 10 11 0 0
1998 56 42 13 10 0 0
1999 51 50 29 16 0 0
2000 33 16 0 0 0 0
2001 67 59 26 20 6 2
2002 59 57 32 33 1 4
2003 60 48 13 6 0 0
2004 30 20 1 1 0 0
2005 65 62 36 29 0 0
2006 50 42 12 11 0 0

Page - 5 -
Table 2. – Trout plantings into the Au Sable River and tributaries between Mio dam and Alcona Pond 1938-
2006.
Year Species Location Number
Size
(age) Strain
1938 Brown trout Comins Creek 4,940 Fall fingerlings
Brown trout Glennie Creek 4,940 Fall fingerlings
Brown trout Perry Creek 9,880 Fall fingerlings
Brown trout Wolf Creek 7,640 Fall fingerlings
1939 Brook trout Perry Creek 4,000 Fall fingerlings
Brown trout Cherry Creek 13,600 Fall fingerlings
Brown trout Comins Creek 3,600 Fall fingerlings
Brown trout Glennie Creek 3,600 Fall fingerlings
Brown trout Perry Creek 13,600 Fall fingerlings
1940 Brown trout Au Sable River 1,000 Adult
Brown trout Cherry Creek 13,500 Fall fingerlings
Brown trout Comins Creek 5,196 Fall fingerlings
Brown trout Glennie Creek 3,107 Fall fingerlings
Brown trout Wolf Creek 15,000 Fall fingerlings
Brown trout Perry Creek 20,196 Fall fingerlings
Rainbow trout Au Sable River 100 Adult
Rainbow trout Cherry Creek 4,500 Fall fingerlings
Rainbow trout Perry Creek 4,500 Fall fingerlings
1941 Brown trout Au Sable River 6,000 Yearling
Brown trout Au Sable River 400 Adult
Brown trout Cherry Creek 2,500
Brown trout Comins Creek 2,500
Brown trout Glennie Creek 15,000 Spring fingerlings
Brown trout Perry Creek 35,000 Spring fingerlings
Rainbow trout Au Sable River 600 Adult
Rainbow trout Cherry Creek 2,500 Fall fingerlings
Rainbow trout Comins Creek 2,500 Fall fingerlings
Rainbow trout Glennie Creek 2,500 Fall fingerlings
Rainbow trout Perry Creek 2,500 Fall fingerlings
1942 Brown trout Cherry Creek 7,500 fingerlings
Brown trout Comins Creek 7,500 fingerlings
Brown trout Perry Creek 30,000 fingerlings
Rainbow trout Cherry Creek 5,000 fingerlings
Rainbow trout Comins Creek 7,000 fingerlings
Rainbow trout Perry Creek 12,000 fingerlings
1943 Brown trout Au Sable River 500 Adult
Brown trout Cherry Creek 10,000 fingerlings
Brown trout Comins Creek 5,000 fingerlings
Brown trout Glennie Creek 5,000 fingerlings
Brown trout Perry Creek 30,000 fingerlings
Rainbow trout Au Sable River 500 Adult
Rainbow trout Cherry Creek 5,000 fingerlings
Rainbow trout Comins Creek 5,000 fingerlings
Rainbow trout Glennie Creek 5,000 fingerlings
Rainbow trout Perry Creek 10,000 fingerlings

Page - 6 -
Table 2. – Trout plantings into the Au Sable River and tributaries between Mio dam and Alcona Pond 1938-
2006 (Continued).
Year Species Location Number
Size
(age or length) Strain
1944 Brown trout Au Sable River 1,900 7.8
1945 Brown trout Au Sable River 4,700 8.3-9
Rainbow trout Au Sable River 900 10
1946 Brown trout Au Sable River 4,225 8.6-9.2
Rainbow trout Au Sable River 1,350 9.3
1947 Brown trout Au Sable River 3,700 9.3-9.6
Rainbow trout Au Sable River 4,000 9.1-9.3
1948 Brown trout Au Sable River 10,500 8.5-9.7
Brown trout Au Sable River 393 16.3
1949 Brown trout Au Sable River 3,600 7.5-9.7
Brown trout Au Sable River 190 18.7
Rainbow trout Au Sable River 11,600 7.2-9.4
1950 Brown trout Au Sable River 3,000 8.1
Brown trout Au Sable River 180 18.3
Rainbow trout Au Sable River 8,000 7.1
1951 Brown trout Au Sable River 5,950 7.2-7.5
Brown trout Au Sable River 180 19.2
Brown trout Au Sable River 6,100 7.2-7.5
Brown trout Au Sable River 180 19.2
Rainbow trout Au Sable River 6,000 7.5
Rainbow trout Au Sable River 95 16
Rainbow trout Au Sable River 6,000 7.5
Rainbow trout Au Sable River 90 16
Brook trout Au Sable River 900 7.7
1952 Brown trout Au Sable River 9,600 7.5-7.8
Brown trout Au Sable River 66 21
Rainbow trout Au Sable River 6,250 7.2-8.6
Rainbow trout Au Sable River 80 19.5-23
1953 Brown trout Au Sable River 13,500 7.2-7.8
Brown trout Au Sable River 160 20-24
Rainbow trout Au Sable River 3,500 7.4-7.8
1954 Brown trout Au Sable River 7,845 7.4-8.1
Brown trout Au Sable River 125 14.8-17.6
Rainbow trout Au Sable River 5,000 7.8

Page - 7 -
Table 2. – Trout plantings into the Au Sable River and tributaries between Mio dam and Alcona Pond 1938-
2006 (Continued).
Year Species Location Number
Size
(age or length) Strain
1955 Brown trout Au Sable River 15,000 Legal
Rainbow trout Au Sable River 25,200 Legal
Brook trout Guster Creek
(Perry)
300 Legal
1956 Brown trout Au Sable River 4,500 Legal
Rainbow trout Au Sable River 43,500 Legal
1957 Brown trout Au Sable River 3,000 Legal
Rainbow trout Au Sable River 43,300 Legal
1958 Brown trout Au Sable River 5,700 Legal
Rainbow trout Au Sable River 20,550 Legal
1959 Brown trout Au Sable River 4,500 Legal
Rainbow trout Au Sable River 20,850 Legal
1960 Brown trout Au Sable River 3,500 Legal
Rainbow trout Au Sable River 17,000 Legal
1961 Brown trout Au Sable River 650 Legal
Rainbow trout Au Sable River 12,900 Legal
Brook trout Au Sable River 650 Legal
1962 Brown trout Au Sable River 3,400 Legal
Rainbow trout Au Sable River 13,500 Legal
1963 Brown trout Au Sable River 3,600 Legal
Rainbow trout Au Sable River 12,000 Legal
1964 Brown trout Au Sable River 3,900 Legal
Rainbow trout Au Sable River 13,000 Legal
1965 Brown trout Au Sable River 3,900 Legal
Rainbow trout Au Sable River 12,000 Legal
1966 Brown trout Au Sable River 3,000 Legal
1967 No plantings
1968 Brown trout Au Sable River 3,790 Yearling
Rainbow trout Au Sable River 1,070 Yearling
1969 Rainbow trout Au Sable River 10,500 Yearling
1970 Brown trout Au Sable River 5,000 Yearling
Rainbow trout Au Sable River 13,000 Yearling

Page - 8 -
Table 2. – Trout plantings into the Au Sable River and tributaries between Mio dam and Alcona Pond 1938-
2006 (Continued).
Year Species Location Number
Size
(age or length) Strain
1971 Brown trout Au Sable River 2,000 Yearling
Brown trout Au Sable River 1,120 Adult
Rainbow trout Au Sable River 13,000 Yearling
1972 Brown trout Au Sable River 8,000 Yearling
Rainbow trout Au Sable River 10,002 Yearling
1973 Brown trout Au Sable River 8,000 Yearling
Rainbow trout Au Sable River 8,500 Yearling
1974 Brown trout Au Sable River 10,000 Yearling
Rainbow trout Au Sable River 16,500 Yearling
1975 Brown trout Au Sable River 8,005 Yearling
Rainbow trout Au Sable River 4,100 Yearling
1976 Brown trout Au Sable River 10,866 Yearling
Rainbow trout Au Sable River 10,160 Yearling
1977 Brown trout Au Sable River 8,005 Yearling
Rainbow trout Au Sable River 11,486 Yearling
1978 Brown trout Au Sable River 8,005 Yearling
Rainbow trout Au Sable River 8,300 Yearling
1979 Brown trout Au Sable River 900 Yearling
Rainbow trout Au Sable River 6,500 Yearling
1980 Brown trout Au Sable River 1,140 Yearling
Rainbow trout Au Sable River 6,500 Yearling
1981 Brown trout Au Sable River 1,200 Yearling
Rainbow trout Au Sable River 6,500 Yearling
1982 Brown trout Au Sable River 1,200 Yearling
Rainbow trout Au Sable River 6,500 Yearling
1983 Brown trout Au Sable River 800 6.2 Harrietta
Brown trout Au Sable River 4,700 6.9 Harrietta
1985 Brown trout Au Sable River 4,620 7.1
Rainbow trout Au Sable River 6,500 7.4 Shasta
1986 Brown trout Au Sable River 5,440 5.4 Plymouth Rock
Rainbow trout Au Sable River 6,750 7.6 Shasta
1987 Brown trout Au Sable River 5,880 7.6 Plymouth Rock
Rainbow trout Au Sable River 5,750 7.4 Shasta
Arctic Grayling Au Sable River 40,032 7.4 Tricolor-Lacu
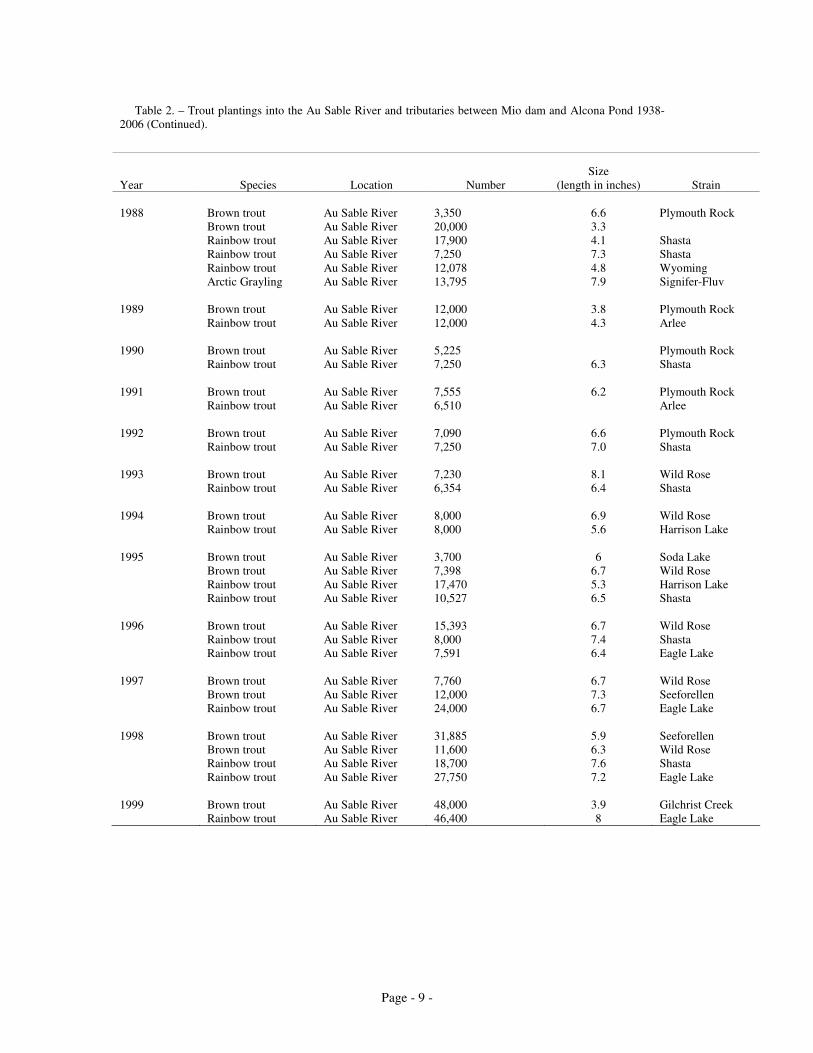
Page - 9 -
Table 2. – Trout plantings into the Au Sable River and tributaries between Mio dam and Alcona Pond 1938-
2006 (Continued).
Year Species Location Number
Size
(length in inches) Strain
1988 Brown trout Au Sable River 3,350 6.6 Plymouth Rock
Brown trout Au Sable River 20,000 3.3
Rainbow trout Au Sable River 17,900 4.1 Shasta
Rainbow trout Au Sable River 7,250 7.3 Shasta
Rainbow trout Au Sable River 12,078 4.8 Wyoming
Arctic Grayling Au Sable River 13,795 7.9 Signifer-Fluv
1989 Brown trout Au Sable River 12,000 3.8 Plymouth Rock
Rainbow trout Au Sable River 12,000 4.3 Arlee
1990 Brown trout Au Sable River 5,225 Plymouth Rock
Rainbow trout Au Sable River 7,250 6.3 Shasta
1991 Brown trout Au Sable River 7,555 6.2 Plymouth Rock
Rainbow trout Au Sable River 6,510 Arlee
1992 Brown trout Au Sable River 7,090 6.6 Plymouth Rock
Rainbow trout Au Sable River 7,250 7.0 Shasta
1993 Brown trout Au Sable River 7,230 8.1 Wild Rose
Rainbow trout Au Sable River 6,354 6.4 Shasta
1994 Brown trout Au Sable River 8,000 6.9 Wild Rose
Rainbow trout Au Sable River 8,000 5.6 Harrison Lake
1995 Brown trout Au Sable River 3,700 6 Soda Lake
Brown trout Au Sable River 7,398 6.7 Wild Rose
Rainbow trout Au Sable River 17,470 5.3 Harrison Lake
Rainbow trout Au Sable River 10,527 6.5 Shasta
1996 Brown trout Au Sable River 15,393 6.7 Wild Rose
Rainbow trout Au Sable River 8,000 7.4 Shasta
Rainbow trout Au Sable River 7,591 6.4 Eagle Lake
1997 Brown trout Au Sable River 7,760 6.7 Wild Rose
Brown trout Au Sable River 12,000 7.3 Seeforellen
Rainbow trout Au Sable River 24,000 6.7 Eagle Lake
1998 Brown trout Au Sable River 31,885 5.9 Seeforellen
Brown trout Au Sable River 11,600 6.3 Wild Rose
Rainbow trout Au Sable River 18,700 7.6 Shasta
Rainbow trout Au Sable River 27,750 7.2 Eagle Lake
1999 Brown trout Au Sable River 48,000 3.9 Gilchrist Creek
Rainbow trout Au Sable River 46,400 8 Eagle Lake

Page - 10 -
Table 2. – Trout plantings into the Au Sable River and tributaries between Mio dam and Alcona Pond 1938-
2006 (Continued).
Year Species Location Number
Size
(length in inches) Strain
2000 Brown trout Au Sable River 48,000 4.6 Gilchrist Creek
Rainbow trout Au Sable River 44,000 7.3 Eagle Lake
2001 Brown trout Au Sable River 48,000 4.9 Gilchrist Creek
Brown trout Au Sable River 43,554 3.3 Gilchrist Creek
Brown trout Au Sable River 21,938 2.8 Seeforellen
Rainbow trout Au Sable River 34,200 6.2 Eagle Lake
Rainbow trout Au Sable River 11,980 6.2 Shasta
2002 Brown trout Au Sable River 67,566 5.2 Gilchrist Creek
Rainbow trout Au Sable River 48,600 7 Eagle Lake
2003 Brown trout Au Sable River 48,000 5 Gilchrist Creek
Rainbow trout Au Sable River 48,000 6.5 Eagle Lake
2004 Brown trout Au Sable River 48,000 5.1 Gilchrist Creek
Rainbow trout Au Sable River 60,000 6.2 Eagle Lake
2005 Brown trout Au Sable River 24,000 6.7 Gilchrist Creek
Brown trout Au Sable River 18,000 7.1 Wild Rose
Rainbow trout Au Sable River 65,394 6 Eagle Lake
2006 Brown trout Au Sable River 48,022 6.8 Wild Rose
Rainbow trout Au Sable River 54,496 6.7 Eagle Lake

Page - 11 -
Table 3. – Fish species captured on four fish community surveys. See text for survey methods.
Species 1924 1962 1972 1990
Carps and Minnows
Spotfin Shiner X
Common Shiner X X X X
Pearl Dace X
River Chub X X
Golden Shiner X
Emerald Shiner X
Blackchin Shiner X X
Blacknose Shiner X
Spottail Shiner X
Mimic Shiner X
Bluntnose Minnow X X X X
Fathead Minnow X
Blacknose Dace X X X X
Longnose Dace X X X
Creek Chub X X X
Suckers
White Sucker X X X X
Northern Hog Sucker X X X X
Greater Redhorse X
Bullhead Catfishes
Black Bullhead X
Stonecat X X
Pikes
Northern Pike X X
Trouts
Rainbow Trout X X X
Round Whitefish X
Brown Trout X X X
Brook Trout X X X
Sticklebacks
Brook Stickleback X X
Sculpins
Mottled Sculpin X X
Slimy Sculpin X X
Sunfishes
Rock Bass X X X X
Bluegill X X
Smallmouth Bass X X X
Largemouth Bass X X
Black Crappie X X
Perches
Rainbow Darter X X X X
Johnny Darter X X X
Yellow Perch X
Logperch X X X
Blackside Darter X X X X
Walleye X X
Total Species captured 17 27 23 23

Page - 12 -
Table 4. - Summary of fish population estimates in the Mio to Alcona reach of the Au Sable River,
September 1962 and October 1990.
1962 1990
Cherry Creek - Davis Landing Meadow Springs -Gabions
Species Number
per acre
Pounds
per acre
Number
per acre
Pounds
per acre
Number
per acre
Pounds
per acre
Number
per acre
Pounds
per acre
Brown Trout 10 6.38 6 2.17 27 1.77 2 0.78
Rainbow Trout 1 0.51 4 2.01 1 0.15
Brook Trout 4 0.92 1 0.02
Round Whitefish 8 10.67 6 3.82
Smallmouth
Bass 7 0.13 0.01 32 0.07 2 0.01
Largemouth
Bass 1 0.02 1 - 3 0.02
Walleye 1 0.09 5 0.64
Northern Pike 2 1.50
Rock Bass 28 0.90 12 0.09 4 0.01
Yellow Perch 17 0.17 4 0.04
Bluegill 5 0.01 1 -
Black Crappie 1 - 1 -
Logperch 156 3.11 512 6.59 25 0.11 925 2.82
Blackside Darter 162 1.57 105 0.62 211 0.49 123 0.17
Rainbow Darter 5 0.03 769 3.35 71 0.05 29 0.03
Johnny Darter 243 0.78
Northern Hog
Sucker 133 7.82 794 7.08 542 59.90 60 8.45
White Sucker 43 2.66 158 2.26 309 79.01 19 5.37
Blacknose Dace 31 0.23 754 2.58 29 0.04 365 0.40
Longnose Dace 104 1.51 247 2.09 69 0.10 223 0.79
Common Shiner 238 0.71 34 0.03 98 0.12 83 0.07
Bluntnose
Minnow 10 0.06 3 0.02 22 0.06
Creek Chub 16 0.15 5 0.11 179 1.10 1,434 7.71
Blackchin
Shiner 7 0.01
Stonecat 24 3.07 2 0.01 8 0.08 5 0.24
Black Bullhead -
Slimy Sculpin 4 0.04 39 0.83
Greater
Redhorse 31 39.15 3 1.53
Mottled Sculpin 1 - 42 0.14
River Chub 5 0.01
Stickleback 1 - 2 -
Tessellated
Darter 82 0.08 91 0.11
Total 1,014 41.38 3,690 35.36 1741 183.17 3,437 29.80

Page - 13 -
Table 5. – Fish species caught by boom shocker electrofishing between Mio Dam and
McKinley Bridge.
Length (inches)
Species Year Catch per hour Minimum Maximum
Arctic grayling 1987 0.2 9.9 9.9
1988 0.0 -- --
1989 0.0 -- --
Brown trout 1987 38.7 4.3 23.5
1988 8.4 6.1 25.6
1989 11.7 6.4 23.3
Rainbow trout 1987 2.9 5.8 19.7
1988 0.6 9.2 10.1
1989 0.5 9.8 20.5
Brook trout 1987 0.2 6.7 6.7
1988 0.2 5.0 5.0
1989 0.2 8.3 8.3
Northern hog sucker 1987 36.0 3.1 18.3
1988 30.2 4.1 22.7
1989 62.4 4.8 18.3
White sucker 1987 16.0 4.7 18.8
1988 87.1 6.0 19.9
1989 67.5 5.8 19.2
Greater redhorse 1987 4.0 20.6 27.7
1988 70.9 17.0 26.7
1989 31.0 17.8 31.3
Hornyhead chub 1987 0.2 7.6 7.6
1988 0.2 4.8 4.8
Creek chub 1987 1.0 4.6 8.3
Common shiner 1987 0.4 6.5 7.1
1988 0.2 6.9 6.9
1989 0.2 6.3 6.3
Longnose dace 1987 2.9 2.3 4.3
1989 0.2 2.8 2.8
Logperch 1987 0.2 4.3 4.3
1989 0.2 3.9 3.9
Blackside darter 1987 0.4 2.1 3.1
1989 0.2 2.4 2.4
Rock bass 1987 0.2 6.2 6.2
1989 2.7 4.6 9.5

Page - 14 -
Table 5. – Fish species caught by boom shocker electrofishing between Mio Dam and McKinley
Bridge (Continued)
Length
Species Year Catch per hour Minimum Maximum
Northern pike 1987 0.4 24.0 24.1
1989 0.2 18.4 18.4
Round whitefish 1987 2.9 6.6 17.3
1988 0.4 13.9 14.9
1989 1.7 11.5 16.2
Walleye 1987 9.2 5.7 15.0
1988 3.2 7.7 27.5
1989 11.6 9.7 30.2
Smallmouth bass 1988 0.4 13.5 27.5
1989 1.6 6.4 14.5
Stonecat 1988 0.4 7.8 8.2
Yellow perch 1989 0.3 7.0 8.5

Page - 15 -
Table 6.– Stream discharge (cfs) near the mouth of tributaries to the mainstem Au Sable River
between Mio Dam and Alcona Pond on June 26, 2007. Mean water July and August 2007
temperatures (0F ) for six streams were summarized from hourly temperature recordings made
with Onset electronic thermometers. Streams are arranged in the table from upstream (Wolf
Creek) to downstream (Lost Creek). Discharge of the Au Sable River immediately downstream
of Mio Dam was near the median level for this date, i.e. 863 cfs at noon.
Tributary name
Discharge
in cubic feet per second
Mean July
Water Temperature
Mean August
Water Temperature
Wolf Creek 0.02 ─ ─
Cherry Creek 3.17 59.8 59.4
Loud Creek Channel dry at mouth ─ ─
Perry Creek 6.56 61.4 61.3
Cauchy Creek 0.66 58.7 58.0
Comins Creek Channel dry at mouth ─ ─
Glennie Creek 0.02 ─ ─
Nine Mile
Creek 1.86 51.9 52.4
O’Brien Lake
outlet 1.85 63.0
A 66.1
A
Blockhouse
Creek 0.37 54.0 54.6
Penoyer Creek 0.15 ─ ─
Lost Creek Mouth of creek was not located ─ ─
Total
discharge of
all named
tributaries
14.66
AIt is possible that local springs resulted in colder temperature readings than those in mid stream.
However, this was the only good hiding spot for the thermometer found within 400 feet of the
mouth of the creek.
Stream discharge of the Au Sable River at noon on 6/26/07 was 863 cfs immediately below Mio
Dam and 993 cfs immediately below Alcona Dam at noon. Thus, the 14.66 cfs of water
contributed to this reach by named tributaries was 11% of the 130 cfs increase in discharge
between the two dams. Discharge data from USGS real-time data for Michigan streamflow web
page.

Page - 16 -
Table 7. -Quality Trout Angling Regulations- Power line (T26N, R2E, Sec. 4) to McKinley Bridge 1965-
2007.
Year Tackle Size limits Creel Limits Season
1965 through 1967 Artificial lures or
flies only 12” all trout 2 trout per day
Last Saturday in
April to September
30
1968 through 1970 Artificial lures or
flies only 15” all trout 2 trout per day
Last Saturday in
April to October
10
1971 through 1972 Artificial lures or
flies only 15” all trout 2 trout per day
Last Saturday in
April to October
31
1973 Artificial flies only 18” all trout 2 trout per day
Last Saturday in
April to October
31
1974 through 1975 Artificial flies only
18” brown and
rainbow trout
12” brook trout
2 trout per day
Last Saturday in
April to October
31
1976 through 1978 Artificial lures or
flies only
15” brown and
rainbow trout
12” brook trout
2 trout per day
Last Saturday in
April to September
30
1979 through 2008 Artificial lures or
flies only
15” brown
12” rainbow and
brook trout
2 trout per day
Last Saturday in
April to September
30

Page - 17 -
Table 8. – Angler catches of brown trout and rainbow trout and angler effort in the Au
Sable River between M-33 and 4001 Bridge from the last Saturday in April through 30-
September in 1999 and 2000. Two standard errors are given in parenthesis. Angler catches
of other fish species are shown in appendices to this report.
M33 – Power line
(0.3 mi)
Power line – Comins
Flats (7.05 mi)
Comins Flats –
McKinley (7.65 mi)
McKinley – 4001
(7.5 mi)
1999 -8” all trout 1999 - 8” all trout
2000 – 12” all
trout
Quality regulations 2000 – 12” all trout
Brown Rainbow Brown Rainbow Brown Rainbow Brown Rainbow
Harvest 1999 146 906 77 178 24 281 216 1,035
(119) (554) (151) (126) (34) (347) (181) (415)
2000 37 116 811 127 30 19 77 73
(65) (131) (999) (122) (50) (23) (73) (60)
Catch and release 1999 4,610 3,559 1,811 6,703 371 4,597 512 2,093
(5,386) (1,892) (1,136) (2,102) (190) (1,637) (691) (876)
2000 388 854 3,310 6,510 500 1,903 616 1,023
(278) (760) (1,156) (1,558) (295) (823) (340) (433)
Total angler hours 1999 8,033 10,410 6,865 5,287
(1,990) (1,705) (1,591) (1,104)
2000 4,738 17,615 5,403 6,978
(1,471) (3,233) (1,299) (1,633)
Total angler trips 1999 2,295 3,427 1,887 2.047
2000 1,354 4,022 1,186 2,565
Page - 18 -
Table 9. – Angler catches of brown trout and rainbow trout and angler effort per mile in the
Au Sable River from the last Saturday in April through 30-September in 1999 and 2000.
M33 – Power line
(0.3 mi)
Power line – Comins
Flats (7.05 mi)
Comins Flats –
McKinley (7.65 mi)
McKinley – 4001
(7.5 mi)
1999 -8” all trout 1999 - 8” all trout
2000 – 12” all
trout
Quality regulations 2000 – 12” all trout
Brown Rainbow Brown Rainbow Brown Rainbow Brown Rainbow
Harvest per mile
1999 487 3,020 11 25 3.1 37 29 138
2000 123 387 115 18 4 2 10 10
Catch and release per mile
1999 15,367 11,863 257 951 48 601 68 279
2000 1,293 2,847 470 923 65 249 82 136
Angler hours per mile
1999 26,829 1,476 896 705
2000 15,793 2,499 706 930
Ave. 21,311 1,987 801 818

Page - 19 -
Table 10. – Percentage of brown trout and rainbow trout released by anglers fishing in the
Au Sable River from the last Saturday in April through 30-September in 1999 and 2000.
M33 – Power line
(0.3 mi)
Power line – Comins
Flats (7.05 mi)
Comins Flats –
McKinley (7.65 mi)
McKinley – 4001
(7.5 mi)
1999 -8” all trout 1999 - 8” all trout
2000 – 12” all
trout
Quality regulations 2000 – 12” all trout
Brown Rainbow Brown Rainbow Brown Rainbow Brown Rainbow
1999 96.9 79.7 95.9 97.4 93.9 94.2 70.3 66.9
2000 91.3 88.0 80.3 98.1 94.3 99.0 88.9 93.3

Page - 20 -
Table 11.─Brown trout population estimates by age in the Au Sable River between the Mio dam
and Meadow Springs and weighted mean length at age. This 4.75-mile long reach has a surface
area of 95 acres.
Numbers per acre by age
Survey date 0 1 2 3 4 5 6 7 Total
11/8/1999 0.1 18.1 12.0 3.2 0.8 0.2 0.1 0.0 34.3
11/6/2000 1.9 20.0 12.5 3.3 1.7 0.4 0.1 0.01 39.9
11/8/2001 1.7 12.8 15.1 2.5 1.7 0.5 0.1 0.0 34.2
11/6/2002 0.2 13.3 9.1 3.0 0.7 0.3 0.1 0.0 26.7
11/08/2005 3.8 11.4 6.1 0.5 0.1 0.1 0.2 0.1 22.3
Numbers per mile by age
0 1 2 3 4 5 6 7 Total
11/8/1999 1.8 361.4 239.0 63.1 15.9 3.3 1.1 0.0 685.5
11/6/2000 37.9 400.0 249.6 66.0 34.6 8.8 1.7 0.1 798.6
11/8/2001 33.2 255.0 300.9 49.1 34.8 9.6 2.1 0.0 684.4
11/6/2002 3.9 266.6 181.7 59.7 13.6 6.9 1.1 0.0 533.3
11/08/2005 76.8 228.3 121.3 9.0 2.1 2.7 4.5 1.9 446.4
Brown trout weighted mean length at age in inches
Age
Year 0 1 2 3 4 5 6
1999 4.9 8.8 11.4 16.1 18.4 21.5 24.4
2000 5.3 6.1 11.3 15.4 18.2 20.5 23.1
2001 4.7 8.9 10.2 14.9 18.9 21.5 20.1
2002 4.4 9.1 10.6 15.7 19.7 22.1 24.6
2005 5.3 7.6 10.5 13.5 19.3 22.0 23.7

Page - 21 -
Table 12. - Annual survival estimates (%) for brown trout and rainbow trout in a 4.75 mile reach
of the Au Sable River between Mio dam and Meadow Springs. Survival estimates were
calculated from consecutive annual population estimates conducted each November from 1999
through 2002.
Brown trout annual percent survival by age
Year 1-2 2-3 3-4 4-5 5-6 6-7
1999 691
28 55 56 45 12
2000 75 20 53 28 21 0
2001 71 20 28 20 11 0
Average 72 22 45 34 29 4
Rainbow trout annual percent survival by age
Year 1-2 2-3 3-4 4-5 5-6 6-7
1999 11 1 0 --- --- ---
2000 79 4 0 --- --- ---
2001 71 2 ---2
--- --- ---
Average 54 2 0
1 Computed as the number of age-2 fish present in November 2000 divided by the number of age-
1 fish present in November 1999 and so on. Note that these estimates are “apparent” survival
rates since immigration into or emigration out of the study reach could occur between the times
populations were estimated. Immigration of trout into this reach was suggested by Abdella
(2001). In addition, bias was introduced by aging errors caused by false annuli laid down during
periods when warm water stress halts growth.
2 A valid estimate of survival could not be computed due to a small sample size. Only one four-
year-old fish was captured in the 4.75 mile sampling reach during this survey.

Page - 22 -
Table 13. - Average total length (inches) at age, and size relative to the state average, for trout
sampled from the Au Sable River below Mio Dam during November 2005.
Table 14. - Annual growth increments (inches) for cohorts of yearling brown trout and rainbow
trout stocked from 1999 through 2001. Annual growth incrementsA are from November to
November of the next year when populations were estimated.
Brown trout Growth Increments (in) by planting year (yearlings)
Age
Year 1 to 2 2 to 3 3 to 4
1999 2.5 3.6 4.8
2000 4.0 5.5
2001 1.7
Average 2.7 4.55 4.8
Rainbow trout Growth Increments (in) by planting year (yearlings)
Year 1 to 2 2 to 3 3 to 4
1999 1.4 2.0 2.2
2000 -0.1 3.1
2001 0.2
Average 0.5 2.5 2.2 A
A more detailed analysis of incremental growth data for specific planted cohorts revealed that
these estimates were biased due to false annuli laid down during summer periods when water
high water temperatures arrested growth. Annual incremental growth rates used in simulation
modeling were estimated from length frequency histograms of trout captured during
electrofishing surveys.
Species Age
Group
Number
of Fish
Length
Range in
Inches
Mean
Length in
Inches
State
Average
Length
Growth
Index (by
age group)
Mean Growth
Index for
Species
Brown
trout 0 31 3.3-6.3 4.9 4.0 +0.9 +1.5
I 68 4.2-10.9 8.7 6.9 +1.8
II 45 8.1-14.3 10.5 9.9 +0.6
III 16 10.8-19.5 13.7 12.9 +0.8
IV 6 18.3-20.7 19.4 15.9 +3.5
V 9 19.6-24.6 21.1 18.9 +3.2
VI 15 20.3-26.8 23.4 21.9 +1.5
VII 5 22.8-25.4 24.4 23.8 +0.6
VIII 1 25.3 25.3
Rainbow
trout 0 1 4.5 4.5 3.4 +1.1 +2.7
I 68 4.2-12.4 10.0 6.5 +3.5
II 10 9.6-12.1 10.5 9.5 +1.0
III 1 17.1 17.1 12.4 +4.7
IV 1 24.2 24.2 15.4 +8.8
Brook
trout I 6 5.2-7.3 6.0 5.3 +0.7 +0.7

Page - 23 -
Table 15.─Rainbow trout population estimates by age in the Au Sable River between the Mio
dam and Meadow Springs. Estimates were conducted during the first week of November each
year. This 4.75-mile long reach has a surface area of 95 acres.
Number per acre by age
Survey Date 0 1 2 3 4 5 6 7 Total
11/08/1999 0.0 14.0 4.2 0.03 0.0 0.0 0.0 0.0 18.2
11/06/2000 0.4 5.1 1.5 0.04 0.0 0.0 0.0 0.0 7.0
11/08/2001 0.0 6.9 4.1 0.06 0.0 0.0 0.0 0.0 11.0
11/06/2002 0.0 10.4 4.9 0.07 0.01 0.0 0.0 0.0 15.4
11/08/2005 0.01 17.9 3.0 0.01 0.02 0.0 0.0 0.0 21.0
Number per mile by age
0 1 2 3 4 5 6 7 Total
11/08/1999 0.0 279.9 84.3 0.6 0.0 0.0 0.0 0.0 364.8
11/06/2000 7.0 102.4 29.9 0.9 0.0 0.0 0.0 0.0 140.0
11/08/2001 0.0 137.3 81.4 1.2 0.0 0.0 0.0 0.0 219.8
11/06/2002 0.0 207.4 97.9 1.3 0.2 0.0 0.0 0.0 307.0
11/08/2005 0.2 358.5 59.8 0.2 0.42 0.0 0.0 0.0 419.2
Rainbow trout weighted mean length at age in inches
Age
Year 0 1 2 3 4 5 6
1999 4.5 11.9 12.4 19.2 --- --- ---
2000 6.6 12.0 13.3 17.7 --- --- ---
2001 --- 11.4 11.9 1
15.3 --- --- ---
2002 --- 11.0 11.7 1
15.1 17.5 --- 24.5
2005 4.5 10.0 10.5 1
17.5 24.5 --- --- 1 Estimates of mean length at age are believed to be biased (low) due to aging error resulting from
false annuli being laid down during stressfully warm water conditions. Mean lengths at age used
in simulation modeling were estimated from examination of length frequency histograms of trout
captured during electrofishing surveys.

Page - 24 -
Table 16. - Numbers of trees placed in the Mio Dam to McKinley section of the Au Sable River
from 1998 to 2006.
Year Numbers of
trees
Location River
miles
1998 90 Mio Power line to Comins Flats 6.5
2002 214 Loud rest stop to Perry Creek 2.5
2003 256 Mio power line to Loud Rest Stop (156) and River islands
near Scenic Overlook (100)
2.5
2005 195 Comins Flats to Davis Landing 2.5
2006 193 Davis Landing to McKinley 3.5
Total 948 12.5*
*Numbers are not additive because some areas overlapped year to year.

Page - 25 -

Page - 26 -
Figure 2. – Brook trout and brown trout density (numbers per acre) in 125 Michigan rivers. Data are from the Michigan Rivers Inventory (MRI) database. Sites
where no trout were captured were omitted from the graphic.
Total brook and brown trout numbers per acre versus mean July water temperature in 125
Michigan streams. Data set includes stocked streams.
0
500
1000
1500
2000
2500
3000
3500
4000
4500
5000
10 11 12 13 14 15 16 17 18 19 20 21 22 23
Mean July water temperature (C)
Nu
mb
er
per
acre

Page - 27 -
Figure 3. – Summer maximum and minimum daily water temperatures in the Au Sable River downstream of Mio dam 1999-2002. Data from
USGS.
Daily maximum and minimum daily water temperatures (Celsius)
Au Sable River below Mio Dam. USGS station 04136500
June through August 1999
12.0
13.0
14.0
15.0
16.0
17.0
18.0
19.0
20.0
21.0
22.0
23.0
24.0
25.0
26.0
06/01/99 06/11/99 06/21/99 07/01/99 07/11/99 07/21/99 07/31/99 08/10/99 08/20/99 08/30/99
Date
Cels
ius
Maximum Minimum
Daily maximum and minimum daily water temperatures (Celsius)
Au Sable River below Mio Dam. USGS station 04136500
June through August 2000
12.0
13.0
14.0
15.0
16.0
17.0
18.0
19.0
20.0
21.0
22.0
23.0
24.0
25.0
26.0
06/01/00 06/11/00 06/21/00 07/01/00 07/11/00 07/21/00 07/31/00 08/10/00 08/20/00 08/30/00
Date
Cels
ius
Maximum Minimum
Daily maximum and minimum daily water temperatures (Celsius)
Au Sable River below Mio Dam. USGS station 04136500
June through August 2001
12.0
13.0
14.0
15.0
16.0
17.0
18.0
19.0
20.0
21.0
22.0
23.0
24.0
25.0
26.0
06/01/01 06/11/01 06/21/01 07/01/01 07/11/01 07/21/01 07/31/01 08/10/01 08/20/01 08/30/01
Date
Cels
ius
Maximum Minimum
Daily maximum and minimum daily water temperatures (Celsius)
Au Sable River below Mio Dam. USGS station 04136500
June through August 2002
12.0
13.0
14.0
15.0
16.0
17.0
18.0
19.0
20.0
21.0
22.0
23.0
24.0
25.0
26.0
06/01/02 06/11/02 06/21/02 07/01/02 07/11/02 07/21/02 07/31/02 08/10/02 08/20/02 08/30/02
Date
Cels
ius
Maximum Minimum

Page - 28 -
Figure 4. – Summer maximum and minimum daily water temperatures in the Au Sable River near McKinley Bridge 1999-2002.
Data from USGS.
Daily maximum and minimum daily water temperatures (Celsius)
Au Sable River near McKinley. USGS station 04136900
June through August 1999
12.0
13.0
14.0
15.0
16.0
17.0
18.0
19.0
20.0
21.0
22.0
23.0
24.0
25.0
26.0
06/01/99 06/11/99 06/21/99 07/01/99 07/11/99 07/21/99 07/31/99 08/10/99 08/20/99 08/30/99
Date
Cels
ius
Maximum Minimum
Daily maximum and minimum daily water temperatures (Celsius)
Au Sable River near McKinley. USGS station 04136900
June through August 2000
12.0
13.0
14.0
15.0
16.0
17.0
18.0
19.0
20.0
21.0
22.0
23.0
24.0
25.0
26.0
06/01/00 06/11/00 06/21/00 07/01/00 07/11/00 07/21/00 07/31/00 08/10/00 08/20/00 08/30/00
Date
Cels
ius
Maximum Minimum
Daily maximum and minimum daily water temperatures (Celsius)
Au Sable River near McKinley. USGS station 04136900
June through August 2001
12.0
13.0
14.0
15.0
16.0
17.0
18.0
19.0
20.0
21.0
22.0
23.0
24.0
25.0
26.0
06/01/01 06/11/01 06/21/01 07/01/01 07/11/01 07/21/01 07/31/01 08/10/01 08/20/01 08/30/01
Date
Cels
ius
Maximum Minimum
Daily maximum and minimum daily water temperatures (Celsius)
Au Sable River near McKinley. USGS station 04136900
June through August 2002
12.0
13.0
14.0
15.0
16.0
17.0
18.0
19.0
20.0
21.0
22.0
23.0
24.0
25.0
26.0
06/01/02 06/11/02 06/21/02 07/01/02 07/11/02 07/21/02 07/31/02 08/10/02 08/20/02 08/30/02
Date
Cels
ius
Maximum Minimum

Page - 29 -
29
Figure 5. – November brown trout average population density by inch group for fish 8-inches or
longer in a 4.75 mile reach of the Au Sable River between Mio Dam and Meadow Springs.
November brown trout average population density by inch group for fish 8-
inches or longer (5-year average of 1999-2002, + 2005) in a 4.75 mile reach of the
Au Sable River between Mio dam and Meadow Springs
557
596
450
204
7961 56 51
67 6141 37 25 16 9 6 6 3
0
100
200
300
400
500
600
700
8 9 10 11 12 13 14 15 16 17 18 19 20 21 22 23 24 25
Inch group
Nu
mb
er
in r
each
November mean length of Age-2 BNT = 10.8"
Age-3 BNT = 15.1"

Page - 30 -
30
Panel A.
Panel B.
Figure 6. – Comparisons of brown trout density in the Au Sable River upstream and
downstream of Mio Dam.
Number of Brown Trout 15 inches or longer per acre: Au Sable River, Mio dam to Meadow Springs compared to Au Sable at Stephan Bridge:
0
1
2
3
4
5
6
7
1999 2000 2001 2002
Year
Nu
mb
er
pe
r a
cre
Mio to Meadow Springs Stephan Bridge
Number of Brown Trout 15 inches or longer per mile: Au Sable River, Mio dam to Meadow Springs compared to Au Sable at Stephan Bridge:
0
10
20
30
40
50
60
70
80
90
100
1999 2000 2001 2002
Year
Nu
mb
er
pe
r m
ile
Mio to Meadow Springs Stephan Bridge

Page - 31 -
31
Figure 7. – November rainbow trout average population density by inch group for fish 8-inches or
longer in a 4.75 mile reach of the Au Sable River between Mio Dam and Meadow Springs.
November rainbow trout average population density by inch group for fish 8-
inches or longer (5-year average of 1999-2002, + 2005) in a 4.75 mile reach of the
Au Sable River between Mio dam and Meadow Springs
33
194
314
455
297
57
8 5 2 1 0 0 0 0 0 0 1 00
50
100
150
200
250
300
350
400
450
500
8 9 10 11 12 13 14 15 16 17 18 19 20 21 22 23 24 25
Inch group
Nu
mb
er
in r
each
November mean length of Age-2 RBT = 12.0"
Age-3 RBT = 16.9"
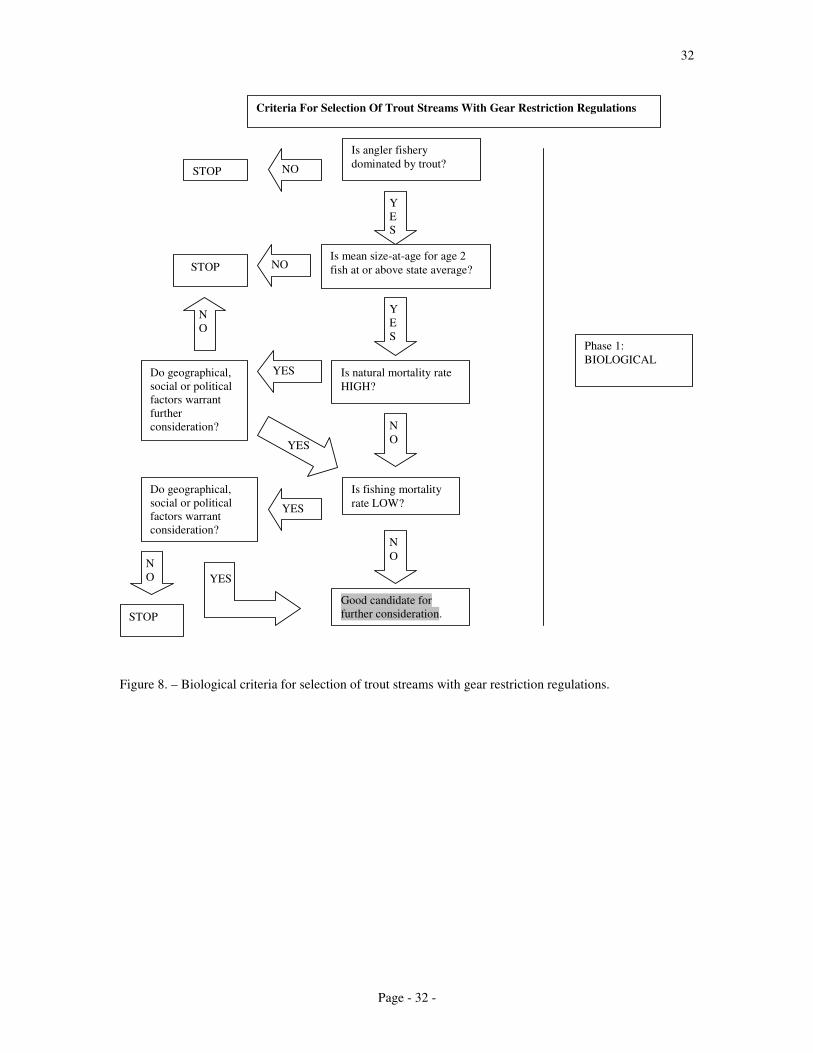
Page - 32 -
32
Figure 8. – Biological criteria for selection of trout streams with gear restriction regulations.
Is angler fishery
dominated by trout?
Y
E
S
Is mean size-at-age for age 2
fish at or above state average?
NO STOP
NO STOP
Phase 1:
BIOLOGICAL
Y
E
S
Is natural mortality rate
HIGH?
YES Do geographical,
social or political
factors warrant
further
consideration?
N
O
Is fishing mortality
rate LOW? YES
Do geographical,
social or political
factors warrant
consideration? N
O
Good candidate for
further consideration.
N
O
YES
N
O
YES
Criteria For Selection Of Trout Streams With Gear Restriction Regulations
STOP

Page - 33 -
33
Figure 9. - Physical criteria for selection of trout streams with gear restriction regulations.
Phase 2: PHYSICAL
Is stream reach 2 miles
or greater in length?
Y
E
S
STOP
Is there assured public
access?
NO STOP
Y
E
S
Very Good Candidate
Consider other factors such as
geographical distribution,
connectivity issues, social
aspects, etc.
NO

Page - 34 -
34
0
500
1,000
1,500
2,000
0% 50% 75% 100% = No Kill
Percent voluntarily released
Nu
mb
er
cau
gh
t; I
nclu
des r
ele
ase
Type 5 Type 6
Difference
13%
Difference
7%
Difference
4%
Figure 10.─Predicted angler catches of brown trout 12 inches or longer under Type 5, 6, or 7
regulations at different rates of voluntary release of legal-sized fish. Catches include both
harvested and released fish. Release of all fish is equivalent to a Type 7 regulation.

Page - 35 -
35
0
100
200
300
400
500
600
700
800
0% 50% 75% 100% = No Kill
Percent voluntarily released
Nu
mb
er
cau
gh
t; I
nclu
des r
ele
ase
Type 5 Type 6
Difference
23%
Difference
13%
Difference
7%
Figure 11.─Predicted angler catches of brown trout 15 inches or longer under Type 5, 6, or 7
regulations at different rates of voluntary release of legal-sized fish. Catches include both
harvested and released fish. Release of all fish is equivalent to a Type 7 regulation.
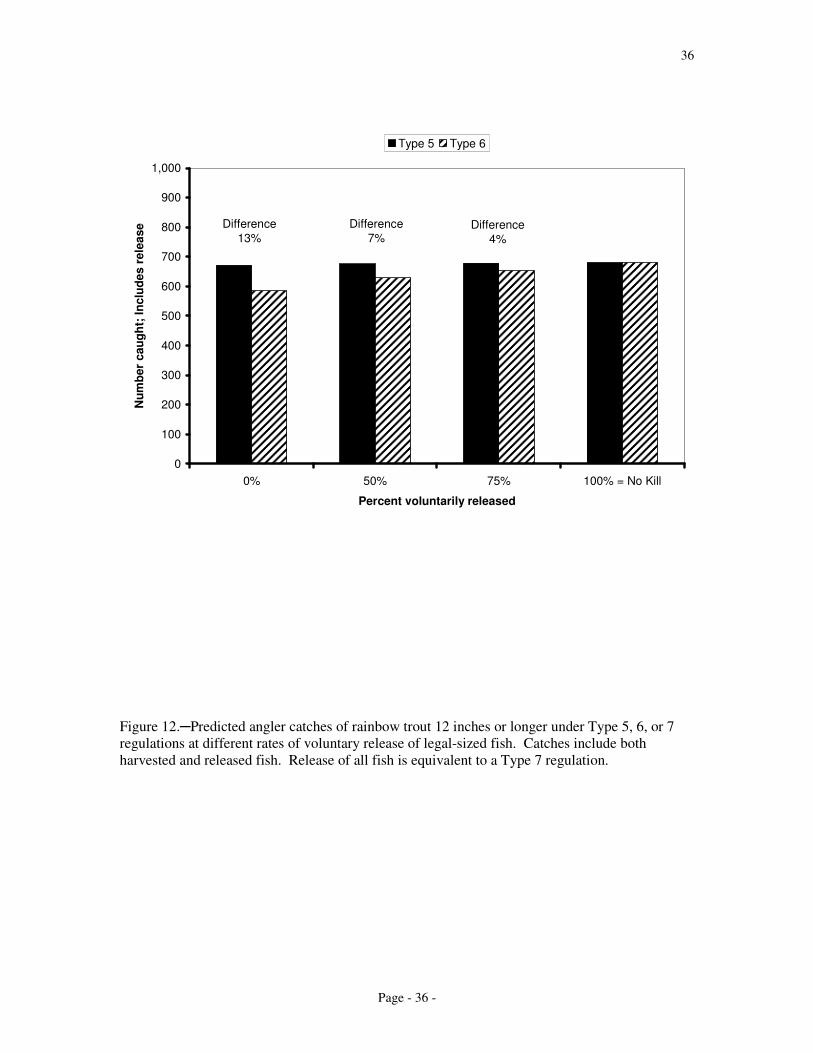
Page - 36 -
36
0
100
200
300
400
500
600
700
800
900
1,000
0% 50% 75% 100% = No Kill
Percent voluntarily released
Nu
mb
er
cau
gh
t; I
nclu
des r
ele
ase
Type 5 Type 6
Difference
13%
Difference
7%Difference
4%
Figure 12.─Predicted angler catches of rainbow trout 12 inches or longer under Type 5, 6, or 7
regulations at different rates of voluntary release of legal-sized fish. Catches include both
harvested and released fish. Release of all fish is equivalent to a Type 7 regulation.

Page - 37 -
37
0
10
20
30
40
50
60
0% 50% 75% 100% = No Kill
Percent voluntarily released
Nu
mb
er
cau
gh
t; I
nclu
des r
ele
ase
Type 5 Type 6
Difference
31%
Difference
18%
Difference
9%
Figure
13.─Predicted angler catches of rainbow trout 15 inches or longer under Type 5, 6, or 7
regulations at different rates of voluntary release of legal-sized fish. Catches include both
harvested and released fish. Release of all fish is equivalent to a Type 7 regulation.

Appendix – Page 1 of 4
Appendix 1. – Methods used to conduct the census.
Survey SiteM-33 to 4001 Bridge, AuSable River. Survey sites are as follows:
Description Site number
M-33 to Power Line 250A
Power Line to Comins Flats 250B
Comins Flats to McKinley Bridge 251
McKinley Bridge to 4001 Bridge 252
What is an angler surveyAn angler survey consists of samples of angling effort and individual
angling activity. Effort is sampled by making counts of units representing angling parties
actively fishing in the chosen survey area. For this survey we will be counting fishing boats
(canoes, etc.), non-fishing boats, and wading/tubing/shore anglers in the river. Individual angling
activity is sampled by interviewing angling parties and recording information for individual trips.
These interview data provide several important pieces of information: rate of catch by species,
number of anglers in the fishing party and length of fishing trip. Only anglers are to be
interviewed (boat, tubing, shore and wading). From the counts and interviews: angling hours,
angling trips and catch by species are estimated over a chosen time period (a month for example).
In general, angler survey estimates are based on samples of 2% to 10% of all anglers fishing at a
selected survey area.
Many people are involved in running an angler survey. Duties of team members vary, but each
member has essential responsibilities. The Au Sable River angler survey team includes a
statistician (design, sampling schedule and calculation of final estimates), several fisheries
biologists (design and supervision), three survey clerks (counting and interviewing), and a data
processor.
Purpose of surveyCollect recreational use, angling effort, catch and harvest data from the
riverine reaches of the AuSable River between Mio Dam and 4001 Bridge. Plans are being
formed to implement recreational and fisheries improvement projects in this section of the
AuSable River. These projects include improving tailrace and riverine access for anglers and
other recreationists. They also include increased trout stocking for a period of three years and
improving stream habitat with the addition of various wood and rock structures. This survey will
also provide insight into the recreational use patterns for evaluation of potential impacts on
sensitive species and habitats.
Personnel and equipment Three employees, vehicle transportation, one canoe and any
necessary equipment to collect data described below.
Appendix – Page 2 of 4
Appendix 1 (continued). – Methods used to conduct the census.
Survey time period April 29, 2000 through September 30, 2000. Sampling hours within a
day for each month are:
Month Sampling hours
April 6:00 a.m. to 9:30 p.m.
May 6:00 a.m. to 9:30 p.m.
June 1-7 6:00 a.m. to 9:30 p.m.
June 8-30 2:30 p.m. to 12:00 midnight
July 1-15 2:30 p.m. to 12:00 midnight
July 16-31 6:00 a.m. to 10:00 p.m.
August 1-24 6:00 a.m. to 10:00 p.m.
August 25-31 2:30 p.m. to 12:00 midnight
September 1-7 2:30 p.m. to 12:00 midnight
September 8-30 6:00 a.m. to 9:30 p.m.
Survey clerks’ dutiesWorking as a team, they will count and interview anglers at prescribed
times in the previously listed sections. Two employees will canoe the river beginning at a
scheduled time and location. While canoeing the employees will count and interview all anglers
encountered. Canoeing clerks will enumerate shore/wading/tubing anglers (summed and
reported as wading anglers); canoes and boats containing anglers (summed and reported as
fishing boats); canoes containing non-fishing anglers; and float tubes with non-fishing persons.
Canoeing clerks will also interview anglers while they are fishing; thus they will be incompleted
trip interviews. Only anglers fishing a minimum of 0.5 hours will be interviewed. The third
employee will serve as a spotter and will drop off and pick up the canoeing employees at
scheduled sites and times. While waiting for the canoeing employee, the spotter will visit access
sites along the river and interview any anglers present. These interviews may be completed trip
interviews. However, regardless of interview type, the same information will be collected.
Clerks will interview only anglers.
Clerks will collect all data following sampling schedule prepared by the Institute for Fisheries
Research, Ann Arbor MI. Schedule will assign one of two eight-hour work shifts (early morning
to early afternoon; or early afternoon to evening) for five days each week during sampling
period. Each weekend day (Saturday and Sunday), each holiday and three randomly selected
weekdays (two weekdays for weeks with holidays) will be sampled. The Institute will provide
specific counting and interviewing techniques.

Appendix – Page 3 of 4
Appendix 1 (continued). – Methods used to conduct the census.
Angler survey recordsEach interview record will contain the following:
-Interview source (drifter or spotter)
-Code (site) number of the site
-Date of interview
-Interview type: completed trip or incompleted trip
-Type of activity (shore, wading, or tubing anglers; boating or
canoeing anglers)
-Number of people in the party
-Time to the nearest 5 minutes the party arrived at the site
-Time to the nearest 5 minutes the party departed the site (interview
time)
-County of residence party lives in
-Specie(s) angler party was fishing for
-Bait type used by angler party (live, artificial, combination etc.)
-For each angler, species name and number caught and released
-For each angler, species name and number harvested
Species codes found on the interview form are as follows:
Code Name Code Name
WAE walleye BNT brown trout
NOP northern pike RBT rainbow trout
RKB rock bass BKT brook trout
YEP yellow perch
LMB largemouth bass
SMB smallmouth bass
Note on the interview form there are three additional “other” codes for additional species.
Counts of river sections will be done following the schedule prepared by the Institute for
Fisheries Research. For each section counted the following information will be recorded:
-Code (site) number of the site
-Date of count
-Time the section of river was entered (nearest hour)
-Number of wading, shore, or float tube anglers counted (passed)
-Number of angling boats and canoes counted (passed)
-Number of non-fishing boats and canoes counted (specific section only)
-Number of non-fishing float tubes counted (specific section only)

Appendix – Page 4 of 4
Appendix 1 (continued). – Methods used to conduct the census.
Non-fishing count sectionsNon-fishing boats and canoes, and non-fishing float tubes are
counted within specific sections of the river. In the middle of a specified section, all visible non-
fishing boats and canoes, and all visible non-fishing float tubes are counted. Thus, the clerks will
look both downstream and back upstream to make this count. Specific locations by section are as
follows (GPS – not corrected):
Section 250B
44°39.34 N
84°04.96 W
Located approximately 52 minutes below powerline.
Section 251
44°38.83 N
83°57.44 W
Located approximately 1 hour 26 minutes below Comins.
Section 252
44°37.80 N
83°51.60 W
Located approximately 55 minutes below McKinley Bridge.

Appendix – Page 1 of 7
Appendix 2. Angler census data for Au Sable River site 250a, M33 to Power Line, 1999-2000.
Appendix 2a.Total harvest, fishing pressure and catch per hour, Au Sable River site 250a, M33 to
Power Line, 1999. Two standard errors are given in parenthesis.
Appendix 2b.Boat angler harvest, fishing pressure and catch per hour, Au Sable River site 250a,
M33 to Power Line, 1999. Two standard errors are given in parenthesis.
Appendix 2c.Shore, wading, and tubing angler harvest, fishing pressure and catch per hour, Au Sable
River site 250a, M33 to Power Line, 1999. Two standard errors are given in parenthesis.
Appendix 2d.Total angler catch and release, fishing pressure and catch per hour, Au Sable River site
250a, M33 to Power Line, 1999. Two standard errors are given in parenthesis
Appendix 2e.Boat angler catch and release, fishing pressure and catch per hour, Au Sable River site
250a, M33 to Power Line, 1999. Two standard errors are given in parenthesis.
Appendix 2f.Shore, wading, and tubing angler catch and release, fishing pressure and catch per hour,
Au Sable River site 250a, M33 to Power Line, 1999. Two standard errors are given in parenthesis.
Appendix 2g.- Total estimated harvest, harvest rate and angling effort, Au Sable River site 250a (M33
to power line), summer 2000. All estimates are given with 2 SE in parentheses. Other species category
may include sunfish, bluegill, suckers, bowfin, redhorse, and catfish.
Appendix 2h.- Boat angler estimated harvest, harvest rate and angling effort, Au Sable River site 250a
(M33 to power line), summer 2000. All estimates are given with 2 SE in parentheses.
Appendix 2i.- Shore and wading angler estimated harvest, harvest rate and angling effort, Au Sable
River site 250a (M33 to power line), summer 2000. All estimates are given with 2 SE in parentheses.
Appendix 2j.- Total estimated catch and release, release rate and angling effort, Au Sable River site
250a (M33 to power line), summer 2000. All estimates are given with 2 SE in parentheses. “Other”
species category may include sunfish, bluegill, suckers, bowfin, redhorse, and catfish.
Appendix 2k.- Boat angler estimated catch and release, release rate and angling effort, Au Sable River
site 250a (M33 to power line), summer 2000. All estimates are given with 2 SE in parentheses. Other
species category may include sunfish, bluegill, suckers, bowfin, redhorse, and catfish.
Appendix 2L.- Shore angler estimated catch and release, release rate and angling effort, Au Sable River
site 250a (M33 to power line), summer 2000. All estimates are given with 2 SE in parentheses. Other
species category may include sunfish, bluegill, suckers, bowfin, redhorse, and catfish.

Appendix – Page 2 of 7
Appendix 2a.Total harvest, fishing pressure and catch per hour, Au Sable River site 250a, M33 to
Power Line, 1999. Two standard errors are given in parenthesis.
Species Catch/Hour Apr24-Jun7 Jun8-Ju15 Jul16-
Aug24
Aug25-Sep7 Sep8-30 Season
Walleye 0.0010 0 0 0 4 4 8
(0.0014) (0) (0) (0) (8) (8) (11)
Rock bass 0.0019 0 5 0 0 10 15
(0.0033) (0) (12) (0) (0) (23) (26)
Largemouth 0.0010 0 0 0 8 0 8
Bass (0.0024) (0) (0) (0) (19) (0) (19)
Brown trout 0.0182 106 21 0 0 19 146
(0.0155) (107) (30) (0) (0) (43) (119)
Rainbow
trout
0.1128 540 127 46 63 130 906
(0.0744) (518) (84) (97) (79) (128) (554)
White sucker 0.0042 34 0 0 0 0 34
(0.0090) (72) (0) (0) (0) (0) (72)
Sunfish sp. 0.0026 0 14 0 7 0 21
(0.0041) (0) (29) (0) (15) (0) (33)
Redhorse sp. 0.0015 0 0 0 12 0 12
(0.0033) (0) (0) (0) (26) (0) (26)
Total harvest 0.1432 680 167 46 94 163 1,150
(0.0798) (534) (95) (97) (87) (137) (574)
Angler hours 4,380 1,367 1,022 733 531 8,033
(1,788) (421) (448) (512) (348) (1,990)
Appendix 2b.Boat angler harvest, fishing pressure and catch per hour, AuSable River site 250a, M33
to Power Line, 1999. Two standard errors are given in parenthesis.
Species Catch/Hour Apr24-Jun7 Jun8-Ju15 Jul16-
Aug24
Aug25-Sep7 Sep8-30 Season
Rainbow
trout
0.1642 289 0 0 0 0 289
(0.2911) (477) (0) (0) (0) (0) (477)
Angler hours 1,356 220 150 34 0 1,760
(1,087) (247) (223) (68) (0) (1,139)

Appendix – Page 3 of 7
Appendix 2c.Shore, wading, and tubing angler harvest, fishing pressure and catch per hour, Au Sable
River site 250a, M33 to Power Line, 1999. Two standard errors are given in parenthesis.
Species Catch/Hour Apr24-Jun7 Jun8-Ju15 Jul16-
Aug24
Aug25-Sep7 Sep8-30 Season
Walleye 0.0013 0 0 0 4 4 8
(0.0018) (0) (0) (0) (8) (8) (11)
Rock bass 0.0024 0 5 0 0 10 15
(0.0042) (0) (12) (0) (0) (23) (26)
Largemouth 0.0013 0 0 0 8 0 8
Bass (0.0031) (0) (0) (0) (19) (0) (19)
Brown trout 0.0233 106 21 0 0 19 146
(0.0199) (107) (30) (0) (0) (43) (119)
Rainbow
trout
0.0984 251 127 46 63 130 617
(0.0519) (203) (84) (97) (79) (128) (283)
White sucker 0.0054 34 0 0 0 0 34
(0.0115) (72) (0) (0) (0) (0) (72)
Sunfish sp. 0.0033 0 14 0 7 0 21
(0.0053) (0) (29) (0) (15) (0) (33)
Redhorse sp. 0.0019 0 0 0 12 0 12
(0.0041) (0) (0) (0) (26) (0) (26)
Total harvest 0.1373 391 167 46 94 163 861
(0.0622) (240) (94) (97) (86) (137) (319)
Angler hours 3,024 1,147 872 699 531 6,273
(1,420) (341) (389) (507) (348) (1,632)
Angler trips 1,930 615 438 351 194 3,528
(1,032) (246) (219) (268) (149) (1,126)

Appendix – Page 4 of 7
Appendix 2d.Total angler catch and release, fishing pressure and catch per hour, Au Sable River site
250a, M33 to Power Line, 1999. Two standard errors are given in parenthesis.
Species Catch/Hour Apr24-Jun7 Jun8-Ju15 Jul16-
Aug24
Aug25-Sep7 Sep8-30 Season
Walleye 0.0009 0 6 0 0 1 7
(0.0018) (0) (14) (0) (0) (2) (14)
Rock bass 0.0346 61 62 0 22 133 278
(0.0259) (91) (65) (0) (42) (155) (196)
Yellow perch 0.0010 8 0 0 0 0 8
(0.0021) (17) (0) (0) (0) (0) (17)
Largemouth 0.0055 31 0 0 13 0 44
Bass (0.0090) (67) (0) (0) (24) (0) (71)
Smallmouth 0.0769 41 128 0 297 152 618
Bass (0.0610) (72) (262) (0) (280) (254) (466)
Brown trout 0.5739 4,455 78 0 0 77 4,610
(0.6854) (5,385) (93) (0) (0) (85) (5,386)
Rainbow
trout
0.4430 2,661 597 186 13 102 3,559
(0.2598) (1,805) (434) (347) (20) (117) (1,892)
Brook trout 0.0019 0 15 0 0 0 15
(0.0041) (0) (32) (0) (0) (0) (32)
Sunfish sp. 0.0034 0 0 0 9 18 27
(0.0056) (0) (0) (0) (20) (39) (44)
White sucker 0.0024 0 0 0 0 19 19
(0.0055) (0) (0) (0) (0) (43) (43)
Total catch 1.1434 7,257 886 186 354 502 9,185
(0.7677) (5,681) (521) (347) (286) (336) (5,732)
Angler hours 4,380 1,367 1,022 733 531 8,033
(1,788) (421) (448) (512) (348) (1,990)

Appendix – Page 5 of 7
Appendix 2e.Boat angler catch and release, fishing pressure and catch per hour, Au Sable River site
250a, M33 to Power Line, 1999. Two standard errors are given in parenthesis.
Species Catch/Hour Apr24-Jun7 Jun8-Ju15 Jul16-
Aug24
Aug25-Sep7 Sep8-30 Season
Brown trout 0.4318 760 0 0 0 0 760
(0.7458) (1,217) (0) (0) (0) (0) (1,217)
Rainbow
trout
1.0040 1,743 0 24 0 0 1,767
(1.1698) (1,711) (0) (60) (0) (0) (1,712)
Total catch 1.4358 2,503 0 24 0 0 2,527
(1.5128) (2,100) (0) (60) (0) (0) (2,101)
Angler hours 1,356 220 150 34 0 1,760
(1,087) (247) (223) (68) (0) (1,139)

Appendix – Page 6 of 7
Appendix 2f.Shore, wading, and tubing angler catch and release, fishing pressure and catch per hour,
Au Sable River site 250a, M33 to Power Line, 1999. Two standard errors are given in parenthesis.
Species Catch/Hour Apr24-Jun7 Jun8-Ju15 Jul16-
Aug24
Aug25-Sep7 Sep8-30 Season
Walleye 0.0011 0 6 0 0 1 7
(0.0022) (0) (14) (0) (0) (2) (14)
Rock bass 0.0443 61 62 0 22 133 278
(0.0333) (91) (65) (0) (42) (155) (196)
Yellow perch 0.0013 8 0 0 0 0 8
(0.0028) (17) (0) (0) (0) (0) (17)
Largemouth 0.0070 31 0 0 13 0 44
Bass (0.0114) (67) (0) (0) (24) (0) (71)
Smallmouth 0.0985 41 128 0 297 152 618
Bass (0.0786) (72) (262) (0) (280) (254) (466)
Brown trout 0.6137 3,695 78 0 0 77 3,850
(0.8516) (5,246) (93) (0) (0) (85) (5,248)
Rainbow
trout
0.2857 918 597 162 13 102 1,792
(0.1486) (576) (434) (342) (20) (117) (807)
Brook trout 0.0024 0 15 0 0 0 15
(0.0052) (0) (32) (0) (0) (0) (32)
Sunfish sp. 0.0043 0 0 0 9 18 27
(0.0071) (0) (0) (0) (20) (39) (44)
White sucker 0.0030 0 0 0 0 19 19
(0.0068) (0) (0) (0) (0) (43) (43)
Total catch 1.0614 4,754 886 162 354 502 6,658
(0.8940) (5,279) (520) (342) (285) (335) (5,334)
Angler hours 3,024 1,147 872 699 531 6,273
(1,420) (341) (389) (507) (348) (1,632)
Angler trips 1,930 615 438 351 194 3,528
(1,032) (246) (219) (268) (149) (1,126)

Appendix – Page 7 of 7
Appendix 2g.- Total estimated harvest, harvest rate and angling effort, Au Sable River site 250a (M33
to power line), summer 2000. All estimates are given with 2 SE in parentheses. Other species category
may include sunfish, bluegill, suckers, bowfin, redhorse, and catfish.
Species Catch/hour
Apr-
Jun 7 Jun 8-Jul 15 Jul 16-Aug 24 Aug 25-Sep 7 Sep 8-30 Season
Walleye 0.0042 0 0 20 0 0 20
(0.0097) (0) (0) (46) (0) (0) (46)
Rock bass 0.0091 0 17 0 26 0 43
(0.0140) (0) (35) (0) (55) 0 (65)
Brown trout 0.0078 37 0 0 0 0 37
(0.0139) (65) (0) (0) (0) (0) (65)
Rainbow trout 0.0245 36 4 0 76 0 116
(0.0287) (40) (9) (0) (124) (0) (131)
Other 0.0082 0 0 39 0 0 39
(0.0189) (0) (0) (89) (0) (0) (89)
Total harvest 0.0538 73 21 59 102 0 255
(0.0432) (76) (36) (100) (136) (0) (189)
Angler hours 1,342 693 1,576 688 439 4,738
(909) (333) (970) (348) (404) (1,471)

Appendix 3. Angler census data: Au Sable River site 250b, Power Line to Comins Flats, 1999-2000
Appendix 3a.Total harvest, fishing pressure and catch per hour, Au Sable River site 250b, Power
Line to Comins Flats, 1999. Two standard errors are given in parenthesis.
Appendix 3b.Total boat angler harvest, fishing pressure and catch per hour, Au Sable River site
250b, Power Line to Comins Flats, 1999. Two standard errors are given in parenthesis.
Appendix 3c.Total shore and wading angler harvest, fishing pressure and catch per hour, Au Sable
River site 250b, Power Line to Comins Flats, 1999. Two standard errors are given in parenthesis.
Appendix 3d.Total angler catch and release, fishing pressure and catch per hour, Au Sable River site
250b, Power Line to Comins Flats, 1999. Two standard errors are given in parenthesis.
Appendix 3e.Total boat angler catch and release, fishing pressure and catch per hour, Au Sable
River site 250b, Power Line to Comins Flats, 1999. Two standard errors are given in parenthesis.
Appendix 3f.Total shore and wading angler catch and release, fishing pressure and catch per hour,
Au Sable River site 250b, Power Line to Comins Flats, 1999. Two standard errors are given in parenthesis.
Appendix 3g.- Total estimated harvest, harvest rate and angling effort, Au Sable River site 250b
(power line to Comins Flats), summer 2000. All estimates are given with 2 SE in parentheses.
Appendix 3h.- Boat angler estimated harvest, harvest rate and angling effort, Au Sable River site 250b
(power line to Comins Flats), summer 2000. All estimates are given with 2 SE in parentheses.
Appendix 3i.- Shore and wading angler estimated harvest, harvest rate and angling effort, Au Sable
River site 250b (power line to Comins Flats), summer 2000. All estimates are given with 2 SE in
parentheses.
Appendix 3j.- Total estimated catch and release, release rate and angling effort, Au Sable River site
250b (power line to Comins Flats), summer 2000. All estimates are given with 2 SE in parentheses. Other
species category may include sunfish, bluegill, suckers, bowfin, redhorse, and catfish.
Appendix 3k.- Boat angler estimated catch and release, release rate and angling effort, Au Sable River site
250b (power line to Comins Flats), summer 2000. All estimates are given with 2 SE in parentheses. Other
species category may include sunfish, bluegill, suckers, bowfin, redhorse, and catfish.
Appendix 3L.- Shore and wading angler estimated catch and release, release rate and angling effort,
Au Sable River site 250b (power line to Comins Flats), summer 2000. All estimates are given with 2 SE in
parentheses. Other species category may include sunfish, bluegill, suckers, bowfin, redhorse, and catfish.

Appendix 3a.Total harvest, fishing pressure and catch per hour, Au Sable River site 250b, Power
Line to Comins Flats, 1999. Two standard errors are given in parenthesis.
Species Catch/Hour Apr24-Jun7 Jun8-Ju15 Jul16-
Aug24
Aug25-Sep7 Sep8-30 Season
Brown trout 0.0074 77 0 0 0 0 77
(0.0146) (151) (0) (0) (0) (0) (151)
Rainbow
trout
0.0171 53 41 21 57 6 178
(0.0124) (51) (40) (29) (103) (10) (126)
Total harvest 0.0245 130 41 21 57 6 255
(0.0193) (159) (40) (29) (103) (10) (196)
Angler hours 3,674 3,026 2,061 490 1,159 10,410
(1,073) (863) (829) (255) (510) (1,705)
Angler trips 1,130 1,057 767 150 323 3,427
(425) (370) (355) (101) (187) (699)
Appendix 3b.Total boat angler harvest, fishing pressure and catch per hour, Au Sable River site
250b, Power Line to Comins Flats, 1999. Two standard errors are given in parenthesis.
Species Catch/Hour Apr24-Jun7 Jun8-Ju15 Jul16-
Aug24
Aug25-Sep7 Sep8-30 Season
Rainbow
trout
0.0118 4 21 21 0 6 52
(0.0103) (9) (29) (29) (0) (10) (43)
Angler hours 1,514 1,349 873 211 473 4,420
(877) (541) (633) (141) (290) (1,252)
Angler trips 316 282 182 44 99 923
(191) (124) (136) (30) (63) (274)

Appendix 3c.Total shore and wading angler harvest, fishing pressure and catch per hour, Au Sable
River site 250b, Power Line to Comins Flats, 1999. Two standard errors are given in parenthesis.
Species Catch/Hour Apr24-Jun7 Jun8-Ju15 Jul16-
Aug24
Aug25-Sep7 Sep8-30 Season
Brown trout 0.0129 77 0 0 0 0 77
(0.0254) (151) (0) (0) (0) (0) (151)
Rainbow
trout
0.0210 49 20 0 57 0 126
(0.0201) (50) (27) (0) (103) (0) (118)
Total harvest 0.0339 126 20 0 57 0 203
(0.0326) (159) (27) (0) (103) (0) (191)
Angler hours 2,160 1,677 1,188 279 686 5,990
(618) (672) (536) (212) (419) (1,158)
Angler trips 814 775 585 106 224 2,504
(380) (349) (328) (96) (176) (643)

Appendix 3d.Total angler catch and release, fishing pressure and catch per hour, Au Sable River site
250b, Power Line to Comins Flats, 1999. Two standard errors are given in parenthesis.
Species Catch/Hour Apr24-Jun7 Jun8-Ju15 Jul16-
Aug24
Aug25-Sep7 Sep8-30 Season
Walleye 0.0011 0 8 3 0 0 11
(0.0017) (0) (16) (7) (0) (0) (17)
Northern pike 0.0011 0 0 0 11 0 11
(0.0026) (0) (0) (0) (26) (0) (26)
Rock bass 0.0026 0 0 25 2 0 27
(0.0051) (0) (0) (53) (5) (0) (53)
Yellow perch 0.0005 0 5 0 0 0 5
(0.0011) (0) (11) (0) (0) (0) (11)
Largemouth 0.0011 0 0 0 11 0 11
Bass (0.0026) (0) (0) (0) (26) (0) (26)
Smallmouth 0.0092 0 7 33 8 48 96
Bass (0.0092) (0) (11) (33) (15) (87) (95)
Brown trout 0.1740 393 954 182 41 241 1,811
(0.1128) (228) (1,086) (140) (33) (197) (1,136)
Rainbow
trout
0.6439 2,958 2,504 820 140 281 6,703
(0.2278) (1,302) (1,548) (524) (116) (202) (2,102)
Brook trout 0.0328 34 188 109 10 0 341
(0.0316) (33) (267) (179) (23) (0) (324)
White sucker 0.0016 0 5 7 5 0 17
(0.0019) (0) (10) (12) (13) (0) (20)
Sunfish sp. 0.0007 0 7 0 0 0 7
(0.0014) (0) (14) (0) (0) (0) (14)
Total catch 0.8684 3,385 3,678 1,179 228 570 9,040
(0.2721) (1,322) (1,910) (575) (130) (295) (2,415)
Angler hours 3,674 3,026 2,061 490 1,159 10,410
(1,073) (863) (829) (255) (510) (1,705)
Angler trips 1,130 1,057 767 150 323 3,427
(425) (370) (355) (101) (187) (699)
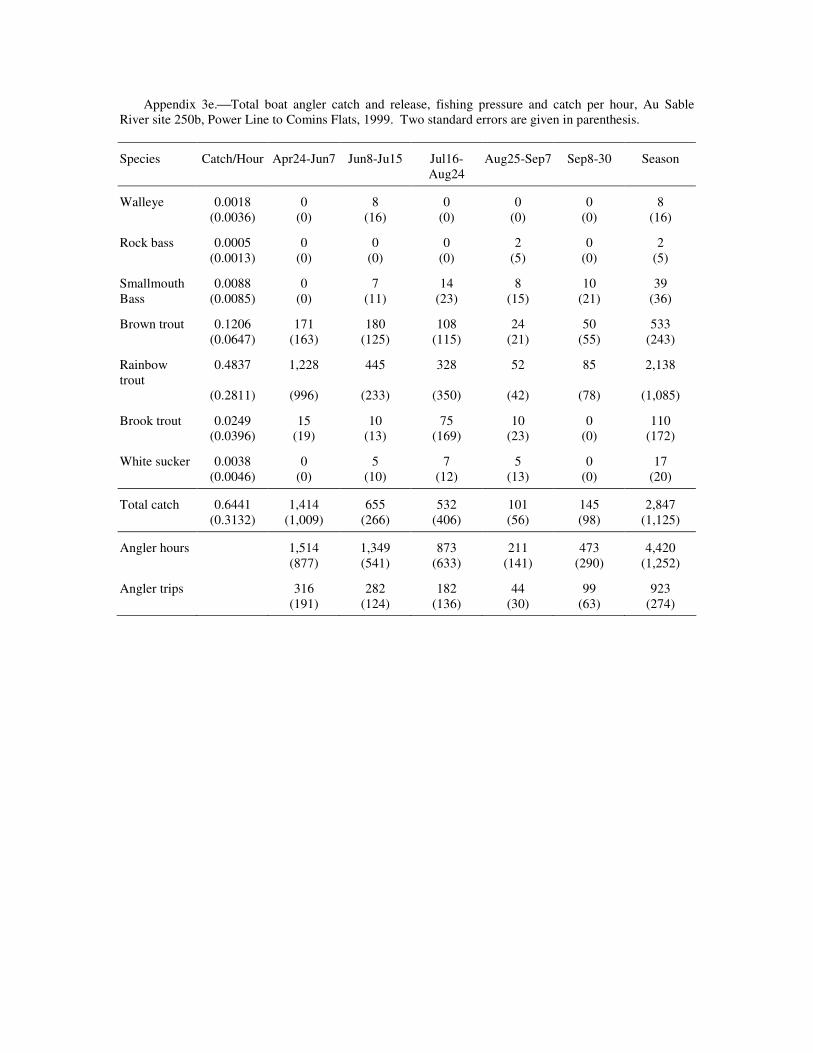
Appendix 3e.Total boat angler catch and release, fishing pressure and catch per hour, Au Sable
River site 250b, Power Line to Comins Flats, 1999. Two standard errors are given in parenthesis.
Species Catch/Hour Apr24-Jun7 Jun8-Ju15 Jul16-
Aug24
Aug25-Sep7 Sep8-30 Season
Walleye 0.0018 0 8 0 0 0 8
(0.0036) (0) (16) (0) (0) (0) (16)
Rock bass 0.0005 0 0 0 2 0 2
(0.0013) (0) (0) (0) (5) (0) (5)
Smallmouth 0.0088 0 7 14 8 10 39
Bass (0.0085) (0) (11) (23) (15) (21) (36)
Brown trout 0.1206 171 180 108 24 50 533
(0.0647) (163) (125) (115) (21) (55) (243)
Rainbow
trout
0.4837 1,228 445 328 52 85 2,138
(0.2811) (996) (233) (350) (42) (78) (1,085)
Brook trout 0.0249 15 10 75 10 0 110
(0.0396) (19) (13) (169) (23) (0) (172)
White sucker 0.0038 0 5 7 5 0 17
(0.0046) (0) (10) (12) (13) (0) (20)
Total catch 0.6441 1,414 655 532 101 145 2,847
(0.3132) (1,009) (266) (406) (56) (98) (1,125)
Angler hours 1,514 1,349 873 211 473 4,420
(877) (541) (633) (141) (290) (1,252)
Angler trips 316 282 182 44 99 923
(191) (124) (136) (30) (63) (274)

Appendix 3f.Total shore and wading angler catch and release, fishing pressure and catch per hour,
Au Sable River site 250b, Power Line to Comins Flats, 1999. Two standard errors are given in parenthesis.
Species Catch/Hour Apr24-Jun7 Jun8-Ju15 Jul16-
Aug24
Aug25-Sep7 Sep8-30 Season
Walleye 0.0005 0 0 3 0 0 3
(0.0012) (0) (0) (7) (0) (0) (7)
Northern pike 0.0018 0 0 0 11 0 11
(0.0043) (0) (0) (0) (26) (0) (26)
Rock bass 0.0042 0 0 25 0 0 25
(0.0089) (0) (0) (53) (0) (0) (53)
Yellow perch 0.0008 0 5 0 0 0 5
(0.0018) (0) (11) (0) (0) (0) (11)
Largemouth 0.0018 0 0 0 11 0 11
Bass (0.0043) (0) (0) (0) (26) (0) (26)
Smallmouth 0.0095 0 0 19 0 38 57
Bass (0.0146) (0) (0) (23) (0) (84) (87)
Brown trout 0.2134 222 774 74 17 191 1,278
(0.1899) (160) (1,079) (80) (26) (189) (1,110)
Rainbow
trout
0.7621 1,730 2,059 492 88 196 4,565
(0.3348) (839) (1,530) (390) (108) (186) (1,801)
Brook trout 0.0386 19 178 34 0 0 231
(0.0466) (27) (267) (59) (0) (0) (275)
Sunfish sp. 0.0012 0 7 0 0 0 7
(0.0024) (0) (14) (0) (0) (0) (14)
Total catch 1.0339 1,971 3,023 647 127 425 6,193
(0.4088) (855) (1,891) (407) (117) (278) (2,136)
Angler hours 2,160 1,677 1,188 279 686 5,990
(618) (672) (536) (212) (419) (1,158)
Angler trips 814 775 585 106 224 2,504
(380) (349) (328) (96) (176) (643)

Appendix 3g.- Total estimated harvest, harvest rate and angling effort, Au Sable River site 250b
(power line to Comins Flats), summer 2000. All estimates are given with 2 SE in parentheses.
Species Catch/hour Apr-Jun7
Jun 8-
Jul 15 Jul 16- Aug 24 Aug 25-Sep 7
Sep 8-
Sep 30 Season
Walleye 0.0010 0 24 0 0 0 24
(0.0016) (0) (38) (0) (0) (0) (38)
Smallmouth bass 0.0056 49 49 0 0 0 98
(0.0065) (60) (94) (0) (0) (0) (112)
Brown trout 0.0460 193 39 475 61 43 811
(0.0573) (170) (56) (970) (126) (92) (999)
Rainbow trout 0.0072 87 23 17 0 0 127
(0.0070) (114) (32) (28) (0) (0) (122)
Brook trout 0.0040 0 10 0 61 0 71
(0.0058) (0) (17) (0) (101) (0) (102)
Total harvest 0.0642 329 145 492 122 43 1,131
(0.0589) (213) (121) (970) (161) (92) (1,017)
Angler hours 6,185 3,703 4,647 2,397 683 17,615
(1,653) (1,246) (2,164) (1,163) (363) (3,233)
Angler trips 1,378 794 998 594 258 4,022
(805) (324) (877) (395) (159) (1,305)

Appendix 3h.- Boat angler estimated harvest, harvest rate and angling effort, Au Sable River site 250b
(power line to Comins Flats), summer 2000. All estimates are given with 2 SE in parentheses.
Species Catch/hour Apr-Jun7
Jun 8-
Jul 15 Jul 16- Aug 24 Aug 25-Sep 7
Sep 8-
Sep 30 Season
Walleye 0.0031 0 24 0 0 0 24
(0.0050) (0) (38) (0) (0) (0) (38)
Smallmouth bass 0.0094 24 49 0 0 0 73
(0.0133) (39) (94) (0) (0) (0) (102)
Brown trout 0.0167 104 14 8 4 0 130
(0.0114) (79) (22) (17) (8) (0) (84)
Rainbow trout 0.0070 29 20 6 0 0 55
(0.0067) (38) (31) (14) (0) (0) (51)
Brook trout 0.0003 0 2 0 0 0 2
(0.0006) (0) (4) (0) (0) (0) (4)
Total harvest 0.0364 157 109 14 4 0 284
(0.0205) (96) (108) (22) (8) (0) (146)
Angler hours 3,137 1,621 2,024 778 245 7,805
(1,022) (933) (1,033) (383) (242) (1,785)
Angler trips 506 343 312 153 46 1,360
(182) (216) (165) (100) (51) (346)

Appendix 3i.- Shore and wading angler estimated harvest, harvest rate and angling effort, Au Sable
River site 250b (power line to Comins Flats), summer 2000. All estimates are given with 2 SE in
parentheses.
Species Catch/hour Apr-Jun7
Jun 8-
Jul 15 Jul 16- Aug 24 Aug 25-Sep 7
Sep 8-
Sep 30 Season
Smallmouth bass 0.0025 25 0 0 0 0 25
(0.0047) (46) (0) (0) (0) (0) (46)
Brown trout 0.0694 89 25 467 57 43 681
(0.1032) (151) (51) (970) (126) (92) (995)
Rainbow trout 0.0073 58 3 11 0 0 72
(0.0113) (107) (6) (24) (0) (0) (110)
Brook trout 0.0070 0 8 0 61 0 69
(0.0105) (0) (17) (0) (101) (0) (102)
Total harvest 0.0863 172 36 478 118 43 847
(0.1053) (191) (54) (970) (161) (92) (1,007)
Angler hours 3,048 2,082 2,623 1,619 438 9,810
(1,299) (826) (1,902) (1,098) (270) (2,696)
Angler trips 872 451 686 441 212 2,662
(784) (242) (861) (382) (151) (1,258)

Appendix 3j.- Total estimated catch and release, release rate and angling effort, Au Sable River site
250b (power line to Comins Flats), summer 2000. All estimates are given with 2 SE in parentheses. Other
species category may include sunfish, bluegill, suckers, bowfin, redhorse, and catfish.
Species Catch/hour Apr-Jun7
Jun 8-
Jul 15 Jul 16- Aug 24 Aug 25-Sep 7
Sep 8-
Sep 30 Season
Walleye 0.0108 0 11 176 3 0 190
(0.0176) (0) (15) (307) (6) (0) (307)
Rock bass 0.0028 3 7 36 3 0.0028 49
(0.0044) (7) (14) (75) (7) (0.0046) (77)
Smallmouth bass 0.0071 6 33 86 0 0 125
(0.0090) (13) (31) (152) (0) (0) (156)
Brown trout 0.1879 1,210 727 945 273 155 3,310
(0.0741) (633) (321) (879) (201) (140) (1156)
Rainbow trout 0.3696 2,891 1,995 985 473 166 6,510
(0.1115) (1,047) (791) (752) (331) (170) (1,558)
Brook trout 0.0307 70 153 188 70 60 541
(0.0156) (78) (119) (183) (75) (79) (256)
Other 0.0307 76 36 132 295 1 540
(0.0266) (119) (36) (227) (378) (3) (458)
Total catch 0.6395 4,256 2,962 2,548 1,117 382 11,265
(0.1649) (1,232) (863) (1,243) (546) (234) (2,040)
Angler hours 6,185 3,703 4,647 2,397 683 17,615
(1,653) (1,246) (2,164) (1,163) (363) (3,233)
Angler trips 1,378 794 998 594 258 4,022
(805) (324) (877) (395) (159) (1,305)

Appendix 3k.- Boat angler estimated catch and release, release rate and angling effort, AuSable River
site 250b (power line to Comins Flats), summer 2000. All estimates are given with 2 SE in parentheses.
Other species category may include sunfish, bluegill, suckers, bowfin, redhorse, and catfish.
Species Catch/hour Apr-Jun7
Jun 8-
Jul 15 Jul 16- Aug 24 Aug 25-Sep 7
Sep 8-
Sep 30 Season
Walleye 0.0050 0 4 32 3 0 39
(0.0088) (0) (6) (67) (6) (0) (68)
Rock bass 0.0008 3 0 0 3 0 6
(0.0013) (7) (0) (0) (7) (0) (10)
Smallmouth bass 0.0068 6 33 14 0 0 53
(0.0055) (13) (31) (24) (0) (0) (41)
Brown trout 0.1249 393 212 261 70 39 975
(0.0527) (195) (164) (221) (57) (53) (346)
Rainbow trout 0.2997 1,341 572 262 120 44 2,339
(0.1145) (541) (400) (223) (80) (67) (716)
Brook trout 0.0106 11 24 36 7 5 83
(0.0074) (17) (28) (42) (11) (10) (55)
Other 0.0138 11 20 34 42 1 108
(0.0089) (17) (23) (42) (41) (3) (65)
Total catch 0.4616 1,765 865 639 245 89 3,603
(0.1475) (576) (435) (327) (107) (86) (804)
Angler hours 3,137 1,621 2,024 778 245 7,805
(1,022) (933) (1,033) (383) (242) (1,785)
Angler trips 506 343 312 153 46 1,360
(182) (216) (165) (100) (51) (346)

Appendix 3L.- Shore and wading angler estimated catch and release, release rate and angling effort,
Au Sable River site 250b (power line to Comins Flats), summer 2000. All estimates are given with 2 SE in
parentheses. Other species category may include sunfish, bluegill, suckers, bowfin, redhorse, and catfish.
Species Catch/hour Apr-Jun7
Jun 8-
Jul 15 Jul 16- Aug 24 Aug 25-Sep 7
Sep 8-
Sep 30 Season
Walleye 0.0154 0 7 144 0 0 151
(0.0309) (0) (14) (300) (0) (0) (300)
Rock bass 0.0044 0 7 36 0 0 43
(0.0079) (0) (14) (75) (0) (0) (76)
Smallmouth bass 0.0073 0 0 72 0 0 72
(0.0153) (0) (0) (150) (0) (0) (150)
Brown trout 0.2380 817 515 684 203 116 2,335
(0.1301) (602) (276) (851) (193) (130) (1,103)
Rainbow trout 0.4252 1,550 1,423 723 353 122 4,171
(0.1830) (896) (682) (718) (321) (156) (1,382)
Brook trout 0.0467 59 129 152 63 55 458
(0.0285) (76) (116) (178) (74) (78) (250)
Other 0.0440 65 16 98 253 0 432
(0.0478) (118) (28) (223) (376) (0) (454)
Total catch 0.7810 2,491 2,097 1,909 872 293 7,662
(0.2874) (1,089) (746) (1,200) (536) (218) (1,875)
Angler hours 3,048 2,082 2,623 1,619 438 9,810
(1,299) (826) (1,902) (1,098) (270) (2,696)
Angler trips 872 451 686 441 212 2,662
(784) (242) (861) (382) (151) (1,258)

Appendix 4. Page 1 of 12
Appendix 4 . Angler census data: Au Sable River site 251, Comins Flats to McKinley, 1999-2000
Appendix 4a.Total angler harvest, fishing pressure and catch per hour, Au Sable River site 251,
Comins Flats to McKinley, 1999. Two standard errors are given in parenthesis.
Appendix 4b.Total boat angler harvest, fishing pressure and catch per hour, Au Sable River site 251,
Comins Flats to McKinley, 1999. Two standard errors are given in parenthesis.
Appendix 4c.Total shore and wading angler harvest, fishing pressure and catch per hour, Au Sable
River site 251, Comins Flats to McKinley, 1999. Two standard errors are given in parenthesis.
Appendix 4d.Total angler catch and release, fishing pressure and catch per hour, Au Sable River site
251,Comins Flats to McKinley, 1999. Two standard errors are given in parenthesis.
Appendix 4e.Total boat angler catch and release, fishing pressure and catch per hour, Au Sable
River site 251, Comins Flats to McKinley, 1999. Two standard errors are given in parenthesis.
Appendix 4f.Total shore and wading angler catch and release, fishing pressure and catch per hour,
Au Sable River site 251, Comins Flats to McKinley, 1999. Two standard errors are given in parenthesis.
Appendix 4g.- Total estimated harvest, harvest rate and angling effort, Au Sable River site 251
(Comins Flats to McKinley), summer 2000. All estimates are given with 2 SE in parentheses.
Appendix 4h.- Boat angler estimated harvest, harvest rate and angling effort, Au Sable River site
251(Comins Flats to McKinley), summer 2000. All estimates are given with 2 SE in parentheses.
Appendix 4i.- Shore and wading angler estimated harvest, harvest rate and angling effort, Au Sable
River site 251(Comins Flats to McKinley), summer 2000. All estimates are given with 2 SE in
parentheses.
Appendix 4j.- Total estimated catch and release, release rate and angling effort, Au Sable River site
251(Comins Flats to McKinley), summer 2000. All estimates are given with 2 SE in parentheses. Other
species category may include sunfish, bluegill, suckers, bowfin, redhorse, and catfish.
Appendix 4k.- Boat angler estimated catch and release, release rate and angling effort, Au Sable River
site 251(Comins Flats to McKinley), summer 2000. All estimates are given with 2 SE in parentheses.
Other species category may include sunfish, bluegill, suckers, bowfin, redhorse, and catfish.
Appendix 4L.- Shore and wading angler estimated catch and release, release rate and angling effort,
Au Sable River site 251(Comins Flats to McKinley), summer 2000. All estimates are given with 2 SE in
parentheses. Other species category may include sunfish, bluegill, suckers, bowfin, redhorse, and catfish.

Appendix 4. Page 2 of 12
Appendix 4a.Total angler harvest, fishing pressure and catch per hour, Au Sable River site 251, Comins
Flats to McKinley, 1999. Two standard errors are given in parenthesis.
Species Catch/Hour Apr24-Jun7 Jun8-Ju15 Jul16-
Aug24
Aug25-Sep7 Sep8-30 Season
Walleye 0.0017 0 0 12 0 0 12
(0.0031) (0) (0) (22) (0) (0) (22)
Smallmouth 0.0006 0 0 4 0 0 4
Bass (0.0015) (0) (0) (10) (0) (0) (10)
Brown trout 0.0035 20 3 0 1 0 24
(0.0050) (34) (5) (0) (3) (0) (34)
Rainbow
trout
0.0409 185 5 89 2 0 281
(0.0514) (331) (12) (104) (6) (0) (347)
Brook trout 0.0047 32 0 0 0 0 32
(0.0099) (67) (0) (0) (0) (0) (67)
Total harvest 0.0514 237 8 105 3 0 353
(0.0532) (339) (13) (107) (7) (0) (356)
Angler hours 3,005 1,529 1,553 383 395 6,865
(987) (560) (1,027) (237) (364) (1,591)
Angler trips 894 417 387 103 86 1,887
(560) (177) (238) (103) (77) (647)
Appendix 4b.Total boat angler harvest, fishing pressure and catch per hour, Au Sable River site 251,
Comins Flats to McKinley, 1999. Two standard errors are given in parenthesis.
Species Catch/Hour Apr24-Jun7 Jun8-Ju15 Jul16-
Aug24
Aug25-Sep7 Sep8-30 Season
Walleye 0.0036 0 0 12 0 0 12
(0.0067) (0) (0) (22) (0) (0) (22)
Smallmouth 0.0012 0 0 4 0 0 4
Bass (0.0030) (0) (0) (10) (0) (0) (10)
Brown trout 0.0012 0 3 0 1 0 4
(0.0019) (0) (5) (0) (3) (0) (6)
Rainbow tr. 0.0249 3 0 79 2 0 84
(0.0314) (6) (0) (101) (6) (0) (101)
Total catch 0.0308 3 3 95 3 0 104
(0.0332) (6) (5) (104) (7) (0) (105)
Angler hours 1,288 676 1,085 113 210 3,372
(655) (301) (1,002) (122) (328) (1,283)
Angler trips 316 108 218 19 39 700
(169) (51) (205) (20) (63) (278)

Appendix 4. Page 3 of 12
Appendix 4c.Total shore and wading angler harvest, fishing pressure and catch per hour, Au Sable
River site 251, Comins Flats to McKinley, 1999. Two standard errors are given in parenthesis.
Species Catch/Hour Apr24-Jun7 Jun8-Ju15 Jul16-
Aug24
Aug25-Sep7 Sep8-30 Season
Brown trout 0.0057 20 0 0 0 0 20
(0.0098) (34) (0) (0) (0) (0) (34)
Rainbow
trout
0.0564 182 5 10 0 0 197
(0.0963) (331) (12) (23) (0) (0) (332)
Brook trout 0.0092 32 0 0 0 0 32
(0.0194) (67) (0) (0) (0) (0) (67)
Total catch 0.0713 234 5 10 0 0 249
(0.0992) (339) (12) (23) (0) (0) (340)
Angler hours 1,717 853 468 270 185 3,493
(738) (472) (223) (203) (157) (940)
Angler trips 578 309 169 84 47 1,187
(534) (169) (120) (101) (45) (583)

Appendix 4. Page 4 of 12
Appendix 4d.Total angler catch and release, fishing pressure and catch per hour, Au Sable River site
251,Comins Flats to McKinley, 1999. Two standard errors are given in parenthesis.
Species Catch/Hour Apr24-Jun7 Jun8-Ju15 Jul16-
Aug24
Aug25-Sep7 Sep8-30 Season
Walleye 0.0102 6 11 28 25 0 70
(0.0113) (12) (14) (49) (55) (0) (76)
Northern pike 0.0004 3 0 0 0 0 3
(0.0007) (5) (0) (0) (0) (0) (5)
Yellow perch 0.0001 0 0 1 0 0 1
(0.0003) (0) (0) (3) (0) (0) (3)
Smallmouth 0.0109 0 39 12 18 6 75
Bass (0.0116) (0) (71) (15) (25) (16) (78)
Brown trout 0.0540 179 57 55 0 80 371
(0.0304) (133) (40) (51) (0) (120) (190)
Rainbow
trout
0.6696 2,574 1,147 575 60 241 4,597
(0.2845) (1,337) (689) (524) (68) (373) (1,637)
Brook trout 0.0071 0 7 34 8 0 49
(0.0097) (0) (8) (63) (18) (0) (66)
Chub sp. 0.0185 0 0 78 47 2 127
(0.0173) (0) (0) (91) (70) (6) (115)
White sucker 0.0034 0 0 15 8 0 23
(0.0045) (0) (0) (24) (18) (0) (30)
Tiger musky 0.0010 0 0 0 7 0 7
(0.0024) (0) (0) (0) (17) (0) (17)
Total catch 0.7754 2,762 1,261 798 173 329 5,323
(0.3010) (1,344) (694) (541) (119) (392) (1,658)
Angler hours 3,005 1,529 1,553 383 395 6,865
(987) (560) (1,027) (237) (364) (1,591)
Angler trips 894 417 387 103 86 1,887
(560) (177) (238) (103) (77) (647)

Appendix 4. Page 5 of 12
Appendix 4e.Total boat angler catch and release, fishing pressure and catch per hour, Au Sable
River site 251, Comins Flats to McKinley, 1999. Two standard errors are given in parenthesis.
Species Catch/Hour Apr24-Jun7 Jun8-Ju15 Jul16-
Aug24
Aug25-Sep7 Sep8-30 Season
Walleye 0.0133 6 11 28 0 0 45
(0.0162) (12) (14) (49) (0) (0) (52)
Northern pike 0.0009 3 0 0 0 0 3
(0.0015) (5) (0) (0) (0) (0) (5)
Yellow perch 0.0003 0 0 1 0 0 1
(0.0009) (0) (0) (3) (0) (0) (3)
Smallmouth 0.0199 0 39 12 10 6 67
Bass (0.0238) (0) (71) (15) (17) (16) (76)
Brown trout 0.0460 42 37 29 0 47 155
(0.0426) (44) (31) (40) (0) (112) (131)
Rainbow
trout
0.4887 616 374 473 17 168 1,648
(0.2924) (371) (229) (516) (28) (349) (761)
Brook trout 0.0047 0 4 4 8 0 16
(0.0064) (0) (6) (9) (18) (0) (21)
Chub sp. 0.0202 0 0 48 20 0 68
(0.0255) (0) (0) (73) (37) (0) (82)
White sucker 0.0044 0 0 15 0 0 15
(0.0072) (0) (0) (24) (0) (0) (24)
Tiger musky 0.0021 0 0 0 7 0 7
(0.0052) (0) (0) (0) (17) (0) (17)
Total catch 0.6005 667 465 610 62 221 2,025
(0.3258) (374) (242) (526) (55) (367) (783)
Angler hours 1,288 676 1,085 113 210 3,372
(655) (301) (1,002) (122) (328) (1,283)
Angler trips 316 108 218 19 39 700
(169) (51) (205) (20) (63) (278)

Appendix 4. Page 6 of 12
Appendix 4f.Total shore and wading angler catch and release, fishing pressure and catch per hour,
Au Sable River site 251, Comins Flats to McKinley, 1999. Two standard errors are given in parenthesis.
Species Catch/Hour Apr24-Jun7 Jun8-Ju15 Jul16-
Aug24
Aug25-Sep7 Sep8-30 Season
Walleye 0.0072 0 0 0 25 0 25
(0.0160) (0) (0) (0) (55) (0) (55)
Smallmouth 0.0023 0 0 0 8 0 8
Bass (0.0052) (0) (0) (0) (18) (0) (18)
Brown trout 0.0618 137 20 26 0 33 216
(0.0428) (125) (25) (31) (0) (43) (138)
Rainbow
trout
0.8443 1,958 773 102 43 73 2,949
(0.4730) (1,284) (650) (92) (62) (132) (1,449)
Brook trout 0.0094 0 3 30 0 0 33
(0.0178) (0) (6) (62) (0) (0) (62)
Chub sp. 0.0169 0 0 30 27 2 59
(0.0236) (0) (0) (54) (60) (6) (81)
White sucker 0.0023 0 0 0 8 0 8
(0.0052) (0) (0) (0) (18) (0) (18)
Total catch 0.9442 2,095 796 188 111 108 3,298
(0.4894) (1,290) (651) (127) (105) (139) (1,461)
Angler hours 1,717 853 468 270 185 3,493
(738) (472) (223) (203) (157) (940)
Angler trips 578 309 169 84 47 1,187
(534) (169) (120) (101) (45) (583)

Appendix 4. Page 7 of 12
Appendix 4g.- Total estimated harvest, harvest rate and angling effort, Au Sable River site 251
(Comins Flats to McKinley), summer 2000. All estimates are given with 2 SE in parentheses.
Species Catch/hour Apr-Jun7 Jun 8-Jul 15 Jul 16- Aug 24 Aug 25-Sep 7 Sep 8-Sep 30 Season
Walleye 0.0051 3 9 22 0 0 34
(0.0069) (6) (17) (41) (0) (0) (45)
Brown trout 0.0056 6 24 0 0 0 30
(0.0094) (10) (49) (0) (0) (0) (50)
Rainbow trout 0.0035 9 9 0 1 0 19
(0.0043) (15) (17) (0) (4) (0) (23)
Total catch 0.0154 18 42 22 1 0 83
(0.0137) (19) (55) (41) (4) (0) (71)
Angler hours 2,007 1,363 1,271 235 527 5,403
(1,029) (429) (540) (207) (330) (1,299)
Angler trips 448 299 278 52 109 1,186
(262) (135) (133) (54) (82) (338)

Appendix 4. Page 8 of 12
Appendix 4h.- Boat angler estimated harvest, harvest rate and angling effort, Au Sable River site
251(Comins Flats to McKinley), summer 2000. All estimates are given with 2 SE in parentheses.
Species Catch/hour
Apr-
Jun7
Jun 8-Jul
15
Jul 16-
Aug 24
Aug 25-
Sep 7
Sep 8-
Sep 30 Season
Walleye 0.0133 3 9 22 0 0 34
(0.0183) (6) (17) (41) (0) (0) (45)
Brown trout 0.0024 6 0 0 0 0 6
(0.0041) (10) (0) (0) (0) (0) (10)
Rainbow trout 0.0071 9 9 0 0 0 18
(0.0094) (15) (17) (0) (0) (0) (23)
Total catch 0.0228 18 18 22 0 0 58
(0.0217) (19) (24) (41) (0) (0) (51)
Angler hours 935 480 776 89 268 1,415
(690) (258) (501) (97) (241) (737)
Angler trips 180 79 155 16 45 475
(136) (44) (107) (19) (44) (185)

Appendix 4. Page 9 of 12
Appendix 4i.- Shore and wading angler estimated harvest, harvest rate and angling effort, Au Sable
River site 251(Comins Flats to McKinley), summer 2000. All estimates are given with 2 SE in
parentheses.
Species Catch/hour
Apr-
Jun7
Jun 8-Jul
15
Jul 16-
Aug 24
Aug 25-
Sep 7
Sep 8-
Sep 30 Season
Brown trout 0.0084 0 24 0 0 0 24
(0.0174) (0) (49) (0) (0) (0) (49)
Rainbow trout 0.0004 0 0 0 1 0 1
(0.0016) (0) (0) (0) (4) (0) (4)
Total catch 0.0088 0 24 0 1 0 25
(0.0175) (0) (49) (0) (4) (0) (49)
Angler hours 1,072 883 495 146 259 2,855
(764) (343) (201) (183) (225) (909)
Angler trips 268 220 123 36 64 711
(224) (128) (79) (51) (69) (283)

Appendix 4. Page 10 of 12
Appendix 4j.- Total estimated catch and release, release rate and angling effort, Au Sable River site
251(Comins Flats to McKinley), summer 2000. All estimates are given with 2 SE in parentheses. Other
species category may include sunfish, bluegill, suckers, bowfin, redhorse, and catfish.
Species Catch/hour Apr-Jun7 Jun 8-Jul 15 Jul 16- Aug 24 Aug 25-Sep 7 Sep 8-Sep 30 Season
Walleye 0.0053 0 8 0 0 27 35
(0.0098) (0) (17) (0) (0) (62) (64)
Smallmouth bass 0.0021 0 14 0 0 0 14
(0.0033) (0) (22) (0) (0) (0) (22)
Brown trout 0.0925 41 160 86 110 103 500
(0.0589) (42) (183) (82) (173) (124) (295)
Rainbow trout 0.3522 782 493 330 132 166 1,903
(0.1743) (561) (314) (428) (185) (214) (823)
Brook trout 0.0167 18 1 42 3 26 90
(0.0147) (28) (3) (58) (6) (39) (76)
Other 0.0411 6 193 21 2 0 222
(0.0635) (10) (337) (30) (5) (0) (339)
Total catch 0.5116 847 869 479 247 322 2,764
(0.2134) (563) (496) (441) (253) (258) (942)
Angler hours 2,007 1,363 1,271 235 527 5,403
(1,029) (429) (540) (207) (330) (1,299)
Angler trips 448 299 278 52 109 1,186
(262) (135) (133) (54) (82) (338)

Appendix 4. Page 11 of 12
Appendix 4k.- Boat angler estimated catch and release, release rate and angling effort, Au Sable River
site 251(Comins Flats to McKinley), summer 2000. All estimates are given with 2 SE in parentheses.
Other species category may include sunfish, bluegill, suckers, bowfin, redhorse, and catfish.
Species Catch/hour
Apr-
Jun7
Jun 8-Jul
15
Jul 16-
Aug 24
Aug 25-
Sep 7
Sep 8-
Sep 30 Season
Walleye 0.0137 0 8 0 0 27 35
(0.0255) (0) (17) (0) (0) (62) (64)
Smallmouth bass 0.0055 0 14 0 0 0 14
(0.0089) (0) (22) (0) (0) (0) (22)
Brown trout 0.0530 12 41 37 1 44 135
(0.0382) (14) (36) (49) (3) (56) (84)
Rainbow trout 0.2602 205 79 275 12 92 663
(0.2144) (195) (53) (423) (29) (141) (490)
Brook trout 0.0063 0 1 2 3 10 16
(0.0074) (0) (3) (6) (6) (16) (18)
Other 0.0098 3 12 8 2 0 25
(0.0101) (6) (18) (14) (5) (0) (24)
Total catch 0.3485 220 155 322 18 173 888
(0.2347) (196) (72) (426) (30) (165) (503)
Angler hours 935 480 776 89 268 2,548
(690) (258) (501) (97) (241) (928)
Angler trips 180 79 155 16 45 475
(136) (44) (107) (19) (44) (185)

Appendix 4. Page 12 of 12
Appendix 4L.- Shore and wading angler estimated catch and release, release rate and angling effort,
Au Sable River site 251(Comins Flats to McKinley), summer 2000. All estimates are given with 2 SE in
parentheses. Other species category may include sunfish, bluegill, suckers, bowfin, redhorse, and catfish.
Species Catch/hour
Apr-
Jun7
Jun 8-Jul
15
Jul 16-
Aug 24
Aug 25-
Sep 7
Sep 8-
Sep 30 Season
Brown trout 0.1278 29 119 49 109 59 365
(0.1071) (40) (179) (66) (173) (111) (283)
Rainbow trout 0.4343 577 414 55 120 74 1,240
(0.2694) (526) (309) (63) (183) (161) (660)
Brook trout 0.0259 18 0 40 0 16 74
(0.0272) (28) (0) (58) (0) (36) (74)
Other 0.0690 3 181 13 0 0 197
(0.1204) (8) (337) (27) (0) (0) (338)
Total catch 0.6624 1,024 990 200 295 209 2,718
(0.3809) (890) (717) (143) (328) (282) (1,230)
Angler hours 1,744 1,175 633 188 363 4,103
(1,264) (527) (274) (239) (335) (1,456)
Angler trips 268 220 123 36 64 711
(224) (128) (79) (51) (69) (283)

Appendix 5. Page 1of 13
Appendix 5 . Angler census data: Au Sable River site 252, McKinley to 4001 Bridge, 1999-2000
Appendix 5a.Total angler harvest, fishing pressure and catch per hour, Au Sable River site 252,
McKinley to 4001, 1999. Two standard errors are given in parenthesis.
Appendix 5b.Total boat angler harvest, fishing pressure and catch per hour, Au Sable River site 252,
McKinley to 4001, 1999. Two standard errors are given in parenthesis.
Appendix 5c.Total shore and wading angler harvest, fishing pressure and catch per hour, Au Sable
River site 252, McKinley to 4001, 1999. Two standard errors are given in parenthesis.
Appendix 5d.Total angler catch and release, fishing pressure and catch per hour, Au Sable River site
252, McKinley to 4001, 1999. Two standard errors are given in parenthesis.
Appendix 5e.Total boat angler catch and release, fishing pressure and catch per hour, Au Sable
River site 252, McKinley to 4001, 1999. Two standard errors are given in parenthesis.
Appendix 5f.Total shore and wading angler catch and release, fishing pressure and catch per hour,
Au Sable River site 252, McKinley to 4001, 1999. Two standard errors are given in parenthesis.
Appendix 5g.- Total estimated harvest, harvest rate and angling effort, Au Sable River site 252
(McKinley to 4001 Bridge), summer 2000. All estimates are given with 2 SE in parentheses. Other species
category may include sunfish, bluegill, suckers, bowfin, redhorse, and catfish.
Appendix 5h.- Boat angler estimated harvest, harvest rate and angling effort, Au Sable River site
252(McKinley to 4001 Bridge), summer 2000. All estimates are given with 2 SE in parentheses. Other
species category may include sunfish, bluegill, suckers, bowfin, redhorse, and catfish.
Appendix 5i.- Shore and wading angler estimated harvest, harvest rate and angling effort, Au Sable
River site 252(McKinley to 4001 Bridge), summer 2000. All estimates are given with 2 SE in parentheses.
Appendix 5j.- Total estimated catch and release, release rate and angling effort, Au Sable River site
252(McKinley to 4001 Bridge), summer 2000. All estimates are given with 2 SE in parentheses. Other
species category may include sunfish, bluegill, suckers, bowfin, redhorse, and catfish.
Appendix 5k.- Boat angler estimated catch and release, release rate and angling effort, Au Sable River
site 252(McKinley to 4001 Bridge), summer 2000. All estimates are given with 2 SE in parentheses. Other
species category may include sunfish, bluegill, suckers, bowfin, redhorse, and catfish.
Appendix 5L.- Shore and wading angler estimated catch and release, release rate and angling effort,
Au Sable River site 252(McKinley to 4001 Bridge), summer 2000. All estimates are given with 2 SE in
parentheses. Other species category may include sunfish, bluegill, suckers, bowfin, redhorse, and catfish.

Appendix 5. Page 2of 13
Appendix 5a.Total angler harvest, fishing pressure and catch per hour, Au Sable River site 252,
McKinley to 4001, 1999. Two standard errors are given in parenthesis.
Species Catch/Hour Apr24-Jun7 Jun8-Ju15 Jul16-
Aug24
Aug25-Sep7 Sep8-30 Season
Walleye 0.0030 0 14 2 0 0 16
(0.0040) (0) (21) (3) (0) (0) (21)
Rock bass 0.0076 40 0 0 0 0 40
(0.0155) (81) (0) (0) (0) (0) (81)
Largemouth 0.0013 0 7 0 0 0 7
Bass (0.0030) (0) (16) (0) (0) (0) (16)
Smallmouth 0.0002 0 0 0 1 0 1
Bass (0.0004) (0) (0) (0) (2) (0) (2)
Brown trout 0.0409 170 3 10 1 32 216
(0.0353) (169) (7) (21) (2) (62) (181)
Rainbow
trout
0.1958 857 78 78 0 22 1,035
(0.0885) (396) (55) (102) (0) (46) (415)
Brook trout 0.0019 3 7 0 0 0 10
(0.0029) (1) (15) (0) (0) (0) (15)
White sucker 0.0144 46 7 23 0 0 76
(0.0207) (94) (16) (50) (0) (0) (108)
Bowfin 0.0002 0 0 0 1 0 1
(0.0004) (0) (0) (0) (2) (0) (2)
Total harvest 0.2652 1,116 116 113 3 54 1,402
(0.1054) (448) (65) (116) (3) (77) (474)
Angler hours 2,922 799 1,109 207 250 5,287
(709) (341) (713) (224) (205) (1,104)
Angler trips 1,094 343 423 48 139 2,047
(624) (173) (283) (71) (146) (725)

Appendix 5. Page 3of 13
Appendix 5b.Total boat angler harvest, fishing pressure and catch per hour, Au Sable River site 252,
McKinley to 4001, 1999. Two standard errors are given in parenthesis.
Species Catch/Hour Apr24-Jun7 Jun8-Ju15 Jul 16-
Aug24
Aug25-Sep7 Sep8-30 Season
Brown trout 0.0366 40 3 10 0 31 84
(0.0380) (47) (7) (21) (0) (62) (81)
Rainbow
trout
0.1645 239 41 76 0 21 377
(0.1108) (172) (42) (102) (0) (46) (209)
Brook trout 0.0031 0 7 0 0 0 7
(0.0067) (0) (15) (0) (0) (0) (15)
Total harvest 0.2042 279 51 86 0 52 468
(0.1255) (178) (45) (104) (0) (77) (225)
Angler hours 853 418 755 137 129 2,292
(417) (257) (681) (210) (150) (878)
Angler trips 146 65 143 23 22 399
(84) (41) (149) (36) (26) (181)

Appendix 5. Page 4of 13
Appendix 5c.Total shore and wading angler harvest, fishing pressure and catch per hour, Au Sable
River site 252, McKinley to 4001, 1999. Two standard errors are given in parenthesis.
Species Catch/Hour Apr24-Jun7 Jun8-Ju15 Jul16-
Aug24
Aug25-Sep7 Sep8-30 Season
Walleye 0.0053 0 14 2 0 0 16
(0.0071) (0) (21) (3) (0) (0) (21)
Rock bass 0.0134 40 0 0 0 0 40
(0.0273) (81) (0) (0) (0) (0) (81)
Largemouth 0.0023 0 7 0 0 0 7
Bass (0.0053) (0) (16) (0) (0) (0) (16)
Smallmouth 0.0003 0 0 0 1 0 1
Bass (0.0006) (0) (0) (0) (2) (0) (2)
Brown trout 0.0441 130 0 0 1 1 132
(0.0550) (162) (0) (0) (2) (2) (162)
Rainbow
trout
0.2197 618 37 2 0 1 658
(0.1296) (357) (35) (3) (0) (2) (359)
Brook trout 0.0010 3 0 0 0 0 3
(0.0004) (1) (0) (0) (0) (0) (1)
White sucker 0.0254 46 7 23 0 0 76
(0.0365) (94) (16) (50) (0) (0) (108)
Bowfin 0.0003 0 0 0 1 0 1
(0.0006) (0) (0) (0) (2) (0) (2)
Total harvest 0.3119 837 65 27 3 2 934
(0.1558) (411) (47) (50) (3) (3) (417)
Angler hours 2,069 381 354 70 121 2,995
(573) (224) (211) (78) (140) (670)
Angler trips 948 278 280 25 117 1,648
(618) (168) (241) (61) (144) (702)

Appendix 5. Page 5of 13
Appendix 5d.Total angler catch and release, fishing pressure and catch per hour, Au Sable River site
252, McKinley to 4001, 1999. Two standard errors are given in parenthesis.
Species Catch/Hour Apr24-Jun7 Jun8-Ju15 Jul16-
Aug24
Aug25-Sep7 Sep8-30 Season
Walleye 0.0059 5 7 8 0 11 31
(0.0073) (12) (14) (10) (0) (32) (38)
Northern pike 0.0036 19 0 0 0 0 19
(0.0074) (39) (0) (0) (0) (0) (39)
Rock bass 0.0011 0 0 6 0 0 6
(0.0024) (0) (0) (13) (0) (0) (13)
Smallmouth 0.0061 0 5 21 6 0 32
Bass (0.0064) (0) (8) (29) (14) (0) (33)
Brown trout 0.0968 16 43 451 2 0 512
(0.1322) (23) (41) (689) (5) (0) (691)
Rainbow
trout
0.3959 1,345 333 413 2 0 2,093
(0.1852) (573) (530) (397) (5) (0) (876)
Brook trout 0.0183 8 7 7 75 0 97
(0.0211) (16) (9) (16) (107) (0) (110)
White sucker 0.0078 0 18 23 0 0 41
(0.0087) (0) (30) (34) (0) (0) (45)
Chub sp. 0.0070 0 0 35 2 0 37
(0.0143) (0) (0) (75) (5) (0) (75)
Total catch 0.5425 1,393 413 964 87 11 2,868
(0.2412) (575) (533) (800) (108) (32) (1,126)
Angler hours 2,922 799 1,109 207 250 5,287
(709) (341) (713) (224) (205) (1,104)
Angler trips 1,094 343 423 48 139 2,047
(624) (173) (283) (71) (146) (725)

Appendix 5. Page 6of 13
Appendix 5e.Total boat angler catch and release, fishing pressure and catch per hour, Au Sable
River site 252, McKinley to 4001, 1999. Two standard errors are given in parenthesis.
Species Catch/Hour Apr24-Jun7 Jun8-Ju15 Jul16-
Aug24
Aug25-Sep7 Sep8-30 Season
Walleye 0.0057 5 0 8 0 0 13
(0.0073) (12) (0) (10) (0) (0) (16)
Rock bass 0.0026 0 0 6 0 0 6
(0.0057) (0) (0) (13) (0) (0) (13)
Smallmouth 0.0140 0 5 21 6 0 32
Bass (0.0154) (0) (8) (29) (14) (0) (33)
Brown trout 0.2120 0 43 441 2 0 486
(0.3118) (0) (41) (689) (5) (0) (690)
Rainbow
trout
0.2853 230 83 339 2 0 654
(0.2308) (248) (83) (386) (5) (0) (466)
Brook trout 0.0100 0 6 7 10 0 23
(0.0132) (0) (9) (16) (23) (0) (29)
White sucker 0.0017 0 0 4 0 0 4
(0.0043) (0) (0) (10) (0) (0) (10)
Chub sp. 0.0161 0 0 35 2 0 37
(0.0332) (0) (0) (75) (5) (0) (75)
Total catch 0.5476 235 137 861 22 0 1,255
(0.4212) (248) (93) (794) (28) (0) (837)
Angler hours 853 418 755 137 129 2,292
(417) (257) (681) (210) (150) (878)
Angler trips 146 65 143 23 22 399
(84) (41) (149) (36) (26) (181)

Appendix 5. Page 7of 13
Appendix 5f.Total shore and wading angler catch and release, fishing pressure and catch per hour,
Au Sable River site 252, McKinley to 4001, 1999. Two standard errors are given in parenthesis.
Species Catch/Hour Apr24-Jun7 Jun8-Ju15 Jul16-
Aug24
Aug25-Sep7 Sep8-30 Season
Walleye 0.0060 0 7 0 0 11 18
(0.0117) (0) (14) (0) (0) (32) (35)
Northern pike 0.0063 19 0 0 0 0 19
(0.0130) (39) (0) (0) (0) (0) (39)
Brown trout 0.0087 16 0 10 0 0 26
(0.0099) (23) (0) (17) (0) (0) (29)
Rainbow
trout
0.4805 1,115 250 74 0 0 1,439
(0.2695) (516) (523) (91) (0) (0) (740)
Brook trout 0.0247 8 1 0 65 0 74
(0.0358) (16) (3) (0) (105) (0) (106)
White sucker 0.0124 0 18 19 0 0 37
(0.0150) (0) (30) (32) (0) (0) (44)
Total catch 0.5386 1,158 276 103 65 11 1,613
(0.2782) (518) (524) (98) (105) (32) (751)
Angler hours 2,069 381 354 70 121 2,995
(573) (224) (211) (78) (140) (670)
Angler trips 948 278 280 25 117 1,648
(618) (168) (241) (61) (144) (702)

Appendix 5. Page 8of 13
Appendix 5g.- Total estimated harvest, harvest rate and angling effort, Au Sable River site 252
(McKinley to 4001 Bridge), summer 2000. All estimates are given with 2 SE in parentheses. Other species
category may include sunfish, bluegill, suckers, bowfin, redhorse, and catfish.
Species Catch/hour
Apr-
Jun 7
Jun 8-
Jul 15 Jul 16-Aug 24 Aug 25-Sep 7 Sep 8-30 Season
Walleye 0.0024 16 1 0 0 0 17
(0.0048) (34) (3) (0) (0) (0) (34)
Brown trout 0.0110 53 24 0 0 0 77
(0.0107) (56) (47) (0) (0) (0) (73)
Rainbow trout 0.0105 20 21 27 5 0 73
(0.0090) (34) (22) (42) (12) (0) (60)
Brook trout 0.0001 0 1 0 0 0 1
(0.0003) (0) (3) (0) (0) (0) (3)
Other 0.0004 0 0 3 0 0 3
(0.0009) (0) (0) (7) (0) (0) (7)
Total harvest 0.0245 89 47 30 5 0 171
(0.0156) (74) (52) (43) (12) (0) (101)
Angler hours 2,651 2,017 1,518 415 377 6,978
(1,042) (698) (951) (248) (356) (1,633)
Angler trips 969 872 436 161 127 2,565
(582) (403) (262) (114) (139) (776)

Appendix 5. Page 9of 13
Appendix 5h.- Boat angler estimated harvest, harvest rate and angling effort, Au Sable River site
252(McKinley to 4001 Bridge), summer 2000. All estimates are given with 2 SE in parentheses. Other
species category may include sunfish, bluegill, suckers, bowfin, redhorse, and catfish.
Species Catch/hour
Apr-
Jun 7
Jun 8-
Jul 15 Jul 16-Aug 24 Aug 25-Sep 7 Sep 8-30 Season
Walleye 0.0003 0 1 0 0 0 1
(0.0009) (0) (3) (0) (0) (0) (3)
Brown trout 0.0038 11 2 0 0 0 13
(0.0049) (15) (4) (0) (0) (0) (16)
Rainbow trout 0.0136 5 14 27 0 0 46
(0.0147) (10) (19) (42) (0) (0) (47)
Brook trout 0.0003 0 1 0 0 0 1
(0.0009) (0) (3) (0) (0) (0) (3)
Other 0.0009 0 0 3 0 0 3
(0.0021) (0) (0) (7) (0) (0) (7)
Total harvest 0.0189 16 18 30 0 0 64
(0.0165) (18) (20) (43) (0) (0) (51)
Angler hours 1,247 722 1,038 179 204 3,390
(591) (427) (900) (186) (273) (1,204)
Angler trips 214 176 178 34 34 636
(112) (113) (182) (35) (45) (248)

Appendix 5. Page 10of 13
Appendix 5i.- Shore and wading angler estimated harvest, harvest rate and angling effort, Au Sable
River site 252(McKinley to 4001 Bridge), summer 2000. All estimates are given with 2 SE in parentheses.
Species Catch/hour
Apr-
Jun 7
Jun 8-
Jul 15 Jul 16-Aug 24 Aug 25-Sep 7 Sep 8-30 Season
Walleye 0.0045 16 0 0 0 0 16
(0.0097) (34) (0) (0) (0) (0) (34)
Brown trout 0.0178 42 22 0 0 0 64
(0.0208) (54) (47) (0) (0) (0) (72)
Rainbow trout 0.0075 15 7 0 5 0 27
(0.0103) (32) (11) (0) (12) (0) (36)
Total harvest 0.0298 73 29 0 5 0 107
(0.0259) (71) (48) (0) (12) (0) (87)
Angler hours 1,404 1,295 480 236 173 3,588
(858) (552) (306) (164) (228) (1,102)
Angler trips 755 696 258 127 93 1,929
(571) (387) (189) (109) (131) (735)
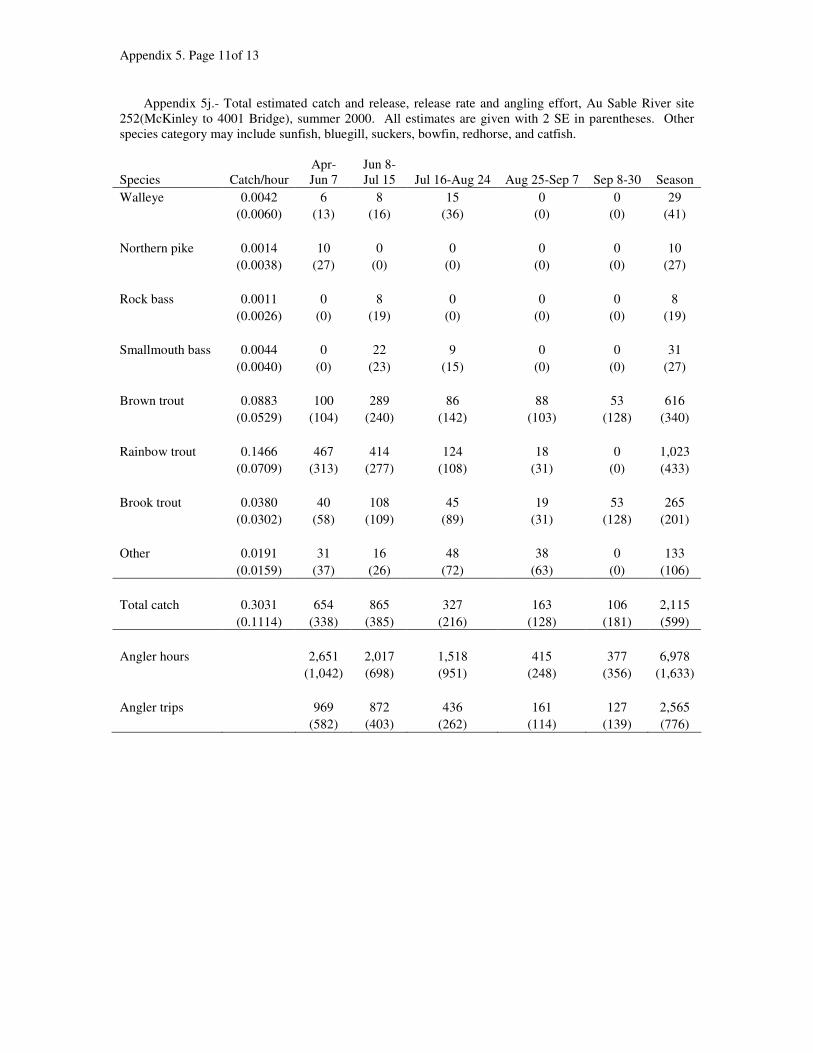
Appendix 5. Page 11of 13
Appendix 5j.- Total estimated catch and release, release rate and angling effort, Au Sable River site
252(McKinley to 4001 Bridge), summer 2000. All estimates are given with 2 SE in parentheses. Other
species category may include sunfish, bluegill, suckers, bowfin, redhorse, and catfish.
Species Catch/hour
Apr-
Jun 7
Jun 8-
Jul 15 Jul 16-Aug 24 Aug 25-Sep 7 Sep 8-30 Season
Walleye 0.0042 6 8 15 0 0 29
(0.0060) (13) (16) (36) (0) (0) (41)
Northern pike 0.0014 10 0 0 0 0 10
(0.0038) (27) (0) (0) (0) (0) (27)
Rock bass 0.0011 0 8 0 0 0 8
(0.0026) (0) (19) (0) (0) (0) (19)
Smallmouth bass 0.0044 0 22 9 0 0 31
(0.0040) (0) (23) (15) (0) (0) (27)
Brown trout 0.0883 100 289 86 88 53 616
(0.0529) (104) (240) (142) (103) (128) (340)
Rainbow trout 0.1466 467 414 124 18 0 1,023
(0.0709) (313) (277) (108) (31) (0) (433)
Brook trout 0.0380 40 108 45 19 53 265
(0.0302) (58) (109) (89) (31) (128) (201)
Other 0.0191 31 16 48 38 0 133
(0.0159) (37) (26) (72) (63) (0) (106)
Total catch 0.3031 654 865 327 163 106 2,115
(0.1114) (338) (385) (216) (128) (181) (599)
Angler hours 2,651 2,017 1,518 415 377 6,978
(1,042) (698) (951) (248) (356) (1,633)
Angler trips 969 872 436 161 127 2,565
(582) (403) (262) (114) (139) (776)

Appendix 5. Page 12of 13
Appendix 5k.- Boat angler estimated catch and release, release rate and angling effort, Au Sable River
site 252(McKinley to 4001 Bridge), summer 2000. All estimates are given with 2 SE in parentheses. Other
species category may include sunfish, bluegill, suckers, bowfin, redhorse, and catfish.
Species Catch/hour
Apr-
Jun 7
Jun 8-
Jul 15 Jul 16-Aug 24 Aug 25-Sep 7 Sep 8-30 Season
Walleye 0.0065 6 1 15 0 0 22
(0.0115) (13) (3) (36) (0) (0) (38)
Northern pike 0.0029 10 0 0 0 0 10
(0.0079) (27) (0) (0) (0) (0) (27)
Rock bass 0.0024 0 8 0 0 0 8
(0.0058) (0) (19) (0) (0) (0) (19)
Smallmouth bass 0.0053 0 15 3 0 0 18
(0.0056) (0) (17) (5) (0) (0) (18)
Brown trout 0.0177 5 43 4 8 0 60
(0.0191) (10) (56) (9) (19) (0) (61)
Rainbow trout 0.1327 172 178 96 4 0 450
(0.0790) (116) (150) (101) (9) (0) (215)
Brook trout 0.0100 0 31 3 0 0 34
(0.0148) (0) (48) (7) (0) (0) (49)
Other 0.0215 8 5 48 12 0 73
(0.0248) (17) (9) (72) (28) (0) (80)
Total catch 0.1991 201 281 169 24 0 675
(0.1017) (121) (169) (130) (35) (0) (248)
Angler hours 1,247 722 1,038 179 204 3,390
(591) (427) (900) (186) (273) (1,204)
Angler trips 214 176 178 34 34 636
(112) (113) (182) (35) (45) (248)

Appendix 5. Page 13of 13
Appendix 5L.- Shore and wading angler estimated catch and release, release rate and angling effort,
Au Sable River site 252(McKinley to 4001 Bridge), summer 2000. All estimates are given with 2 SE in
parentheses. Other species category may include sunfish, bluegill, suckers, bowfin, redhorse, and catfish.
Species Catch/hour
Apr-
Jun 7
Jun 8-
Jul 15 Jul 16-Aug 24 Aug 25-Sep 7 Sep 8-30 Season
Walleye 0.0020 0 7 0 0 0 7
(0.0046) (0) (16) (0) (0) (0) (16)
Smallmouth bass 0.0036 0 7 6 0 0 13
(0.0059) (0) (16) (14) (0) (0) (21)
Brown trout 0.1550 95 246 82 80 53 556
(0.1046) (104) (233) (142) (101) (128) (334)
Rainbow trout 0.1597 295 236 28 14 0 573
(0.1157) (291) (233) (37) (30) (0) (376)
Brook trout 0.0644 40 77 42 19 53 231
(0.0581) (58) (98) (89) (31) (128) (196)
Other 0.0167 23 11 0 26 0 60
(0.0199) (33) (24) (0) (56) (0) (69)
Total harvest 0.4013 453 584 158 139 106 1,440
(0.1954) (316) (345) (172) (123) (181) (544)
Angler hours 1,404 1,295 480 236 173 3,588
(858) (552) (306) (164) (228) (1,102)
Angler trips 755 696 258 127 93 1,929
(571) (387) (189) (109) (131) (735)