Embed Size (px)
Citation preview
Au Sable River Assessment
196
Figure 1.–Major tributaries of the Au Sable River.
Lak
e H
uro
n
Oscoda
Glennie
Barton CityLincoln
SouthBranch
Mc Kinley
Fairview
Luzerne
St. Helen
Roscommon
Grayling
Frederic
Waters
Gaylord
Lewiston
Lovells
Mio
N
EW
S
1
3
4
5
6
7
8
9 10
11
12
13
1415
16
17
1819
20
30
34
35
36
37
38
39
40
41
42
43
44
45
46
47 48
49
50
51
52
53
5455
56
57
58 5960
61
6263
64 65
66
676869
70 71
74
72
73
75
76
77 78
7980
82
81
31
32 33
21
22
23
24
25
26
2728
292
0 10
MILES
Au Sable River Assessment
197
1. Kolke Creek 2. Bradford Creek 3. Au Sable River 4. East Branch Au Sable River 5. Shellenbarger Creek 6. Barker Creek 7. Wakeley Creek 8. Marsh Creek 9. South Branch Au Sable River 10. South Creek 11. East Creek 12. Hudson Creek 13. Robinson Creek 14. Beaver Creek 15. Hickey Creek 16. Thayer Creek 17. Douglas Creek 18. Sauger Creek 19. White Creek 20. Grace Creek 21. Conner’s Creek 22. North Branch Au Sable River 23. Chub Creek 24. Turtle Creek 25. Crapo Creek 26. East Branch Big Creek - North 27. Wright Creek 28. Middle Branch Big Creek - North 29. West Branch Big Creek - North 30. Gammy Creek 31. Whitewater Creek 32. Sohn Creek 33. Beaver Creek 34. West Branch Big Creek - South 35. Hunt Creek 36. East Branch Big Creek - South 37. Red Creek 38. Lost Creek 39. Antler Creek 40. Honeywell Creek 41. Wolf Creek
42. Cherry Creek 43. Loud Creek 44. Perry Creek 45. Gusler Creek 46. Cauchy Creek 47. Comins Creek 48. Glennie Creek 49. Nine Mile Creek 50. Blockhouse Creek 51. Wilbur Creek 52. Bamfield Creek 53. Smith Creek 54. Hoppy Creek 55. Stewart Creek 56. Mink Creek 57. Harper Creek 58. Au Sable Creek 59. South Branch River 60. Stuart Creek 61. Wildcat Creek 62. East Branch Pine River 63. West Branch Pine River 64. Loud Creek 65. Backus Creek 66. Bryant Creek 67. Wallace Creek 68. Kurtz Creek 69. Samyn Creek 70. McGillis Creek 71. Gimlet Creek 72. South Branch Pine River 73. McDonald Creek 74. Roy Creek 75. Grey Creek 76. Van Etten Creek 77. Duval Creek 78. Hill Creek 79. Coppler Creek 80. Pine River (Van Etten Creek) 81. Old Au Sable River 82. State Ditch
Au Sable River Assessment
198
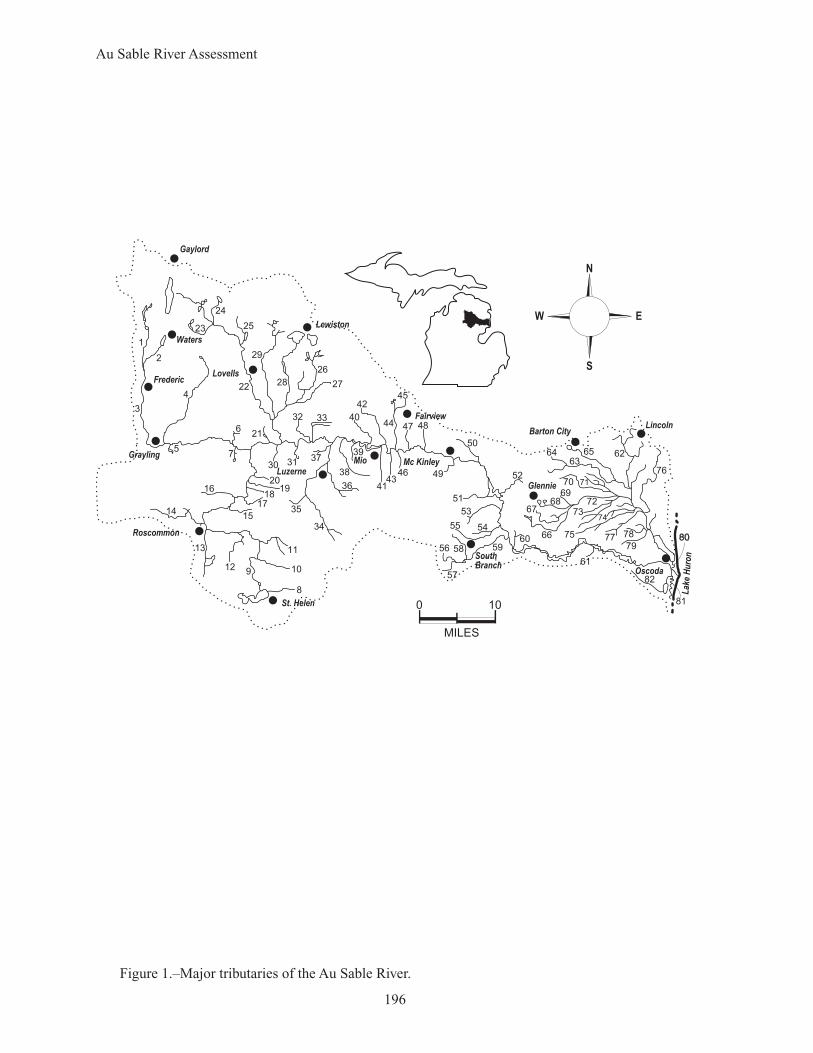
Figure 2.–General sites and river valley segments within the Au Sable River watershed. The dams shown here form ponds having the same name. Roads for differently named bridges are: Kellogg’s Bridge = F32; Smith’s Bridge = M-72; Parmalee Bridge = County Road 485.
Au Sable River Valley SegmentsHeadwaters to Wakeley Bridge
Wakeley Bridge to Mio Pond
Mio Pond to McKinley Bridge
McKinley Bridge to Five Channels Dam
Five Channels Dam to Foote Dam
Foote Dam to Lake Huron
Lake H
uro
n
Oscoda
Glennie
Barton CityLincoln
SouthBranch
Mc Kinley
Fairview
Luzerne
St. Helen
Roscommon
Grayling
Frederic
Waters
Gaylord
Lewiston
Lovells
Mio
N
EW
S
Otsego Lake
North Branch Au Sable
West Twin Lake
Big Creek - North
F32
Parmalee Bridge
Mio Dam
McKinley Bridge
Pine River
Van Etten Lake
Alcona Dam
Co. Rd. 487 Bridge
Big Creek - South
Lake St. Helen
Chase BridgeSmith's Bridge
Wakeley Bridge
South BranchAu Sable
GraylingDam
Stephan Bridge
Kellogg'sBridge
Co. Rd.612
Loud DamFive Channels Dam
Cooke Dam
Foote Dam
US - 23 Bridge
0 10
MILES
Au Sable River Assessment
199
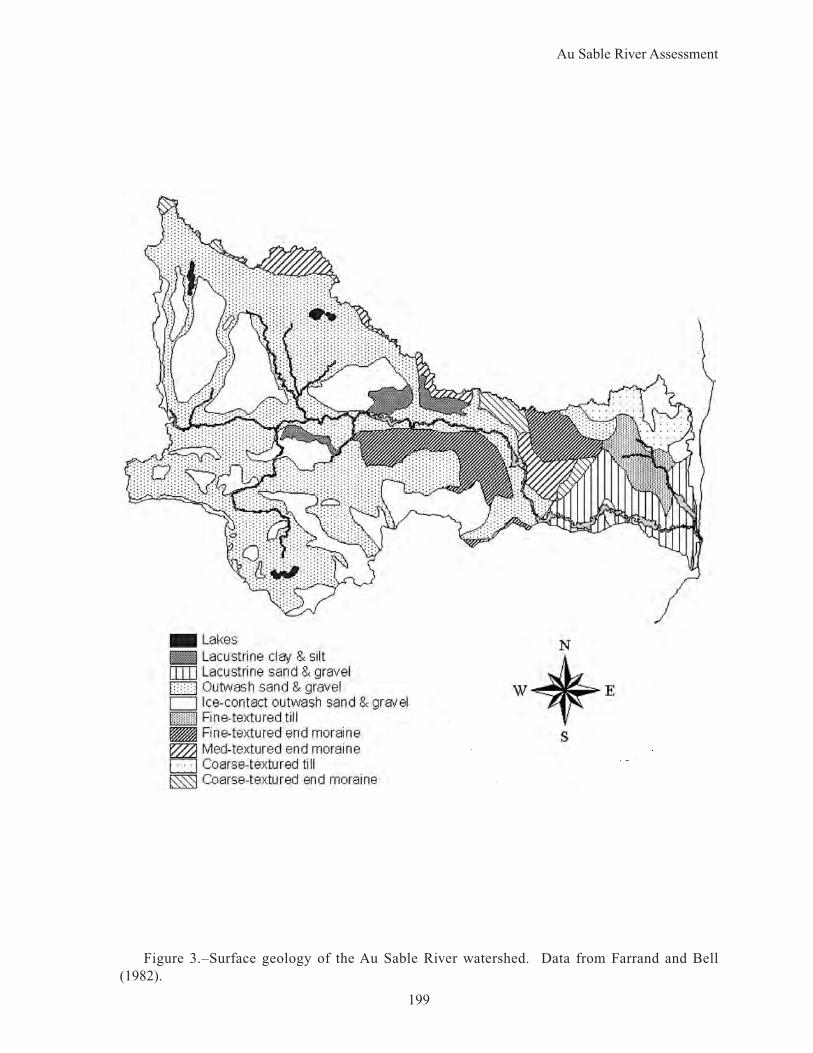
Figure 3.–Surface geology of the Au Sable River watershed. Data from Farrand and Bell (1982).
Au Sable River Assessment
200
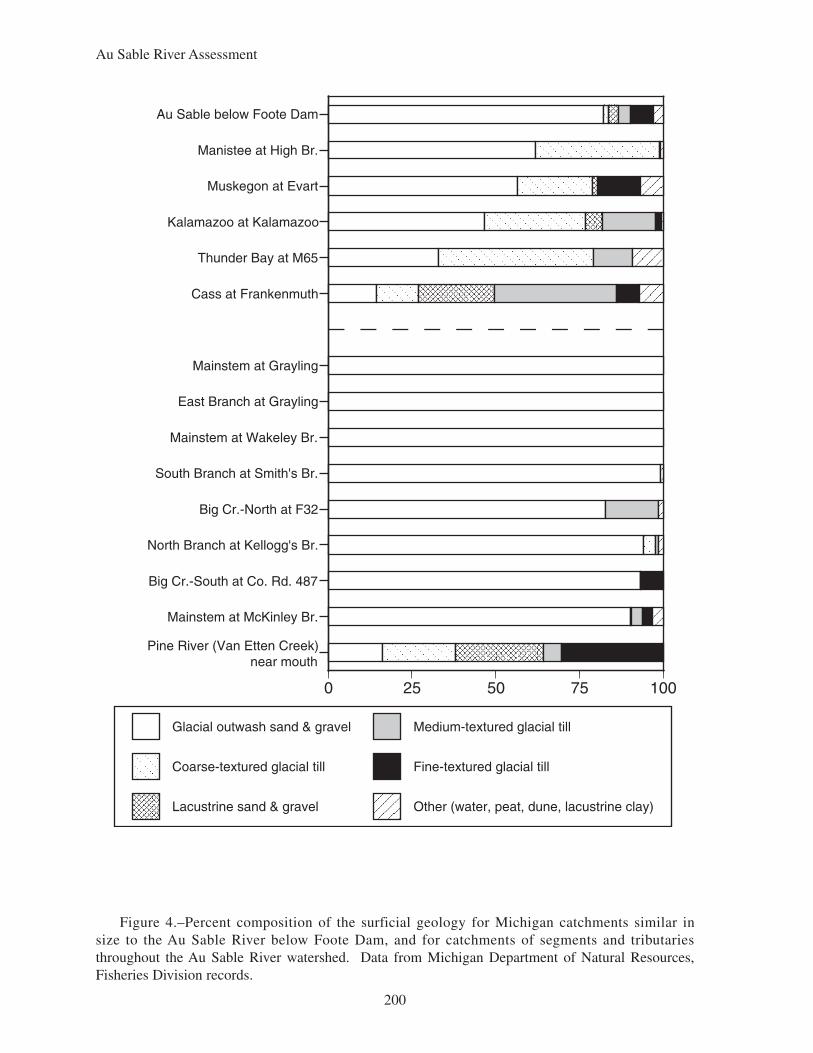
Figure 4.–Percent composition of the surficial geology for Michigan catchments similar in size to the Au Sable River below Foote Dam, and for catchments of segments and tributaries throughout the Au Sable River watershed. Data from Michigan Department of Natural Resources, Fisheries Division records.
Pine River (Van Etten Creek)near mouth
Mainstem at McKinley Br.
Big Cr.-South at Co. Rd. 487
North Branch at Kellogg's Br.
Big Cr.-North at F32
South Branch at Smith's Br.
Mainstem at Wakeley Br.
East Branch at Grayling
Mainstem at Grayling
Cass at Frankenmuth
Thunder Bay at M65
Kalamazoo at Kalamazoo
Muskegon at Evart
Manistee at High Br.
Au Sable below Foote Dam
0 25 50 75 100
Glacial outwash sand & gravel
Coarse-textured glacial till
Lacustrine sand & gravel
Medium-textured glacial till
Fine-textured glacial till
Other (water, peat, dune, lacustrine clay)
Au Sable River Assessment
201
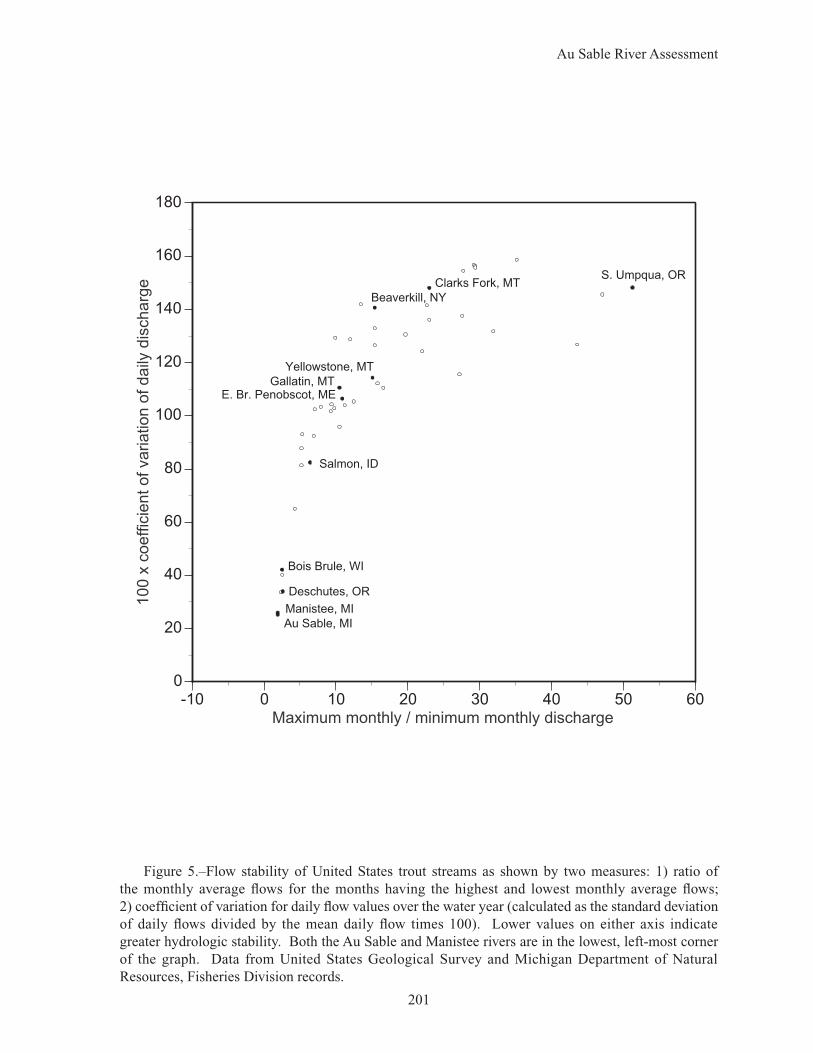
Figure 5.–Flow stability of United States trout streams as shown by two measures: 1) ratio of the monthly average flows for the months having the highest and lowest monthly average flows; 2) coefficient of variation for daily flow values over the water year (calculated as the standard deviation of daily flows divided by the mean daily flow times 100). Lower values on either axis indicate greater hydrologic stability. Both the Au Sable and Manistee rivers are in the lowest, left-most corner of the graph. Data from United States Geological Survey and Michigan Department of Natural Resources, Fisheries Division records.
0
20
40
60
80
100
120
140
160
180
-10 0 10 20 30 40 50 60
100 x
coeffic
ient of variation o
f da
ily d
ischarg
e
Maximum monthly / minimum monthly discharge
Au Sable, MI
Manistee, MI
Bois Brule, WI
Deschutes, OR
Salmon, ID
Gallatin, MTE. Br. Penobscot, ME
Yellowstone, MT
Clarks Fork, MT
Beaverkill, NY
S. Umpqua, OR
Au Sable River Assessment
202
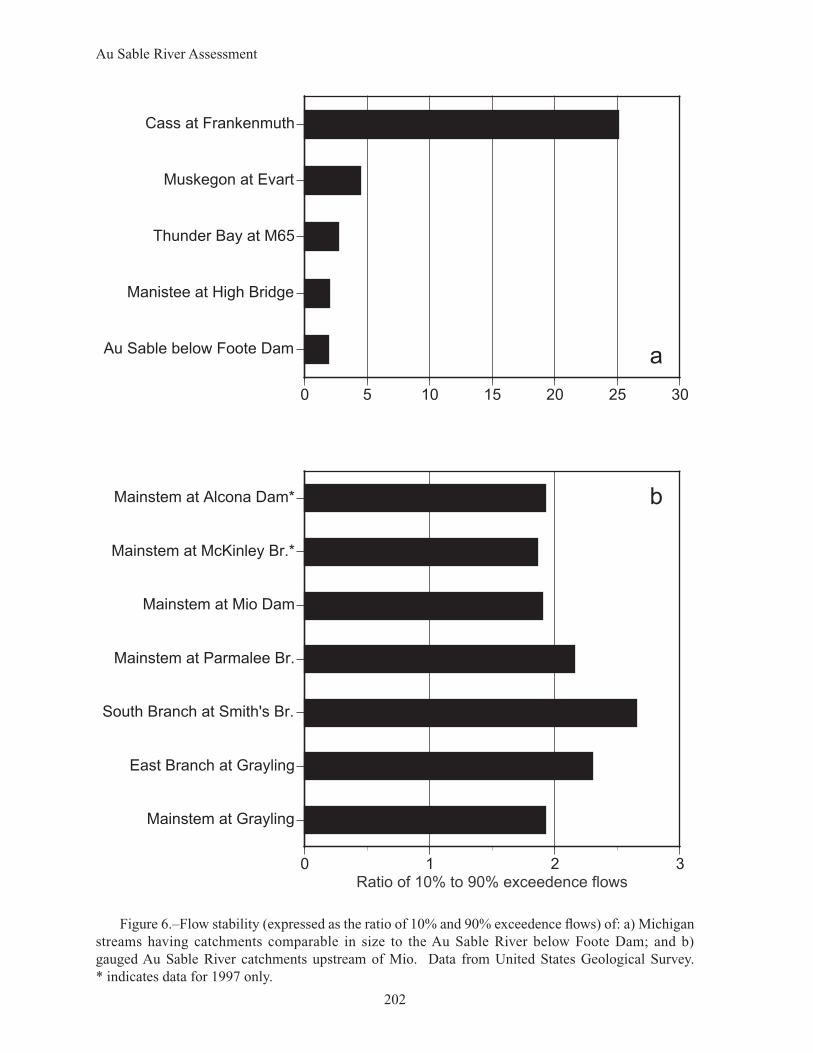
Figure 6.–Flow stability (expressed as the ratio of 10% and 90% exceedence flows) of: a) Michigan streams having catchments comparable in size to the Au Sable River below Foote Dam; and b) gauged Au Sable River catchments upstream of Mio. Data from United States Geological Survey. * indicates data for 1997 only.
Au Sable below Foote Dam
Manistee at High Bridge
Thunder Bay at M65
Muskegon at Evart
Cass at Frankenmuth
0 5 10 15 20 25 30
Mainstem at Grayling
East Branch at Grayling
South Branch at Smith's Br.
Mainstem at Parmalee Br.
Mainstem at Mio Dam
Mainstem at McKinley Br.*
Mainstem at Alcona Dam*
0 1 2 3Ratio of 10% to 90% exceedence flows
b
a
Au Sable River Assessment
203
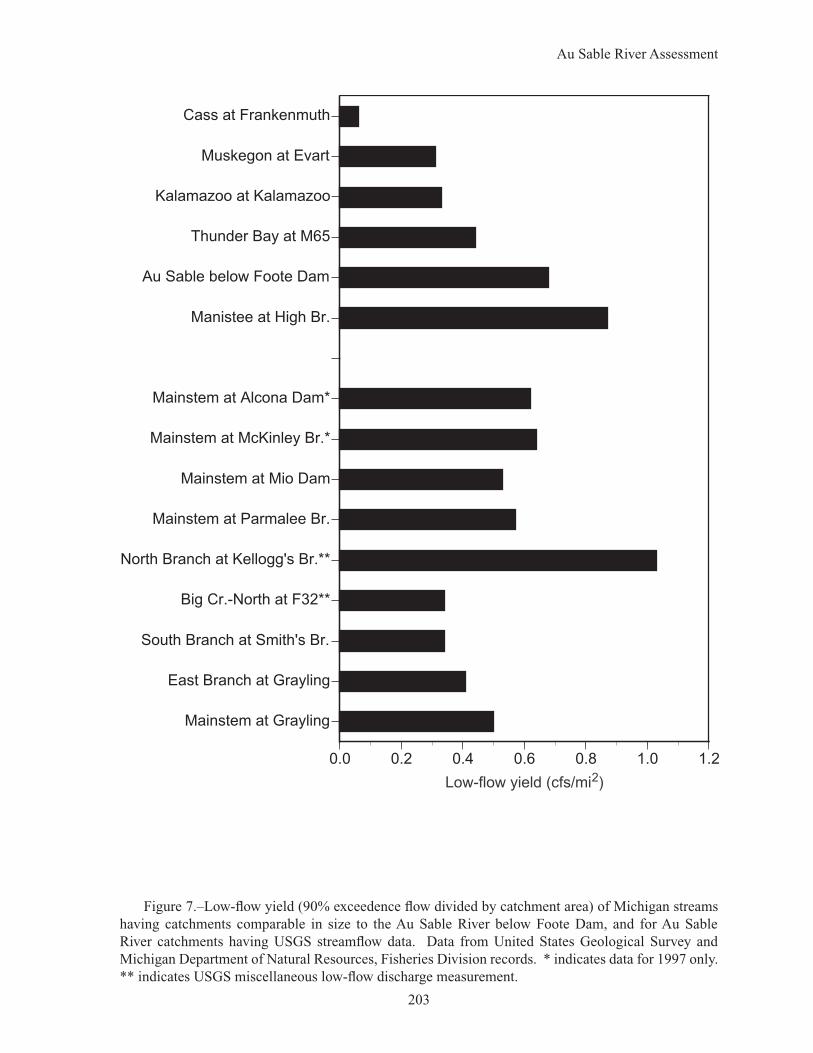
Figure 7.–Low-flow yield (90% exceedence flow divided by catchment area) of Michigan streams having catchments comparable in size to the Au Sable River below Foote Dam, and for Au Sable River catchments having USGS streamflow data. Data from United States Geological Survey and Michigan Department of Natural Resources, Fisheries Division records. * indicates data for 1997 only. ** indicates USGS miscellaneous low-flow discharge measurement.
Mainstem at Grayling
East Branch at Grayling
South Branch at Smith's Br.
Big Cr.-North at F32**
North Branch at Kellogg's Br.**
Mainstem at Parmalee Br.
Mainstem at Mio Dam
Mainstem at McKinley Br.*
Mainstem at Alcona Dam*
Manistee at High Br.
Au Sable below Foote Dam
Thunder Bay at M65
Kalamazoo at Kalamazoo
Muskegon at Evart
Cass at Frankenmuth
0.0 0.2 0.4 0.6 0.8 1.0 1.2
Low-flow yield (cfs/mi2)
Au Sable River Assessment
204
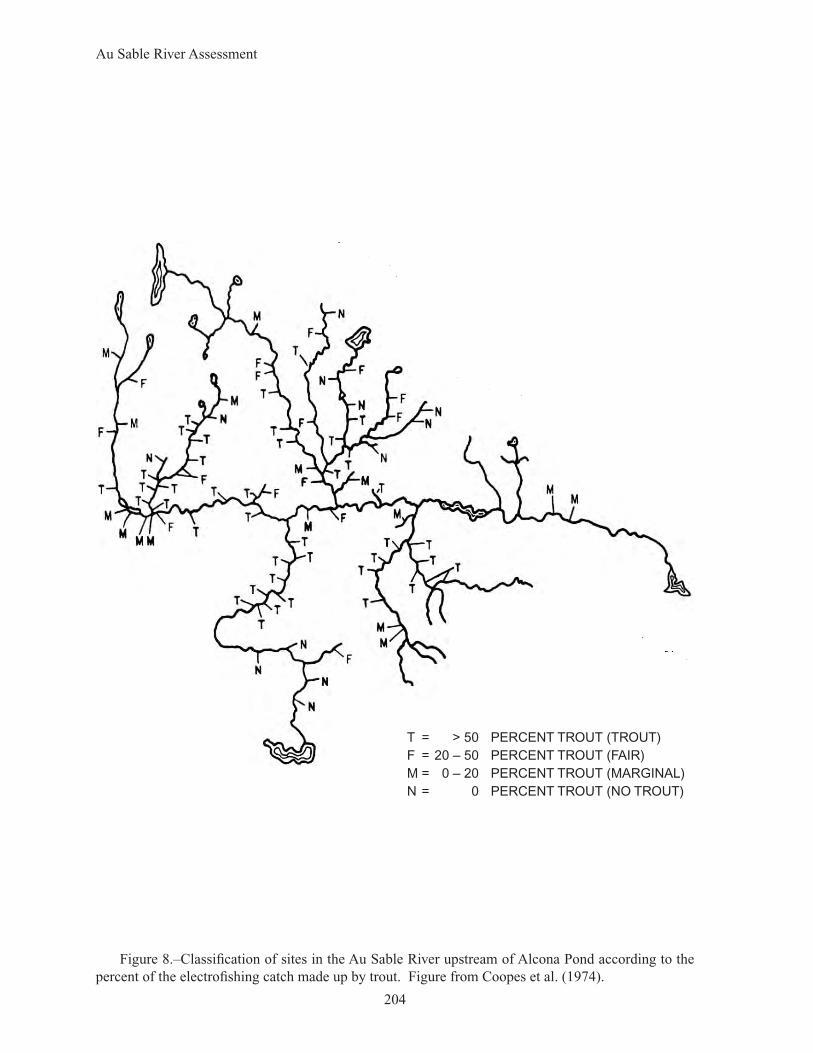
Figure 8.–Classification of sites in the Au Sable River upstream of Alcona Pond according to the percent of the electrofishing catch made up by trout. Figure from Coopes et al. (1974).
T = > 50 PERCENT TROUT (TROUT)F = 20 – 50 PERCENT TROUT (FAIR)M = 0 – 20 PERCENT TROUT (MARGINAL)N = 0 PERCENT TROUT (NO TROUT)
Au Sable River Assessment
205
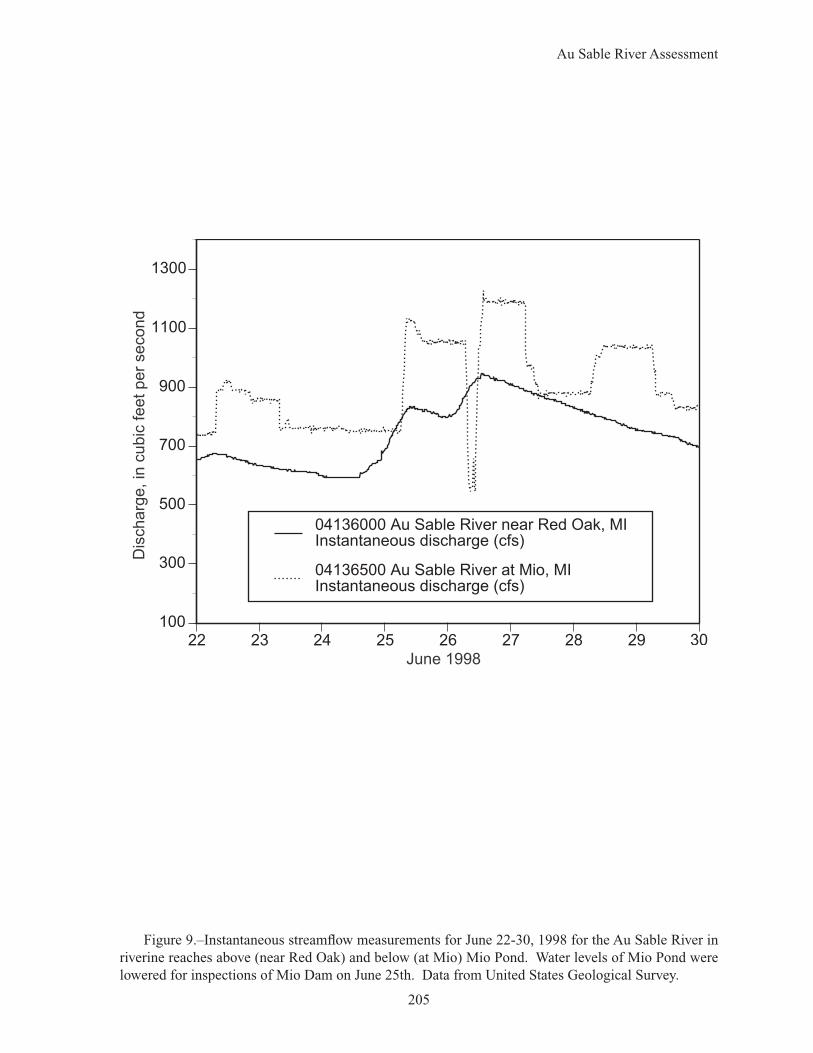
Figure 9.–Instantaneous streamflow measurements for June 22-30, 1998 for the Au Sable River in riverine reaches above (near Red Oak) and below (at Mio) Mio Pond. Water levels of Mio Pond were lowered for inspections of Mio Dam on June 25th. Data from United States Geological Survey.
22 23 24 25 26 27 28 29100
300
500
700
900
1100
1300
Dis
charg
e, in
cubic
feet pe
r second
June 1998
04136000 Au Sable River near Red Oak, MIInstantaneous discharge (cfs)
04136500 Au Sable River at Mio, MIInstantaneous discharge (cfs)
30
Au Sable River Assessment
206
Pine River (Van Etten Creek)near mouth
Mainstem below Foote Dam
Mainstem at McKinley Br.
Big Cr-North at F32
Big Cr-South at Co. Rd. 487
Mainstem at Wakeley Br
North Branch at Kellogg's Br.
South Branch at Smith's Br.
East Branch at Grayling
Mainstem at Wa Wa Sum
0% 10% 20% 30% 40% 50% 60% 70% 80% 90% 100%
Decidious Forest
Coniferous Forest
Rangeland
Forested Wetland
Urban
Agriculture
Water
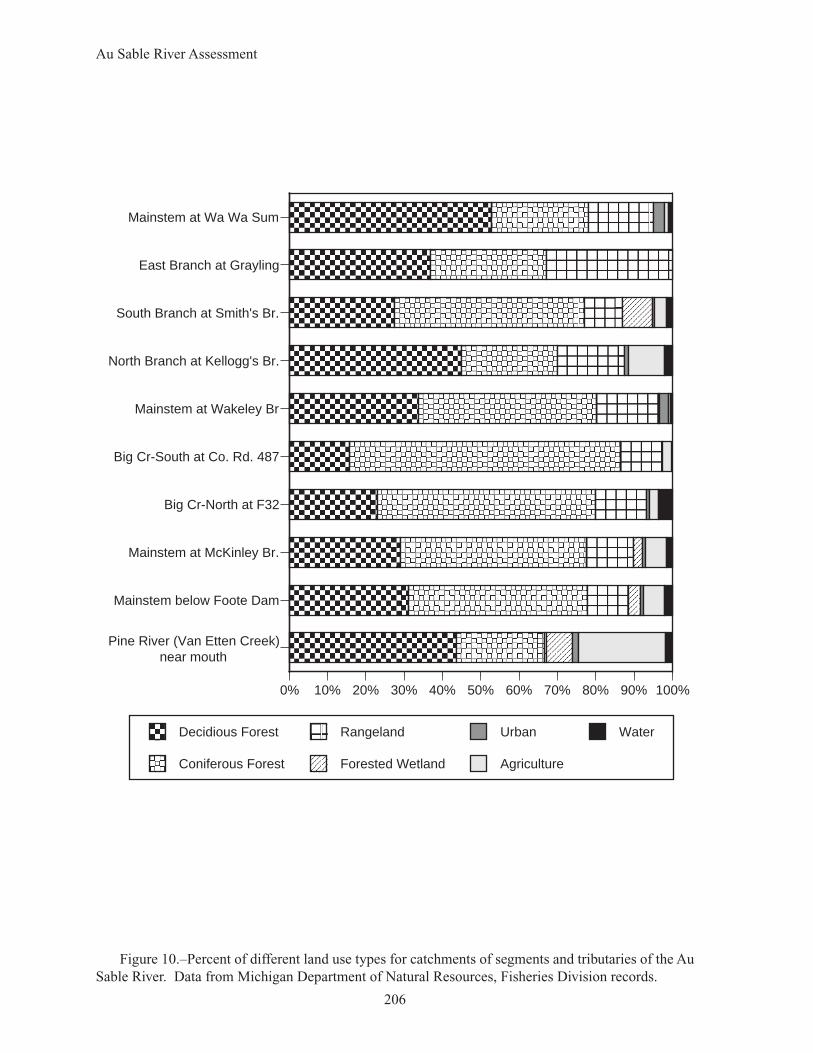
Figure 10.–Percent of different land use types for catchments of segments and tributaries of the Au Sable River. Data from Michigan Department of Natural Resources, Fisheries Division records.
Au Sable River Assessment
207
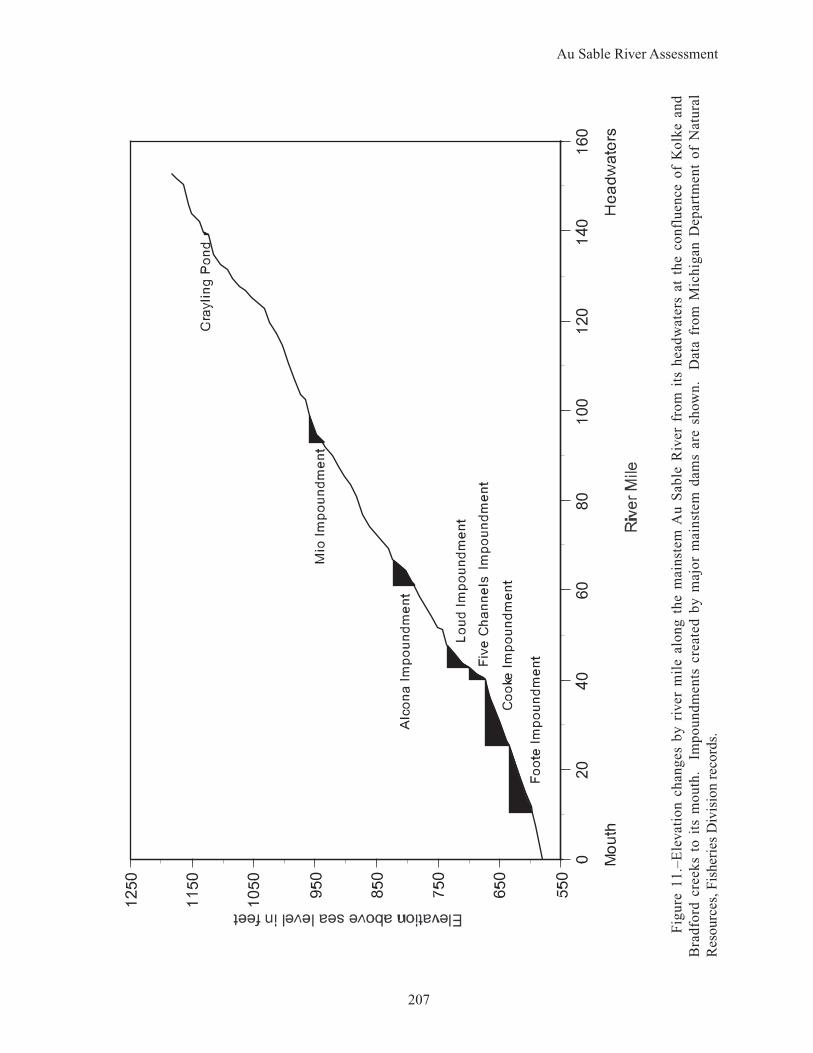
Fig
ure
11.–
Ele
vati
on c
hang
es b
y ri
ver
mil
e al
ong
the
mai
nste
m A
u S
able
Riv
er f
rom
its
hea
dwat
ers
at t
he c
onfl
uenc
e of
Kol
ke a
nd
Bra
dfor
d cr
eeks
to
its
mou
th.
Im
poun
dmen
ts c
reat
ed b
y m
ajor
mai
nste
m d
ams
are
show
n.
Dat
a fr
om M
ichi
gan
Dep
artm
ent
of N
atur
al
Res
ourc
es, F
ishe
ries
Div
isio
n re
cord
s.
Au Sable River Assessment
208
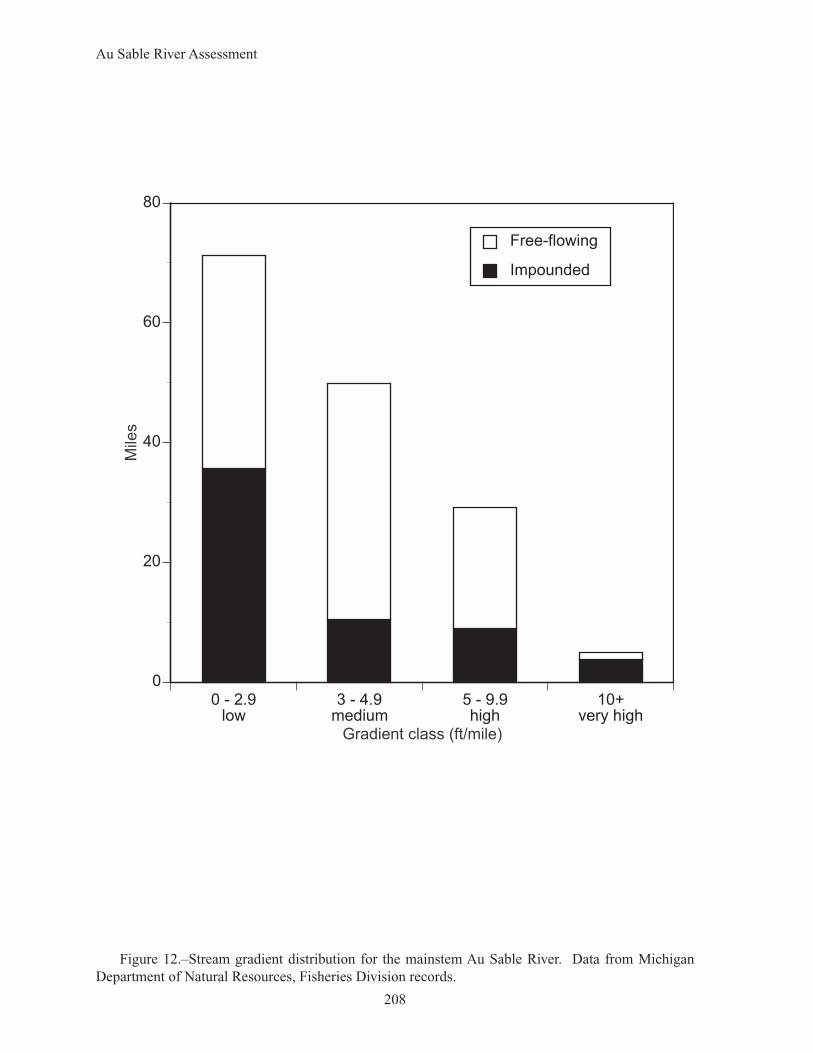
Figure 12.–Stream gradient distribution for the mainstem Au Sable River. Data from Michigan Department of Natural Resources, Fisheries Division records.
0 - 2.9low
3 - 4.9medium
5 - 9.9high
10+very high
0
20
40
60
80
Mile
s
Gradient class (ft/mile)
Impounded
Free-flowing
Au Sable River Assessment
209
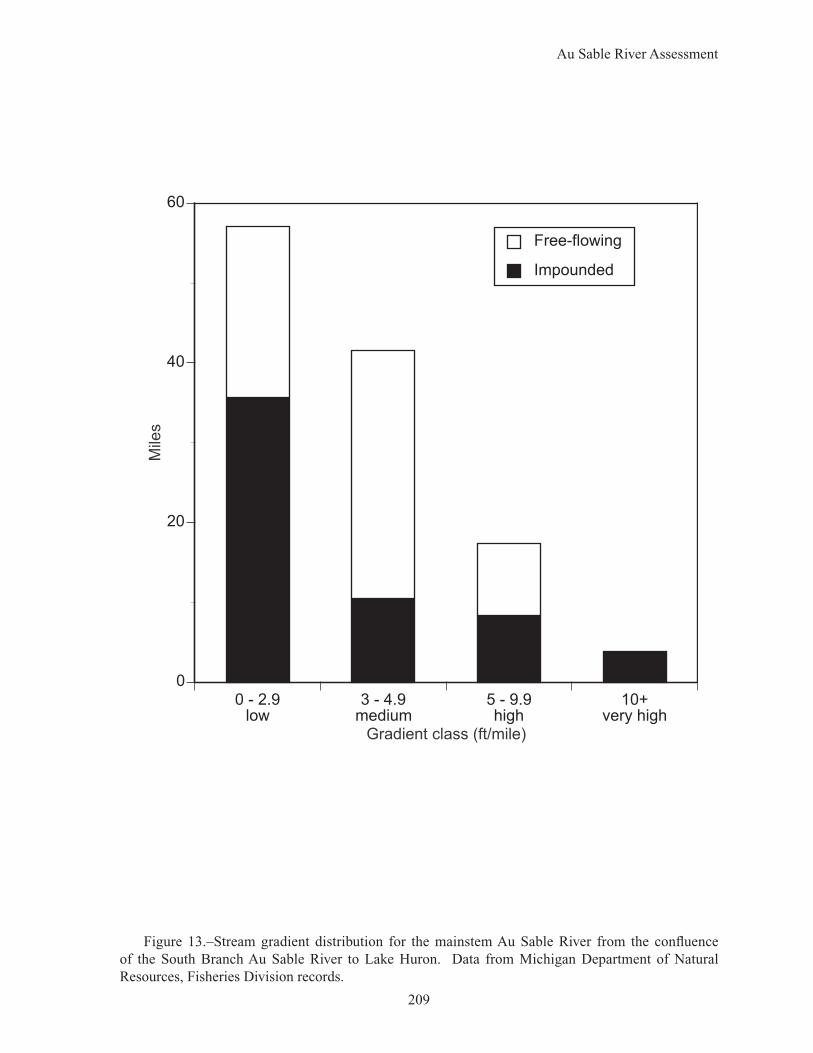
Figure 13.–Stream gradient distribution for the mainstem Au Sable River from the confluence of the South Branch Au Sable River to Lake Huron. Data from Michigan Department of Natural Resources, Fisheries Division records.
0 - 2.9low
3 - 4.9medium
5 - 9.9high
10+very high
0
20
40
60
Mile
s
Gradient class (ft/mile)
Impounded
Free-flowing
Au Sable River Assessment
210
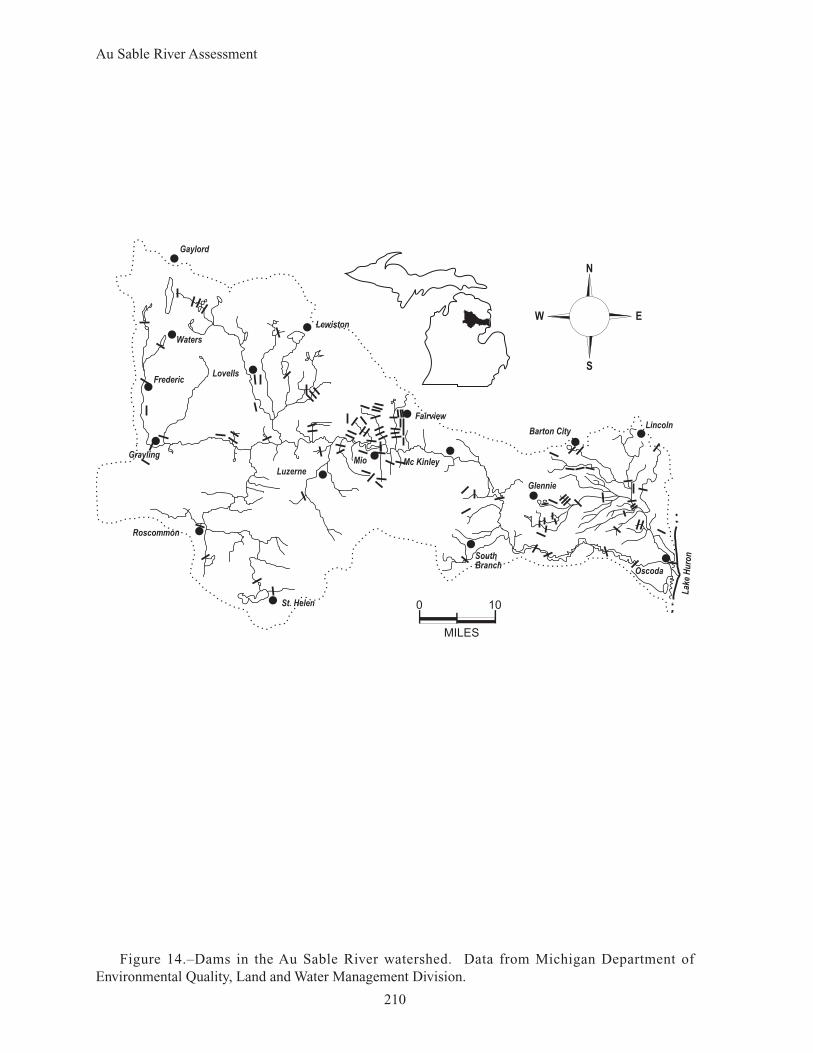
Figure 14.–Dams in the Au Sable River watershed. Data from Michigan Department of Environmental Quality, Land and Water Management Division.
Lak
e H
uro
n
Oscoda
Glennie
Barton CityLincoln
SouthBranch
Mc Kinley
Fairview
Luzerne
St. Helen
Roscommon
Grayling
Frederic
Waters
Gaylord
Lewiston
Lovells
Mio
N
EW
S
0 10
MILES
Au Sable River Assessment
211
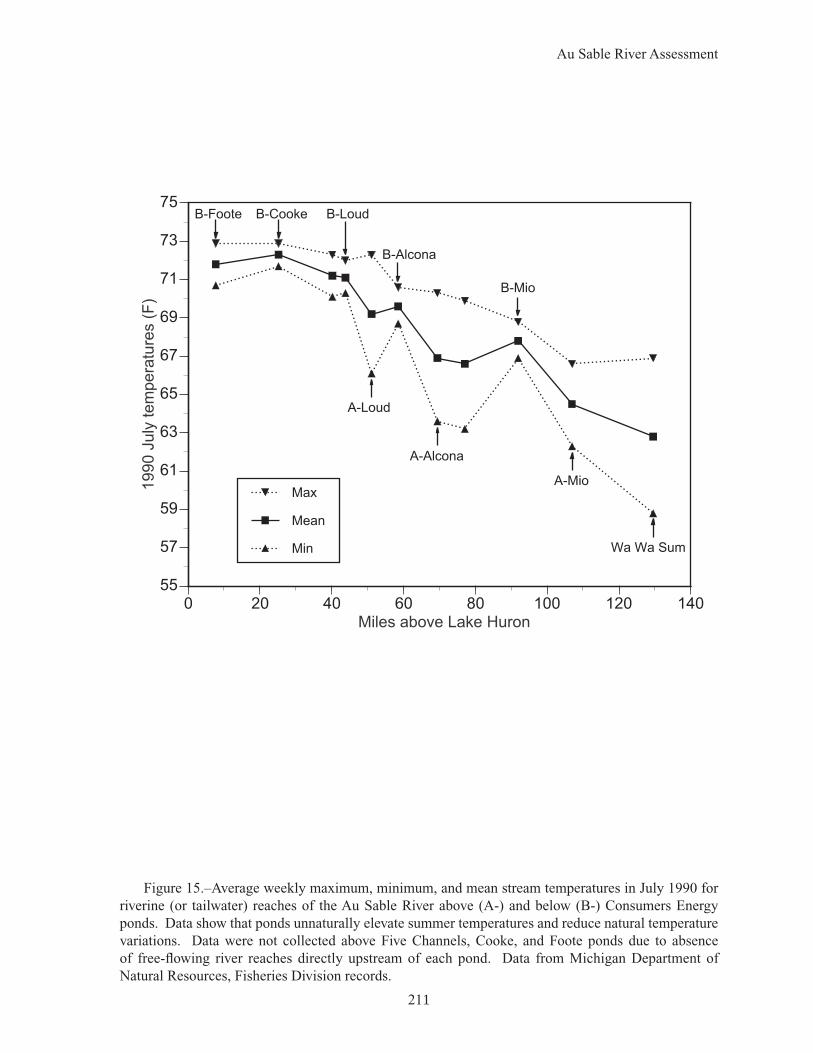
Figure 15.–Average weekly maximum, minimum, and mean stream temperatures in July 1990 for riverine (or tailwater) reaches of the Au Sable River above (A-) and below (B-) Consumers Energy ponds. Data show that ponds unnaturally elevate summer temperatures and reduce natural temperature variations. Data were not collected above Five Channels, Cooke, and Foote ponds due to absence of free-flowing river reaches directly upstream of each pond. Data from Michigan Department of Natural Resources, Fisheries Division records.
55
57
59
61
63
65
67
69
71
73
75
0 20 40 60 80 100 120 140
1990 J
uly
tem
pera
ture
s (
F)
Miles above Lake Huron
Max
Mean
Min
B-Foote B-Cooke B-Loud
B-Alcona
B-Mio
A-Alcona
A-Loud
A-Mio
Wa Wa Sum
Au Sable River Assessment
212
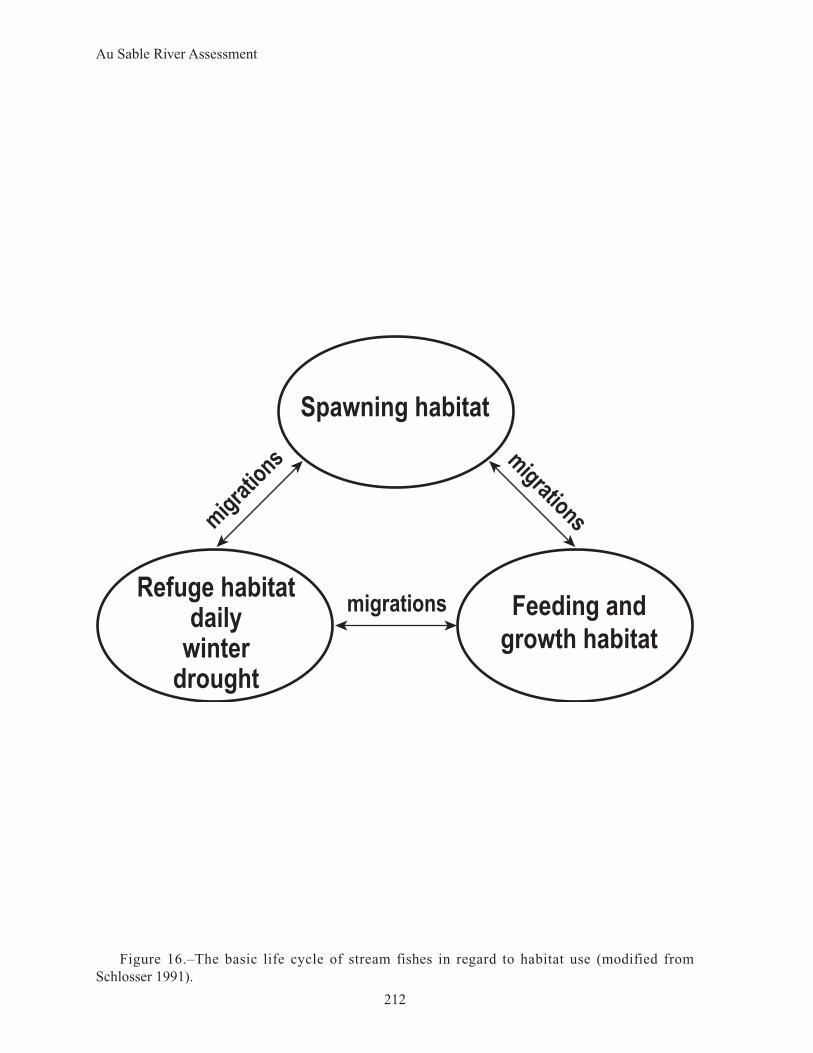
Figure 16.–The basic life cycle of stream fishes in regard to habitat use (modified from Schlosser 1991).
Spawning habitat
Feeding and
growth habitat
Refuge habitatdaily
winterdrought
migrations
migrationsm
igra
tions
Au Sable River Assessment
213
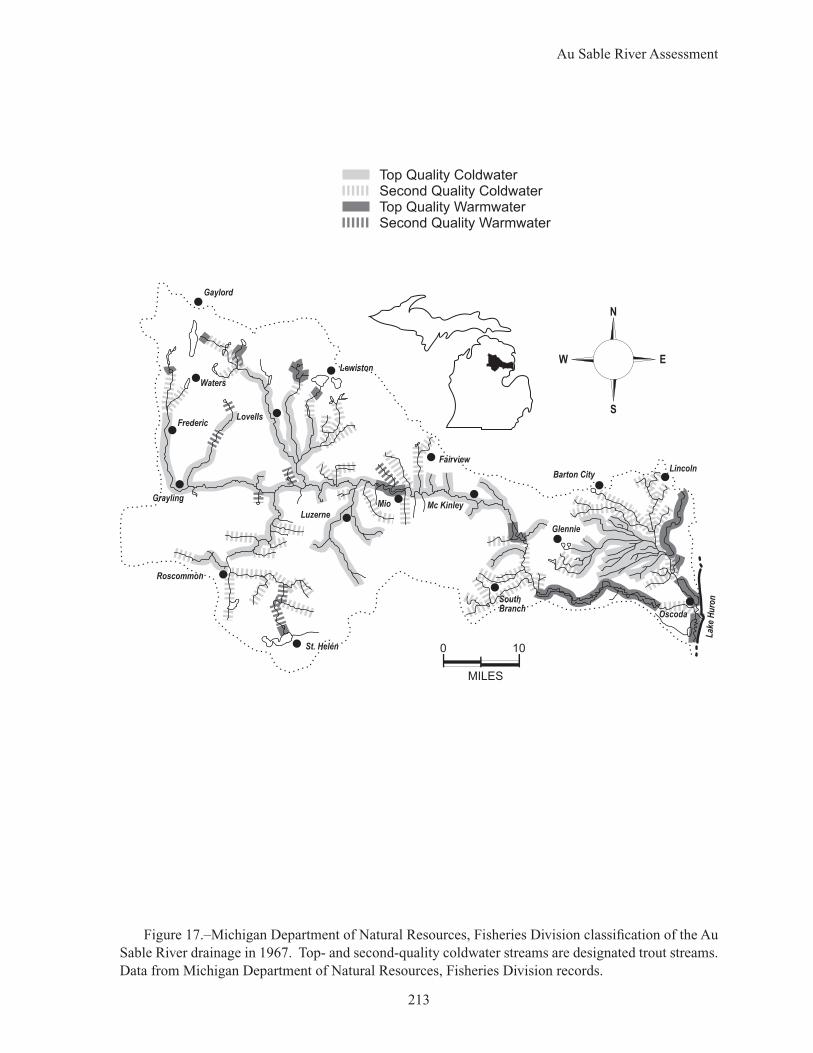
Figure 17.–Michigan Department of Natural Resources, Fisheries Division classification of the Au Sable River drainage in 1967. Top- and second-quality coldwater streams are designated trout streams. Data from Michigan Department of Natural Resources, Fisheries Division records.
Top Quality ColdwaterSecond Quality ColdwaterTop Quality WarmwaterSecond Quality Warmwater
Lak
e H
uro
n
Oscoda
Glennie
Barton CityLincoln
SouthBranch
Mc Kinley
Fairview
Luzerne
St. Helen
Roscommon
Grayling
Frederic
Waters
Gaylord
Lewiston
Lovells
Mio
N
EW
S
0 10
MILES
Au Sable River Assessment
214
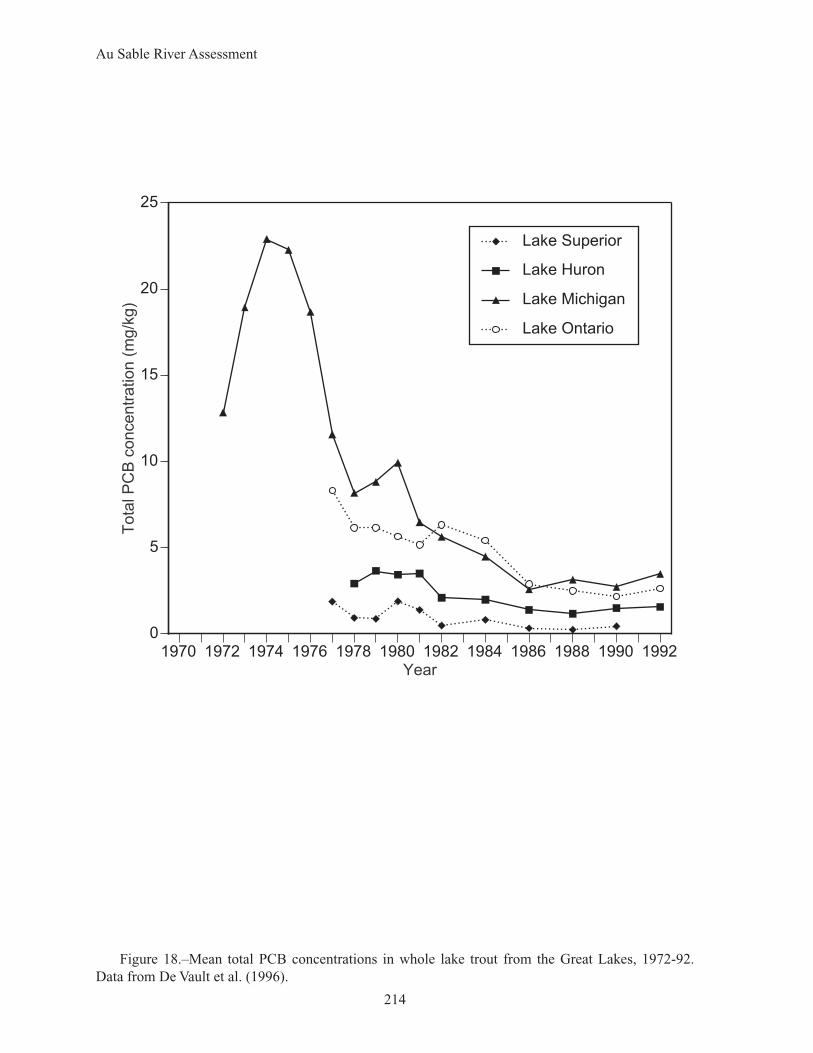
Figure 18.–Mean total PCB concentrations in whole lake trout from the Great Lakes, 1972-92. Data from De Vault et al. (1996).
1970 1972 1974 1976 1978 1980 1982 1984 1986 1988 1990 19920
5
10
15
20
25
Tota
l P
CB
concentr
ation (
mg/k
g)
Year
Lake Superior
Lake Huron
Lake Michigan
Lake Ontario
Au Sable River Assessment
215
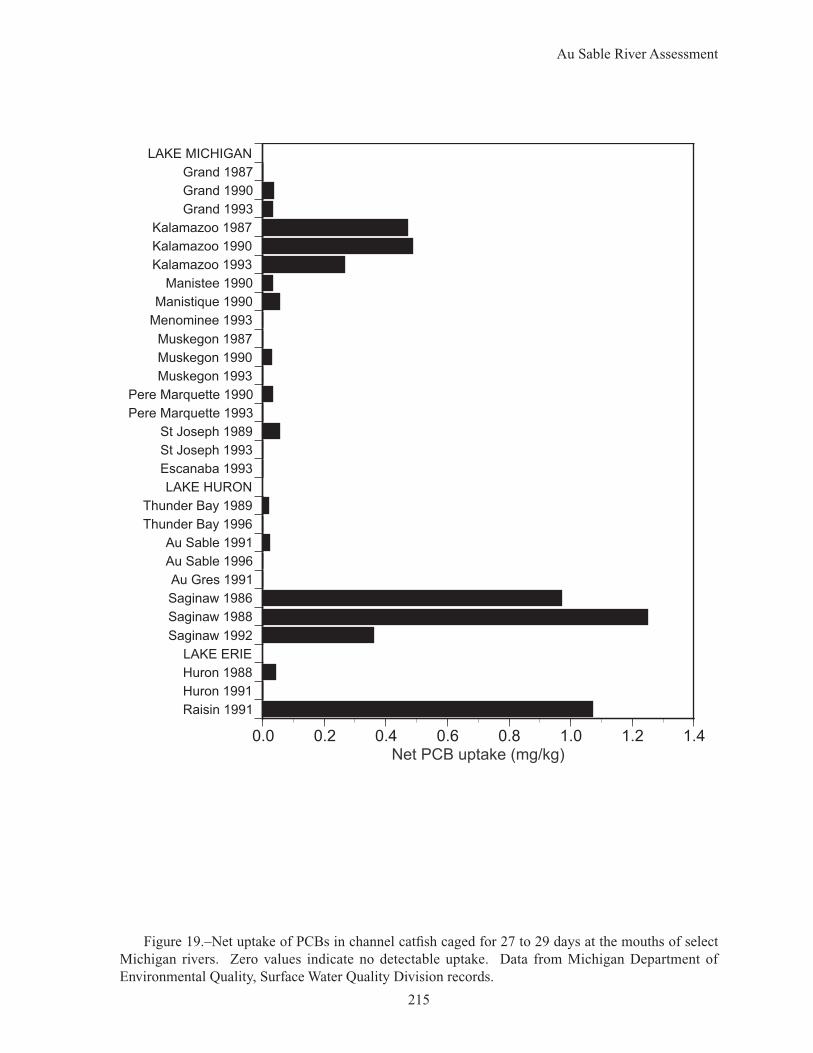
Figure 19.–Net uptake of PCBs in channel catfish caged for 27 to 29 days at the mouths of select Michigan rivers. Zero values indicate no detectable uptake. Data from Michigan Department of Environmental Quality, Surface Water Quality Division records.
Raisin 1991
Huron 1991
Huron 1988
LAKE ERIE
Saginaw 1992
Saginaw 1988
Saginaw 1986
Au Gres 1991
Au Sable 1996
Au Sable 1991
Thunder Bay 1996
Thunder Bay 1989
LAKE HURON
Escanaba 1993
St Joseph 1993
St Joseph 1989
Pere Marquette 1993
Pere Marquette 1990
Muskegon 1993
Muskegon 1990
Muskegon 1987
Menominee 1993
Manistique 1990
Manistee 1990
Kalamazoo 1993
Kalamazoo 1990
Kalamazoo 1987
Grand 1993
Grand 1990
Grand 1987
LAKE MICHIGAN
0.0 0.2 0.4 0.6 0.8 1.0 1.2 1.4Net PCB uptake (mg/kg)
Au Sable River Assessment
216
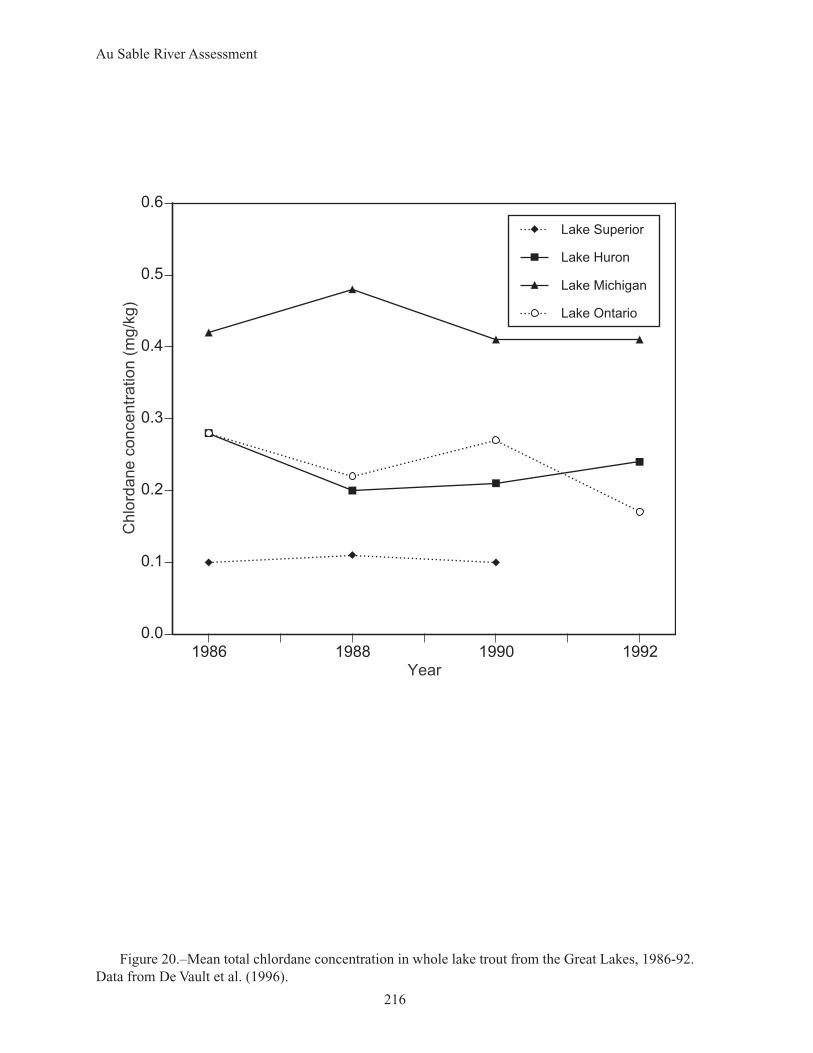
Figure 20.–Mean total chlordane concentration in whole lake trout from the Great Lakes, 1986-92. Data from De Vault et al. (1996).
1986 1988 1990 1992
0.0
0.1
0.2
0.3
0.4
0.5
0.6
Chlo
rdane c
oncentr
ation (
mg/k
g)
Year
Lake Superior
Lake Huron
Lake Michigan
Lake Ontario
Au Sable River Assessment
217
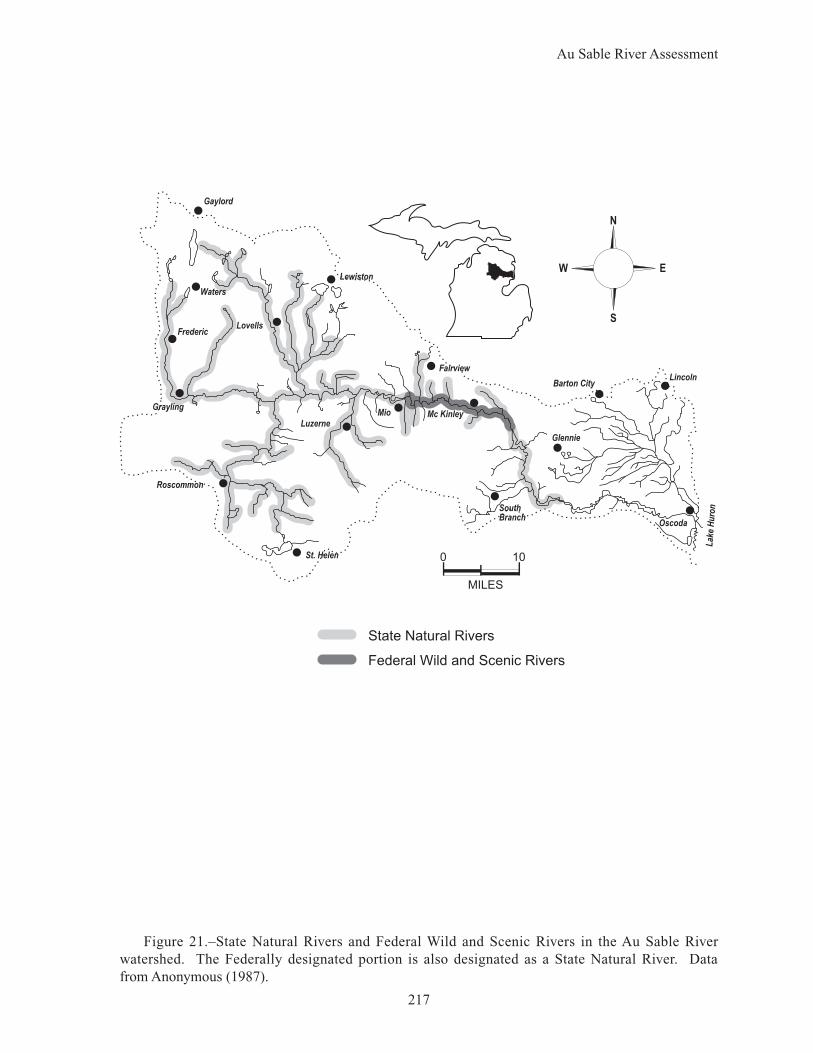
Figure 21.–State Natural Rivers and Federal Wild and Scenic Rivers in the Au Sable River watershed. The Federally designated portion is also designated as a State Natural River. Data from Anonymous (1987).
State Natural Rivers
Federal Wild and Scenic Rivers
Lak
e H
uro
n
Oscoda
Glennie
Barton CityLincoln
SouthBranch
Mc Kinley
Fairview
Luzerne
St. Helen
Roscommon
Grayling
Frederic
Waters
Gaylord
Lewiston
Lovells
Mio
N
EW
S
0 10
MILES
Au Sable River Assessment
218
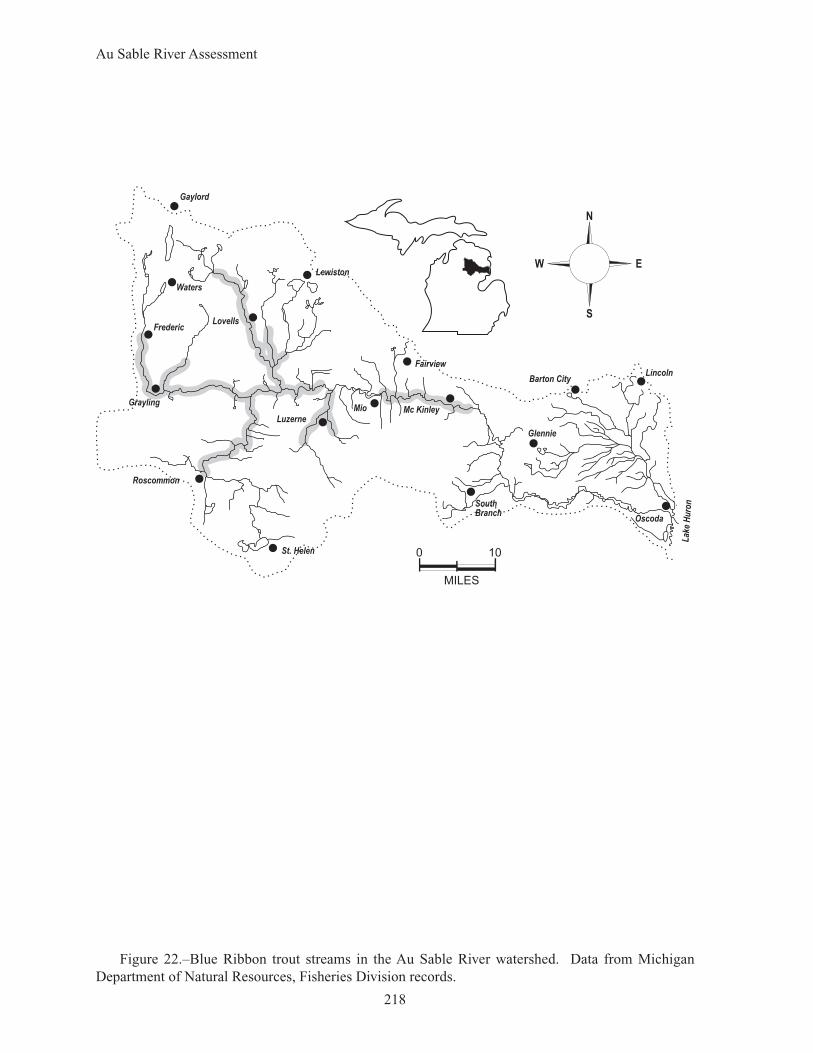
Figure 22.–Blue Ribbon trout streams in the Au Sable River watershed. Data from Michigan Department of Natural Resources, Fisheries Division records.
Lak
e H
uro
n
Oscoda
Glennie
Barton CityLincoln
SouthBranch
Mc Kinley
Fairview
Luzerne
St. Helen
Roscommon
Grayling
Frederic
Waters
Gaylord
Lewiston
Lovells
Mio
N
EW
S
0 10
MILES
Au Sable River Assessment
219
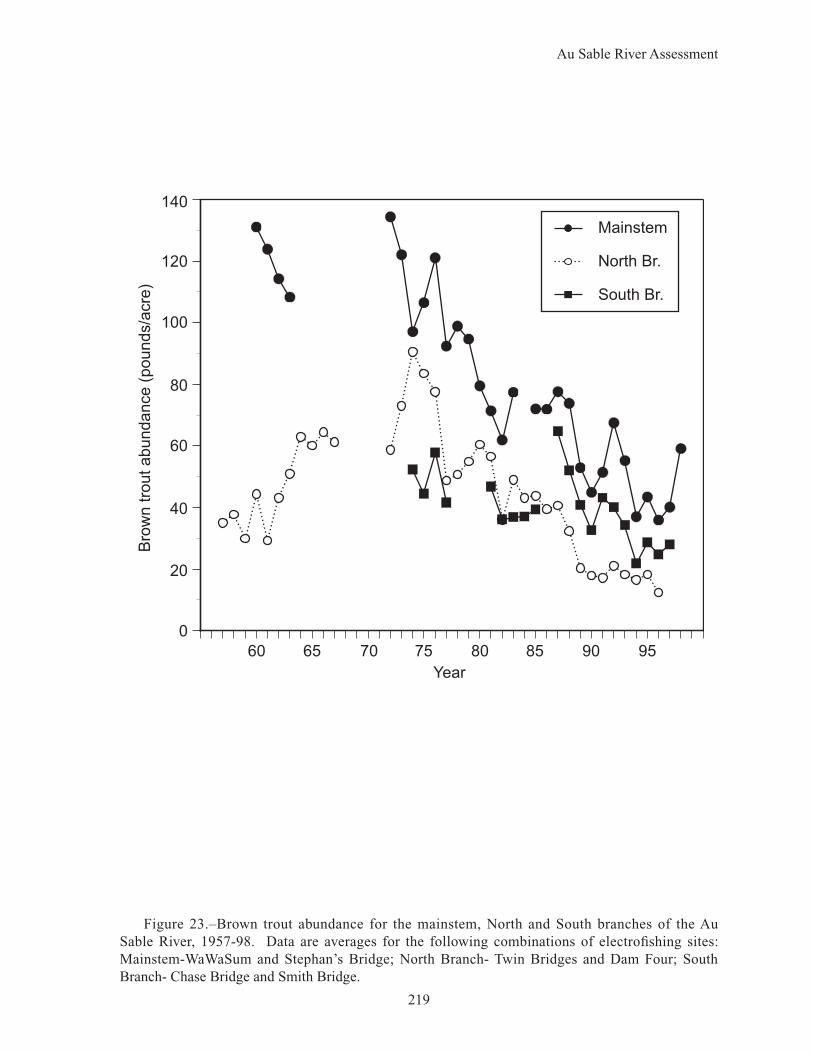
Figure 23.–Brown trout abundance for the mainstem, North and South branches of the Au Sable River, 1957-98. Data are averages for the following combinations of electrofishing sites: Mainstem-WaWaSum and Stephan’s Bridge; North Branch- Twin Bridges and Dam Four; South Branch- Chase Bridge and Smith Bridge.
Bro
wn
tro
ut abundance (
pounds/a
cre
)
140
120
100
80
60
40
20
0
60 65 70 75 80 85 90 95
Year
Mainstem
North Br.
South Br.
Au Sable River Assessment
220
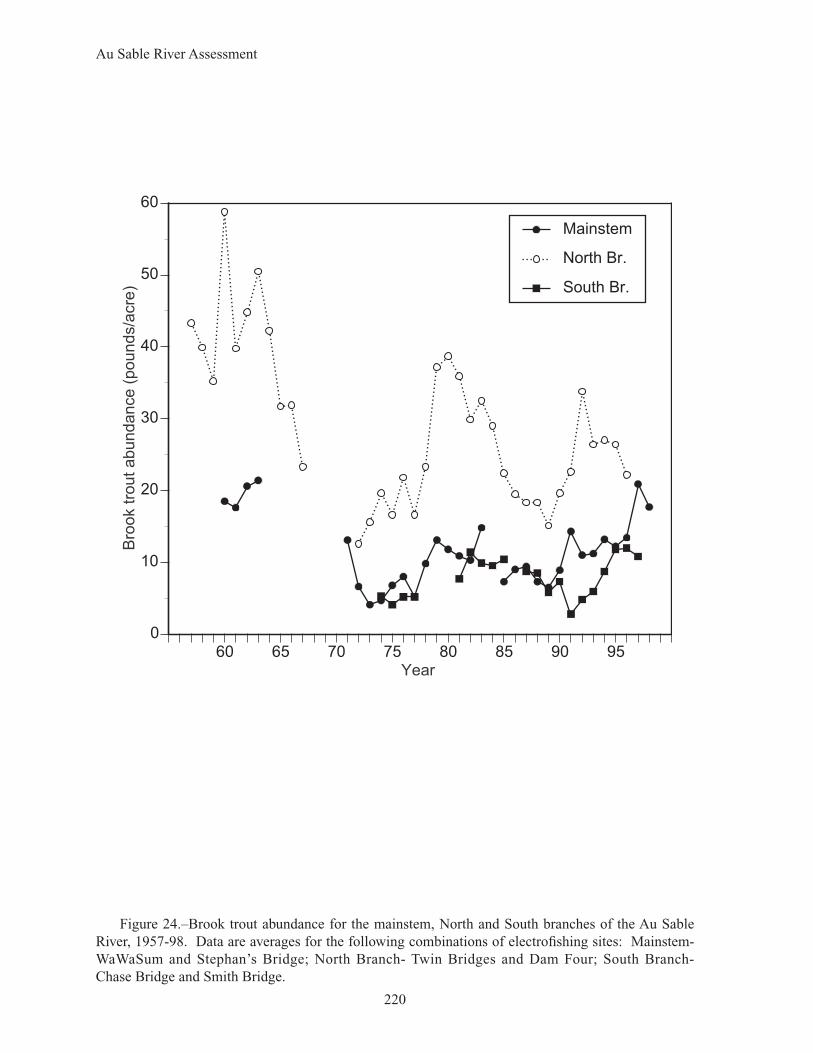
Figure 24.–Brook trout abundance for the mainstem, North and South branches of the Au Sable River, 1957-98. Data are averages for the following combinations of electrofishing sites: Mainstem- WaWaSum and Stephan’s Bridge; North Branch- Twin Bridges and Dam Four; South Branch- Chase Bridge and Smith Bridge.
60 65 70 75 80 85 90 95
0
10
20
30
40
50
60
Bro
ok tro
ut abundance (
pounds/a
cre
)
Year
Mainstem
North Br.
South Br.
Au Sable River Assessment
221
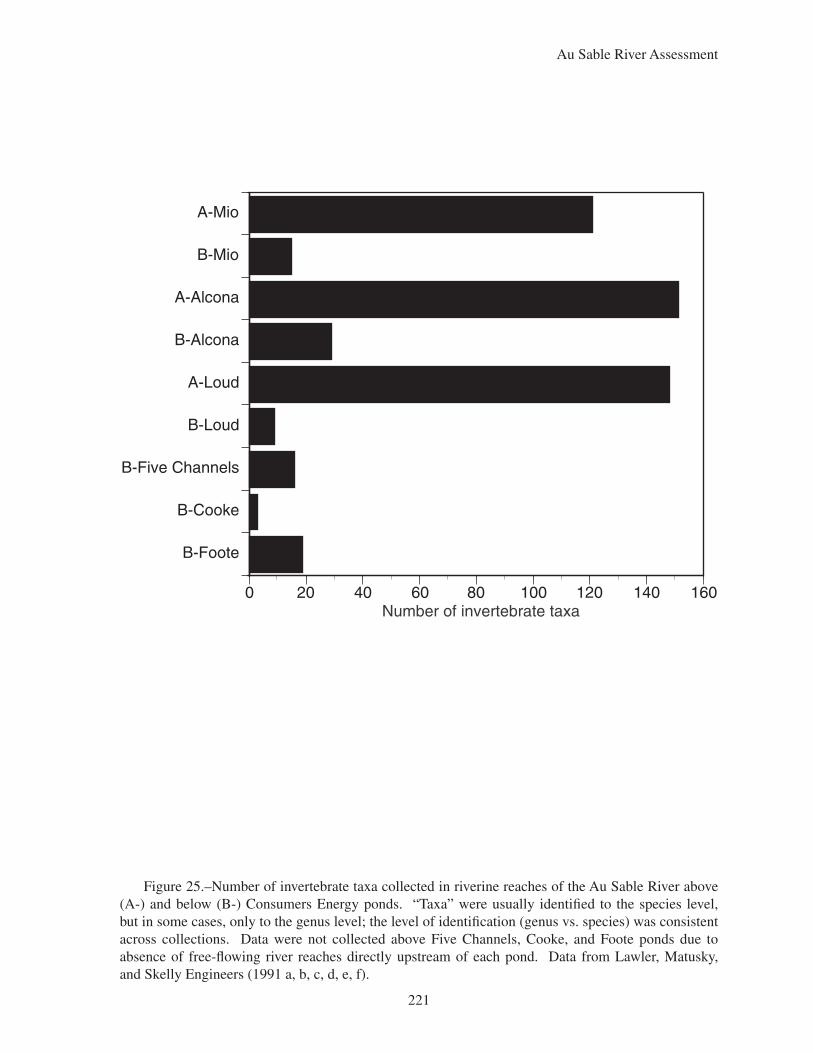
Figure 25.–Number of invertebrate taxa collected in riverine reaches of the Au Sable River above (A-) and below (B-) Consumers Energy ponds. “Taxa” were usually identified to the species level, but in some cases, only to the genus level; the level of identification (genus vs. species) was consistent across collections. Data were not collected above Five Channels, Cooke, and Foote ponds due to absence of free-flowing river reaches directly upstream of each pond. Data from Lawler, Matusky, and Skelly Engineers (1991 a, b, c, d, e, f).
B-Foote
B-Cooke
B-Five Channels
B-Loud
A-Loud
B-Alcona
A-Alcona
B-Mio
A-Mio
0 20 40 60 80 100 120 140 160Number of invertebrate taxa
Au Sable River Assessment
222
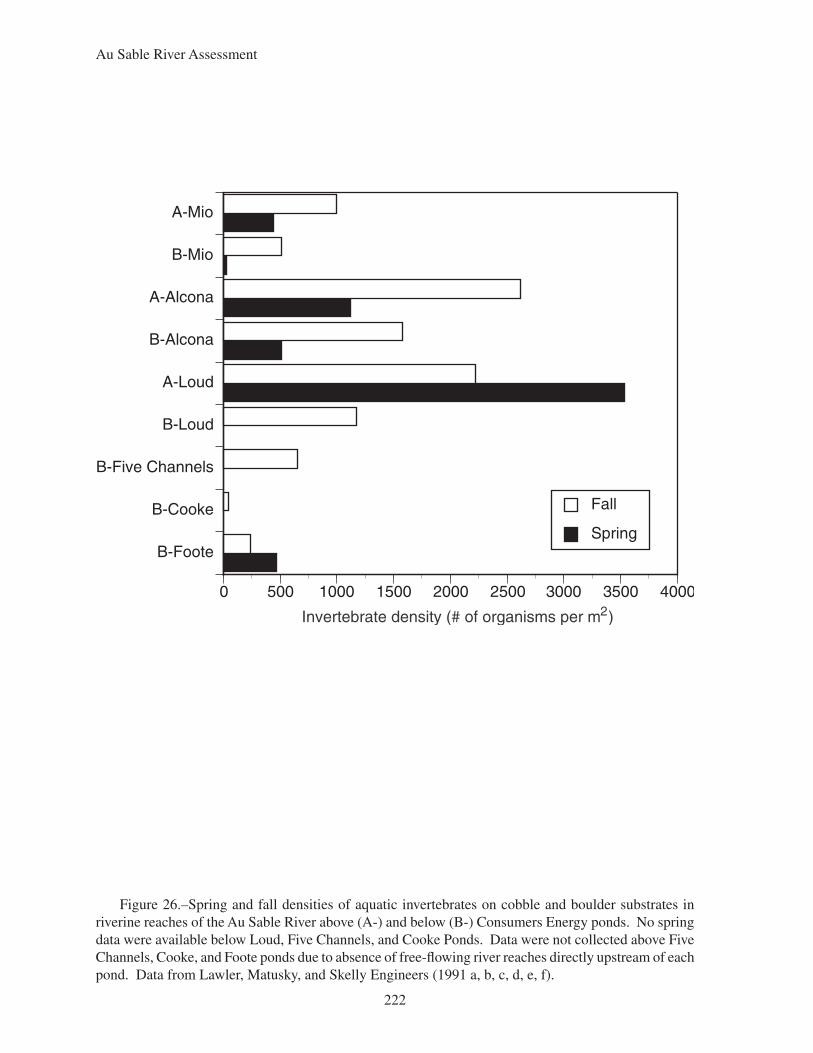
Figure 26.–Spring and fall densities of aquatic invertebrates on cobble and boulder substrates in riverine reaches of the Au Sable River above (A-) and below (B-) Consumers Energy ponds. No spring data were available below Loud, Five Channels, and Cooke Ponds. Data were not collected above Five Channels, Cooke, and Foote ponds due to absence of free-flowing river reaches directly upstream of each pond. Data from Lawler, Matusky, and Skelly Engineers (1991 a, b, c, d, e, f).
B-Foote
B-Cooke
B-Five Channels
B-Loud
A-Loud
B-Alcona
A-Alcona
B-Mio
A-Mio
0 500 1000 1500 2000 2500 3000 3500 4000
Invertebrate density (# of organisms per m2)
Spring
Fall
Au Sable River Assessment
223
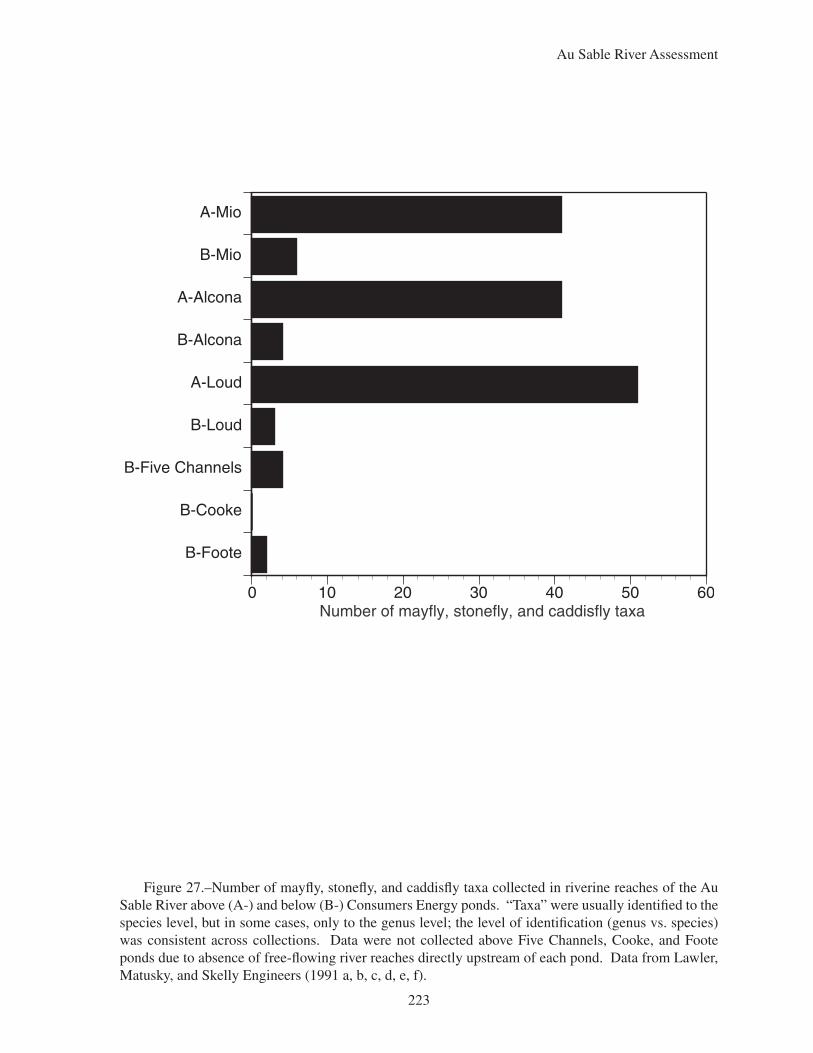
Figure 27.–Number of mayfly, stonefly, and caddisfly taxa collected in riverine reaches of the Au Sable River above (A-) and below (B-) Consumers Energy ponds. “Taxa” were usually identified to the species level, but in some cases, only to the genus level; the level of identification (genus vs. species) was consistent across collections. Data were not collected above Five Channels, Cooke, and Foote ponds due to absence of free-flowing river reaches directly upstream of each pond. Data from Lawler, Matusky, and Skelly Engineers (1991 a, b, c, d, e, f).
B-Foote
B-Cooke
B-Five Channels
B-Loud
A-Loud
B-Alcona
A-Alcona
B-Mio
A-Mio
0 10 20 30 40 50 60Number of mayfly, stonefly, and caddisfly taxa
Au Sable River Assessment
224
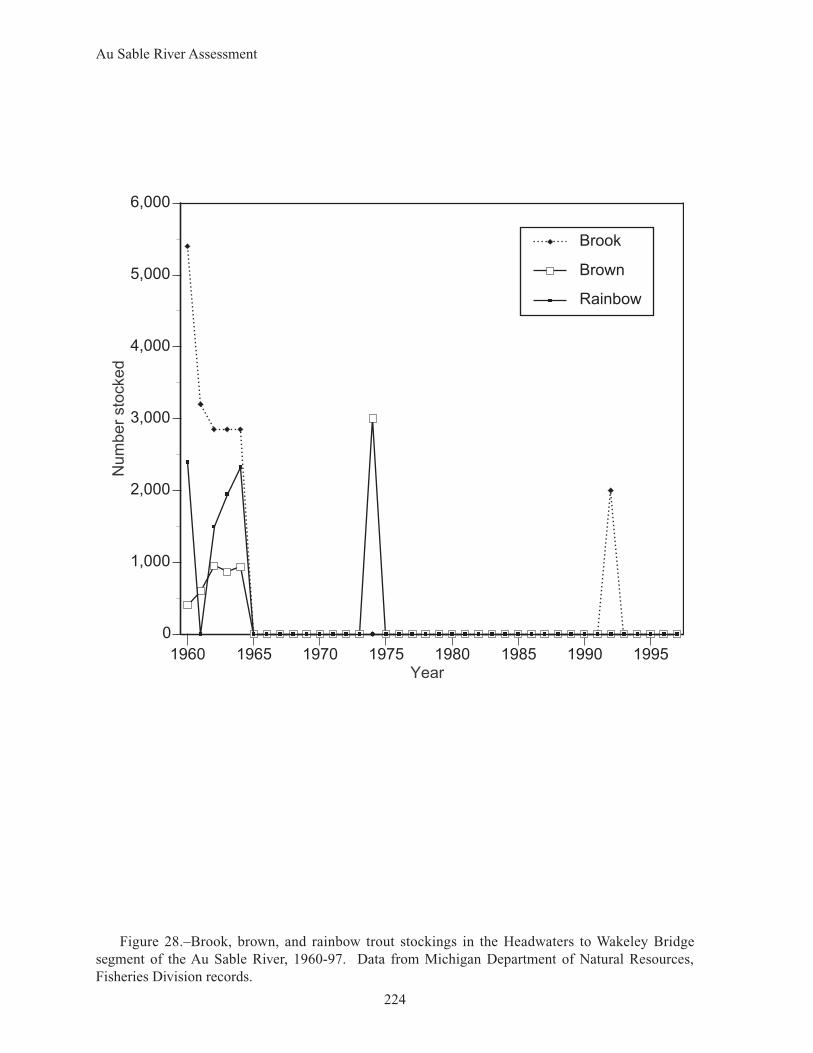
Figure 28.–Brook, brown, and rainbow trout stockings in the Headwaters to Wakeley Bridge segment of the Au Sable River, 1960-97. Data from Michigan Department of Natural Resources, Fisheries Division records.
1960 1965 1970 1975 1980 1985 1990 1995
0
1,000
2,000
3,000
4,000
5,000
6,000
Num
ber
sto
cked
Year
Brook
Brown
Rainbow
Au Sable River Assessment
225
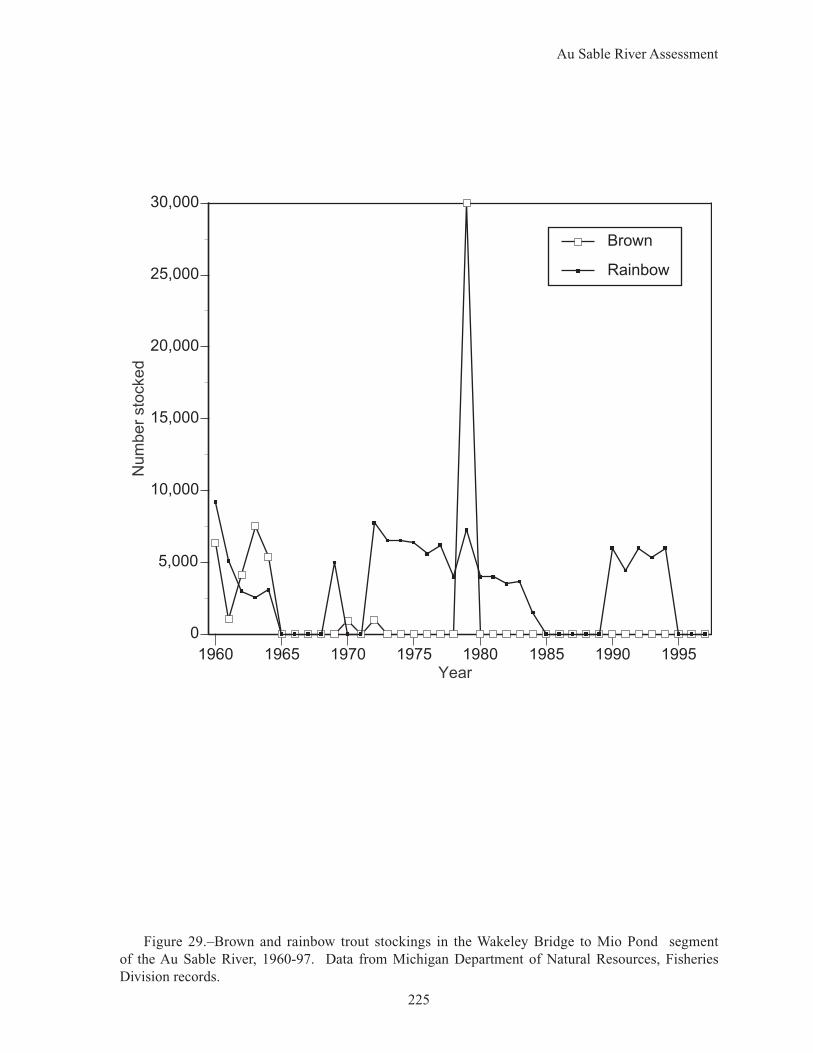
Figure 29.–Brown and rainbow trout stockings in the Wakeley Bridge to Mio Pond segment of the Au Sable River, 1960-97. Data from Michigan Department of Natural Resources, Fisheries Division records.
1960 1965 1970 1975 1980 1985 1990 1995
0
5,000
10,000
15,000
20,000
25,000
30,000
Num
ber
sto
cked
Year
Brown
Rainbow
Au Sable River Assessment
226
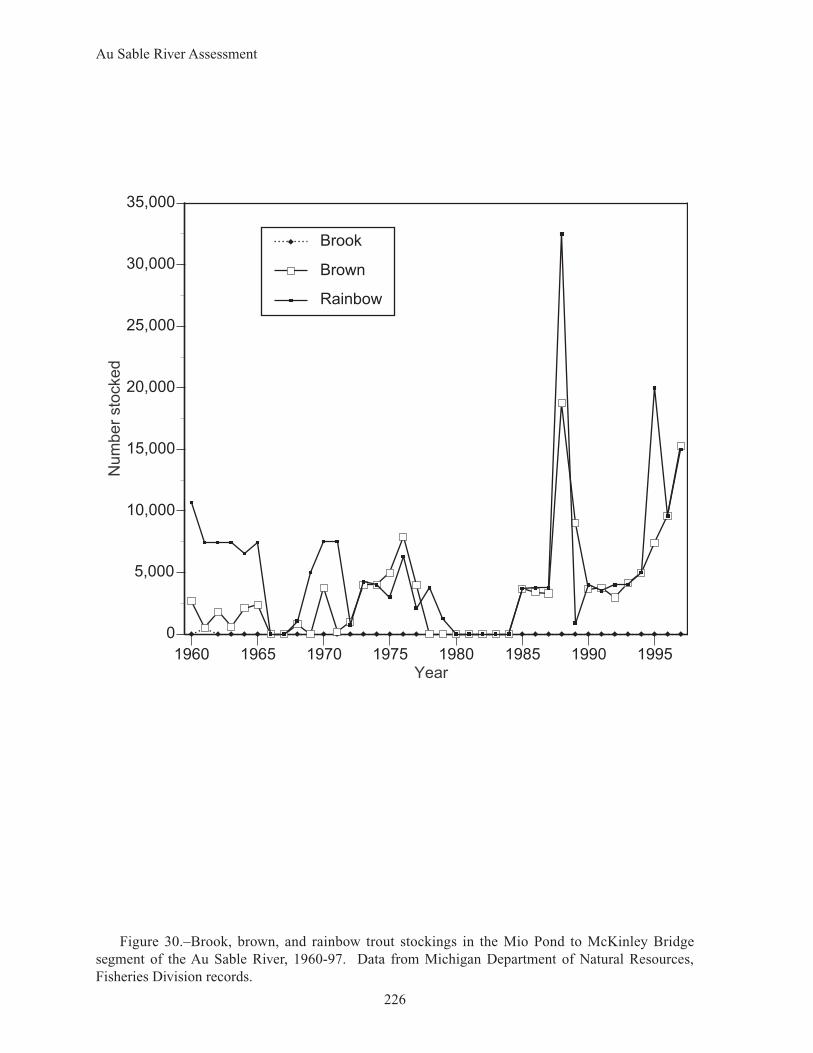
Figure 30.–Brook, brown, and rainbow trout stockings in the Mio Pond to McKinley Bridge segment of the Au Sable River, 1960-97. Data from Michigan Department of Natural Resources, Fisheries Division records.
1960 1965 1970 1975 1980 1985 1990 1995
0
5,000
10,000
15,000
20,000
25,000
30,000
35,000
Num
ber
sto
cked
Year
Brook
Brown
Rainbow
Au Sable River Assessment
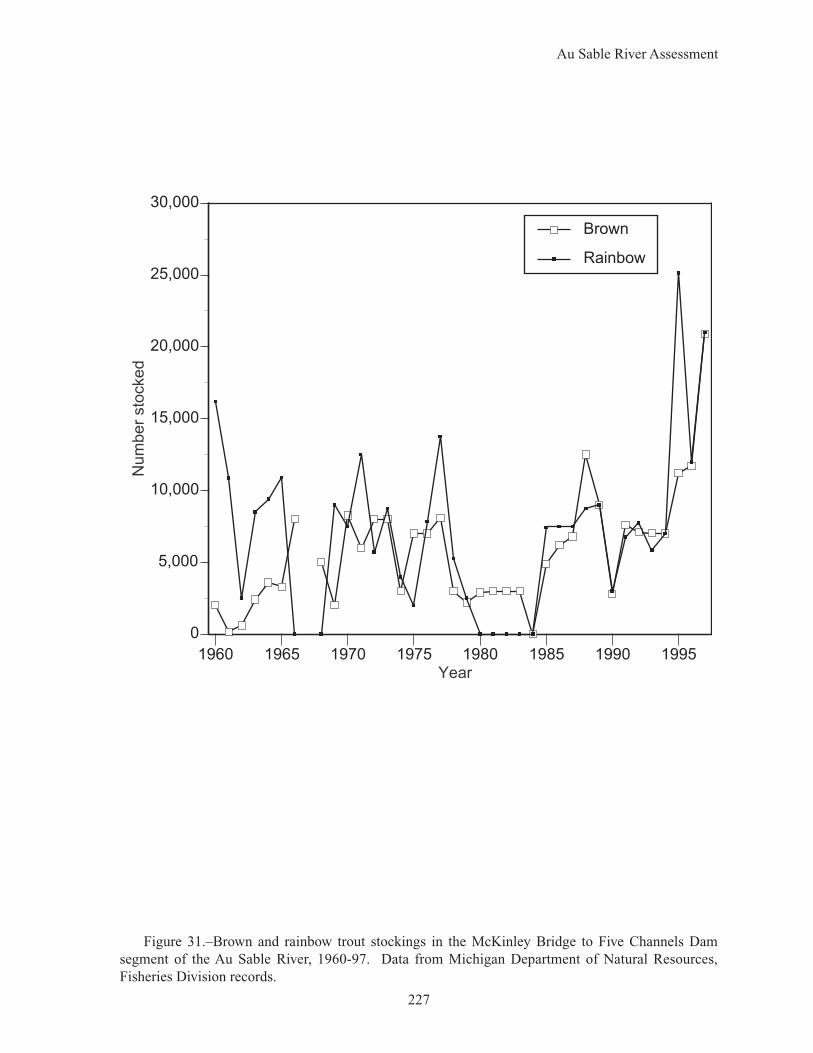
227
Figure 31.–Brown and rainbow trout stockings in the McKinley Bridge to Five Channels Dam segment of the Au Sable River, 1960-97. Data from Michigan Department of Natural Resources, Fisheries Division records.
1960 1965 1970 1975 1980 1985 1990 1995
0
5,000
10,000
15,000
20,000
25,000
30,000
Num
ber
sto
cked
Year
Brown
Rainbow
Au Sable River Assessment
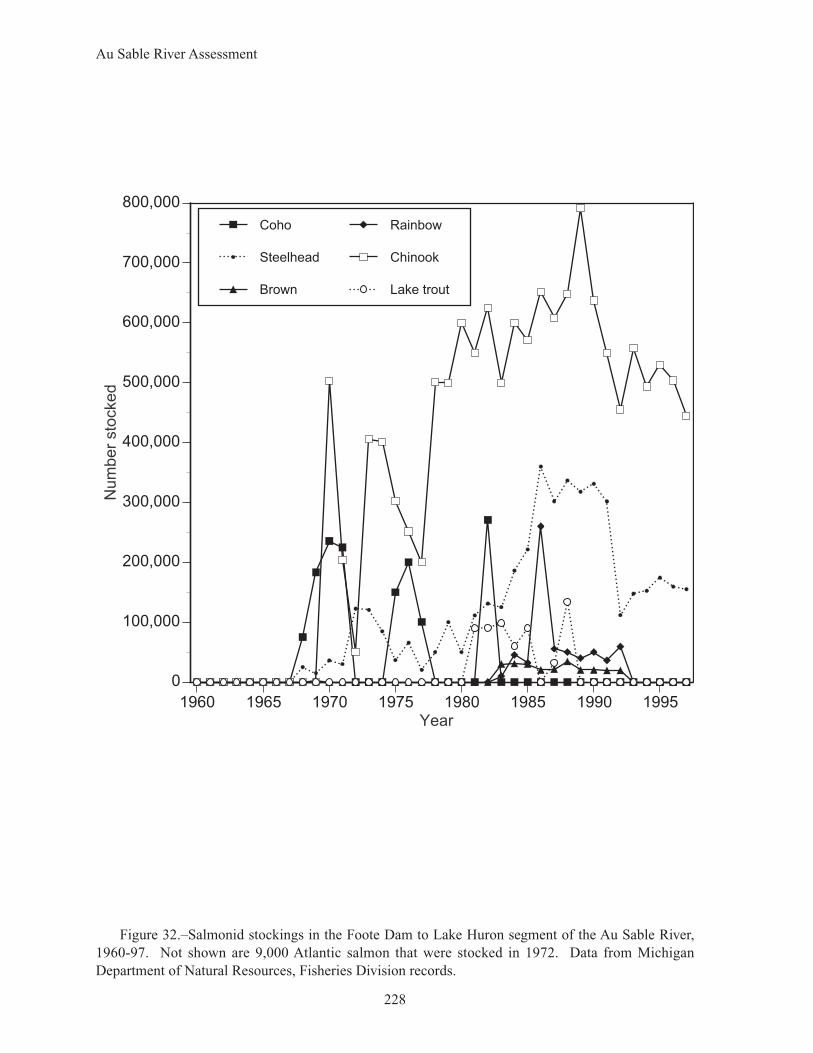
228
Figure 32.–Salmonid stockings in the Foote Dam to Lake Huron segment of the Au Sable River, 1960-97. Not shown are 9,000 Atlantic salmon that were stocked in 1972. Data from Michigan Department of Natural Resources, Fisheries Division records.
1960 1965 1970 1975 1980 1985 1990 1995
0
100,000
200,000
300,000
400,000
500,000
600,000
700,000
800,000
Num
ber
sto
cked
Year
Coho
Steelhead
Brown
Rainbow
Chinook
Lake trout
Au Sable River Assessment
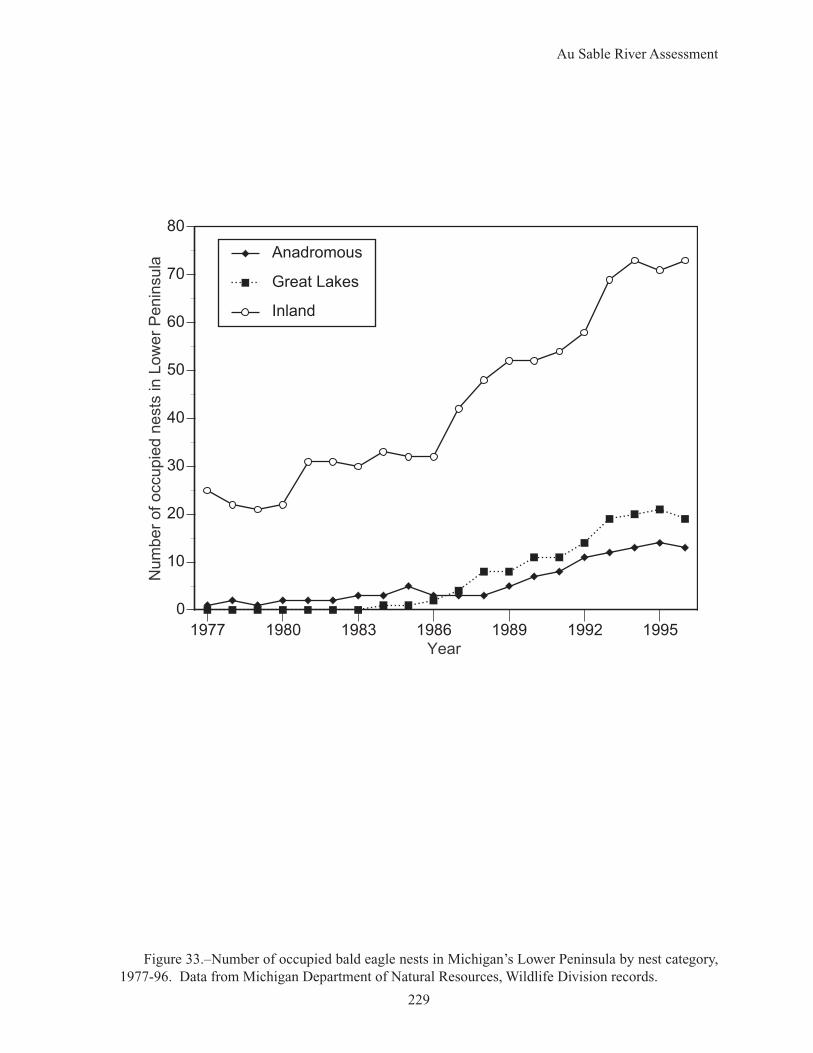
229
Figure 33.–Number of occupied bald eagle nests in Michigan’s Lower Peninsula by nest category, 1977-96. Data from Michigan Department of Natural Resources, Wildlife Division records.
1977 1980 1983 1986 1989 1992 1995
0
10
20
30
40
50
60
70
80
Num
ber
of occupie
d n
ests
in L
ow
er
Penin
sula
Year
Anadromous
Great Lakes
Inland
Au Sable River Assessment
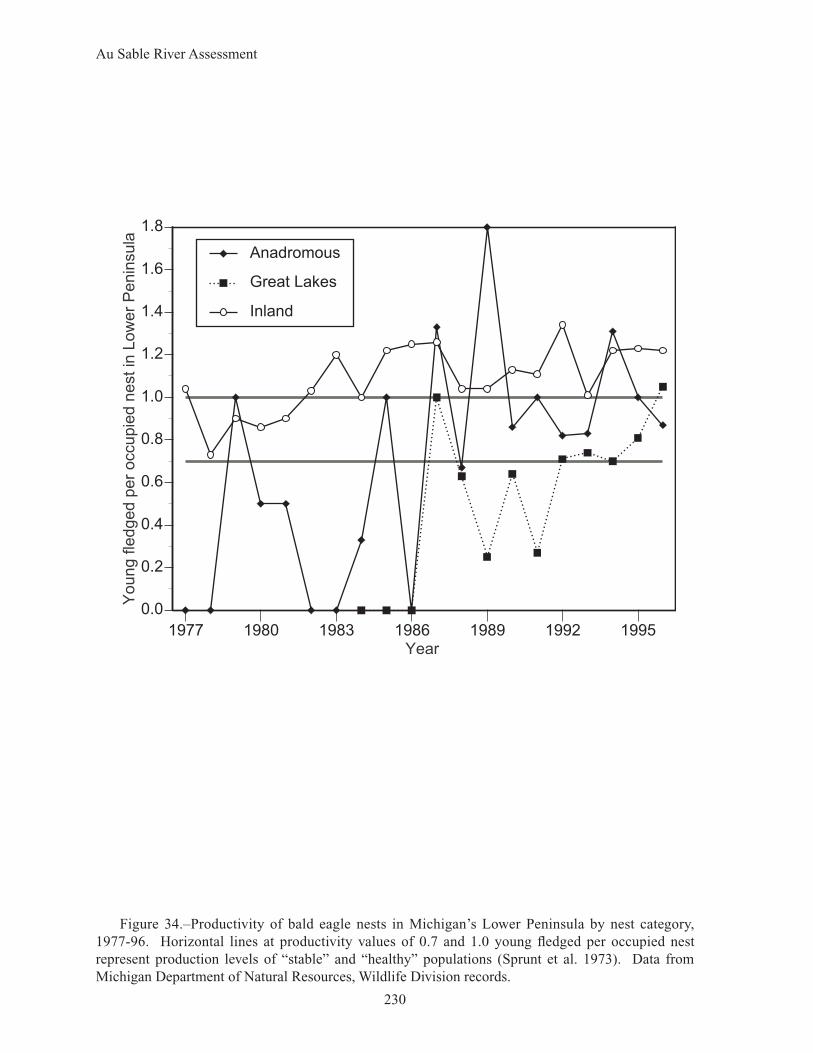
230
Figure 34.–Productivity of bald eagle nests in Michigan’s Lower Peninsula by nest category, 1977-96. Horizontal lines at productivity values of 0.7 and 1.0 young fledged per occupied nest represent production levels of “stable” and “healthy” populations (Sprunt et al. 1973). Data from Michigan Department of Natural Resources, Wildlife Division records.
1977 1980 1983 1986 1989 1992 1995
0.0
0.2
0.4
0.6
0.8
1.0
1.2
1.4
1.6
1.8
Young fle
dged p
er
occupie
d n
est
in L
ow
er
Penin
sula
Year
Anadromous
Great Lakes
Inland

Au Sable River Assessment
231
Au Sable River Assessment
232
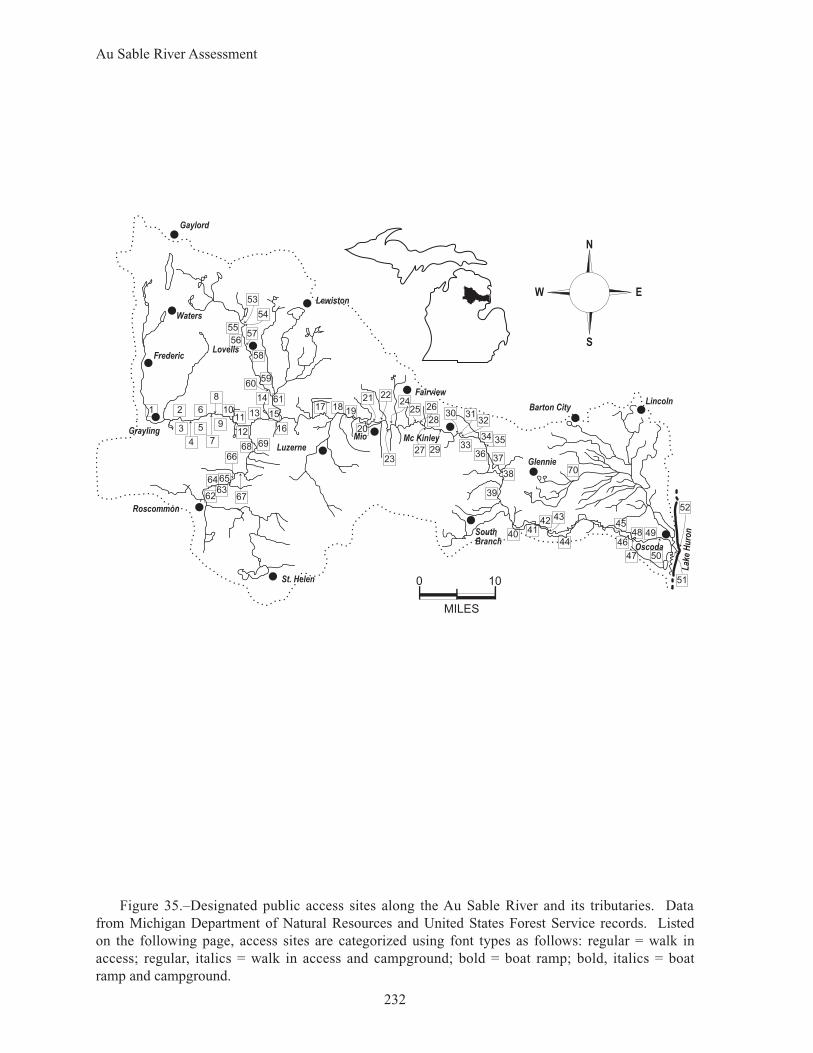
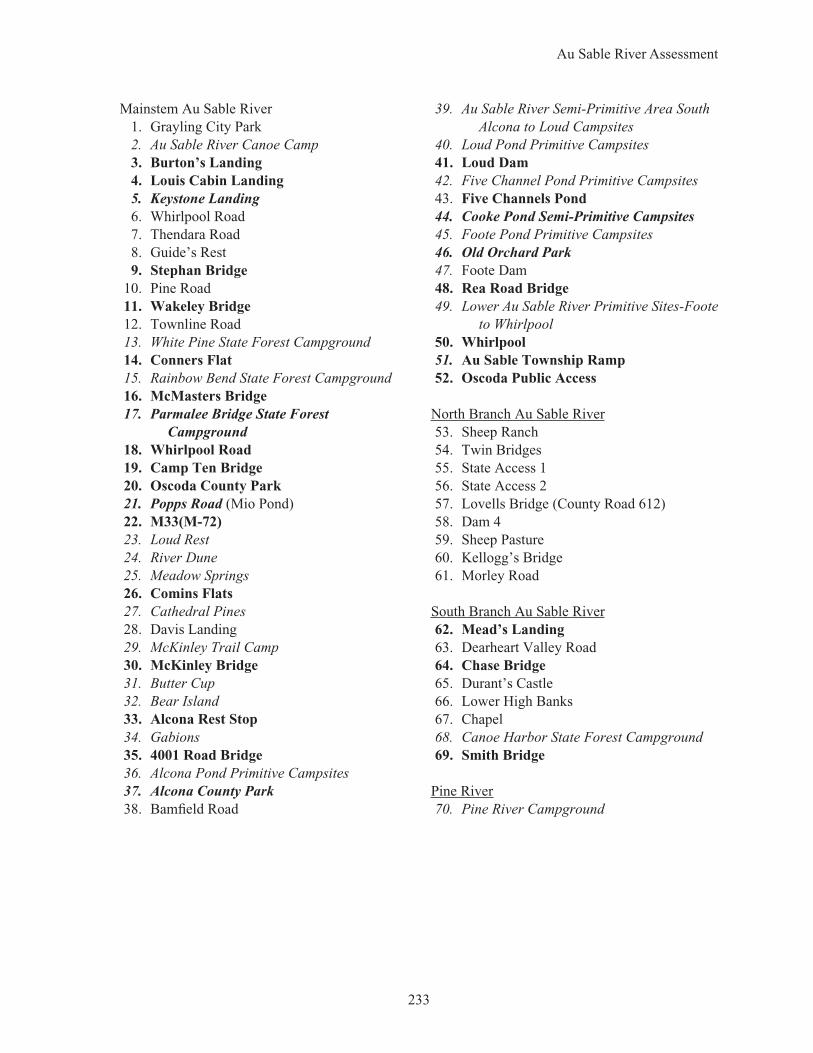
Figure 35.–Designated public access sites along the Au Sable River and its tributaries. Data from Michigan Department of Natural Resources and United States Forest Service records. Listed on the following page, access sites are categorized using font types as follows: regular = walk in access; regular, italics = walk in access and campground; bold = boat ramp; bold, italics = boat ramp and campground.
28
29
30 3132
3334 35
3637
38
39
4041
4243
70
44
45
46
47
48 49
50
51
52
1 2
5
6
7
8
9
1011
12
13
14
53
54
55
5657
58
5960
61
6263
6465
66
67
68 69
15
16
17 1819
20
21 22
23
2425 26
27
3
4
Lak
e H
uro
n
Oscoda
Glennie
Barton CityLincoln
SouthBranch
Mc Kinley
Fairview
Luzerne
St. Helen
Roscommon
Grayling
Frederic
Waters
Gaylord
Lewiston
Lovells
Mio
N
EW
S
0 10
MILES
Au Sable River Assessment
233
Mainstem Au Sable River 1. Grayling City Park 2. Au Sable River Canoe Camp 3. Burton’s Landing 4. Louis Cabin Landing 5. Keystone Landing 6. Whirlpool Road 7. Thendara Road 8. Guide’s Rest 9. Stephan Bridge 10. Pine Road 11. Wakeley Bridge 12. Townline Road 13. White Pine State Forest Campground 14. Conners Flat 15. Rainbow Bend State Forest Campground 16. McMasters Bridge 17. Parmalee Bridge State Forest
Campground 18. Whirlpool Road 19. Camp Ten Bridge 20. Oscoda County Park 21. Popps Road (Mio Pond) 22. M33(M-72) 23. Loud Rest 24. River Dune 25. Meadow Springs 26. Comins Flats 27. Cathedral Pines 28. Davis Landing 29. McKinley Trail Camp 30. McKinley Bridge 31. Butter Cup 32. Bear Island 33. Alcona Rest Stop 34. Gabions 35. 4001 Road Bridge 36. Alcona Pond Primitive Campsites 37. Alcona County Park 38. Bamfield Road
39. Au Sable River Semi-Primitive Area South Alcona to Loud Campsites
40. Loud Pond Primitive Campsites 41. Loud Dam 42. Five Channel Pond Primitive Campsites 43. Five Channels Pond 44. Cooke Pond Semi-Primitive Campsites 45. Foote Pond Primitive Campsites 46. Old Orchard Park 47. Foote Dam 48. Rea Road Bridge 49. Lower Au Sable River Primitive Sites-Foote
to Whirlpool 50. Whirlpool 51. Au Sable Township Ramp 52. Oscoda Public Access
North Branch Au Sable River 53. Sheep Ranch 54. Twin Bridges 55. State Access 1 56. State Access 2 57. Lovells Bridge (County Road 612) 58. Dam 4 59. Sheep Pasture 60. Kellogg’s Bridge 61. Morley Road
South Branch Au Sable River 62. Mead’s Landing 63. Dearheart Valley Road 64. Chase Bridge 65. Durant’s Castle 66. Lower High Banks 67. Chapel 68. Canoe Harbor State Forest Campground 69. Smith Bridge
Pine River 70. Pine River Campground

Au Sable River Assessment
234


![Clutha River/Mata-au Plan - Central Otago District Council Plans... · The Clutha River/Mata-au and its lakes and tributaries [the river] are significant features of the Central Otago](https://img.pdfslide.us/doc/110x75/5c86fd6509d3f2206a8c8c55/clutha-rivermata-au-plan-central-otago-council-plans-the-clutha-rivermata-au.jpg)