Embed Size (px)
Citation preview
Pro
ActiveRoadwaySafety
and
theFuture
ofResearchandPractice
Dr.MohamedAbdelAty,PE
Professor
DepartmentofCivil,Env.&ConstructionEngineering
Deputy
Director
CenterforAdvancedTransportationSystemsSimulation
UniversityofCentralFlorida,U
SA
Associate
Editor,AccidentAnalysis&Prevention


TrafficSafety:AGrowingConcern
The
concern
about
traffic
safety
has
been
growing
over
the
years
indeveloped
and
developingcountriesalike
In2010;33,883
people
were
killed
intraffic
crashesin
theUS.About2.24millionpeople
were
injured
(total5.5
million
crashes
cost
exceeds$230Billion)
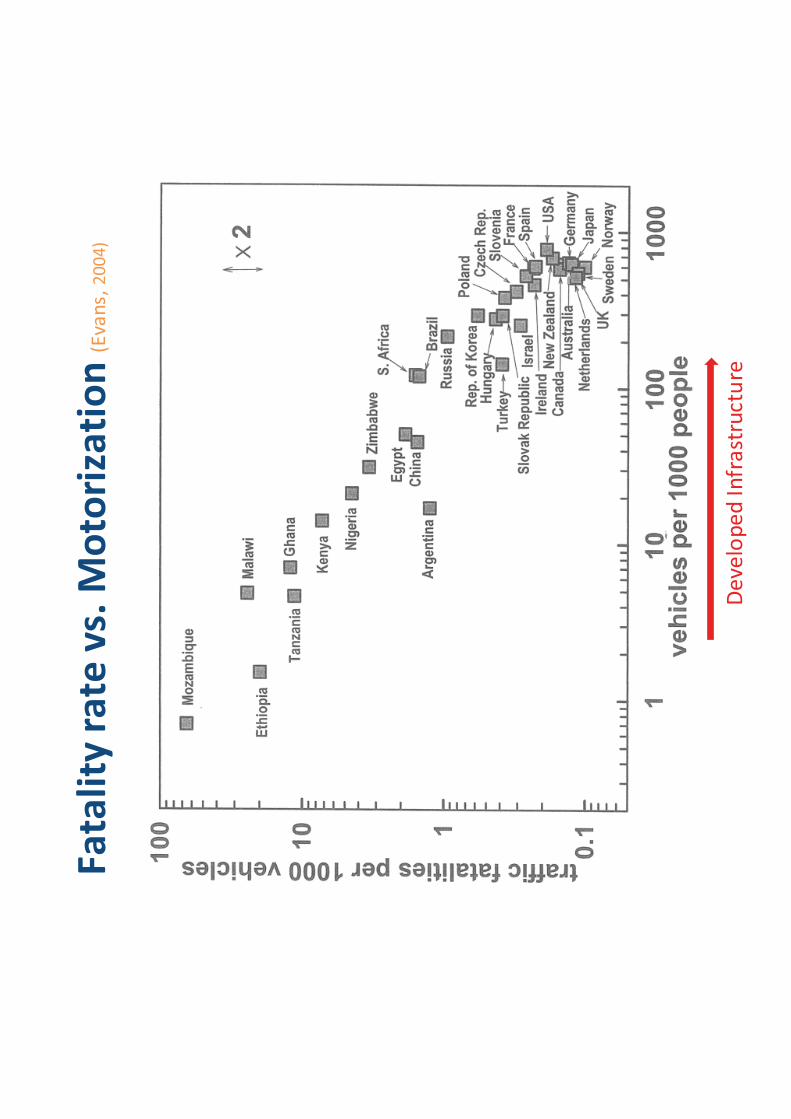
Fatality
rate
vs.Motorization
(Evans,
2004)
DevelopedInfrastructure
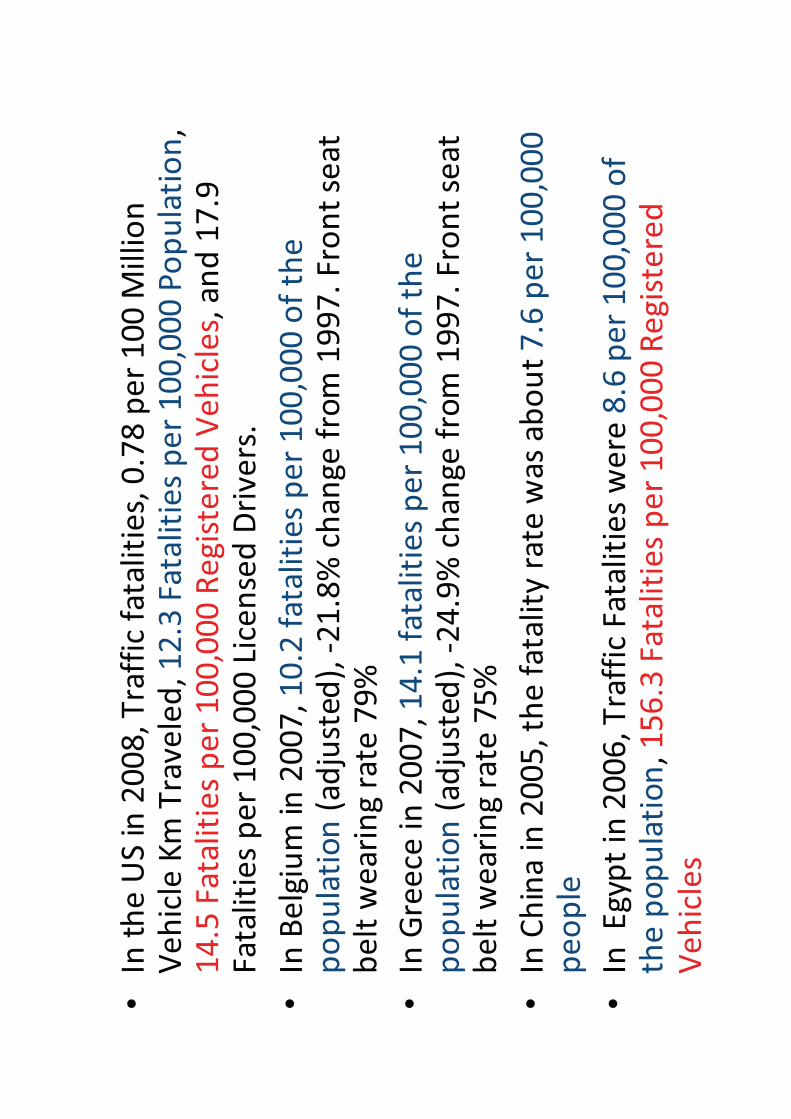
•In
theUSin2008,Trafficfatalities,0.78per100Million
VehicleKm
Traveled,12.3Fatalitiesper100,000Population,
14.5Fatalitiesper100,000RegisteredVehicles,and17.9
Fatalitiesper100,000LicensedDrivers.
•In
Belgium
in2007,10.2fatalitiesper100,000ofthe
population(adjusted),
21.8%changefrom
1997.Frontseat
beltwearingrate
79%
•In
Greece
in2007,14.1fatalitiesper100,000ofthe
population(adjusted),
24.9%changefrom
1997.Frontseat
beltwearingrate
75%
•In
Chinain2005,thefatalityrate
wasabout7.6per100,000
people
•In
Egyptin2006,TrafficFatalitieswere
8.6per100,000of
thepopulation,156.3Fatalitiesper100,000Registered
Vehicles
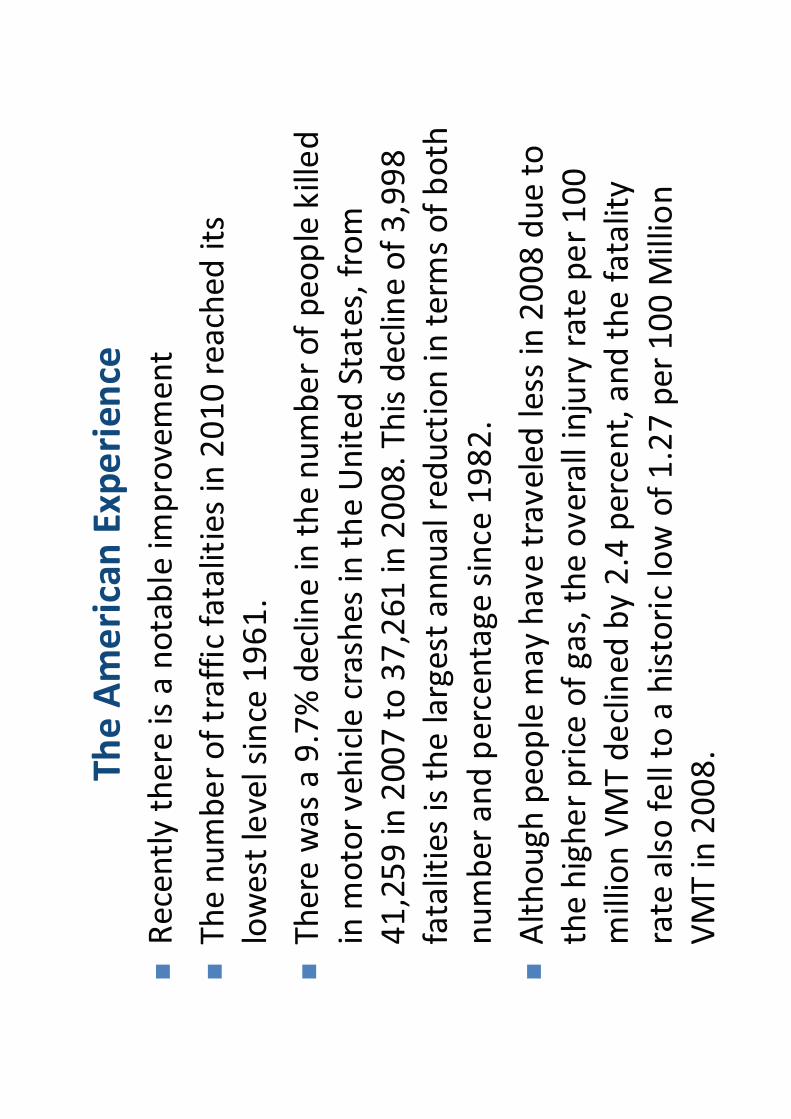
TheAmericanExperience
Recentlythere
isanotableim
provement
Thenumberoftrafficfatalitiesin2010reachedits
lowestlevelsince
1961.
There
wasa9.7%declineinthenumberofpeoplekilled
inmotorvehiclecrashesintheUnitedStates,from
41,259in2007to
37,261in2008.Thisdeclineof3,998
fatalitiesisthelargestannualreductioninterm
sofboth
numberandpercentagesince
1982.
Althoughpeoplemayhavetraveledless
in2008dueto
thehigherprice
ofgas,theoverallinjury
rate
per100
millionVMTdeclinedby2.4percent,andthefatality
rate
alsofellto
ahistoriclowof1.27per100Million
VMTin2008.
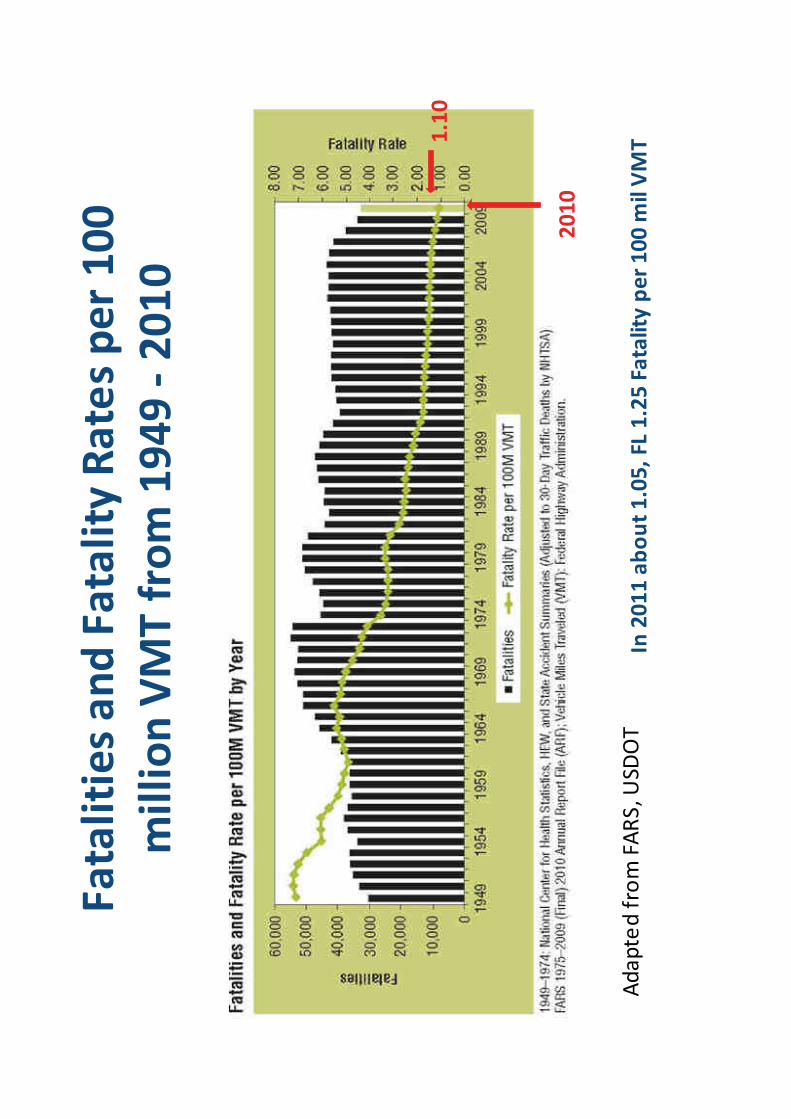
FatalitiesandFatality
Ratesper100
millionVMTfrom
1949
2010
AdaptedfromFARS,U
SDOT
In2011about1.05,FL
1.25Fatalityper100milVMT
2010
1.10
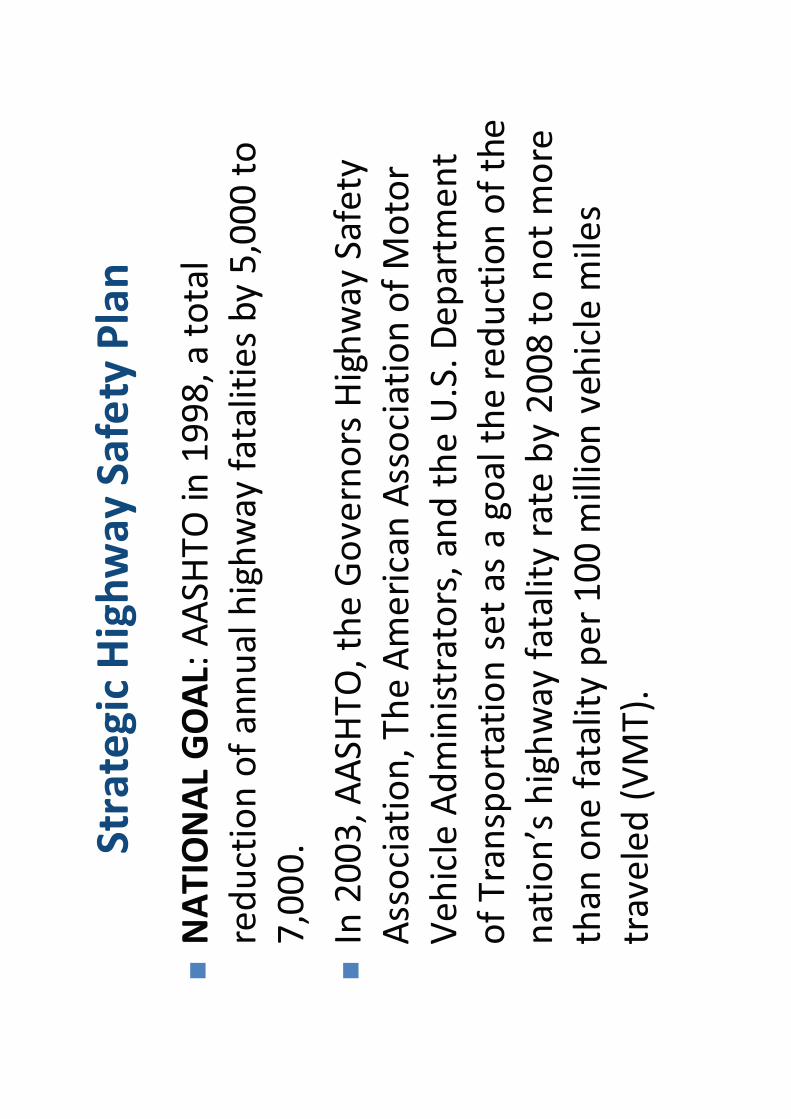
StrategicHighwaySafety
Plan
NATIONALGOAL:AASHTOin1998,atotal
reductionofannualhighwayfatalitiesby5,000to
7,000.
In2003,AASHTO,theGovernorsHighwaySafety
Association,TheAmericanAssociationofMotor
VehicleAdministrators,andtheU.S.Department
ofTransportationsetasagoalthereductionofthe
nation’shighwayfatalityrate
by2008to
notmore
thanonefatalityper100millionvehiclemiles
traveled(VMT).
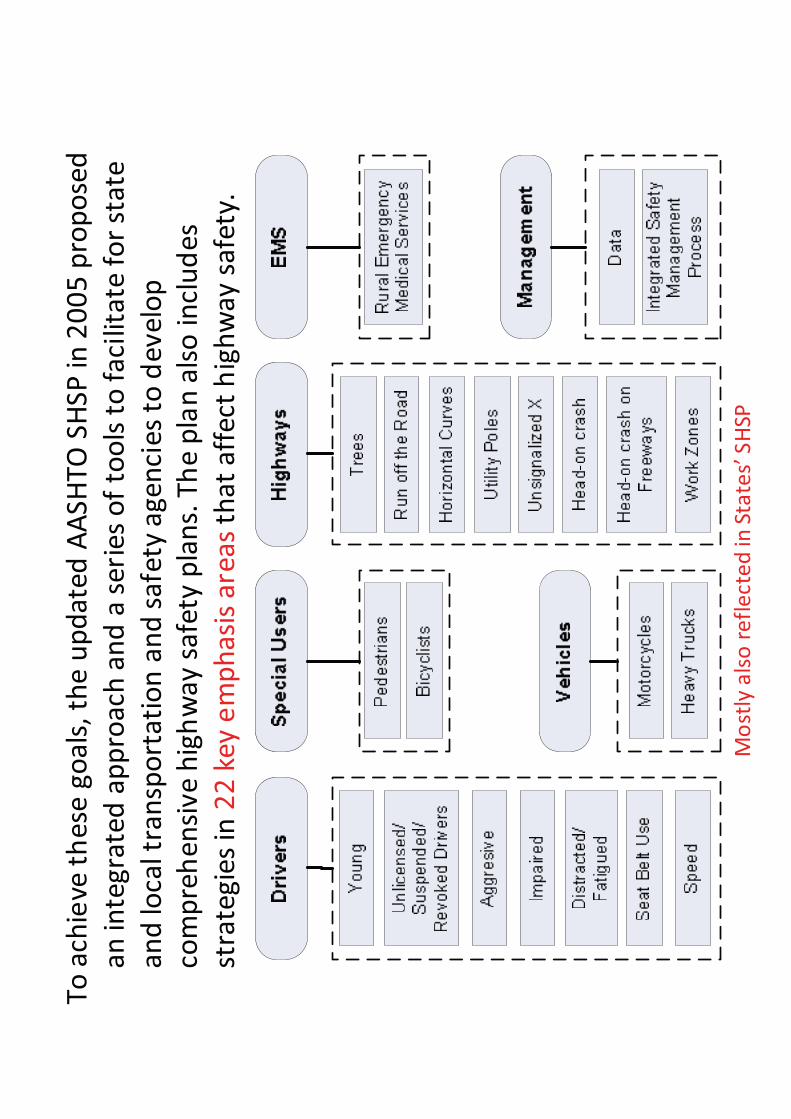
Toachieve
these
goals,theupdatedAASHTOSHSPin2005proposed
anintegratedapproach
andaseriesoftoolsto
facilitate
forstate
andlocaltransportationandsafetyagenciesto
develop
comprehensivehighwaysafety
plans.Theplanalsoincludes
strategiesin22keyemphasisareasthataffecthighwaysafety.
MostlyalsoreflectedinStates’SHSP
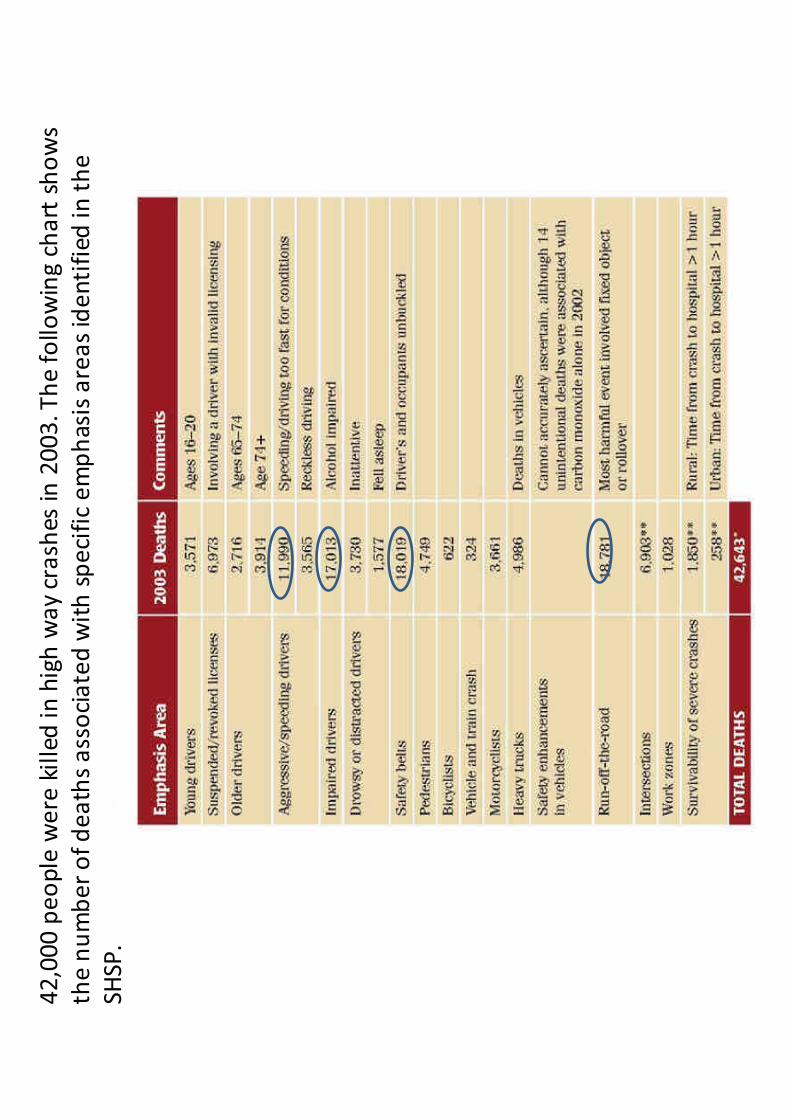
42,000peoplewere
killed
inhighwaycrashes
in2003.Thefollowingchartshows
thenumberofdeathsassociatedwithspecificemphasisareasidentified
inthe
SHSP.
StrategicHighwaySafety
Plan(cont.)
CurrentlyAASHTOisdeveloping“Toward
Zero
Deaths:aNationalStrategyonHighway
Safety”.
Thenationalstrategywillhave
twotiers:
CulturalChangeandBuildingtheFoundation
ofSafety.
HighwaySafety
Manual,Providefactualinform
ationand
toolsto
facilitate
roadwaydesignandoperationaldecisions
basedonexplicitconsiderationonsafety
consequences.
SHRP2:StrategicHighwayResearchProgram
2,Safety,
Preventorreduce
theseverityofhighwaycrashesby
understandingdriverbehavior(naturalisticdriving).
SafetyAnalyst:Asetofsoftware
toolsusedbyhighway
agenciesto
improve
theirprogrammingofsite
specific
highwaysafety
improvements.
IHSDM:InteractiveHighwaySafety
DesignModel,Asuite
ofsoftware
analysistoolsforevaluatingsafety
and
operationaleffectsofgeometricdesigndecisionson
highways.
Exam
ple
s o
f Im
ple
men
tati
on
gu
ides
an
d t
oo
ls
HighwaySafety
Manual
•TheTransportationResearchBoard
hasrecently
(2010)publishedtheHighwaySafetyManualto
fill
thegapbetw
eenstate
oftheartandstate
of
practice.
–PartA:Introduction,Human
FactorsandFundamentals
–PartB:RoadwaySafetyManagementProcess
–PartC:Predictive
Method
–PartD:Crash
ModificationFactors
HighwaySafety
Manual
HighwaySafetyManual(HSM)Im
plementationGoals
•IntegrationofSafetyindayto
dayactivities
•HSM
becomesatoolroutinelyusedbytransportation
professionals
•Safetyisalwaysanotherquantifiedparameter
–SafetyPerform
ance
Measurement
•SafetyPerform
ance
Functions(SPF)
•Crash
ModificationFactors(CMF)
FHWA:HighwaySafetyIm
provementProgram
FHWA:IntersectionSafetyProgram
FHWA:LocalandRuralRoadSafetyProgram
FHWA:Pedestrian&BicycleSafetyProgram
FHWA:RoadwayDeparture
SafetyProgram
FHWA:SpeedManagementSafetyProgram
FHWA:Guidance
Memorandum
on
ConsiderationandIm
plementationofProven
SafetyCounterm
easures
Recen
t Safe
ty I
mp
rovem
ent
Pro
gra
ms
ConsiderationandIm
plementationof
ProvenSafety
Counterm
easures
•RoadSafetyAudits(crash
reductionupto
60%)
•RumbleStripsandRumbleStripes(15%ofinjury
crash
reductiononruraltwolaneroads).
•MedianBarriers(Cablesystems)
•Roundabouts
•LeftandRightturn
lanesatstopcontrolled
Intersections
•Yellowchangeintervals
•MediansandPedestrianrefugeareasatUrban
andSuburbanAreas
•Safety
Edge(3035o)
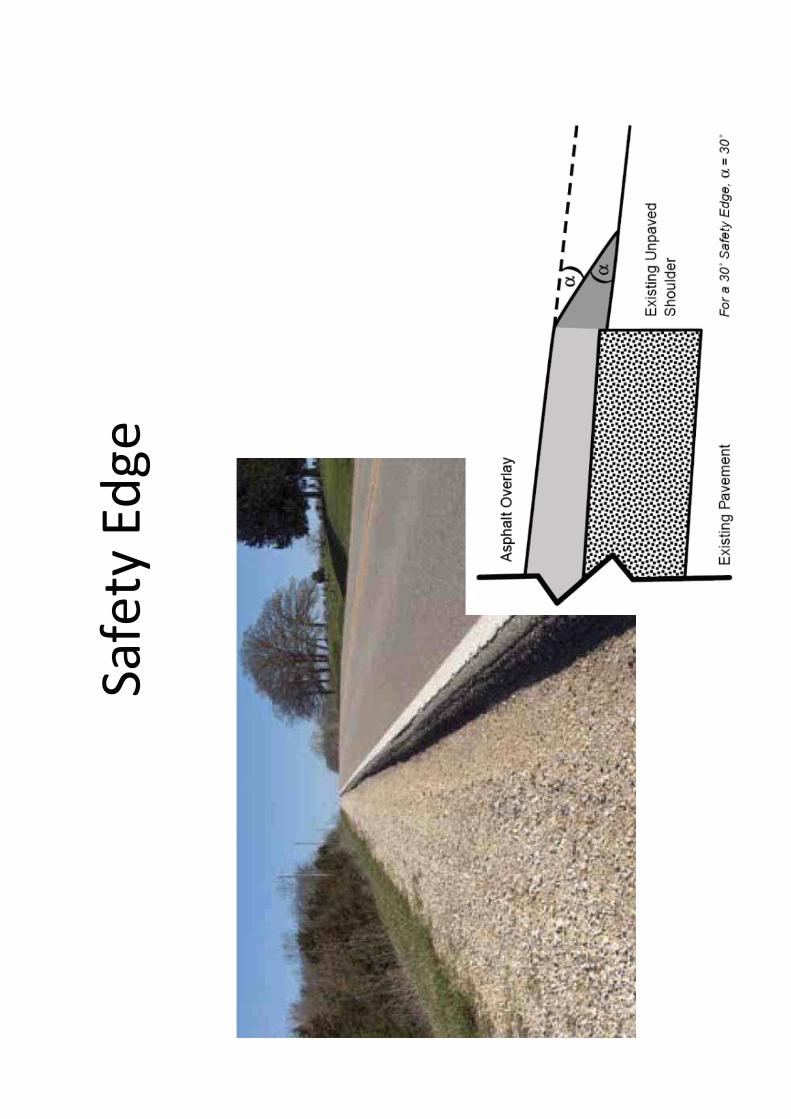
Safety
Edge
NHTSA
:Counterm
easuresthatWork:HighwaySafety
Counterm
easure
Guide(4
thEd.2009).
CMFClearinghouse
NHTSA
:AggressiveDrivingEnforcement:Strategiesfor
ImplementingBestPractices
NHTSA
:IdentifyingStrategiesto
Reduce
thePercentageof
UnrestrainedYoungChildren
NHTSA
:IncreasingSeatBeltUse
ThroughState
Level
DemonstrationProjects
NHTSA
:DevelopmentandTestingofCounterm
easuresfor
FatigueRelatedHighwayCrashes
NHTSA
:DriverStrategiesforEngaginginDistractingTasks
UsingIn
vehicleTechnology
Recen
t Safe
ty I
mp
rovem
ent
Pro
gra
ms
CurrentSafety
Approach
•MostlyReactive
•Dependonblack
“hot”spotidentificationand
identifyingthefactorsthatcontribute
tocrash
occurrence
andseverity
•Problemsalreadyoccurringanddamage
alreadydone
•Im
portantbutnotenough
•Challengesare
increasingandresourcesare
limited
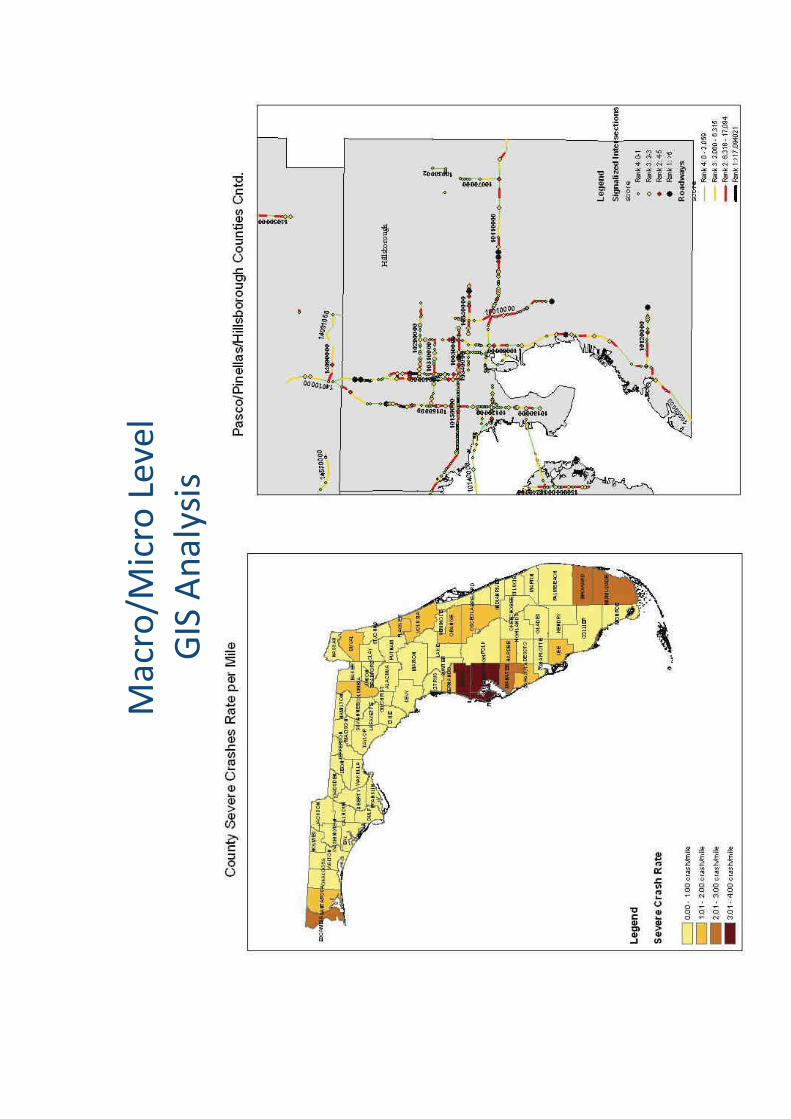
Macro/M
icro
Level
GISAnalysis
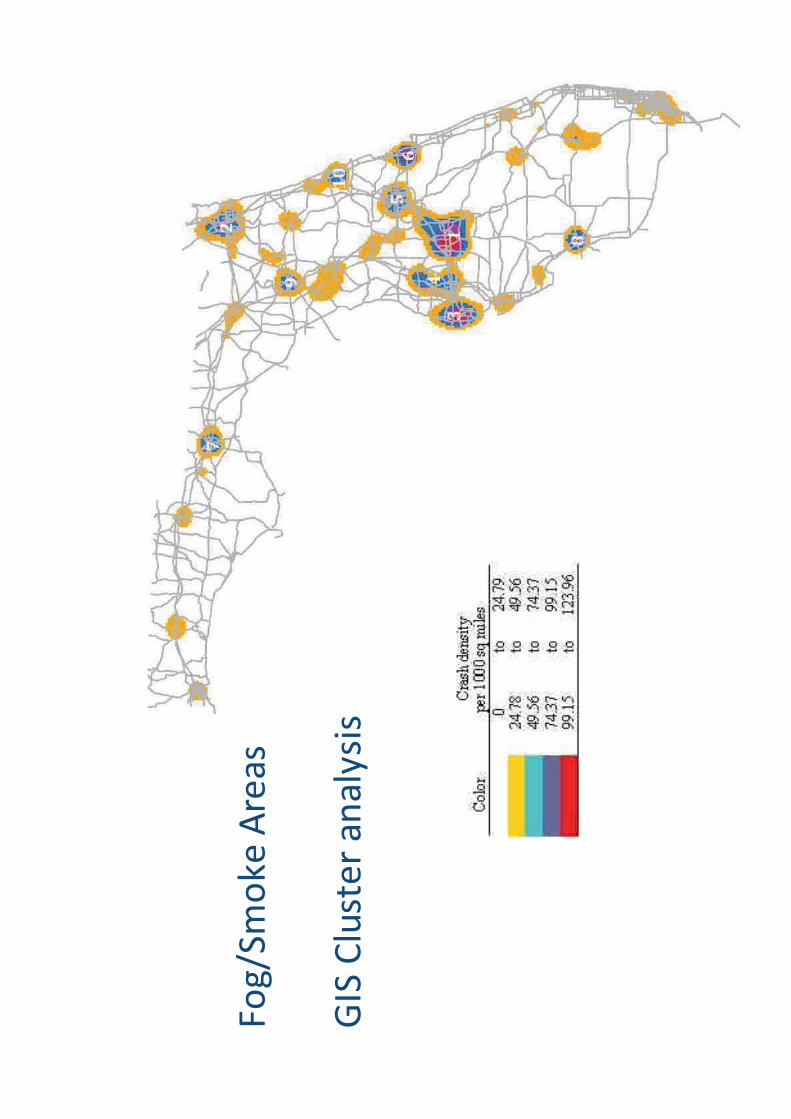
Fog/SmokeAreas
GISClusteranalysis
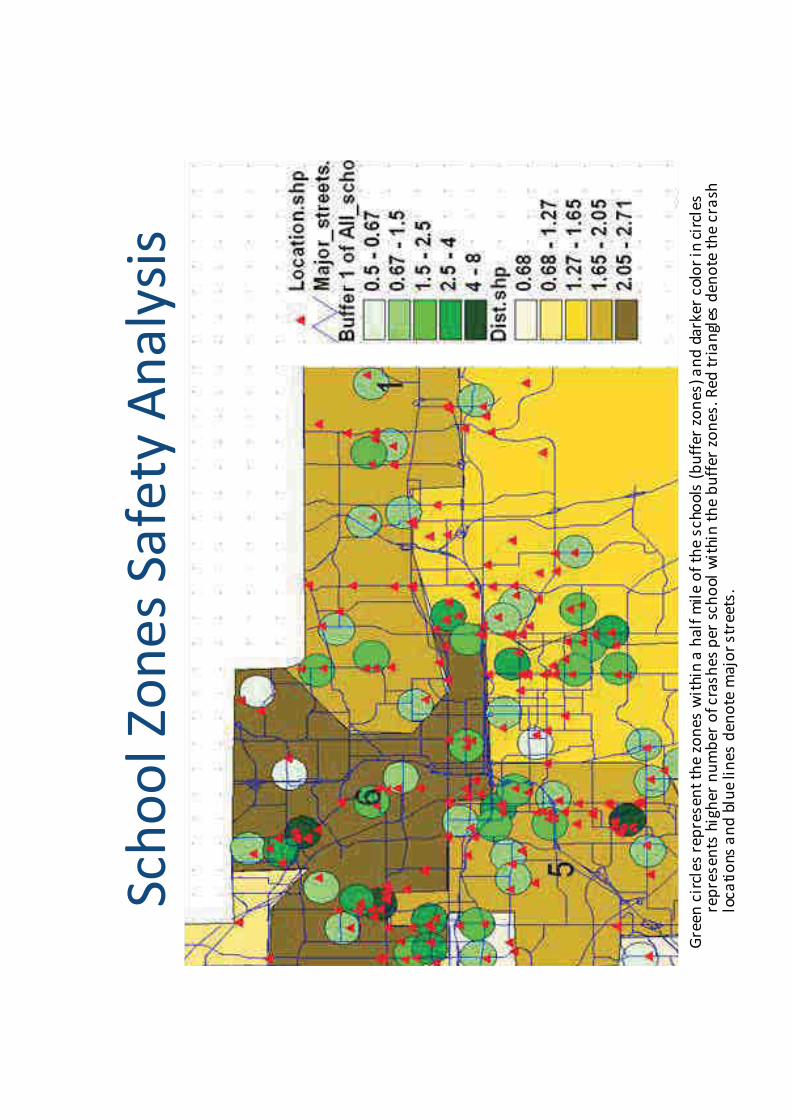
SchoolZonesSafety
Analysis
Greencirclesrepresentthezoneswithinahalfmileoftheschools(bufferzones)anddarkercolorincircles
representshighernumberofcrashesperschoolwithinthebufferzones.Redtriangles
denotethecrash
locations
andbluelinesdenotemajorstreets.
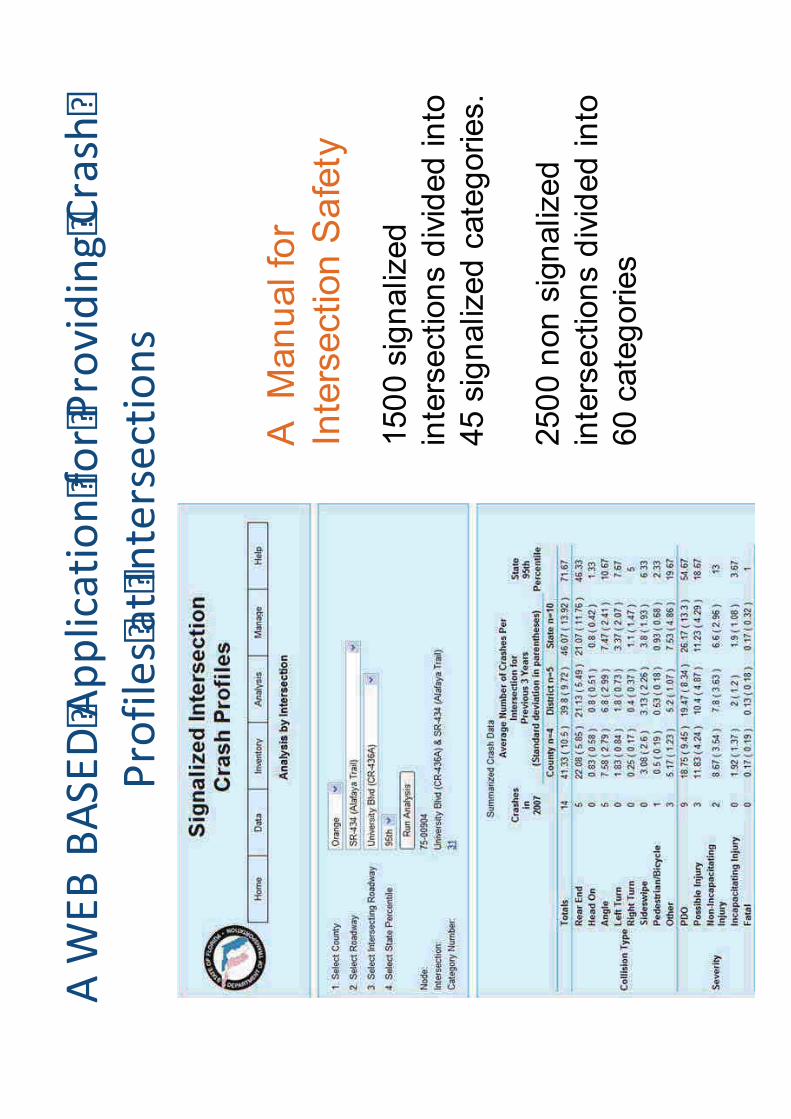
AWEBBASEDApplicationforProvidingCrash
ProfilesatIntersections
A
Man
ual fo
r
Inte
rsection
Sa
fety
150
0 s
ign
aliz
ed
inte
rsection
s d
ivid
ed
in
to
45 s
ign
aliz
ed
cate
gories.
250
0 n
on
sig
naliz
ed
inte
rsection
s d
ivid
ed
in
to
60 c
ate
gories
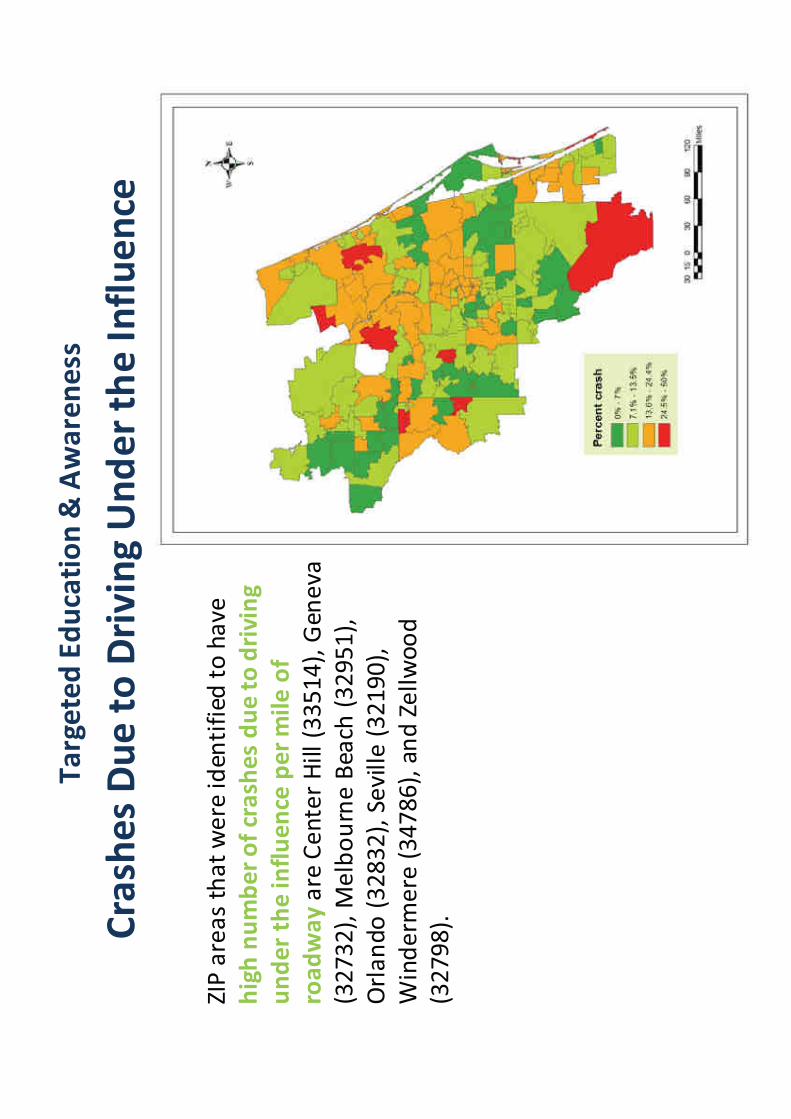
CrashesDueto
DrivingUndertheInfluence
ZIPareasthatwere
identified
tohave
highnumberofcrashesdueto
driving
undertheinfluence
permileof
roadwayare
CenterHill(33514),Geneva
(32732),MelbourneBeach
(32951),
Orlando(32832),Seville(32190),
Winderm
ere
(34786),andZellwood
(32798).
TargetedEducation&Awareness
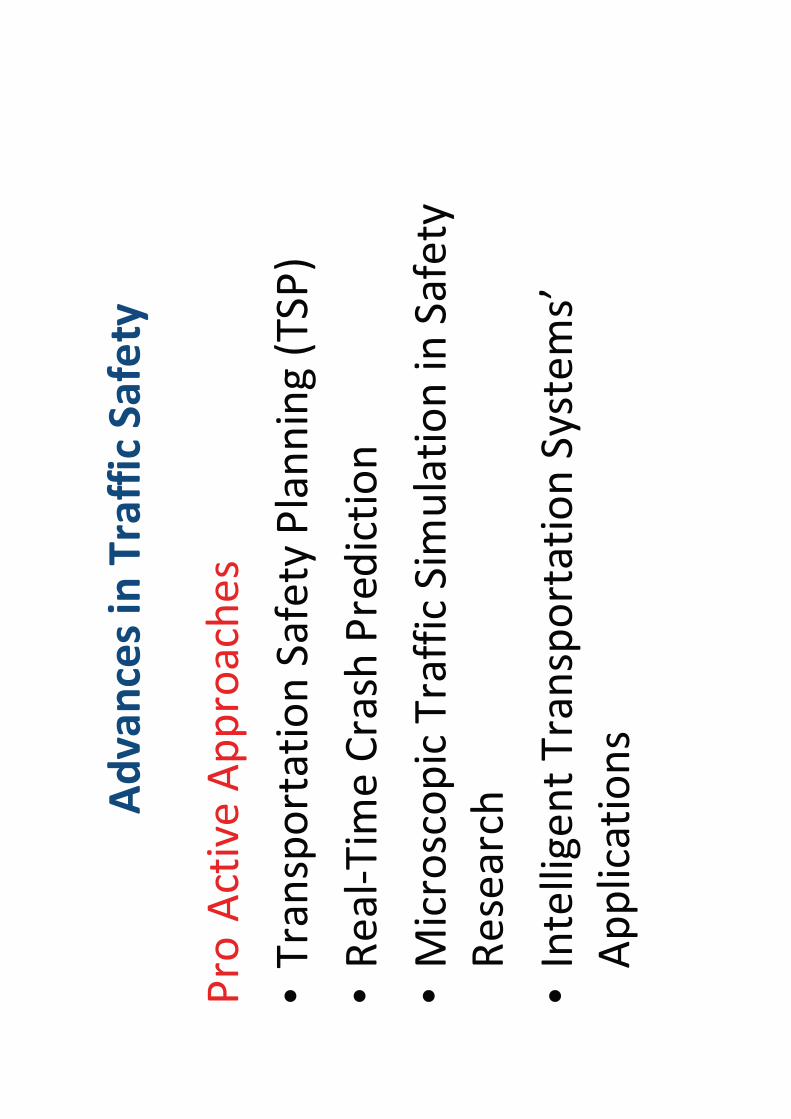
Advancesin
TrafficSafety
Pro
ActiveApproaches
•TransportationSafetyPlanning(TSP)
•RealTim
eCrash
Prediction
•MicroscopicTrafficSim
ulationinSafety
Research
•IntelligentTransportationSystems’
Applications
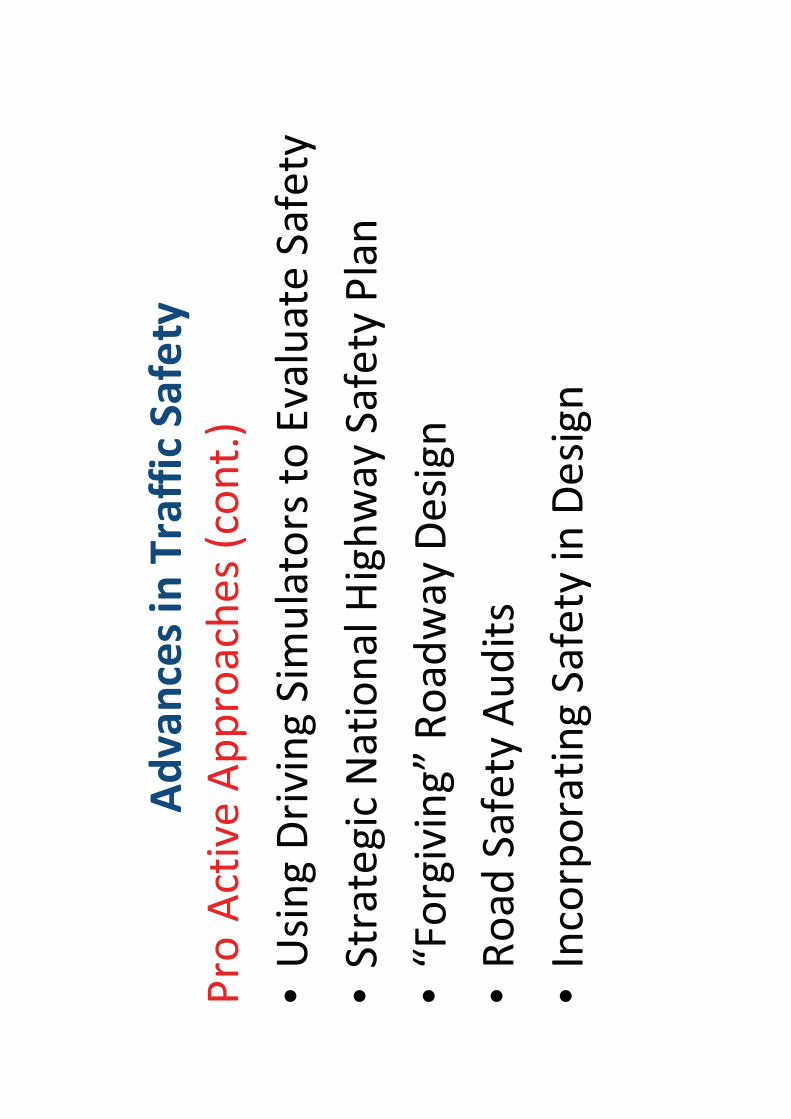
Advancesin
TrafficSafety
Pro
ActiveApproaches(cont.)
•UsingDrivingSim
ulatorsto
Evaluate
Safety
•StrategicNationalH
ighwaySafetyPlan
•“Forgiving”RoadwayDesign
•RoadSafetyAudits
•IncorporatingSafetyinDesign
TransportationSafety
Planning
•TSPisaproactiveapproach
forthepreventionof
accidentsandunsafe
transportationconditionsby
establishinginherentlysafe
transportation
netw
orks.
•Integrate
safety
considerationsinto
the
transportationplanningprocessatalllevels.This
stepshouldbefollowedbyconsiderationofsafety
objectivesinthelongerrangetransportationplan
(i.e.,20yearplan).
•Leadto
furthercollaborationamongtransportation
planners,trafficengineers,safety
stakeholders,
andothers.
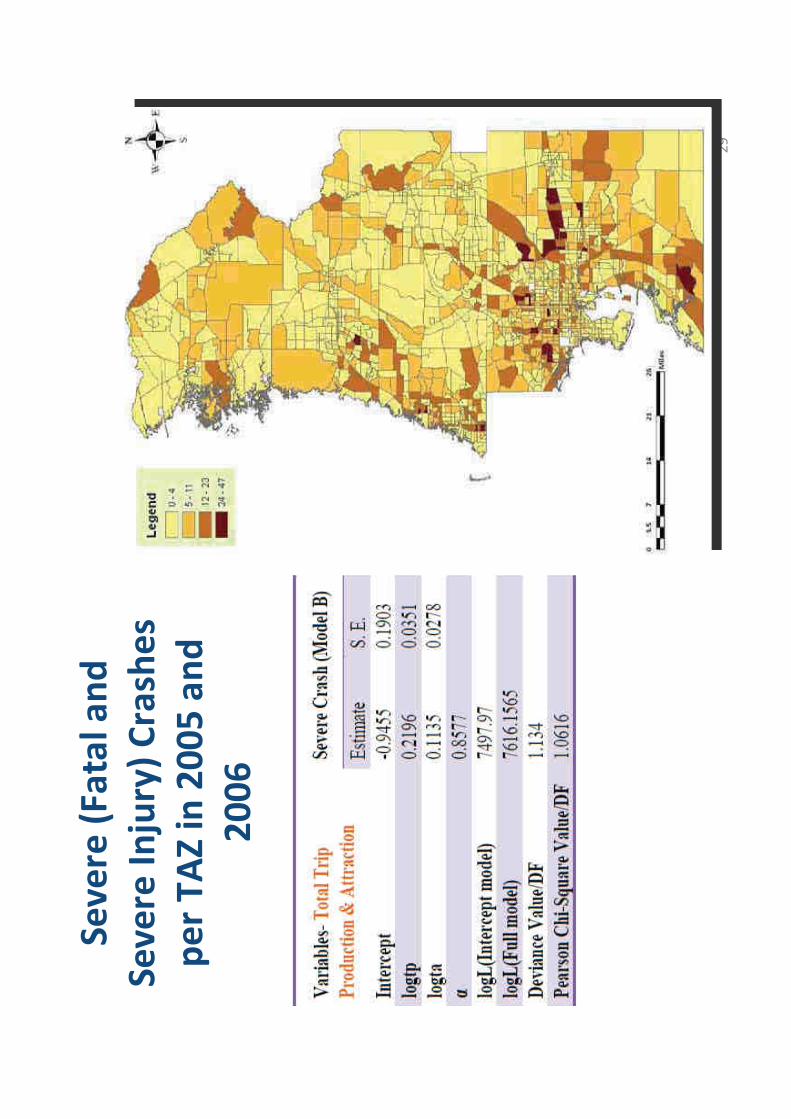
Severe
(Fataland
Severe
Injury)Crashes
perTAZin2005and
2006
29
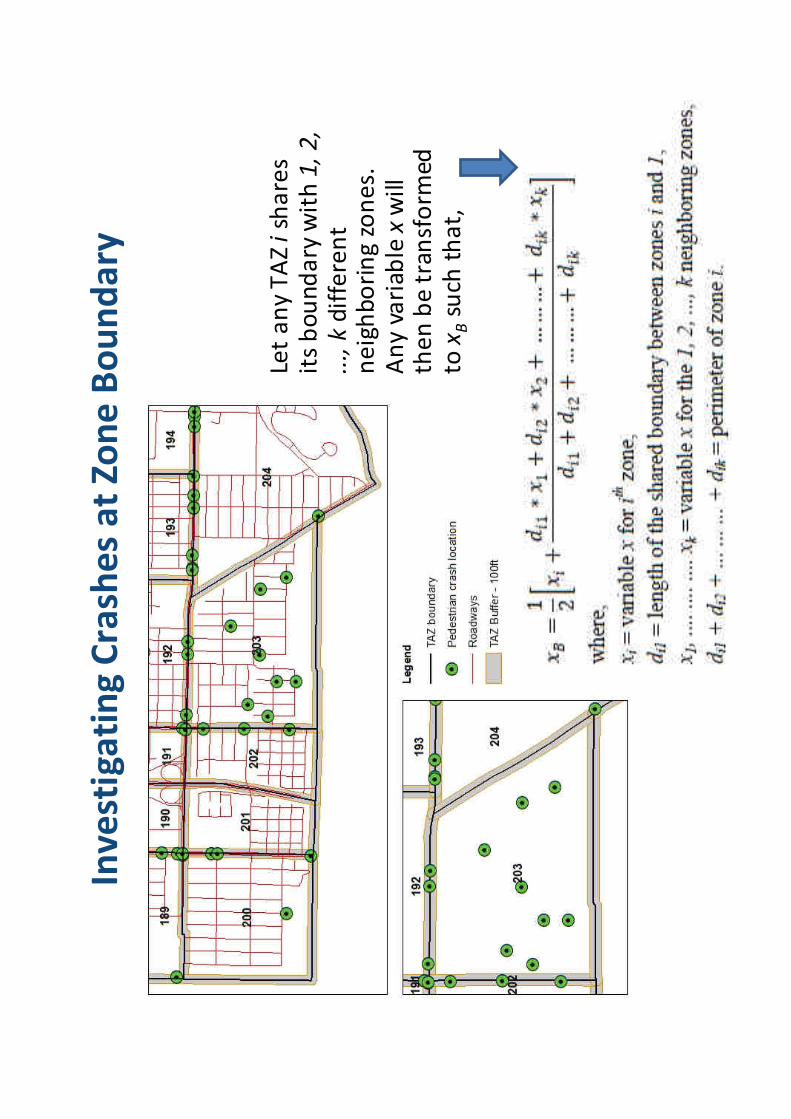
InvestigatingCrashesatZoneBoundary
LetanyTAZishares
itsboundarywith1,2,
...,kdifferent
neighboringzones.
Anyvariablexwill
thenbetransform
edto
xBsuch
that,
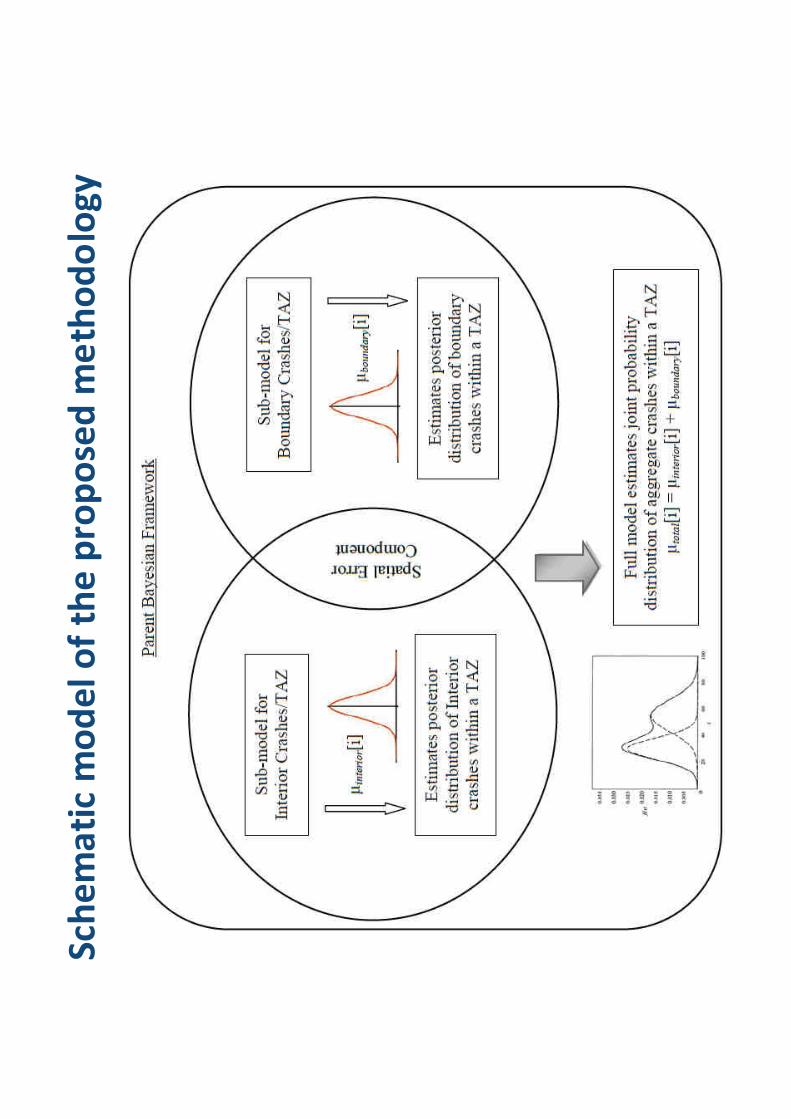
Schematicmodeloftheproposedmethodology
RealTim
eCrash
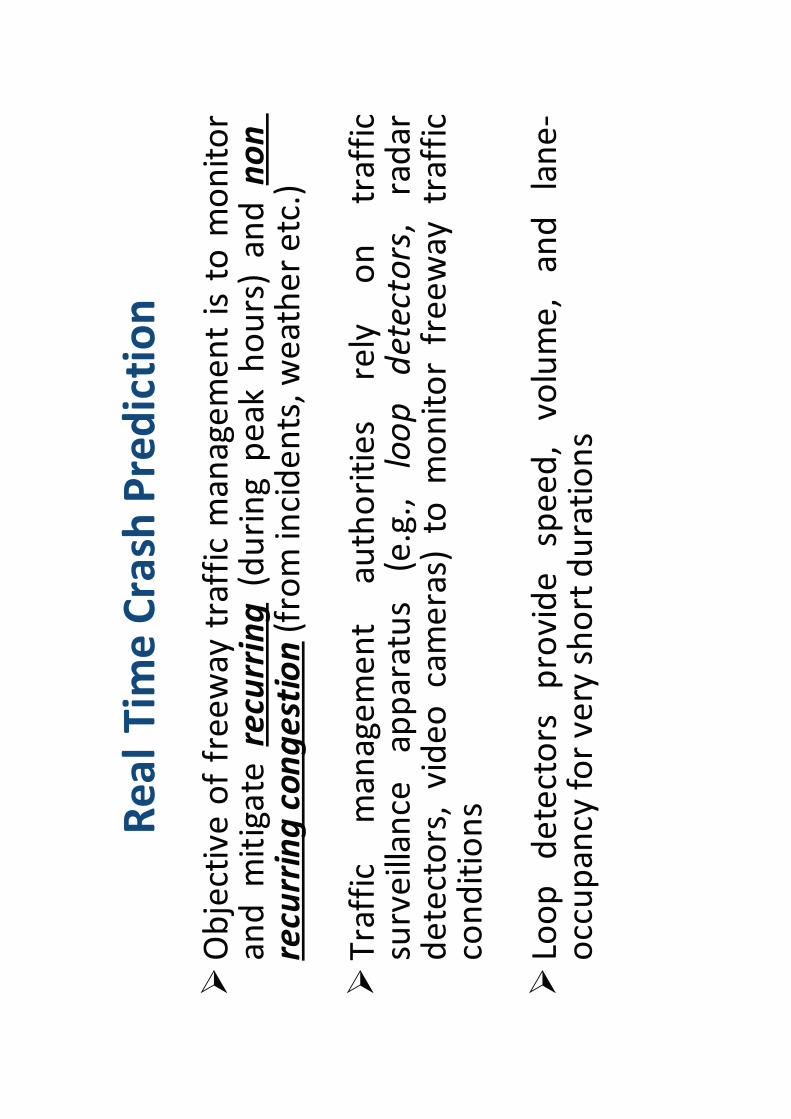
Prediction
Objectiveoffreewaytrafficmanagementisto
monitor
andmitigate
recurring(duringpeakhours)andnon
recurringcongestion(fromincidents,weatheretc.)
Traffic
management
authorities
rely
on
traffic
surveillance
apparatus
(e.g.,
loop
detectors,radar
detectors,videocameras)
tomonitorfreewaytraffic
conditions
Loop
detectors
provide
speed,volume,and
lane
occupancy
forveryshortdurations
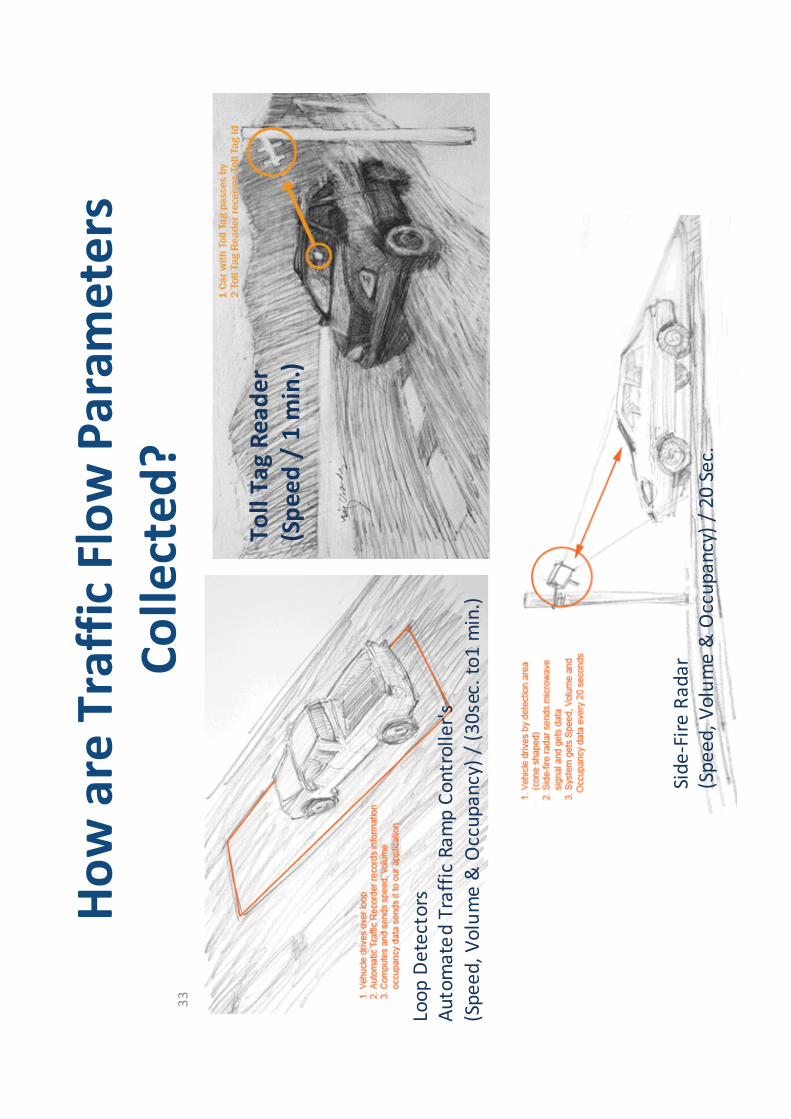
Howare
TrafficFlowParameters
Collected?
TollTagReader
(Speed/1min.)
LoopDetectors
AutomatedTrafficRampController's
(Speed,Volume&Occupancy)/(30sec.to1min.)
SideFire
Radar
(Speed,Volume&Occupancy)/20Sec.
33
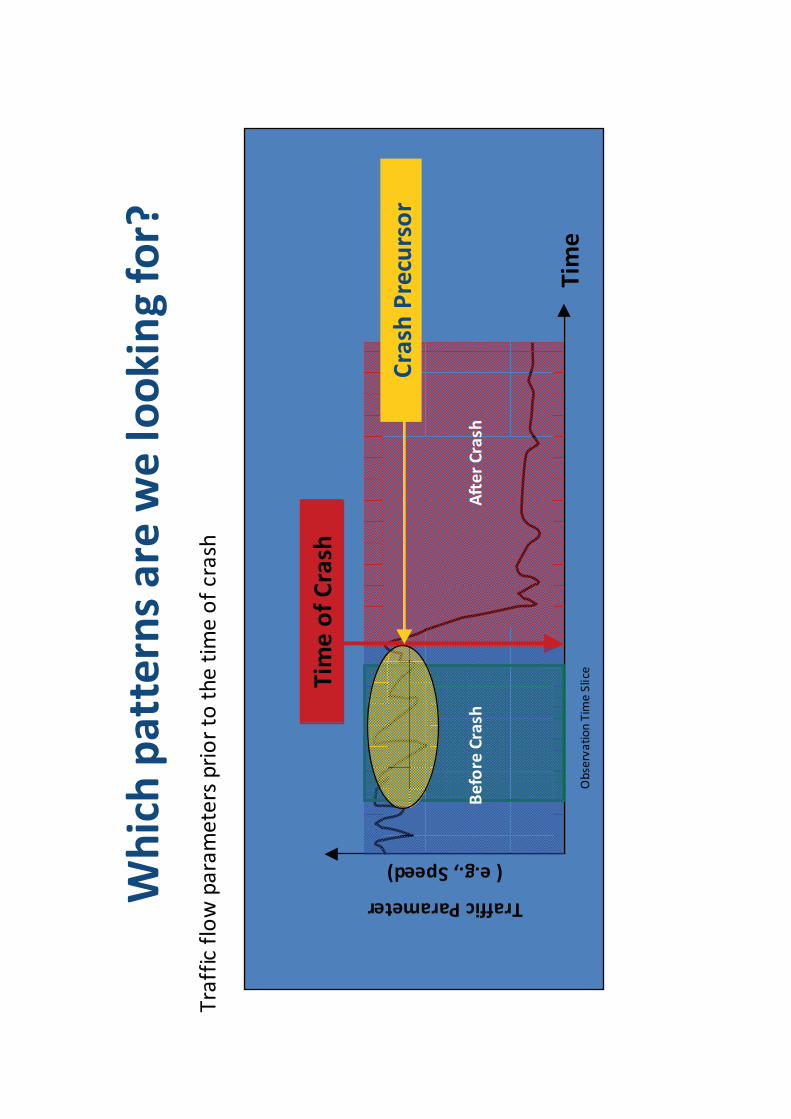
Whichpatternsare
welookingfor?
TrafficParameter
(e.g.,Speed)
Tim
e
Trafficflowparameterspriorto
thetimeofcrash
ObservationTimeSliceTim
eofCrash
AfterCrash
Before
Crash
Crash
Precursor
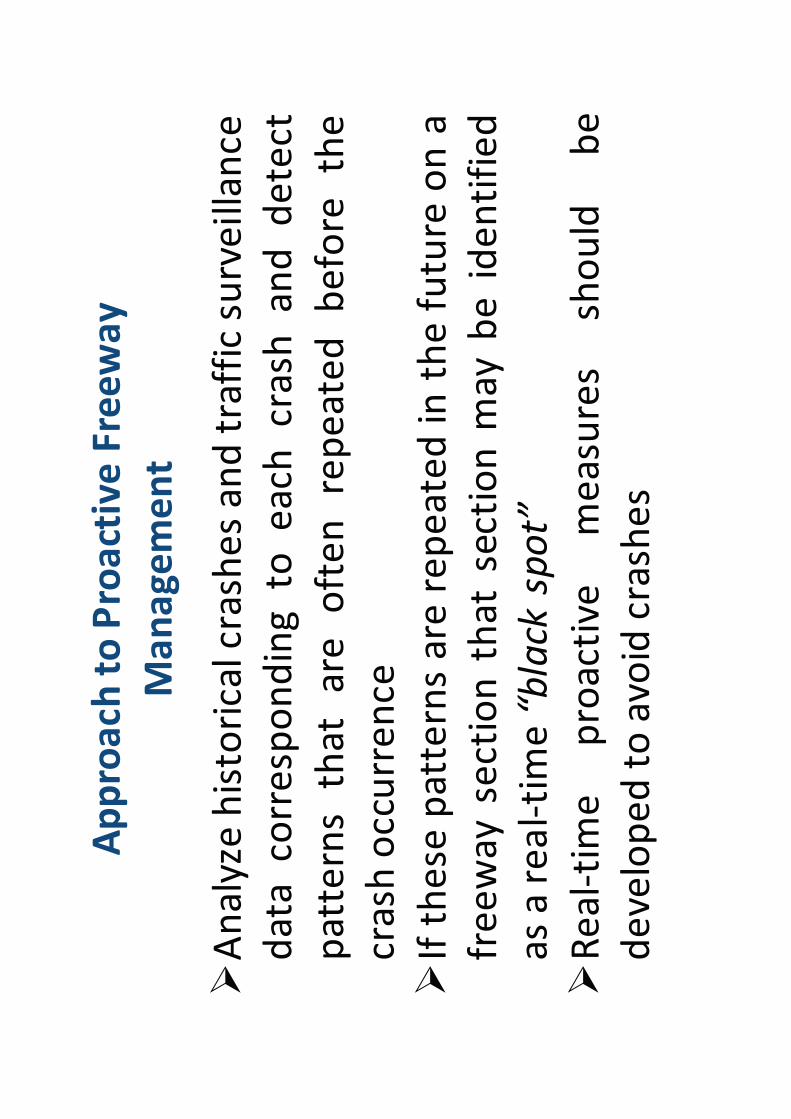
Approach
toProactiveFreeway
Management
Analyze
historicalcrashesandtrafficsurveillance
data
correspondingto
each
crash
and
detect
patternsthatare
often
repeated
before
the
crash
occurrence
Ifthese
patternsare
repeatedin
thefuture
ona
freewaysectionthatsectionmaybeidentified
asarealtime“black
spot”
Realtime
proactive
measures
should
be
developedto
avoidcrashes
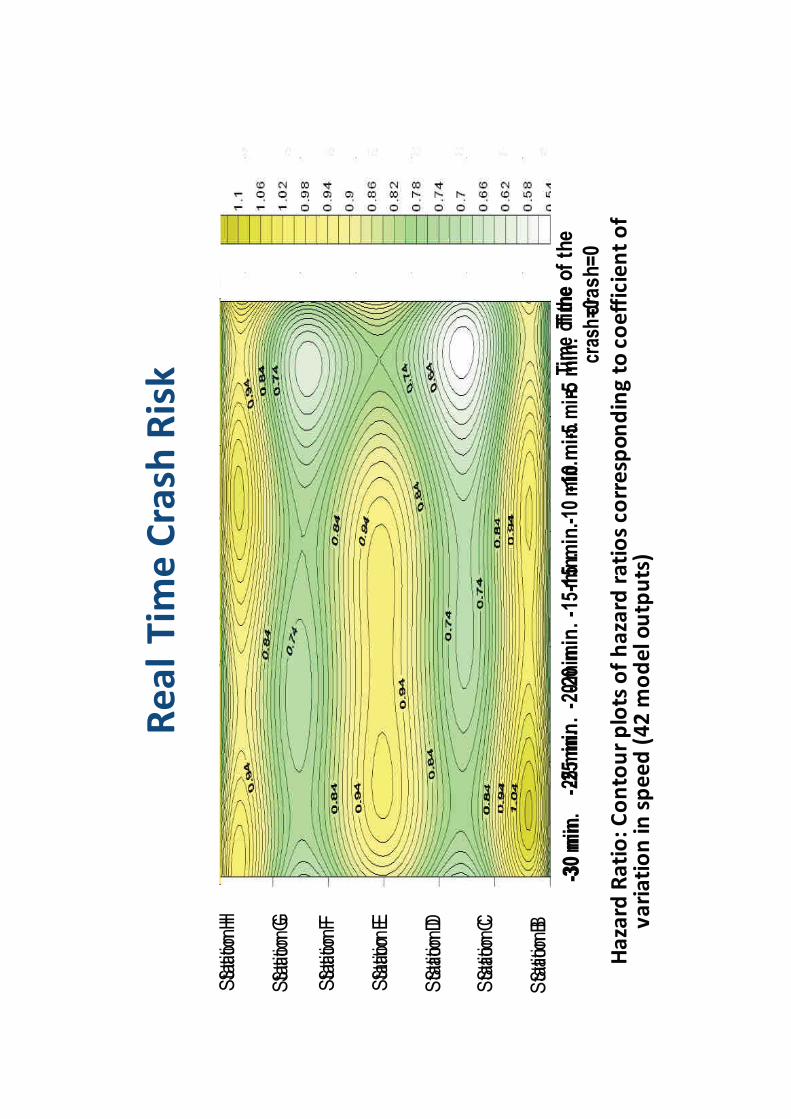
RealTim
eCrash
Risk
Hazard
Ratio:Contourplotsofhazard
ratioscorrespondingto
coefficientof
variationinspeed(42modeloutputs)
Tim
e of
the
cras
h=0
-25
min
.-2
0 m
in.
-15
min
.-1
0 m
in.
-5 m
in.
-30
min
.
Sta
tion
B
Sta
tion
H
Sta
tion
G
Sta
tion
F
Sta
tion
E
Sta
tion
D
Sta
tion
C
Tim
e o
f th
e
cra
sh
=0
-25
min
.-2
0 m
in.
-15
min
.-1
0 m
in.
-5 m
in.
-30
min
.
Sta
tion
B
Sta
tion
H
Sta
tion
G
Sta
tion
F
Sta
tion
E
Sta
tion
D
Sta
tion
C
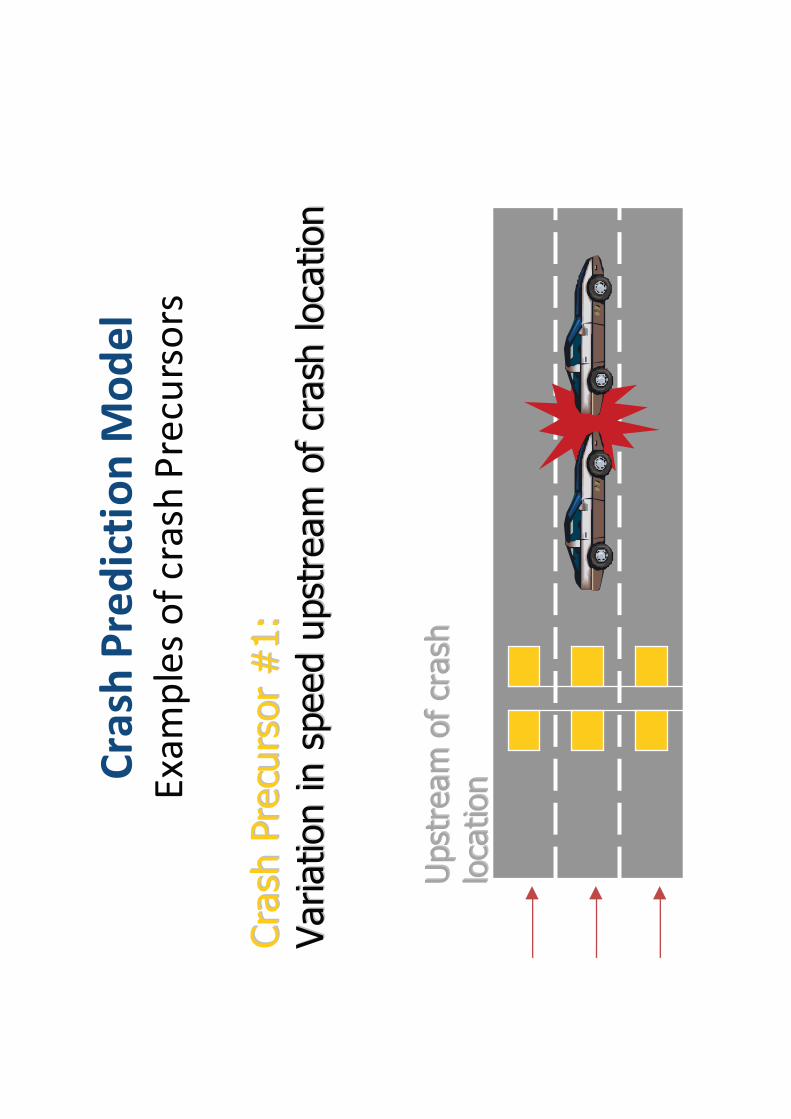
Crash
PredictionModel
Examplesofcrash
Precursors
Cra
sh P
recu
rsor
#1:
Cra
sh P
recu
rsor
#1:
Variation in s
peed u
pst
ream
of cr
ash
loca
tion
Variation in s
peed u
pst
ream
of cr
ash
loca
tion
Upst
ream
of cr
ash
U
pst
ream
of cr
ash
loca
tion
loca
tion
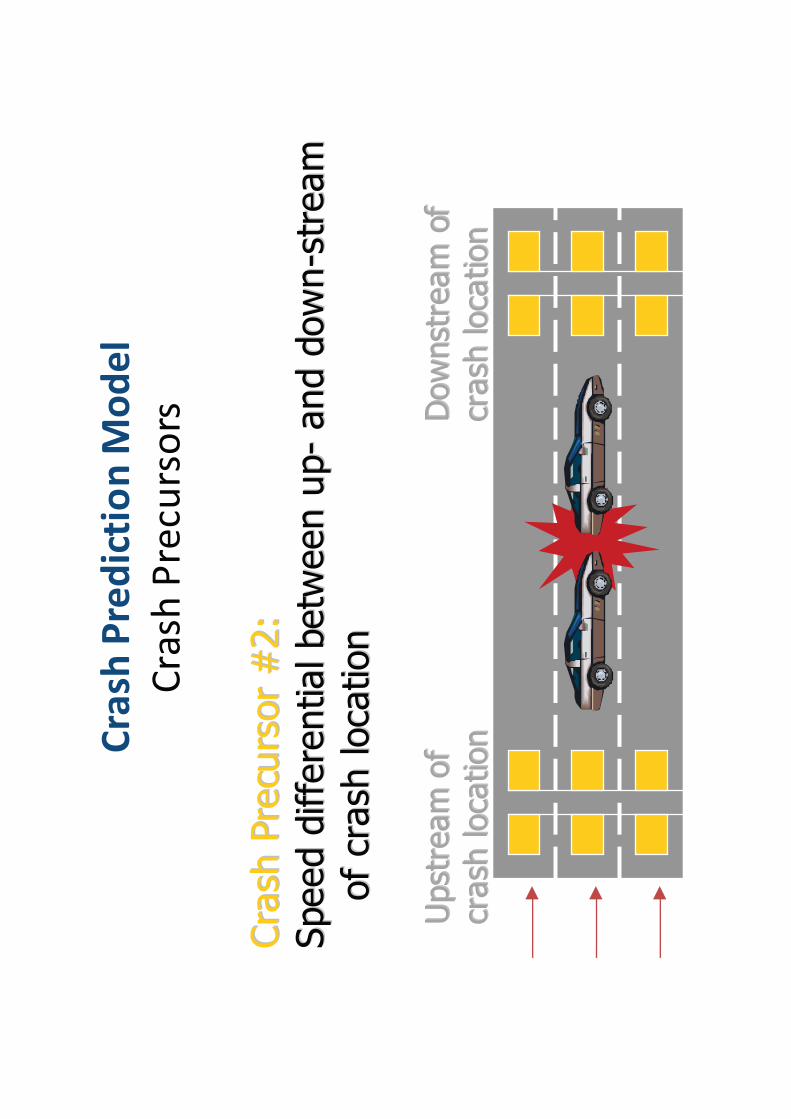
Crash
PredictionModel
Crash
Precursors
Cra
sh P
recu
rsor
#2:
Cra
sh P
recu
rsor
#2:
Speed d
iffe
rential betw
een u
pSpeed d
iffe
rential betw
een u
p--
and d
ow
nand d
ow
n-- s
tream
st
ream
of
crash
loca
tion
of
crash
loca
tion
Upst
ream
of
Upst
ream
of
crash
loca
tion
crash
loca
tion
Dow
nst
ream
of
Dow
nst
ream
of
crash
loca
tion
crash
loca
tion
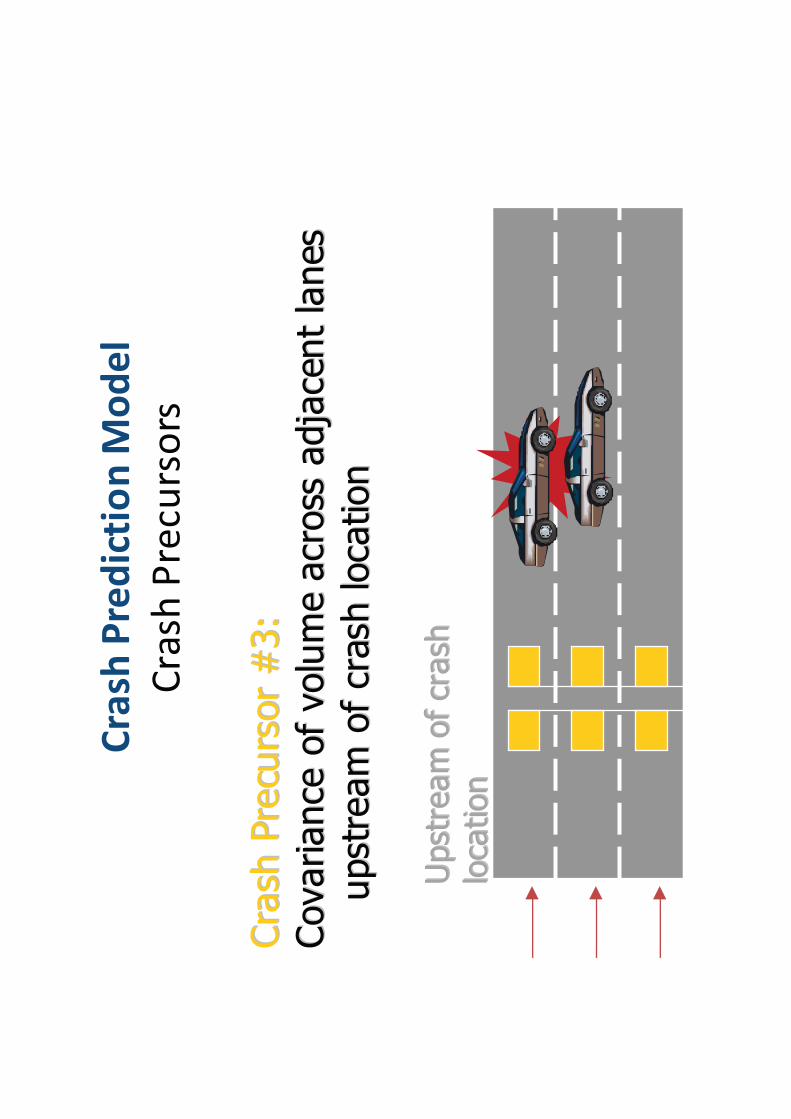
Crash
PredictionModel
Crash
Precursors
Cra
sh P
recu
rsor
#3:
Cra
sh P
recu
rsor
#3:
Covariance
of
volu
me a
cross
adja
cent
lanes
Covariance
of
volu
me a
cross
adja
cent
lanes
upst
ream
of
crash
loca
tion
upst
ream
of
crash
loca
tion
Upst
ream
of cr
ash
U
pst
ream
of cr
ash
loca
tion
loca
tion
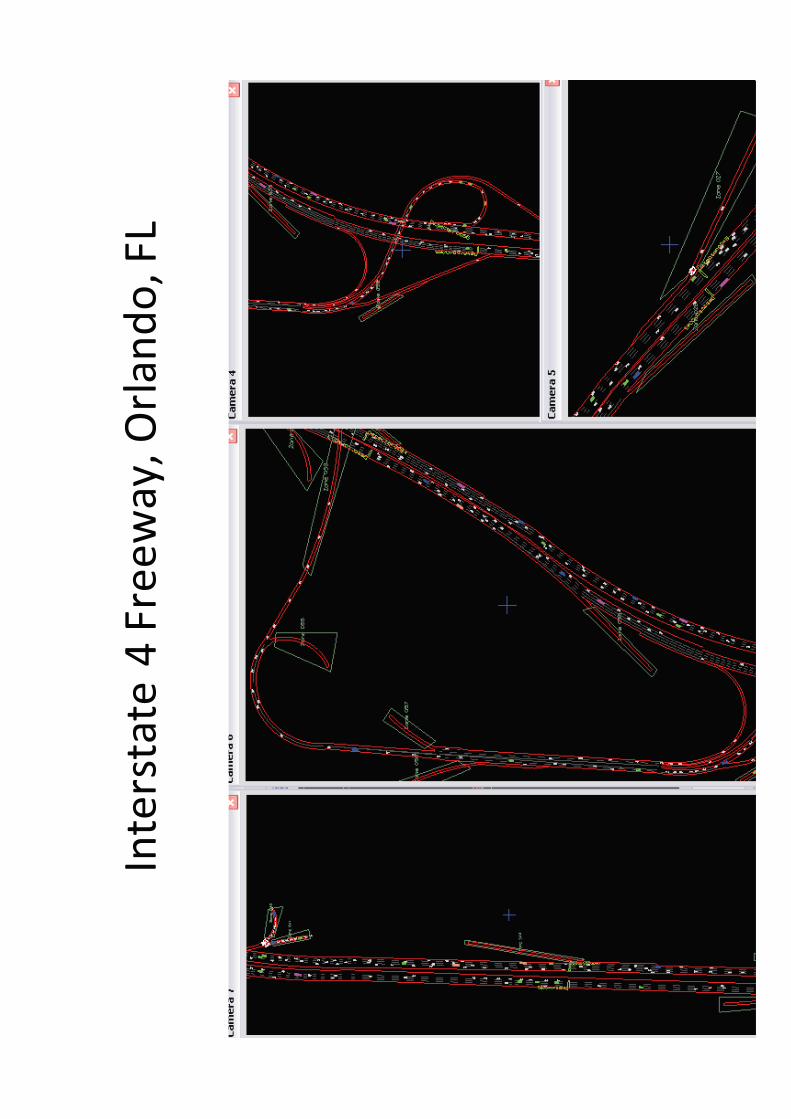
Interstate
4Freeway,Orlando,FL
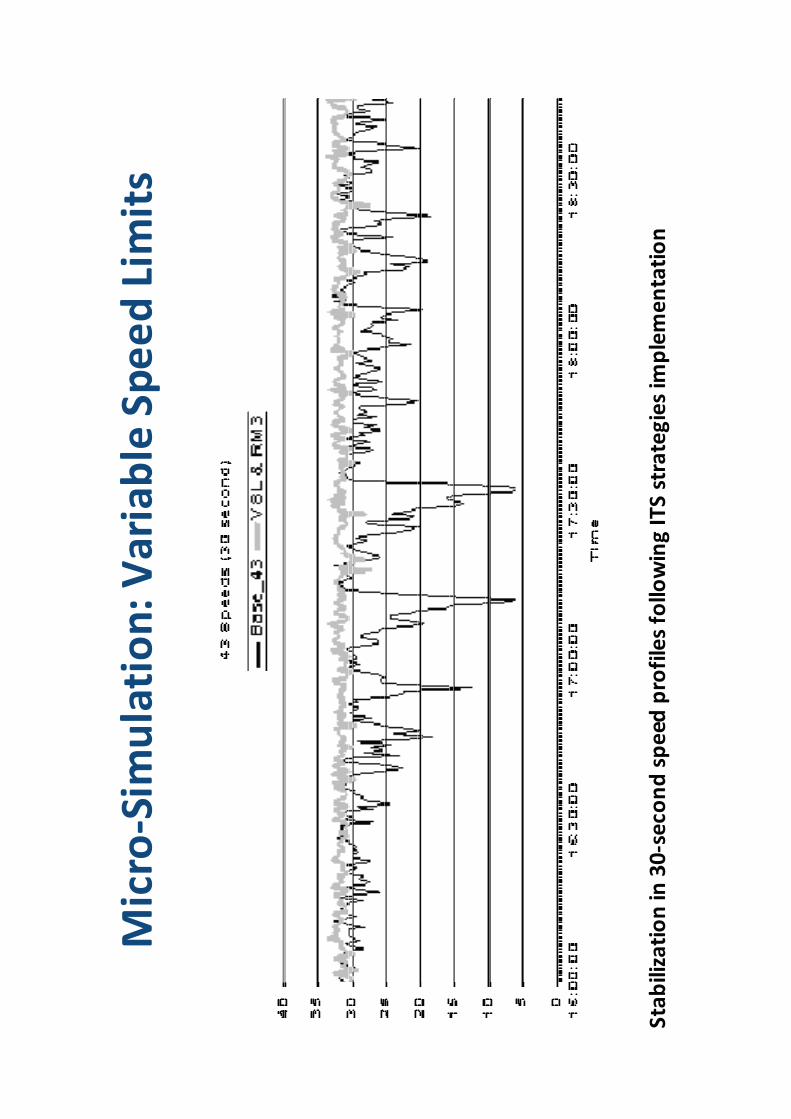
Stabilizationin30secondspeed
profilesfollowingITSstrategiesim
plementation
Micro
Sim
ulation:VariableSpeedLimits
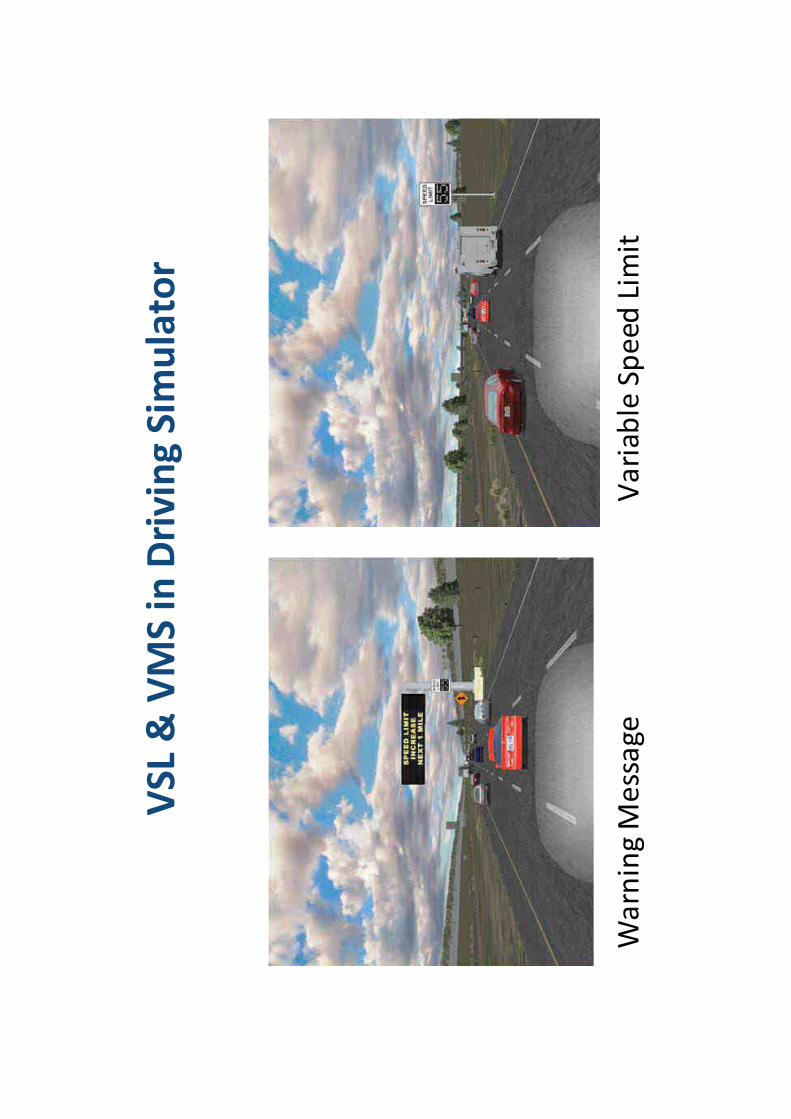
VSL&VMSinDrivingSim
ulator
•VariableSpeed
Limit
•WarningMessage
43
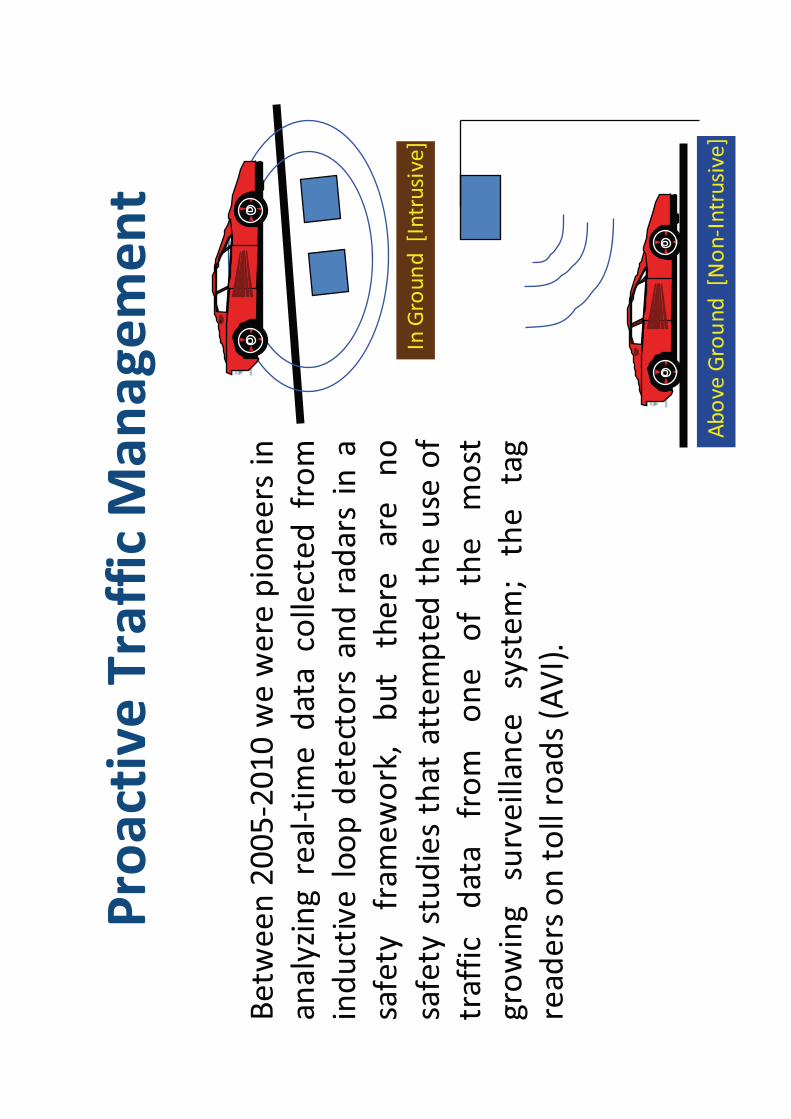
ProactiveTrafficManagement
InGround[Intrusive]
Above
Ground[NonIntrusive]
Betw
een20052010wewere
pioneersin
analyzingrealtimedata
collectedfrom
inductiveloopdetectors
andradars
ina
safety
framework,but
there
are
no
safety
studiesthatattemptedtheuse
of
traffic
data
from
one
of
the
most
growing
surveillance
system;the
tag
readersontollroads(AVI).
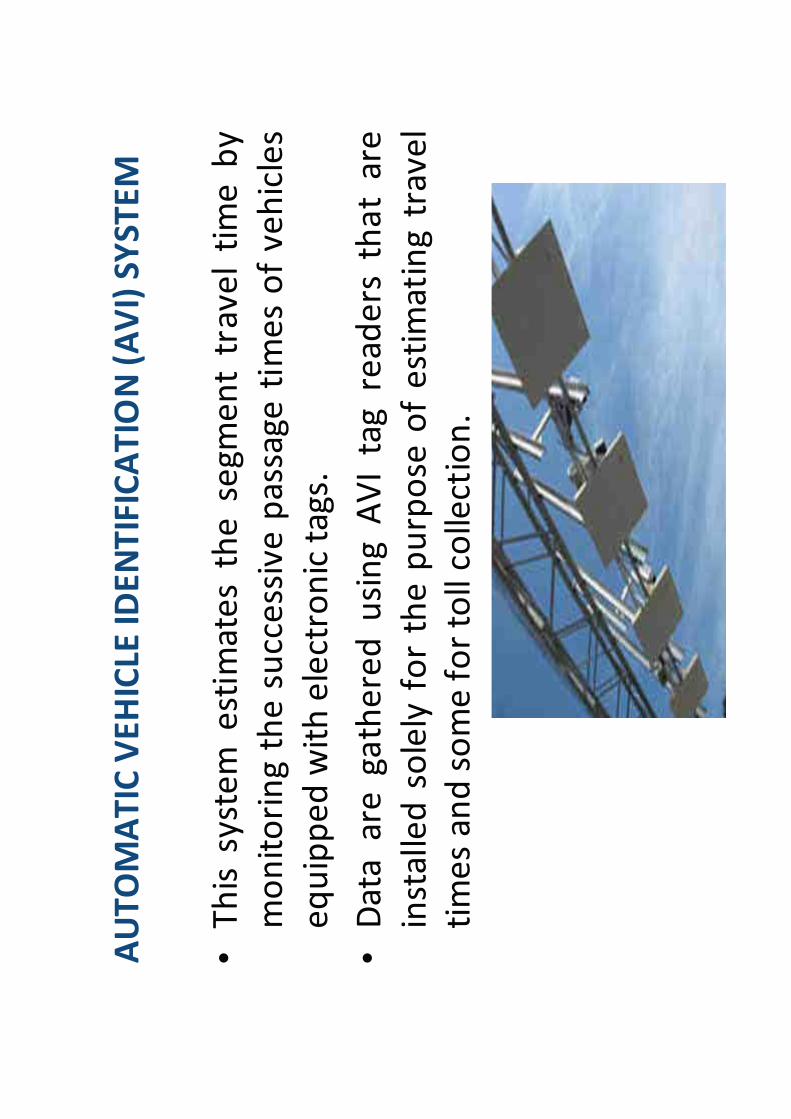
AUTOMATICVEHICLE
IDENTIFICATION(AVI)SYSTEM
•Thissystem
estim
atesthesegmenttraveltimeby
monitoringthesuccessivepassagetimesofvehicles
equippedwithelectronictags.
•Data
are
gatheredusingAVItagreaders
thatare
installedsolelyforthepurpose
ofestimatingtravel
timesandsomefortollcollection.
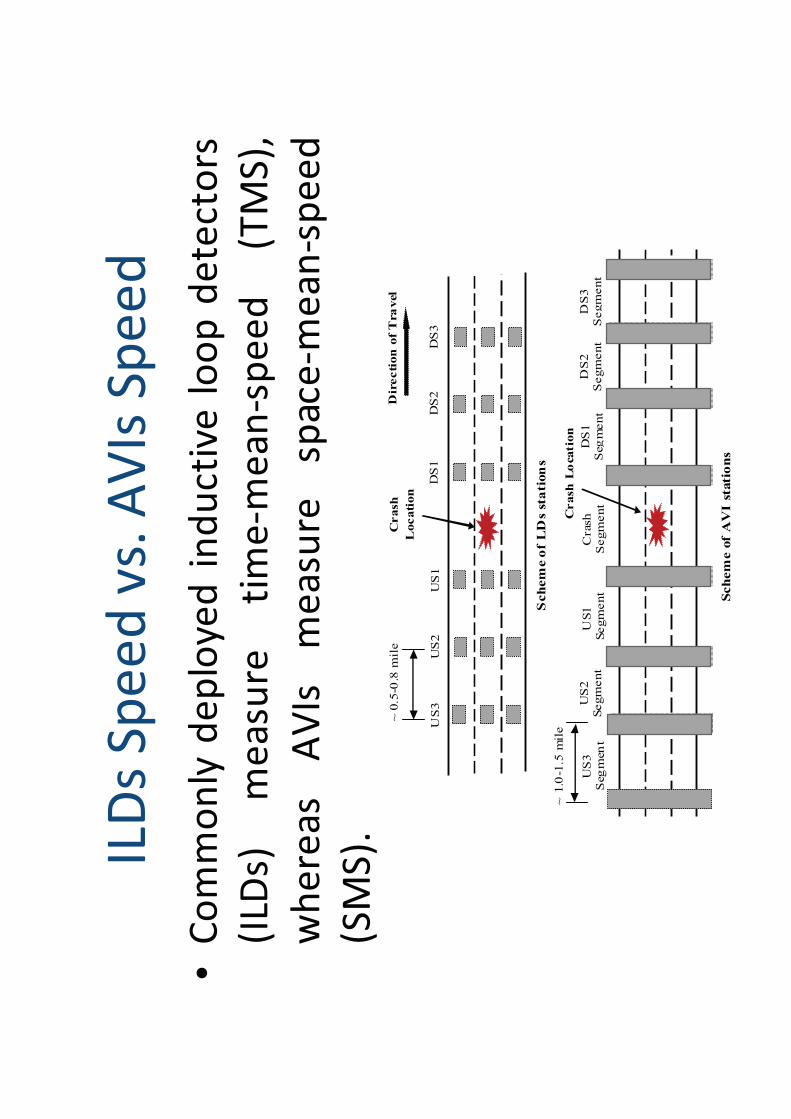
ILDsSpeedvs.AVIsSpeed
•Commonlydeployedinductiveloopdetectors
(ILD
s)measure
timemeanspeed
(TMS),
whereas
AVIs
measure
spacemeanspeed
(SMS).
US
3
Seg
men
t
US
2
Segm
ent
DS
3
Segm
ent
DS
2
Segm
ent
DS
1
Seg
ment
US1
S
egm
ent
Cra
sh
Segm
ent
~ 0
.5-0
.8 m
ile
US
3
US
2
US
1
DS
1
DS
2
DS
3
Crash
Lo
catio
n
Sch
em
e o
f L
Ds
sta
tion
s
Dir
ecti
on
of
Tra
vel
Sch
em
e o
f A
VI s
tati
on
s
Crash
Locati
on
~ 1
.0-1
.5 m
ile
ILDvs.AVI
•Ourrecentresearch
implemented
forthefirst
timedata
collectedfrom
theAVIin
arealtime
trafficsafety
analysis.
•AVIdata
were
foundto
bepromisinginproviding
ameasure
of
crash
risk
inrealtime.
The
managementofexpresswayscan
benefitfrom
thecollectedAVItrafficdata
notonlyto
ease
the
congestionandenhance
theoperationbutalso
byevaluatingtheincreasedrisk.
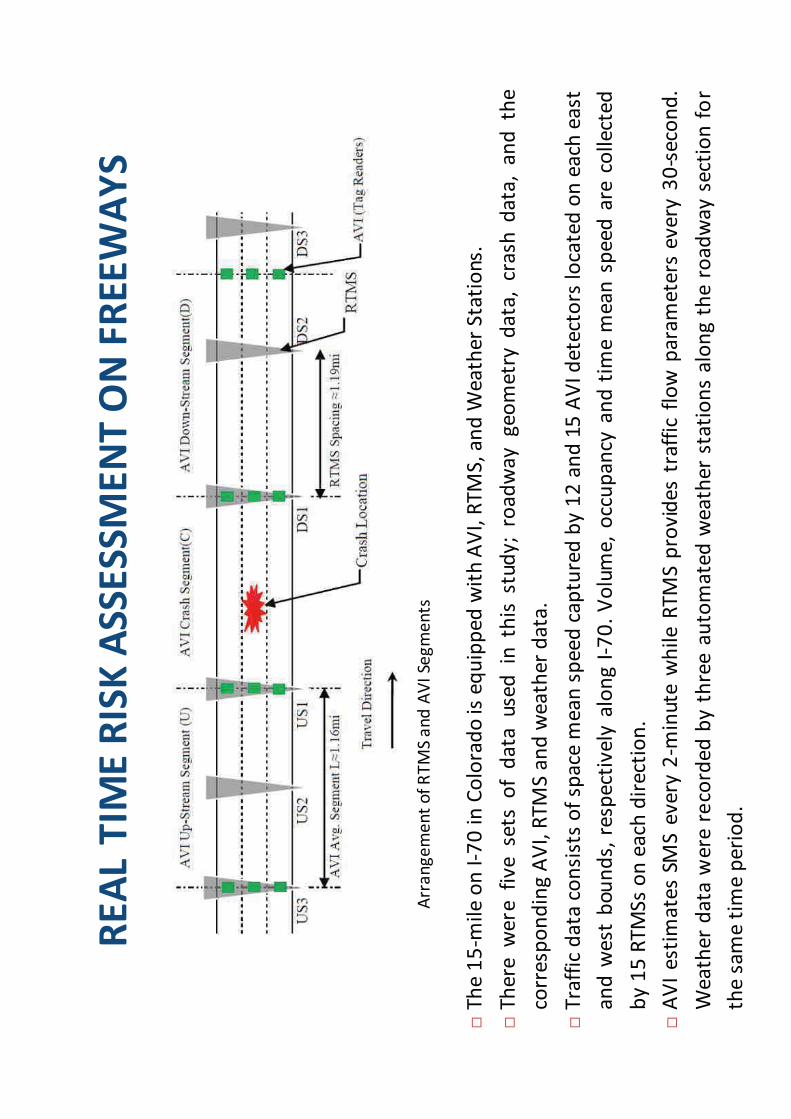
REALTIM
ERISKASSESSMENTONFREEWAYS
ArrangementofRTMSandAVISegments
The15mileonI70inColoradoisequippedwithAVI,RTMS,andWeatherStations.
There
were
fivesets
ofdata
usedin
this
study;roadwaygeometrydata,crash
data,andthe
correspondingAVI,RTMSandweatherdata.
Trafficdata
consistsofspace
meanspeedcapturedby12and15AVIdetectorslocatedoneach
east
andwest
bounds,respectively
alongI70.Volume,occupancy
andtimemeanspeedare
collected
by15RTMSsoneach
direction.
AVIestim
atesSM
Severy
2minute
whileRTMSprovidestrafficflow
parameters
every
30second.
Weatherdata
were
recordedbythreeautomatedweatherstationsalongtheroadwaysectionfor
thesametimeperiod.
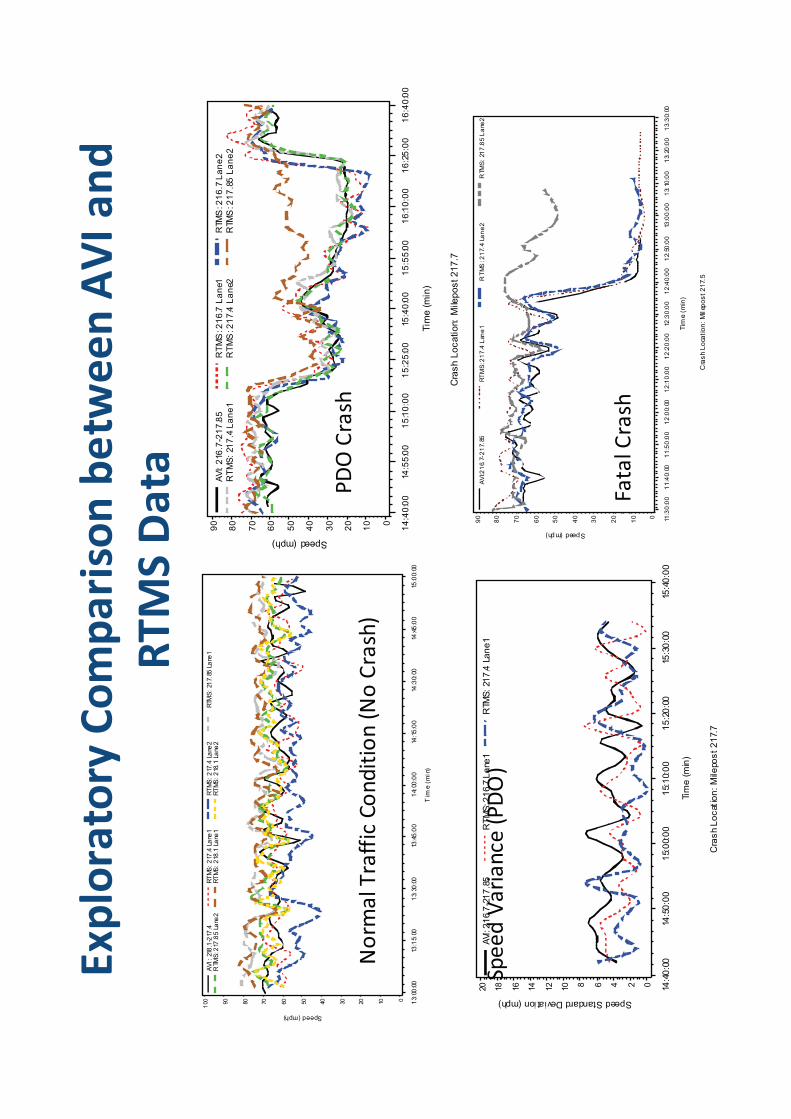
Exploratory
Comparisonbetw
eenAVIand
RTMSData
Speed (mph)
0102030405060708090
100
Tim
e (
min
)
13:
00:0
013
:15:
001
3:30
:00
13:4
5:0
01
4:00
:00
14:1
5:0
014
:30:
0014
:45
:00
15:0
0:00
AV
I: 2
18.1
-217
.4R
TM
S:
217
.4 L
ane
1R
TM
S:
217
.4 L
ane
2R
TMS
: 21
7.85
La
ne1
RTM
S: 2
17.8
5 La
ne2
RT
MS
: 2
18.1
La
ne1
RT
MS
: 2
18.1
La
ne2
Speed (mph)
0
10
20
30
40
50
60
70
80
90
Tim
e (m
in)
14
:40
:00
14:5
5:0
01
5:1
0:0
01
5:2
5:0
015
:40
:00
15
:55
:00
16
:10
:00
16
:25
:00
16
:40
:00
Cra
sh L
ocation:
Mile
post 217.7
AV
I: 2
16.7
-21
7.8
5R
TM
S: 2
16
.7 L
an
e1R
TMS
: 21
6.7
La
ne
2
RT
MS
: 21
7.4
La
ne
1R
TM
S: 2
17
.4 L
an
e2R
TMS
: 21
7.8
5 L
an
e2
Speed (mph)
0
10
20
30
40
50
60
70
80
90
Tim
e (m
in)
11:3
0:0
01
1:4
0:00
11
:50
:00
12
:00:
001
2:1
0:0
01
2:2
0:0
012
:30
:00
12
:40
:00
12:
50:0
013
:00
:00
13:
10:0
01
3:20
:00
13
:30:
00
Cra
sh
Lo
cati
on
: M
ilep
os
t 2
17.
5
AV
I:21
6.7-
21
7.85
RT
MS
: 21
7.4
Lan
e1
RT
MS
: 21
7.4
Lan
e2
RTM
S:
217
.85
La
ne2
Speed Standard Deviation (mph)
02468
101214161820
Tim
e (
min
)
14:4
0:0
014
:50
:00
15:
00:
00
15:
10:
00
15
:20
:00
15:3
0:0
015
:40
:00
Cra
sh
Lo
cat
ion
: M
ilepo
st
21
7.7
AVI
: 21
6.7
-21
7.8
5R
TM
S: 2
16.
7 L
ane
1R
TMS
: 21
7.4
La
ne
1
Norm
alTrafficCondition(NoCrash)
PDOCrash
FatalCrash
SpeedVariance
(PDO)
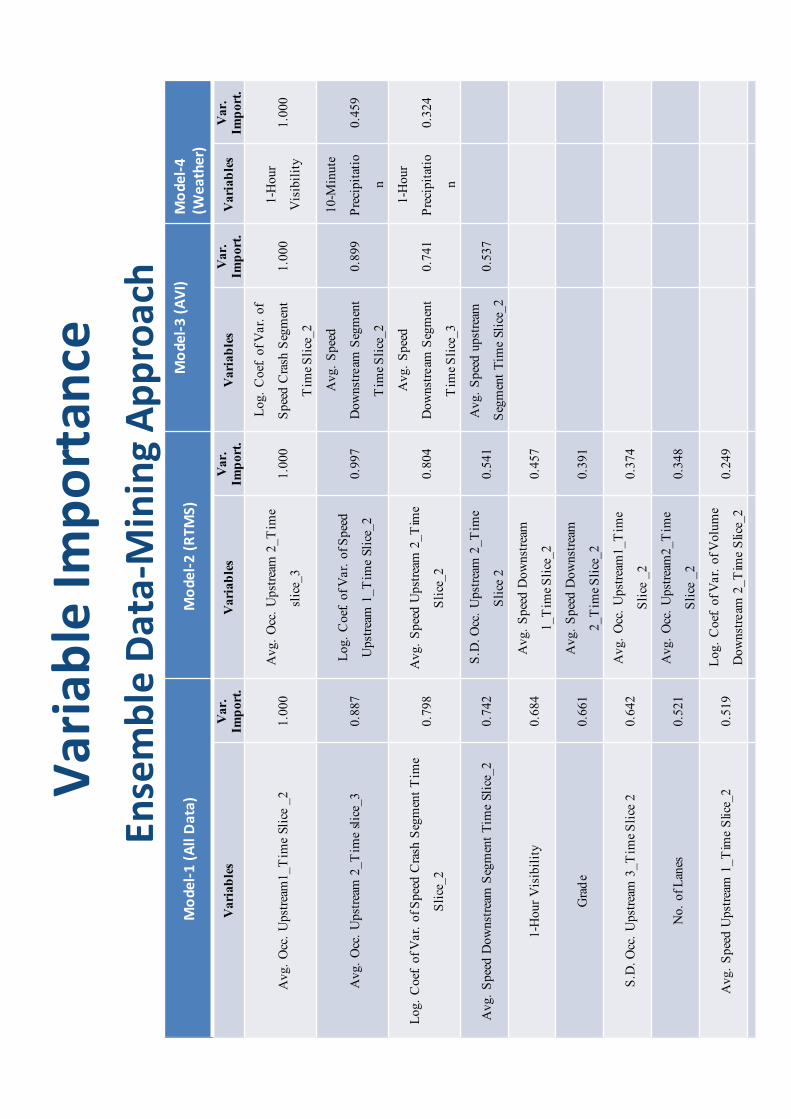
VariableIm
portance
EnsembleData
MiningApproach
Model1(AllData)
Model2(RTMS)
Model3(AVI)
Model4
(Weather)
Vari
ab
les
Var.
Im
port
.V
ari
ab
les
Var.
Im
port
.V
ari
ab
les
Var.
Im
port
.V
ari
ab
les
Var.
Im
port
.
Avg.
Occ
. U
pst
ream
1_T
ime
Sli
ce _
21.0
00
Avg.
Occ
. U
pst
ream
2_T
ime
slic
e_3
1.0
00
Log.
Coef
. of V
ar.
of
Spee
d C
rash
Seg
men
t
Tim
e S
lice
_2
1.0
00
1-H
our
Vis
ibil
ity
1.0
00
Avg.
Occ
. U
pst
ream
2_T
ime
slic
e_3
0.8
87
Log.
Coef
. of V
ar.
of S
pee
d
Upst
ream
1_T
ime
Sli
ce_2
0.9
97
Avg.
Spee
d
Dow
nst
ream
Seg
men
t
Tim
e S
lice
_2
0.8
99
10-M
inute
Pre
cipit
atio
n
0.4
59
Log.
Coef
. of V
ar.
of S
pee
d C
rash
Seg
men
t T
ime
Sli
ce_2
0.7
98
Avg.
Spee
d U
pst
ream
2_T
ime
Sli
ce_2
0.8
04
Avg.
Spee
d
Dow
nst
ream
Seg
men
t
Tim
e S
lice
_3
0.7
41
1-H
our
Pre
cipit
atio
n
0.3
24
Avg.
Spee
d D
ow
nst
ream
Seg
men
t T
ime
Sli
ce_2
0.7
42
S.D
. O
cc.
Upst
ream
2_T
ime
Sli
ce 2
0.5
41
Avg.
Spee
d u
pst
ream
Seg
men
t T
ime
Sli
ce_2
0.5
37
1-H
our
Vis
ibil
ity
0.6
84
Avg.
Spee
d D
ow
nst
ream
1_T
ime
Sli
ce_2
0.4
57
Gra
de
0.6
61
Avg.
Spee
d D
ow
nst
ream
2_T
ime
Sli
ce_2
0.3
91
S.D
. O
cc.
Upst
ream
3_T
ime
Sli
ce 2
0.6
42
Avg.
Occ
. U
pst
ream
1_T
ime
Sli
ce _
20.3
74
No.
of L
anes
0.5
21
Avg.
Occ
. U
pst
ream
2_T
ime
Sli
ce _
20.3
48
Avg.
Sp
eed U
pst
ream
1_T
ime
Sli
ce_2
0.5
19
Log.
Coef
. of V
ar.
of V
olu
me
Dow
nst
ream
2_T
ime
Sli
ce_2
0.2
49
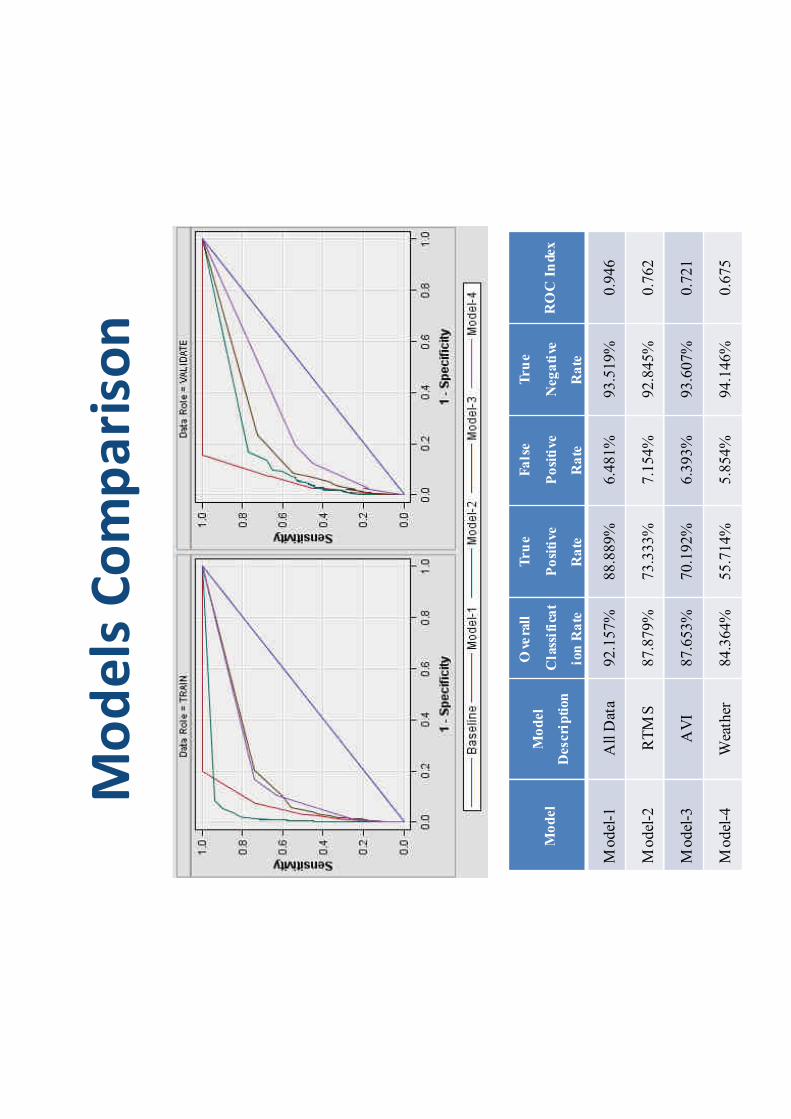
ModelsComparison
Mo
del
Mo
del
Descri
pti
on
Ove
rall
Cla
ssif
ica
t
ion
Ra
te
Tru
e
Po
siti
ve
Ra
te
Fa
lse
Po
siti
ve
Ra
te
Tru
e
Neg
ati
ve
Ra
te
RO
C I
ndex
Model
-1A
ll D
ata
92.1
57%
88.8
89%
6.4
81%
93.5
19%
0.9
46
Model
-2R
TM
S87.8
79%
73.3
33%
7.1
54%
92.8
45%
0.7
62
Model
-3A
VI
87.6
53%
70.1
92%
6.3
93%
93.6
07%
0.7
21
Model
-4W
eath
er84.3
64%
55.7
14%
5.8
54%
94.1
46%
0.6
75
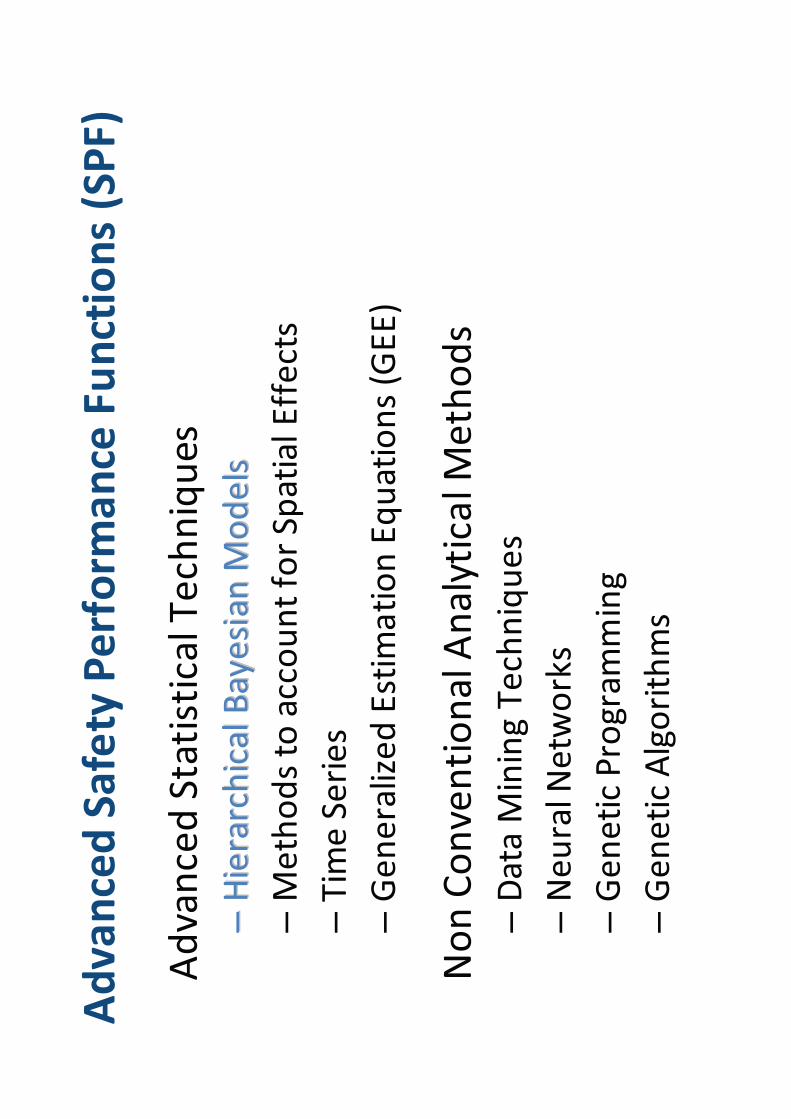
AdvancedSafety
Perform
ance
Functions(SPF)
AdvancedStatisticalTechniques
––Hierarchical
HierarchicalBayesianModels
BayesianModels
–Methodsto
accountforSpatialEffects
–TimeSeries
–GeneralizedEstimationEquations(GEE)
NonConventionalA
nalyticalM
ethods
–Data
MiningTechniques
–NeuralN
etw
orks
–GeneticProgramming
–GeneticAlgorithms
SPFsforLongitudinalCrash
Frequencies
•GeneralizedEstimationEquations(GEE)
–GEEcomefromspecifyingaknownfunctionofthemarginal
expectationofthedependentvariableasalinearfunctionof
covariates;assumingthatthevariance
isaknownfunctionofthe
mean;inaddition,specifyinga“w
orking”
correlationmatrixfor
theobservationsforeach
location.
•GEEswithNegativeBinomiallinkfunctionwere
usedto
modelspatialandtemporalcorrelation
for3yearlongitudinalcrash
data.
Sp
ati
al
Sa
fety
An
aly
sis:
Co
rri
do
r Id
en
tifi
ca
tio
n &
Clu
ster
An
aly
sis
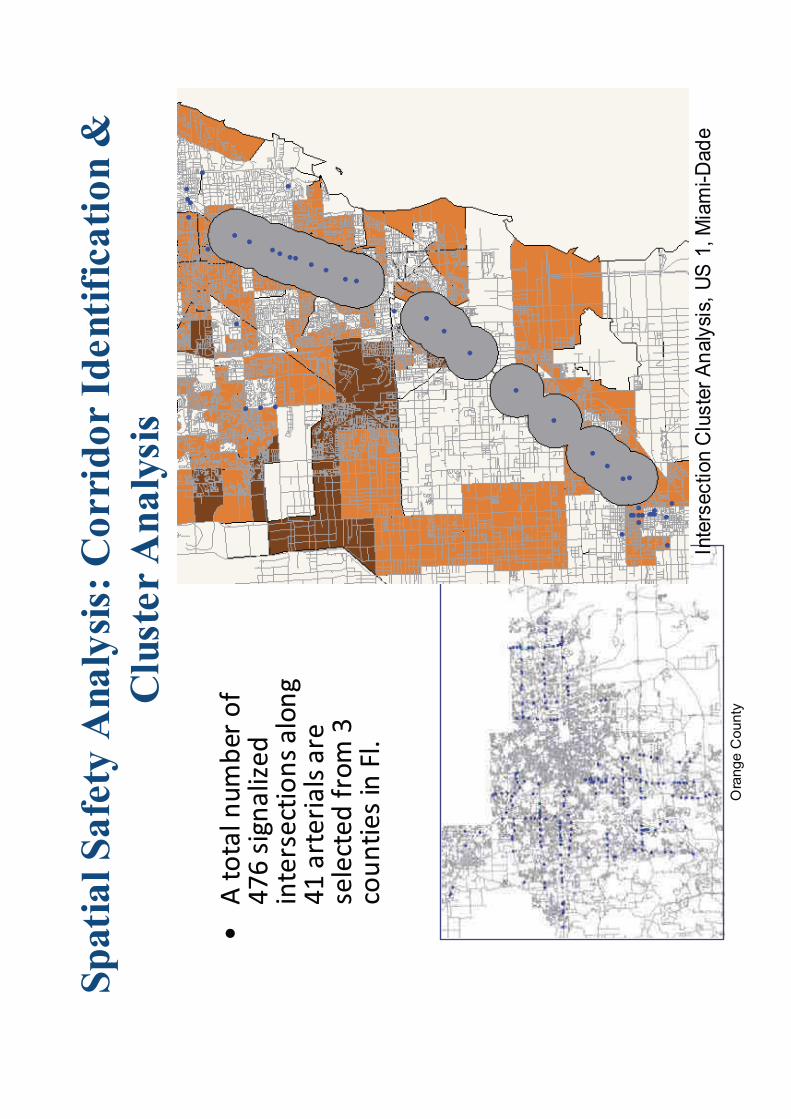
••Atotalnumber
of
Atotalnumber
of
476signalized
476signalized
intersectionsalong
intersectionsalong
41arterialsare
41arterialsare
selectedfrom
3selectedfrom
3countiesinFl.
countiesinFl.
Bre
vard
County
Ora
nge C
ounty
Mia
mi-D
ade
Inte
rsection C
luste
r A
naly
sis,
US
1, M
iam
i-D
ad
e
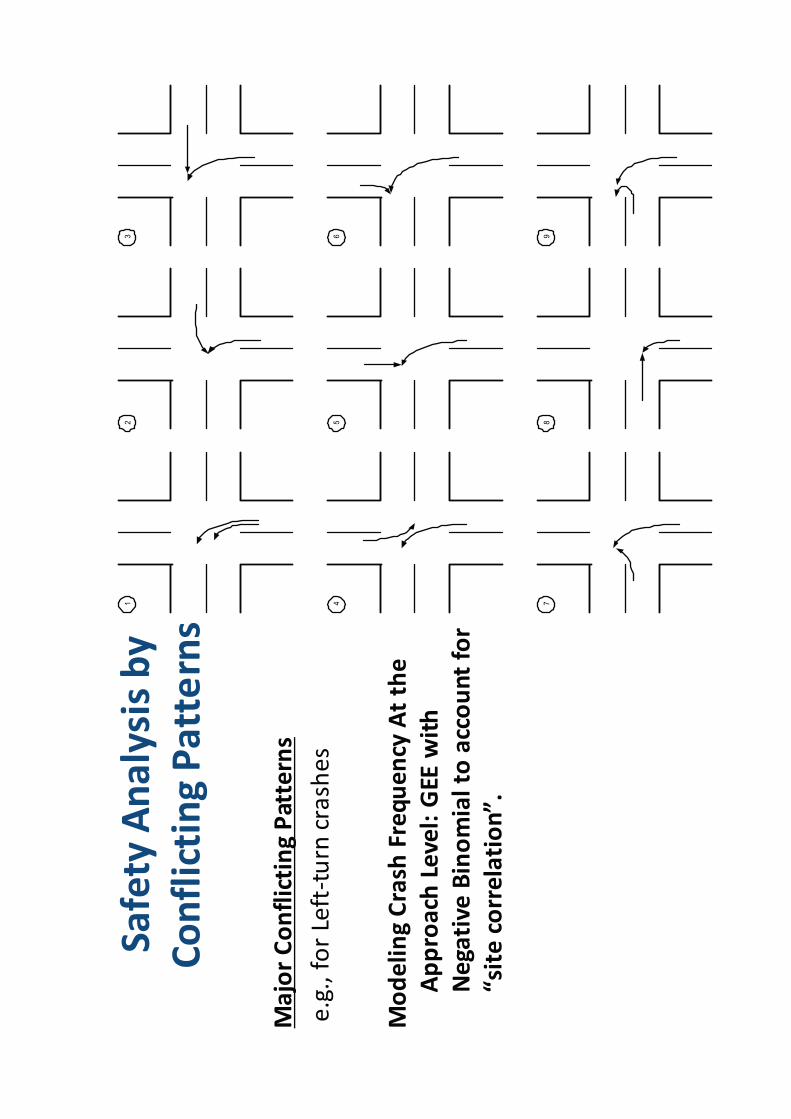
Safety
Analysisby
ConflictingPatterns
MajorConflictingPatterns
e.g.,forLeftturn
crashes
ModelingCrash
Frequency
Atthe
Approach
Level:GEE
with
Negative
Binomialto
accountfor
“sitecorrelation”.
12
3
45
6
78
9
A c
on
ce
ptu
al
mo
de
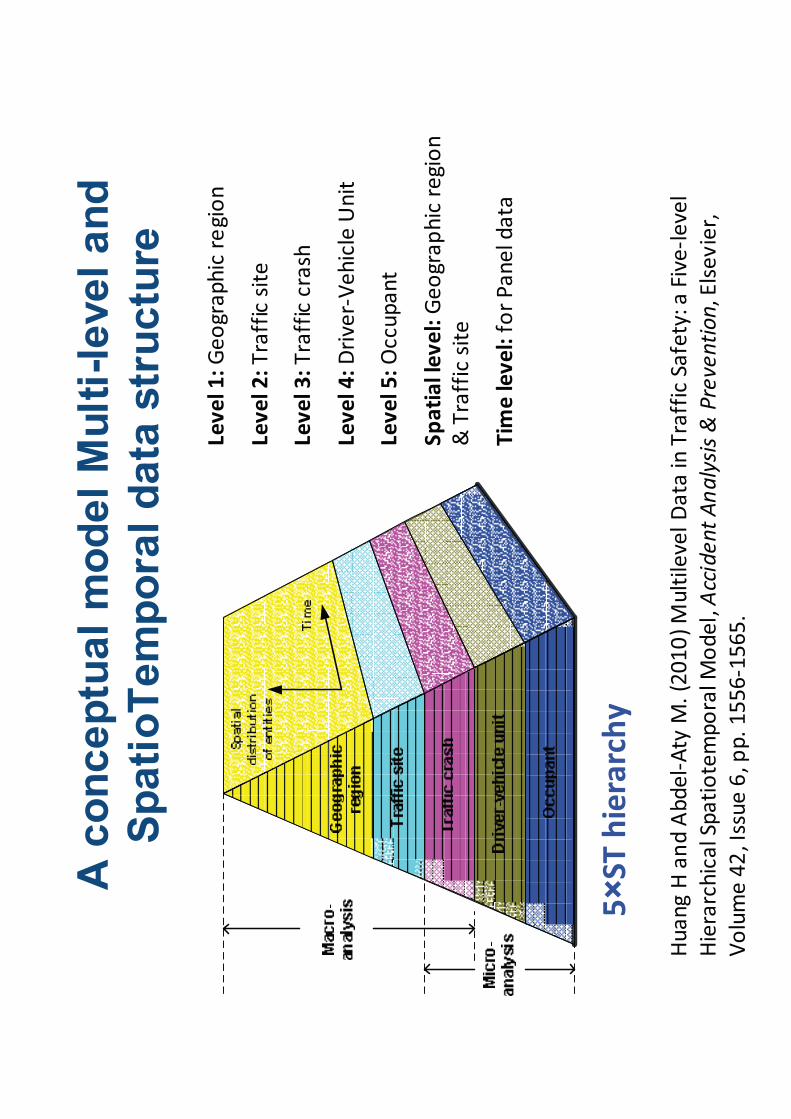
l M
ult
i-le
ve
l a
nd
Sp
ati
oT
em
po
ral
da
ta s
tru
ctu
re
Level1:Geographicregion
Level2:Trafficsite
Level3:Trafficcrash
Level4:DriverVehicleUnit
Level5:Occupant
Spatiallevel:Geographicregion
&Trafficsite
Tim
elevel:forPaneldata
5×SThierarchy
HuangHandAbdelAty
M.(2010)MultilevelData
inTrafficSafety:a
Five
level
HierarchicalSpatiotemporalM
odel,AccidentAnalysis&Prevention,Elsevier,
Volume42,Issue6,pp.15561565.
Tra
dit
ion
al
Ap
pro
ac
h
GeneralizedLinearModel
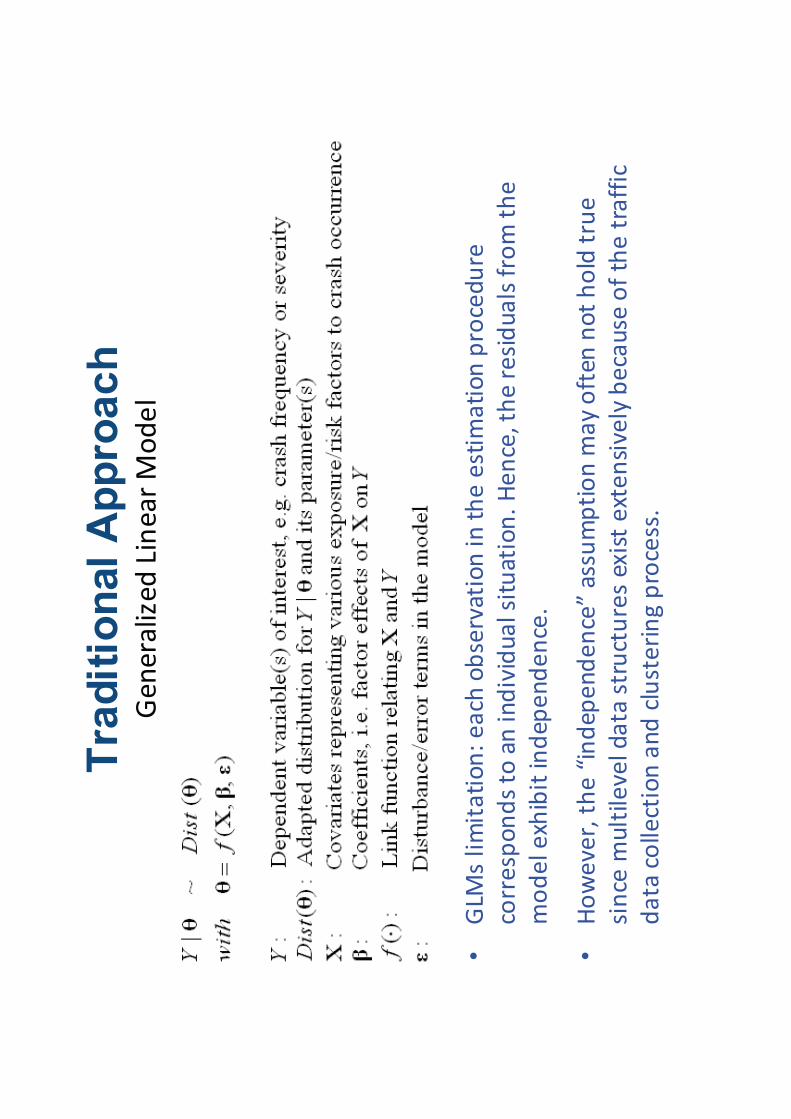
•GLM
slimitation:each
observationintheestim
ationprocedure
correspondsto
anindividualsituation.Hence,theresidualsfromthe
modelexhibitindependence.
•However,the“independence”assumptionmayoften
notholdtrue
since
multileveldata
structuresexistextensivelybecause
ofthetraffic
data
collectionandclusteringprocess.
So
luti
on
: B
aye
sia
n H
iera
rch
ical
Mo
de
lin
g
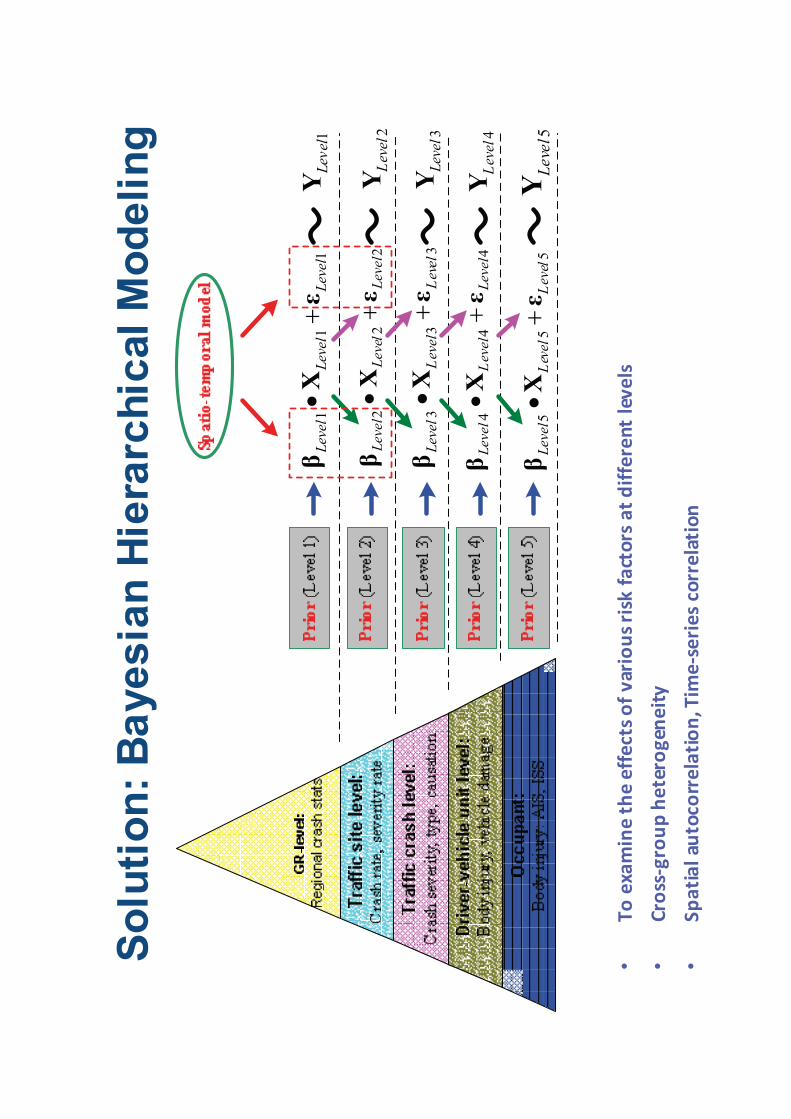
•Toexaminetheeffectsofvariousrisk
factorsatdifferentlevels
•Cross
groupheterogeneity
•Spatialautocorrelation,Tim
eseriescorrelation
11
1Level
Level
Level
X1
Level
Y
22
2Level
Level
Level
X2
Level
Y
33
3Level
Level
Level
X3
Level
Y
44
4Level
Level
Level
X4
Level
Y
55
5Level
Level
Level
X5
Level
Y
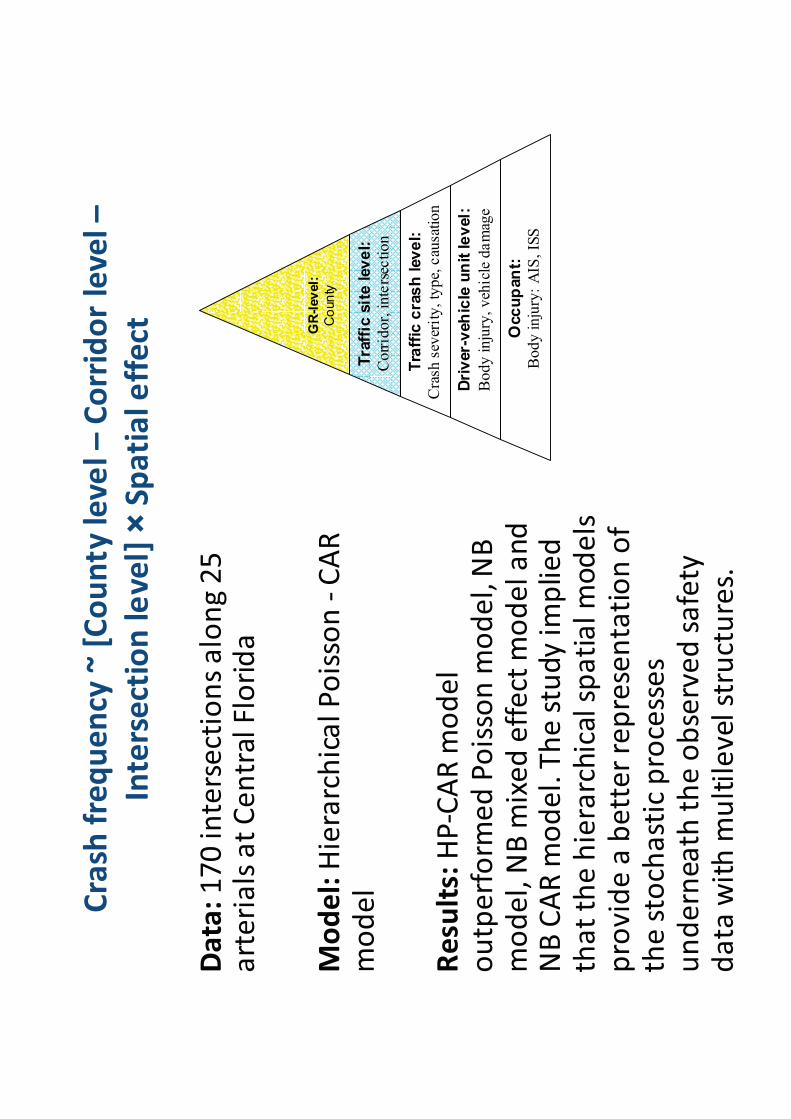
Crash
frequency
~[County
level–Corridorlevel–
Intersectionlevel]
×Spatialeffect
Data:170intersectionsalong25
arterialsatCentralFlorida
Model:HierarchicalPoisson
CAR
model
Results:HPCARmodel
outperform
edPoissonmodel,NB
model,NBmixedeffectmodeland
NBCARmodel.Thestudyim
plied
thatthehierarchicalspatialmodels
provideabetterrepresentationof
thestochasticprocesses
underneath
theobservedsafety
data
withmultilevelstructures.
GR
-lev
el:
Co
un
ty
Tra
ffic
sit
e l
ev
el:
Corr
idor,
inte
rsec
tion
Tra
ffic
cra
sh
lev
el:
Cra
sh s
ever
ity, ty
pe,
cau
sati
on
Dri
ver-
veh
icle
un
it le
vel:
Body i
nju
ry, veh
icle
da
mag
e
Occ
up
an
t:B
ody i
nju
ry:
AIS
, IS
S
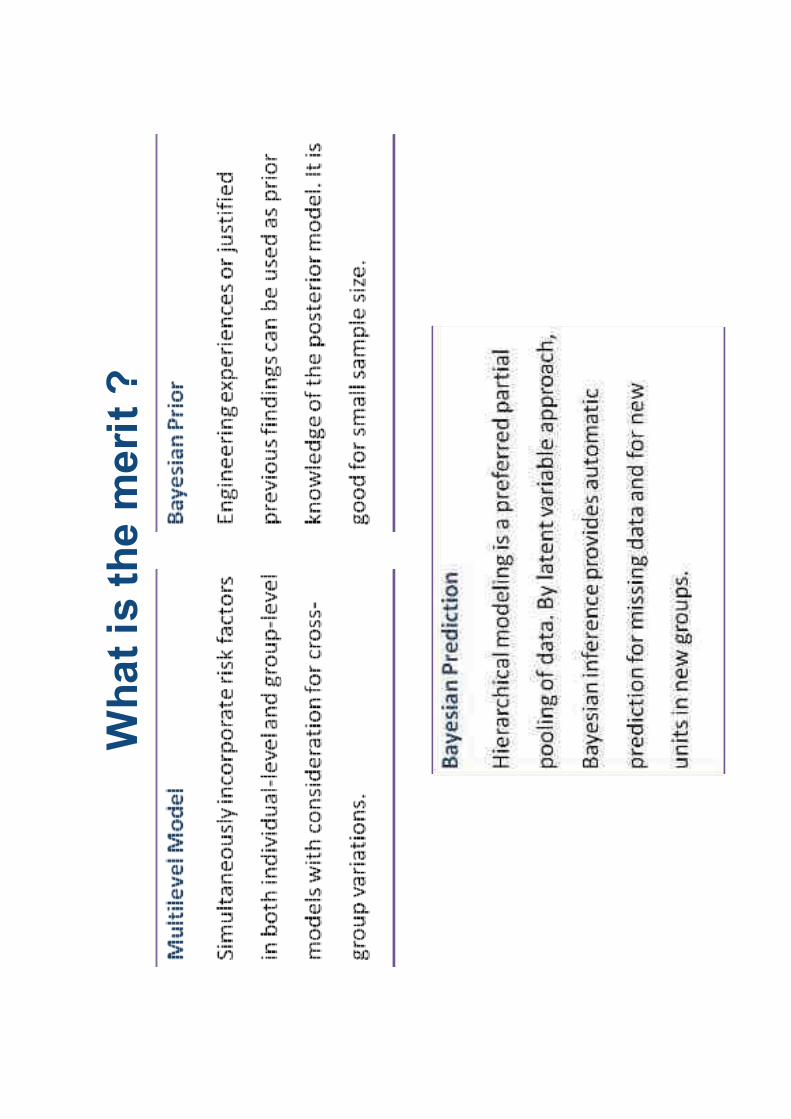
Wh
at
is t
he
me
rit
?
Recommendations
•More
Proactiveapproachesare
needed
intrafficsafety
•Im
prove
Accidentandrelevant
Databases.
•IncorporatingSafetyatthePlanning
Level
•Integrated5Eapproach
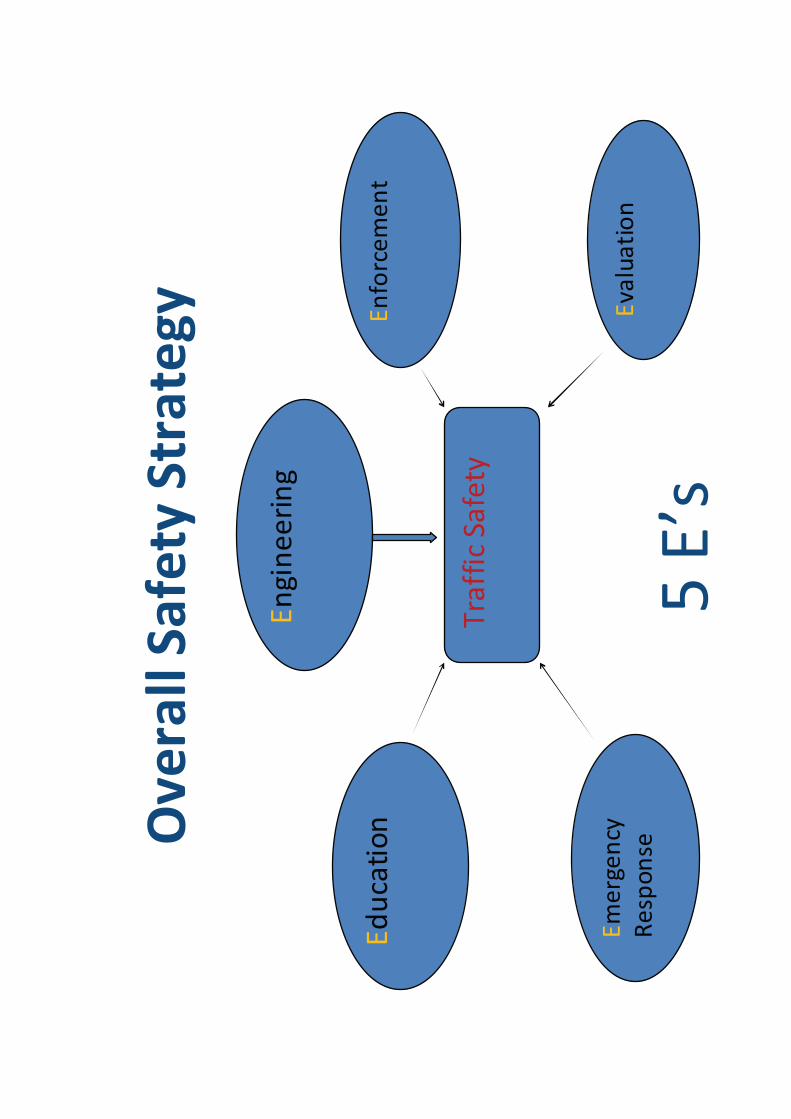
OverallSafety
Strategy
TrafficSafety
Enforcement
Evaluation
Emergency
Response
Education
Engineering
5E’s
Recommendations(cont.)
•ClearNationalG
oalandastrategicSafetyPlan
•BenefitfromthewealthofSafety
Researchfrom
aroundtheworldwhiletailoringitto
thespecific
country
•Anumberofrecentstudies,includingthose
bythe
presenter,have
showntheusefulness
of
accountingforspecificsafety
data
structure
by
usingBayesianhierarchicalm
odels.
•Theproposed5×ST
levelhierarchyrepresentsa
conceptualframework
withallupto
date
understandingsofsafety
data
structure.
Dr.MohamedAbdelAty,P.E.
Professor
DepartmentofCivil,Environmental&Construction
Engineering
UniversityofCentralFlorida
Ph.+14078235657
Email:[email protected]
Associate
Editor
AccidentAnalysis&Prevention