Embed Size (px)
Citation preview
Attributes characterising river fisheries managed by Fish & Game New Zealand: a pilot survey of the Otago and Nelson/Marlborough regions
NIWA Client Report: CHC2009-090 June 2009 NIWA Project: FGC09502


All rights reserved. This publication may not be reproduced or copied in any form, without the permission of the client. Such permission is to be given only in accordance with the terms of the client’s contract with NIWA. This copyright extends to all forms of copying and any storage of material in any kind of information retrieval system.
Attributes characterising river fisheries managed by Fish & Game New Zealand: a pilot survey of the Otago and Nelson/Marlborough regions. Martin Unwin
Prepared for
Fish & Game New Zealand
NIWA Client Report: CHC2009-090 June 2009 NIWA Project: FGC09502 National Institute of Water & Atmospheric Research Ltd 10 Kyle Street, Riccarton, Christchurch P O Box 8602, Christchurch, New Zealand Phone +64-3-348 8987, Fax +64-3-348 5548 www.niwa.co.nz


Contents Summary i
1. Introduction 1 1.1. Freshwater angling in New Zealand 1
2. Survey design and implementation 2 2.1. River fishery attributes and the 1979 NAS 2 2.2. Survey design 4 2.2.1. River fishery attributes 5 2.2.2. Overall importance 6 2.2.3. Survey population 6 2.2.4. Sample selection 6 2.2.5. Interview procedures 7 2.3. Data analysis 8
3. Results 9 3.1. The replies 9 3.2. Distribution of attributes 11 3.3. Other attributes 18 3.4. Types of fisheries 22
4. Discussion 23 4.1. Survey design 23 4.2. Survey implementation 24 4.3. Sampling strategies 25 4.4. Data utility 25 4.5. Data analysis 26 4.6. Recommendations 27
5. Acknowledgements 27
6. References 27
Appendix 1: Estimated usage for all New Zealand lake and river fisheries recorded in either 1994-96 or 2001/02.
Reviewed by: Approved for release by:
Doug Booker John Zeldis


Attributes characterising river fisheries managed by Fish & Game New Zealand: a pilot survey of the Otago and Nelson/Marlborough regions
i
Summary
This report describes a pilot survey of anglers in the Otago and Nelson/Marlborough Fish & Game
New Zealand (FGNZ) regions, conducted in 2008 as a precursor to a possible national survey updating
the 30 year old data set collected by the 1979/81 National Angling Survey. Like its predecessor, the
pilot survey was concerned with qualitative rather than quantitative attributes of each individual
fishery and the values associated with them, and hence the reasons why anglers choose to fish one
water in preference to another. The main objectives of the pilot survey were to remedy some of the
flaws in the 1979/81 survey, to trial the feasibility of administering the survey via telephone, to
contrast the effects of differing sampling strategies on the data sets so collected, to assess the utility of
the resulting data, to identify any changes in angler motivation associated with particular rivers with
time, and to consider appropriate strategies for analysing and reporting the survey results.
Respondents were selected at random from among adult whole-season fishing licence holders in the
two participating regions, using simple random sampling with two strata representing anglers known
from a previous survey to have fished at least one river, and those whose fishing history was unknown.
Respondents were contacted by telephone and asked to nominate any rivers they had fished over the
last three years. They were then read a list of eight attributes (e.g., close to where you live, scenic
beauty, anticipation of catching a large fish), and asked to identify the three most important attributes
for each river they had fished. They were also asked to rank the importance of each river on a 1-5
scale, and to nominate any other attributes which they considered important but were not included in
the survey.
Collated data sets for both regions were tallied to determine the number of responses for each river,
and the number of times each attribute was nominated for each river. These counts were then used to
score each attribute based on the number of times it was nominated, expressed as a proportion of the
total number of respondents. Scores for overall importance were expressed as a numerical average of
the rating for each respondent.
The pilot survey attribute scores performed at least as well as their 1979/81 equivalents in
differentiating between individual rivers, and often did considerably better. Scores tended to be more
widely distributed than in 1979/81, suggesting that forcing respondents to choose which attributes they
considered important generated more meaningful data than asking them to rank all eight regardless of
importance as was the case in 1979/81. Scores for overall importance were not significantly more
dispersed than in 1979/81, but were easier to interpret following changes to the way in which they
were worded.
Preliminary analysis of the results suggest that mulitvariate statistical techniques such as principal
components analysis could potentially be used to group fisheries by type in a more robust and
objective way than has previously been possible. In particular, groupings corresponding to lowland,

Attributes characterising river fisheries managed by Fish & Game New Zealand: a pilot survey of the Otago and Nelson/Marlborough regions
ii
back country, and headwater fisheries, which have previously been defined on an ad hoc and
apparently subjective basis, appear to emerge naturally from the survey data.
Several recommendations are made should FGNZ wish to implement the survey on a national basis.
These include retaining the eight attributes used in the pilot survey with little or no modification;
engaging local FGNZ staff to review all interview data; dropping the stratified sampling approach
(which did not lead to any gains in efficiency); increasing the sample size for each FGNZ region so as
to maximise the number of rivers for which a meaningful analysis is possible; and inviting respondents
to assess rivers outside their home region.

Attributes characterising river fisheries managed by Fish & Game New Zealand: a pilot survey of the Otago and Nelson/Marlborough regions 1
1. Introduction
1.1. Freshwater angling in New Zealand
Fish & Game New Zealand (FGNZ) has statutory authority for managing all
freshwater sports fishing in all New Zealand waters except Lake Taupo and its
inflowing tributaries. To provide baseline data on temporal changes in angling activity
and fishing preferences over decadal time scales, FGNZ uses national sample surveys
to estimate total annual usage for all recognised fishing waters at intervals of 6-7
years. Three such surveys have been conducted to date, beginning in 1994/95 and
most recently in 2007/08 (Unwin 2009, Unwin & Brown 1998, Unwin & Image
2003).
These surveys provide consistent usage estimates for over 1000 lakes and rivers, and
have grown to provide a rich dataset on angling demographics at national, regional,
and catchment scales. However, the surveys were not designed to assess the more
qualitative attributes of each individual fishery and the values associated with them,
and hence the reasons why anglers might choose to fish one water in preference to
another. Such attributes were previously assessed via a large-scale national survey in
the late 1970s (subsequently referred to as the 1979 NAS;Teirney & Richardson 1992,
Teirney et al. 1982), which yielded individual assessments of 817 river fisheries
throughout New Zealand. These data remain a significant and influential resource, and
were instrumental in developing a three-tier classification system for river fisheries
(lowland, back country, headwater) which has since been widely adopted. However,
the data are now 30 years old, and FGNZ has identified an update of the original
survey results as one of its highest research priorities.
This report describes the first steps in implementing this update, via a pilot survey of
licence holders in the Otago and Nelson/Marlborough FGNZ regions. As with its
predecessor, the survey focuses specifically on river fisheries, on the basis that the
attributes which characterise lake fisheries are distinct enough to require a separate
survey. The objectives of this survey (the 2008 Pilot Survey; hereinafter the Pilot
Survey) were:
• to develop a survey format which captured a similar set of river fishery
attributes to those used for the 1979 NAS, while remedying some of the flaws
in the original survey design;
• to trial the feasibility of administering the survey via telephone rather than by
mail;
• to contrast the effects of differing sampling strategies on the data sets so
collected;
Attributes characterising river fisheries managed by Fish & Game New Zealand: a pilot survey of the Otago and Nelson/Marlborough regions 2
• to assess the utility of the resulting data;
• to identify rivers showing evidence of significant changes in angler motivation
over time; and
• to briefly consider appropriate strategies for analysing and reporting the
survey results.
Note that these objectives do not include a detailed analysis of the results from the
perspective of FGNZ management issues in the two pilot survey regions. The survey
data could potentially be used for regional scale analysis of specific river fisheries, but
– given the survey’s exploratory nature – such analyses have been deferred until
FGNZ has had the opportunity to review the pilot survey results and make a decision
as to continuation of the survey at a national level.
2. Survey design and implementation
2.1. River fishery attributes and the 1979 NAS
To develop the Pilot Survey questionnaire, I began by reviewing the attributes used for
the 1979 NAS. As a co-author of many of the original reports, and a subsequent user
of the survey data at numerous hearings, I was able to review the original survey with
the benefit of 30 years of hindsight, and hence to identify and remedy any
deficiencies.
The 1979 NAS was based on seven attributes considered to span the range of
characteristics which might attract anglers to an individual water. These were distilled
from a larger list of attributes based on open-ended responses to an undocumented
pilot survey of anglers in the former Wellington Acclimatisation District. The final
seven attributes were defined in the survey questionnaire as follows (Teirney et al.
1982):
Close to where you live would include rivers which can be reached by a short drive;
Easy access would include rivers which can be driven to, or that involve only a short
walk to reach the river bed;
Large area of water fishable incorporates the possibility of walking beside, or wading
through long stretches of water, which may contain both pools and riffles in order to
continue angling without having to leave the river;
Scenic beauty should include the river bed, the river, the river banks and surrounding
views, either immediate or panoramic;
Feelings of solitude/peace may be gained without being in a wilderness area and will
be influenced by the geography of the river. For instance, if fishing in a gorge, the

Attributes characterising river fisheries managed by Fish & Game New Zealand: a pilot survey of the Otago and Nelson/Marlborough regions 3
existence of a road above may not detract from feelings of solitude if it is out of sight
and the traffic noise cannot be heard;
Good catch rate refers to the number of fish you catch in a certain amount of time.
You may fish some rivers all day without success and yet catch several fish in the
same time from another river;
Size of fish: 1. Smaller than 23 cm (9 inches)
2. 23 cm (9”) – 38 cm (15”)
3. 38 cm (15”) – 53 cm (21”)
4. 53 cm (21” – 65 cm (26”)
5. Larger than 65 cm (26”)
Respondents were asked to consider each river they fished, in isolation of the others,
and then grade each reason between 1-5, with 1 representing the lowest value and 5
the highest.
A second question asked respondents to rate the Importance of [each] river to you as
an angler, on the same 1-5 scale. This question was accompanied by a lengthy
explanation in the questionnaire instructions, as follows:
This category relies on your own judgement and feelings about each river you
fish. The score you give each river is not necessarily related to the amount of
time you spend angling on it. You may for instance, value the headwaters of a
remote river highly, because of the quality of the whole angling experience even
though you may only manage a trip every 2-3 years. On the other hand, you
may value a river close to home as it allows you to go fishing frequently. One
way of assessing the importance of a river to you is to imagine how you would
feel if you no longer had the opportunity of fishing it.
In retrospect, it seems clear that the wording associated with at least some of these
attributes was ambiguous, difficult to interpret, or potentially biased. For example, for
close to where you live respondents may have been unclear as to whether a rating of 1
meant a river was very close to home or very remote. For good catch rate and size of
fish, no direction is given to respondents who fished a river but failed to catch
anything. Contemporary reports from anglers who were included in the original
random sample also indicated confusion over whether these attributes referred to their
expectations of a river, or the experience they actually had there. By contrast, the
guidelines for feelings of solitude/peace were very explicit, and could be interpreted as
encouraging respondents to emphasise this attribute at the expense of others.
Inspection of the survey results seems to bear out these concerns. Ratings for most
attributes were strongly skewed, with more than twice as many attributes rated as 5
(highest) than 1 (lowest). This suggests that the responses had limited power to
discriminate between rivers of differing value. Over 56% of respondents rated feelings

Attributes characterising river fisheries managed by Fish & Game New Zealand: a pilot survey of the Otago and Nelson/Marlborough regions 4
of solitude/peace as above average (4 or 5) compared to 28% for good catch rate and
27% for size of fish, also suggesting a degree of bias and further weakening the power
to discriminate between individual rivers. One sixth (16.5%) of the responses did not
give a rating for size of fish, compared to ~5% for all other attributes, confirming that
this attribute may have been poorly worded, or simply irrelevant for some rivers.
A second undesirable feature of the 1979 NAS format was the use of an ordinal rather
than numeric scale to measure each attribute (Zar 1999). In practice most of the
original analyses simply ignored this discrepancy and calculated mean ratings for each
attribute as though the data were based on an interval or ratio scale, but this is
potentially misleading and requires further justification if it is to be used to compare
different attributes. For these reasons, I sought a more structured approach to the Pilot
Survey, so as to eliminate (or at least minimise) any ambiguity in the resulting
attribute data, and yield numerical scores which could be interpreted consistently for
each attribute.
2.2. Survey design
The Pilot Survey was designed to be implemented by telephone, using a third party
(the Southland Institute of Technology; SIT) to undertake the necessary calls. This
approach has become increasingly popular with FGNZ in recent years, proving to be a
quick and cost-effective method of data capture. The questions to be asked of
respondents were therefore constrained by the need to be as concise as possible, so as
to be easily within the scope of a telephone conversation without compromising data
quality.
Taking this consideration into account, together with the desire for a more quantitative
measure of each attribute’s importance, I decided to present respondents with a list of
all attributes of interest, and ask them to nominate at most three attributes which they
consider of particular relevance to each river. This allows each attribute to be ranked
simply by expressing the number of responses who list it in their notional top three as
a percentage of the total number of responses for each river. For example, if a
particular river was listed by 60 respondents, of whom each of seven possible
attributes was identified as one of its three most important characteristics by (e.g.) 7,
5, 22, 52, 12, 48, and 4 respondents, respectively, then I would identify the fourth
(52), sixth (48) and third (22) attributes as the most important. Expressing these counts
as a proportion (from 0 to 1) of the respondents who ranked each fishery then yields a
smoothly and continuously varying index for each attribute (subject to the constraint
that each count must be a whole number), avoiding the need to work with ordinal
count data. Essentially, this approach allows each respondent to vote for three
attributes for each river, and for these votes to be tallied to determine the final score.
Attributes characterising river fisheries managed by Fish & Game New Zealand: a pilot survey of the Otago and Nelson/Marlborough regions 5
The Pilot Survey was restricted to river fisheries within the two participating regions,
with respondents being asked only to rate rivers within their home region. This was
motivated by the desire to keep the pilot survey to a manageable size, and to exclude
rivers elsewhere in New Zealand which were likely to be fished by insufficient
respondents to yield a worthwhile amount of data. Respondents were invited to
include any rivers which they had fished within the last 2-3 years even if they had not
visited them during the most recent (2007/08) angling season, on the grounds that the
attributes of interest were general characteristics of each river rather than being
specific to a particular season.
2.2.1. River fishery attributes
My review of the 1979 NAS, reinforced by further discussions with FGNZ managers
in the two participating regions, suggested that the original list of seven attributes was
still appropriate for characterising river fisheries, with little need for additions.
However, most attributes were wholly or partially reworded, so as to minimise (and
hopefully eliminate) any ambiguity or potential source of bias. The resulting list of
attributes was as follows:
Close to home. Interpretation of the 1979 NAS data was sometimes confounded by
uncertainty as to whether respondents had fished a particular river from the normal
home, or while on holiday at a bach or camping ground. To clarify this, we chose to
define two attributes relating to travel distance, i.e.:
close to where you normally live
close to where you live while on holiday
ease of access; large areas of fishable water: These attributes caused no obvious
problems with the 1979 NAS, and were left unchanged.
scenic beauty; feelings of solitude/peace: These attributes were highly correlated in
the 1979 NAS, with rivers scoring highly for scenic beauty also tending to score
highly for peace/solitude, and the extent to which respondents differentiated between
the two is unclear. In addition, the concept of “wilderness value” is now far more
widely recognised than it was in 1979. We therefore replaced solitude/peace with
wilderness character, both to reflect current usage and to more sharply differentiate
this attribute from scenic beauty.
good catch rate; size of fish: Discussion with FGNZ managers suggested that for
most anglers, these two attributes were as much about anticipation as they were about
the actual experience. We therefore reworded each attribute so as to emphasise their
anticipatory nature:
Attributes characterising river fisheries managed by Fish & Game New Zealand: a pilot survey of the Otago and Nelson/Marlborough regions 6
anticipation of a good catch rate
anticipation of landing large fish
In addition, respondents were given the opportunity to nominate any other attributes
which they considered relevant to a particular fishery. This was done to be consistent
with the pilot survey approach, with the intention of collating all such responses and
identifying any additional attributes which should be specifically included in future
surveys.
2.2.2. Overall importance
To encourage respondents to be more expansive in their assessment of the overall
importance of each river, the 1-5 ranking scale as used in the 1979 NAS was modified
so as to give explicit instructions as to how each ranking should be interpreted.
Respondents were asked to “…identify, on the following 1-5 scale, the overall
importance of the [nominated] fishery to you as an angler”:
1. This fishery can provide enjoyable angling, but is not exceptional;
2. This fishery often provides enjoyable angling, but is not exceptional;
3. This fishery consistently provides enjoyable angling;
4. This fishery provides a very enjoyable angling experience, and is one of my
personal favourites;
5. This fishery provides an exceptional angling experience, and has few peers.
2.2.3. Survey population
The survey was limited to holders of adult whole season licences, and the principal
licence holder on family licences, in the Nelson/Marlborough and Otago regions. We
assumed that such anglers could make well-informed judgements on each river they
were familiar with, in contrast to junior and part-season licence holders who were
considered unlikely to have sufficient knowledge to provide well-informed rankings
and choices. The total survey populations were 2 971 in Nelson/Marlborough, and
11 731 in Otago.
2.2.4. Sample selection
Sample sizes for each region were chosen so as to ensure at least 100 responses for the
most popular rivers in each region, with an expectation of diminishing numbers of
responses for less heavily fished rivers. Analysis of the 2007/08 survey database
indicated that the most heavily fished rivers (Clutha, Wairau, Motueka) were typically
fished by around one third of the respondents, suggesting that a total of 300 completed
Attributes characterising river fisheries managed by Fish & Game New Zealand: a pilot survey of the Otago and Nelson/Marlborough regions 7
interviews in each region would meet this requirement. However, the 2007/08 data for
the Nelson/Marlborough and Otago regions also indicated that, within a given two-
month period during the main angling season (October to April), 65% of respondents
either did not fish any rivers within their respective region, fished only lakes, or did
not fish at all. We were thus concerned that only one third of the respondents in a
random sample of licence holders drawn from the total population within each region
would be able to contribute useful data to the survey, thereby reducing its efficiency
and increasing costs.
To help circumvent this we created two strata within each region, each with a nominal
sample size of 150. One stratum (Stratum 1) was drawn from respondents to the
2007/08 survey who had (a) been contacted in exactly one of the six bi-monthly
surveys conducted over the 12 month survey period, so as to avoid excessive response
burden; and (b) fished at least one river fishery within the region of interest. We
expected this stratum to yield a high proportion of positive responses because anglers
who did not fish were automatically excluded. We implicitly assumed that respondents
who were able to be contacted by telephone constituted a random sample of all licence
holders with respect to their fishing habits, and hence that these individuals provided a
valid sampling frame for the purposes of the pilot survey. Stratum 2 was drawn from
licence holders who were not contacted during the 2007/08 survey. We therefore
expected Stratum 2 to include some licence holders who fished little or not at all, and
hence to yield a higher proportion of negative (i.e., did not fish) responses than
Stratum 1, but would serve as a control group whose angling preferences could be
assumed to be fully representative of all licence holders. One of the objectives of the
pilot survey was to compare results from both strata and evaluate any bias associated
with Stratum 1, and hence to assess the utility of the 2007/08 database as a resource
for future surveys.
2.2.5. Interview procedures
Telephone interviews for all strata were conducted by the SIT in Invercargill, using a
team of operators who had worked with FGNZ on several previous surveys including
the 2007/08 survey. SIT call staff were provided with a random sub-sample of licence
holders drawn from the sampling frame for each stratum, giving the licence number,
name, and phone number for each individual in MS™ Excel format. Interviewers
worked sequentially through each list, making one call to each licence holder and
moving immediately to the next if there was no response. I assumed that respondent’s
fishing activity over the preceding three years was unrelated to whether or not they
could be contacted on the first attempt, and hence that the resulting sample was
unbiased.
Attributes characterising river fisheries managed by Fish & Game New Zealand: a pilot survey of the Otago and Nelson/Marlborough regions 8
Stratum 1 licence holders (who had previously been contacted as part of the 2007/08
survey) were thanked for the help, and informed that the present call was a follow-up
to a small group of anglers selected at random from the earlier survey. Stratum 2
licence holders were told that their name had been randomly selected from FGNZ
licence records, and invited to participate in a new survey. Respondents from both
strata were then informed that the present survey aimed to learn why anglers fish
particular rivers, and what they considered the most important attributes of each river.
Anglers who had fished at least one river over the last 2-3 years were then asked to
identify the three most important attributes of each river, prompted by the interviewer
who read out the full list of available attributes (as defined in Section 2.2.1), and to
assess its overall importance (as defined in Section 2.2.2). Interviewers were asked to
offer respondents the option of receiving a hard copy of the questionnaire by post if
the large number of rivers for which an angler wished to provide assessments made
conducting the interview by telephone too complex, but in practice most interviews
proceeded smoothly with less than 5% of respondents opting for a written
questionnaire.
All responses were entered directly into Excel as the interview proceeded, using a data
entry form linked to a lookup list identifying all recognised river fisheries within the
survey region. This list was an exact copy of the corresponding table in the 2007/08
survey database, so as to maintain full compatibility between the respective survey
data sets. This list included eight large mainstem rivers (two in Otago and six in
Nelson/Marlborough) which varied significantly in character over their length and
were divided into up to four sub-reaches (Unwin 2009).
2.3. Data analysis
Attribute scores for each river were derived by tallying the number of times each
attribute was listed, and expressing this as a fraction of the total number of
respondents. Most respondents (75%) nominated exactly three attributes for each
fishery, as intended, but individual cases ranging from one to seven were recorded.
Responses which identified only one or two attributes were left to stand, on the basis
that respondents were expressing a legitimate opinion that they considered the river in
question to have only one or two significant attributes. Respondents listing more than
three attributes were more problematical, as including their data would potentially
skew the results by inflating the number of individual rankings for the river in
question. After considering various alternatives, I decided to retain all attributes as
listed, but to weight their score for that angler so as to maintain a total of three votes
per respondent. For example, if a respondent nominated four attributes instead of
three, the contribution of each attribute to the final tally was down-weighted from 1 to
0.75. Thus, the summed score for all attributes of a river was capped at three times the
number of respondents, assuming all respondents exercised their three votes, but could
Attributes characterising river fisheries managed by Fish & Game New Zealand: a pilot survey of the Otago and Nelson/Marlborough regions 9
be less than three if some respondents voted for less than three attributes. A mean
importance rating was also calculated for each river, based on the numerical average
of the individual 1-5 ratings.
I conducted separate analyses for the full data set, pooled across both participating
regions and both sample strata, and also for each stratum (pooled across regions) and
each region (pooled across strata). However, the number of fisheries for which a
meaningful analysis was possible was limited by the number of responses available,
with some rivers assessed by only one respondent. To achieve a balance between data
quantity and data quality, detailed analysis of the results was restricted to rivers for
which at least ten responses were available. This was lower than the 1979/81 NAS
threshold of 15, but reflected the smaller size of our dataset (1 979 vs. 20 800 river
assessments).
To explore the potential for future analysis should the survey be implemented at
national level, I used principal components analysis (PCA) to search for groupings of
attributes which most strongly differentiated between individual rivers. The results for
these analyses are necessarily tentative, reflecting the small size of the data set and its
limited geographical coverage.
Verbal comments made by respondents about individual rivers were collated, and
examined for common themes.
3. Results
3.1. The replies
Completed interviews were obtained for 616 licence holders in the two regions,
comprising 316 in Nelson/Marlborough and 300 in Otago (Table 1). These included
148 and 152 licence holders from Stratum 1 (and hence were known to have fished at
least one river) in Nelson/Marlborough and Otago, respectively. Corresponding
figures for Stratum 2 were 168 (Nelson/Marlborough) and 148 (Otago).
A total of 606 respondents (96.8% of those contacted) provided assessments of at least
one fishery, representing 154 fisheries on 136 rivers (Appendix 1). Stratum 1
respondents in both regions provided slightly more assessments (54% of the total) than
did Stratum 2 respondents (46% of the total), but there was no evidence of any
consistent difference in the proportion of respondents who had fished at least one river
(Table 1). Averaged across both strata and regions data were obtained for 3.3 rivers
per respondent. However, the number of assessments per respondent was highly
skewed (Fig. 1), with exactly half of the respondents (297 of 595) providing either one
or two assessments. By contrast, only 21% 122 respondents (122 of 595) assessed five

Attributes characterising river fisheries managed by Fish & Game New Zealand: a pilot survey of the Otago and Nelson/Marlborough regions 10
or more rivers (including 37 for one Nelson/Marlborough angler), but these
individuals collectively provided 49% of the total assessments.
Table 1: Number of responses to the 2008 Pilot Survey by region and stratum. Successive columns show the total number of respondents (Total replies); the number of respondents who had fished at least one river in their home region (Fished rivers); the % of respondents who had fished rivers (% fished); the total number of rivers fished and assessed by all respondents (Rivers fished); and the number of rivers fished per angler (Rivers per angler).
Region Stratum Total
replies Fished rivers % fished
Rivers fished
Rivers per angler
Nelson/Marlborough 1 148 145 98.0% 583 4.02
2 168 155 92.3% 501 3.23
Otago 1 152 148 97.4% 493 3.33
2 148 148 100.0% 402 2.72
Total 616 606 96.8% 1979 3.27
0
20
40
60
80
100
120
140
160
180
1 3 5 7 9 11 13 15 17 19 21 23 25 27 29 31 33 35 37
Assessments per respondent
Nu
mb
er o
f re
spo
nse
s
Figure 1: Number of river assessments by respondent, pooled across regions and strata.

Attributes characterising river fisheries managed by Fish & Game New Zealand: a pilot survey of the Otago and Nelson/Marlborough regions 11
The number of assessments per river ranged from 117 (for the upper Clutha River in
Otago) and 115 (for the lower Wairau River in Nelson/Marlborough) to one (for 25
rivers evenly spread across both regions; Appendix 1). The median number of
responses per river was seven, and only 55 rivers were evaluated by 10 or more
respondents. Responses for one Otago fishery (Dunstan Creek) were deleted from the
database at this point, as inspection of its attributes, and a verbal comment on “good
launching facilities” suggest that many of these responses related to Lake Dunstan
rather than the much more remote and less fished Dunstan Creek.
3.2. Distribution of attributes
Attribute scores for the Pilot Survey tended to be more widely dispersed than for the
1979 NAS equivalents, with less evidence of strong clustering around the mean, a
broader range, and more extreme values at one or both ends of the observed range
(Table 2, Figure 2). However, the strength of this tendency varied considerably
between individual attributes, being strongest for “wilderness character”, “anticipated
good catch rate” and “anticipate large fish”, intermediate for “large area fishable”, and
weak or for “ease of access” and “scenic beauty”. Scores for “close to home” were
broadly dispersed in both surveys, while “close to where you live on holiday” (which
was not included in the 1979/81 NAS) only rarely scored above 0.2 in the pilot survey.
Table 2: Summary statistics for the eight Pilot Survey attributes based on pooled responses for the Otago and Nelson/Marlborough regions. Successive columns for each attribute show the total number of times each attribute was identified (out of a maximum possible of 1979); the mean attribute score for 55 rivers fished by at least 10 respondents; and the corresponding range, median, standard deviation (SD), coefficient of variation (CV), and skewness.
Attribute N Mean Range Median SD CV Skewness
Ease of access 1222 0.55 0.13 - 0.82 0.61 0.18 0.29 -0.76
Close to where you live 1033 0.47 0.12 – 1.00 0.46 0.23 0.50 0.39
Scenic beauty 896 0.47 0.06 - 0.79 0.47 0.15 0.32 -0.07
Large area of fishable water 812 0.36 0.00 - 0.72 0.35 0.14 0.40 -0.14
Anticipate good catch rate 668 0.31 0.00 - 0.63 0.31 0.14 0.45 0.04
Wilderness character 452 0.25 0.00 - 0.73 0.20 0.18 0.93 0.92
Anticipate large fish 420 0.21 0.00 - 0.61 0.16 0.14 0.86 0.69
Close to where you live on holiday 279 0.12 0.00 - 0.53 0.10 0.12 1.19 1.61

Attributes characterising river fisheries managed by Fish & Game New Zealand: a pilot survey of the Otago and Nelson/Marlborough regions 12
0.0 0.2 0.4 0.6 0.8 1.0Close to home
0
5
10
15
1 2 3 4 50
20
40
60
80
100
120
Close to home
0.0 0.2 0.4 0.6 0.8 1.0Close to holiday
0
10
20
30
40
0.0 0.2 0.4 0.6 0.8 1.0Ease of access
0
10
20
30
1 2 3 4 50
50
100
150
200
Ease of access
0.0 0.2 0.4 0.6 0.8 1.0Large area fishable
0
5
10
15
20
1 2 3 4 50
50
100
150
200
Large areas of fishable water
0.0 0.2 0.4 0.6 0.8 1.0Scenic beauty
0
5
10
15
20
0.0 0.2 0.4 0.6 0.8 1.0Wilderness character
0
5
10
15
20
25
1 2 3 4 50
20
40
60
80
100
120
Scenic beauty1 2 3 4 5
0
50
100
150
Feelings of peace and solitude
0.0 0.2 0.4 0.6 0.8 1.0Anticipate good catch rate
0
5
10
15
20
0.0 0.2 0.4 0.6 0.8 1.0Anticipate large fish
0
5
10
15
20
1 2 3 4 50
50
100
150
200
Good catch rate1 2 3 4 5
0
50
100
150
Size of fish
Pilot survey
1979/81 NAS 1979/81 NAS 1979/81 NAS
1979/81 NAS 1979/81 NAS 1979/81 NAS 1979/81 NAS
Pilot survey
Pilot survey
Pilot survey
Pilot survey
Pilot survey
Pilot survey
Pilot survey
Figure 2: Frequency distributions for the eight Pilot Survey attributes and their 1979 NAS counterparts, based on mean scores for 55 rivers (Pilot Survey; minimum of 10 responses) and 389 rivers (1979 NAS; minimum of 15 responses).
The distribution of scores for each attribute was strongly related to the number of
times it was nominated (Table 2). The most frequently nominated attributes (“ease of
access”, “close to home”), tended to be the least dispersed and the most normally
distributed, with low coefficients of variation and low skewness (Figure 2). By
contrast, attributes which were only rarely nominated as one of the three most
important (e.g., “close to where you live on holiday”) were broadly dispersed and
highly skewed. This relationship supports the suggestion that forcing respondents to
choose between the available attributes, rather than simply ranking all possible
attributes (as in the 1979/81 NAS) generates more meaningful data. For example, the
tendency for the 1979/81 NAS scores for “[anticipation of a] good catch rate” and
“[anticipation of landing] large fish” to cluster about the mean seems to have been
partly an artefact of demanding that they rank these attributes even if they did not feel
strongly about them. This appears to have generated a lot of noise in the results, with
scores for many rivers simply emerging as average and partly burying any signal from

Attributes characterising river fisheries managed by Fish & Game New Zealand: a pilot survey of the Otago and Nelson/Marlborough regions 13
the subset of rivers for which these attributes were genuinely important. By contrast,
the Pilot Survey results indicate that these attributes are important for a relatively
small subset of river fisheries, providing much better discrimination between
individual fisheries.
Pairwise correlations between individual attributes were generally weak (Figure 3).
All correlations exceeding 0.5 in absolute value involved either “scenic beauty’ or
“wilderness character”, which were positively correlated with each other (r = 0.635),
and negatively correlated with “close to home” (-0.613 and -0.531, respectively) and
“ease of access” (-0.569, -0.703, respectively). By contrast, “close to where you live
on holiday” and “anticipation of a good catch rate” showed almost no correlation with
any other attribute, and correlations between “anticipation of landing large fish” and
other attributes were only slightly stronger. This result suggests that all of the eight
attributes available to respondents are relevant to characterising river fisheries, with
relatively little overlap.
Close to home
Close toholiday
Clo
se t
oho
liday
Ease ofaccess
Eas
e o
fac
cess
Areafishable
Are
afis
habl
e
Scenicbeauty
Sce
nic
beau
ty
Wildernesscharacter
Wild
ern
ess
char
acte
r
Catch rate
Cat
ch ra
teS
ize
of fi
sh
-0.304
0.423 0.131
0.020 0.133 0.185
-0.613 -0.068 -0.569 -0.333
-0.531 -0.185 -0.703 -0.180 0.635
-0.086 0.211 -0.032 0.185 -0.083 -0.188
-0.372 -0.261 -0.448 -0.083 0.216 0.352 -0.309
Figure 3: Scatterplot matrix of mean attribute scores for 55 Otago and Nelson/Marlborough river fisheries which attracted at least ten responses. Correlation coefficients for each plot are shown in red or blue, for positive and negative

Attributes characterising river fisheries managed by Fish & Game New Zealand: a pilot survey of the Otago and Nelson/Marlborough regions 14
It thus appears that the pilot survey format performed at least as well as the 1979/81
NAS in characterising variation between individual river fisheries, and often did
considerably better. Based on the observed distributions, the eight pilot survey
attributes can be interpreted as follows.
Close to where you normally live. This attribute was broadly dispersed in both
surveys, suggesting that it is one of the easiest for anglers to assess and respond to.
Scores for individual rivers ranged from 1.00 on the Waimea and Arrow Rivers (i.e.,
every respondent identified this as one of its three most important attributes) to 0.13
on the Travers River (two of 15 respondents) and 0.12 on the Takaka River (two of 17
respondents). It was the second most commonly cited key attribute, appearing in
51.7% (1033 of 1998) of all assessments.
Close to where you live while on holiday. This was the least commonly cited key
attribute, appearing in 14.0% (279 of 1998) assessments. It was highly skewed
towards low rating scores (median 0.10; Table 1), and scored over 0.20 (i.e., was
nominated by over 20% of respondents) for only 8 of 56 rivers. Several of these
(Hawea River, upper Clutha River, Hunter River) are in the upper Clutha area,
consistent with its popularity as a holiday destination, and two others (the Aorere and
Takaka Rivers) are in Golden Bay.
Ease of access was the most frequently cited attribute, being nominated by 61.2% of
respondents (1222 of 1998). It was approximately normally distributed and had the
lowest CV of any of the attributes, with few outlying values. High scoring rivers
included the Takaka River, Dart River, Diamond Creek, and the Rai River, while low
scoring rivers included the Goulter River, Hunter River, and Dingle Burn.
Large areas of fishable water was nominated as a key attribute in 40.6% (812 of
1998) of assessments. It was approximately normally distributed, with little evidence
of skewness (Figure 2), but was moderately well dispersed with a lower tail which
included one zero value (the Arrow River). The highest scoring fisheries with respect
to this attribute were the Maruia (0.72), Wairau (0.54-0.59), upper Motueka (0.57),
and Taieri (0.53). Other low scoring rivers included the Shag River, Spring Creek, the
Motupiko River, and the Gowan River (0.09-0.16). These results are consistent with
the physical attributes of each river, with Spring Creek and the Gowan River offering
only a few km of fishable water.
Scenic beauty was the third most frequently identified key attribute, being nominated
in 44.8% (896 of 1998) assessments. Consistent with the tendency for the most
commonly cited attributes to be the most normally distributed, scores for “scenic
beauty” had a mean close to 0.50 (Table n) and few extreme values. High scoring
Attributes characterising river fisheries managed by Fish & Game New Zealand: a pilot survey of the Otago and Nelson/Marlborough regions 15
fisheries (≥ 0.7) included the Goulter River, Timaru River, Sabine River, and Travers
River. Only one river (the Waimea) scored below 0.20 (Appendix 1).
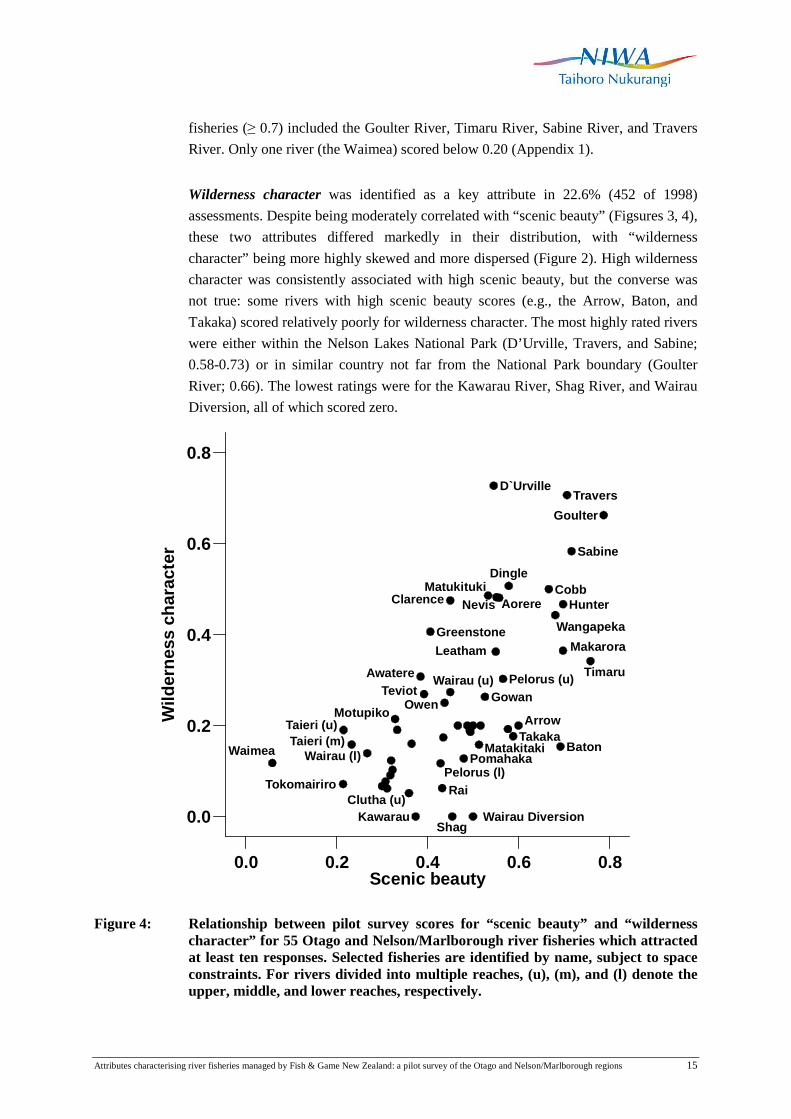
Wilderness character was identified as a key attribute in 22.6% (452 of 1998)
assessments. Despite being moderately correlated with “scenic beauty” (Figsures 3, 4),
these two attributes differed markedly in their distribution, with “wilderness
character” being more highly skewed and more dispersed (Figure 2). High wilderness
character was consistently associated with high scenic beauty, but the converse was
not true: some rivers with high scenic beauty scores (e.g., the Arrow, Baton, and
Takaka) scored relatively poorly for wilderness character. The most highly rated rivers
were either within the Nelson Lakes National Park (D’Urville, Travers, and Sabine;
0.58-0.73) or in similar country not far from the National Park boundary (Goulter
River; 0.66). The lowest ratings were for the Kawarau River, Shag River, and Wairau
Diversion, all of which scored zero.
0.0 0.2 0.4 0.6 0.8Scenic beauty
Wild
ern
ess
char
acte
r
0.0
0.2
0.4
0.6
0.8
Waimea
Tokomairiro
Taieri (u)Taieri (m)
Wairau (l)
Motupiko
Clutha (u)Kawarau
AwatereTeviot
Greenstone
Pelorus (l)Rai
Owen
Wairau (u)
Clarence
Shag
Goulter
Timaru
Sabine
Travers
Hunter
Makarora
Baton
Wangapeka
Cobb
ArrowTakaka
Dingle
Pelorus (u)
AorereNevis
Leatham
D`Urville
Matukituki
Gowan
Matakitaki
Wairau Diversion
Pomahaka
Figure 4: Relationship between pilot survey scores for “scenic beauty” and “wilderness character” for 55 Otago and Nelson/Marlborough river fisheries which attracted at least ten responses. Selected fisheries are identified by name, subject to space constraints. For rivers divided into multiple reaches, (u), (m), and (l) denote the upper, middle, and lower reaches, respectively.

Attributes characterising river fisheries managed by Fish & Game New Zealand: a pilot survey of the Otago and Nelson/Marlborough regions 16
Anticipation of a good catch rate was identified as a key attribute in 33.4% (668 of
1998) assessments. Its distribution was close to normal, with minimal skewness and
no outliers, and scores ranging from zero on two rivers (the Nevis and Leatham) to
well over 0.5 for the Gowan River (0.580 and several back country fisheries in Otago
(Timaru River 0.63; Teviot River 0.55; Dingle Burn 0.53). This is in marked contrast
to the 1979/81 NAS equivalent, ratings for which were strongly clustered around the
mean with little tendency towards extremes in either direction (Figure 2).
Anticipation of landing large fish was the second least commonly cited key attribute,
appearing in 21.0% (420 of 1998) assessments. It showed strong negative skewness,
with only two rivers (the Nevis and Sabine) scoring over 0.50, and 15 of the 56 rivers
available for analysis scoring below 0.10. For these rivers, therefore, less than 10% of
anglers considered that the prospect of catching a large fish was a key motivation for
choosing to fish there. As with anticipated catch rate, this result contrasts strongly
with the 1978/81 NAS equivalent, for which individual river scores were strongly
clustered with little deviation from the mean.
Overall importance ratings were approximately normally distributed, and differed
little if at all from the 1979/81 NAS equivalents (Figure 5). In particular, both surveys
indicate a general tendency for these ratings to be skewed towards the high end of the
scale, with respondents being more likely to assign a score of 4 or 5 than a score of 1
or 2. In terms of the more detailed descriptions specified in the pilot survey,
respondents were almost three time more likely to choose the highest available
ranking, “this fishery provides an exceptional angling experience, and has few peers”
(18.5% of responses), as they were to chose the lowest available ranking “this fishery
can provide enjoyable angling, but is not exceptional” (6.4% of respondents).
1
2
3
4
5
Number of river fisheries
1979/81 survey(389 rivers)
2007 pilot survey(56 rivers)
Mea
n im
por
tan
ce s
core
5 10 15 20020406080100
Figure 5: Distribution of mean overall importance ratings for the 1979 NAS (389 rivers) and the 2008 Pilot Survey (55 rivers). Medians for each distribution are arrowed.

Attributes characterising river fisheries managed by Fish & Game New Zealand: a pilot survey of the Otago and Nelson/Marlborough regions 17
These results indicate that the Pilot Survey was no more successful than its 1979/81
predecessor in discriminating between the importance of individual river fisheries, and
that any attempt to encourage a wider spread of individual river scores (e.g., by
rephrasing each of the 1-5 rankings) is unlikely to be successful. This does not
necessarily mean that such results are biased, given that – by definition – angling is a
leisure time activity undertaken for pleasure, and that anglers are unlikely to devote
much effort to fisheries which do not “consistently provide enjoyable angling”.
However, an important virtue of the Pilot Survey results is that – in contrast to the
1979/81 NAS – they enable one to make much more definite statements about how
respondents regard each fishery they used. With regard to the Nevis River, for
example, which is currently (May 2009) the subject of an application to amend the
Water Conservation (Kawarau River) Order 1997, the pilot survey data allow one to
state unequivocally that 50% of anglers sampled (9 of 18) who fished the Nevis River
considered that “this fishery provides an exceptional angling experience, and has few
peers”. This statement is more meaningful and easier to interpret than the 1979/81
NAS equivalent, which allows only the rather vague observation that seven out of
twenty respondents awarded it a score of 5 on a 1-5 scale.
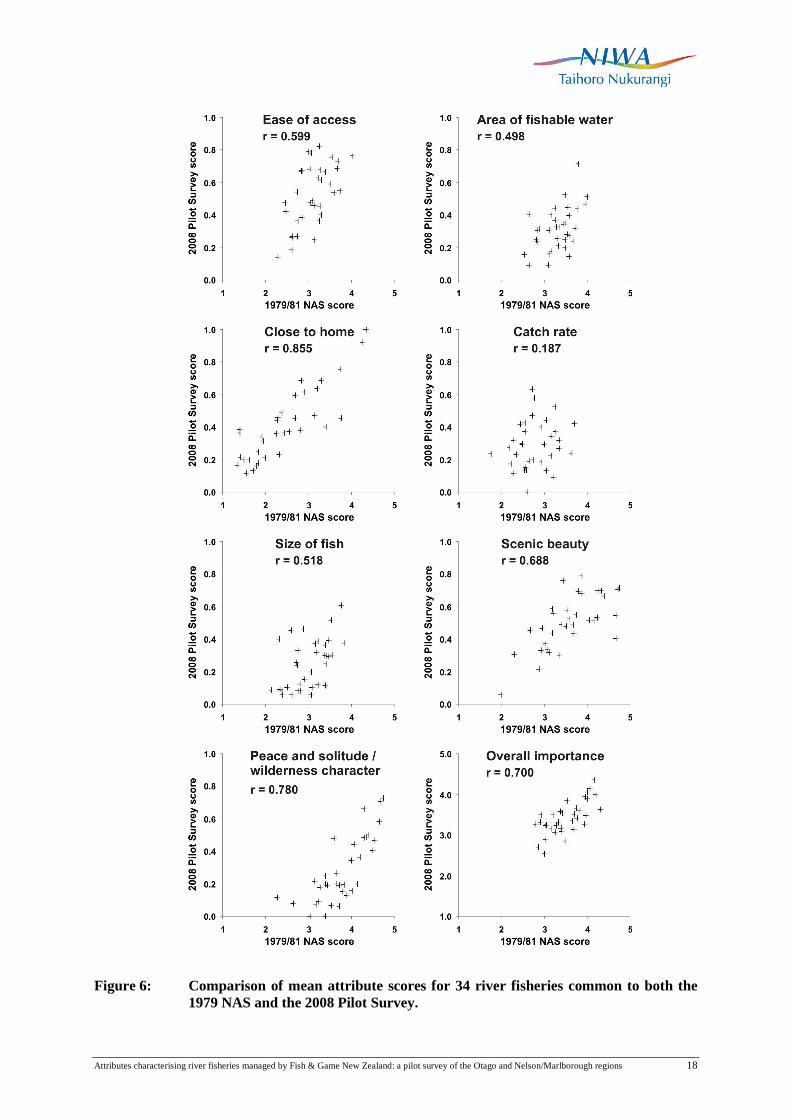
Comparison of mean attribute scores for 34 rivers common to both the 1979 NAS and
the Pilot Survey, and with at least ten responses for the Pilot Survey, suggested that
scores for most attributes were moderately well correlated (Fig. 6), with the notable
exception of “good catch rate” (1979 NAS) vs. “anticipation of a good catch rate”
(Pilot Survey). However, the extent of variability between the two surveys, even for
attributes (such as “close to home”) which were highly correlated, suggests that
detecting long term changes in the attributes of specific river fisheries may be
challenging. The extent to which this variability stems from the changes in the
underlying survey design is unclear. Changes in the wording of some attributes may
be one source of variability, although even for attributes (e.g., “ease of access”) which
were identically phrased in both surveys the variability was substantial. It is also
possible that asking respondents to identify three key attributes for each river rather
than ranking each individual attribute may have influenced the resulting scores.
3.3. Other attributes
Just under 14% (275 of 1979) of the responses for individual river fisheries included
additional verbal comments. Many of these were more akin to comments on the
general nature of the fishery (e.g., “dairy pollution”, “fishing is deteriorating”) than to
its characteristic attributes. Other comments were anecdotal (e.g., “nice river”, “only
been a few times”) or simply reiterated attributes which had already been nominated
(e.g., “scenery”, “big fish”).
Attributes characterising river fisheries managed by Fish & Game New Zealand: a pilot survey of the Otago and Nelson/Marlborough regions 18
Figure 6: Comparison of mean attribute scores for 34 river fisheries common to both the 1979 NAS and the 2008 Pilot Survey.

Attributes characterising river fisheries managed by Fish & Game New Zealand: a pilot survey of the Otago and Nelson/Marlborough regions 19
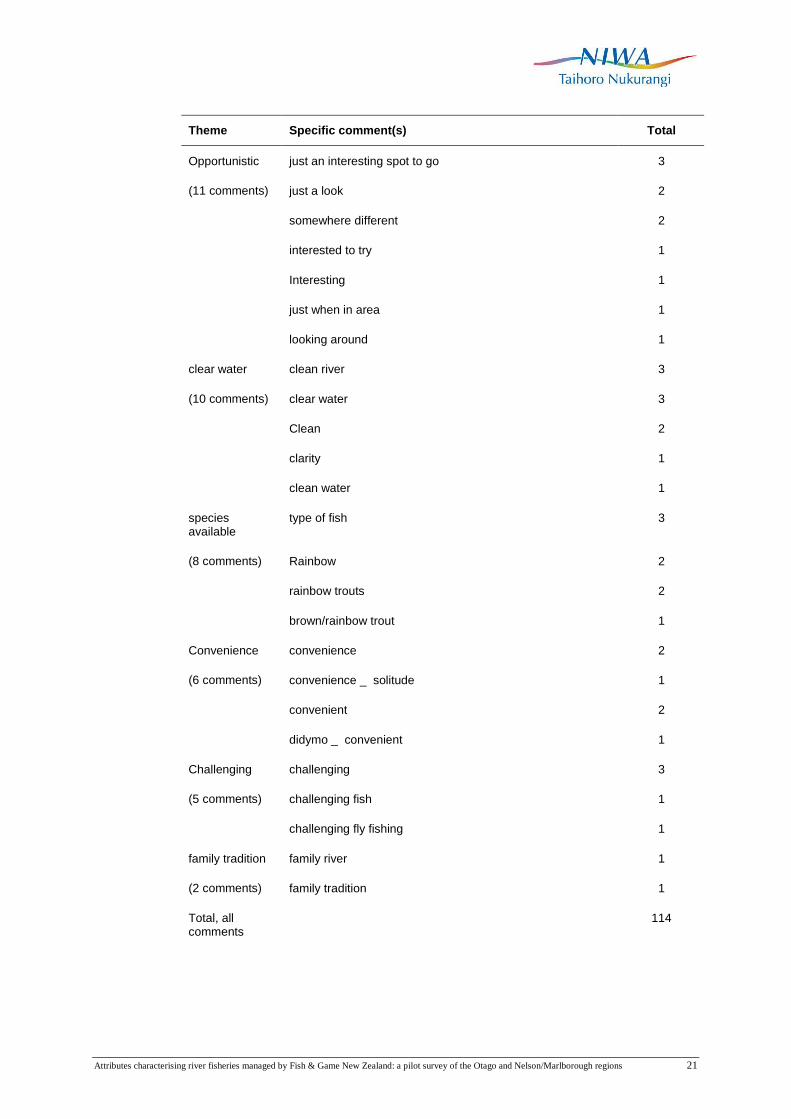
Nevertheless, the remaining comments suggested several consistent themes (Table 3).
Concern over the invasive aquatic diatom Didymosphenia geminata (didymo; Kilroy
2004, Kilroy et al. 2005) was by far the most common of these, being noted by 49
respondents. The presence of didymo evidently did not deter respondents from fishing
these rivers, but its absence from another river may significantly influence angler
choice when faced with two otherwise similar fishing alternatives. If so, adding
“absence of didymo” to the list of attributes to be considered for each fishery may be
appropriate. This would potentially be informative in some FGNZ regions, but – as of
mid 2009 – is relevant only to South Island rivers. It would also introduce an attribute
which is inherently time dependent, potentially confounding detection of long term
trends in relation to other attributes.
Other potential attributes to emerge from the collated list of comments were “solitude”
(18 respondents), and the species of fish available (six respondents). Only six of the
eighteen respondents who identified “solitude” also nominated “wilderness character”
as a key attribute, suggesting that for the remaining twelve respondents “solitude” and
“wilderness character” were not necessarily equivalent. Most of the rivers to which
these respondents were referring (e.g., the Dingle, Young, Sabine, and D’Urville)
generally scored highly for “wilderness character”, but notable exceptions included
the Waimea, Riwaka, and lower Motueka Rivers. This suggests that for these
individuals, a feeling of solitude can be obtained in a relatively developed rural
environment, and may owe as much to the absence of other anglers in the immediate
vicinity as to remoteness.
Of the six respondents whose comments related to the species of fish available, five
were referring specifically to the Pelorus River, consistent with its status as one of the
few rivers in the Nelson/Marlborough region which supports both rainbow and brown
trout. This attribute is well recognised by regional FGNZ staff, and is clearly an
important characteristic of the fishery. However, rivers which sustain genuine multi
species fisheries are relatively rare elsewhere in New Zealand, the main exceptions
being the large salmon-producing rivers on the east coast of the South Island
(particularly the Waimakariri, Rakaia, Rangitata and Waitaki), and is unlikely to
justify inclusion of an attribute such as “species of fish available” in a survey targeting
all rivers in New Zealand. This attribute would potentially be more important in a
survey targeting lake fisheries, particularly with respect to some large South Island
glacial-formed lakes (e.g., Lake Coleridge, Lake Hawea), and coarse fisheries in the
upper North Island.

Attributes characterising river fisheries managed by Fish & Game New Zealand: a pilot survey of the Otago and Nelson/Marlborough regions 20
Table 3: Collated comments associated with 114 river assessments, grouped by the general theme of the comment. Comments which do not relate to specific attributes of a river (e.g., “nice river”) are not shown.
Theme Specific comment(s) Total
Didymo Didymo
(49 comments) didymo _ fluctuation due to dam 3
didymo - no noticeable difference - rate of flow affects fishing
2
didymo - put off salmon fishing 2
didymo esp when Hawea gates open; be aware of access with housing development
2
didymo put me off 1
didymo _ not a lot 1
didymo; animals in river;fences not intact - animals in river; lots of whitebaiters leaving things behind – rubbish
1
didymo; f and g should seriously police dairy farming pollution - heavy fines
1
didymo; lack of water with Hawea 1
don't now because of didymo 1
farm pollution _ didymo 1
full of didymo 1
full of rock snot- unappealing 1
good job regarding water quality due to farming _ didymo 1
lots of didymo 1
one time stop _ didymo 1
shocked about didymo 1
spoilt by didymo 1
suspected didymo 1
Solitude Solitude 16
(23 comments) Quiet 4
Isolation 1
not likely to meet other peers 1
not many other fishers 1
Attributes characterising river fisheries managed by Fish & Game New Zealand: a pilot survey of the Otago and Nelson/Marlborough regions 21
Theme Specific comment(s) Total
Opportunistic just an interesting spot to go 3
(11 comments) just a look 2
somewhere different 2
interested to try 1
Interesting 1
just when in area 1
looking around 1
clear water clean river 3
(10 comments) clear water 3
Clean 2
clarity 1
clean water 1
species available
type of fish 3
(8 comments) Rainbow 2
rainbow trouts 2
brown/rainbow trout 1
Convenience convenience 2
(6 comments) convenience _ solitude 1
convenient 2
didymo _ convenient 1
Challenging challenging 3
(5 comments) challenging fish 1
challenging fly fishing 1
family tradition family river 1
(2 comments) family tradition 1
Total, all comments
114
Attributes characterising river fisheries managed by Fish & Game New Zealand: a pilot survey of the Otago and Nelson/Marlborough regions 22
3.4. Types of fisheries
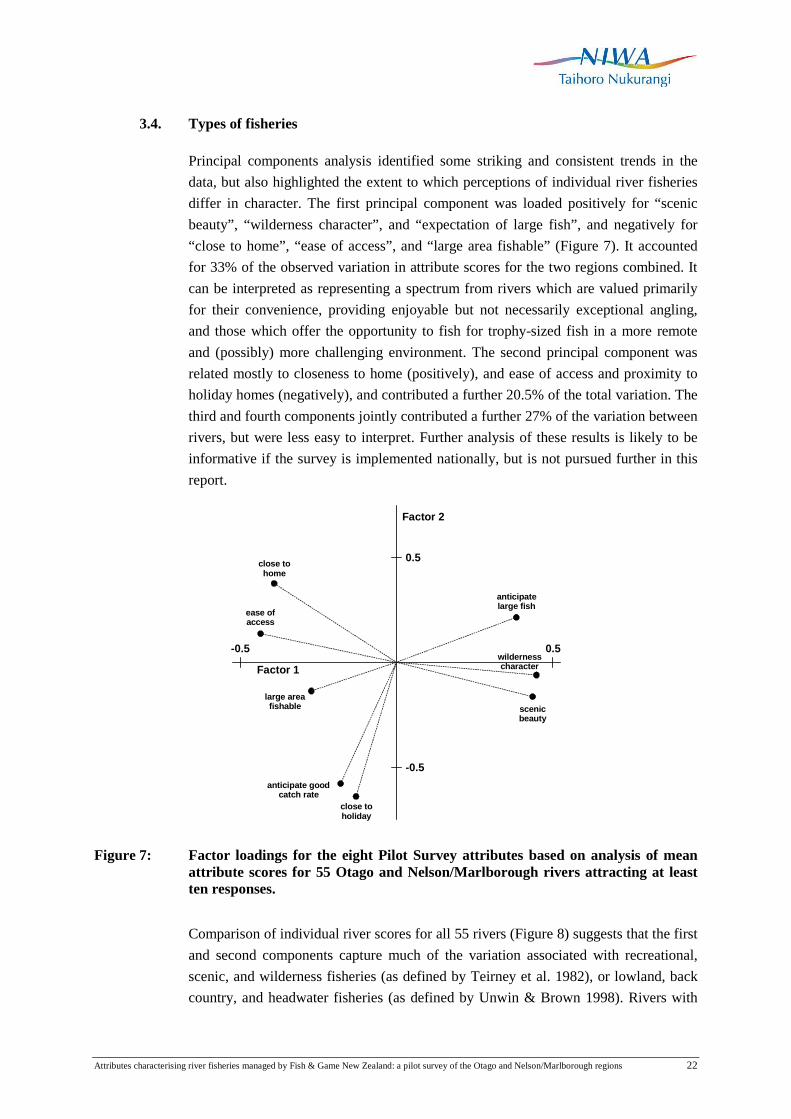
Principal components analysis identified some striking and consistent trends in the
data, but also highlighted the extent to which perceptions of individual river fisheries
differ in character. The first principal component was loaded positively for “scenic
beauty”, “wilderness character”, and “expectation of large fish”, and negatively for
“close to home”, “ease of access”, and “large area fishable” (Figure 7). It accounted
for 33% of the observed variation in attribute scores for the two regions combined. It
can be interpreted as representing a spectrum from rivers which are valued primarily
for their convenience, providing enjoyable but not necessarily exceptional angling,
and those which offer the opportunity to fish for trophy-sized fish in a more remote
and (possibly) more challenging environment. The second principal component was
related mostly to closeness to home (positively), and ease of access and proximity to
holiday homes (negatively), and contributed a further 20.5% of the total variation. The
third and fourth components jointly contributed a further 27% of the variation between
rivers, but were less easy to interpret. Further analysis of these results is likely to be
informative if the survey is implemented nationally, but is not pursued further in this
report.
-0.5 0.5
Factor 1
Factor 2
-0.5
0.5
ease ofaccess
close tohome
large areafishable
anticipate goodratecatch
wildernesscharacter
scenicbeauty
anticipatelarge fish
close toholiday
Figure 7: Factor loadings for the eight Pilot Survey attributes based on analysis of mean attribute scores for 55 Otago and Nelson/Marlborough rivers attracting at least ten responses.
Comparison of individual river scores for all 55 rivers (Figure 8) suggests that the first
and second components capture much of the variation associated with recreational,
scenic, and wilderness fisheries (as defined by Teirney et al. 1982), or lowland, back
country, and headwater fisheries (as defined by Unwin & Brown 1998). Rivers with

Attributes characterising river fisheries managed by Fish & Game New Zealand: a pilot survey of the Otago and Nelson/Marlborough regions 23
positive scores for the first component tend to sustain wilderness or headwater
fisheries, such as the Travers, Sabine and Goulter in Nelson/Marlborough, and the
Hunter, Dingle, and Nevis in Otago. Rivers with negative scores for this component
tend to be in the lowland or back country categories, distinguished mainly by their
score with respect to the second component. Rivers with the highest scores on this axis
tend to be small lowland or semi-lowland rivers (e.g., Waimea, Opawa, Arrow, Shag),
while those with the lowest scores tend to be larger back country fisheries (e.g., upper
Clutha, upper Buller, Maruia, and Hawea) which provide abundant angling
opportunity in settings which are attractive but not necessarily remote.
Waimea
Wairau (L)
Motueka (U)Motueka (L)
Rai
Pelorus (L)
Wairau Div
Opawa
AwatereBuller (M)
RiwakaWairau
Goulter
Travers
Sabine
D`Urville
Cobb
Wangapeka
Leatham
Aorere
Gowan
Clarence (L)
Pelorus (U)Owen
Spring Ck
Matakitaki
Maruia
Wairau (U)
Buller (U)
Baton
Motupiko
Takaka
Taieri (M)
Kawarau
Taieri (L)
Clutha (U)
Clutha (L)
Taieri (U)
Tokomairiro
Dart
Hawea
Manuherikia
Waipahi
Arrow
TeviotDiamond Ck
Pomahaka
Hunter
Nevis
Dingle
Makarora
Timaru
Matukituki
Greenstone
Shag
-1.0 -0.5 0.0 0.5 1.0PCA1
PC
A2
-0.6
-0.4
-0.2
0.0
0.2
0.4
Otago"
Nelson/Marlborough
Figure 8: Scores for 55 Otago and Nelson/Marlborough river fisheries, based on the first and second principal component from analysis of mean scores for each of eight attributes. Rivers which were subdivided into multiple reaches are denoted L, M, or U for lower, middle, and upper, respectively.
4. Discussion
4.1. Survey design
The Pilot Survey format appears to have been considerably more successful than its
1979/81 predecessor in strengthening the extent to which the responses can be used to
discriminate between individual river fisheries. Asking respondents to identify the
three most important attributes of each river, rather than rate all possible attributes
Attributes characterising river fisheries managed by Fish & Game New Zealand: a pilot survey of the Otago and Nelson/Marlborough regions 24
irrespective of their importance, yielded results which were at least as descriptive as
their 1979/81 equivalents, and often considerably more so. The wording used to
describe the Pilot Survey attributes also appears to have made them easier for
respondents to interpret, particularly for “anticipated catch rate” and “anticipation of
large fish” which were poorly defined in the 1979/81 survey.
Further refinement of the attributes to be presented to respondents is undoubtedly
possible, but it is unclear whether doing so would greatly enhance the survey results.
“Close to where you live on holiday” was cited only rarely, but this may be because
respondents were asked to limit their replies to rivers within their home region. This
attribute may well be more relevant if the survey is to be conducted at a national level,
with respondents allowed to assess rivers anywhere in the country. Likewise, there
appear to be no compelling reasons for reintroducing an attribute related to solitude.
This clearly contributes to the angling experience, but was mentioned by less than 3%
of respondents and is at least partially synonymous with “wilderness character”. The
presence/absence of didymo is the strongest contender for inclusion in a national
survey, but – as noted in section 0 – has the potential to differentially affect results for
the North and South Islands.
An additional benefit of asking respondents to identify only the three most important
attributes of each river is that this judgement can be made independently for each river
irrespective of how many other rivers the respondent fished. Given that over half the
respondents fished no more than four rivers, and that over 20% fished only one or two,
I believe that this is more likely to generate meaningful data than asking them to rate
each attribute on a 1-5 scale as in the original NAS. It is likely to be considerably
easier for an inexperienced angler who is familiar with only two rivers to identify their
three most important characteristics than it would be to rank each attribute in relation
to the one other river they have fished.
A potential disadvantage of the revised format used for the Pilot Survey, as noted in
Section 3.2, is that it may have helped to confound any changes in the attribute scores
for individual river fisheries since the original NAS. This is a legitimate concern,
particularly if FGNZ sees detection of such long term trends as one of the primary
aims of the survey. If so, the benefits of the Pilot Survey format as identified in this
report should be weighed up against the potential loss of inter-survey comparability.
4.2. Survey implementation
Administering the survey via telephone proved to be a highly effective way of
gathering data. Fewer than 20 respondents took up the option of completing a hard
copy of the questionnaire via post, suggesting that providing the level of detail sought

Attributes characterising river fisheries managed by Fish & Game New Zealand: a pilot survey of the Otago and Nelson/Marlborough regions 25
by interviewers was well within the capabilities of most respondents. Indeed, SIT staff
commented favourably on angler’s response to the survey, and their willingness to
provide information.
It also appears that interviewers had little difficulty capturing river names with
sufficient accuracy to avoid errors of misidentification, albeit with a few exceptions
(e.g., Lake Dunstan vs. Dunstan Creek; see Section 3.1). This contrasts with the
recently completed 2007/08 National Angling Survey, for which incorrectly named or
misidentified waters were a significant source of confusion and required numerous
manual corrections to the survey database (Unwin 2009). However, an obvious
contrast between the two surveys is that the National Survey covered the whole of
New Zealand, whereas the Pilot Survey required each interviewer to be familiar only
with rivers from a single FGNZ region. If the Pilot Survey format is to be adopted at a
national level, it may well be appropriate for collated responses for each region to be
manually reviewed by local FGNZ staff immediately after data entry, so as to catch
any such errors and make follow up telephone calls as necessary. Otherwise there may
be some risk that outlying results associated with misidentifed rivers may skew the
results. In addition, implementing the survey at a national level will increase the
potential for confusion between rivers in different parts of the country which share the
same name.
4.3. Sampling strategies
Using known river anglers from the 2007/08 National Angling Survey as a sampling
frame in order to maximise the number of rivers fished per respondent met with only
limited success. In practice, anglers selected at random from the full set of whole
season licence records for each region were only slightly less active than those in the
national survey sub-sample, and provided almost as many assessments.
Respondents to the national survey were asked to identify waters they had fished only
over the preceding two months, and it does not follow that anglers who were inactive
during this period remained so throughout the twelve month angling season. Should
the Pilot Survey format be adopted at a national level, simple random sampling of all
adult licence holders in each region would appears to be as close to an optimum
sampling strategy as can be achieved with the resources available to FGNZ.
4.4. Data utility
A significant limitation on the utility of the survey data is the relatively small number
or river fisheries with sufficient responses to allow meaningful analysis. For the
purposes of the Pilot Survey this limit was nominally (and arbitrarily) set at ten or
Attributes characterising river fisheries managed by Fish & Game New Zealand: a pilot survey of the Otago and Nelson/Marlborough regions 26
more, but this should be regarded as an absolute minimum. Unfortunately, the nature
of angling in New Zealand is that the distribution of effort among individual rivers is
highly skewed, with a small number of rivers accounting for a disproportionate share
of the national total. In the context of a random sample survey, this inevitably means
that lesser used fisheries attract relatively few respondents, and are thus only weakly
characterised by the responses.
Two strategies appear to be available for increasing the number of assessments
available for analysis. First, as noted above, allowing respondents to assess rivers
outside their home region would incrementally increase the response rate for all rivers
in the country, particularly where neighbouring regions (such as Central South Island
and Otago) sustain high levels of cross-boundary fishing (Unwin 2009, Unwin &
Image 2003). The second and almost certainly most effective option would be increase
the sample size. This is feasible but would have significant cost implications, and
would require careful consideration of the benefits to be gained (i.e., number of river
fisheries above the minimum response threshold) vs. the increase in interview costs.
For example, assuming that doubling the sample size in the two Pilot Survey regions
would double the number of responses for each river, the number of rivers with more
than ten responses would increase from 55 to 95, i.e., by almost a factor of two.
Implementing the survey at a national level would add significantly to the data
resources available to FGNZ managers, and would also complement the more
quantitative data generated by the 2007/08 National Angling Survey. Two immediate
benefits would be compilation of a robust and up to date database on river fisheries
throughout New Zealand, and a resource from which to draw on as necessary for more
detailed information on specific river fisheries. Within the Otago region, this has
already been used to supplement FGNZ’s application to include the Nevis River in the
Kawarau River Conservation Order.
4.5. Data analysis
The data generated by the survey data is straightforward to analyse, and considerable
insight can be gained just by tabulating responses for individual rivers and comparing
mean attribute scores. As noted in Section 4.4 this has already proved beneficial in
relation to the Nevis River, where the survey data clearly establish that – within the
two Pilot Survey regions – the Nevis River scores unusually highly for the expectation
of catching a large fish.
A strong secondary application of the survey data, as indicated in Section 3.4, is to
identify and classify different types of river fisheries in a much more robust and
objective way than has been previously possible (Teirney et al. 1982, Unwin & Brown
1998). The Pilot Survey results are highly encouraging in that they tend to support the

Attributes characterising river fisheries managed by Fish & Game New Zealand: a pilot survey of the Otago and Nelson/Marlborough regions 27
concept of a well-defined spectrum spanning the transition from lowland fisheries to
back country fisheries to headwater fisheries (c.f. Unwin & Brown 1998), but also hint
at other classification metrics which are difficult to elucidate with the limited data
available. For example, it is possible that a national data set would provide more
evidence of distinct regional differences, in contrast to the two Pilot Survey regions
which both appear to offer a similar range of angling opportunities.
4.6. Recommendations
Should FGNZ wish to implement the survey at a national level, the following
recommendations should be considered:
• the eight attributes used in the Pilot Survey should be retained;
• local FGNZ staff should review all interview data to identify rivers which may
have been incorrectly recorded by interviewers unfamiliar the corresponding
FGNZ region;
• sample selection should be based on simple random sampling of adult licence
holders in each region. Sample stratification based on known anglers from the
2007/08 National Angling Survey appears to offer no significant gains in
efficiency;
• sample sizes for each FGNZ region should be chosen so as to maximise the
number of rivers for which at least ten responses are available for comparison
of attributes, within the available resources;
• respondents should be invited to assess rivers outside their home region;
5. Acknowledgements
I thank Maurice Rodway (FGNZ, Southland) for coordinating the survey and project
management; Neil Deans and Niall Watson for their assistance in Nelson/Marlborough
and Otago, respectively; and Pamela Parker, Amanda Watt, and staff at the Southland
Institute of Technology for managing the telephone calls. Maurice Rodway, Neil
Deans, and Doug Booker constructively reviewed a draft of this report.
6. References
Anon. (1956). Catchments of New Zealand. Soil Conservation and Rivers Control
Kilroy, C. (2004). A new alien diatom, Didymosphenia geminata (Lyngbye)
Schmidt: its biology, distribution, effects and potential risks for New Zealand fresh
waters. NIWA Client Report CHC2004-128. 34 p.

Attributes characterising river fisheries managed by Fish & Game New Zealand: a pilot survey of the Otago and Nelson/Marlborough regions 28
Kilroy, C.; Snelder, T.; Sykes, J.R. (2005). Likely environments in which the non-
indigenous freshwater diatom, Didymosphenia geminata, can survive, in New
Zealand. NIWA Client Report CHC2005-043. 36 p.
Teirney, L.D.; Richardson, J. (1992). Attributes that characterize angling rivers of
importance in New Zealand, based on angler use and perceptions. North American
Journal of Fisheries Management 12: 693-702.
Teirney, L.D.; Unwin, M.J.; Rowe, D.K.; McDowall, R.M.; Graynoth, E. (1982).
Submission on the draft inventory of wild and scenic rivers of national importance.
Fisheries Environmental Report 28. 122 p.
Unwin, M.J. (2009). Angler usage of lake and river fisheries managed by Fish &
Game New Zealand: results from the 2007/08 National Angling Survey. NIWA
Client Report CHC2009-046. 48 p.
Unwin, M.J.; Brown, S. (1998). The geography of freshwater angling in New Zealand:
A summary of results from the 1994/96 National Angling Survey. NIWA Client
Report CHC98/33. 78 p.
Unwin, M.J.; Image, K. (2003). Angler usage of lake and river fisheries managed by
Fish & Game New Zealand: results from the 2001/02 National Angling Survey.
NIWA Client Report CHC2003-114. 48 p.
Zar, J.H. (1999). Biostatistical analysis. 4th edition. Prentice Hall, New Jersey.

Attributes characterising river fisheries managed by Fish & Game New Zealand: a pilot survey of the Otago and Nelson/Marlborough regions 29
Appendix 1. Mean attribute scores for all Nelson/Marlborough and Otago rivers fished by at least one respondent to the 2008 Pilot Survey. Within each region rivers are ordered by catchment (Anon. 1956), proceeding clockwise around the South Island from Farewell Spit.
River (section) Tot
al
resp
onse
s
Impo
rtan
ce
Clo
se to
hom
e
Clo
se to
ho
liday
Eas
e of
ac
cess
Are
a fis
habl
e
Sce
nic
beau
ty
Wild
erne
ss
char
acte
r
Ant
icip
ated
ca
tch
rate
Ant
icip
ate
larg
e fis
h
Nelson/Marlborough Region
Aorere River 13 3.31 0.38 0.38 0.42 0.33 0.56 0.48 0.17 0.12
Takaka River (reach unspecified) 17 2.88 0.12 0.53 0.82 0.18 0.59 0.18 0.29 0.06
Takaka River (above Lindsay's Bridge; upper) 2 2.50 0.00 0.50 1.00 0.00 0.50 0.00 0.00 0.00
Takaka River (below Lindsay's Bridge; lower) 3 3.33 0.53 0.00 0.53 0.53 0.53 0.00 0.33 0.53
Waikoropupu River 2 3.00 0.88 0.00 0.38 0.00 0.38 0.00 0.00 0.88
Anatoki River 3 3.67 0.25 0.33 0.33 0.33 0.58 0.25 0.00 0.25
Waingaro River 3 3.67 0.20 0.00 0.20 0.20 0.53 0.67 0.00 0.87
Cobb River 12 3.50 0.17 0.17 0.25 0.25 0.67 0.50 0.42 0.08
Riwaka River 20 2.85 0.69 0.15 0.55 0.20 0.49 0.20 0.14 0.09
Riwaka River South Branch 3 1.67 0.67 0.33 0.67 0.33 0.00 0.00 0.00 0.00
Motueka River (reach unspecified) 9 2.78 0.56 0.00 0.67 0.44 0.33 0.00 0.22 0.11
Motueka River (above Wangapeka; upper) 39 3.33 0.65 0.10 0.70 0.57 0.32 0.10 0.35 0.09
Motueka River (below Wangapeka; lower) 100 3.36 0.65 0.11 0.63 0.47 0.37 0.16 0.36 0.08
Pearse River 6 2.67 0.50 0.17 0.33 0.17 0.00 0.00 0.00 0.17
Dove River 1 1.00
Baton River 13 3.23 0.62 0.00 0.62 0.31 0.69 0.15 0.23 0.15
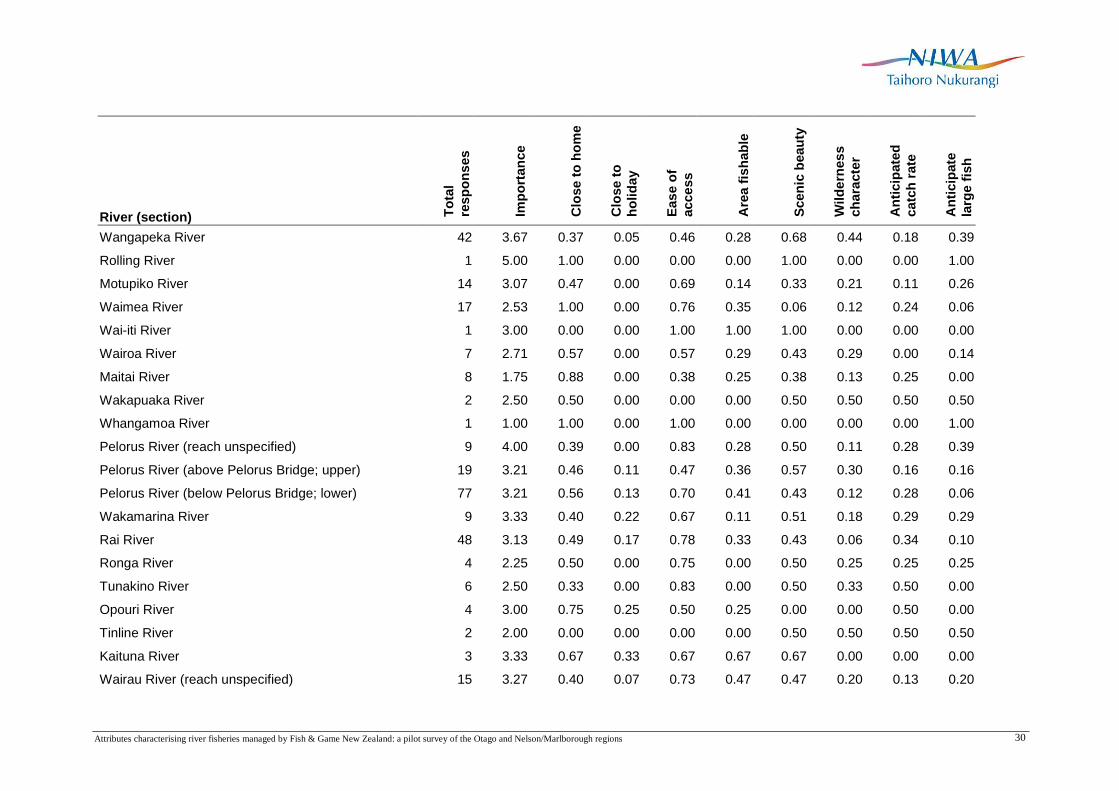
Attributes characterising river fisheries managed by Fish & Game New Zealand: a pilot survey of the Otago and Nelson/Marlborough regions 30
River (section) Tot
al
resp
onse
s
Impo
rtan
ce
Clo
se to
hom
e
Clo
se to
ho
liday
Eas
e of
ac
cess
Are
a fis
habl
e
Sce
nic
beau
ty
Wild
erne
ss
char
acte
r
Ant
icip
ated
ca
tch
rate
Ant
icip
ate
larg
e fis
h
Wangapeka River 42 3.67 0.37 0.05 0.46 0.28 0.68 0.44 0.18 0.39
Rolling River 1 5.00 1.00 0.00 0.00 0.00 1.00 0.00 0.00 1.00
Motupiko River 14 3.07 0.47 0.00 0.69 0.14 0.33 0.21 0.11 0.26
Waimea River 17 2.53 1.00 0.00 0.76 0.35 0.06 0.12 0.24 0.06
Wai-iti River 1 3.00 0.00 0.00 1.00 1.00 1.00 0.00 0.00 0.00
Wairoa River 7 2.71 0.57 0.00 0.57 0.29 0.43 0.29 0.00 0.14
Maitai River 8 1.75 0.88 0.00 0.38 0.25 0.38 0.13 0.25 0.00
Wakapuaka River 2 2.50 0.50 0.00 0.00 0.00 0.50 0.50 0.50 0.50
Whangamoa River 1 1.00 1.00 0.00 1.00 0.00 0.00 0.00 0.00 1.00
Pelorus River (reach unspecified) 9 4.00 0.39 0.00 0.83 0.28 0.50 0.11 0.28 0.39
Pelorus River (above Pelorus Bridge; upper) 19 3.21 0.46 0.11 0.47 0.36 0.57 0.30 0.16 0.16
Pelorus River (below Pelorus Bridge; lower) 77 3.21 0.56 0.13 0.70 0.41 0.43 0.12 0.28 0.06
Wakamarina River 9 3.33 0.40 0.22 0.67 0.11 0.51 0.18 0.29 0.29
Rai River 48 3.13 0.49 0.17 0.78 0.33 0.43 0.06 0.34 0.10
Ronga River 4 2.25 0.50 0.00 0.75 0.00 0.50 0.25 0.25 0.25
Tunakino River 6 2.50 0.33 0.00 0.83 0.00 0.50 0.33 0.50 0.00
Opouri River 4 3.00 0.75 0.25 0.50 0.25 0.00 0.00 0.50 0.00
Tinline River 2 2.00 0.00 0.00 0.00 0.00 0.50 0.50 0.50 0.50
Kaituna River 3 3.33 0.67 0.33 0.67 0.67 0.67 0.00 0.00 0.00
Wairau River (reach unspecified) 15 3.27 0.40 0.07 0.73 0.47 0.47 0.20 0.13 0.20

Attributes characterising river fisheries managed by Fish & Game New Zealand: a pilot survey of the Otago and Nelson/Marlborough regions 31
River (section) Tot
al
resp
onse
s
Impo
rtan
ce
Clo
se to
hom
e
Clo
se to
ho
liday
Eas
e of
ac
cess
Are
a fis
habl
e
Sce
nic
beau
ty
Wild
erne
ss
char
acte
r
Ant
icip
ated
ca
tch
rate
Ant
icip
ate
larg
e fis
h
Wairau River (above Wash Bridge; upper) 51 3.69 0.38 0.11 0.61 0.54 0.45 0.27 0.23 0.34
Wairau River (below Wash Bridge; lower) 115 3.62 0.78 0.07 0.67 0.59 0.27 0.14 0.31 0.14
Roses Overflow 2 3.50 1.00 0.00 1.00 0.00 0.50 0.50 0.00 0.00
Wairau Diversion 10 3.10 0.55 0.00 0.65 0.45 0.50 0.00 0.35 0.20
Opawa River 13 3.23 0.92 0.00 0.54 0.31 0.31 0.08 0.15 0.46
Taylor River 6 2.83 0.67 0.17 0.83 0.17 0.17 0.17 0.00 0.17
Omaka River 1 4.00 1.00 0.00 1.00 0.00 0.00 0.00 0.00 1.00
Spring Creek 22 3.09 0.45 0.14 0.36 0.09 0.32 0.09 0.14 0.32
Tuamarina River 3 3.33 0.92 0.00 0.33 0.33 0.25 0.00 0.25 0.58
Waihopai River 3 2.00 0.33 0.00 0.67 0.00 0.00 0.33 0.00 0.00
Bartletts Creek 2 2.50 0.50 0.00 0.50 0.00 0.50 0.00 0.00 0.00
Timms Creek 3 2.33 0.33 0.00 0.67 0.00 0.67 0.33 0.00 0.00
Top Valley Stream 2 2.50 0.50 0.00 0.50 0.00 0.50 0.00 0.00 0.00
Goulter River 16 4.06 0.16 0.00 0.19 0.16 0.79 0.66 0.23 0.38
Branch River 9 3.33 0.29 0.11 0.62 0.29 0.51 0.40 0.11 0.33
Leatham River 12 3.00 0.30 0.00 0.61 0.28 0.55 0.36 0.00 0.40
Rainbow River 9 4.11 0.22 0.11 0.22 0.11 0.67 0.56 0.11 0.44
Awatere River 13 3.15 0.62 0.15 0.54 0.46 0.38 0.31 0.31 0.08
Clarence River (reach unspecified) 1 2.00 1.00 0.00 0.00 0.00 1.00 0.00 0.00 0.00
Clarence River (above Acheron; upper) 7 3.29 0.14 0.25 0.25 0.25 0.64 0.50 0.25 0.00

Attributes characterising river fisheries managed by Fish & Game New Zealand: a pilot survey of the Otago and Nelson/Marlborough regions 32
River (section) Tot
al
resp
onse
s
Impo
rtan
ce
Clo
se to
hom
e
Clo
se to
ho
liday
Eas
e of
ac
cess
Are
a fis
habl
e
Sce
nic
beau
ty
Wild
erne
ss
char
acte
r
Ant
icip
ated
ca
tch
rate
Ant
icip
ate
larg
e fis
h
Clarence River (below Acheron; lower) 10 3.00 0.70 0.00 0.28 0.25 0.45 0.48 0.35 0.10
Acheron River 6 3.33 0.17 0.17 0.00 0.46 0.63 0.79 0.00 0.13
Severn River 3 3.67 0.33 0.00 0.33 0.92 0.58 0.58 0.00 0.25
Alma River 2 3.50 0.50 0.00 0.50 0.50 0.50 0.00 1.00 0.00
Lyell Creek 2 4.50 0.50 0.00 0.50 0.50 0.50 0.00 0.50 0.50
Kahutara River 1 4.00 0.00 0.00 0.00 1.00 0.00 0.00 0.00 0.00
Buller River (reach unspecified) 5 3.60 0.20 0.00 0.80 0.00 0.60 0.00 0.60 0.20
Buller River (above Gowan; upper) 43 3.12 0.14 0.16 0.68 0.35 0.49 0.19 0.52 0.20
Buller River (Gowan to Lyell; middle) 23 3.22 0.43 0.22 0.70 0.35 0.43 0.17 0.26 0.17
Buller River (below Lyell; lower) 6 3.00 0.33 0.00 0.83 0.29 0.63 0.13 0.63 0.00
Deepdale River 1 3.00 0.00 0.00 0.00 0.00 1.00 1.00 0.00 1.00
Maruia River 15 3.60 0.20 0.13 0.40 0.72 0.52 0.20 0.32 0.25
Warwick River 1 2.00 0.00 0.00 0.00 0.00 1.00 0.00 0.00 0.00
Matiri River 7 2.57 0.29 0.14 0.57 0.43 0.43 0.29 0.43 0.00
Matakitaki River 19 3.84 0.32 0.11 0.47 0.51 0.51 0.16 0.20 0.30
Glenroy River 5 3.20 0.60 0.20 0.60 0.60 0.20 0.20 0.20 0.00
Mangles River 9 3.22 0.22 0.11 0.56 0.44 0.56 0.22 0.22 0.11
Tutaki River 8 3.25 0.25 0.13 0.88 0.38 0.25 0.00 0.50 0.25
Owen River 16 3.50 0.25 0.06 0.67 0.23 0.44 0.25 0.30 0.30
Gowan River 19 3.32 0.21 0.16 0.47 0.16 0.53 0.26 0.58 0.11

Attributes characterising river fisheries managed by Fish & Game New Zealand: a pilot survey of the Otago and Nelson/Marlborough regions 33
River (section) Tot
al
resp
onse
s
Impo
rtan
ce
Clo
se to
hom
e
Clo
se to
ho
liday
Eas
e of
ac
cess
Are
a fis
habl
e
Sce
nic
beau
ty
Wild
erne
ss
char
acte
r
Ant
icip
ated
ca
tch
rate
Ant
icip
ate
larg
e fis
h
Sabine River 15 4.00 0.20 0.00 0.27 0.25 0.72 0.58 0.27 0.52
D`Urville River 11 4.36 0.36 0.00 0.36 0.27 0.55 0.73 0.09 0.36
Hope River 2 1.50 0.00 0.00 1.00 0.00 0.00 0.00 0.00 0.00
Howard River 2 1.00 0.00 0.00 1.00 0.00 0.50 0.00 0.00 0.00
Speargrass Creek 1 4.00 0.00 0.00 1.00 0.00 0.00 0.00 0.00 1.00
Travers River 15 4.13 0.13 0.00 0.27 0.24 0.71 0.71 0.37 0.37
Anatori River 1 4.00 0.00 0.00 0.00 0.00 1.00 0.00 0.00 0.00
Paturau River 1 1.00 0.00 1.00 1.00 0.00 1.00 0.00 0.00 0.00

Attributes characterising river fisheries managed by Fish & Game New Zealand: a pilot survey of the Otago and Nelson/Marlborough regions 34
River (section) Tot
al
resp
onse
s
Impo
rtan
ce
Clo
se to
hom
e
Clo
se to
ho
liday
Eas
e of
ac
cess
Are
a fis
habl
e
Sce
nic
beau
ty
Wild
erne
ss
char
acte
r
Ant
icip
ated
ca
tch
rate
Ant
icip
ate
larg
e fis
h
Otago Region
Shag River 11 2.70 0.64 0.09 0.45 0.09 0.45 0.00 0.27 0.45
Waikouaiti River 6 2.67 0.58 0.00 0.75 0.42 0.42 0.08 0.08 0.17
Waikouaiti River South Branch 1 5.00 1.00 0.00 1.00 0.00 0.00 0.00 0.00 1.00
Waitati River 5 3.80 0.40 0.00 0.60 0.20 0.20 0.20 0.60 0.60
Water of Leith 1 3.00 1.00 0.00 1.00 0.00 0.00 0.00 0.00 0.00
Taieri River (reach unspecified) 9 3.00 0.53 0.22 0.58 0.47 0.36 0.39 0.28 0.17
Taieri River (above Kokonga; upper) 40 3.48 0.55 0.29 0.59 0.53 0.22 0.19 0.42 0.17
Taieri River (Kokonga – Outram; middle) 30 3.50 0.77 0.00 0.73 0.53 0.23 0.16 0.43 0.13
Taieri River (below Outram; lower) 64 2.97 0.78 0.06 0.67 0.44 0.32 0.12 0.33 0.16
Waipori River 5 3.80 0.72 0.00 0.32 0.52 0.32 0.32 0.60 0.20
Contour Channel 1 2.00 1.00 0.00 1.00 0.00 0.00 0.00 0.00 0.00
Lee Stream 1 3.00 0.00 0.00 1.00 1.00 0.00 0.00 0.00 0.00
Deep Stream 6 2.67 0.33 0.17 0.79 0.29 0.46 0.63 0.17 0.17
Kye Burn 3 3.00 0.33 0.00 0.67 0.00 0.67 0.00 0.00 0.67
Logan Burn 5 3.00 0.20 0.32 0.72 0.72 0.20 0.32 0.32 0.00
Tokomairiro River 14 3.14 0.69 0.07 0.76 0.26 0.21 0.07 0.47 0.40
Clutha River (reach unspecified) 5 3.20 0.40 0.20 0.80 1.00 0.00 0.00 0.40 0.20
Clutha River (Wanaka - L. Dunstan; upper) 117 3.52 0.55 0.32 0.66 0.38 0.36 0.05 0.49 0.14
Clutha River (below Roxburgh; lower) 79 3.50 0.62 0.16 0.66 0.51 0.31 0.06 0.40 0.25
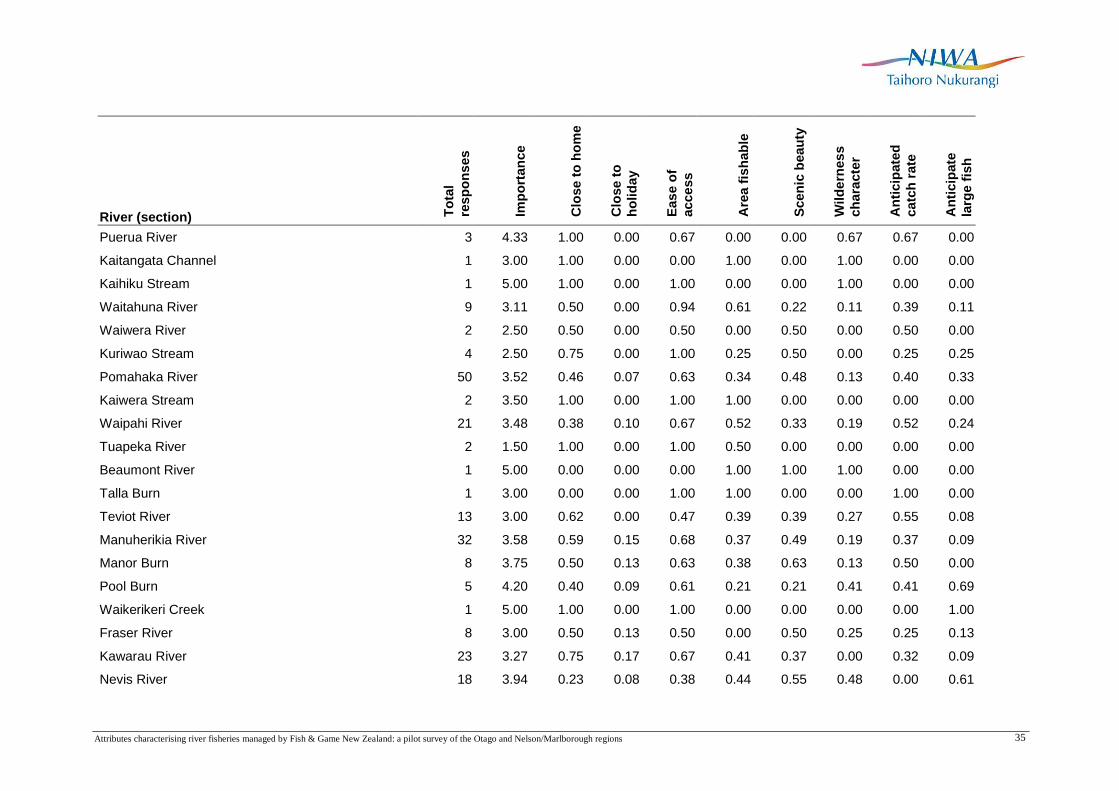
Attributes characterising river fisheries managed by Fish & Game New Zealand: a pilot survey of the Otago and Nelson/Marlborough regions 35
River (section) Tot
al
resp
onse
s
Impo
rtan
ce
Clo
se to
hom
e
Clo
se to
ho
liday
Eas
e of
ac
cess
Are
a fis
habl
e
Sce
nic
beau
ty
Wild
erne
ss
char
acte
r
Ant
icip
ated
ca
tch
rate
Ant
icip
ate
larg
e fis
h
Puerua River 3 4.33 1.00 0.00 0.67 0.00 0.00 0.67 0.67 0.00
Kaitangata Channel 1 3.00 1.00 0.00 0.00 1.00 0.00 1.00 0.00 0.00
Kaihiku Stream 1 5.00 1.00 0.00 1.00 0.00 0.00 1.00 0.00 0.00
Waitahuna River 9 3.11 0.50 0.00 0.94 0.61 0.22 0.11 0.39 0.11
Waiwera River 2 2.50 0.50 0.00 0.50 0.00 0.50 0.00 0.50 0.00
Kuriwao Stream 4 2.50 0.75 0.00 1.00 0.25 0.50 0.00 0.25 0.25
Pomahaka River 50 3.52 0.46 0.07 0.63 0.34 0.48 0.13 0.40 0.33
Kaiwera Stream 2 3.50 1.00 0.00 1.00 1.00 0.00 0.00 0.00 0.00
Waipahi River 21 3.48 0.38 0.10 0.67 0.52 0.33 0.19 0.52 0.24
Tuapeka River 2 1.50 1.00 0.00 1.00 0.50 0.00 0.00 0.00 0.00
Beaumont River 1 5.00 0.00 0.00 0.00 1.00 1.00 1.00 0.00 0.00
Talla Burn 1 3.00 0.00 0.00 1.00 1.00 0.00 0.00 1.00 0.00
Teviot River 13 3.00 0.62 0.00 0.47 0.39 0.39 0.27 0.55 0.08
Manuherikia River 32 3.58 0.59 0.15 0.68 0.37 0.49 0.19 0.37 0.09
Manor Burn 8 3.75 0.50 0.13 0.63 0.38 0.63 0.13 0.50 0.00
Pool Burn 5 4.20 0.40 0.09 0.61 0.21 0.21 0.41 0.41 0.69
Waikerikeri Creek 1 5.00 1.00 0.00 1.00 0.00 0.00 0.00 0.00 1.00
Fraser River 8 3.00 0.50 0.13 0.50 0.00 0.50 0.25 0.25 0.13
Kawarau River 23 3.27 0.75 0.17 0.67 0.41 0.37 0.00 0.32 0.09
Nevis River 18 3.94 0.23 0.08 0.38 0.44 0.55 0.48 0.00 0.61
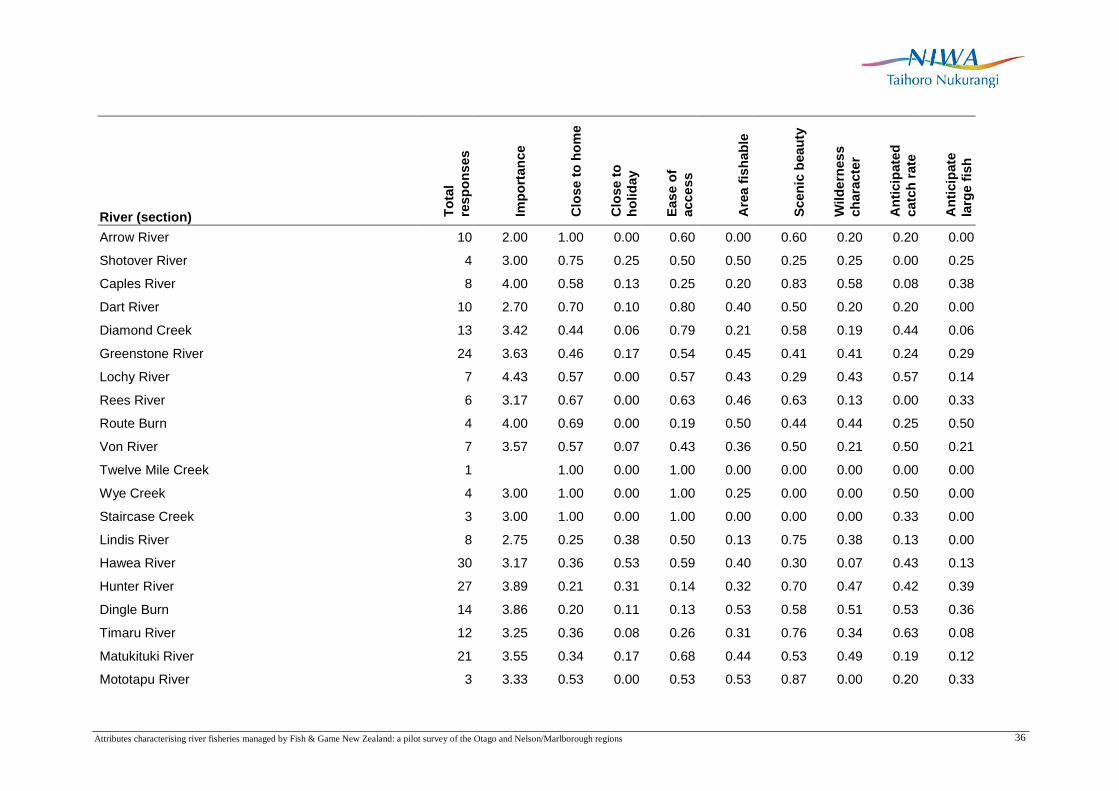
Attributes characterising river fisheries managed by Fish & Game New Zealand: a pilot survey of the Otago and Nelson/Marlborough regions 36
River (section) Tot
al
resp
onse
s
Impo
rtan
ce
Clo
se to
hom
e
Clo
se to
ho
liday
Eas
e of
ac
cess
Are
a fis
habl
e
Sce
nic
beau
ty
Wild
erne
ss
char
acte
r
Ant
icip
ated
ca
tch
rate
Ant
icip
ate
larg
e fis
h
Arrow River 10 2.00 1.00 0.00 0.60 0.00 0.60 0.20 0.20 0.00
Shotover River 4 3.00 0.75 0.25 0.50 0.50 0.25 0.25 0.00 0.25
Caples River 8 4.00 0.58 0.13 0.25 0.20 0.83 0.58 0.08 0.38
Dart River 10 2.70 0.70 0.10 0.80 0.40 0.50 0.20 0.20 0.00
Diamond Creek 13 3.42 0.44 0.06 0.79 0.21 0.58 0.19 0.44 0.06
Greenstone River 24 3.63 0.46 0.17 0.54 0.45 0.41 0.41 0.24 0.29
Lochy River 7 4.43 0.57 0.00 0.57 0.43 0.29 0.43 0.57 0.14
Rees River 6 3.17 0.67 0.00 0.63 0.46 0.63 0.13 0.00 0.33
Route Burn 4 4.00 0.69 0.00 0.19 0.50 0.44 0.44 0.25 0.50
Von River 7 3.57 0.57 0.07 0.43 0.36 0.50 0.21 0.50 0.21
Twelve Mile Creek 1 1.00 0.00 1.00 0.00 0.00 0.00 0.00 0.00
Wye Creek 4 3.00 1.00 0.00 1.00 0.25 0.00 0.00 0.50 0.00
Staircase Creek 3 3.00 1.00 0.00 1.00 0.00 0.00 0.00 0.33 0.00
Lindis River 8 2.75 0.25 0.38 0.50 0.13 0.75 0.38 0.13 0.00
Hawea River 30 3.17 0.36 0.53 0.59 0.40 0.30 0.07 0.43 0.13
Hunter River 27 3.89 0.21 0.31 0.14 0.32 0.70 0.47 0.42 0.39
Dingle Burn 14 3.86 0.20 0.11 0.13 0.53 0.58 0.51 0.53 0.36
Timaru River 12 3.25 0.36 0.08 0.26 0.31 0.76 0.34 0.63 0.08
Matukituki River 21 3.55 0.34 0.17 0.68 0.44 0.53 0.49 0.19 0.12
Mototapu River 3 3.33 0.53 0.00 0.53 0.53 0.87 0.00 0.20 0.33
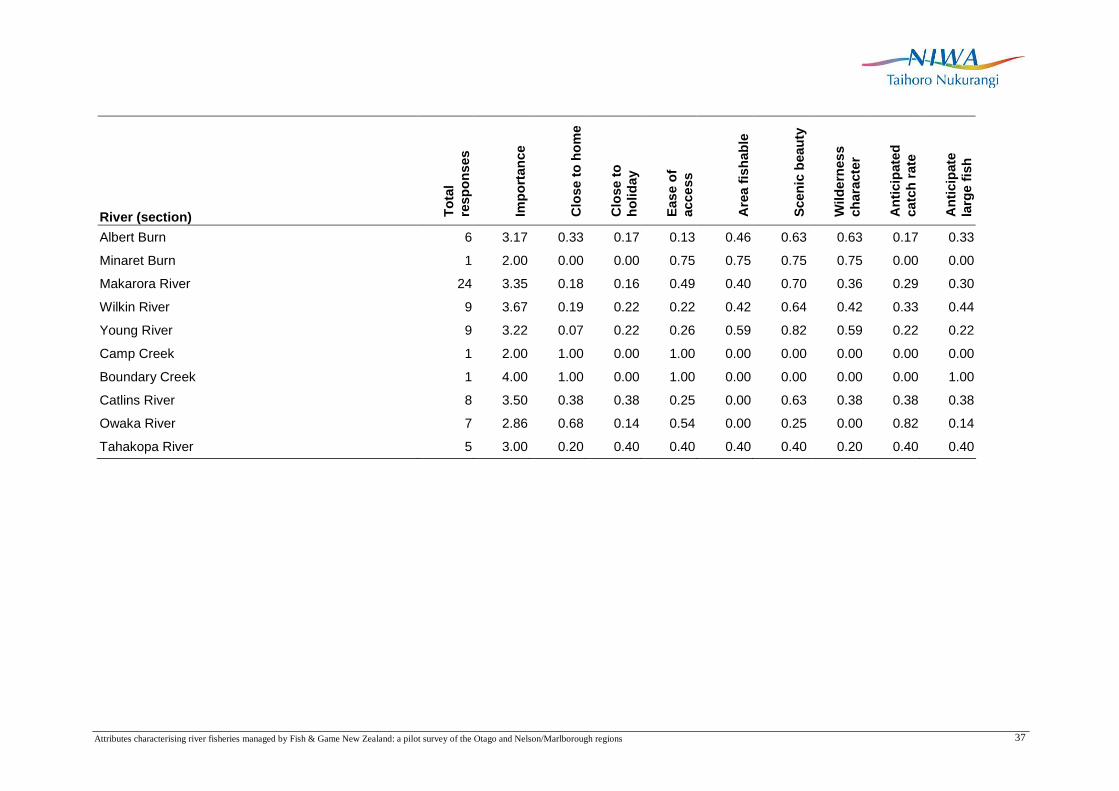
Attributes characterising river fisheries managed by Fish & Game New Zealand: a pilot survey of the Otago and Nelson/Marlborough regions 37
River (section) Tot
al
resp
onse
s
Impo
rtan
ce
Clo
se to
hom
e
Clo
se to
ho
liday
Eas
e of
ac
cess
Are
a fis
habl
e
Sce
nic
beau
ty
Wild
erne
ss
char
acte
r
Ant
icip
ated
ca
tch
rate
Ant
icip
ate
larg
e fis
h
Albert Burn 6 3.17 0.33 0.17 0.13 0.46 0.63 0.63 0.17 0.33
Minaret Burn 1 2.00 0.00 0.00 0.75 0.75 0.75 0.75 0.00 0.00
Makarora River 24 3.35 0.18 0.16 0.49 0.40 0.70 0.36 0.29 0.30
Wilkin River 9 3.67 0.19 0.22 0.22 0.42 0.64 0.42 0.33 0.44
Young River 9 3.22 0.07 0.22 0.26 0.59 0.82 0.59 0.22 0.22
Camp Creek 1 2.00 1.00 0.00 1.00 0.00 0.00 0.00 0.00 0.00
Boundary Creek 1 4.00 1.00 0.00 1.00 0.00 0.00 0.00 0.00 1.00
Catlins River 8 3.50 0.38 0.38 0.25 0.00 0.63 0.38 0.38 0.38
Owaka River 7 2.86 0.68 0.14 0.54 0.00 0.25 0.00 0.82 0.14
Tahakopa River 5 3.00 0.20 0.40 0.40 0.40 0.40 0.20 0.40 0.40