Embed Size (px)
Citation preview
© 2016 IHS. ALL RIGHTS RESERVED.
RATING GLOBAL CITIES’ ABILITY TO
ATTRACT AND SUPPORT HIGH
POTENTIAL WOMEN ENTREPRENEURS
MAY 2016
Karen A. Campbell, Sr. Consultant
+1 (215) 594-9503
Elizabeth Redman Cleveland, Sr. Consultant
+1 (510) 708-3056
Jim Diffley, Sr. Director
+1 (215) 789-7422
Brendan O’Neil, Director
+1 (202) 481-9239
Contents
© 2016 IHS. ALL RIGHTS RESERVED. 2
Dell WE Cities Research / May 2016
SEITIC LABOLG 52 GNIROCS :1 TRAP
1. Scoring Overview
2. Scoring Construction
3. Methodology Overview
4. Rating Results
(seitiC EW) xednI seitiC ruenerpertnE nemoW lleD eht neewteb noitalerroC :2 traP
Score and the Future Ready Economies (FRE) Score
1. FRE Score Overview
2. Theoretical Connection
3. Correlation of Scores and Rankings
4. Trends
xidneppA
secnerefeR rehtruF
© 2016 IHS. ALL RIGHTS RESERVED.
Part I:
Scoring 25 Global Cities
3
Dell WE Cities Research / May 2016
© 2016 IHS. ALL RIGHTS RESERVED.
Overview
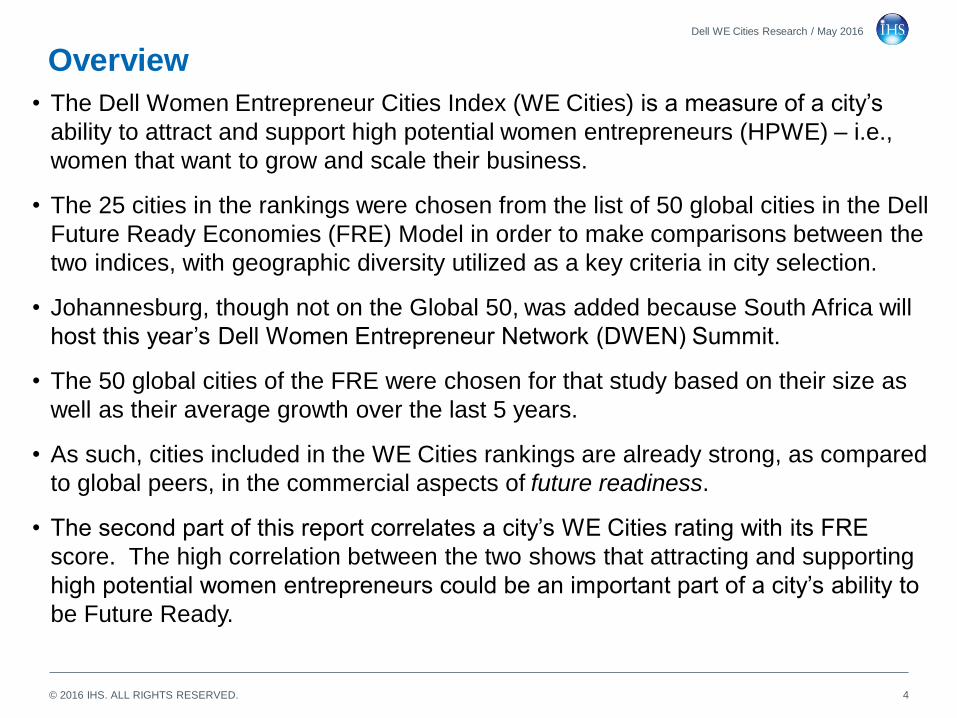
• The Dell Women Entrepreneur Cities Index (WE Cities) iss’yticafoerusaema
ability to attract and support high potential women entrepreneurs (HPWE) – i.e.,
women that want to grow and scale their business.
• The 25 cities in the rankings were chosen from the list of 50 global cities in the Dell
Future Ready Economies (FRE) Model in order to make comparisons between the
two indices, with geographic diversity utilized as a key criteria in city selection.
• Johannesburg, though not on the Global 50, was added because South Africa will
host.timmuS(NEWD)krowteNruenerpertnEnemoWlleDs’raeysiht
• The 50 global cities of the FRE were chosen for that study based on their size as
well as their average growth over the last 5 years.
• As such, cities included in the WE Cities rankings are already strong, as compared
to global peers, in the commercial aspects of future readiness.
• TheERFstihtiwgnitarseitiCEWs’yticasetalerroctropersihtfotrapdnoces
score. The high correlation between the two shows that attracting and supporting
highotytilibas’yticafotraptnatropminaebdluocsruenerpertnenemowlaitnetop
be Future Ready.
4
Dell WE Cities Research / May 2016
© 2016 IHS. ALL RIGHTS RESERVED.
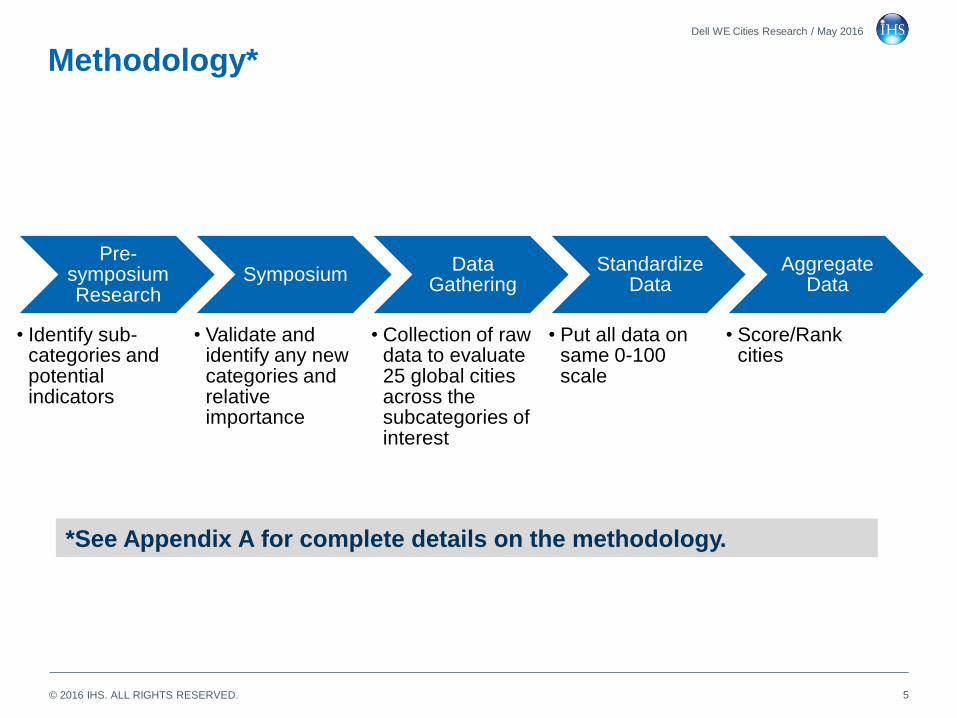
Methodology*
Pre-symposium Research
• Identify sub-categories and potential indicators
Symposium
• Validate and identify any new categories and relative importance
Data Gathering
• Collection of raw data to evaluate 25 global cities across the subcategories of interest
Standardize Data
• Put all data on same 0-100 scale
Aggregate Data
• Score/Rank cities
5
Dell WE Cities Research / May 2016
*See Appendix A for complete details on the methodology.
© 2016 IHS. ALL RIGHTS RESERVED.
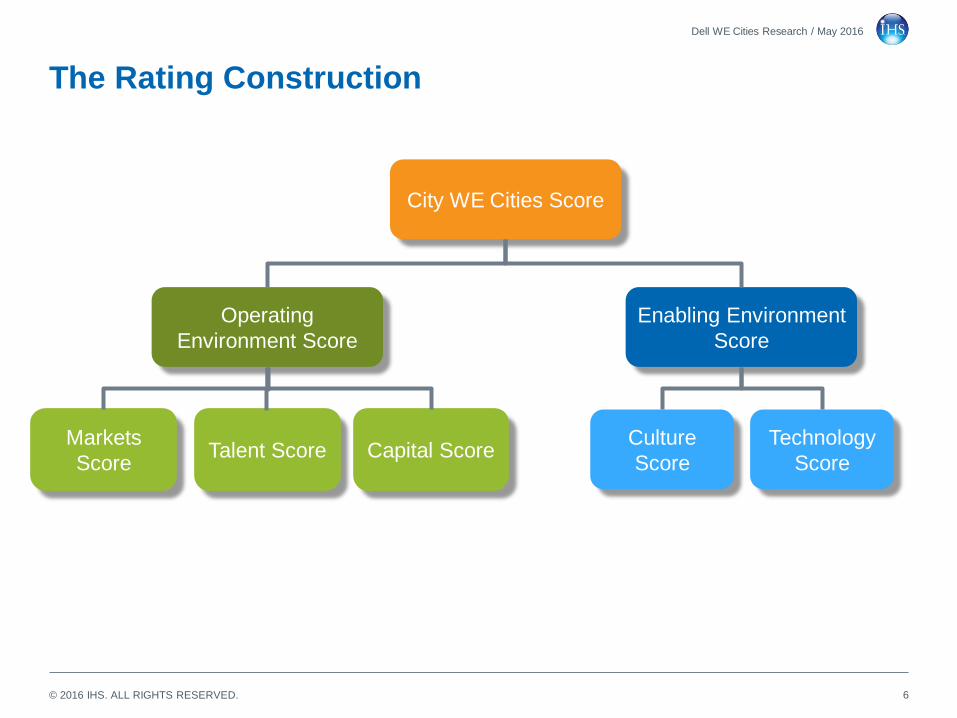
The Rating Construction
6
Dell WE Cities Research / May 2016
City WE Cities Score
Operating
Environment Score
Enabling Environment
Score
Markets
ScoreCapital ScoreTalent Score
Culture
Score
Technology
Score
© 2016 IHS. ALL RIGHTS RESERVED.
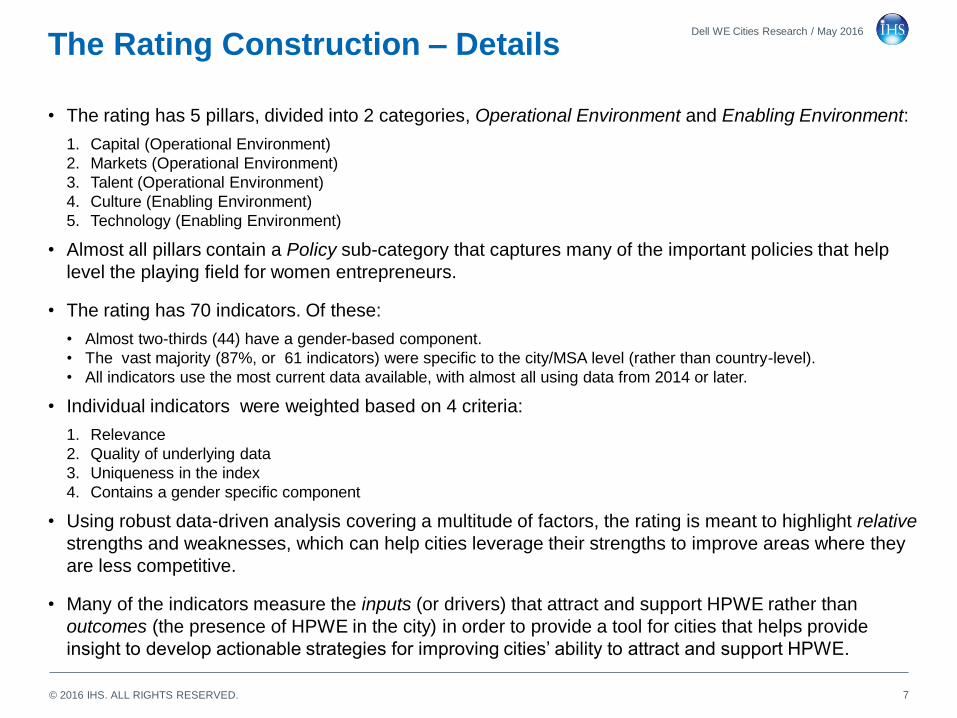
The Rating Construction – Details
7
Dell WE Cities Research / May 2016
• The rating has 5 pillars, divided into 2 categories, Operational Environment and Enabling Environment:
1. Capital (Operational Environment)
2. Markets (Operational Environment)
3. Talent (Operational Environment)
4. Culture (Enabling Environment)
5. Technology (Enabling Environment)
• Almost all pillars contain a Policy sub-category that captures many of the important policies that help
level the playing field for women entrepreneurs.
• The rating has 70 indicators. Of these:
• Almost two-thirds (44) have a gender-based component.
• The vast majority (87%, or 61 indicators) were specific to the city/MSA level (rather than country-level).
• All indicators use the most current data available, with almost all using data from 2014 or later.
• Individual indicators were weighted based on 4 criteria:
1. Relevance
2. Quality of underlying data
3. Uniqueness in the index
4. Contains a gender specific component
• Using robust data-driven analysis covering a multitude of factors, the rating is meant to highlight relative
strengths and weaknesses, which can help cities leverage their strengths to improve areas where they
are less competitive.
• Many of the indicators measure the inputs (or drivers) that attract and support HPWE rather than
outcomes (the presence of HPWE in the city) in order to provide a tool for cities that helps provide
insight.EWPHtroppusdnatcarttaotytiliba’seiticgnivorpmirofseigetartselbanoitcapolevedot
© 2016 IHS. ALL RIGHTS RESERVED.
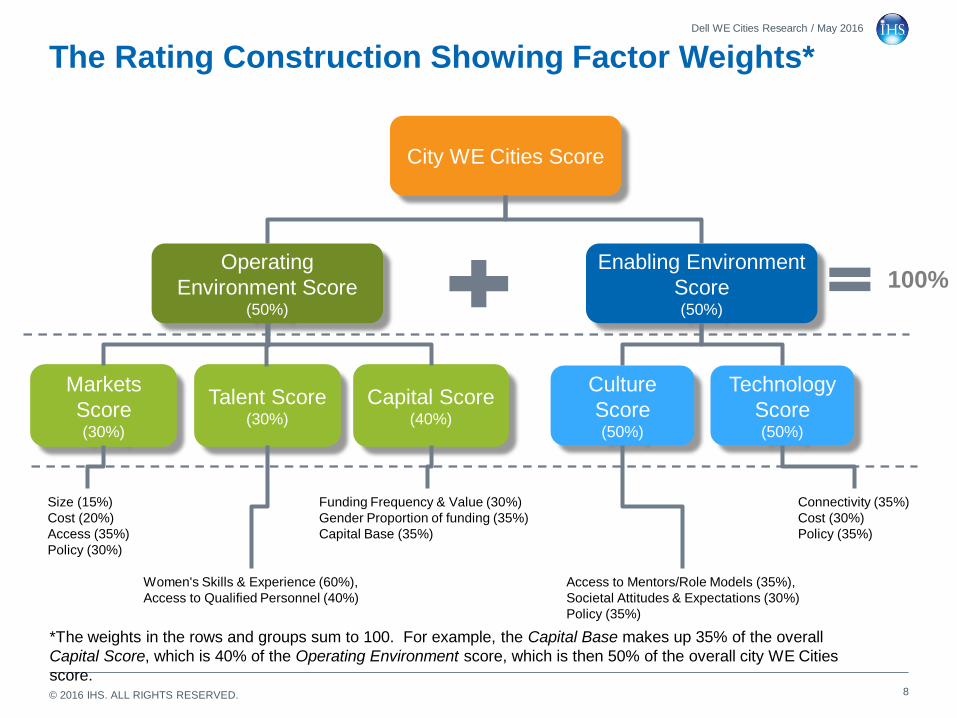
The Rating Construction Showing Factor Weights*
8
Dell WE Cities Research / May 2016
City WE Cities Score
Operating
Environment Score(50%)
Enabling Environment
Score(50%)
Markets
Score(30%)
Capital Score(40%)
Talent Score(30%)
Culture
Score(50%)
Technology
Score(50%)
Funding Frequency & Value (30%)
Gender Proportion of funding (35%)
Capital Base (35%)
Women's Skills & Experience (60%),
Access to Qualified Personnel (40%)
Size (15%)
Cost (20%)
Access (35%)
Policy (30%)
Access to Mentors/Role Models (35%),
Societal Attitudes & Expectations (30%)
Policy (35%)
Connectivity (35%)
Cost (30%)
Policy (35%)
100%
*The weights in the rows and groups sum to 100. For example, the Capital Base makes up 35% of the overall
Capital Score, which is 40% of the Operating Environment score, which is then 50% of the overall city WE Cities
score.
© 2016 IHS. ALL RIGHTS RESERVED.
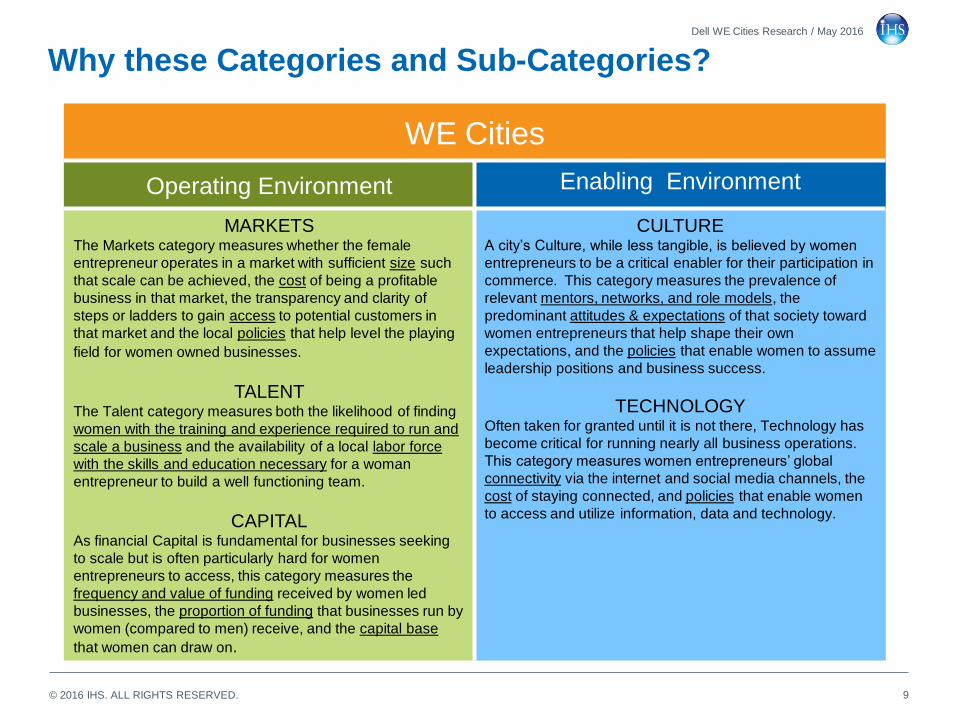
Why these Categories and Sub-Categories?
9
Dell WE Cities Research / May 2016
WE Cities
Operating Environment Enabling Environment
MARKETSThe Markets category measures whether the female
entrepreneur operates in a market with sufficient size such
that scale can be achieved, the cost of being a profitable
business in that market, the transparency and clarity of
steps or ladders to gain access to potential customers in
that market and the local policies that help level the playing
field for women owned businesses.
TALENTThe Talent category measures both the likelihood of finding
women with the training and experience required to run and
scale a business and the availability of a local labor force
with the skills and education necessary for a woman
entrepreneur to build a well functioning team.
CAPITALAs financial Capital is fundamental for businesses seeking
to scale but is often particularly hard for women
entrepreneurs to access, this category measures the
frequency and value of funding received by women led
businesses, the proportion of funding that businesses run by
women (compared to men) receive, and the capital base
that women can draw on.
CULTUREAnemowybdeveilebsi,elbignatsselelihw,erutluCs’ytic
entrepreneurs to be a critical enabler for their participation in
commerce. This category measures the prevalence of
relevant mentors, networks, and role models, the
predominant attitudes & expectations of that society toward
women entrepreneurs that help shape their own
expectations, and the policies that enable women to assume
leadership positions and business success.
TECHNOLOGYOften taken for granted until it is not there, Technology has
become critical for running nearly all business operations.
Thislabolg’sruenerpertnenemowserusaemyrogetac
connectivity via the internet and social media channels, the
cost of staying connected, and policies that enable women
to access and utilize information, data and technology.
© 2016 IHS. ALL RIGHTS RESERVED.
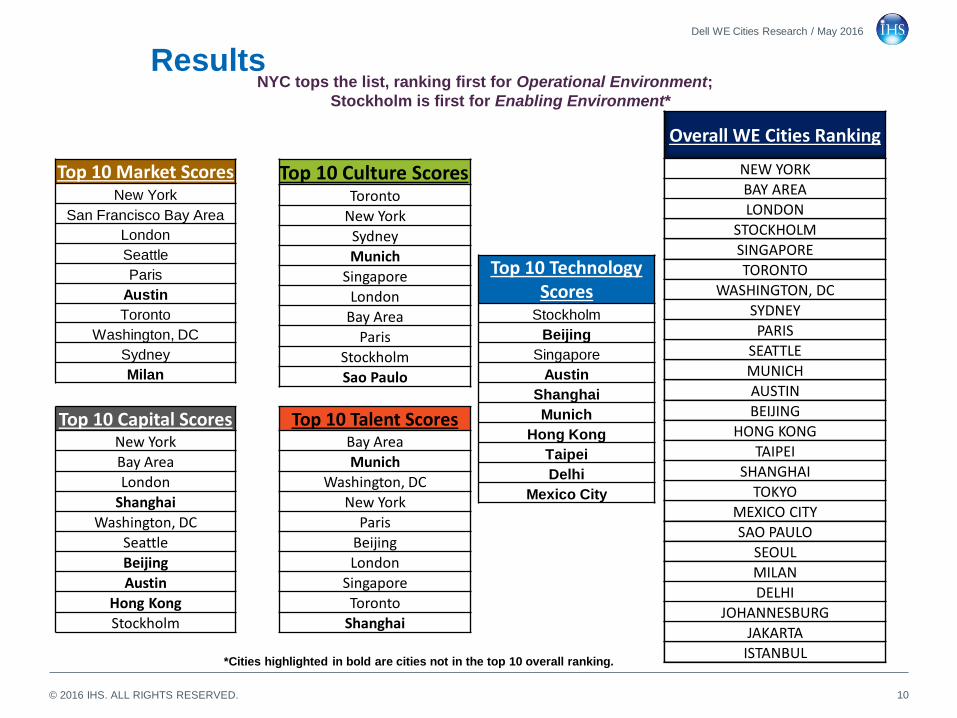
ResultsNYC tops the list, ranking first for Operational Environment;
Stockholm is first for Enabling Environment*
10
Dell WE Cities Research / May 2016
Top 10 Market ScoresNew York
San Francisco Bay Area
London
Seattle
Paris
Austin
Toronto
Washington, DC
Sydney
Milan
Top 10 Talent ScoresBay Area
Munich
Washington, DC
New York
Paris
Beijing
London
Singapore
Toronto
Shanghai
Top 10 Capital ScoresNew York
Bay Area
London
Shanghai
Washington, DC
Seattle
Beijing
Austin
Hong Kong
Stockholm
Top 10 Culture ScoresToronto
New York
Sydney
Munich
Singapore
London
Bay Area
Paris
Stockholm
Sao Paulo
Top 10 Technology Scores
Stockholm
Beijing
Singapore
Austin
Shanghai
Munich
Hong Kong
Taipei
Delhi
Mexico City
Overall WE Cities Ranking
NEW YORK
BAY AREA
LONDON
STOCKHOLM
SINGAPORE
TORONTO
WASHINGTON, DC
SYDNEY
PARIS
SEATTLE
MUNICH
AUSTIN
BEIJING
HONG KONG
TAIPEI
SHANGHAI
TOKYO
MEXICO CITY
SAO PAULO
SEOUL
MILAN
DELHI
JOHANNESBURG
JAKARTA
ISTANBUL*Cities highlighted in bold are cities not in the top 10 overall ranking.
© 2016 IHS. ALL RIGHTS RESERVED.
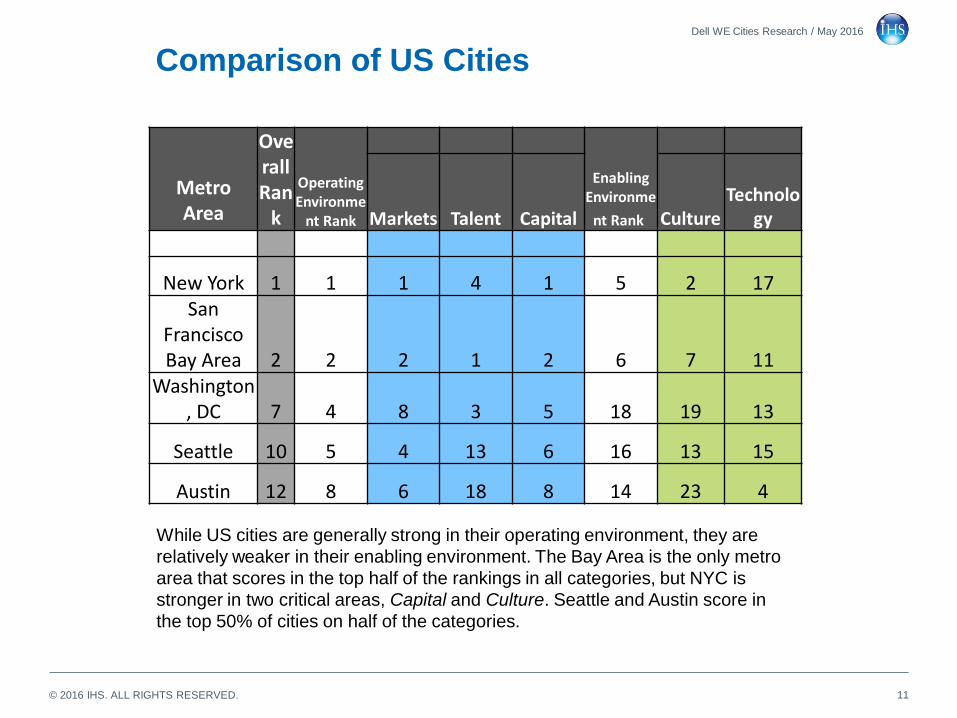
Comparison of US Cities
11
Dell WE Cities Research / May 2016
Metro Area
OverallRan
k
Operating Environme
nt Rank
Enabling Environme
nt RankMarkets Talent Capital CultureTechnolo
gy
New York 1 1 1 4 1 5 2 17San
Francisco Bay Area 2 2 2 1 2 6 7 11
Washington, DC 7 4 8 3 5 18 19 13
Seattle 10 5 4 13 6 16 13 15
Austin 12 8 6 18 8 14 23 4
While US cities are generally strong in their operating environment, they are
relatively weaker in their enabling environment. The Bay Area is the only metro
area that scores in the top half of the rankings in all categories, but NYC is
stronger in two critical areas, Capital and Culture. Seattle and Austin score in
the top 50% of cities on half of the categories.
© 2016 IHS. ALL RIGHTS RESERVED.
Highlights from the Rating
12
Dell WE Cities Research / May 2016
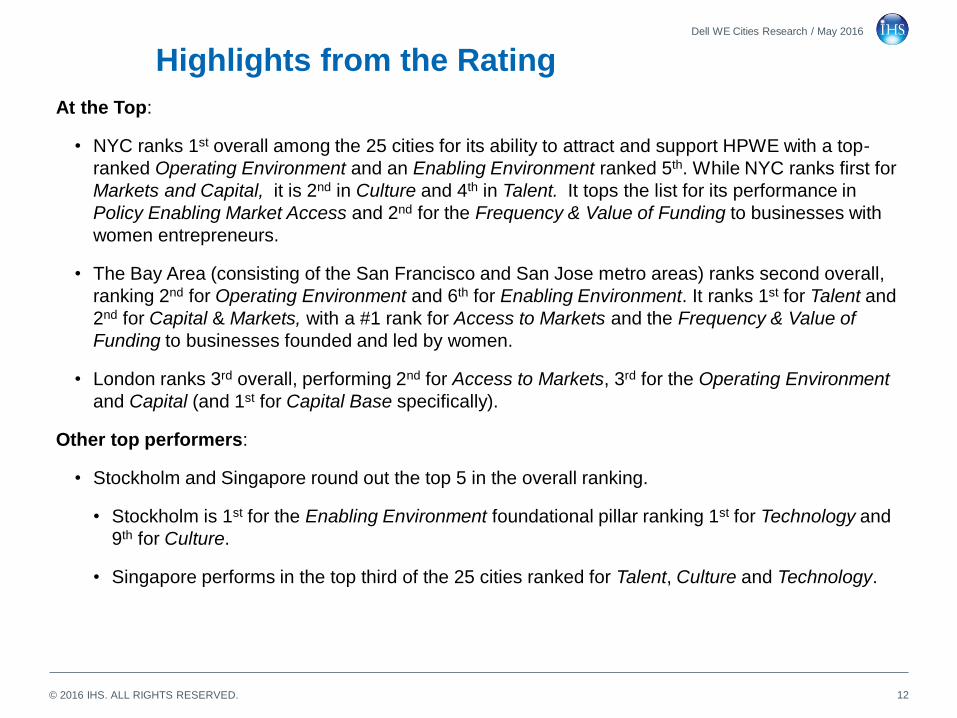
At the Top:
• NYC ranks 1st overall among the 25 cities for its ability to attract and support HPWE with a top-
ranked Operating Environment and an Enabling Environment ranked 5th. While NYC ranks first for
Markets and Capital, it is 2nd in Culture and 4th in Talent. It tops the list for its performance in
Policy Enabling Market Access and 2nd for the Frequency & Value of Funding to businesses with
women entrepreneurs.
• The Bay Area (consisting of the San Francisco and San Jose metro areas) ranks second overall,
ranking 2nd for Operating Environment and 6th for Enabling Environment. It ranks 1st for Talent and
2nd for Capital & Markets, with a #1 rank for Access to Markets and the Frequency & Value of
Funding to businesses founded and led by women.
• London ranks 3rd overall, performing 2nd for Access to Markets, 3rd for the Operating Environment
and Capital (and 1st for Capital Base specifically).
Other top performers:
• Stockholm and Singapore round out the top 5 in the overall ranking.
• Stockholm is 1st for the Enabling Environment foundational pillar ranking 1st for Technology and
9th for Culture.
• Singapore performs in the top third of the 25 cities ranked for Talent, Culture and Technology.
© 2016 IHS. ALL RIGHTS RESERVED.
Highlights from the Rating
13
Dell WE Cities Research / May 2016
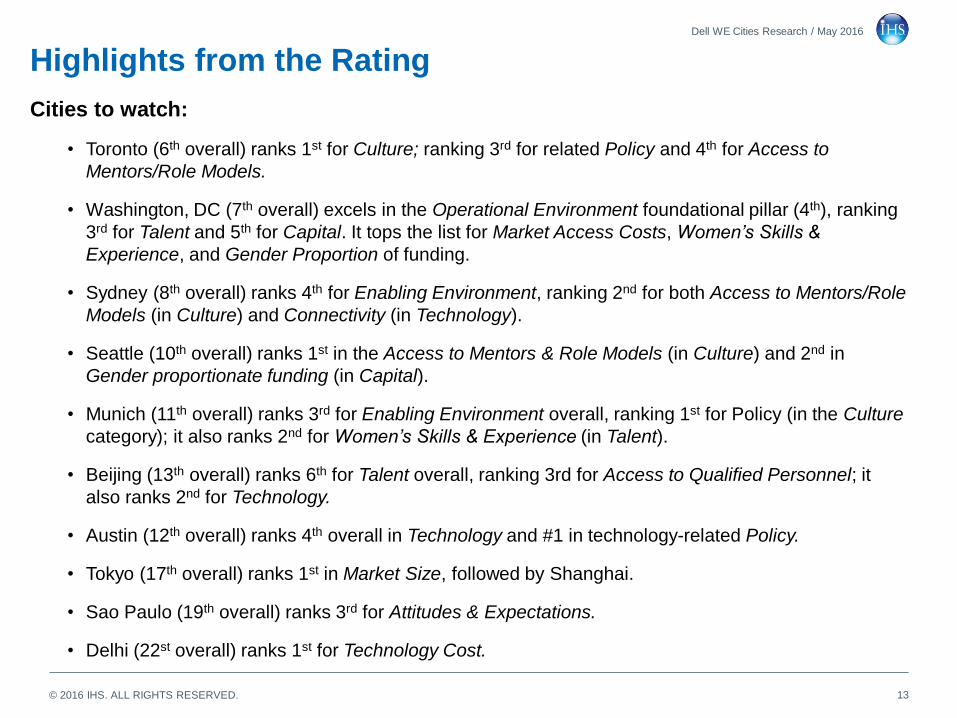
Cities to watch:
• Toronto (6th overall) ranks 1st for Culture; ranking 3rd for related Policy and 4th for Access to
Mentors/Role Models.
• Washington, DC (7th overall) excels in the Operational Environment foundational pillar (4th), ranking
3rd for Talent and 5th for Capital. It tops the list for Market Access Costs, Women’s Skills &
Experience, and Gender Proportion of funding.
• Sydney (8th overall) ranks 4th for Enabling Environment, ranking 2nd for both Access to Mentors/Role
Models (in Culture) and Connectivity (in Technology).
• Seattle (10th overall) ranks 1st in the Access to Mentors & Role Models (in Culture) and 2nd in
Gender proportionate funding (in Capital).
• Munich (11th overall) ranks 3rd for Enabling Environment overall, ranking 1st for Policy (in the Culture
category); it also ranks 2nd for Women’s Skills & Experience (in Talent).
• Beijing (13th overall) ranks 6th for Talent overall, ranking 3rd for Access to Qualified Personnel; it
also ranks 2nd for Technology.
• Austin (12th overall) ranks 4th overall in Technology and #1 in technology-related Policy.
• Tokyo (17th overall) ranks 1st in Market Size, followed by Shanghai.
• Sao Paulo (19th overall) ranks 3rd for Attitudes & Expectations.
• Delhi (22st overall) ranks 1st for Technology Cost.
© 2016 IHS. ALL RIGHTS RESERVED.
Highlights from the Rating
14
Dell WE Cities Research / May 2016
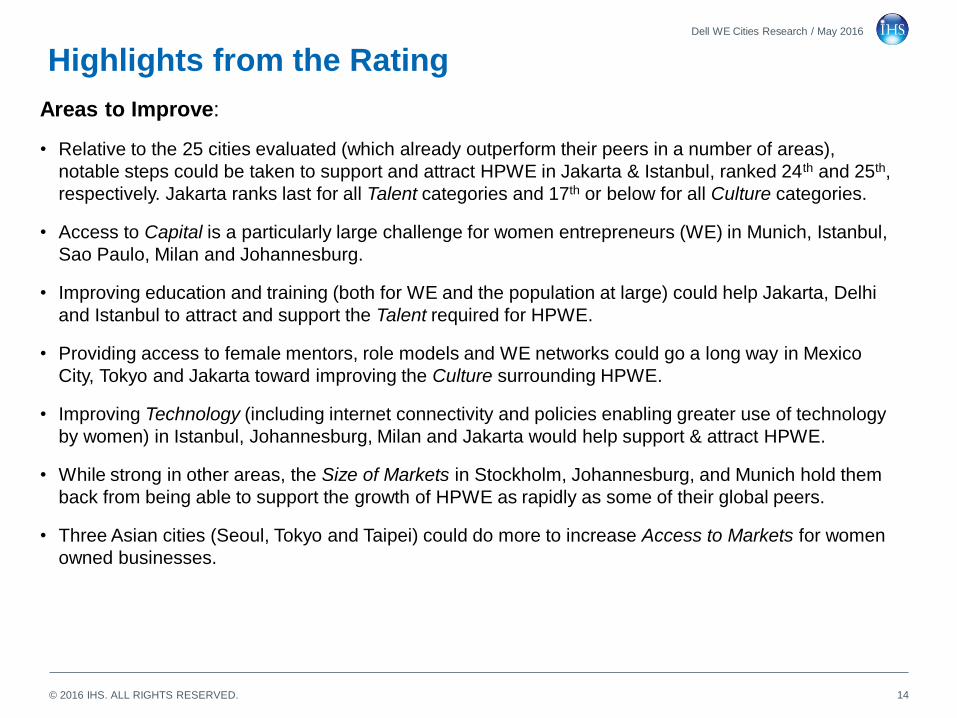
Areas to Improve:
• Relative to the 25 cities evaluated (which already outperform their peers in a number of areas),
notable steps could be taken to support and attract HPWE in Jakarta & Istanbul, ranked 24th and 25th,
respectively. Jakarta ranks last for all Talent categories and 17th or below for all Culture categories.
• Access to Capital is a particularly large challenge for women entrepreneurs (WE) in Munich, Istanbul,
Sao Paulo, Milan and Johannesburg.
• Improving education and training (both for WE and the population at large) could help Jakarta, Delhi
and Istanbul to attract and support the Talent required for HPWE.
• Providing access to female mentors, role models and WE networks could go a long way in Mexico
City, Tokyo and Jakarta toward improving the Culture surrounding HPWE.
• Improving Technology (including internet connectivity and policies enabling greater use of technology
by women) in Istanbul, Johannesburg, Milan and Jakarta would help support & attract HPWE.
• While strong in other areas, the Size of Markets in Stockholm, Johannesburg, and Munich hold them
back from being able to support the growth of HPWE as rapidly as some of their global peers.
• Three Asian cities (Seoul, Tokyo and Taipei) could do more to increase Access to Markets for women
owned businesses.
© 2016 IHS. ALL RIGHTS RESERVED.
Part II:
How a city’s ability to
attract and support High
potential women
entrepreneurs affects
‘future readiness’
15
Dell WE Cities Research / May 2016
© 2016 IHS. ALL RIGHTS RESERVED.
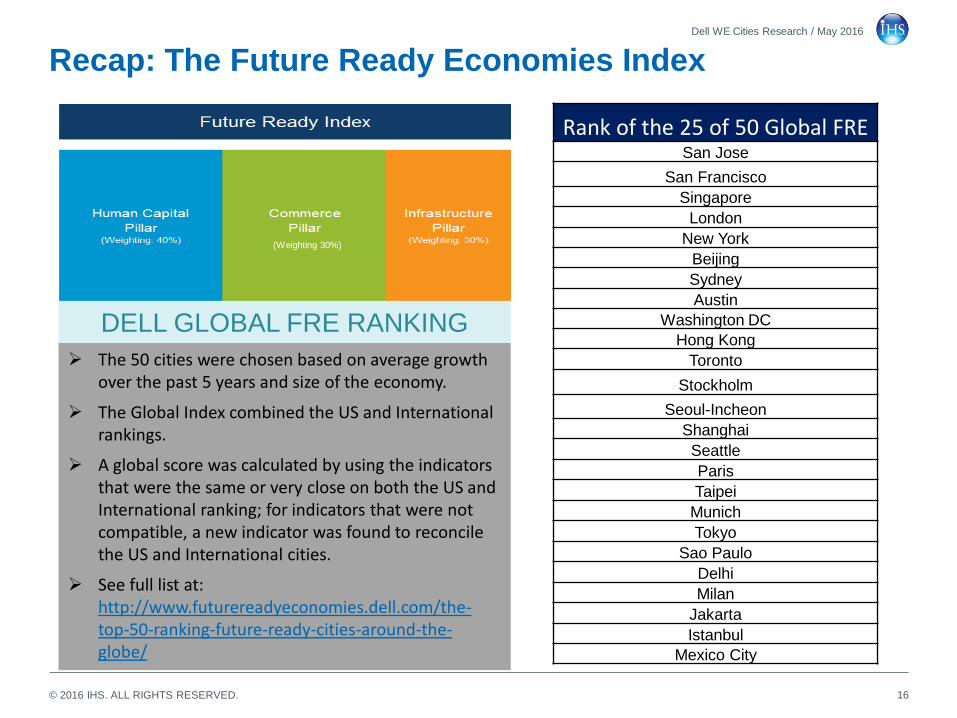
Recap: The Future Ready Economies Index
(Weighting 30%)
Rank of the 25 of 50 Global FRESan Jose
San Francisco
Singapore
London
New York
Beijing
Sydney
Austin
Washington DC
Hong Kong
Toronto
Stockholm
Seoul-Incheon
Shanghai
Seattle
Paris
Taipei
Munich
Tokyo
Sao Paulo
Delhi
Milan
Jakarta
Istanbul
Mexico City
The 50 cities were chosen based on average growth over the past 5 years and size of the economy.
The Global Index combined the US and International rankings.
A global score was calculated by using the indicators that were the same or very close on both the US and International ranking; for indicators that were not compatible, a new indicator was found to reconcile the US and International cities.
See full list at: http://www.futurereadyeconomies.dell.com/the-top-50-ranking-future-ready-cities-around-the-globe/
DELL GLOBAL FRE RANKING
Dell WE Cities Research / May 2016
16
© 2016 IHS. ALL RIGHTS RESERVED.
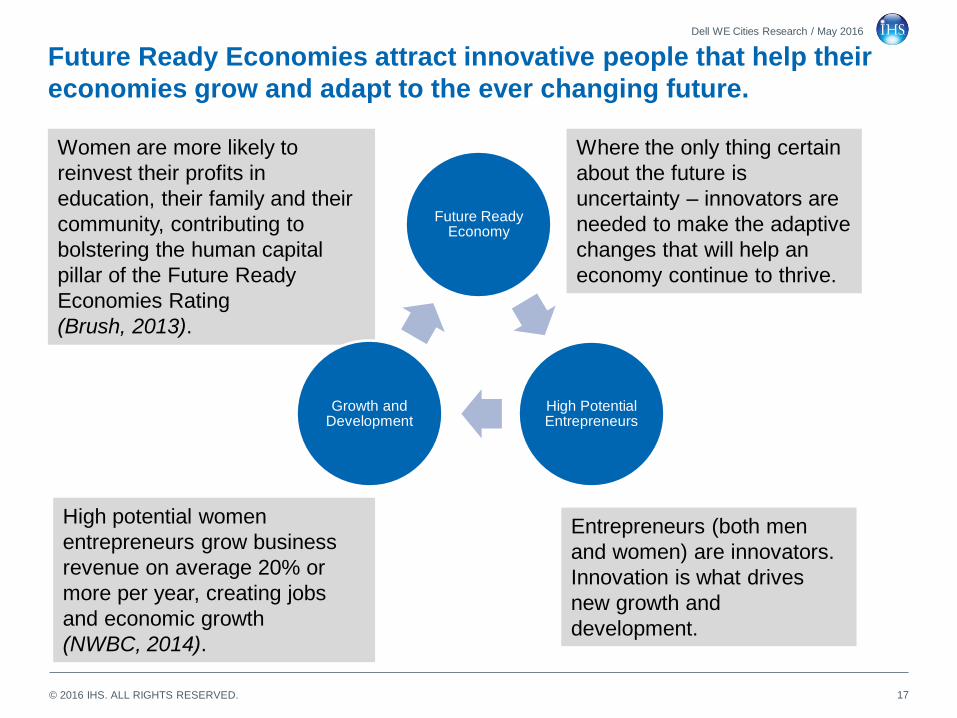
Entrepreneurs (both men
and women) are innovators.
Innovation is what drives
new growth and
development.
High potential women
entrepreneurs grow business
revenue on average 20% or
more per year, creating jobs
and economic growth
(NWBC, 2014).
Women are more likely to
reinvest their profits in
education, their family and their
community, contributing to
bolstering the human capital
pillar of the Future Ready
Economies Rating
(Brush, 2013).
Future Ready Economies attract innovative people that help their
economies grow and adapt to the ever changing future.
17
Dell WE Cities Research / May 2016
Future Ready Economy
High Potential Entrepreneurs
Growth and Development
Where the only thing certain
about the future is
uncertainty – innovators are
needed to make the adaptive
changes that will help an
economy continue to thrive.
© 2016 IHS. ALL RIGHTS RESERVED.
Future Ready Economies attract innovative people that help their
economies grow and adapt to the ever changing future.
18
Dell WE Cities Research / May 2016
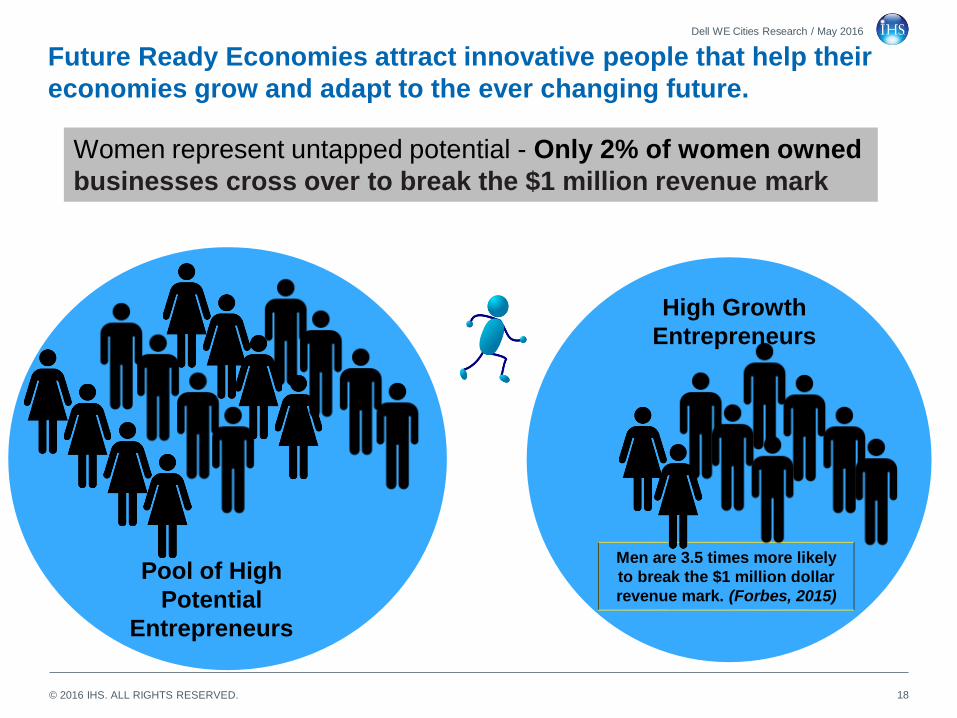
Women represent untapped potential - Only 2% of women owned
businesses cross over to break the $1 million revenue mark
Pool of High
Potential
Entrepreneurs
High Growth
Entrepreneurs
Men are 3.5 times more likely
to break the $1 million dollar
revenue mark. (Forbes, 2015)
© 2016 IHS. ALL RIGHTS RESERVED. 19
Dell WE Cities Research / May 2016
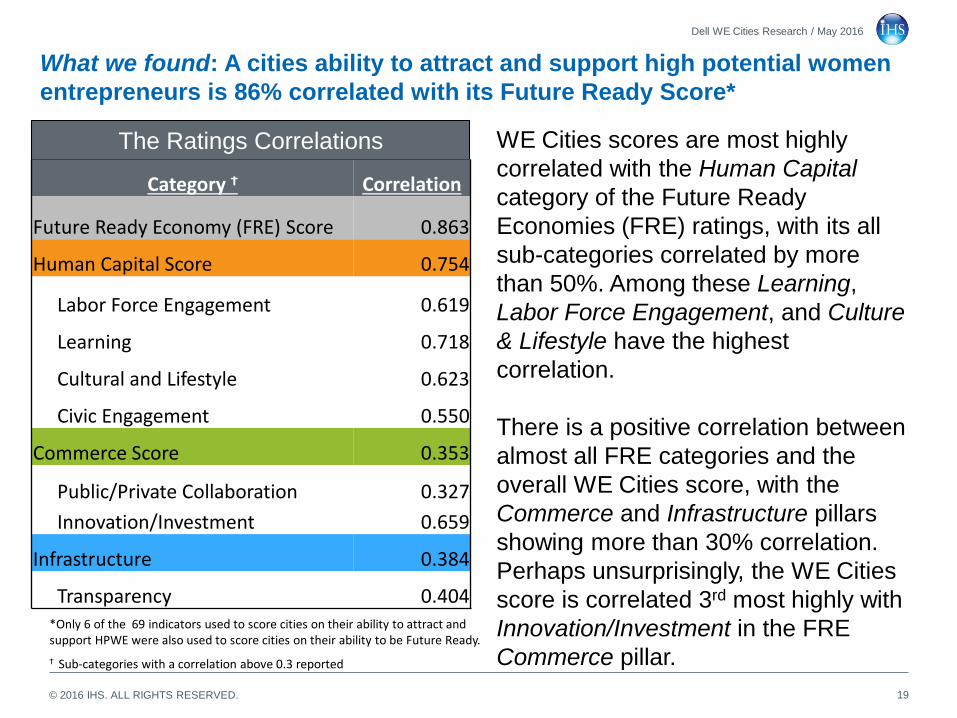
WE Cities scores are most highly
correlated with the Human Capital
category of the Future Ready
Economies (FRE) ratings, with its all
sub-categories correlated by more
than 50%. Among these Learning,
Labor Force Engagement, and Culture
& Lifestyle have the highest
correlation.
There is a positive correlation between
almost all FRE categories and the
overall WE Cities score, with the
Commerce and Infrastructure pillars
showing more than 30% correlation.
Perhaps unsurprisingly, the WE Cities
score is correlated 3rd most highly with
Innovation/Investment in the FRE
Commerce pillar.
.
What we found: A cities ability to attract and support high potential women
entrepreneurs is 86% correlated with its Future Ready Score*
The Ratings Correlations
Category Ϯ Correlation
Future Ready Economy (FRE) Score 0.863
Human Capital Score 0.754
Labor Force Engagement 0.619
Learning 0.718
Cultural and Lifestyle 0.623
Civic Engagement 0.550
Commerce Score 0.353
Public/Private Collaboration 0.327
Innovation/Investment 0.659
Infrastructure 0.384
Transparency 0.404*Only 6 of the 69 indicators used to score cities on their ability to attract and support HPWE were also used to score cities on their ability to be Future Ready.
Ϯ Sub-categories with a correlation above 0.3 reported
© 2016 IHS. ALL RIGHTS RESERVED.
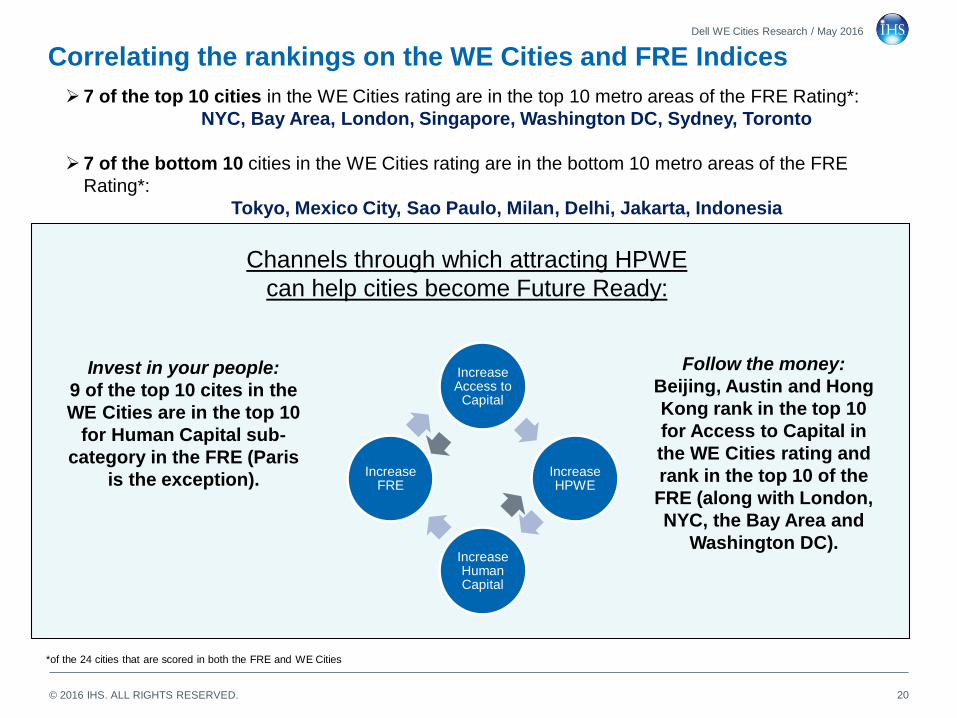
Correlating the rankings on the WE Cities and FRE Indices
20
Dell WE Cities Research / May 2016
7 of the top 10 cities in the WE Cities rating are in the top 10 metro areas of the FRE Rating*:
NYC, Bay Area, London, Singapore, Washington DC, Sydney, Toronto
7 of the bottom 10 cities in the WE Cities rating are in the bottom 10 metro areas of the FRE
Rating*:
Tokyo, Mexico City, Sao Paulo, Milan, Delhi, Jakarta, Indonesia
Increase Access to
Capital
Increase HPWE
Increase Human Capital
Increase FRE
Invest in your people:
9 of the top 10 cites in the
WE Cities are in the top 10
for Human Capital sub-
category in the FRE (Paris
is the exception).
Follow the money:
Beijing, Austin and Hong
Kong rank in the top 10
for Access to Capital in
the WE Cities rating and
rank in the top 10 of the
FRE (along with London,
NYC, the Bay Area and
Washington DC).
Channels through which attracting HPWE
can help cities become Future Ready:
*of the 24 cities that are scored in both the FRE and WE Cities
© 2016 IHS. ALL RIGHTS RESERVED.
Beijing
Delhi
Hong Kong
Istanbul
Jakarta
Washington, DC
London
Mexico City
Milan
Munich
New York
Paris
SF Bay Area
Sao Paulo
SeattleSeoul
Shanghai
Singapore
Stockholm
Sydney
Taipei
Tokyo
Toronto
Austin
WE Cities RatingRoom for
investment…
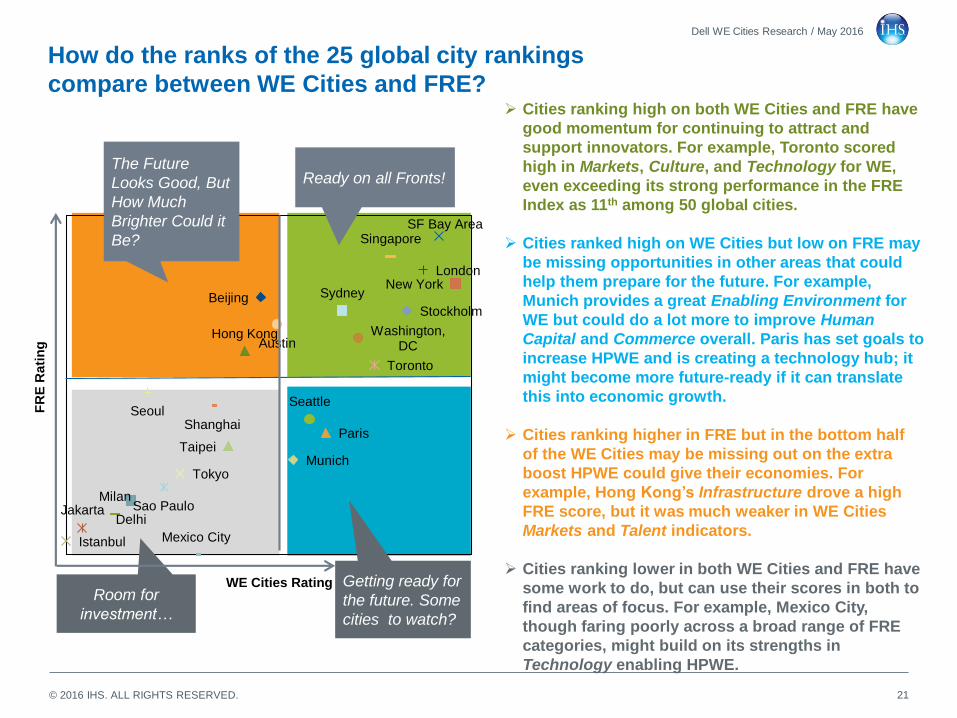
How do the ranks of the 25 global city rankings
compare between WE Cities and FRE?
21
Dell WE Cities Research / May 2016
Cities ranking high on both WE Cities and FRE have
good momentum for continuing to attract and
support innovators. For example, Toronto scored
high in Markets, Culture, and Technology for WE,
even exceeding its strong performance in the FRE
Index as 11th among 50 global cities.
Cities ranked high on WE Cities but low on FRE may
be missing opportunities in other areas that could
help them prepare for the future. For example,
Munich provides a great Enabling Environment for
WE but could do a lot more to improve Human
Capital and Commerce overall. Paris has set goals to
increase HPWE and is creating a technology hub; it
might become more future-ready if it can translate
this into economic growth.
Cities ranking higher in FRE but in the bottom half
of the WE Cities may be missing out on the extra
boost HPWE could give their economies. For
example, Hong Kong’s Infrastructure drove a high
FRE score, but it was much weaker in WE Cities
Markets and Talent indicators.
Cities ranking lower in both WE Cities and FRE have
some work to do, but can use their scores in both to
find areas of focus. For example, Mexico City,
though faring poorly across a broad range of FRE
categories, might build on its strengths in
Technology enabling HPWE.
Getting ready for
the future. Some
cities to watch?
Ready on all Fronts!
FR
E R
ati
ng
The Future
Looks Good, But
How Much
Brighter Could it
Be?
© 2016 IHS. ALL RIGHTS RESERVED.
Future Ready trends
22
Dell WE Cities Research / May 2016
The next three slides show the trend lines (the quantitative relationship
between the two indices, as described by a regression line).
The trend line indicates which cities have WE Cities scores (measuring
cities’taht (sruenerpertne nemow laitnetop hgih troppus dna tcartta ot ytiliba
are commensurate with their performance on the FRE (based on the three
categories of Human Capital, Commerce and Infrastructure).
It provides a visualization of the strong positive association between the
categories of the FRE and WE Cities.
© 2016 IHS. ALL RIGHTS RESERVED.
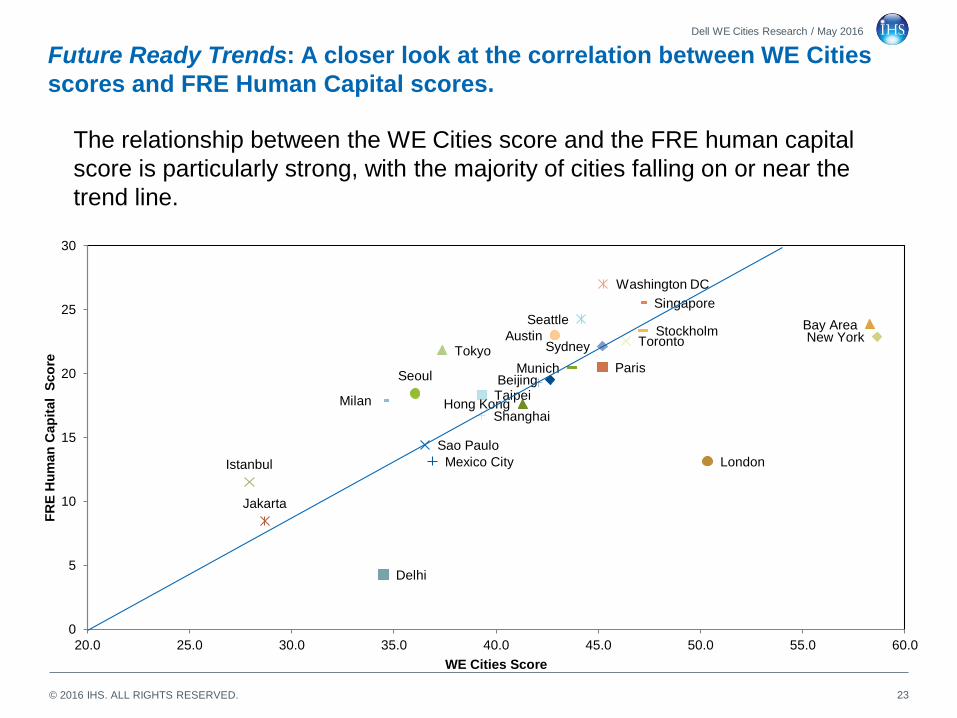
Future Ready Trends: A closer look at the correlation between WE Cities
scores and FRE Human Capital scores.
23
Dell WE Cities Research / May 2016
The relationship between the WE Cities score and the FRE human capital
score is particularly strong, with the majority of cities falling on or near the
trend line.
Beijing
Delhi
Hong Kong
Istanbul
Jakarta
London
Milan
Munich
New York
Paris
Bay Area
Sao Paulo
Seattle
Seoul
Shanghai
Singapore
StockholmSydney
Taipei
TokyoToronto
Washington DC
Austin
Mexico City
0
5
10
15
20
25
30
20.0 25.0 30.0 35.0 40.0 45.0 50.0 55.0 60.0
FR
E H
um
an
Cap
ital S
co
re
WE Cities Score
© 2016 IHS. ALL RIGHTS RESERVED.
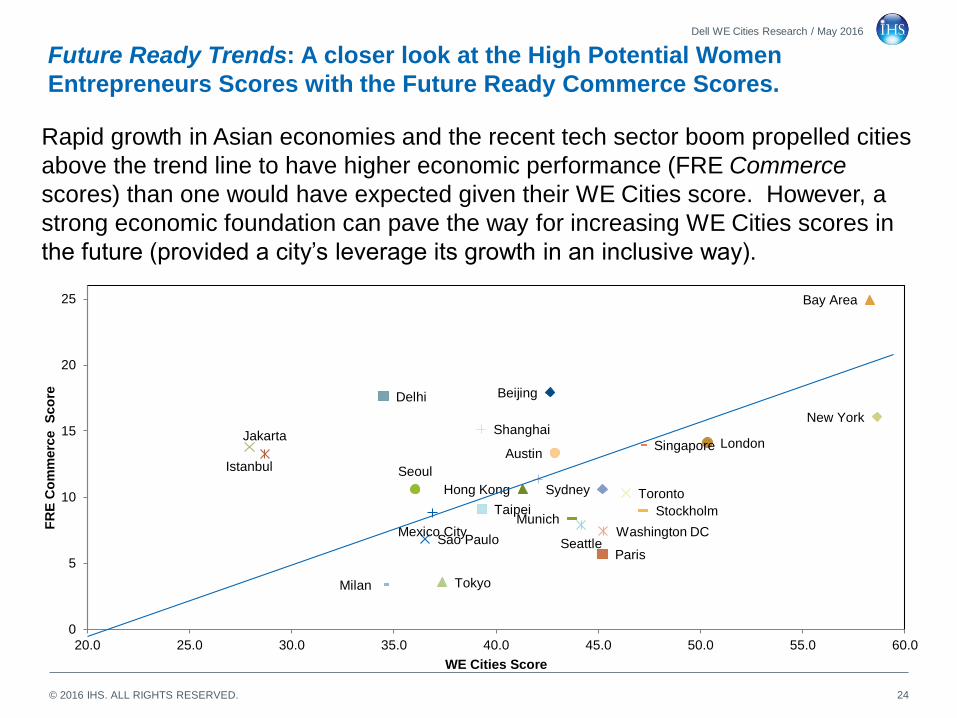
Future Ready Trends: A closer look at the High Potential Women
Entrepreneurs Scores with the Future Ready Commerce Scores.
24
Dell WE Cities Research / May 2016
Rapid growth in Asian economies and the recent tech sector boom propelled cities
above the trend line to have higher economic performance (FRE Commerce
scores) than one would have expected given their WE Cities score. However, a
strong economic foundation can pave the way for increasing WE Cities scores in
the.(yawevisulcninanihtworgstiegarevels’yticadedivorp)erutuf
BeijingDelhi
Hong Kong
Istanbul
JakartaLondon
Mexico City
Milan
Munich
New York
Paris
Bay Area
Sao Paulo Seattle
Seoul
Shanghai
Singapore
Stockholm
Sydney
Taipei
Tokyo
Toronto
Washington DC
Austin
0
5
10
15
20
25
20.0 25.0 30.0 35.0 40.0 45.0 50.0 55.0 60.0
FR
E C
om
merc
e S
co
re
WE Cities Score
© 2016 IHS. ALL RIGHTS RESERVED.
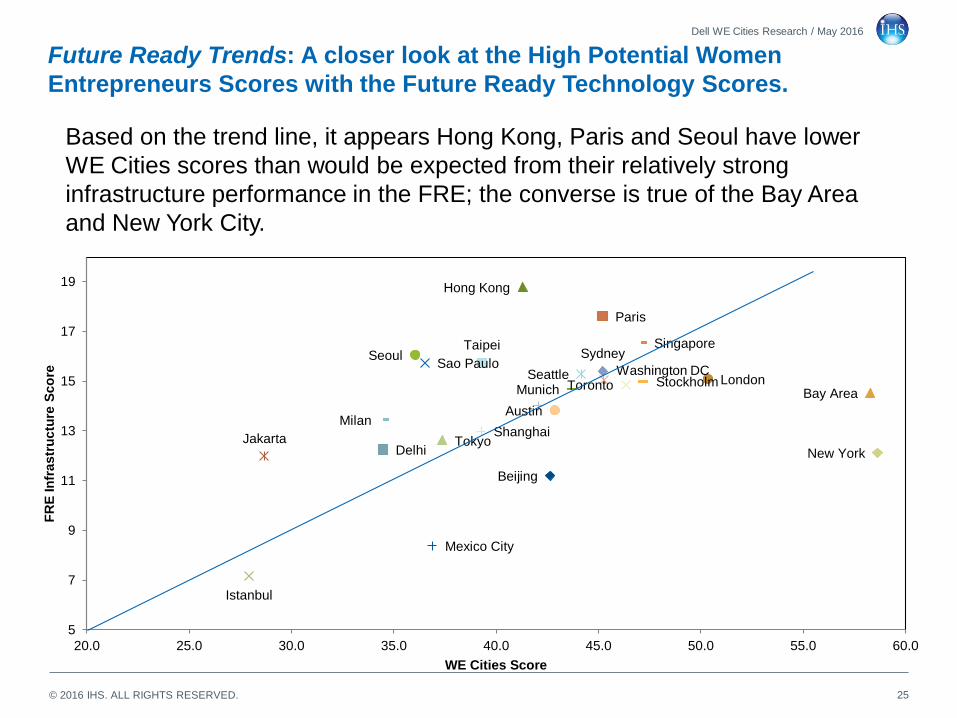
Future Ready Trends: A closer look at the High Potential Women
Entrepreneurs Scores with the Future Ready Technology Scores.
25
Dell WE Cities Research / May 2016
Based on the trend line, it appears Hong Kong, Paris and Seoul have lower
WE Cities scores than would be expected from their relatively strong
infrastructure performance in the FRE; the converse is true of the Bay Area
and New York City.
Beijing
Delhi
Hong Kong
Istanbul
Jakarta
London
Mexico City
Milan
Munich
New York
Paris
Bay Area
Sao PauloSeattle
Seoul
Shanghai
Singapore
Stockholm
SydneyTaipei
Tokyo
TorontoWashington DC
Austin
5
7
9
11
13
15
17
19
20.0 25.0 30.0 35.0 40.0 45.0 50.0 55.0 60.0
FR
E In
fra
str
uc
ture
Sc
ore
WE Cities Score
© 2016 IHS. ALL RIGHTS RESERVED.
Appendix
26
Dell WE Cities Research / May 2016
A. WE Cities Scoring Methodology
B. How this rating differs from other entrepreneurship measures
C. How to read the Rating Workbook
D. Using the Rating
E. Acknowledgements
© 2016 IHS. ALL RIGHTS RESERVED.
A. Scoring Methodology – Indicator Selection
• BuildingdeifitnediSHI,(EWPH)sruenerpertnEnemoWlaitnetoPhgiHnohcraeserfosraeys’lleDno
five important categories of city characteristics (pillars) that influence them.
• IHS conducted a literature review to identify important sub-categories within those pillars as well as
potential indicators that could be used for measuring those sub-categories.
• Dell, Harvard TECH Professor David Ricketts, and IHS convened a Research Symposium bringing
together women entrepreneurs, funders, thought leaders, policy makers and researchers to discuss
what cities need to attract and support HPWE.
• IHS took feedback from DWEN Symposium participants into account when determining which
indicators to include in the rating. Theylsuoiverpt’ndahtahtsrotacidniweneerhtdecafrusmuisopmyS
been proposed: paternity leave, initiatives to collect gendered data, and safety of transportation
systems (which relates to the city safety/security overall).
• Culture (including mentoring/networking, internal mindsets/expectations and relevant
nondiscrimination/ level playing field policies) carried much of the discussion. Capital was identified as
the biggest constraint in the survey and discussed as critical to business scaling; crowd-funding in
particular emerged as a growing source of capital for WE. Talent (both’sruenerpertneehtfosmretni
own talent, including education & experience) and getting the right team in place (staff skills) also
came out as highly important. All of these were thus given higher weight in the final index scoring.
• A higher order categorization of city characteristics emerged from the symposium: factors that
influence the Operating Environment and factors that influence the Enabling Environment. The five
pillars were thus re-organized to fit into these two foundational pillars, with related Policy included as a
component of each.
27
Dell WE Cities Research / May 2016
© 2016 IHS. ALL RIGHTS RESERVED.
A. Scoring Methodology – Data Collection
28
Dell WE Cities Research / May 2016
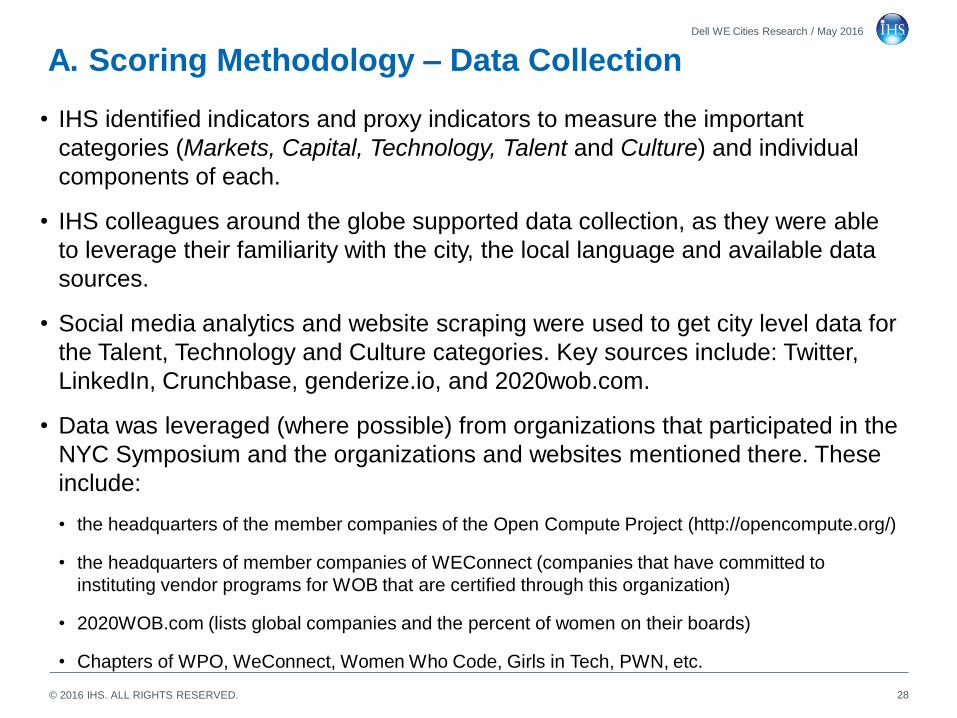
• IHS identified indicators and proxy indicators to measure the important
categories (Markets, Capital, Technology, Talent and Culture) and individual
components of each.
• IHS colleagues around the globe supported data collection, as they were able
to leverage their familiarity with the city, the local language and available data
sources.
• Social media analytics and website scraping were used to get city level data for
the Talent, Technology and Culture categories. Key sources include: Twitter,
LinkedIn, Crunchbase, genderize.io, and 2020wob.com.
• Data was leveraged (where possible) from organizations that participated in the
NYC Symposium and the organizations and websites mentioned there. These
include:
• the headquarters of the member companies of the Open Compute Project (http://opencompute.org/)
• the headquarters of member companies of WEConnect (companies that have committed to
instituting vendor programs for WOB that are certified through this organization)
• 2020WOB.com (lists global companies and the percent of women on their boards)
• Chapters of WPO, WeConnect, Women Who Code, Girls in Tech, PWN, etc.
© 2016 IHS. ALL RIGHTS RESERVED.
A. Scoring Methodology – Scoring & Ranking Cities
29
Dell WE Cities Research / May 2016
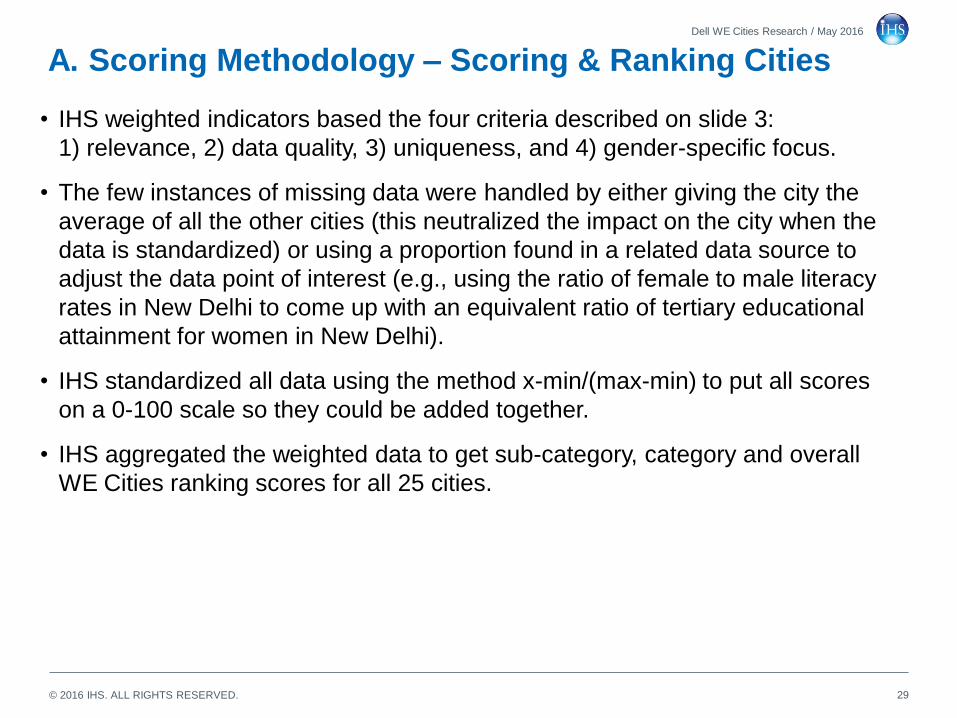
• IHS weighted indicators based the four criteria described on slide 3:
1) relevance, 2) data quality, 3) uniqueness, and 4) gender-specific focus.
• The few instances of missing data were handled by either giving the city the
average of all the other cities (this neutralized the impact on the city when the
data is standardized) or using a proportion found in a related data source to
adjust the data point of interest (e.g., using the ratio of female to male literacy
rates in New Delhi to come up with an equivalent ratio of tertiary educational
attainment for women in New Delhi).
• IHS standardized all data using the method x-min/(max-min) to put all scores
on a 0-100 scale so they could be added together.
• IHS aggregated the weighted data to get sub-category, category and overall
WE Cities ranking scores for all 25 cities.
© 2016 IHS. ALL RIGHTS RESERVED.
B. How this scoring differs from other entrepreneurship
ratings
30
Dell WE Cities Research / May 2016
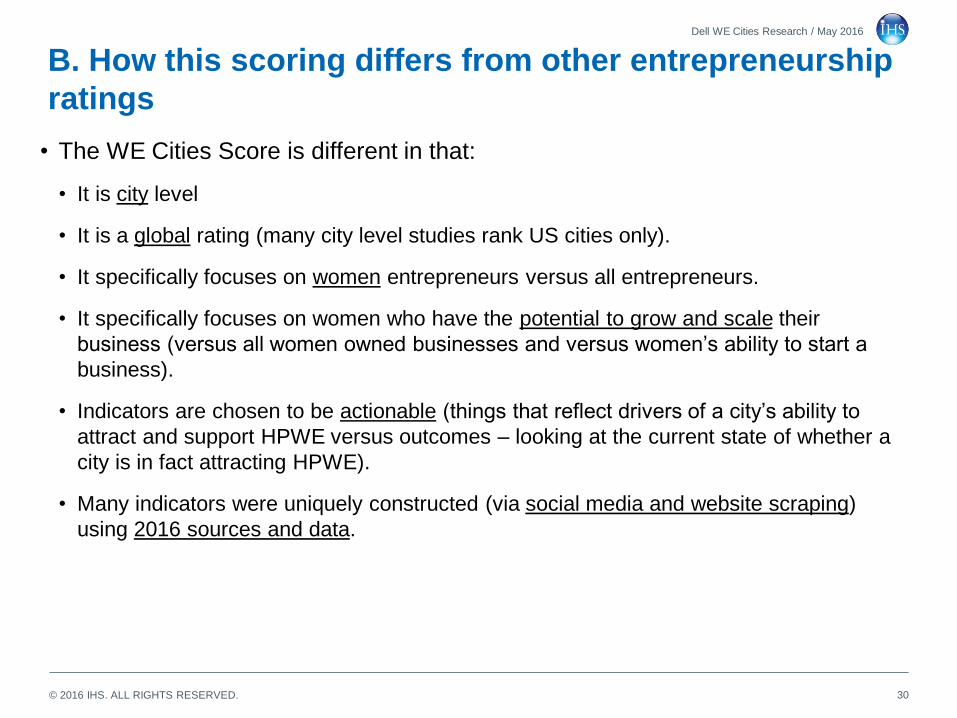
• The WE Cities Score is different in that:
• It is city level
• It is a global rating (many city level studies rank US cities only).
• It specifically focuses on women entrepreneurs versus all entrepreneurs.
• It specifically focuses on women who have the potential to grow and scale their
businessatratsotytilibas’nemowsusrevdnasessenisubdenwonemowllasusrev)
business).
• Indicators are chosen to be actionable (thingsotytilibas’yticafosrevirdtcelfertaht
attract and support HPWE versus outcomes – looking at the current state of whether a
city is in fact attracting HPWE).
• Many indicators were uniquely constructed (via social media and website scraping)
using 2016 sources and data.
© 2016 IHS. ALL RIGHTS RESERVED.
C. How to read the Scoring Sheet
31
Dell WE Cities Research / May 2016
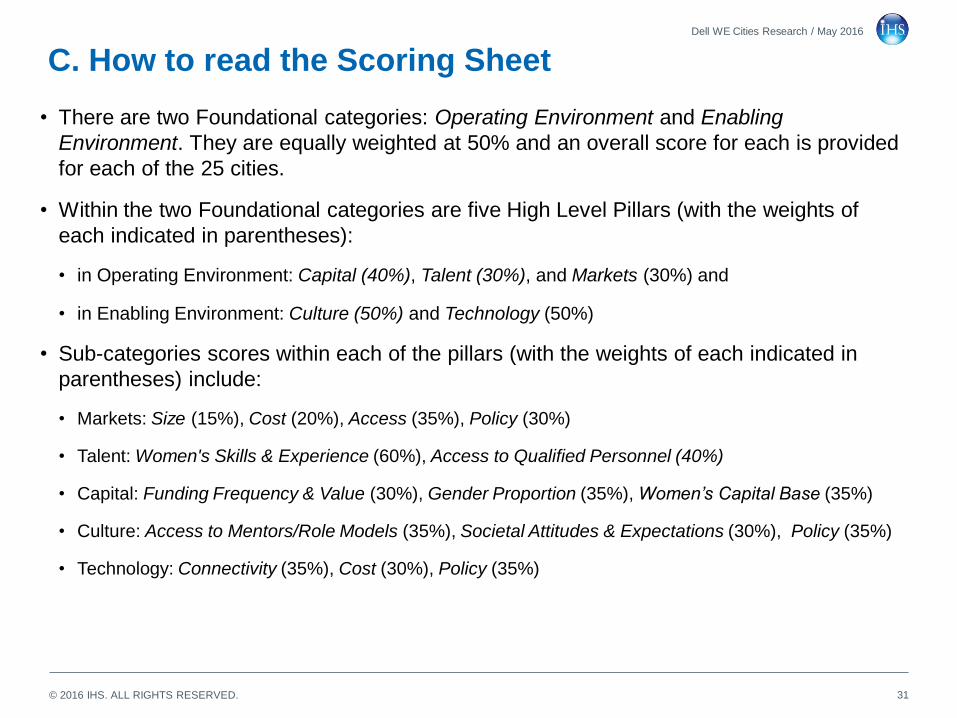
• There are two Foundational categories: Operating Environment and Enabling
Environment. They are equally weighted at 50% and an overall score for each is provided
for each of the 25 cities.
• Within the two Foundational categories are five High Level Pillars (with the weights of
each indicated in parentheses):
• in Operating Environment: Capital (40%), Talent (30%), and Markets (30%) and
• in Enabling Environment: Culture (50%) and Technology (50%)
• Sub-categories scores within each of the pillars (with the weights of each indicated in
parentheses) include:
• Markets: Size (15%), Cost (20%), Access (35%), Policy (30%)
• Talent: Women's Skills & Experience (60%), Access to Qualified Personnel (40%)
• Capital: Funding Frequency & Value (30%), Gender Proportion (35%), Women’s Capital Base (35%)
• Culture: Access to Mentors/Role Models (35%), Societal Attitudes & Expectations (30%), Policy (35%)
• Technology: Connectivity (35%), Cost (30%), Policy (35%)
© 2016 IHS. ALL RIGHTS RESERVED.
D. Using the Rating
32
Dell WE Cities Research / May 2016
• The WE Cities rating is useful for highlighting relative areas of strengths and weaknesses
within a city that can help it improve by leveraging existing strengths and improving areas
that are less strong.
• Indicators were selected that had an action component (e.g., increasing tertiary
education; instituting Vendor Diversity programs, etc.)
• While the WE Cities rating can point to areas that a city could strengthen to increase its
overall WE Cities score, further analysis is required to identify the context and develop
appropriate improvement strategies.
© 2016 IHS. ALL RIGHTS RESERVED.
E. Acknowledgements
Raj Badiani
Eleonora Bonalumi
Carlos Cardenas
Alison Evans
Diana Heger
David Hunt
Marushia Li Gislen
Hanna Luchnikava
Roelof Middeljans
Braden Muhl
Chichi Morales
Martin Seban
Ege Seckin
David Wilson
Edwin Wong
Yating Xu
Steve Zabak
Yajing Zhao
33
Dell WE Cities Research / May 2016
The project team would to thank the following colleagues for their
substantial support on this project:
© 2016 IHS. ALL RIGHTS RESERVED.
For Further Reference
34
Dell WE Cities Research / May 2016
Brush, Candida, “How,sebroF,”seitinummoC dna seimonocE gnimrofsnarT erA sruenerpertnE nemoW 13 February
2013 at http://www.forbes.com/sites/babson/2013/02/16/how-women-entrepreneurs-are-transforming-economies-and-
communities/#a33a1a254665 (retrieved 11 May 2016).
Carter, N., Brush, C., Greene, P., Gatewood, E., & Hart, M. (2003). Women entrepreneurs who break through to equity
financing: the influence of human, social and financial capital. Venture Capital, 5(1), 1.
Chatterji, Aaron; Glaeser,noitavonnI”noitavonnIdnapihsruenerpertnEfosretsulC(4102)mailliW,rreK;drawdE
Policy and the Economy, Volume 14, Lerner and Stern.
Coleman,denwO-nemoW htworG-hgiHyblatipaCotsseccA“(4102lirpA3)aicilA,bboRdnanameloCnasuS
Businesses,”licnuoCssenisuBs’nemoWlanoitaNehtrofCLL,gnitlusnoCniraMybderaperP
https://www.nwbc.gov/sites/default/files/Access%20to%20Capital%20by%20High%20Growth%20Women-
Owned%20Businesses%20(Robb)%20-%20Final%20Draft.pdf (retrieved 10 May 2016).
Fetsch,namffuaK ehT”htworGgnitareleccAotyeKerasruenerpertnEnemoW“.nosaJ,sneiW,sirhC,noskcaJ,ylimE
Foundation, Women in Entrepreneurship 20 July 2015 at http://www.kauffman.org/what-we-
do/resources/entrepreneurship-policy-digest/women-entrepreneurs-are-key-to-accelerating-growth (retrieved 10 May
2016).
Dell,weiveRssenisuBdravraH,”hsiruolF seinapmoC htworG-hgiH pleH naC seitiCwoH“.cnI
January 14, 2016, https://hbr.org/sponsored/2016/01/how-cities-can-help-high-growth-companies-flourish
Das, Malika. (2000-2001)folanruoJ,“srotcaFsseccuSdnasnoitavitoM,smelborP:aidnImorfsruenerpertnEnemoW“
Small Business & Entrepreneurship
http://www.cartierwomensinitiative.com/docs/Women%20entrepreneurs%20from%20India.pdf
Ghani, Ejaz,elamefdnaserutcurtslairtsudnilacoL“.DnehpetS,llennoC’Odna.RmailliW,rreK
entrepreneurship in India, J Econ Geogr first published online May 8, 2013 doi:10.1093/jeg/lbt004.
Messina, Judy et. al.(2016) BREAKING THROUGH Harnessing the Economic Potential of Women Entrepreneurs,
Center for an Urban Future, https://nycfuture.org/pdf/Breaking-Through.pdf (retrieved 3 March 2016).
© 2016 IHS. ALL RIGHTS RESERVED.
For Further Reference (Continued)
35
Dell WE Cities Research / May 2016
Mitchelmore, Siwan, Rowley, Jennifer, Shiu, Edward (2014) "Competencies associated with growth of women-led
SMEs", Journal of Small Business and Enterprise Development, Vol. 21 Iss: 4, pp.588 – 601.
Ricketts, David. Proceedings from the 2016 Dell Women’s Entrepreneur Network Research Symposium, Harvard
University Club, New York, NY, 4 April 2016,
http://theinnovatorsforum.org/sites/default/files/DWEN_RS_2016_Whitepaper.pdf (retrieved 11 May 2016).
Siwan Mitchelmore, Jennifer Rowley, (2013) "Entrepreneurial competencies of women entrepreneurs pursuing
business growth", Journal of Small Business and Enterprise Development, Vol. 20 Iss: 1, pp.125 – 142.
Stuart S.weNAdnA,noitaremolggA,pihsruenerpertnEelameF“(2102tsuguA)egnartS.CmailliWdnalahtnesoR
Spatial.887–467:(3)49,scitsitatSdnascimonocEfoweiveRehT”hctamsiM
University of Toronto, Women’s Summit Communiqué. W20 Summits, Istanbul, October 17, 2015
http://www.g20.utoronto.ca/w20/151017-w20.html (retrieved 9 May 2016).
Zimmerman, Eilene.-- kraM noilliM 1$ ehT kaerB sessenisuB denwO-nemoW fO %2 ylnO“ Here's How To Be One Of
Them”5102lirpA1,sebroF
http://www.forbes.com/sites/eilenezimmerman/2015/04/01/only-2-of-women-owned-businesses-break-the-1-million-
mark-heres-how-to-be-one-of-them/#5762a4a2224e (retrieved 10 May 2016).
IHS Customer Care:
Americas: +1 800 IHS CARE (+1 800 447 2273); [email protected]
Europe, Middle East, and Africa: +44 (0) 1344 328 300; [email protected]
Asia and the Pacific Rim: +604 291 3600; [email protected]
COPYRIGHT NOTICE AND DISCLAIMER
© 2016 IHS. All rights reserved. No portion of this presentation may be reproduced, reused, or otherwise distributed in any form without prior written consent of IHS. Content reproduced or redistributed with IHS permission must display IHS legal
notices and attributions of authorship. The information contained herein is from sources considered reliable, but its accuracy and completeness are not warranted, nor are the opinions and analyses which that are based upon it, and to the extent
permitted by law, IHS shall not be liable for any errors or omissions or any loss, damage, or expense incurred by reliance on information or any statement contained herein. In particular, please note that no representation or warranty is given as to the
achievement or reasonableness of, and no reliance should be placed on, any projections, forecasts, estimates, or assumptions, and, due to various risks and uncertainties, actual events and results may differ materially from forecasts and statements
of belief noted herein. This presentation is not to be construed as legal or financial advice, and use of or reliance on any information in this publication is entirely at your own risk. IHS and the IHS logo are trademarks of IHS.


![[Attract Women] 4 Looks That Will Turn a Woman Off](https://img.pdfslide.us/doc/110x75/53fb88338d7f72de698b456c/attract-women-4-looks-that-will-turn-a-woman-off.jpg)


![[Attract Women] 3 Things Not to Say When You Meet a Woman](https://img.pdfslide.us/doc/110x75/53f2f1ac8d7f72c30e8b4651/attract-women-3-things-not-to-say-when-you-meet-a-woman.jpg)