Embed Size (px)
Citation preview
ATTITUDES TO OLDER PEOPLE AND PERCEPTIONS OF WORKING WITH OLDER PEOPLE OF
STUDENTS OF HEALTH AND SOCIAL CARE
This project has been funded with support from the Lifelong Learning Programme of the European Commission.
This publication (communication) reflects the views only of the author, and the Commission cannot be held responsible for any use which may be made of the information contained therein.
1
Attitudes to older people and perceptions of working with
older people of students of health and social care
Recommended citation:
Coffey, A , Buckley, C., Murphy, E., McCarthy, G., Gaidys, U., Sansoni, J., Arola, M., Deimante-hartmane,
D., Auer, S., Corvo, E., Petersen- Ewert, C. (2015) ATTITUDES TO OLDER PEOPLE AND PERCEPTIONS
OF WORKING WITH OLDER PEOPLE OF STUDENTS OF HEALTH AND SOCIAL CARE : Report
available at ELLAN – European Later Life Active Network available at http://ellan.savonia.fi/
Authors:
Dr Alice Coffey, Catherine Buckley, Elaine Murphy, Professor Geraldine
McCarthy, Professor Dr Uta Gaidys, Dr Julita Sansoni, Dr Marjut Arola, Dr
Dagnija Deimante-hartmane, Sabrina Auer, Elisabetta Corvo, Professor Dr
Corinna Petersen- Ewert
Project workgroup: Ireland (Lead), Germany, Latvia, Finland, Italy
Date: 20th
/6/2015
ATTITUDES TO OLDER PEOPLE AND PERCEPTIONS OF WORKING WITH OLDER PEOPLE OF
STUDENTS OF HEALTH AND SOCIAL CARE
This project has been funded with support from the Lifelong Learning Programme of the European Commission.
This publication (communication) reflects the views only of the author, and the Commission cannot be held responsible for any use which may be made of the information contained therein.
2
Table of Content
Background .................................................................................................................. 7
Literature Review .......................................................................................................... 9
Introduction .............................................................................................................. 9
Method of Literature Review ...................................................................................... 10
Attitudes to ageing and older people .......................................................................... 11
Perceptions of working with older people .................................................................... 15
Conclusion ............................................................................................................... 17
Methodology ................................................................................................................ 18
Aim ......................................................................................................................... 18
Research Design ....................................................................................................... 18
Sample ................................................................................................................. 18
Inclusion Criteria ................................................................................................... 18
Exclusion Criteria ................................................................................................... 18
Study Instruments .................................................................................................... 19
Ethical approval ........................................................................................................ 20
Access to sample and Data Collection ......................................................................... 20
Data Analysis ........................................................................................................... 20
Results ........................................................................................................................ 21
Demographics .......................................................................................................... 21
Student Group ....................................................................................................... 21
Gender ................................................................................................................. 21
Age Group ............................................................................................................ 22
Level of Education ................................................................................................. 22
Ethnic or Culture Origin .......................................................................................... 22
Experience of Working with Older People .................................................................... 25
Students experience prior to commencing education programme. .............................. 25

ATTITUDES TO OLDER PEOPLE AND PERCEPTIONS OF WORKING WITH OLDER PEOPLE OF
STUDENTS OF HEALTH AND SOCIAL CARE
This project has been funded with support from the Lifelong Learning Programme of the European Commission.
This publication (communication) reflects the views only of the author, and the Commission cannot be held responsible for any use which may be made of the information contained therein.
3
Students Perceptions of their experience with older people ....................................... 26
Experience of students currently working with older people....................................... 26
Student attitudes toward older people ........................................................................... 27
Overall attitude to older people by country ................................................................. 28
Reliability of the scale using this data sample ........................................................... 28
Examples of results with regard to individual statements: ............................................. 28
Statements that showed a mainly negative attitude towards older people: ................. 28
Statements that showed a mainly positive attitude towards older people: ................... 29
Statements that showed a mainly mixed attitude towards older people: ..................... 29
Relationships between student demographic and attitudes to older people .................... 30
Gender and attitude ............................................................................................... 30
Age group and attitude .......................................................................................... 30
Student group and attitude .................................................................................... 30
Highest level of education attained and attitude ....................................................... 31
Relationship between past experience (yes/no) of working with older people and
attitude ................................................................................................................ 31
Relationship between past experience of working with older people and attitude ........ 32
Relationship between current experience of working with older people and attitude .... 32
Perceptions of Working with Older People ...................................................................... 37
Reliability of the scale ............................................................................................ 37
Overall perceptions of working with older people ......................................................... 37
Student’s perceptions of working with older people in general ...................................... 39
Student’s personal disposition towards working with older people ................................. 39
Student’s perceptions of the consequences of working with older people ....................... 40
Reliability of subscales: .......................................................................................... 41
Scores on the subscales: ........................................................................................ 41
ATTITUDES TO OLDER PEOPLE AND PERCEPTIONS OF WORKING WITH OLDER PEOPLE OF
STUDENTS OF HEALTH AND SOCIAL CARE
This project has been funded with support from the Lifelong Learning Programme of the European Commission.
This publication (communication) reflects the views only of the author, and the Commission cannot be held responsible for any use which may be made of the information contained therein.
4
Relationships between demographics and perception of working with older people
subscales ................................................................................................................. 42
Gender and ‘perception of working with older people in general’................................ 42
Age group and ‘perceptions of working with older people in general’ .......................... 42
Student group and ‘perceptions of working with older people in general’ .................... 42
Highest level of education and ‘perceptions of working with older people in general’ ... 43
Past experience of older people and ‘perceptions of working with older people in
general’ ................................................................................................................ 43
Perception of past experience of working with older people and ‘perceptions of working
with older people in general’................................................................................... 43
Current experience of working with older people ...................................................... 44
Perception of current experience of working with older people and perception of
working with older people ...................................................................................... 44
Gender and disposition to working with older people ................................................ 46
Age group and disposition to working with older people ............................................ 46
Student group and disposition to working with older people ...................................... 46
Highest level of education and disposition to working with older people ..................... 46
Past experience of working with older people and disposition to working with older
people .................................................................................................................. 47
Perception of experience of working with older people .............................................. 47
Current experience of working with older people and disposition to working with older
people .................................................................................................................. 47
Perception of current experience of working with older people and disposition to
working with older people ...................................................................................... 47
Gender and perceived ‘consequences of working with older people’ ........................... 50
Age group and perceived ‘consequences of working with older people’....................... 50
Student group and perceived ‘consequences of working with older people’ ................. 50
ATTITUDES TO OLDER PEOPLE AND PERCEPTIONS OF WORKING WITH OLDER PEOPLE OF
STUDENTS OF HEALTH AND SOCIAL CARE
This project has been funded with support from the Lifelong Learning Programme of the European Commission.
This publication (communication) reflects the views only of the author, and the Commission cannot be held responsible for any use which may be made of the information contained therein.
5
Highest level of education attained and perceived ‘consequences of working with older
people’ ................................................................................................................. 50
Past experience of working with older people and perceived ‘consequences of working
with older people’ .................................................................................................. 51
Perceptions of past experience of working with older people and perceived
‘consequences of working with older ....................................................................... 51
Current experience of working with older people and perceived ‘consequences of
working with older people’ ..................................................................................... 51
Perceptions of current experience of working with older people and perceived............ 51
Relationship between attitude to older people and perception of working with older people
overall ..................................................................................................................... 54
Discussion ................................................................................................................... 55
Limitations ............................................................................................................... 57
Conclusions and recommendations ................................................................................ 57
References .................................................................................................................. 58
List of Tables:
Table 1 Demographics………………………………………………………………………………………………..21
Table 2 Experience of working with older people…………………………………………………………..22
Table 3 Perception of experience…………………………………………………………………………………23
Table 4 Attitude by country…………………………………………………………………………………………25
Table 5 Response to negative statements…………………………………………………………………….30
Table 6 Response to positive statements…………………………………………………………………….31
Table 7 Response by country………………………………………………………………………………………32
Table 8 Summary Scores Nolan…………………………………………………………………………………..33
Table 9 Perception of Working with older people………………………………………………………….34
Table 10 Individual questions Nolan by country……………………………………………………………36
Table 11 Relationships perception and demographics…………………………………………………..41
Table 12 Relationships disposition and demographics…………………………………………………..45
Table 13 Relationships consequences and demographics………………………………………………49
Table 14 Pearsons correlation Attitude and Perception………………………………………………….50
ATTITUDES TO OLDER PEOPLE AND PERCEPTIONS OF WORKING WITH OLDER PEOPLE OF
STUDENTS OF HEALTH AND SOCIAL CARE
This project has been funded with support from the Lifelong Learning Programme of the European Commission.
This publication (communication) reflects the views only of the author, and the Commission cannot be held responsible for any use which may be made of the information contained therein.
6
List of Figures
Figure 1 Number of respondents by country……………………………………………………………….. 20
Figure 2 Scatterplot attitude & perception…………………………………………………………………….50
ATTITUDES TO OLDER PEOPLE AND PERCEPTIONS OF WORKING WITH OLDER PEOPLE OF
STUDENTS OF HEALTH AND SOCIAL CARE
This project has been funded with support from the Lifelong Learning Programme of the European Commission.
This publication (communication) reflects the views only of the author, and the Commission cannot be held responsible for any use which may be made of the information contained therein.
7
Background
Europe faces severe population ageing in the near future. A new vision of ageing and
promotion of positive possibilities in older age is needed.
The need for cooperation throughout Europe to meet new challenges in professional work
with older people is undeniable. In this context a competency based education is considered
as crucial. Therefore, it is regarded as essential to build on both, inter- and transnational
partnerships between Higher Education Institutes and trans-professional partnerships,
including older adults on the one hand and students on the other hand, as experts of their
own experience. In this context the EU-funded Project ELLAN (2013 – 2016) was
undertaken with a consortium of 26 partners from all over Europe.
The overarching aim of ELLAN is to develop a European Core Competencies Framework for
working with older people (ECCF) within the perspective of positive ageing and social
cohesion. Consequently, the project is designed to share good practice and innovative
approaches of both, the work with older adults and competency based learning. Cooperation
with European professional organizations and networks will assure the development of an
agreed set of competencies.
The overall project is set out in 10 work packages with specific members from the 26
partner organisations taking a lead on these packages and the other partners forming part
of that work package team. All work packages addressed the main research aims and
objectives of the project which are:
(1) to develop an agreed Core European Competencies Framework for working with older
people by discovering older people’s thoughts on the knowledge, attitudes and behaviours
of health and social care professionals when working with older people, analysing research
and literature on competences required in older people’s care; exploring health and social
care professionals’ views of desired competences for all working with older people, and
(2) to positively influence health and social care professionals’ interest in working with older
people by identifying and sharing innovative learning approaches to working with older
people – exemplars of good practice across Europe and exploring with students of social and
health care, the factors that inhibit or facilitate working with older people.

ATTITUDES TO OLDER PEOPLE AND PERCEPTIONS OF WORKING WITH OLDER PEOPLE OF
STUDENTS OF HEALTH AND SOCIAL CARE
This project has been funded with support from the Lifelong Learning Programme of the European Commission.
This publication (communication) reflects the views only of the author, and the Commission cannot be held responsible for any use which may be made of the information contained therein.
8
Other work packages were concerned with overall management of the project, ensuring the
quality of the project and ensuring that findings of the research and the output are
disseminated widely.
Work Package 6 was led by Dr Alice Coffey, University College Cork (Ireland). Research
partners in this work package are Germany, Finland, Latvia and Italy.
The aim of this work package was to ascertain the attitudes to ageing and perceptions of
working with older people among students of health and social care. The work undertaken
by the Work Package six group is reported here.
ATTITUDES TO OLDER PEOPLE AND PERCEPTIONS OF WORKING WITH OLDER PEOPLE OF
STUDENTS OF HEALTH AND SOCIAL CARE
This project has been funded with support from the Lifelong Learning Programme of the European Commission.
This publication (communication) reflects the views only of the author, and the Commission cannot be held responsible for any use which may be made of the information contained therein.
9
Literature Review
Introduction
Societies all over Europe are ageing. Ageing populations are providing a challenge for both
public health and social care systems (Lui, Norman & While 2013). The WHO (2012) cites
the median age of population in the European region as already the highest in the world,
with the proportion of older people aged 65 and older forecast to increase from 14% to
25% by 2050. This is coupled with the fact that the oldest segment of this population,
those aged 80 and over, is rapidly growing and expected to represent 20% of the older
adult population. This increase in the ageing population means an increased number of
older people who are unable to care for themselves. Indeed the WHO (2012) predicts that
many older people will lose the ability to live independently and 25%-30% of people aged
over 85 will have some form of cognitive impairment. Therefore, there will be an increased
need to provide care for older people that will cover a wide range of services including
hospitals, residential care settings, health and community services (Lin, Bryant & Boldero
2011, Remmers & Walter 2013). This increasing demand is set against a background of a
shortage of skilled healthcare professionals globally (Engstrom & Fagerberg 2011), but more
importantly with a lack of interest or desire from these professionals to work within the
ageing context (Samra, Griffiths, Cox Conroy & Knight 2013, Goncalves 2009, Amrhein et al
2007, Cummings, Alder & DeCosta 2005, McLafferty & Morrison 2004). In 2006 the WHO
noted the shortage of skilled gerontological workers in the developed world and urged the
development of training specific to older people care. However issues such as lack of
professional esteem and economic reward, poor working conditions and working
environments and lack of personal satisfaction (Kydd & Wild 2013), perpetuate the existence
of this shortage. There is a discrepancy in the literature as to whether health and social
care workers hold positive or negative attitudes towards older people (Liu et al 2013,
Boswell 2012, Nolan et al 2006, McLafferty & Morrison 2004,) According to German studies
health care and social workers hold a relatively positive attitude towards older people
(Klaghofer et al 2009, Berner et al 2012, Buchwald et al 2007) but most studies recommend
educational interventions that enable individuals develop accurate knowledge about the
ageing process to improve responses to ageing and interest in working with older people
(Samra et al. 2013, Boswell 2012, Swanlund & Kujath 2012, Duggan Mitchel & Moore
2013, Van Dussen & Weaver 2009, Klaghofer et al 2009).

ATTITUDES TO OLDER PEOPLE AND PERCEPTIONS OF WORKING WITH OLDER PEOPLE OF
STUDENTS OF HEALTH AND SOCIAL CARE
This project has been funded with support from the Lifelong Learning Programme of the European Commission.
This publication (communication) reflects the views only of the author, and the Commission cannot be held responsible for any use which may be made of the information contained therein.
10
Ageism a term originally coined by Butler in the nineteen sixties is a systematic stereotyping
of and discrimination against people because they are old (Butler, 1995). Ageist attitudes
were suggested in the past to be prevalent in western society. However according to Kruse
(2013), today it is more a profound reservation about age. Recent studies and newer
cognitive social psychology assume differentiated and multidimensional images of older
people and a coexistence of negative and positive images of older people (Fillip et al 2005,
Amrhein et al 2007, Huy et al 2009). Nevertheless negative attitudes have been cited as a
major cause for failure to recruit health and social care professionals to work in areas caring
for the older population (Masciadrelli 2014).
A systematic review of research into health professionals’ attitudes towards older people by
Lovell (2006), found that attitudes ranged from neutral to positive. Lovell, (2006, p96)
further stated that negative attitudes to ageing could lead to ageism. Several studies have
cited the importance of societal influence on the views and attitudes of students towards
older people (Remmers & Walter 2013, McKinlay & Cowan 2003, Happel 2002, Haight, Christ
and Dias 1994). Additionally, age is associated with losses in creativity, productivity,
curiosity and openness (Kruse 2012). Research conducted with health care workers in the
UK argued that negative attitudes to older people impacted on decisions about care and
treatment (Victor 2006, Eurich 2006). There is also evidence that attitude towards ageing
and working with older people are found to have shaped health care professionals'
behaviours in care delivery (Jacelon, 2002; McLafferty and Morrison, 2004) and were directly
related to the quality of care to older people.
Method of Literature Review
In developing this review the databases CINAHL, Academic Search complete, Pubmed,
SocIndex with full text, Psychology and behavioural Sciences Collection and PSYCH INFO
were systematically searched using the keywords attitude, ageing, students, working with
and older people. Each country conducted searches in their own language and was limited
to years 2003-2014. The review is organised into two sections i.e. Literature related to
Attitudes to ageing and older people and Perceptions of working with older people.
ATTITUDES TO OLDER PEOPLE AND PERCEPTIONS OF WORKING WITH OLDER PEOPLE OF
STUDENTS OF HEALTH AND SOCIAL CARE
This project has been funded with support from the Lifelong Learning Programme of the European Commission.
This publication (communication) reflects the views only of the author, and the Commission cannot be held responsible for any use which may be made of the information contained therein.
11
Attitudes to ageing and older people
Attitude has been defined as either a positive or negative appraisal of a person, place, thing
or event (Federal Ministry of families, seniors, women and youth 2010a). Attitudes can be
formed based on a person’s past and present experiences and can often be changeable
(Federal Ministry of families, seniors, women and youth 2010b). Attitudes contain cognitive,
behavioural and affective constituents and are based on the beliefs and values of the
individual (Matarese et al 2013). This, however, can change over time and is affected by
both social influence and emotional appeal. Mason & Saunders (2004) found that in all
health and social care undergraduate courses working with older people was often described
as the least preferred choice of students for their future careers. This attitude is reflected in
society’s privilege of youth over age with a prevailing view that to be old is something to be
feared. Indeed if professionals consider working with older people as low status this will not
encourage students to view working with older people as either important or rewarding.
Views of ageing and attitude to working with older people can differ. Study results with
students of social and health care in Germany underline that the students have an
unprejudiced view on age, but preferred to work with younger people in the future (Amrhein
et al, 2007)
According to Boswell (2012) poor knowledge about ageing has been linked to negative
attitudes and lack of interest in working with older people. It was suggested that education
about ageing and older people can both deteriorate and ameliorate these problems (Boswell
2012). In an effort to understand this conflicting information Boswell (2012) investigated
whether increasing the knowledge of professional trainees would decrease ageist attitudes.
In a study with 43 undergraduate allied health professional students using the Fraboni Scale
of Ageism (FSA) (Fraboni, Saltstone & Hughes, 1990) and the Facts on Aging Quiz (Palmore,
1988). Findings were that prior to the course students who were anxious about ageing and
who had little knowledge of the ageing process held higher ageist attitudes and lower
interest in working with older people. Boswell (2012) also found that education increased
interest in working with older people and lowered ageist attitudes. Although findings
suggest that education on ageing increases interest in working with older people, interest
does not always translate into actual intent to work therefore these findings should be
viewed with caution. Klaghofer et al (2009) examined the attitudes of medical students
(n=308) towards older people, their knowledge, experiences with older people and their
ATTITUDES TO OLDER PEOPLE AND PERCEPTIONS OF WORKING WITH OLDER PEOPLE OF
STUDENTS OF HEALTH AND SOCIAL CARE
This project has been funded with support from the Lifelong Learning Programme of the European Commission.
This publication (communication) reflects the views only of the author, and the Commission cannot be held responsible for any use which may be made of the information contained therein.
12
own representations of being old, using the Aging Semantic Differential, Facts on Aging Quiz
and other standardized scales. Results showed that the students reported positive attitudes
toward older people. Higher levels of knowledge about older people together with students
own expectations for health, resulted in more positive attitudes toward older people
(Klaghofer et al, 2009).
Similarly Masciadrelli (2014) used a pre-test post-test research approach with 49
undergraduate social work students to measure the effects of an experiential learning
activity on the competency and attitudes of students to older people. Using the General
Attitudes towards the Elderly scale (Dorfman et al 2002), to measure attitudes and the
Dorfman Attitudes towards working with older people scale (Dorfman et al 2002), to
measure attitudes towards working with older people, the researchers found a significant
increases in the targeted competencies and statistically significant decreases in ageist
attitudes after the introduction of a learning activity. These findings suggest that
experiential learning is a useful method of helping students to overcome ageist attitudes and
beliefs about ageing. A limitation of this study was the lack of a control group which did not
allow the researchers identify if it was the progression through their learning curriculum
rather than the specific interventions that caused the positive outcome.
In a study to examine physiotherapy students attitudes towards age and knowledge of older
people, Hobbs et al. (2006), measured attitudes and knowledge at three time points during
their undergraduate studies. The Geriatric Attitudinal Scale (GAS) (Reuben et al. 1998)
measured attitudes and the Facts on Ageing Quiz 1 (FAQ1) measured student’s knowledge.
The findings show that physiotherapy students had a somewhat positive attitude to older
people at time 1 that improved slightly over time to time 3. However, while knowledge of
older people improved from below 50% to 52% there was no corresponding significant
increase in attitudes to older people. While the authors alluded to this in their discussion,
they did not address the underlying cause merely suggesting that further education may
help to increase the level of knowledge and thus influence attitudes. Generalizability of the
findings was limited as the study was conducted with only one cohort of students from the
same university. One could also assume from the findings that the students were still lacking
in knowledge at the end of their studies, which suggests a need to address this in the
educational curricula. Gutheil, Heyman & Chernesky (2009) proposed that it is incumbent
ATTITUDES TO OLDER PEOPLE AND PERCEPTIONS OF WORKING WITH OLDER PEOPLE OF
STUDENTS OF HEALTH AND SOCIAL CARE
This project has been funded with support from the Lifelong Learning Programme of the European Commission.
This publication (communication) reflects the views only of the author, and the Commission cannot be held responsible for any use which may be made of the information contained therein.
13
on educators to provide curricula that not only prepares students for working with older
adults, but also addresses ageist attitudes and misconceptions about ageing. In Germany,
Buchwald and Wehr (2007) conducted a study to assess psychology students’ features of
the stereotype “older people” and authoritative ideas about age. They found that there were
positive, negative and neutral attitudes. Negative attitudes included “immobility”, “fragility”
and “inflexibility”. Positive attitudes included “experienced”, “caring” and “authentic”.
Several studies have highlighted that gerontological content was lacking in educational
curricula and that students are often exposed to negative attitudes to older people in their
clinical placement (Baumbusch, Dahlke & Phinney 2012). Higashi, Tillack, Steinman, Harper
and Johnson (2012) in their ethnographic study to measure the attitudes of physicians in
training towards older people, found that the majority of participants views of older people
were based on their medical training as well as their own preconceived beliefs about older
people. The authors further suggested that the weighting of curricula towards a biomedical
discourse, where older people are seen as dependant and frail rather than dynamic and
healthy, has led to physicians in training developing negative attitudes (Higashi,et al, 2012).
These views can shape not only students desire to work with older people but also the way
they perceive older client needs. Studies have shown that education and positive role
modelling have improved not only student’s knowledge of ageing but also their attitudes
towards older people. An empirical study with students of care-related courses in Germany
showed that attitudes towards the life of older people were positive, however, social loss
and physical problems were thought to belong to age (Remmers et al 2010).
Of all professional groups, nurses’ views and attitudes to ageing are perhaps the best
researched. In a recent systematic review Lui, Norman & While (2013) identified 25 papers
that discussed nurses’ attitudes towards older people. The review results were inconsistent
with positive, negative and neutral attitudes reported. In the selected studies six scales
were most commonly utilised to measure attitudes; the Ageing Semantic Differential
(Rosencranz and NcNevin 1969), Aged Inventory (Knox et al 1995), Perceptions of working
with Older People (PWOP) (Nolan et al. 2001), Facts on Aging Quiz (FAQ) (Palmore 1988),
Kogan’s Older People Scale (KOP) (Kogan 1961) and the revised Kogan’s Older Peoples
Scale (rKOP) (Hilt & Lipschultz 1999). The Kogan’s Older Peoples Scale was most
frequently used. The review identified that a range of variables were examined; with age,
ATTITUDES TO OLDER PEOPLE AND PERCEPTIONS OF WORKING WITH OLDER PEOPLE OF
STUDENTS OF HEALTH AND SOCIAL CARE
This project has been funded with support from the Lifelong Learning Programme of the European Commission.
This publication (communication) reflects the views only of the author, and the Commission cannot be held responsible for any use which may be made of the information contained therein.
14
gender and education level being most frequently investigated. However none were
consistent predictors of attitude to older people. Findings of this review identified that the
age of student nurses impacted on their attitudes to older people, that is that older students
had more positive attitudes. Education level of participants showed inconsistent findings,
with five studies showing an association between education and positive attitudes and six
studies showing no association (Lui, Norman & While 2013). There was little evidence in the
research reviewed that the experience of living with or interacting with older people had an
association with attitude. However there was evidence that nurse’s work setting impacted
both negatively and positively on attitudes to older people (Lui, Norman & While, 2013). The
review identified that having a positive attitude increased the preference to work with older
people however it was also acknowledged that few well-designed studies existed that
explored both the attitudes of registered and student nurses that could be used to develop
future curricula and workforce planning (Lui, Norman & While 2013).
Yilmaz, Kisa & Zeyneloglu (2012) conducted a descriptive study with a random sample of
378 university students used a researcher developed questionnaire to investigate students
views on ageism and ageist practices. The results show, that while the students identified
most of the statements in the questionnaire as ageist they employed behaviours that were
in fact ageist. According to the researchers this showed a contradiction between the
espoused beliefs and the lived beliefs of the students. Interestingly over 50% (56.4%) were
studying social sciences. It is clear that attitudes alone are not an indication of whether a
person displays ageist behaviour and this has implications for all studies that aim to explore
attitudes towards older people.
In summary this review of literature provided evidence that attitudes to older people among
students of health and social care were mixed i.e. positive, negative and neutral
(Baumbusch, Dahlke & Phinney, 2012; Buchwald and Wehr 2007; Hobbs et al. 2006).
Findings also suggest that in health and social care programmes students cite working with
older people as their least preferred choice for their future careers (Amrhein et al, 2007).
However increased knowledge about older people through education was found to lower
ageist attitudes (Masciadrelli, 2014; Lui, Norman & While 2013; Boswell 2012; Klaghofer et
al, 2009). Nevertheless, much of the educational curricula for health and social care
professionals lacked gerontological content (Baumbusch, Dahlke & Phinney 2012).
ATTITUDES TO OLDER PEOPLE AND PERCEPTIONS OF WORKING WITH OLDER PEOPLE OF
STUDENTS OF HEALTH AND SOCIAL CARE
This project has been funded with support from the Lifelong Learning Programme of the European Commission.
This publication (communication) reflects the views only of the author, and the Commission cannot be held responsible for any use which may be made of the information contained therein.
15
Perceptions of working with older people
There is a difference between attitudes towards ageing and older people and perceptions of
working with older people. Where attitudes towards ageing may be positive this may not
translate into positive ideals or indeed attitudes towards caring for older people (McKinley &
Cowan 2006). In the past, it was assumed that positive attitudes towards older people
translated into intention to work with older people. However researchers have challenged
that assumption (Lui, Norman & While 2013, Boswell 2012) and yet there is little reliable
research on perceptions of working with older people (Walther 2007).
Mason & Sanders (2004) conducted a study with social work students (n=22), working in
older adult placement, to explore their attitudes to working with older people by means of
open ended questions and face to face interviews. Students provided both positive and
negative feelings about working with older people. Positive aspects were: learning from the
older people, being appreciated, and feeling more competent. The most frequently cited
negative aspect was that older people died and these students did not feel adequately
prepared to deal with this loss. The study raised implications for student’s preparation to
work in older people settings. It needs to be acknowledged that due to their advancing
years older people are more likely to die than other client groups and therefore students
need to be prepared to deal with this loss. While the sample size in this study was small
and the process of interviewing did not guarantee anonymity, the authors reported that
several students felt appalled by the inequality they perceived against the older population
and this made them more inclined to work with older people when they graduated. These
findings are consistent with those of other studies (Bambusch et al. 2012, Guteil et al. 2009,
Golcalves 2009), that highlight the need for educational curricula that adequately prepare
students for working with older people.
Kydd & Wild (2013), reported on a study that investigated healthcare professionals attitudes
towards working with older people, in 1999 and 2009. These researchers used a
multifactorial questionnaire (MAQ) based on 5 identified themes: Ageism; learning
environment; working environment; professional esteem and specialist status.
Questionnaires were returned from 376 professional healthcare staff in 1999 and 546 staff
in 2009 respectively. In exploring differences between the two data sets, the authors found
that there was little significant difference between the two time periods; with both sets of

ATTITUDES TO OLDER PEOPLE AND PERCEPTIONS OF WORKING WITH OLDER PEOPLE OF
STUDENTS OF HEALTH AND SOCIAL CARE
This project has been funded with support from the Lifelong Learning Programme of the European Commission.
This publication (communication) reflects the views only of the author, and the Commission cannot be held responsible for any use which may be made of the information contained therein.
16
respondents being enthusiastic about working with and having positive attitudes about older
people. While there were negative views about working conditions and professional esteem
working with older people, a significant percentage (64%) of participants stated they had
chosen or would consider a career in gerontology. Limitations of the study were that two
different cohorts of participants were used for the two studies and the term ‘older’ was not
defined and may have been open to interpretation. However what is significant about this
study is that while there were some changes in beliefs about the way care occurred, staff
still expressed the view that care of older adults took place in less desirable working
environments and did not offer the opportunity of career advancement. This has
implications for those wishing to attract staff to these areas of care and also for policy
makers who clearly have the problem of ensuring there are enough carers in the future for
this aging population. This study’s findings are similar to those of Brown et al, 2008 and
Stevens (2011).
In a replication of previous studies by Stevens (1995) and Happell (2002), Stevens (2011)
using a survey questionnaire and a non-probability sample of undergraduate Bachelor of
Nursing students, explored the career choices of nursing students and the reasons they
choose certain career paths. This study was conducted over three years. The findings
confirmed the previous results (Stevens 1995, Happel 2002), and showed that student
nurses desire to work with older people decreased over time and was usually ranked last as
a career choice. Students felt that working with older people would impact negatively on
their career and that they would get little or no clinical experience in these care
environments. Students as in the previous two studies rated working in highly technical care
areas highest in their preference lists. Stevens (2011), suggests that students at the end of
a three year Bachelor of Nursing degree have a strong preference for working in highly
‘technical’ areas such as ICU and theatre and low preference for working in less technical
more ‘hands on’ areas such as care of the older person. Interestingly, this study showed
that the more days the students spent on practice the lower they ranked working with older
people. This seems to suggest as also highlighted by Kydd & Wild (2013) that work
environments where the students were placed were not rewarding environments and led to
the negative perceptions. Nursing students did not regard working with older people as
important. The researchers suggested that this may be due to factors in their training that
predispose them to view working with older people as lower status work. A further finding of
this study was that while the student’s perceptions of caring for older people were not

ATTITUDES TO OLDER PEOPLE AND PERCEPTIONS OF WORKING WITH OLDER PEOPLE OF
STUDENTS OF HEALTH AND SOCIAL CARE
This project has been funded with support from the Lifelong Learning Programme of the European Commission.
This publication (communication) reflects the views only of the author, and the Commission cannot be held responsible for any use which may be made of the information contained therein.
17
initially negative, working in poorly resourced care environments increased their negative
attitudes. The findings of this study have implications for the way curricula are developed
and for the way student clinical placements occur and are monitored.
In summary, negative views about working with older people, appear to stem from little or
no clinical experience with older people, a perception of less desirable working environments
and the lack of opportunity for career advancement (Kydd & Wild, 2013; Stevens, 2011;
Brown et al, 2008; Mason & Sanders, 2004).
Conclusion
This literature review highlights some important issues that are relevant to researchers,
curriculum developers and policy makers. Overall, student’s attitudes to ageing and
perceptions of working with older people show a mixed picture. The literature supports the
view that students that who held more positive views of older people also expressed an
interest in working with them. Initiatives such as experiential learning and engaging
students in research related to older people appear to have positive effects on attitude and
intention to work with older people. Work environments that were not supportive and that
did not demonstrate desirability in working with older people impacted on the attitudes of
students during clinical placements.
Attitudes to ageing and lack of interest in working with older people not only diminishes the
numbers of people working with this population but it also may affect the quality of care
older people receive. Failure by curricula or faculty members when teaching students, to
address myths or stereotypes about ageing may hamper student’s ability to deal with
practice situations and further increase their ageing bias. Research has shown that there is
a need for education to address aging and aging issues. According to Berner (2012/2010)
and Remmers & Walter (2013) to change attitudes towards ageing, the underlying
structures need modifications. Increased life expectancy has led to a global social challenge
and also a challenge to provide healthcare professionals with both knowledge and skills that
meet the needs of this growing demographic.
As the population continues to age there is an increased need for professionals to work in
the older adult healthcare sector. It is incumbent on researchers to explore the issues
highlighted in this literature review. While the views of nurses and nursing students have
been well researched, there remains a gap in research in relation to the views and
perceptions of students from other health and social care disciplines. This is particularly
ATTITUDES TO OLDER PEOPLE AND PERCEPTIONS OF WORKING WITH OLDER PEOPLE OF
STUDENTS OF HEALTH AND SOCIAL CARE
This project has been funded with support from the Lifelong Learning Programme of the European Commission.
This publication (communication) reflects the views only of the author, and the Commission cannot be held responsible for any use which may be made of the information contained therein.
18
important as an increased emphasis is placed on multidisciplinary and interdisciplinary
working and the view that beliefs and values held by students become the basis for their
future professional practice.
The following chapter outlines the research methodology for a survey of health and social
care student’s attitudes to older people and perceptions of working with older people in five
European countries.
Methodology
Aim
The aim of this study was to measure the attitudes of health and social care students to
older people and their perceptions of working with older people.
Research Design
The methodological approach used in this study was quantitative descriptive and
correlational. Ethical approval was granted by individual ethics committees in each of the
partner countries. Questionnaires were translated by each country and administered by the
partner organisations.
Sample
A convenience sample of 160+ students, representative of health and social care
professions (nursing, medicine, occupational therapy, physiotherapy, social work, dentistry),
in one University or Institute of Higher Education in each country were invited to complete a
survey including two questionnaires: A total of 955 questionnaires were collected.
Inclusion Criteria
We included undergraduate students of health and social care in their final year of study
accessible to the researchers in each country. This was to ensure that the students had
already gained experience of working with older people during their clinical placements.
Exclusion Criteria
Students of health and social care other than those in their final year of training or study.
ATTITUDES TO OLDER PEOPLE AND PERCEPTIONS OF WORKING WITH OLDER PEOPLE OF
STUDENTS OF HEALTH AND SOCIAL CARE
This project has been funded with support from the Lifelong Learning Programme of the European Commission.
This publication (communication) reflects the views only of the author, and the Commission cannot be held responsible for any use which may be made of the information contained therein.
19
Study Instruments
Demographic questionnaire: This instrument was researcher developed and collected
data on country, student group, gender, age, and level of education (Appendix 1).
Kogan’s Attitudes towards Older People Scale, (KOPS) (Kogan1966) (Appendix 2).
The KOPS is a 34 attitudinal item Likert type scale with 17 matched positive and negative
statements. Six non related items are interspersed throughout the KOPS to reduce
participant’s set-bias response. It assesses attitudes towards older people towards normal
and individual differences, stereotypes and misconceptions. Scale scores range from 34 to
204. A higher score indicate a more positive attitude towards older people. The categories
were scored 1-7 respectively with a score of 4 assigned to failure to respond to an item. A
score of 102 was considered a neutral attitude towards the older person (Kearney et al.,
2000). Kogan investigated the scale reliability and reported Spearman-Brown reliability
coefficients which ranged from 0.69 for the negative and 0.84 for the positive (n=125) and
inter scale items correlated ranged from 0.46 to 0.52 (Kogan, 1961). The scale has been
shown to be reliable when used with healthcare professionals (Soderhamn et al., 2001).
Students Perception of Working with Older people (revised) (Nolan et al, 2006)
(Appendix 3).
This is a 15 item questionnaire developed by Nolan et al, (2006) in the UK following
qualitative research with student nurses covering three broad areas: student nurses’
perceptions of working with older people in general; their intentions to work with older
people when they qualified; and the perceived consequences of working with older people in
terms of future career prospects and job satisfaction. The questionnaire was revised with
permission from the authors for application to research with students of other professions.
For each statement such as ‘nursing older people is challenging and stimulating’, students
indicate their agreement on a five point Likert scale from strongly agree to strongly
disagree. In addition to the structured items the questionnaires contained space for further
comment and a range of demographic and other data including age, gender and ethnicity,
as well as qualifications. The questionnaire also contains sections to record students’
experience of working with older people prior to starting their training / education and
whether they currently worked with older people outside of their clinical placements. Details
ATTITUDES TO OLDER PEOPLE AND PERCEPTIONS OF WORKING WITH OLDER PEOPLE OF
STUDENTS OF HEALTH AND SOCIAL CARE
This project has been funded with support from the Lifelong Learning Programme of the European Commission.
This publication (communication) reflects the views only of the author, and the Commission cannot be held responsible for any use which may be made of the information contained therein.
20
of the type of work that they had undertaken and whether they found this a positive or
negative experience are also included. For additional statistical analysis the questions on the
scale were divided into sections (subscales) General Perception of working with older
people; Disposition to working with older people and Perceived Consequences of working
with older people.
With the exception of Ireland these scales were translated and back translated by each
country into their language using guidance from the cross-cultural adaptation process of
Beaton and Guillemin (2000).
Ethical approval
Ethical approval was granted by the research ethics committees for each country as above.
Participants were provided with an information leaflet outlining the study aims and
objectives and consent was implied by completion of the questionnaires. Participants were
not required to provide any identification therefore anonymity was maintained. The
researchers are aware of the ethical, legal and regulatory requirements for
research, therefore this research conforms to the provisions of the declaration of Helsinki in
1995 (as revised in Edinburgh 2000).
Access to sample and Data Collection
Permission to access students was obtained from the relevant persons in each university in
the partner countries. Questionnaires were distributed over a period of 6 months from
January – August 2014 and collected by the researchers in each country.
Data Analysis
All data were entered into a data base using Predictive Analytics SoftWare (PASW) version
18 for analysis and collated by a statistician in the lead country.
The sample consisted of 955 respondents, from nursing, medical, physiotherapy,
occupational therapy, social work, dietician, and dental student background. This was
comprised of 421 nursing, 106 medical, 120 physiotherapy, 73 Occupational therapy, 96
social work, 14 dietician and 28 dental students. A further 58 students stated they were in
‘another’ category of student group e.g. speech and language therapy.
Results are presented in next section.
ATTITUDES TO OLDER PEOPLE AND PERCEPTIONS OF WORKING WITH OLDER PEOPLE OF
STUDENTS OF HEALTH AND SOCIAL CARE
This project has been funded with support from the Lifelong Learning Programme of the European Commission.
This publication (communication) reflects the views only of the author, and the Commission cannot be held responsible for any use which may be made of the information contained therein.
21
Results
Demographics
A total of 955 respondents from five countries completed the questionnaires. Respondents
were from nursing, medical, physiotherapy, occupational therapy, social work, dietician,
dental student backgrounds. Additionally there was a group variable ‘other’ to allow for any
student category outside of those named above (See figure 1).
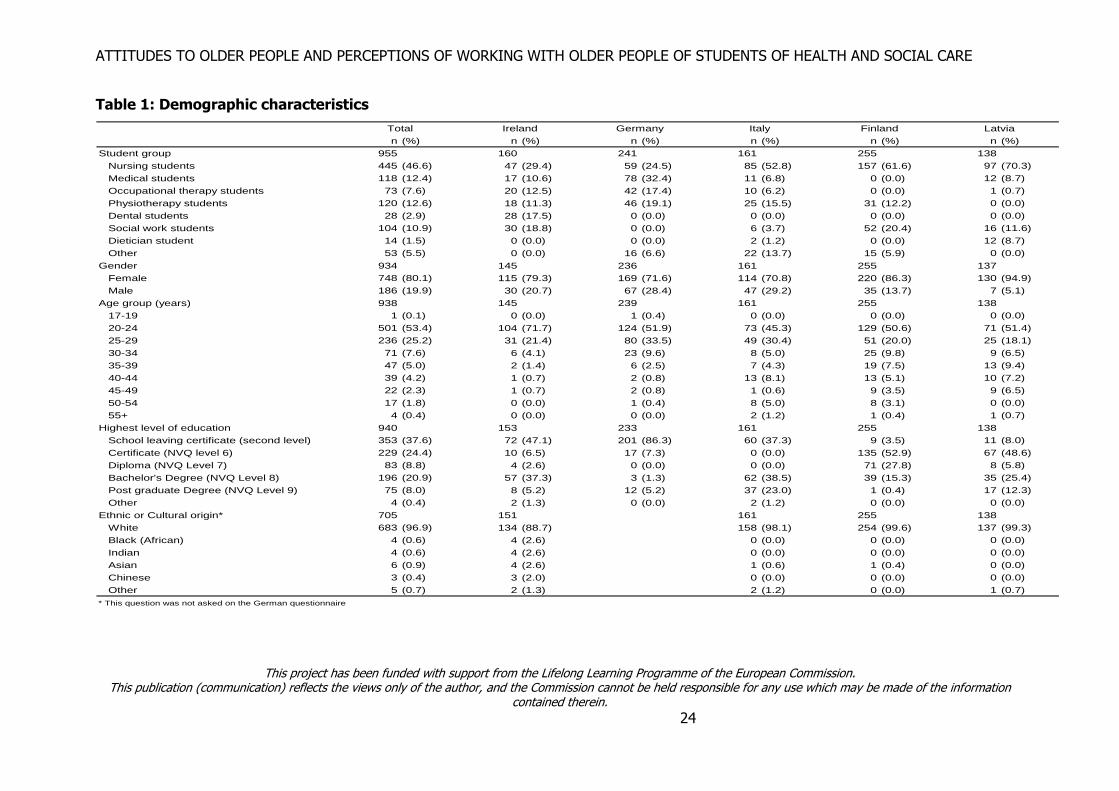
Student Group
Questionnaires were predominantly completed by nursing students (n=445). With most
respondents from Finland (n=157) and least amount (n=47) from Ireland. Dietician students
accounted for the least amount number of respondents to the questionnaire (n=14) ; Italy
(n=2) respondents and Latvia (n=12). Dietician student’s respondents were not represented
in other countries. 12.4% of respondents were medical students. The majority of medical
students respondents (n=78) were from Germany, while Finland had none. Most
occupational therapy students (n=73) were also from Germany, while Finland has no
students representing this group.
Physiotherapy students made up 12.6% of the total respondents. Germany having most
respondents (n=46) followed by Finland (n=31), Italy (n=25) and Ireland (n=18). Latvia
had no response from physiotherapy students. A total of 28 dental students completed the
survey and all were from Ireland. Total response from social work students was (n=101)
with representation in all countries with the exception of Germany. Most social work student
respondents were from Finland (n=52), followed by Ireland (n=30), Latvia (n=16), Italy
(n=6) with none from German. A number of respondents responded as ‘other’ (n=53).
Ireland these respondents were from Italy had (n=22), Germany (n=16), and Finland
(n=15).
Gender
Most of the respondents were female (n=748). With regard to country; Most female
respondents were from Finland (n=220) and most males were from Germany (n=67).

ATTITUDES TO OLDER PEOPLE AND PERCEPTIONS OF WORKING WITH OLDER PEOPLE OF
STUDENTS OF HEALTH AND SOCIAL CARE
This project has been funded with support from the Lifelong Learning Programme of the European Commission.
This publication (communication) reflects the views only of the author, and the Commission cannot be held responsible for any use which may be made of the information contained therein.
22
Age Group
The majority of respondents were aged between 20 and 24 years (n=501), closely followed
by the 35-39 year age group (n=236). Only four respondents represented the 55+ age
group representing Italy (n=2), Finland (n=1) and Latvia (n=1).
Level of Education
Second level education was the most common highest level of education among the
respondents in the total sample (37.6%). Second level education accounted for 86.3% of
respondents in Germany while it only represented 3.5% in Finland. In Finland the highest
level of education was Certificate (NVQ Level 7) (28%). However in interpretation of these
results consideration is given to differences in education systems and diversity in
understandings of levels of education between countries.
Ethnic or Culture Origin
The vast majority of respondents (96.9%) were of white ethnicity. Detailed demographic
characteristics are represented in Table 1.
Figure 1: Number of Respondents from each country
138
160
161
241
255
955
0 100 200 300 400 500 600 700 800 900 1,000
Count
Latvia
Ireland
Italy
Germany
Finland
Overall
Number of respondents

ATTITUDES TO OLDER PEOPLE AND PERCEPTIONS OF WORKING WITH OLDER PEOPLE OF STUDENTS OF HEALTH AND SOCIAL CARE
This project has been funded with support from the Lifelong Learning Programme of the European Commission.
This publication (communication) reflects the views only of the author, and the Commission cannot be held responsible for any use which may be made of the information contained therein.
23
ATTITUDES TO OLDER PEOPLE AND PERCEPTIONS OF WORKING WITH OLDER PEOPLE OF STUDENTS OF HEALTH AND SOCIAL CARE
This project has been funded with support from the Lifelong Learning Programme of the European Commission.
This publication (communication) reflects the views only of the author, and the Commission cannot be held responsible for any use which may be made of the information contained therein.
24
Table 1: Demographic characteristics
n (%) n (%) n (%) n (%) n (%) n (%)
Student group 955 160 241 161 255 138
Nursing students 445 (46.6) 47 (29.4) 59 (24.5) 85 (52.8) 157 (61.6) 97 (70.3)
Medical students 118 (12.4) 17 (10.6) 78 (32.4) 11 (6.8) 0 (0.0) 12 (8.7)
Occupational therapy students 73 (7.6) 20 (12.5) 42 (17.4) 10 (6.2) 0 (0.0) 1 (0.7)
Physiotherapy students 120 (12.6) 18 (11.3) 46 (19.1) 25 (15.5) 31 (12.2) 0 (0.0)
Dental students 28 (2.9) 28 (17.5) 0 (0.0) 0 (0.0) 0 (0.0) 0 (0.0)
Social work students 104 (10.9) 30 (18.8) 0 (0.0) 6 (3.7) 52 (20.4) 16 (11.6)
Dietician student 14 (1.5) 0 (0.0) 0 (0.0) 2 (1.2) 0 (0.0) 12 (8.7)
Other 53 (5.5) 0 (0.0) 16 (6.6) 22 (13.7) 15 (5.9) 0 (0.0)
Gender 934 145 236 161 255 137
Female 748 (80.1) 115 (79.3) 169 (71.6) 114 (70.8) 220 (86.3) 130 (94.9)
Male 186 (19.9) 30 (20.7) 67 (28.4) 47 (29.2) 35 (13.7) 7 (5.1)
Age group (years) 938 145 239 161 255 138
17-19 1 (0.1) 0 (0.0) 1 (0.4) 0 (0.0) 0 (0.0) 0 (0.0)
20-24 501 (53.4) 104 (71.7) 124 (51.9) 73 (45.3) 129 (50.6) 71 (51.4)
25-29 236 (25.2) 31 (21.4) 80 (33.5) 49 (30.4) 51 (20.0) 25 (18.1)
30-34 71 (7.6) 6 (4.1) 23 (9.6) 8 (5.0) 25 (9.8) 9 (6.5)
35-39 47 (5.0) 2 (1.4) 6 (2.5) 7 (4.3) 19 (7.5) 13 (9.4)
40-44 39 (4.2) 1 (0.7) 2 (0.8) 13 (8.1) 13 (5.1) 10 (7.2)
45-49 22 (2.3) 1 (0.7) 2 (0.8) 1 (0.6) 9 (3.5) 9 (6.5)
50-54 17 (1.8) 0 (0.0) 1 (0.4) 8 (5.0) 8 (3.1) 0 (0.0)
55+ 4 (0.4) 0 (0.0) 0 (0.0) 2 (1.2) 1 (0.4) 1 (0.7)
Highest level of education 940 153 233 161 255 138
School leaving certificate (second level) 353 (37.6) 72 (47.1) 201 (86.3) 60 (37.3) 9 (3.5) 11 (8.0)
Certificate (NVQ level 6) 229 (24.4) 10 (6.5) 17 (7.3) 0 (0.0) 135 (52.9) 67 (48.6)
Diploma (NVQ Level 7) 83 (8.8) 4 (2.6) 0 (0.0) 0 (0.0) 71 (27.8) 8 (5.8)
Bachelor's Degree (NVQ Level 8) 196 (20.9) 57 (37.3) 3 (1.3) 62 (38.5) 39 (15.3) 35 (25.4)
Post graduate Degree (NVQ Level 9) 75 (8.0) 8 (5.2) 12 (5.2) 37 (23.0) 1 (0.4) 17 (12.3)
Other 4 (0.4) 2 (1.3) 0 (0.0) 2 (1.2) 0 (0.0) 0 (0.0)
Ethnic or Cultural origin* 705 151 161 255 138
White 683 (96.9) 134 (88.7) 158 (98.1) 254 (99.6) 137 (99.3)
Black (African) 4 (0.6) 4 (2.6) 0 (0.0) 0 (0.0) 0 (0.0)
Indian 4 (0.6) 4 (2.6) 0 (0.0) 0 (0.0) 0 (0.0)
Asian 6 (0.9) 4 (2.6) 1 (0.6) 1 (0.4) 0 (0.0)
Chinese 3 (0.4) 3 (2.0) 0 (0.0) 0 (0.0) 0 (0.0)
Other 5 (0.7) 2 (1.3) 2 (1.2) 0 (0.0) 1 (0.7)
* This question was not asked on the German questionnaire
Total Ireland Germany Italy Finland Latvia

ATTITUDES TO OLDER PEOPLE AND PERCEPTIONS OF WORKING WITH OLDER PEOPLE OF
STUDENTS OF HEALTH AND SOCIAL CARE
This project has been funded with support from the Lifelong Learning Programme of the European Commission.
This publication (communication) reflects the views only of the author, and the Commission cannot be held responsible for any use which may be made of the information contained therein.
25
Experience of Working with Older People
Four separate questions were related to the respondent’s experience of working with older
people. Two related to past experience and one to current experience and their perceptions
of this experience (positive or negative).
Students experience prior to commencing education programme.
Detailed response to this question by country is represented in Table 2. Most respondents
reported that they had their experience within their families e.g. visiting grandparents (74%)
and caring for older family members (43%). Only 5% of respondent’s stated they had no
previous experience with older people. A number had past experience of working with older
people in hospitals (23%) and in residential homes (23%). Comparing countries; 49% of
respondents from Italy stated that they gained their experience through school work
experience, while only 4% of respondents from Finland stated they had similar experience.
Caring for older people in their own home proved to be more popular among the
respondents from Finland (25.9%) and Italy (36%). Respondents from Ireland (30%)
gained most experience of working with older people through voluntary work. In general
working as support worker was established as having the fewest number of respondents
(3%) (see table 2).
Table 2. Experience of working with older people before educational programme
n (%) n (%) n (%) n (%) n (%) n (%)
Visiting Grandparents** 702 (74.4) 105 (68.6) 171 (72.2) 145 (90.1) 206 (80.8) 75 (54.3)
Caring for older family members 409 (43.3) 79 (51.6) 57 (24.1) 110 (68.3) 94 (36.9) 69 (50.0)
Working in Hospital 222 (23.5) 20 (13.1) 62 (26.2) 82 (50.9) 54 (21.2) 4 (2.9)
Working in residential home 220 (23.3) 33 (21.6) 34 (14.3) 44 (27.3) 83 (32.5) 26 (18.8)
School work experience 192 (20.3) 32 (20.9) 58 (24.5) 79 (49.1) 11 (4.3) 12 (8.7)
Working with people in their own homes 185 (19.6) 22 (14.4) 27 (11.4) 58 (36.0) 66 (25.9) 12 (8.7)
Voluntary work 145 (15.4) 47 (30.7) 18 (7.6) 54 (33.5) 16 (6.3) 10 (7.2)
Working in daycare centre 72 (7.6) 12 (7.8) 7 (3.0) 24 (14.9) 24 (9.4) 5 (3.6)
Working as a support worker 31 (3.3) 3 (2.0) 16 (6.8) 2 (1.2) 8 (3.1) 2 (1.4)
I have no experience 51 (5.4) 12 (7.8) 14 (5.9) 2 (1.2) 12 (4.7) 11 (8.0)
Total (n=944) Ireland (n=153) Germany (n=237) Italy (n=161) Finland (n=255) Latvia (n=138)
ATTITUDES TO OLDER PEOPLE AND PERCEPTIONS OF WORKING WITH OLDER PEOPLE OF
STUDENTS OF HEALTH AND SOCIAL CARE
This project has been funded with support from the Lifelong Learning Programme of the European Commission.
This publication (communication) reflects the views only of the author, and the Commission cannot be held responsible for any use which may be made of the information contained therein.
26
Students Perceptions of their experience with older people
From the totality of respondents that had past experience of working with older people prior
to profession education, perceptions of this experience were predominantly ‘quite a positive
experience’ (n=176), and 147 participants declared that their experience was ‘a very
positive experience’. Country comparisons show that 45% were from Finland, 44% from
Germany 34% from Ireland, 25% from Latvia and 28% from Italy. Only 3.9% of the total
sample perceived working with older people prior to professional education as ‘quite a
negative experience’ and none deemed their experience of working with older people prior
to professional education as ‘a very negative experience’.
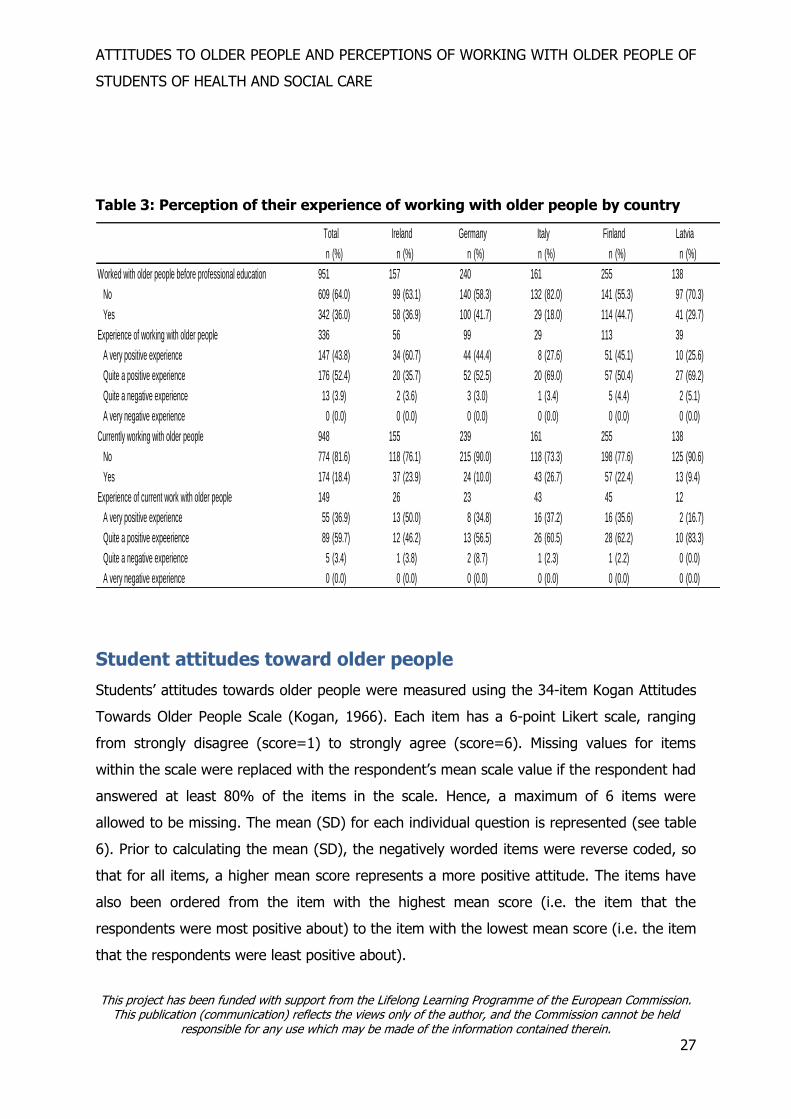
Experience of students currently working with older people
Of the total sample 174 were currently working with older people. Most of these
respondents were from Finland (n=57) and least from Latvia (n=13). Similar to respondents
that had worked with older people prior to professional education, the most common
perception of respondents currently working with older people (59%) was that it was ‘quite
a positive experience. Italy (n=16) and Finland (n=16) participants stated that their
experience was ‘a very positive experience’. With respondents from Ireland (n=12),
Germany (n=13), Italy (n=26), Finland (n=28) and Latvia (n=10) reporting that their
perception of working with older people was ‘quite a positive experience’. Only five
respondents reported their experience to be ‘quite a negative experience’.
Student’s perception of their experience of working with older people by country is detailed
in Table 3.
ATTITUDES TO OLDER PEOPLE AND PERCEPTIONS OF WORKING WITH OLDER PEOPLE OF
STUDENTS OF HEALTH AND SOCIAL CARE
This project has been funded with support from the Lifelong Learning Programme of the European Commission.
This publication (communication) reflects the views only of the author, and the Commission cannot be held responsible for any use which may be made of the information contained therein.
27
Table 3: Perception of their experience of working with older people by country
n (%) n (%) n (%) n (%) n (%) n (%)
Worked with older people before professional education 951 157 240 161 255 138
No 609 (64.0) 99 (63.1) 140 (58.3) 132 (82.0) 141 (55.3) 97 (70.3)
Yes 342 (36.0) 58 (36.9) 100 (41.7) 29 (18.0) 114 (44.7) 41 (29.7)
Experience of working with older people 336 56 99 29 113 39
A very positive experience 147 (43.8) 34 (60.7) 44 (44.4) 8 (27.6) 51 (45.1) 10 (25.6)
Quite a positive experience 176 (52.4) 20 (35.7) 52 (52.5) 20 (69.0) 57 (50.4) 27 (69.2)
Quite a negative experience 13 (3.9) 2 (3.6) 3 (3.0) 1 (3.4) 5 (4.4) 2 (5.1)
A very negative experience 0 (0.0) 0 (0.0) 0 (0.0) 0 (0.0) 0 (0.0) 0 (0.0)
Currently working with older people 948 155 239 161 255 138
No 774 (81.6) 118 (76.1) 215 (90.0) 118 (73.3) 198 (77.6) 125 (90.6)
Yes 174 (18.4) 37 (23.9) 24 (10.0) 43 (26.7) 57 (22.4) 13 (9.4)
Experience of current work with older people 149 26 23 43 45 12
A very positive experience 55 (36.9) 13 (50.0) 8 (34.8) 16 (37.2) 16 (35.6) 2 (16.7)
Quite a positive expeerience 89 (59.7) 12 (46.2) 13 (56.5) 26 (60.5) 28 (62.2) 10 (83.3)
Quite a negative experience 5 (3.4) 1 (3.8) 2 (8.7) 1 (2.3) 1 (2.2) 0 (0.0)
A very negative experience 0 (0.0) 0 (0.0) 0 (0.0) 0 (0.0) 0 (0.0) 0 (0.0)
Total Ireland Germany Italy Finland Latvia
Student attitudes toward older people
Students’ attitudes towards older people were measured using the 34-item Kogan Attitudes
Towards Older People Scale (Kogan, 1966). Each item has a 6-point Likert scale, ranging
from strongly disagree (score=1) to strongly agree (score=6). Missing values for items
within the scale were replaced with the respondent’s mean scale value if the respondent had
answered at least 80% of the items in the scale. Hence, a maximum of 6 items were
allowed to be missing. The mean (SD) for each individual question is represented (see table
6). Prior to calculating the mean (SD), the negatively worded items were reverse coded, so
that for all items, a higher mean score represents a more positive attitude. The items have
also been ordered from the item with the highest mean score (i.e. the item that the
respondents were most positive about) to the item with the lowest mean score (i.e. the item
that the respondents were least positive about).
ATTITUDES TO OLDER PEOPLE AND PERCEPTIONS OF WORKING WITH OLDER PEOPLE OF
STUDENTS OF HEALTH AND SOCIAL CARE
This project has been funded with support from the Lifelong Learning Programme of the European Commission.
This publication (communication) reflects the views only of the author, and the Commission cannot be held responsible for any use which may be made of the information contained therein.
28
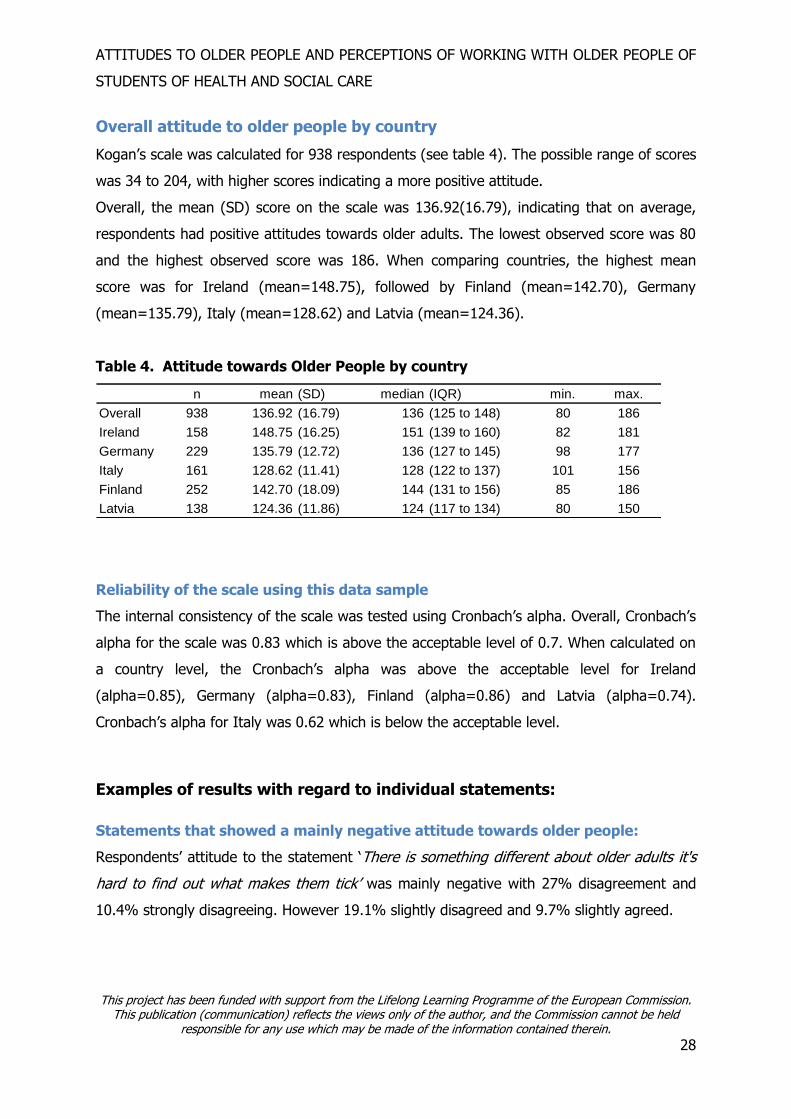
Overall attitude to older people by country
Kogan’s scale was calculated for 938 respondents (see table 4). The possible range of scores
was 34 to 204, with higher scores indicating a more positive attitude.
Overall, the mean (SD) score on the scale was 136.92(16.79), indicating that on average,
respondents had positive attitudes towards older adults. The lowest observed score was 80
and the highest observed score was 186. When comparing countries, the highest mean
score was for Ireland (mean=148.75), followed by Finland (mean=142.70), Germany
(mean=135.79), Italy (mean=128.62) and Latvia (mean=124.36).
Table 4. Attitude towards Older People by country
n mean (SD) median (IQR) min. max.
Overall 938 136.92 (16.79) 136 (125 to 148) 80 186
Ireland 158 148.75 (16.25) 151 (139 to 160) 82 181
Germany 229 135.79 (12.72) 136 (127 to 145) 98 177
Italy 161 128.62 (11.41) 128 (122 to 137) 101 156
Finland 252 142.70 (18.09) 144 (131 to 156) 85 186
Latvia 138 124.36 (11.86) 124 (117 to 134) 80 150
Reliability of the scale using this data sample
The internal consistency of the scale was tested using Cronbach’s alpha. Overall, Cronbach’s
alpha for the scale was 0.83 which is above the acceptable level of 0.7. When calculated on
a country level, the Cronbach’s alpha was above the acceptable level for Ireland
(alpha=0.85), Germany (alpha=0.83), Finland (alpha=0.86) and Latvia (alpha=0.74).
Cronbach’s alpha for Italy was 0.62 which is below the acceptable level.
Examples of results with regard to individual statements:
Statements that showed a mainly negative attitude towards older people:
Respondents’ attitude to the statement ‘There is something different about older adults it's
hard to find out what makes them tick’ was mainly negative with 27% disagreement and
10.4% strongly disagreeing. However 19.1% slightly disagreed and 9.7% slightly agreed.
ATTITUDES TO OLDER PEOPLE AND PERCEPTIONS OF WORKING WITH OLDER PEOPLE OF
STUDENTS OF HEALTH AND SOCIAL CARE
This project has been funded with support from the Lifelong Learning Programme of the European Commission.
This publication (communication) reflects the views only of the author, and the Commission cannot be held responsible for any use which may be made of the information contained therein.
29
Respondents depict a more negative attitude towards older adults in this statement. ‘Most
older adults get set in their ways and are unable to change’ 30% slightly agreed; 18%
agreed and 2.8% strongly agreed.
Statements that showed a mainly positive attitude towards older people:
In general respondents disagreed (28.8%) or strongly disagreed (14.2%) with the
statement ‘It would probably be better if older adults lived in residential units with people
their own age’. Nevertheless 18.7% slightly agreed and 2.7% strongly agreed.
Overall respondents largely disagreed 26.6% (disagree), 32% (slightly disagree) and 13.8%
strongly disagree) with the statement that ‘most older adults would prefer to quit work as
soon as pensions or their children can support them’).
A considerable amount of respondents did not think that ‘most older adults tend to let their
homes become shabby and unattractive’.
Largely respondents (n=618) opposed the statement ‘it is foolish to claim wisdom comes
with age’. (25%) slightly disagreeing, (30%) disagreeing and (10.6%) strongly disagreeing
The greater amount of respondents did not think that ‘older adults have too much power in
business and politics’, with (31.3%) disagreeing with this statement and (9.7%) agreeing.
The majority of respondents disagreed with this statement ‘most older adults make one feel
ill at ease’. With only (4.4%) strongly agreeing in comparison with (27.8%) strongly
disagreeing.
Statements that showed a mainly mixed attitude towards older people:
Respondents disagreed (i.e. 11.7% strongly disagreed, 33.6% disagreed and 28.5% slightly
disagreed) with the statement that ‘Most older adults spend too much time prying into the
affairs of others and giving unsought advice’. However 16.9% slightly agreed and 7.9%
were in agreement and 1.7% strongly agreed with the statement.
Although (59.3%) of respondents disagreed with the statement ‘in order to maintain a nice
residential neighbourhood, it would be best if too many older adults did not live in it’,
(29.4%) were neither agreeing nor disagreeing. (17.8%) slightly disagreed and (9.7%)
slightly agreed. While only (13.2%) agreed with this statement.

ATTITUDES TO OLDER PEOPLE AND PERCEPTIONS OF WORKING WITH OLDER PEOPLE OF
STUDENTS OF HEALTH AND SOCIAL CARE
This project has been funded with support from the Lifelong Learning Programme of the European Commission.
This publication (communication) reflects the views only of the author, and the Commission cannot be held responsible for any use which may be made of the information contained therein.
30
In addition, respondents could neither agree nor disagree with the statement ‘there are a
few exceptions, but in general older adults are pretty much alike’. While (n=318) disagreed
(n=169) strongly disagreed. A minute (1.3%) strongly agreed that older adults are much
alike.
A sizeable number of respondents (n=464) could not come to an agreement on whether ‘it
would probably be better if older adults lived in residential units with younger people’ .
Almost half (48.5%) of respondents firmly agreed that ‘most older adults would prefer to
continue working as long as they possibly can rather than be dependent on anybody’ but
43.2% neither agreed or disagreed.
Relationships between student demographic and attitudes to older people
Gender and attitude
An independent-samples t-test was run to determine if there were differences in attitudes to
ageing between males and females. Females had more positive attitudes (mean
(SD):137.76(17.28), n=737) than males (mean(SD): 132.62(13.76), n=183), a statistically
significant difference of 5.13(95% CI: 2.44 to 7.83), p<0.001. Due to the presence of
outliers, the non-parametric Mann-Whitney U test was also performed and the conclusions
remained unchanged (p<0.001).
Age group and attitude
There was no statistically significant relationship between age group and attitude (p=0.257
from one-way ANOVA). Due to the presence of outliers, the non-parametric Kruskal-Wallis
test was also performed and the conclusions remained unchanged (p=0.190).
(Note: For the analysis, age group was combined into three categories: 17-24 years; 25-29
years; 30+ years).
Student group and attitude
A one-way ANOVA was run to determine if attitudes differed between student groups.
Dental students had the most positive attitude (mean(SD): 149.27(16.41), n=28), followed
by Social work students (mean(SD): 145.30(16.57), n=104), Occupational therapy students
ATTITUDES TO OLDER PEOPLE AND PERCEPTIONS OF WORKING WITH OLDER PEOPLE OF
STUDENTS OF HEALTH AND SOCIAL CARE
This project has been funded with support from the Lifelong Learning Programme of the European Commission.
This publication (communication) reflects the views only of the author, and the Commission cannot be held responsible for any use which may be made of the information contained therein.
31
(mean(SD): 139.39(17.52), n=70), Physiotherapy students (mean(SD): 135.58(14.10),
n=119), Nursing students (mean(SD): 135.55(17.25), n=437), Other students (mean(SD):
134.72(14.20), n=53), Medical students (mean(SD): 133.69(15.45), n=113), and Dietician
students (mean(SD):126.00(8.47), n=14). The difference between groups was
statistically significant (p<0.001). Post-hoc pairwise comparisons using Tukey’s HSD
indicated that the mean scores for Dental and Social work students was significantly
different from all other student groups except for Occupational Therapy. Due to the
presence of outliers, the non-parametric Kruskal-Wallis test was also performed and the
conclusions remained unchanged (p<0.001).
Highest level of education attained and attitude
Students with a Diploma had the most positive attitude (mean(SD): 141.06(19.07), n=82),
followed by students with a Bachelor`s Degree (mean(SD): 137.47(17.55), n=196),
students with a Certificate (mean(SD): 136.75(18.26), n=226), students with Second level
(mean(SD): 136.32(14.65), n=341) and students with a Post-graduate Degree (mean(SD):
131.47(15.05), n=75). The difference between groups was statistically significant
(p=0.009). Post-hoc pairwise comparisons using Tukey’s HSD indicated that the only
significant difference was between students with a Diploma and students with a Post-
graduate Degree (p=0.003). Due to the presence of outliers, the non-parametric Kruskal-
Wallis test was also performed and the conclusions remained unchanged (p=0.002).
Note: For the analysis, who answered “Fetac level 5” (n=2) are coded as 1 (“school leaving
certificate”). Also, the remaining who answered “other” (n=2) but did not give any
information are excluded from this analysis.
Relationship between past experience (yes/no) of working with older people and
attitude
An independent-samples t-test was run to determine if there were differences in attitudes to
ageing between students who had past experience of working with older people and
students who did not have that experience. Students with past experience had more positive
attitudes (mean (SD):139.06(17.98), n=337) than students who did not (mean(SD):

ATTITUDES TO OLDER PEOPLE AND PERCEPTIONS OF WORKING WITH OLDER PEOPLE OF
STUDENTS OF HEALTH AND SOCIAL CARE
This project has been funded with support from the Lifelong Learning Programme of the European Commission.
This publication (communication) reflects the views only of the author, and the Commission cannot be held responsible for any use which may be made of the information contained therein.
32
135.68(15.94), n=599), a statistically significant difference of 3.38(95% CI: 1.15 to
5.61), p=0.003. Due to the presence of outliers, the non-parametric Mann-Whitney U test
was also performed and the conclusions remained unchanged (p=0.003).
Relationship between past experience of working with older people and attitude
An one-way ANOVA was run to determine if attitudes depended on students past experience
of working with older adults. Students who had a “very positive experience” had the most
positive attitude (mean(SD): 144.84(18.05), n=145), followed by students who had “quite a
positive experience” (mean(SD): 135.35(16.43), n=174) and students who had “quite a
negative experience” (mean(SD): 122.98(16.34), n=13). The difference between groups
was statistically significant (p<0.001). Post-hoc pairwise comparisons using Tukey’s
HSD indicated that the mean scores for all groups were significantly different. Due to the
presence of outliers, the non-parametric Kruskal-Wallis test was also performed and the
conclusions remained unchanged (p<0.001).
Note: This analysis is restricted to those who had worked with older people in the past
Relationship between current experience of working with older people and
attitude
An independent-samples t-test was run to determine if there were differences in attitudes to
ageing between students who had current experience of working with older people and
students who did not have that experience. Students with current experience had more
positive attitudes (mean (SD):138.48(16.55), n=170) than students who did not (mean
(SD): 136.53(16.84), n=763), but this difference was not statistically significant (p=0.170).
Due to the presence of outliers, the non-parametric Mann-Whitney U test was also
performed and the conclusions remained unchanged (p=0.142).
A one-way ANOVA was run to determine if attitudes depended on students current
experience of working with older adults. Students who had a “very positive experience” had
the most positive attitude (mean (SD): 144.76(14.61), n=55), followed by students who had
“quite a positive experience” (mean(SD): 135.57(16.04), n=86) and students who had
“quite a negative experience” (mean(SD): 122.39(8.48), n=5). The difference between
groups was statistically significant (p<0.001). Post-hoc pairwise comparisons using Tukey’s

ATTITUDES TO OLDER PEOPLE AND PERCEPTIONS OF WORKING WITH OLDER PEOPLE OF
STUDENTS OF HEALTH AND SOCIAL CARE
This project has been funded with support from the Lifelong Learning Programme of the European Commission.
This publication (communication) reflects the views only of the author, and the Commission cannot be held responsible for any use which may be made of the information contained therein.
33
HSD indicated that the mean scores for those who had a “very positive experience” was
significantly different to both those who had a “quite positive experience” and those who
had a “quite negative experience”. There was not a statistically significant difference in
attitudes between those who had quite a positive and those who had quite a negative
experience. Due to the presence of outliers, the non-parametric Kruskal-Wallis test was also
performed and the conclusions remained unchanged (p<0.001).
Tables 5 shows detailed response to negative statements. Table 6 shows detailed
responses to positive statements. Table 7 shows response by country.

ATTITUDES TO OLDER PEOPLE AND PERCEPTIONS OF WORKING WITH OLDER PEOPLE OF STUDENTS OF HEALTH AND SOCIAL CARE
This project has been funded with support from the Lifelong Learning Programme of the European Commission.
This publication (communication) reflects the views only of the author, and the Commission cannot be held responsible for any use which may be made of the information contained therein.
34
Table 5 Responses to the negatively-worded items on the Kogan scale*
n
n (%) n (%) n (%) n (%) n (%) n (%)
It would probably be better if older adults lived in
residential units with people their own age949 135 (14.2) 273 (28.8) 186 (19.6) 177 (18.7) 152 (16.0) 26 (2.7)
There is something different about older adults; it's hard
to find out what makes them tick946 98 (10.4) 255 (27.0) 181 (19.1) 186 (19.7) 144 (15.2) 82 (8.7)
Most older adults get set in their ways and are unable to
change948 79 (8.3) 180 (19.0) 207 (21.8) 284 (30.0) 171 (18.0) 27 (2.8)
Most older adults would prefer to quit work as soon as
pensions or their children can support them945 130 (13.8) 307 (32.5) 251 (26.6) 128 (13.5) 106 (11.2) 23 (2.4)
Most older adults tend to let their homes become
shabby and unattractive945 214 (22.6) 424 (44.9) 190 (20.1) 79 (8.4) 31 (3.3) 7 (0.7)
It is foolish to claim wisdom comes with age 940 100 (10.6) 283 (30.1) 235 (25.0) 162 (17.2) 114 (12.1) 46 (4.9)
Older adults have too much power in business and
politics937 120 (12.8) 293 (31.3) 236 (25.2) 158 (16.9) 91 (9.7) 39 (4.2)
Most older adults make one feel ill at ease 945 263 (27.8) 278 (29.4) 178 (18.8) 98 (10.4) 86 (9.1) 42 (4.4)
Most older adults bore others by their insistence on
talking "about the good old days"945 145 (15.3) 305 (32.3) 269 (28.5) 138 (14.6) 72 (7.6) 16 (1.7)
Most older adults spend too much time prying into the
affairs of others and giving unsought advice943 110 (11.7) 317 (33.6) 269 (28.5) 159 (16.9) 71 (7.5) 17 (1.8)
If older adults expect to be liked, their first step is to try
and get rid of their irritating faults942 266 (28.2) 335 (35.6) 186 (19.7) 101 (10.7) 39 (4.1) 15 (1.6)
In order to maintain a nice residential neighbourhood, it
would be best if too many older adults did not live in it943 251 (26.6) 308 (32.7) 168 (17.8) 91 (9.7) 85 (9.0) 40 (4.2)
There are a few exceptions, but in general older adults
are pretty much alike944 169 (17.9) 318 (33.7) 219 (23.2) 149 (15.8) 77 (8.2) 12 (1.3)
Most older adults should be more concerned with their
personal appearance. They are too untidy942 189 (20.1) 319 (33.9) 225 (23.9) 132 (14.0) 55 (5.8) 22 (2.3)
Most older adults are irritable, grouchy and unpleasant 940 161 (17.1) 299 (31.8) 250 (26.6) 107 (11.4) 90 (9.6) 33 (3.5)
Most older adults are constantly complaining about the
behaviour of the younger generation944 32 (3.4) 167 (17.7) 203 (21.5) 269 (28.5) 222 (23.5) 51 (5.4)
Most older adults make excessive demands for love
and reassurance than anyone else941 114 (12.1) 236 (25.1) 255 (27.1) 162 (17.2) 129 (13.7) 45 (4.8)
Strongly disagree Disagree Slightly disagree Slightly agree Agree Strongly agree

ATTITUDES TO OLDER PEOPLE AND PERCEPTIONS OF WORKING WITH OLDER PEOPLE OF STUDENTS OF HEALTH AND SOCIAL CARE
This project has been funded with support from the Lifelong Learning Programme of the European Commission.
This publication (communication) reflects the views only of the author, and the Commission cannot be held responsible for any use which may be made of the information contained therein.
35
Table 6. Responses to the positively-worded items on the Kogan scale*
n
n (%) n (%) n (%) n (%) n (%) n (%)
It would probably be better if older adults lived in
residential units with younger people949 79 (8.3) 186 (19.6) 228 (24.0) 236 (24.9) 177 (18.7) 43 (4.5)
Most older adults are really no different from anybody
else; they're as easy to understand as younger people947 26 (2.7) 160 (16.9) 187 (19.7) 226 (23.9) 249 (26.3) 99 (10.5)
Most older adults are capable of new adjustments when
the situation demands it945 18 (1.9) 143 (15.1) 225 (23.8) 276 (29.2) 232 (24.6) 51 (5.4)
Most older adults would prefer to continue working as
long as they possibly can rather than be dependent on
anybody
946 10 (1.1) 68 (7.2) 106 (11.2) 303 (32.0) 348 (36.8) 111 (11.7)
Most older adults can generally be counted on to
maintain a clean, attractive home942 6 (0.6) 42 (4.5) 84 (8.9) 303 (32.2) 404 (42.9) 103 (10.9)
People grow wiser with the coming of age 940 33 (3.5) 114 (12.1) 164 (17.4) 352 (37.4) 225 (23.9) 52 (5.5)
Older adults should have power in business and politics 932 52 (5.6) 184 (19.7) 272 (29.2) 238 (25.5) 147 (15.8) 39 (4.2)
Most older adults are very relaxing to be with 943 11 (1.2) 47 (5.0) 113 (12.0) 342 (36.3) 321 (34.0) 109 (11.6)
One of the most interesting and entertaining qualities of
most older adults is their accounts of their past
experiences
947 13 (1.4) 64 (6.8) 98 (10.3) 276 (29.1) 343 (36.2) 153 (16.2)
Most older adults tend to keep to themselves and give
advice only when asked942 53 (5.6) 238 (25.3) 300 (31.8) 233 (24.7) 105 (11.1) 13 (1.4)
When you think about it, older adults have the same
faults as anybody else946 22 (2.3) 41 (4.3) 63 (6.7) 255 (27.0) 318 (33.6) 247 (26.1)
You can count on finding a nice residential
neighbourhood when there is a sizeable number of
older adults living in it
938 39 (4.2) 128 (13.6) 200 (21.3) 233 (24.8) 267 (28.5) 71 (7.6)
It is evident that older adults are very different from one
another943 23 (2.4) 54 (5.7) 131 (13.9) 251 (26.6) 302 (32.0) 182 (19.3)
Most older adults seem quite clean and neat in their
personal appearance940 9 (1.0) 64 (6.8) 119 (12.7) 320 (34.0) 354 (37.7) 74 (7.9)
Most older adults are cheerful agreeable and good
humoured941 11 (1.2) 51 (5.4) 110 (11.7) 368 (39.1) 341 (36.2) 60 (6.4)
One seldom hears older adults complaining about the
behaviour of the younger generation942 62 (6.6) 332 (35.2) 311 (33.0) 142 (15.1) 81 (8.6) 14 (1.5)
Most older adults need no more love and reassurance
than anyone else943 76 (8.1) 240 (25.5) 200 (21.2) 181 (19.2) 190 (20.1) 56 (5.9)
Strongly disagree Disagree Slightly disagree Slightly agree Agree Strongly agree

ATTITUDES TO OLDER PEOPLE AND PERCEPTIONS OF WORKING WITH OLDER PEOPLE OF STUDENTS OF HEALTH AND SOCIAL CARE
This project has been funded with support from the Lifelong Learning Programme of the European Commission.
This publication (communication) reflects the views only of the author, and the Commission cannot be held responsible for any use which may be made of the information contained therein.
36
Table 7: Responses by Country
n mean (SD) n mean (SD) n mean (SD) n mean (SD) n mean (SD) n mean (SD)
Most older adults tend to let their homes become
shabby and unattractive 945 4.73 (1.05) 158 5.15 (0.90) 234 4.70 (0.85) 161 4.70 (1.06) 254 4.84 (1.10) 138 4.12 (1.14)
If older adults expect to be liked, their first step is to try
and get rid of their irritating faults 942 4.68 (1.20) 160 5.01 (1.11) 232 4.81 (0.88) 161 4.28 (1.32) 251 5.05 (1.14) 138 3.89 (1.23)
When you think about it, older adults have the same
faults as anybody else946 4.64 (1.19) 160 5.04 (1.09) 233 4.40 (1.03) 161 4.27 (1.33) 254 4.86 (1.32) 138 4.57 (0.93)
Most older adults can generally be counted on to
maintain a clean, attractive home942 4.45 (0.99) 157 4.37 (1.22) 232 4.28 (0.84) 161 4.70 (1.07) 254 4.54 (0.98) 138 4.37 (0.80)
In order to maintain a nice residential neighbourhood, it
would be best if too many older adults did not live in it 943 4.45 (1.42) 159 5.30 (1.01) 231 4.77 (0.97) 161 2.43 (1.10) 254 4.81 (1.19) 138 4.66 (1.04)
Most older adults make one feel ill at ease 945 4.43 (1.45) 159 4.89 (1.38) 232 4.89 (0.89) 161 2.67 (1.24) 255 5.04 (1.23) 138 4.07 (1.10)
Most older adults should be more concerned with their
personal appearance. They are too untidy942 4.41 (1.25) 159 4.96 (1.02) 231 4.55 (0.91) 161 3.71 (1.49) 253 4.81 (1.17) 138 3.64 (1.09)
One of the most interesting and entertaining qualities of
most older adults is their accounts of their past
experiences
947 4.41 (1.16) 160 4.83 (1.12) 233 4.19 (1.02) 161 3.98 (1.28) 255 4.73 (1.13) 138 4.17 (1.00)
It is evident that older adults are very different from one
another943 4.38 (1.24) 159 4.48 (1.26) 231 4.14 (1.04) 161 4.96 (1.01) 254 4.45 (1.40) 138 3.84 (1.14)
There are a few exceptions, but in general older adults
are pretty much alike 944 4.34 (1.24) 159 4.64 (1.13) 233 4.23 (1.07) 161 4.96 (1.01) 253 4.34 (1.33) 138 3.42 (1.17)
Most older adults are very relaxing to be with 943 4.32 (1.06) 160 4.44 (1.04) 230 4.11 (0.86) 161 4.53 (1.25) 254 4.31 (1.16) 138 4.27 (0.88)
Most older adults would prefer to continue working as
long as they possibly can rather than be dependent on
anybody
946 4.32 (1.11) 158 4.46 (1.10) 234 4.06 (0.93) 161 4.55 (1.15) 255 4.34 (1.19) 138 4.27 (1.13)
Most older adults bore others by their insistence on
talking "about the good old days"945 4.28 (1.21) 159 4.84 (1.02) 233 4.31 (0.90) 161 3.98 (1.28) 254 4.50 (1.31) 138 3.54 (1.14)
Most older adults are irritable, grouchy and unpleasant 940 4.25 (1.32) 159 5.11 (0.95) 230 4.66 (0.76) 161 2.67 (1.24) 252 4.63 (1.19) 138 3.74 (1.01)
Most older adults seem quite clean and neat in their
personal appearance940 4.24 (1.06) 158 4.42 (1.07) 231 3.99 (0.75) 161 4.71 (1.06) 252 4.15 (1.26) 138 4.09 (0.86)
Most older adults are cheerful agreeable and good
humoured941 4.23 (1.00) 160 4.39 (1.00) 230 3.88 (0.84) 161 4.39 (1.19) 252 4.40 (0.99) 138 4.13 (0.87)
Most older adults spend too much time prying into the
affairs of others and giving unsought advice943 4.20 (1.18) 160 4.69 (0.96) 232 4.03 (0.94) 161 4.33 (1.24) 252 4.39 (1.21) 138 3.39 (1.22)
Most older adults would prefer to quit work as soon as
pensions or their children can support them945 4.17 (1.29) 160 4.86 (1.19) 232 4.21 (0.93) 161 4.54 (1.16) 254 4.08 (1.23) 138 3.01 (1.34)
Older adults have too much power in business and
politics937 4.08 (1.32) 159 4.50 (1.25) 227 3.95 (1.11) 161 3.29 (1.49) 252 4.41 (1.30) 138 4.13 (1.15)
It would probably be better if older adults lived in
residential units with people their own age949 3.98 (1.39) 160 4.91 (1.27) 236 4.19 (1.07) 161 4.27 (1.26) 254 3.26 (1.43) 138 3.57 (1.27)
*Negatively worded items were reverse coded prior to calculating the mean and SD
Total Ireland Germany Italy Finland Latvia
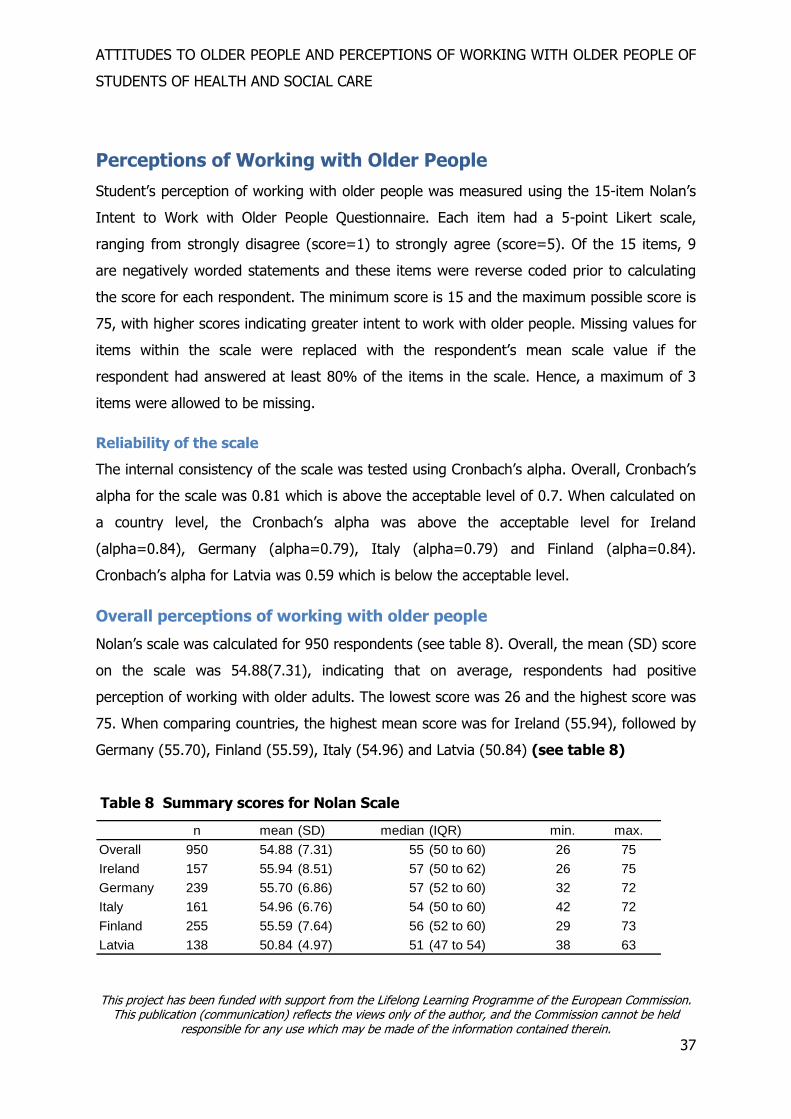
ATTITUDES TO OLDER PEOPLE AND PERCEPTIONS OF WORKING WITH OLDER PEOPLE OF
STUDENTS OF HEALTH AND SOCIAL CARE
This project has been funded with support from the Lifelong Learning Programme of the European Commission.
This publication (communication) reflects the views only of the author, and the Commission cannot be held responsible for any use which may be made of the information contained therein.
37
Perceptions of Working with Older People
Student’s perception of working with older people was measured using the 15-item Nolan’s
Intent to Work with Older People Questionnaire. Each item had a 5-point Likert scale,
ranging from strongly disagree (score=1) to strongly agree (score=5). Of the 15 items, 9
are negatively worded statements and these items were reverse coded prior to calculating
the score for each respondent. The minimum score is 15 and the maximum possible score is
75, with higher scores indicating greater intent to work with older people. Missing values for
items within the scale were replaced with the respondent’s mean scale value if the
respondent had answered at least 80% of the items in the scale. Hence, a maximum of 3
items were allowed to be missing.
Reliability of the scale
The internal consistency of the scale was tested using Cronbach’s alpha. Overall, Cronbach’s
alpha for the scale was 0.81 which is above the acceptable level of 0.7. When calculated on
a country level, the Cronbach’s alpha was above the acceptable level for Ireland
(alpha=0.84), Germany (alpha=0.79), Italy (alpha=0.79) and Finland (alpha=0.84).
Cronbach’s alpha for Latvia was 0.59 which is below the acceptable level.
Overall perceptions of working with older people
Nolan’s scale was calculated for 950 respondents (see table 8). Overall, the mean (SD) score
on the scale was 54.88(7.31), indicating that on average, respondents had positive
perception of working with older adults. The lowest score was 26 and the highest score was
75. When comparing countries, the highest mean score was for Ireland (55.94), followed by
Germany (55.70), Finland (55.59), Italy (54.96) and Latvia (50.84) (see table 8)
Table 8 Summary scores for Nolan Scale
n mean (SD) median (IQR) min. max.
Overall 950 54.88 (7.31) 55 (50 to 60) 26 75
Ireland 157 55.94 (8.51) 57 (50 to 62) 26 75
Germany 239 55.70 (6.86) 57 (52 to 60) 32 72
Italy 161 54.96 (6.76) 54 (50 to 60) 42 72
Finland 255 55.59 (7.64) 56 (52 to 60) 29 73
Latvia 138 50.84 (4.97) 51 (47 to 54) 38 63

ATTITUDES TO OLDER PEOPLE AND PERCEPTIONS OF WORKING WITH OLDER PEOPLE OF
STUDENTS OF HEALTH AND SOCIAL CARE
This project has been funded with support from the Lifelong Learning Programme of the European Commission.
This publication (communication) reflects the views only of the author, and the Commission cannot be held responsible for any use which may be made of the information contained therein.
38
Scores on individual subscales by country are presented in table 9 below:
Table 9: Perceptions of Working with Older People scale (Nolan, 2006)
n
n (%) n (%) n (%) n (%) n (%)
Working with older people is mainly about basic care - it
does not require much skill (N)952 226 (23.7) 496 (52.1) 150 (15.8) 68 (7.1) 12 (1.3)
Working with older people is challenging and
stimulating952 11 (1.2) 77 (8.1) 284 (29.8) 470 (49.4) 110 (11.6)
Health Care Professionals work with older people
because they cannot cope with high tech care (N)947 415 (43.8) 340 (35.9) 160 (16.9) 27 (2.9) 5 (0.5)
The older you are the easier it is to have a good rapport
with older people (N)953 191 (20.0) 394 (41.3) 210 (22.0) 142 (14.9) 16 (1.7)
Working with older people is a highly skilled job 950 14 (1.5) 56 (5.9) 216 (22.7) 514 (54.1) 150 (15.8)
I think older people are really interesting to work with 950 11 (1.2) 69 (7.3) 282 (29.7) 418 (44.0) 170 (17.9)
Student's personal disposition towards work with
older people
I would definitely consider working with older people
when I qualify953 77 (8.1) 178 (18.7) 297 (31.2) 297 (31.2) 104 (10.9)
I am really looking forward/I really looked forward to my
first placement with older people949 54 (5.7) 184 (19.4) 408 (43.0) 221 (23.3) 82 (8.6)
I am really anxious/I was really anxious about my first
placement with older people (N)950 251 (26.4) 337 (35.5) 224 (23.6) 122 (12.8) 16 (1.7)
Work with older people does not appeal to me at all (N) 950 177 (18.6) 355 (37.4) 265 (27.9) 123 (12.9) 30 (3.2)
Student's perceptions of the consequences of
working with older people
Working with older people is a dead end job (N) 952 318 (33.4) 443 (46.5) 153 (16.1) 27 (2.8) 11 (1.2)
Working with older people has high status 953 94 (9.9) 262 (27.5) 402 (42.2) 158 (16.6) 37 (3.9)
Once you work with older people it is difficult to get a
job elsewhere (N)951 261 (27.4) 407 (42.8) 237 (24.9) 38 (4.0) 8 (0.8)
Working with older people provides little satisfaction as
they rarely get better (N)950 216 (22.7) 444 (46.7) 212 (22.3) 62 (6.5) 16 (1.7)
Working with older people is not a good career move
(N)950 263 (27.7) 405 (42.6) 224 (23.6) 41 (4.3) 17 (1.8)
*Pink denotes a greater intent to work with older people
Student's perceptions of working with older people
in general
Strongly disagree DisagreeNeither agree nor
disagreeAgree Strongly agree
ATTITUDES TO OLDER PEOPLE AND PERCEPTIONS OF WORKING WITH OLDER PEOPLE OF
STUDENTS OF HEALTH AND SOCIAL CARE
This project has been funded with support from the Lifelong Learning Programme of the European Commission.
This publication (communication) reflects the views only of the author, and the Commission cannot be held responsible for any use which may be made of the information contained therein.
39
As shown on Table 10 items in the scale have been arranged to correspond with the three
broad areas (subscales):
perceptions of work with older people in general;
personal disposition/experiences of work with older people; and
perceived consequences of work with older people
All responses to the individual questions are presented overall and not by country
Student’s perceptions of working with older people in general
Generally respondents depicted a positive perception of working with older people. The
majority of respondents (75.8%) disagreed and strongly disagreed that ‘working with older
people is mainly about basic care-it does not require much skill’. In addition a sizeable
number of respondents (61%) were in agreement that ‘working with older people is
challenging and stimulating’, however, many (29.8% and 16.9% respectively) were
undecided i.e. could neither agree nor disagree. A great number of respondents (79.7%) did
not believe that ‘heath care professionals work with older people because they cannot cope
with high tech care’ but the remainder were unsure (neither agreed nor disagreed). It is
encouraging to reveal that more than half of respondents (69.9%) agreed that ‘working with
older people is a highly skilled job’ and 61.9% considered ‘older people to be interesting to
work with’. However 29.7% did not know if it was interesting to work with older people.
Student’s personal disposition towards working with older people
It is clear that many respondents are uncertain about their personal disposition towards
working with older people. For example 31.2% could neither agree nor disagree with the
statement ‘I would definitely consider working with older people when I qualify’. While
42.1% agreed that they ‘would consider this area of employment’. Many respondents
(43%) were undecided about they; ‘really looked forward to first placement with older
people’. However 61.9% disagreed that they were ‘really anxious about first placement with
older people’ and 23.6% were undecided. 56% disagreed with the statement ‘work with
older people does not appeal to me at all’ while 16% agreed and 27.9% neither agreed nor
disagreed.
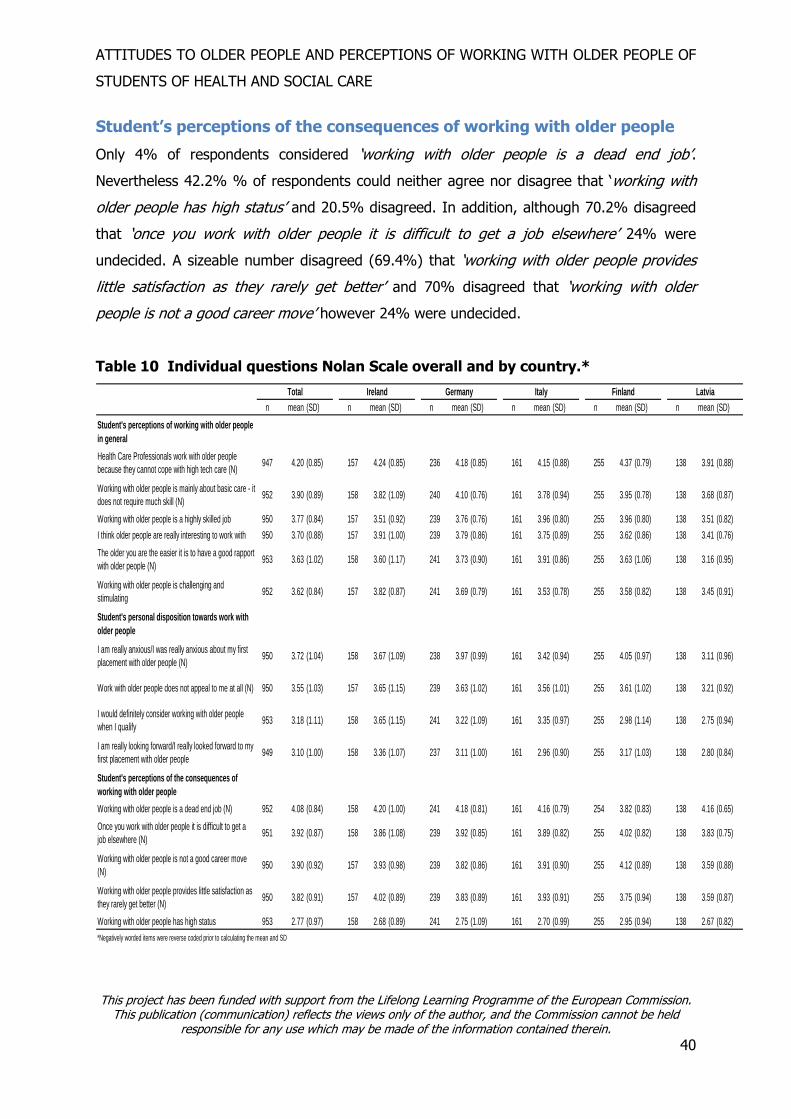
ATTITUDES TO OLDER PEOPLE AND PERCEPTIONS OF WORKING WITH OLDER PEOPLE OF
STUDENTS OF HEALTH AND SOCIAL CARE
This project has been funded with support from the Lifelong Learning Programme of the European Commission.
This publication (communication) reflects the views only of the author, and the Commission cannot be held responsible for any use which may be made of the information contained therein.
40
Student’s perceptions of the consequences of working with older people
Only 4% of respondents considered ‘working with older people is a dead end job’.
Nevertheless 42.2% % of respondents could neither agree nor disagree that ‘working with
older people has high status’ and 20.5% disagreed. In addition, although 70.2% disagreed
that ‘once you work with older people it is difficult to get a job elsewhere’ 24% were
undecided. A sizeable number disagreed (69.4%) that ‘working with older people provides
little satisfaction as they rarely get better’ and 70% disagreed that ‘working with older
people is not a good career move’ however 24% were undecided.
Table 10 Individual questions Nolan Scale overall and by country.*
n mean (SD) n mean (SD) n mean (SD) n mean (SD) n mean (SD) n mean (SD)
Health Care Professionals work with older people
because they cannot cope with high tech care (N)947 4.20 (0.85) 157 4.24 (0.85) 236 4.18 (0.85) 161 4.15 (0.88) 255 4.37 (0.79) 138 3.91 (0.88)
Working with older people is mainly about basic care - it
does not require much skill (N)952 3.90 (0.89) 158 3.82 (1.09) 240 4.10 (0.76) 161 3.78 (0.94) 255 3.95 (0.78) 138 3.68 (0.87)
Working with older people is a highly skilled job 950 3.77 (0.84) 157 3.51 (0.92) 239 3.76 (0.76) 161 3.96 (0.80) 255 3.96 (0.80) 138 3.51 (0.82)
I think older people are really interesting to work with 950 3.70 (0.88) 157 3.91 (1.00) 239 3.79 (0.86) 161 3.75 (0.89) 255 3.62 (0.86) 138 3.41 (0.76)
The older you are the easier it is to have a good rapport
with older people (N)953 3.63 (1.02) 158 3.60 (1.17) 241 3.73 (0.90) 161 3.91 (0.86) 255 3.63 (1.06) 138 3.16 (0.95)
Working with older people is challenging and
stimulating952 3.62 (0.84) 157 3.82 (0.87) 241 3.69 (0.79) 161 3.53 (0.78) 255 3.58 (0.82) 138 3.45 (0.91)
Student's personal disposition towards work with
older people
I am really anxious/I was really anxious about my first
placement with older people (N)950 3.72 (1.04) 158 3.67 (1.09) 238 3.97 (0.99) 161 3.42 (0.94) 255 4.05 (0.97) 138 3.11 (0.96)
Work with older people does not appeal to me at all (N) 950 3.55 (1.03) 157 3.65 (1.15) 239 3.63 (1.02) 161 3.56 (1.01) 255 3.61 (1.02) 138 3.21 (0.92)
I would definitely consider working with older people
when I qualify953 3.18 (1.11) 158 3.65 (1.15) 241 3.22 (1.09) 161 3.35 (0.97) 255 2.98 (1.14) 138 2.75 (0.94)
I am really looking forward/I really looked forward to my
first placement with older people949 3.10 (1.00) 158 3.36 (1.07) 237 3.11 (1.00) 161 2.96 (0.90) 255 3.17 (1.03) 138 2.80 (0.84)
Student's perceptions of the consequences of
working with older people
Working with older people is a dead end job (N) 952 4.08 (0.84) 158 4.20 (1.00) 241 4.18 (0.81) 161 4.16 (0.79) 254 3.82 (0.83) 138 4.16 (0.65)
Once you work with older people it is difficult to get a
job elsewhere (N)951 3.92 (0.87) 158 3.86 (1.08) 239 3.92 (0.85) 161 3.89 (0.82) 255 4.02 (0.82) 138 3.83 (0.75)
Working with older people is not a good career move
(N)950 3.90 (0.92) 157 3.93 (0.98) 239 3.82 (0.86) 161 3.91 (0.90) 255 4.12 (0.89) 138 3.59 (0.88)
Working with older people provides little satisfaction as
they rarely get better (N)950 3.82 (0.91) 157 4.02 (0.89) 239 3.83 (0.89) 161 3.93 (0.91) 255 3.75 (0.94) 138 3.59 (0.87)
Working with older people has high status 953 2.77 (0.97) 158 2.68 (0.89) 241 2.75 (1.09) 161 2.70 (0.99) 255 2.95 (0.94) 138 2.67 (0.82)
*Negatively worded items were reverse coded prior to calculating the mean and SD
Latvia
Student's perceptions of working with older people
in general
Total Ireland Germany Italy Finland

ATTITUDES TO OLDER PEOPLE AND PERCEPTIONS OF WORKING WITH OLDER PEOPLE OF
STUDENTS OF HEALTH AND SOCIAL CARE
This project has been funded with support from the Lifelong Learning Programme of the European Commission.
This publication (communication) reflects the views only of the author, and the Commission cannot be held responsible for any use which may be made of the information contained therein.
41
Reliability of subscales:
The internal consistency of the subscales was tested using Cronbach’s alpha and the mean
inter-item correlation.. Cronbach’s alpha values for all subscales were below 0.7 (0.59 for
perception, 0.69 for disposition and 0.62 for consequences), but their mean inter-item
correlations were within the recommended range (0.20 for perception, 0.36 for disposition
and 0.25 for consequences).
Scores on the subscales:
For each subscale, the mean score was calculated by averaging the scores across the items
in the subscale. Hence, the scores on the subscales could range from 1 to 5, with higher
scores indicating greater intent to work with older people. Missing values for items within a
subscale were replaced with the respondent’s mean subscale value if the respondent had
answered at least 80% of the items in the subscale. Hence, a maximum of 1 item was
allowed to be missing for the perception and consequences subscales and no missing items
were allowed for the disposition subscale. The mean score was highest for the perception
subscale (mean(SD): 3.80(0.51)), followed by the consequences subscale (mean(SD):
3.70(0.57)) and lowest for the disposition subscale (mean(SD): 3.39(0.75))
Table 11. Reliability and summary statistics for subscales on Nolan scale
Reliability
Subscales
Perception 942 6 0.59 0.20 950 3.80 (0.51) 3.83 (3.50 to 4.17)
Dispositon 945 4 0.69 0.36 945 3.39 (0.75) 3.25 (3.00 to 4.00)
Consequences 947 5 0.62 0.25 950 3.70 (0.57) 3.80 (3.40 to 4.00)
Higher score=greater
perception of working with
older adults
Summary statistics
nno. of
itemsalpha
mean inter-
item
correlation
n possible range observed range mean(SD)
1 to 5 1.25 to 5
1 to 5 1.20 to 5
median(IQR)
1 to 5 1.67 to 5

42
Relationships between demographics and perception of working with older people
subscales
Univariate analysis was conducted to test relationships between demographics and perception of working
with older people subscales i.e. Perception of working with older people in general; Disposition towards
working with older people; Perceived consequences of working with older people.
The results presented below and are summarised in tables 11, 12 & 13 below.
Gender and ‘perception of working with older people in general’
An independent-samples t-test was run to determine if there were differences in perception of working with
older people between males and females. Females had more positive perceptions (mean(SD):3.83(0.51))
than males (mean(SD):3.69(0.49), a statistically significant difference of 0.14(95% CI: 0.06 to 0.22),
p=0.001. Due to the presence of outliers, the non-parametric Mann-Whitney U test was also performed
and the conclusions remained unchanged (p=0.001).
Age group and ‘perceptions of working with older people in general’
A one-way ANOVA was run to determine if perception of working with older people depended on age
group. Students aged 30+ years had the most positive perceptions (mean(SD): 3.91(0.51), n=200), while
students aged 17-24 years and 25-29 years had the same mean perception (mean(SD): 3.78(0.52) vs
mean(SD): 3.78(0.47) respectively). The difference between groups was statistically significant (p=0.005).
Post-hoc pairwise comparisons using Tukey’s HSD indicated that the mean scores for students aged 30+
years was significantly different to that of students aged 17-26 years (p=0.005) and students aged 25-29
years (p=0.018). Due to the presence of outliers, the non-parametric Kruskal-Wallis test was also
performed and the conclusions remained unchanged (p=0.018).
Student group and ‘perceptions of working with older people in general’
A one-way ANOVA was run to determine if perception of working with older people differed between
student groups. Occupational therapy students had the most positive perception (mean(SD): 4.03(0.45),
followed by ‘other’ students (mean(SD): 3.91(0.52), Social Work students (mean(SD): 3.87(0.47)), Nursing
students (mean(SD): 3.79(0.54), Dental students (mean(SD): 3.77(0.49), Physiotherapy students
(mean(SD): 3.77(0.45), Medical students (mean(SD): 3.72(0.47) and Dietician students
(mean(SD):3.32(0.23). The difference between groups was statistically significant (p<0.001). Post-hoc
pairwise comparisons using Tukey’s HSD indicated that the mean score for Dietician students was
significantly different from all other student groups except for Medical and Dental students and the mean
score for Occupational Therapy students was significantly different from Nursing, Medical and
43
Physiotherapy students. Due to the presence of outliers, the non-parametric Kruskal-Wallis test was also
performed and the conclusions remained unchanged (p<0.001).
Highest level of education and ‘perceptions of working with older people in general’
A one-way ANOVA was run to determine if perception of working with older people depended on highest
level of education attained. Students with a Diploma had the most positive perception (mean(SD):
3.89(0.54), followed by students with a Post-graduate Degree (mean(SD): 3.87(0.54), Second level
education (mean(SD): 3.83(0.49), students with a Degree (mean(SD): 3.77(0.53) and students with a
Certificate (mean(SD): 3.73(0.49). The difference between groups was statistically significant (p=0.039).
Post-hoc pairwise comparisons using Tukey’s HSD indicated that none of the groups were significantly
different after adjusting for multiple comparisons. Due to the presence of outliers, the non-parametric
Kruskal-Wallis test was also performed and the conclusions remained unchanged (p=0.028).
Past experience of older people and ‘perceptions of working with older people in general’
An independent-samples t-test was run to determine if there were differences in perceptions of working
with older people between students who had past experience of working with older people and students
who did not have that experience. Students with past experience had more positive perceptions
(mean(SD):3.86(0.52) than students who did not (mean(SD): 3.77(0.50) a statistically significant
difference of 0.09 (95% CI: 0.03 to 0.16), p=0.006. Due to the presence of outliers, the non-parametric
Mann-Whitney U test was also performed and the conclusions remained unchanged (p=0.004).
Perception of past experience of working with older people and ‘perceptions of working with
older people in general’
Note: This analysis is restricted to those who had worked with older people in the past.
An one-way ANOVA was run to determine if perceptions of working with older people depended on
students past experience of working with older adults. Students who had a “very positive experience” had
the most positive perception (mean (SD): 4.09(0.47), followed by students who had “quite a positive
experience” (mean (SD): 3.73(0.48) and students who had “quite a negative experience” (mean (SD):
3.23(0.46). The difference between groups was statistically significant (p<0.001). Post-hoc pairwise
comparisons using Tukey’s HSD indicated that the mean scores for all groups were significantly different.
Due to the presence of outliers, the non-parametric Kruskal-Wallis test was also performed and the
conclusions remained unchanged (p<0.001).
44
Current experience of working with older people and ‘perception of working with older people
in general’
An independent-samples t-test was run to determine if there were differences in perception of working with
older people between students who had current experience of working with older people and students who
did not have that experience. Students with current experience had more positive perceptions
(mean(SD):3.95(0.50) than students who did not (mean(SD): 3.77(0.51) a statistically significant
difference of 0.18(95% CI: 0.09 to 0.26), p<0.001. Due to the presence of outliers, the non-parametric
Mann-Whitney U test was also performed and the conclusions remained unchanged (p<0.001).
Perception of current experience of working with older people and perception of working with
older people
Note: This analysis is restricted to those who are currently working with older people.
A one-way ANOVA was run to determine if perception of working with older people depended on students
current experience of working with older adults. Students who had a “very positive experience” had the
most positive perceptions (mean(SD): 4.22(0.43), followed by students who had “quite a positive
experience” (mean(SD): 3.84(0.45), n=89) and students who had “quite a negative experience”
(mean(SD): 3.23(0.56), n=5). The difference between groups was statistically significant (p<0.001). Post-
hoc pairwise comparisons using Tukey’s HSD indicated that the mean scores for all groups were
significantly different. Due to the presence of outliers, the non-parametric Kruskal-Wallis test was also
performed and the conclusions remained unchanged (p<0.001).
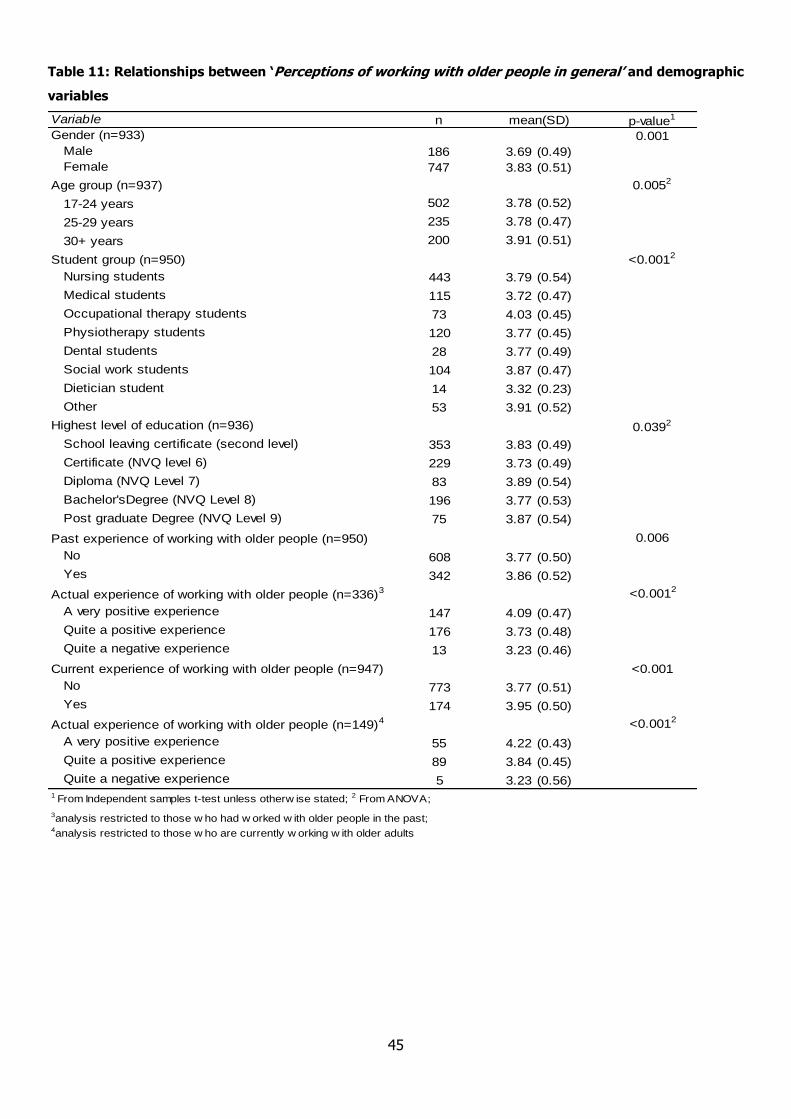
45
Table 11: Relationships between ‘Perceptions of working with older people in general’ and demographic
variables
Variable n p-value1
Gender (n=933) 0.001
Male 186 3.69 (0.49)
Female 747 3.83 (0.51)
Age group (n=937) 0.0052
17-24 years 502 3.78 (0.52)
25-29 years 235 3.78 (0.47)
30+ years 200 3.91 (0.51)
Student group (n=950) <0.0012
Nursing students 443 3.79 (0.54)
Medical students 115 3.72 (0.47)
Occupational therapy students 73 4.03 (0.45)
Physiotherapy students 120 3.77 (0.45)
Dental students 28 3.77 (0.49)
Social work students 104 3.87 (0.47)
Dietician student 14 3.32 (0.23)
Other 53 3.91 (0.52)
Highest level of education (n=936) 0.0392
School leaving certificate (second level) 353 3.83 (0.49)
Certificate (NVQ level 6) 229 3.73 (0.49)
Diploma (NVQ Level 7) 83 3.89 (0.54)
Bachelor'sDegree (NVQ Level 8) 196 3.77 (0.53)
Post graduate Degree (NVQ Level 9) 75 3.87 (0.54)
Past experience of working with older people (n=950) 0.006
No 608 3.77 (0.50)
Yes 342 3.86 (0.52)
Actual experience of working with older people (n=336)3 <0.0012
A very positive experience 147 4.09 (0.47)
Quite a positive experience 176 3.73 (0.48)
Quite a negative experience 13 3.23 (0.46)
Current experience of working with older people (n=947) <0.001
No 773 3.77 (0.51)
Yes 174 3.95 (0.50)
Actual experience of working with older people (n=149)4 <0.0012
A very positive experience 55 4.22 (0.43)
Quite a positive experience 89 3.84 (0.45)
Quite a negative experience 5 3.23 (0.56)1 From Independent samples t-test unless otherw ise stated; 2 From ANOVA;
mean(SD)
3analysis restricted to those w ho had w orked w ith older people in the past;4analysis restricted to those w ho are currently w orking w ith older adults
46
Gender and disposition to working with older people
An independent-samples t-test was run to determine if disposition to working with older people differed
between males and females. Females had a more favourable disposition (mean(SD):3.40(0.77) than males
(mean(SD): 3.31(0.66), but this difference was not statistically significant (p=0.119). Due to the presence
of outliers, the non-parametric Mann-Whitney U test was also performed and the conclusions remained
unchanged (p=0.090).
Age group and disposition to working with older people
There was not a statistically significant relationship between age group and disposition to working with
older people (p=0.109 from one-way ANOVA). Due to the presence of outliers, the non-parametric Kruskal-
Wallis test was also performed and the conclusions remained unchanged (p=0.097).
Student group and disposition to working with older people
A one-way ANOVA was run to determine if disposition to working with older people differed between
student groups. Dental students had the most favourable disposition (mean(SD): 3.81(0.58), followed by
Occupational Therapy students (mean(SD): 3.72(0.81), Physiotherapy students (mean(SD): 3.49(0.66),
other students (mean(SD): 3.44(0.71), Nursing students (mean(SD): 3.38(0.74), Social work students
(mean(SD): 3.30(0.83), Medical students (mean(SD): 3.13(0.73), and Dietician students (mean(SD):
2.98(0.46). The difference between groups was statistically significant (p<0.001). Post-hoc pairwise
comparisons using Tukey’s HSD indicated that the mean score for both Dental and Occupational Therapy
students was significantly different from Nursing, Medical, Social work and Dietician students. The mean
scores for Medical students were also significantly different to those of Nursing and Physiotherapy
students. Due to the presence of outliers, the non-parametric Kruskal-Wallis test was also performed and
the conclusions remained unchanged (p<0.001).
Highest level of education and disposition to working with older people
A one-way ANOVA was run to determine if disposition to working with older people depended on highest
level of education attained. Students with Second level education (mean(SD): 3.48(0.78) had the most
favourable disposition, followed by students with a Diploma (mean(SD): 3.43(0.78), students with a Post-
graduate Degree (mean(SD): 3.36(0.74), students with a Degree (mean(SD): 3.34(0.70), students with a
Certificate (mean(SD): 3.26(0.73). The difference between groups was statistically significant (p=0.014).
Post-hoc pairwise comparisons using Tukey’s HSD indicated that the only significant difference was
between students with a Certificate and students with Second level education (p=0.006). Due to the
presence of outliers, the non-parametric Kruskal-Wallis test was also performed and the conclusions
remained unchanged (p=0.008).
47
Past experience of working with older people and disposition to working with older people
An independent-samples t-test was run to determine if there were differences in disposition to working
with older people between students who had past experience of working with older people and students
who did not have that experience. Students with past experience had greater intent (mean(SD):
3.51(0.74), than students who did not (mean(SD): 3.32(0.75), a statistically significant difference of
0.18(95% CI: 0.08 to 0.28), p<0.001. Due to the presence of an outlier, the non-parametric Mann-Whitney
U test was also performed and the conclusions remained unchanged (p=0.001).
Perception of experience of working with older people and disposition to working with older
people
Note: This analysis is restricted to those who had worked with older people in the past
A one-way ANOVA was run to determine if disposition to working with older people depended on students
past experience of working with older adults. Students who had a “very positive experience” had the most
favourable disposition (mean(SD): 3.85(0.70), followed by students who had “quite a positive experience”
(mean(SD): 3.32(0.63) and students who had “quite a negative experience” (mean(SD): 2.54(0.62). The
difference between groups was statistically significant (p<0.001). Post-hoc pairwise comparisons using
Tukey’s HSD indicated that the mean scores for all groups were significantly different. Due to the presence
of outliers, the non-parametric Kruskal-Wallis test was also performed and the conclusions remained
unchanged (p<0.001).
Current experience of working with older people and disposition to working with older people
An independent-samples t-test was run to determine if there were differences in disposition to working
with older people between students who had current experience of working with older people and students
who did not have that experience. Students with current experience had a more favourable disposition
(mean(SD): 3.58(0.73) than students who did not (mean(SD): 3.34(0.75), a statistically significant
difference of 0.23(95% CI: 0.11 to 0.36), p<0.001. Due to the presence of outliers, the non-parametric
Mann-Whitney U test was also performed and the conclusions remained unchanged (p<0.001).
Perception of current experience of working with older people and disposition to working with
older people
Note: This analysis is restricted to those who are currently working with older people.
A one-way ANOVA was run to determine if disposition to working with older people depended on students
current experience of working with older adults. Students who had a “very positive experience” had the
most favourable disposition (mean(SD): 4.01(0.64), followed by students who had “quite a positive
experience” (mean(SD): 3.47(0.64), n=89) and students who had “quite a negative experience”

48
(mean(SD): 2.50(0.25), n=5). The difference between groups was statistically significant (p<0.001). Post-
hoc pairwise comparisons using Tukey’s HSD indicated that the mean scores for all groups were
significantly different. Due to non-constant variance across the groups, the non-parametric Kruskal-Wallis
test was also performed and the conclusions remained unchanged (p<0.001).

49
Table 12. Relationships between ‘disposition to working with older people’ and demographic variables
Variable n p-value1
Gender (n=928) 0.119
Male 183 3.31 (0.66)
Female 745 3.40 (0.77)
Age group (n=932) 0.1092
17-24 years 501 3.37 (0.76)
25-29 years 233 3.34 (0.71)
30+ years 198 3.48 (0.79)
Student group (n=945) <0.0012
Nursing students 442 3.38 (0.74)
Medical students 112 3.13 (0.73)
Occupational therapy students 72 3.72 (0.81)
Physiotherapy students 120 3.49 (0.66)
Dental students 28 3.81 (0.58)
Social work students 104 3.30 (0.83)
Dietician student 14 2.98 (0.46)
Other 53 3.44 (0.71)
Highest level of education (n=931) 0.0142
School leaving certificate (second level) 350 3.48 (0.78)
Certificate (NVQ level 6) 227 3.26 (0.73)
Diploma (NVQ Level 7) 83 3.43 (0.78)
Bachelor'sDegree (NVQ Level 8) 196 3.34 (0.70)
Post graduate Degree (NVQ Level 9) 75 3.36 (0.74)
Past experience of working with older people (n=945) <0.001
No 605 3.32 (0.75)
Yes 340 3.51 (0.74)
Actual experience of working with older people (n=334)3 <0.0012
A very positive experience 146 3.85 (0.70)
Quite a positive experience 175 3.32 (0.63)
Quite a negative experience 13 2.54 (0.62)
Current experience of working with older people (n=942) <0.001
No 769 3.34 (0.75)
Yes 173 3.58 (0.73)
Actual experience of working with older people (n=148)4 <0.0012
A very positive experience 54 4.01 (0.64)
Quite a positive experience 89 3.47 (0.64)
Quite a negative experience 5 2.50 (0.25)1 From Independent samples t-test unless otherw ise stated; 2 From ANOVA;
mean(SD)
3analysis restricted to those w ho had w orked w ith older people in the past;4analysis restricted to those w ho are currently w orking w ith older adults
50
Gender and perceived ‘consequences of working with older people’
An independent-samples t-test was run to determine if there were differences in perceived consequences
of working with older people between males and females. Females had more positive perceived
consequences (mean(SD): 3.73(0.56), than males (mean(SD): 3.57(0.57), a statistically significant
difference of 0.17(95% CI: 0.07 to 0.26), p<0.001. Due to the presence of outliers, the non-parametric
Mann-Whitney U test was also performed and the conclusions remained unchanged (p=0.002).
Age group and perceived ‘consequences of working with older people’
There was not a statistically significant relationship between age group and perceived consequences of
working with older people (p=0.403 from one-way ANOVA). Due to the presence of outliers, the non-
parametric Kruskal-Wallis test was also performed and the conclusions remained unchanged (p=0.322).
Student group and perceived ‘consequences of working with older people’
A one-way ANOVA was run to determine if perceived consequences of working with older people differed
between student groups. Dental students and Occupational therapy students had the most positive
perceived consequences (mean(SD): 3.84(0.55), mean(SD): 3.84(0.65), respectively), followed by other
students (mean(SD): 3.82(0.51), Social work students (mean(SD): 3.76(0.53), Medical students
(mean(SD): 3.71(0.53), Nursing students (mean(SD): 3.67(0.58), Physiotherapy students (mean(SD):
3.63(0.53), and Dietician students (mean(SD):3.31(0.41). The difference between groups was statistically
significant (p=0.007). Post-hoc pairwise comparisons using Tukey’s HSD indicated that the only
statistically significant difference was between the Dietician students and Occupational Therapy students
(p=0.032). Due to the presence of outliers, the non-parametric Kruskal-Wallis test was also performed and
the conclusions remained unchanged (p=0.001).
Highest level of education attained and perceived ‘consequences of working with older people’
There was not a statistically significant relationship between highest level of education attained and
perceived consequences of working with older people (p=0.360 from one-way ANOVA). Due to the
presence of outliers, the non-parametric Kruskal-Wallis test was also performed and the conclusions
remained unchanged (p=0.174).
51
Past experience of working with older people and perceived ‘consequences of working with
older people’
There was no statistically significant relationship between past experience and perceived consequences of
working with older people (p=0.295 from independent samples t-test). Due to the presence of outliers, the
non-parametric Kruskal-Wallis test was also performed and the conclusions remained unchanged
(p=0.340).
Perceptions of past experience of working with older people and perceived ‘consequences of
working with older
Note: This analysis is restricted to those who had worked with older people in the past
An one-way ANOVA was run to determine if perceived consequences of working with older people
depended on students past experience of working with older adults. Students who had a “very positive
experience” had the most positive perceived consequences (mean (SD): 3.96(0.54), followed by students
who had “quite a positive experience” (mean(SD): 3.58(0.51), and students who had “quite a negative
experience” (mean(SD): 3.17(0.48). The difference between groups was statistically significant (p<0.001).
Post-hoc pairwise comparisons using Tukey’s HSD indicated that the mean scores for all groups were
significantly different. Due to the presence of outliers, the non-parametric Kruskal-Wallis test was also
performed and the conclusions remained unchanged (p<0.001).
Current experience of working with older people and perceived ‘consequences of working with
older people’
There was no statistically significant relationship between past experience and perceived consequences of
working with older people (p=0.251 from independent samples t-test). Due to the presence of outliers, the
non-parametric Kruskal-Wallis test was also performed and the conclusions remained unchanged
(p=0.265).
Perceptions of current experience of working with older people and perceived ‘consequences
of working with older people’
Note: This analysis is restricted to those who are currently working with older people.
A one-way ANOVA was run to determine if perceived consequences of working with older people depended
on students current experience of working with older adults. Students who had a “very positive experience”
had the most positive perceived consequences (mean (SD): 4.04(0.48) followed by students who had
“quite a positive experience” (mean (SD): 3.62(0.54) and students who had “quite a negative experience”
(mean (SD): 3.28(0.54). The difference between groups was statistically significant (p<0.001). Post-hoc

52
pairwise comparisons using Tukey’s HSD indicated that the mean scores for the group who had a “very
positive experience” was significantly different to the group who had a “quite positive experience”
(p<0.001) and the group who had “quite a negative experience” (p=0.005). No significant difference was
found between the group who had “quite a positive experience” and the group who had “quite a negative
experience” (p=0.325).

53
Table 13. Relationships between ‘Consequences of working with older people’ and demographic variables
Variable n p-value1
Gender (n=933) <0.001
Male 186 3.57 (0.57)
Female 747 3.73 (0.56)
Age group (n=937) 0.4032
17-24 years 502 3.71 (0.59)
25-29 years 235 3.66 (0.52)
30+ years 200 3.73 (0.57)
Student group (n=950) 0.0072
Nursing students 443 3.67 (0.58)
Medical students 115 3.71 (0.53)
Occupational therapy students 73 3.84 (0.65)
Physiotherapy students 120 3.63 (0.53)
Dental students 28 3.84 (0.55)
Social work students 104 3.76 (0.53)
Dietician student 14 3.31 (0.41)
Other 53 3.82 (0.51)
Highest level of education (n=936) 0.3602
School leaving certificate (second level) 353 3.73 (0.56)
Certificate (NVQ level 6) 229 3.67 (0.57)
Diploma (NVQ Level 7) 83 3.76 (0.53)
Bachelor'sDegree (NVQ Level 8) 196 3.67 (0.59)
Post graduate Degree (NVQ Level 9) 75 3.63 (0.57)
Past experience of working with older people (n=950) 0.295
No 608 3.68 (0.57)
Yes 342 3.72 (0.57)
Actual experience of working with older people (n=336)3 <0.0012
A very positive experience 147 3.96 (0.54)
Quite a positive experience 176 3.58 (0.51)
Quite a negative experience 13 3.17 (0.48)
Current experience of working with older people (n=947) 0.251
No 773 3.69 (0.57)
Yes 174 3.74 (0.55)
Actual experience of working with older people (n=149)4 <0.0012
A very positive experience 55 4.04 (0.48)
Quite a positive experience 89 3.62 (0.54)
Quite a negative experience 5 3.28 (0.54)1 From Independent samples t-test unless otherw ise stated; 2 From ANOVA;
mean(SD)
3analysis restricted to those w ho had w orked w ith older people in the past;4analysis restricted to those w ho are currently w orking w ith older adults
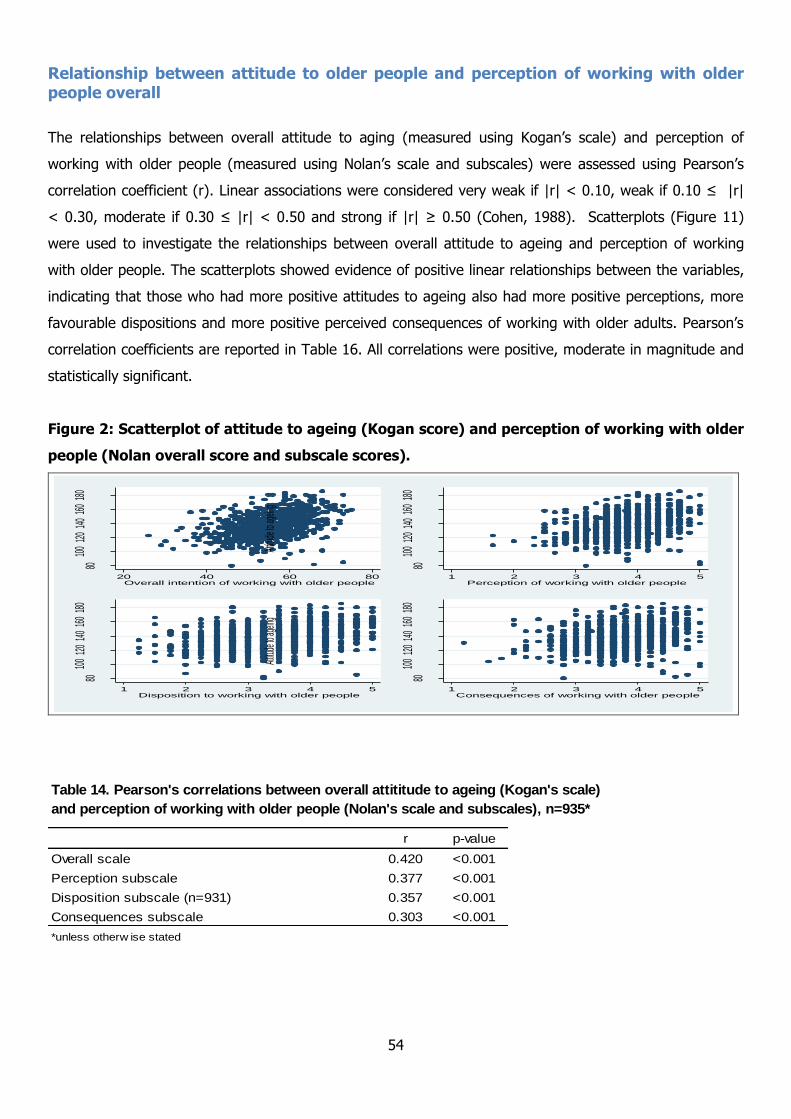
54
Relationship between attitude to older people and perception of working with older people overall
The relationships between overall attitude to aging (measured using Kogan’s scale) and perception of
working with older people (measured using Nolan’s scale and subscales) were assessed using Pearson’s
correlation coefficient (r). Linear associations were considered very weak if |r| < 0.10, weak if 0.10 ≤ |r|
< 0.30, moderate if 0.30 ≤ |r| < 0.50 and strong if |r| ≥ 0.50 (Cohen, 1988). Scatterplots (Figure 11)
were used to investigate the relationships between overall attitude to ageing and perception of working
with older people. The scatterplots showed evidence of positive linear relationships between the variables,
indicating that those who had more positive attitudes to ageing also had more positive perceptions, more
favourable dispositions and more positive perceived consequences of working with older adults. Pearson’s
correlation coefficients are reported in Table 16. All correlations were positive, moderate in magnitude and
statistically significant.
Figure 2: Scatterplot of attitude to ageing (Kogan score) and perception of working with older
people (Nolan overall score and subscale scores).
Table 14. Pearson's correlations between overall attititude to ageing (Kogan's scale)
and perception of working with older people (Nolan's scale and subscales), n=935*
r p-value
Overall scale 0.420 <0.001
Perception subscale 0.377 <0.001
Disposition subscale (n=931) 0.357 <0.001
Consequences subscale 0.303 <0.001
*unless otherw ise stated
8010
012
014
016
018
0
Attitu
de to
agein
g
20 40 60 80Overall intention of working with older people
8010
012
014
016
018
0
Attitu
de to
agein
g
1 2 3 4 5Perception of working with older people
8010
012
014
016
018
0
Attitu
de to
agein
g
1 2 3 4 5Disposition to working with older people
8010
012
014
016
018
0
Attitu
de to
agein
g
1 2 3 4 5Consequences of working with older people
55
Discussion
In this research the attitudes to older people of students of health and social care and their perceptions of
working with older people were examined. Respondents were positive towards older people as a whole and
displayed little of the ageist attitudes coined by Butler in the nineteen sixties. There were very few
differences in the mean (SD) scores in attitude between the countries. It is possible that differences found
may be related to the amount of experience with older people that students reported. For example those
with lowest reported experience with older people i.e. students in Latvia also displayed lowest attitude
scores. However the corresponding high reported experience with older people and positive attitudes were
not altogether proven. An exception was the result from students in Germany who reported both high
experience and positive attitudes. These findings are new to this research with no comparative research
found in the literature reviewed. However attitudes alone are not an indication of whether a person
displays ageist behaviour as found in a study by Yilmaz et al, (2012). Although ageist behaviours were not
found in our research this is one of few studies that have examined attitude along with perceptions of
working with older people. Jacelon (2002) and McLaffery & Morrison (2004) suggested that the quality of
care an older people receives is shaped by the health care professionals attitudes which they obtain form
their experiences of dealing with or interacting with older people.
In contrast to previous research by Liu et al, (2013), who found no evidence of an association between
experience of living with or interacting with older people and attitude, respondents in this study who
reported experience with older people prior to their education programme considered the experiences
positive and our results showed significant relationships between this experience and respondents positive
attitudes. These results agree with Klaghofer et al. (2009) and Boswell (2012) who suggested that more
knowledge about older people increased interest in working with older people and reduced ageist attitudes.
Evidence that attitude shapes health professional’s behaviours in care delivery (McLaffery and Morrison,
2004) must be borne in mind when considering students preparation for working with older people.
McKinley & Cowan (2006) suggested that where attitudes towards ageing may be positive this may not
translate into positive ideals or indeed attitudes towards caring for older people.
Results from our survey of perceptions of working with older people were mainly divided between positive
and neutral perceptions. Ireland reported most positive perception when comparing countries and Latvia
least. While perceptions were positive there was some indecision amongst students. In interpreting these
results we suggest that a lack of experience of older people might also impact on perceptions of working
with older people. Mason and Sanders (2004) found that students felt more positive about working with
older people when they learned from older people themselves. This again raises the question of student
preparation for working with older people and is consistent with research by Bambursh et al, (2012) and
Guteil, (2009). Kydd and Wild (2013) suggested as did Nolan et al, (2006) that negative views about or

56
less desirable working environments may have an impact on the perceptions of students to work with older
people. Although we did not include a question about the work environment in this research, our results
show that many students were undecided about the impact of working with older people on their future
careers. Although not as negative as the results of Stevens (2011), where students strongly expressed a
view that working with older people would impact negatively on their future careers; this indecision must
be borne in mind. Stevens (2011) in their research suggested that students had a preference for working in
highly technical areas like ICU and low preference for areas such as care of the older person. In contrast,
respondents in our study were opposed to the statement that ‘professionals work with older people
because they cannot cope with high tech care’. Surprisingly 43% of respondents in our study did not know
‘whether they looked forward to their first placement with older people’ or not. This may imply that
students were inadequately prepared about the care environment. Similar to sentiments of Kydd & Wild
(2013) respondents may have gained a negative perception of the environment prior to their experience
there. Nolan et al, (2006, p8) recommended that when student nurses had more experience of ‘enriched’
care environments for older people it would transform their views of gerontological nursing.
Much evidence exists in the literature of a lack of interest or desire from professionals to work with older
people (Samra et al. 2013, Boswell 2012, Swanlund & Kujath 2012, Duggan Mitchel & Moore 2011, Van
Dussen & Weaver 2009, Klaghofer et al 2009). The results of our study provide evidence that this absolute
lack of interest might not exist, rather the students report some indecision about the consequences of
working with older people. This may be due to a lack of recognition of gerontology as a defined body of
knowledge, skills and attitudes or failure to recognise the expertise and competence that professionals
require when working with older people. According to Titchen & Higgs (2001) expertise is a combination of
professional artistry and practice wisdom integral to professional practice. Meeting the multiple and
complex and diverse requirements of older person people require competencies particular to this
specialism. The CanMEDS Physician Competency Framework (CanMEDS 2005 Framework, 2005) describes
the knowledge, skills and abilities that specialist physicians need for better patient outcomes. This
framework consists of seven roles: Medical Expert, Communicator, Collaborator, Manager, Health Advocate,
Scholar, and Professional. According to this framework experts apply these competencies to collect and
interpret information, make appropriate clinical decisions, and carry out diagnostic and therapeutic
interventions within the boundaries of their discipline, personal expertise, the healthcare setting and the
patient’s preferences and context (CanMEDS 2005 Framework, 2005). Their care is characterized by up-to-
date, ethical, and resource efficient clinical practice as well as with effective communication in partnership
with patients, other health care providers and the community.
57
Considering the results of our study, many of our respondents reported their experience of working with
older people to be a ‘positive’ one and results show a positive disposition towards working with older
people. This indicates that the perceived consequences of working in care environments for older people
may be of most concern. It is probable that the students perceived these care environments to be of ‘low
status’ and likely that they had little knowledge, awareness or understanding of the learning opportunities
that exist in working with older people and in contexts where expert gerontological practitioners work.
Limitations
This study was conducted across five European countries and is unique in this regard. However there are
differences between countries that must be considered in interpreting results. For example the difficulties
in comparison with regard to education level as differences between systems of second level education and
in professional education particularly in nursing exist. Another limitation is the differences in sample size
and characteristics of sample between the countries. For reasons of access at least one of the student
groups were missing from each of the five countries. In addition there was the majority of respondents
were female in this study, which could be considered a limitation. Nevertheless these results are a unique
representation of the perceptions of undergraduate students of health and social care across north south
east and west of Europe and provide some insight into the factors that determine students decisions to
work with older people.
Conclusions and recommendations
This research has provided some encouraging results regarding the attitudes of students of health and
social care to older people. Positive attitudes to older people were foremost as were mainly positive
perceptions of working with older people. The main result from our study points to the apparent indecision
among student with regard to their disposition to working with older people and the consequences of
choosing to work with older people.
As a result the researchers recommend:
1. A focus on the promotion of gerontology as an exciting career opportunity.
2. The formulation of a competency framework for working with older people that will serve to
articulate the skills, knowledge and expertise necessary for working with older people to inform
systems of professional education for practice.
3. The identification of innovative methods of education and training in gerontology that will also
develop student’s interest in the topic.
4. The promotion of care environments for older people as ‘enriched’, of high quality and where
working with older people is valued and respected.

58
References
Amrhein, L., Backes, G. M. (2007) Alter(n)sbilder und Diskurse des Alter(n)s. Anmerkungen zum Stand der Forschung. Zeitschrift für Gerontologie und Geriatrie,40 (2), 104-111. Baumbusch, J., Dahlke, S. and Phinney, A. (2012) Nursing students' knowledge and beliefs about care of older adults in a shifting context of nursing education. Journal of advanced nursing, 68 (11), 2550-2558. Beaton, D., Guillemin, F (2000) Cross-Cultural Adaptation of Self-Report Measures SPINE 25(24), 3186–3191. Berner, F., Rossow, J., Schwitzer, K.-P. (2012) Altersbilder in der Wirtschaft, im Gesundheitswesen und in der pflegerischen Versorgung. Expertisen zum 6. Altersbericht. Band 1. Verlag für Sozialwissenschaften, Wiesbaden. Berner, F. (2010) Altersbilder in der gesundheitlichen Versorgung älterer Menschen: Erkenntnisse und Empfehlungen aus dem sechsten Altersbericht. Bundesgesundheitsblatt, Gesundheitsforschung, Gesundheitsschutz 54 (8), 927-932. Boswell, S.S. (2012) “Old People are Cranky”: Helping Professional Trainees' Knowledge, Attitudes, Aging Anxiety, and Interest in Working with Older Adults. Educational Gerontology, 38 (7), 465-472. Buchwald, F.M., Wehr, T. (2007) Subjektive Vorstellungen über ältere Menschen und das Altern. Pflege Hans Huber, Zeitschrift für Sozialpsychologie 38, (3), 163-177. Bundesministerium für Familie, Senioren, Frauen und Jugend 2010a. Eine neue Kultur des Alterns –Altersbilder in der Gesellschaft, Berlin. Bundesministerium für Familie, Senioren, Frauen und Jugend (2010b) Sechster Bericht zur Lage der älteren Generation in der Bundesrepublik Deutschland Altersbilder in der Gesellschaft, Berlin. Butler, R. (1995). Ageism. In G. Maddox (Ed.), The Encyclopedia of Aging (2nd ed., pp. 38–39). New York: Springer Publishing Co. Browne, J., Nolan., M., Davies, S., Nolan, J., Keady, J (2008) Transforming students’ views of gerontological nursing: Realising the potential of ‘enriched’ environments of learning and care: A multi-method longitudinal study. International Journal of Nursing Studies 45(8) 1214-1232 CanMEDS Physician Competency Framework (2005) accessed 28th May 2015 at http://www.royalcollege.ca/portal/page/portal/rc/canmeds/framework Clark LA, Watson D (1995) Constructing validity: Basic issues in objective scale development. Psychological Assessment, 7(3):309-319. Cummings, S. M., Adler, G., & DeCoster, V. A. (2005). Factors influencing graduate social work students’ interest in working with elders. Journal of Educational Gerontology, 31, 643-655. Dorfman, L. T., Murty, S. A., Ingram, J. G., Evans, R.J. & Powers, J. R. (2004) Intergenerational service-learning in five cohorts of students: is attitude change robust? Educational Gerontology, 30, pp. 39-55.
59
Duggan,S., Mitchel, E.A & Moore, K.D. (2013) With a bit of tweaking…we could be great’. An exploratory
study of the perceptions of students on working with older people in a preregistration BSc (Hons)
Nursing course. International Journal of Older People Nursing 8, (3) 207-215.
Engstrom & Fagerberg 2011 Attitudes towards older people among Swedish health care students and
health care professionals working in elder care Nursing Reports Vol 1:e2 open access
file:///C:/Users/acoffey/Downloads/11-166-2-PB.pdf
Eurich, J. (2008) Eingeschränkte Menschenwürde Unterschiedliche Menschbilder in der Pflege und ihre Folgen für Menschen mit Demenzerkrankung. Pflege und Gesellschaft 13, (4), 350-361. Fraboni, M., Saltstone, R., & Hughes, S. (1990) The Fraboni Scale of Ageism (FSA): An attempt at a more precise measure of ageism. Canadian Journal on Aging, 9, 56 – 66. doi:10.1017/S0714980800016093 Filipp, S.-H., Mayer, A.-K. (2005) Zur Bedeutung von Altersstereotypen. Aus Politik und Zeitgeschichte, 49-50, 25-31. Gutheil, I.A., Heyman, J.C. and Chernesky, R.H. (2009) Graduate Social Work Students' Interest in Working with Older Adults. Social Work Education, 28 (1), 54-64. Haight, B. K., Christ, M. A., Dias, J. K. (1994) Does nursing education promote ageism? Journal of Advancd Nursing. 20, 382-390. Happell, B. (2002) Nursing home employment for nursing students: valuable experience or a harsh deterrent? Journal of Advanced Nursing 39 (6), 21-29. Higashi, R., Tillack, A., Steinman, M., Harper, B. and Johnson, B. (2012) Elder care as “frustrating” and “boring”: Understanding the persistence of negative attitudes toward older patients among physicians-in-training Journal of Ageing Studies. 26, (4), 476-483. Hilt, M. and Lipschultz, J. (1999)Revising the Kogan scale: a test of local television news producers’ attitudes towards older adults Educational Gerontology. 25, (2), 143-153 Hobbs, C. Dean, CM, Higgs, J. Adamson B. (2006) Physiotherapy student’s attitudes towards and knowledge of older people. Australian Journal of Physiotherapy. 52, (2), 115-119. Huy, C., Thiel, A. (2009) Altersbilder und Gesundheitsverhalten. Pflege Hans Huber, Zeitschrift für Gesundheitspsychologie 17, (3), 121-23.
Jocelyn, C. S. (2002) Attitudes and behaviors of hospital staff toward elders in an acute care setting Applied Nursing Research 15, (4), 227-234. John, O.P. & Benet-Martínez, V (2000). Measurement, scale construction, and reliability. In H.T. Reis and C.M. Judd (Eds.), Handbook of research methods in social and personality psychology (pp. 339-369). New York, NY: Cambridge University Press. Klaghofer, R., Buddberg, C., Schleuniger, M.; Herta, K.-D. 2009. Einstellung zu alten Menschen zu Beginn und am Ende des Medizinstudiums, Zeitschrift für Gerontologie und Geriatrie 42, (5), 365-371. Knox, V.J., Gekoski, W.L. and Kelly, L.E., (1995) The age group evaluation and despription (AGED) inventory: a new instrument for assessing sterotypes of attitudes toward aged groups International Journal of Aging and Human Development. 40, (1), 31-55
60
Kogan, N. (1961) Attitudes toward old people: the development of a scale and an examination of correlates. Journal of Abnorma and Social Psychology. 63, 44-54. Kruse, A. 2013. Altersbilder, Potenziale und Verletzlichkeit: gesellschaftliche Reserviertheit gegenüber dem Alter. Psychotherapie im Alter 10, (38), 149-160. Kruse, A (2012) Menschenbilder und Altersbilder: differenzierte Repräsentation des Alters in ihrer Bedeutung für personale Entwicklungsprozesse. Heidelberger Jahrbücher (2012), 215-227.
Kydd, A & Wild, D (2013) Attitudes towards caring for older people: literature review and methodology.
Nursing Older People 25(3)22-7.
Liu, Y., Norman I.J., and While, A (2013) Nurses’ attitudes towards older people: A systematic review. International Journal of Nursing Studies, 50(9) 1271-1282. Lovell, M. (2006) Caring for the elderly: Changing perceptions and attitudes. Journal of Vascular Nursing 24(1), 22–26
Masciadrelli, B.P (2014) “I Learned That the Aging Population Isn't That Much Different From Me”: The Final Outcomes of a Gero-Ed BEL Project. Journal of Gerontological Social Work, 57 (1), 24-36. Mason, S. and Sanders, G., (2004) Social work students attitides on working with older clients, Journal of Gerontological Social Work. 42, (3-4), 61-75. Matarese, M., Lommi, M., Pedone, C., Alvaro, R. and De Marinis, M.G. (2013) Nursing student attitudes towards older people: Validity and reliability of the Italian version of the Kogan Attitudes towards Older People scale. Journal of advanced nursing, 69 (1), 175-184 McKinlay, A. and Cowan, S. (2003) Student nurses’ attitudes towards working with older patients Journal of advanced nursing, 43 (3), 298-309. McKinlay, A. and Cowan, S. 2006. “If You're Frail You've Had It”: A Theory of Planned Behavior Study of Student Nurses' Attitudes Towards Working with Older Patients. Journal of Applied Social Psychology, 36 (4), 900-917.
McLafferty ,I & Morrison, F (2004) Attitudes towards hospitalized older adults. Journal of Advanced Nursing 47(4):446-53 Nolan, M. R., Brown, J., Davies, S., Nolan, J. and Keady, J (2006) The Senses Framework: improving care for older people through a relationship-centred approach. Getting Research into Practice (GRiP) Report No 2 http://shura.shu.ac.uk/280/
Palmore, E. B. (1988) The Facts on Aging Quiz. New York: Springer Remmers, H., Renneke, S. (2010) Altersbilder und Pflege. Expertise für den Sechsten Altenbericht der Bundesregierung. In: Deutsches Zentrum für Altersfragen (Hrsg.): Expertisen zum 6. Altenbericht der Bundesregierung. Berlin, Lit Verlag, 345-372. Remmers, H., Rennecke, S., Andrees, K. (2009) Altersbilder in der Pflege. Expertise erstellt im Auftrag der Sechsten Altenberichtskommission. Remmers, H., Walter, U. (2013). Altersbilder bei Gesundheitsberufen: einige neuere Befunde. Psychotherapie im Alter, 10, 267-278
61
Reuben, D., Lee, M., Davis, J. W. Eslami, M. S., Osterweil, D. G. Melchiore, S. and Weintraub, N. T. (1998). Development and validation of a geriatrics attitudes scale for primary care residents. Journal of the American Geiatrics Society 46, 1425-1430. Rosencranz, H. A. McNevin, T. E., (1969) A factor analysis of attitudes towards the aged. The Gerontologist. 9, (1), 55-59.
Samra, R., Griffiths, A., Cox, T., Conroy, S & Knight A (2013) Changes in medical student and doctor
attitudes toward older adults after an intervention: a systematic review. Journal of American Geriatric Society 61(7):1188-96.
Soderhamn, O., Lindencrona, C.,& Gustavsson, S. (2001). Attitudes toward older people among nursing students and registered nurses in Sweden. Nurse Education Today, 21, 225-229. Stevens (2011), Student nurses’ career preferences for working with older people: A replicated longitudinal survey. International Journal of Nursing Studies 48 (8), 944–951 Swanlund, S & Kujath, A (2012) Attitudes of Baccalaureate Nursing Students Toward Older Adults: A Pilot Study. Nursing Education Perspectives: 33, (3), 181-183. Titchen A & Higgs J (2001) Towards professional artistry and creativity in practice. In Professional Practice in Health Education and the Creative Arts. (Higgs J & Titchen A. eds), Blackwell Science, Oxford, pp 273-290. Van Dussen, D.J & Weaver, R.R (2009) Undergraduate Students' Perceptions and Behaviors Related to the Aged and to Aging Processes. Educational Gerontology 35 (4) 342–357 Walter, H.J. (2006) Altersbilder. Journal für Psychologie 14, (2), 178-192. Walter, U. (2007) Altern und Altersbilder. Public Health Forum 15, (57), 2-4. Wells, Y., Foreman, P., Gething, L. and Petralia, W. (2004) Nurses attitudes toward aging and older adults – examining attitudes and practices among health services providers in Australia Journal of Gerontological Nursing. 30, (9), 5-13. Yilmaz, D., Kisa, S. and Zeyneloglu, S. (2012) University Students' Views and Practices of Ageism. Ageing International, 37 (2), 143-154.
Appendix 1
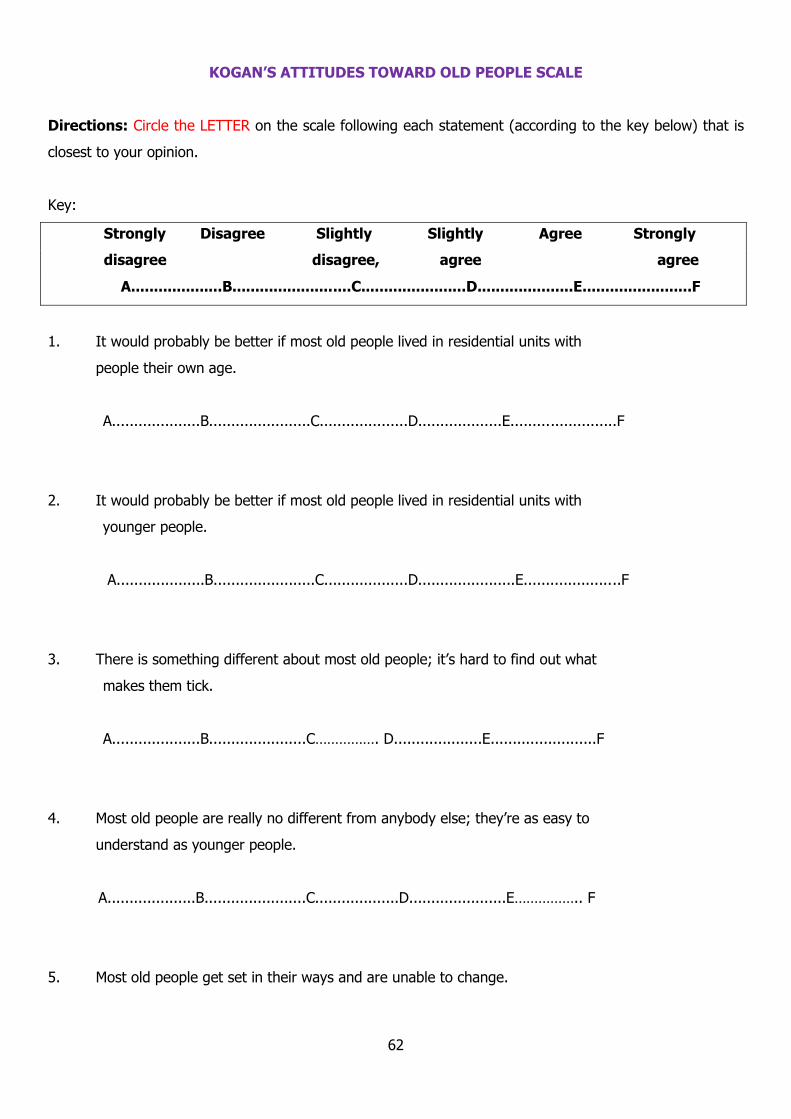
62
KOGAN’S ATTITUDES TOWARD OLD PEOPLE SCALE
Directions: Circle the LETTER on the scale following each statement (according to the key below) that is
closest to your opinion.
Key:
Strongly Disagree Slightly Slightly Agree Strongly
disagree disagree, agree agree
A....................B..........................C.......................D.....................E........................F
1. It would probably be better if most old people lived in residential units with
people their own age.
A....................B.......................C....................D...................E........................F
2. It would probably be better if most old people lived in residential units with
younger people.
A....................B.......................C...................D......................E......................F
3. There is something different about most old people; it’s hard to find out what
makes them tick.
A....................B......................C……………. D....................E........................F
4. Most old people are really no different from anybody else; they’re as easy to
understand as younger people.
A....................B.......................C...................D......................E…………….. F
5. Most old people get set in their ways and are unable to change.

63
A....................B.......................C...................D....................E....................F
6. Most old people are capable of new adjustments when the situation demands it.
A...................B.......................C...................D....................E........................F
7. Most old people would prefer to quit work as soon as pensions or their children
can support them.
A....................B.......................C....................D...................E........................F
8. Most old people would prefer to continue working just as long as they possibly
can rather than be dependent on anybody.
A....................B.......................C...................D.....................E.....................F
9. Most old people tend to let their homes become shabby and unattractive.
A....................B.......................C..................D…………… E........................F
10. Most old people can generally be counted on to maintain a clean, attractive home.
A....................B.......................C..................D……………. E........................F
11. It is foolish to claim that wisdom comes with age.
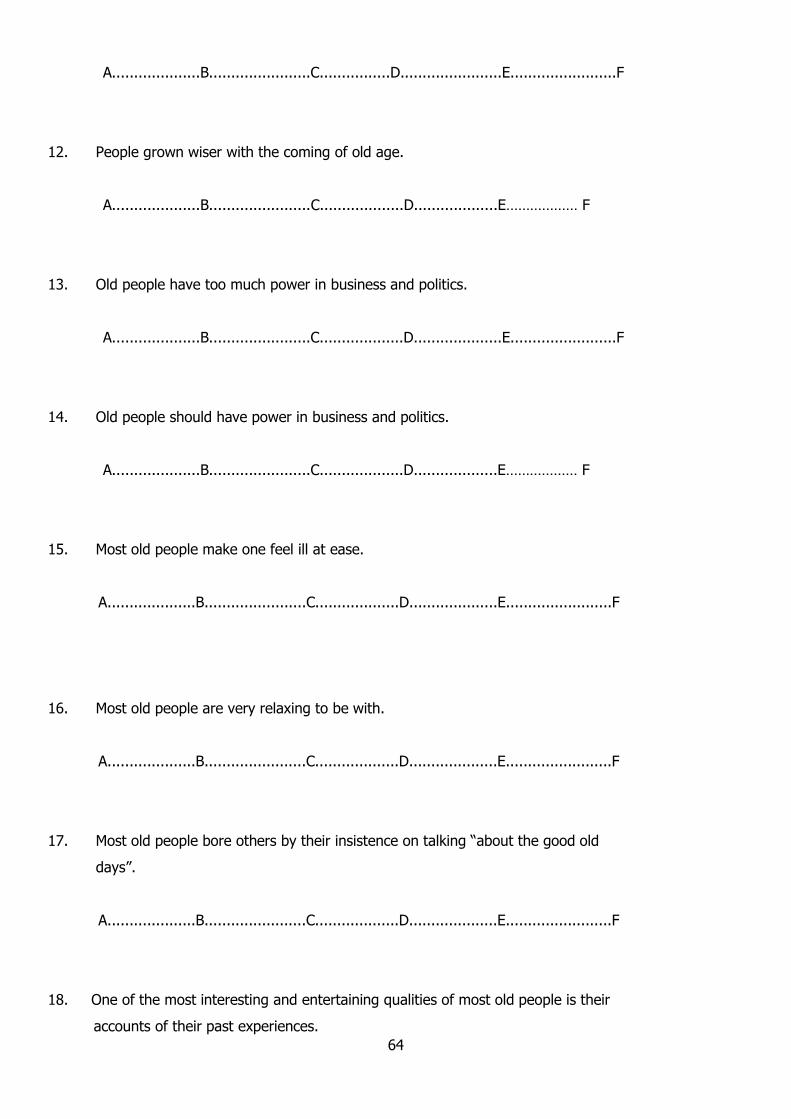
64
A....................B.......................C................D.......................E........................F
12. People grown wiser with the coming of old age.
A....................B.......................C...................D...................E……………… F
13. Old people have too much power in business and politics.
A....................B.......................C...................D....................E........................F
14. Old people should have power in business and politics.
A....................B.......................C...................D...................E……………… F
15. Most old people make one feel ill at ease.
A....................B.......................C...................D....................E........................F
16. Most old people are very relaxing to be with.
A....................B.......................C...................D....................E........................F
17. Most old people bore others by their insistence on talking “about the good old
days”.
A....................B.......................C...................D....................E........................F
18. One of the most interesting and entertaining qualities of most old people is their
accounts of their past experiences.
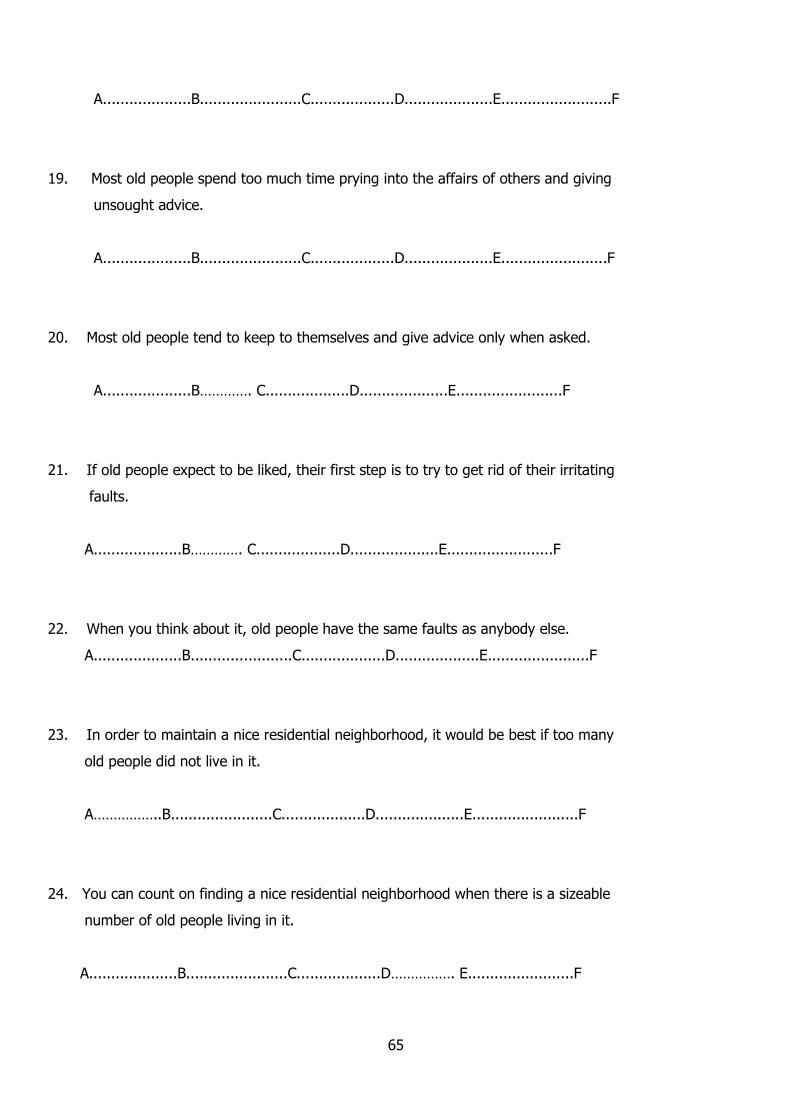
65
A....................B.......................C...................D....................E.........................F
19. Most old people spend too much time prying into the affairs of others and giving
unsought advice.
A....................B.......................C...................D....................E........................F
20. Most old people tend to keep to themselves and give advice only when asked.
A....................B…………. C...................D....................E........................F
21. If old people expect to be liked, their first step is to try to get rid of their irritating
faults.
A....................B…………. C...................D....................E........................F
22. When you think about it, old people have the same faults as anybody else.
A....................B.......................C...................D...................E.......................F
23. In order to maintain a nice residential neighborhood, it would be best if too many
old people did not live in it.
A……………..B.......................C...................D....................E........................F
24. You can count on finding a nice residential neighborhood when there is a sizeable
number of old people living in it.
A....................B.......................C...................D……………. E........................F
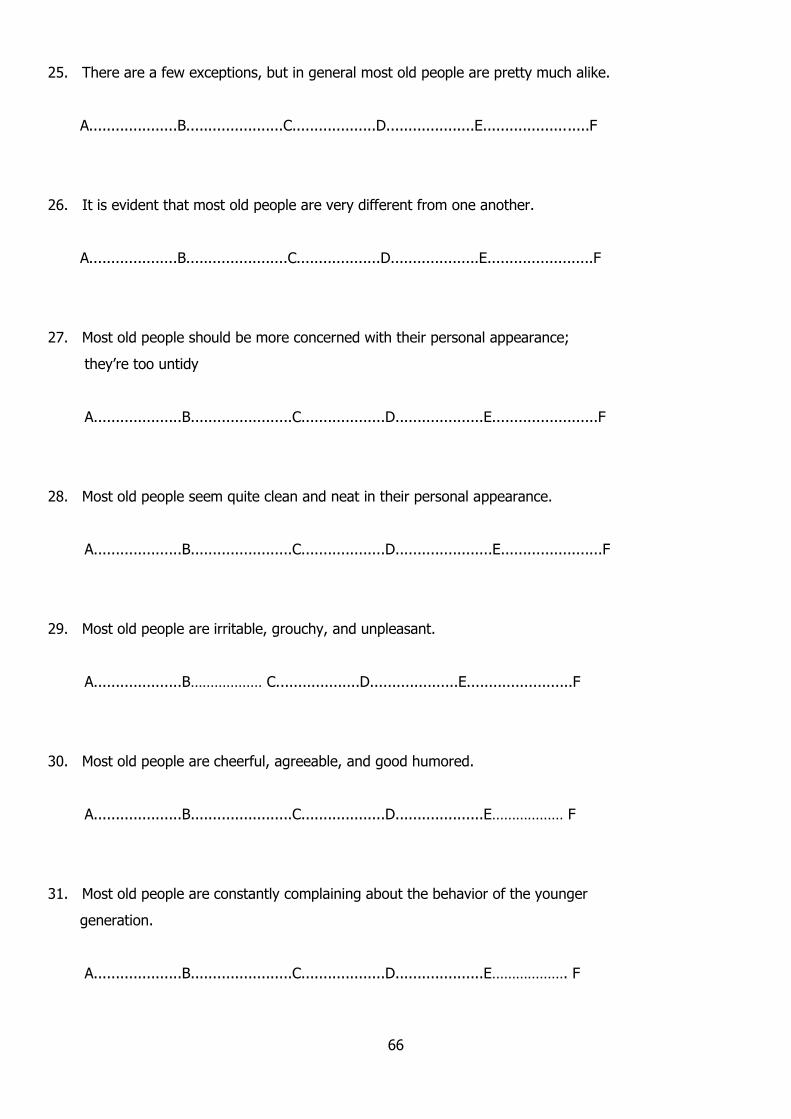
66
25. There are a few exceptions, but in general most old people are pretty much alike.
A....................B......................C...................D....................E........................F
26. It is evident that most old people are very different from one another.
A....................B.......................C...................D....................E........................F
27. Most old people should be more concerned with their personal appearance;
they’re too untidy
A....................B.......................C...................D....................E........................F
28. Most old people seem quite clean and neat in their personal appearance.
A....................B.......................C...................D......................E.......................F
29. Most old people are irritable, grouchy, and unpleasant.
A....................B……………… C...................D....................E........................F
30. Most old people are cheerful, agreeable, and good humored.
A....................B.......................C...................D....................E……………… F
31. Most old people are constantly complaining about the behavior of the younger
generation.
A....................B.......................C...................D....................E………………. F
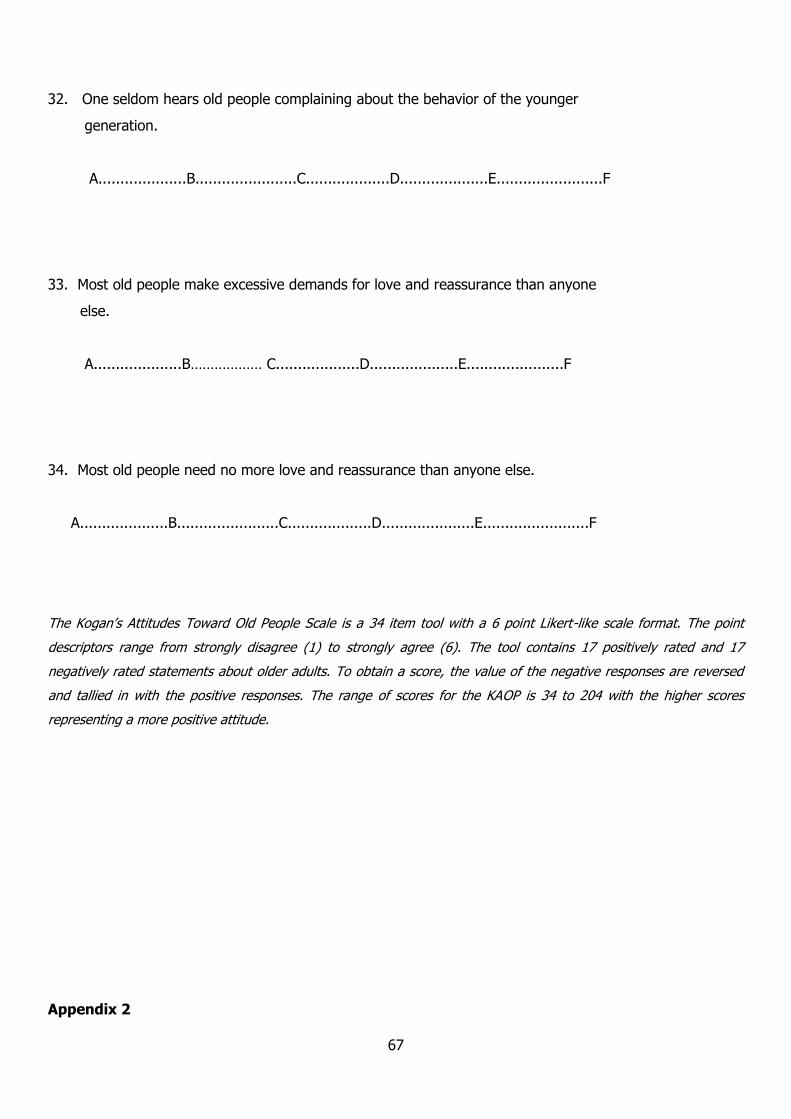
67
32. One seldom hears old people complaining about the behavior of the younger
generation.
A....................B.......................C...................D....................E........................F
33. Most old people make excessive demands for love and reassurance than anyone
else.
A....................B……………… C...................D....................E......................F
34. Most old people need no more love and reassurance than anyone else.
A....................B.......................C...................D.....................E........................F
The Kogan’s Attitudes Toward Old People Scale is a 34 item tool with a 6 point Likert-like scale format. The point
descriptors range from strongly disagree (1) to strongly agree (6). The tool contains 17 positively rated and 17
negatively rated statements about older adults. To obtain a score, the value of the negative responses are reversed
and tallied in with the positive responses. The range of scores for the KAOP is 34 to 204 with the higher scores
representing a more positive attitude.
Appendix 2
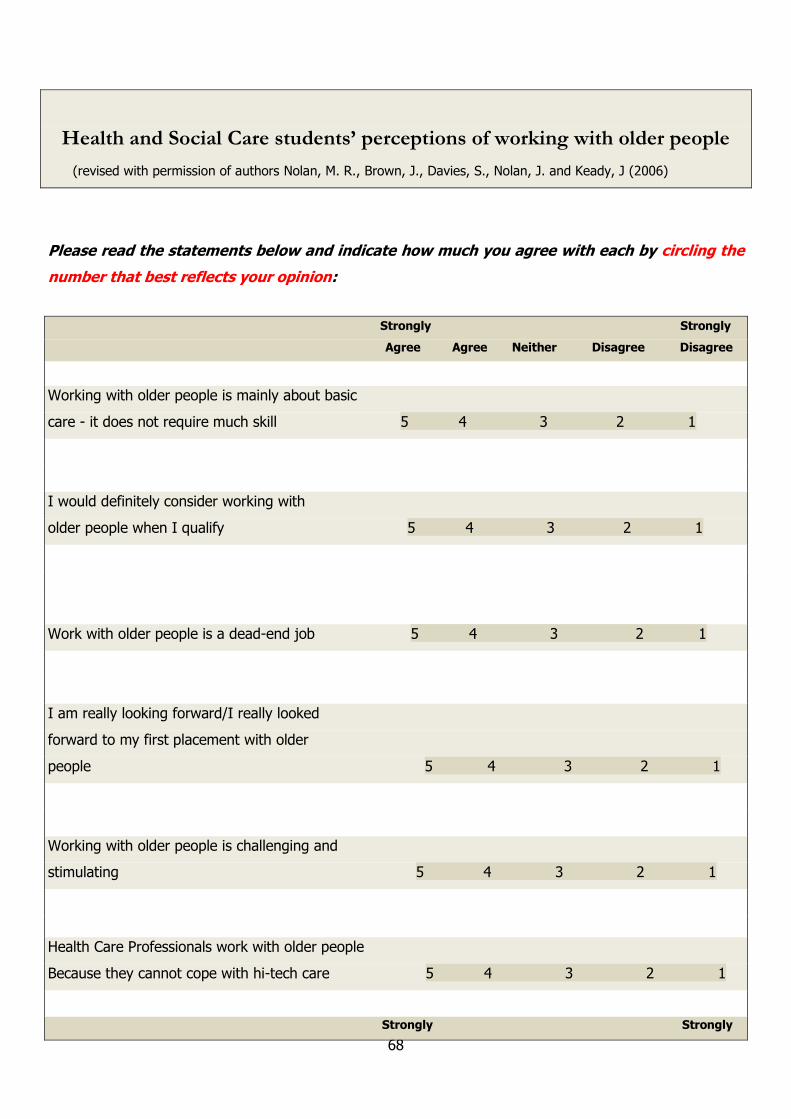
68
Health and Social Care students’ perceptions of working with older people
(revised with permission of authors Nolan, M. R., Brown, J., Davies, S., Nolan, J. and Keady, J (2006)
Please read the statements below and indicate how much you agree with each by circling the
number that best reflects your opinion:
Strongly Strongly
Agree Agree Neither Disagree Disagree
Working with older people is mainly about basic
care - it does not require much skill 5 4 3 2 1
I would definitely consider working with
older people when I qualify 5 4 3 2 1
Work with older people is a dead-end job 5 4 3 2 1
I am really looking forward/I really looked
forward to my first placement with older
people 5 4 3 2 1
Working with older people is challenging and
stimulating 5 4 3 2 1
Health Care Professionals work with older people
Because they cannot cope with hi-tech care 5 4 3 2 1
Strongly Strongly

69
Agree Agree Neither Disagree Disagree
Working with older people has a high
status 5 4 3 2 1
Once you work with older people it is
difficult to get a job elsewhere 5 4 3 2 1
The older you are, the easier it is to have
a good rapport with older people 5 4 3 2 1
I am really anxious/I was really anxious
about my first placement with older people 5 4 3 2 1
Please read the statements below and indicate how much you agree with each by circling the
number that best reflects your opinion:
Strongly Strongly
Agree Agree Neither Disagree Disagree
Working with older people does not
appeal to me at all 5 4 3 2 1
Working with older people is a highly
skilled job 5 4 3 2 1
Working with older people provides little
satisfaction as they rarely get better 5 4 3 2 1
Please read the statements below and indicate how much you agree with each by circling the
number that best reflects your opinion:

70
Strongly Strongly
Agree Agree Neither Disagree Disagree
Working with older people is not a
good career move 5 4 3 2 1
I think older people are really interesting
to work with 5 4 3 2 1
Below are some questions about working with older people
Please respond by ticking the appropriate box or writing your answer in the space provided:
1. Did you work with older people before starting your professional education programme?
No □ (please go to question 2)
Yes □
If yes please briefly describe the work that you did:
.........................................................................................
..............................................................................................................
.........................................................................
..............................................................................................................
.........................................................................
..............................................................................................................
.........................................................................

71
Did you find working with older people?
A very positive experience □ Quite a negative experience□
Quite a positive experience□ A very negative experience □
2. Do you currently work with older people outside of your professional education programme
(e.g. as a care assistant)?
No □ (please go to question 3)
Yes □
Please briefly describe the work that you do:
.............................................................................................................................................................
.............................................................................................................................................................
.............................................................................................................................................................
.................................................................................................................................
Would you say that your current work provides:
A very positive experience □ Quite a negative experience□
Quite a positive experience□ A very negative experience
3. Please add any further thoughts about working with older people.
.............................................................................................................................................................
.............................................................................................................................................................
.............................................................................................................................
..............................................................................................................
................................................................
Finally, some questions about you. Please tick the appropriate boxes:
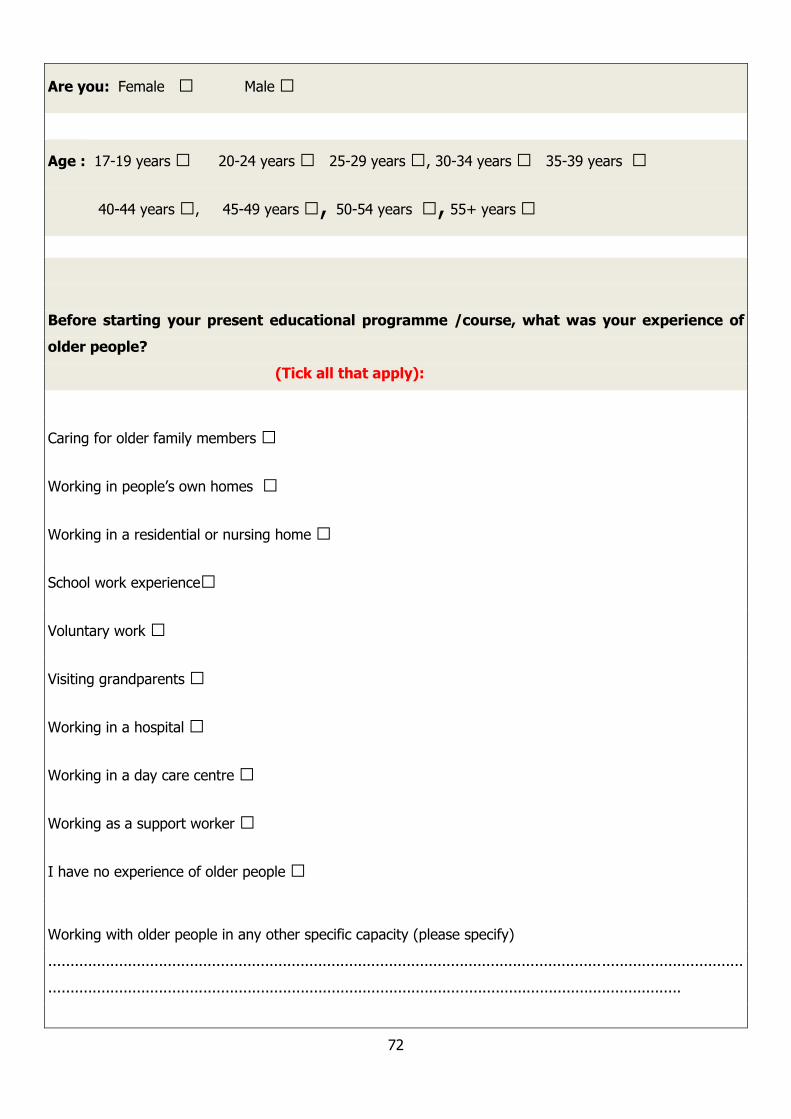
72
Are you: Female □ Male □
Age : 17-19 years □ 20-24 years □ 25-29 years □, 30-34 years □ 35-39 years □
40-44 years □, 45-49 years □, 50-54 years □, 55+ years □
Before starting your present educational programme /course, what was your experience of
older people?
(Tick all that apply):
Caring for older family members □
Working in people’s own homes □
Working in a residential or nursing home □
School work experience□
Voluntary work □
Visiting grandparents □
Working in a hospital □
Working in a day care centre □
Working as a support worker □
I have no experience of older people □
Working with older people in any other specific capacity (please specify)
.............................................................................................................................................................
...............................................................................................................................................

73
What is your highest level of education (presently)?
School Leaving Certificate (second level) □
Certificate (NVQ Level 6) □
Diploma (NVQ Level 7) □
Bachelor’s Degree (NVQ Level 8) □
Post Graduate Degree (NVQ Level 9) □
Other (please specify):
..............................................................................................................
................................
Which of the following best describes your ethnic or cultural origin?
White □ Black (African) □ Indian □ Asian (other) □
Black (other) □ Chinese □
Other (please specify):
...............................................................................................
THANK YOU FOR PARTICIPATING IN THIS REEARCH


![[Global HR Forum 2011] An Age of Centenarians? Lifelong Learning Policies and Ageing](https://img.pdfslide.us/doc/110x75/5590df251a28ab32578b470d/global-hr-forum-2011-an-age-of-centenarians-lifelong-learning-policies-and-ageing.jpg)