Embed Size (px)
Citation preview
J. Acoustic Emission, 30 (2012) 109 © 2012 Acoustic Emission Group
Attenuation of Lamb Waves in CFRP Plates
Kanji Ono1 and Antolino Gallego2 1 Department of Materials Science and Engineering, University of California, Los Angeles
(UCLA), Los Angeles, CA 90095 2 Department of Applied Physics, University of Granada, Granada, Spain
Abstract
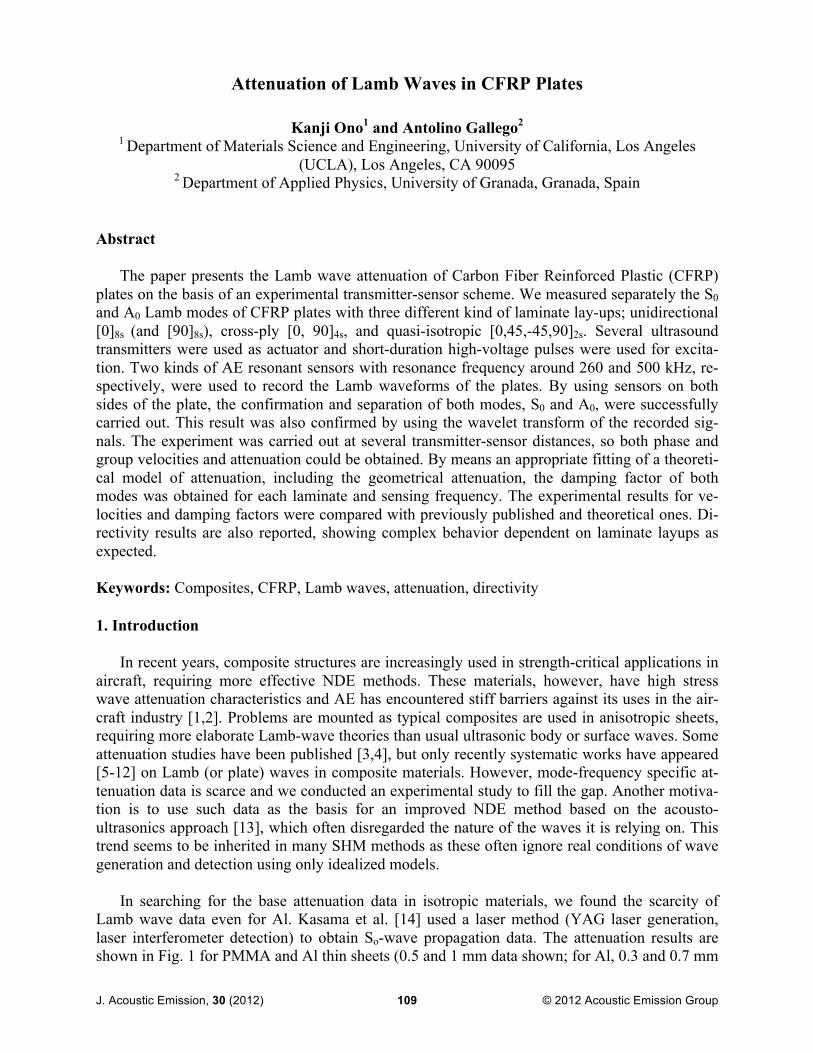
The paper presents the Lamb wave attenuation of Carbon Fiber Reinforced Plastic (CFRP) plates on the basis of an experimental transmitter-sensor scheme. We measured separately the S0 and A0 Lamb modes of CFRP plates with three different kind of laminate lay-ups; unidirectional [0]8s (and [90]8s), cross-ply [0, 90]4s, and quasi-isotropic [0,45,-45,90]2s. Several ultrasound transmitters were used as actuator and short-duration high-voltage pulses were used for excita-tion. Two kinds of AE resonant sensors with resonance frequency around 260 and 500 kHz, re-spectively, were used to record the Lamb waveforms of the plates. By using sensors on both sides of the plate, the confirmation and separation of both modes, S0 and A0, were successfully carried out. This result was also confirmed by using the wavelet transform of the recorded sig-nals. The experiment was carried out at several transmitter-sensor distances, so both phase and group velocities and attenuation could be obtained. By means an appropriate fitting of a theoreti-cal model of attenuation, including the geometrical attenuation, the damping factor of both modes was obtained for each laminate and sensing frequency. The experimental results for ve-locities and damping factors were compared with previously published and theoretical ones. Di-rectivity results are also reported, showing complex behavior dependent on laminate layups as expected. Keywords: Composites, CFRP, Lamb waves, attenuation, directivity 1. Introduction In recent years, composite structures are increasingly used in strength-critical applications in aircraft, requiring more effective NDE methods. These materials, however, have high stress wave attenuation characteristics and AE has encountered stiff barriers against its uses in the air-craft industry [1,2]. Problems are mounted as typical composites are used in anisotropic sheets, requiring more elaborate Lamb-wave theories than usual ultrasonic body or surface waves. Some attenuation studies have been published [3,4], but only recently systematic works have appeared [5-12] on Lamb (or plate) waves in composite materials. However, mode-frequency specific at-tenuation data is scarce and we conducted an experimental study to fill the gap. Another motiva-tion is to use such data as the basis for an improved NDE method based on the acousto-ultrasonics approach [13], which often disregarded the nature of the waves it is relying on. This trend seems to be inherited in many SHM methods as these often ignore real conditions of wave generation and detection using only idealized models. In searching for the base attenuation data in isotropic materials, we found the scarcity of Lamb wave data even for Al. Kasama et al. [14] used a laser method (YAG laser generation, laser interferometer detection) to obtain So-wave propagation data. The attenuation results are shown in Fig. 1 for PMMA and Al thin sheets (0.5 and 1 mm data shown; for Al, 0.3 and 0.7 mm
110
data also obtained). The data has eliminated the geometrical spreading effect of the inverse-square-root distance. For Al, the attenuation coefficient α (of the exponential decay with dis-tance) is 0.25 to 2 Np/m (or 2.2 to 17 dB/m) at 0.5~5 MHz, whereas it is much higher for PMMA by a factor of 10~50. In Fig. 1, x marks represent corresponding P-wave attenuation values. Note there are significant frequency effects (higher for viscoelastic PMMA) and also a thickness ef-fect. Aljets found 2 Np/m using pencil-lead break source and PAC µ80 sensor [11].
Fig. 1 Lamb wave attenuation in PMMA and Al sheets. Redrawn data of Kasama et al. [14].
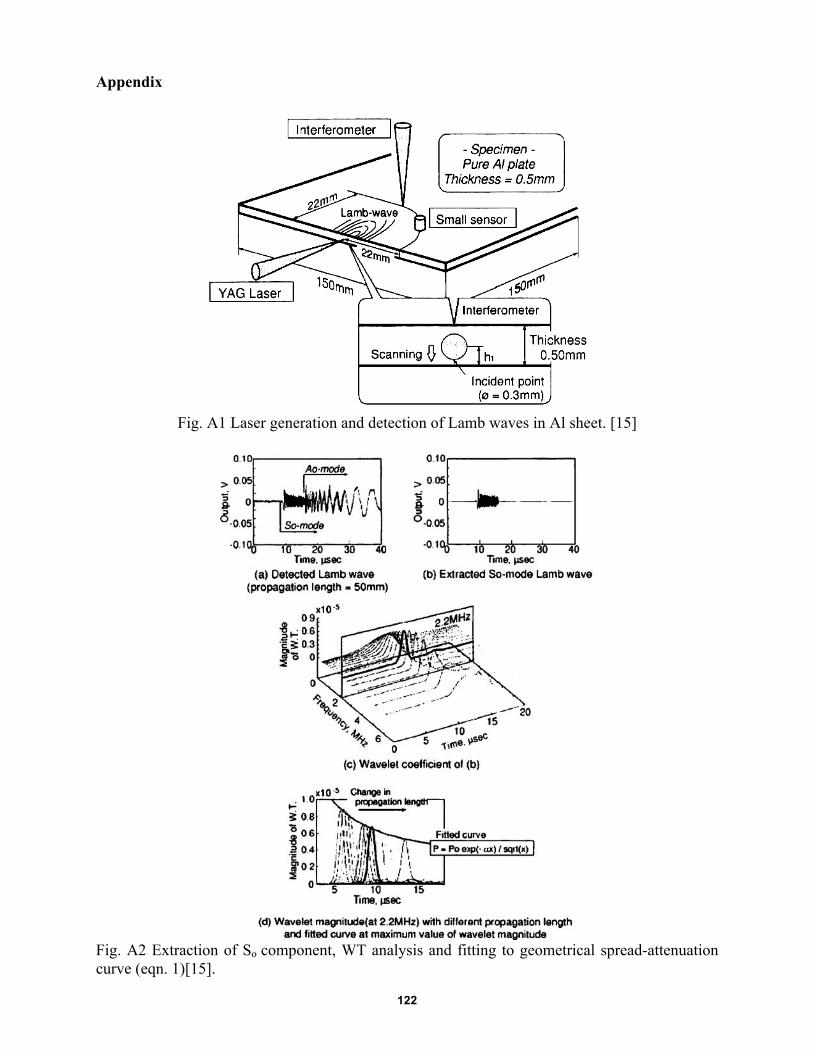
Kasama’s experimental setup is shown schematically in Fig. A1 (in Appendix) from his the-
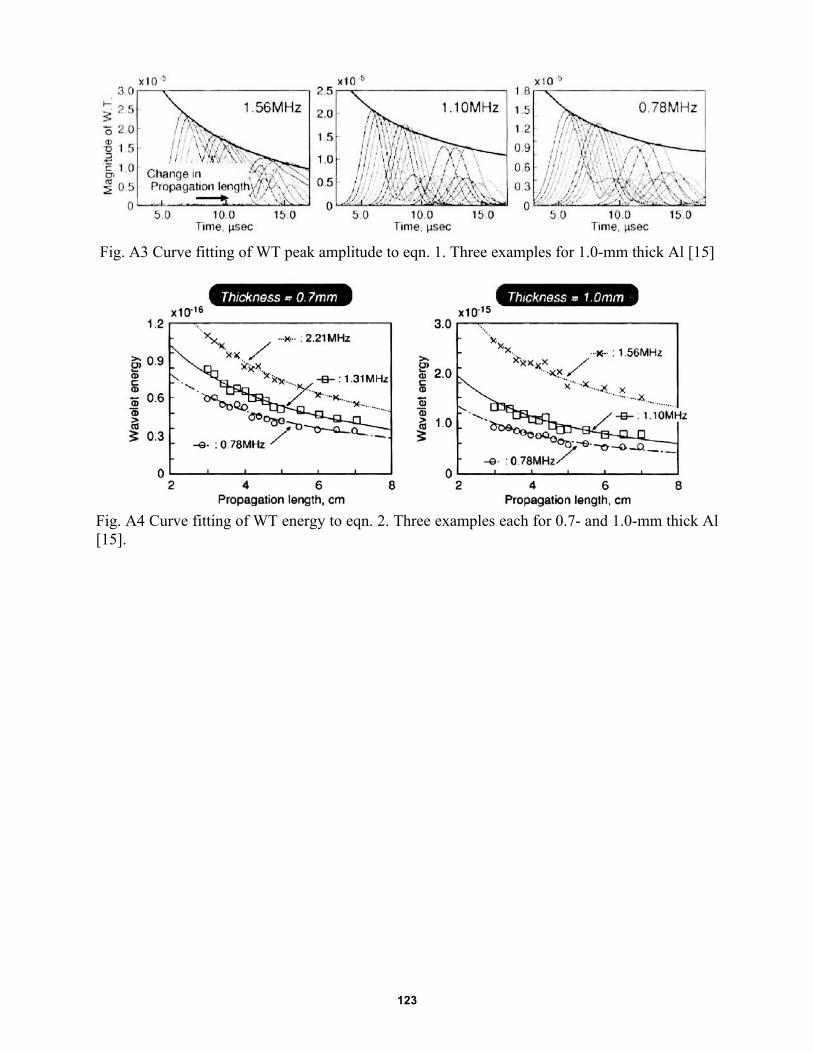
sis [15]. YAG laser beam is focused on a plate edge in the in-plane orientation and a laser inter-ferometer detected the surface displacement as a function of distance from the source. They used only the initial S0-mode segment as later segment includes both modes, as shown in Fig. A2. Wavelet amplitude at a selected frequency, P, is then determined and its peak (also see Fig. A2) and the integrated WT energy of E = ∫P2 dt were plotted against the distance of propagation. Typical examples of the peak-amplitude fit and WT energy fit are shown in Figs. A3 and A4, respectively. The peak amplitude-distance curves were fitted to the inverse square-root-exponential attenuation that includes the geometrical spreading effect. The attenuation coeffi-cient, α, is obtained from the best-fit equation. The integrated WT energy data was fitted to the square of the above expression, again yielding the attenuation coefficient, α. These are eqns. (1) and (2) below.
𝑃 = 𝑃! 1𝑥 exp (–𝛼𝑥) (1)
𝐸 = 𝐸! 1 𝑥 exp (– 2𝛼𝑥) (2) Both of these equations are based on the wave radiation pattern of a point source [16]. Kasama confirmed the predicted directivity of [16] by measuring the peak amplitude of S0 waves at 50 mm from the source. The polar plot shows good agreement with theoretical shape of the P-wave radiation pattern [16, 17]. Note that the directivity of a point source can be approximated with the cos-θ angular dependence (equivalent to the half of a dipole point source) [18].
111
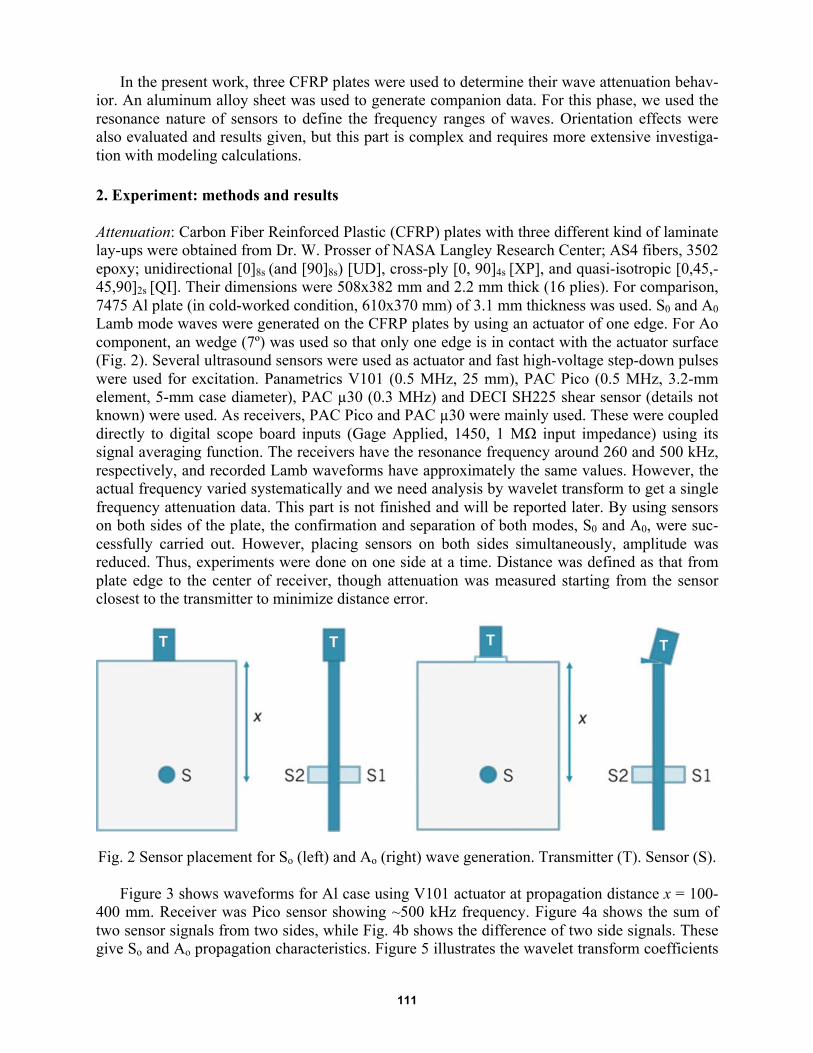
In the present work, three CFRP plates were used to determine their wave attenuation behav-ior. An aluminum alloy sheet was used to generate companion data. For this phase, we used the resonance nature of sensors to define the frequency ranges of waves. Orientation effects were also evaluated and results given, but this part is complex and requires more extensive investiga-tion with modeling calculations. 2. Experiment: methods and results Attenuation: Carbon Fiber Reinforced Plastic (CFRP) plates with three different kind of laminate lay-ups were obtained from Dr. W. Prosser of NASA Langley Research Center; AS4 fibers, 3502 epoxy; unidirectional [0]8s (and [90]8s) [UD], cross-ply [0, 90]4s [XP], and quasi-isotropic [0,45,-45,90]2s [QI]. Their dimensions were 508x382 mm and 2.2 mm thick (16 plies). For comparison, 7475 Al plate (in cold-worked condition, 610x370 mm) of 3.1 mm thickness was used. S0 and A0 Lamb mode waves were generated on the CFRP plates by using an actuator of one edge. For Ao component, an wedge (7º) was used so that only one edge is in contact with the actuator surface (Fig. 2). Several ultrasound sensors were used as actuator and fast high-voltage step-down pulses were used for excitation. Panametrics V101 (0.5 MHz, 25 mm), PAC Pico (0.5 MHz, 3.2-mm element, 5-mm case diameter), PAC µ30 (0.3 MHz) and DECI SH225 shear sensor (details not known) were used. As receivers, PAC Pico and PAC µ30 were mainly used. These were coupled directly to digital scope board inputs (Gage Applied, 1450, 1 MΩ input impedance) using its signal averaging function. The receivers have the resonance frequency around 260 and 500 kHz, respectively, and recorded Lamb waveforms have approximately the same values. However, the actual frequency varied systematically and we need analysis by wavelet transform to get a single frequency attenuation data. This part is not finished and will be reported later. By using sensors on both sides of the plate, the confirmation and separation of both modes, S0 and A0, were suc-cessfully carried out. However, placing sensors on both sides simultaneously, amplitude was reduced. Thus, experiments were done on one side at a time. Distance was defined as that from plate edge to the center of receiver, though attenuation was measured starting from the sensor closest to the transmitter to minimize distance error.
Fig. 2 Sensor placement for So (left) and Ao (right) wave generation. Transmitter (T). Sensor (S).
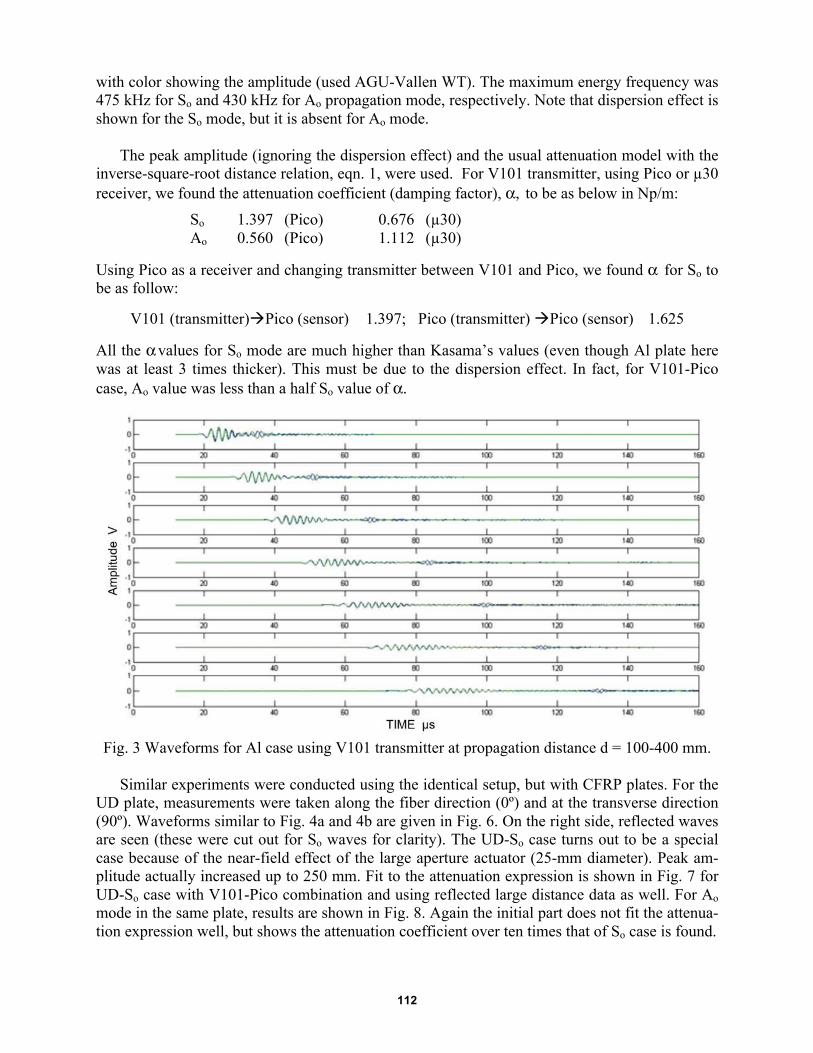
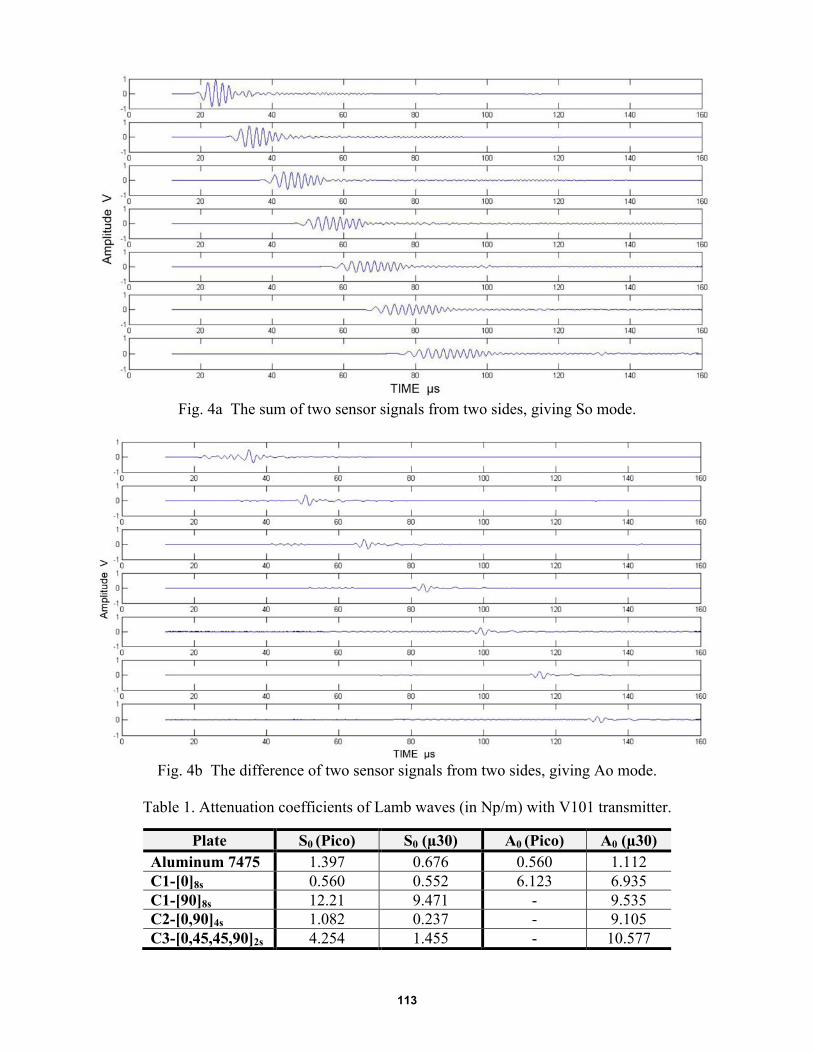
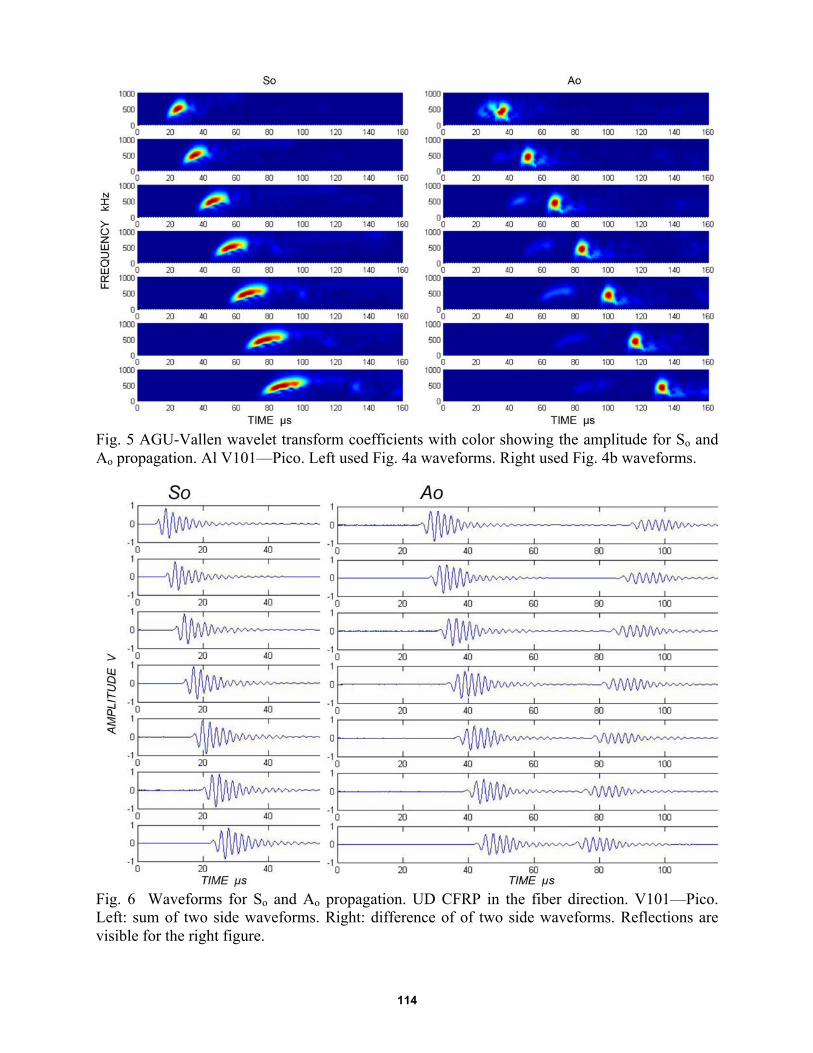
Figure 3 shows waveforms for Al case using V101 actuator at propagation distance x = 100-400 mm. Receiver was Pico sensor showing ~500 kHz frequency. Figure 4a shows the sum of two sensor signals from two sides, while Fig. 4b shows the difference of two side signals. These give So and Ao propagation characteristics. Figure 5 illustrates the wavelet transform coefficients
112
with color showing the amplitude (used AGU-Vallen WT). The maximum energy frequency was 475 kHz for So and 430 kHz for Ao propagation mode, respectively. Note that dispersion effect is shown for the So mode, but it is absent for Ao mode.
The peak amplitude (ignoring the dispersion effect) and the usual attenuation model with the inverse-square-root distance relation, eqn. 1, were used. For V101 transmitter, using Pico or µ30 receiver, we found the attenuation coefficient (damping factor), α, to be as below in Np/m: So 1.397 (Pico) 0.676 (µ30) Ao 0.560 (Pico) 1.112 (µ30)
Using Pico as a receiver and changing transmitter between V101 and Pico, we found α for So to be as follow:
V101 (transmitter)Pico (sensor) 1.397; Pico (transmitter) Pico (sensor) 1.625
All the α values for So mode are much higher than Kasama’s values (even though Al plate here was at least 3 times thicker). This must be due to the dispersion effect. In fact, for V101-Pico case, Ao value was less than a half So value of α.
Fig. 3 Waveforms for Al case using V101 transmitter at propagation distance d = 100-400 mm.
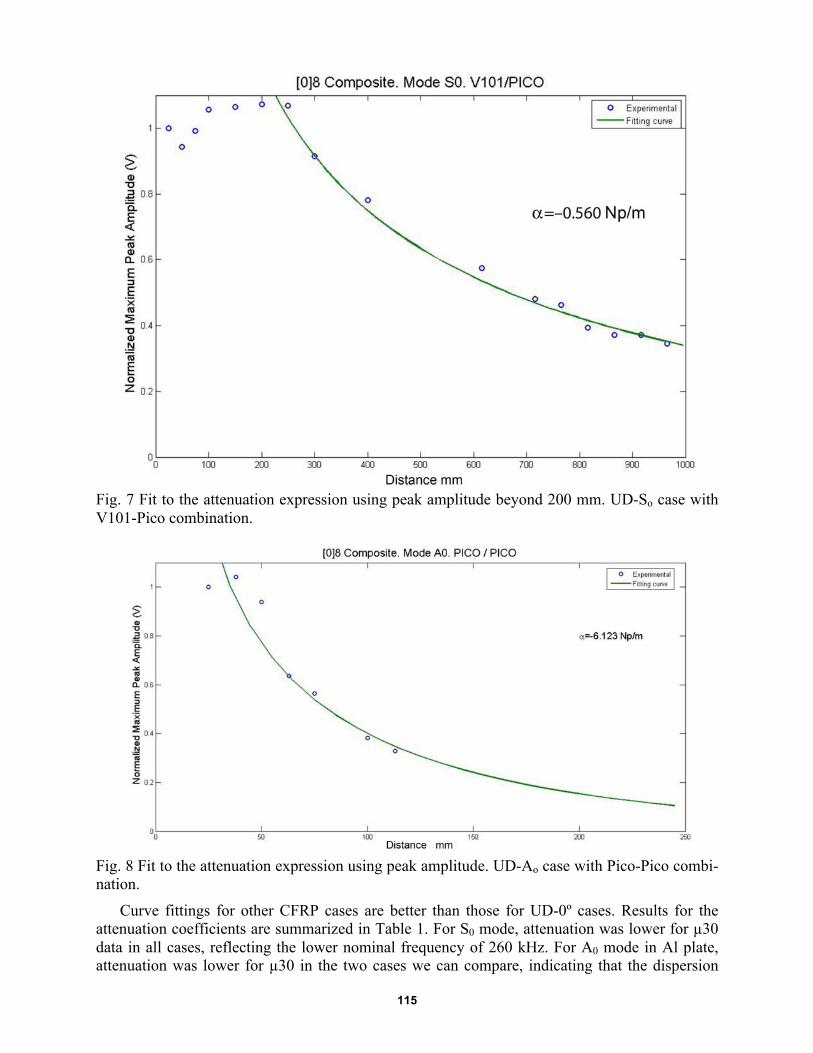
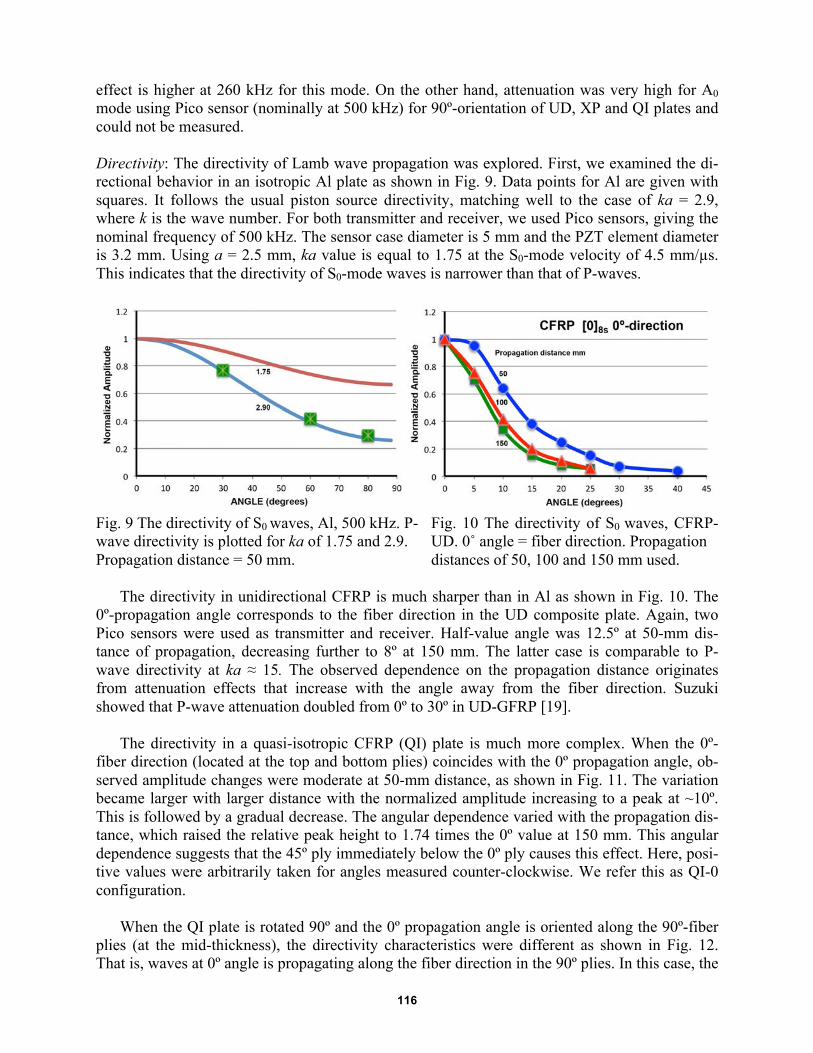
Similar experiments were conducted using the identical setup, but with CFRP plates. For the UD plate, measurements were taken along the fiber direction (0º) and at the transverse direction (90º). Waveforms similar to Fig. 4a and 4b are given in Fig. 6. On the right side, reflected waves are seen (these were cut out for So waves for clarity). The UD-So case turns out to be a special case because of the near-field effect of the large aperture actuator (25-mm diameter). Peak am-plitude actually increased up to 250 mm. Fit to the attenuation expression is shown in Fig. 7 for UD-So case with V101-Pico combination and using reflected large distance data as well. For Ao mode in the same plate, results are shown in Fig. 8. Again the initial part does not fit the attenua-tion expression well, but shows the attenuation coefficient over ten times that of So case is found.
113
Fig. 4a The sum of two sensor signals from two sides, giving So mode.
Fig. 4b The difference of two sensor signals from two sides, giving Ao mode.
Table 1. Attenuation coefficients of Lamb waves (in Np/m) with V101 transmitter.
Plate S0 (Pico) S0 (µ30) A0 (Pico) A0 (µ30) Aluminum 7475 1.397 0.676 0.560 1.112 C1-[0]8s 0.560 0.552 6.123 6.935 C1-[90]8s 12.21 9.471 - 9.535 C2-[0,90]4s 1.082 0.237 - 9.105 C3-[0,45,45,90]2s 4.254 1.455 - 10.577
114
Fig. 5 AGU-Vallen wavelet transform coefficients with color showing the amplitude for So and Ao propagation. Al V101—Pico. Left used Fig. 4a waveforms. Right used Fig. 4b waveforms.
Fig. 6 Waveforms for So and Ao propagation. UD CFRP in the fiber direction. V101—Pico. Left: sum of two side waveforms. Right: difference of of two side waveforms. Reflections are visible for the right figure.
115
Fig. 7 Fit to the attenuation expression using peak amplitude beyond 200 mm. UD-So case with V101-Pico combination.
Fig. 8 Fit to the attenuation expression using peak amplitude. UD-Ao case with Pico-Pico combi-nation.
Curve fittings for other CFRP cases are better than those for UD-0º cases. Results for the attenuation coefficients are summarized in Table 1. For S0 mode, attenuation was lower for µ30 data in all cases, reflecting the lower nominal frequency of 260 kHz. For A0 mode in Al plate, attenuation was lower for µ30 in the two cases we can compare, indicating that the dispersion
116
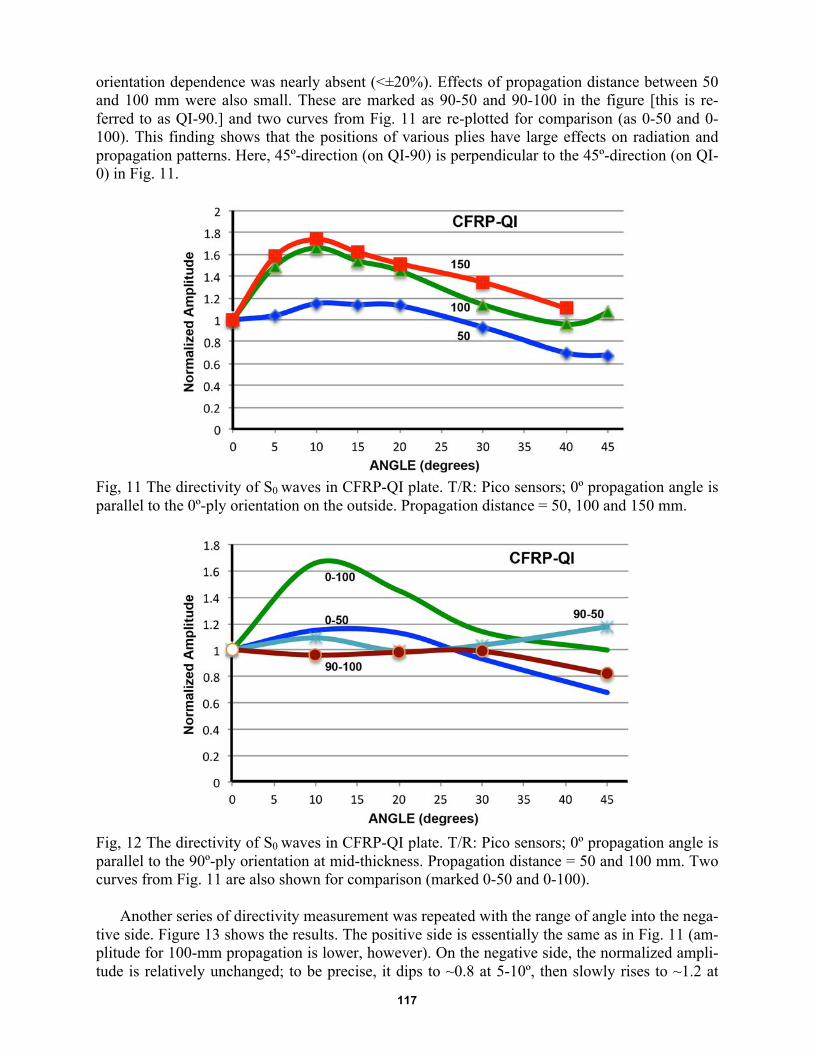
effect is higher at 260 kHz for this mode. On the other hand, attenuation was very high for A0 mode using Pico sensor (nominally at 500 kHz) for 90º-orientation of UD, XP and QI plates and could not be measured. Directivity: The directivity of Lamb wave propagation was explored. First, we examined the di-rectional behavior in an isotropic Al plate as shown in Fig. 9. Data points for Al are given with squares. It follows the usual piston source directivity, matching well to the case of ka = 2.9, where k is the wave number. For both transmitter and receiver, we used Pico sensors, giving the nominal frequency of 500 kHz. The sensor case diameter is 5 mm and the PZT element diameter is 3.2 mm. Using a = 2.5 mm, ka value is equal to 1.75 at the S0-mode velocity of 4.5 mm/µs. This indicates that the directivity of S0-mode waves is narrower than that of P-waves.
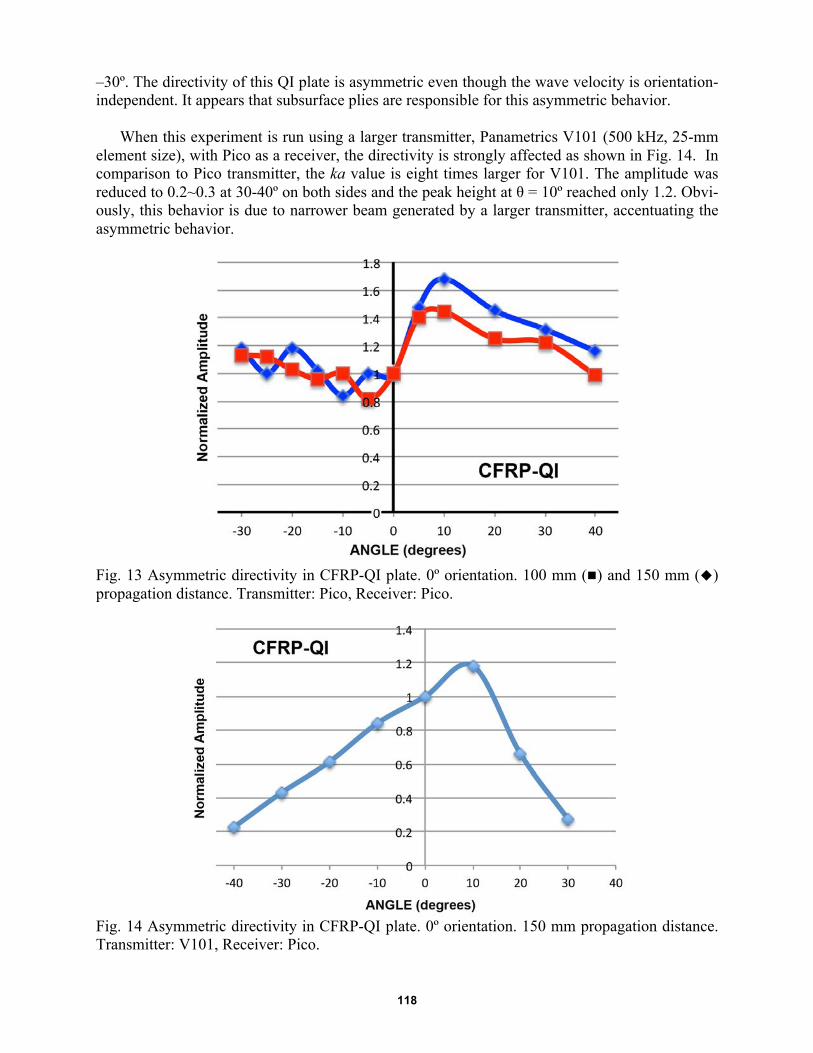
Fig. 9 The directivity of S0 waves, Al, 500 kHz. P- Fig. 10 The directivity of S0 waves, CFRP- wave directivity is plotted for ka of 1.75 and 2.9. UD. 0˚ angle = fiber direction. Propagation Propagation distance = 50 mm. distances of 50, 100 and 150 mm used. The directivity in unidirectional CFRP is much sharper than in Al as shown in Fig. 10. The 0º-propagation angle corresponds to the fiber direction in the UD composite plate. Again, two Pico sensors were used as transmitter and receiver. Half-value angle was 12.5º at 50-mm dis-tance of propagation, decreasing further to 8º at 150 mm. The latter case is comparable to P-wave directivity at ka ≈ 15. The observed dependence on the propagation distance originates from attenuation effects that increase with the angle away from the fiber direction. Suzuki showed that P-wave attenuation doubled from 0º to 30º in UD-GFRP [19]. The directivity in a quasi-isotropic CFRP (QI) plate is much more complex. When the 0º-fiber direction (located at the top and bottom plies) coincides with the 0º propagation angle, ob-served amplitude changes were moderate at 50-mm distance, as shown in Fig. 11. The variation became larger with larger distance with the normalized amplitude increasing to a peak at ~10º. This is followed by a gradual decrease. The angular dependence varied with the propagation dis-tance, which raised the relative peak height to 1.74 times the 0º value at 150 mm. This angular dependence suggests that the 45º ply immediately below the 0º ply causes this effect. Here, posi-tive values were arbitrarily taken for angles measured counter-clockwise. We refer this as QI-0 configuration. When the QI plate is rotated 90º and the 0º propagation angle is oriented along the 90º-fiber plies (at the mid-thickness), the directivity characteristics were different as shown in Fig. 12. That is, waves at 0º angle is propagating along the fiber direction in the 90º plies. In this case, the
117
orientation dependence was nearly absent (<±20%). Effects of propagation distance between 50 and 100 mm were also small. These are marked as 90-50 and 90-100 in the figure [this is re-ferred to as QI-90.] and two curves from Fig. 11 are re-plotted for comparison (as 0-50 and 0-100). This finding shows that the positions of various plies have large effects on radiation and propagation patterns. Here, 45º-direction (on QI-90) is perpendicular to the 45º-direction (on QI-0) in Fig. 11.
Fig, 11 The directivity of S0 waves in CFRP-QI plate. T/R: Pico sensors; 0º propagation angle is parallel to the 0º-ply orientation on the outside. Propagation distance = 50, 100 and 150 mm.
Fig, 12 The directivity of S0 waves in CFRP-QI plate. T/R: Pico sensors; 0º propagation angle is parallel to the 90º-ply orientation at mid-thickness. Propagation distance = 50 and 100 mm. Two curves from Fig. 11 are also shown for comparison (marked 0-50 and 0-100). Another series of directivity measurement was repeated with the range of angle into the nega-tive side. Figure 13 shows the results. The positive side is essentially the same as in Fig. 11 (am-plitude for 100-mm propagation is lower, however). On the negative side, the normalized ampli-tude is relatively unchanged; to be precise, it dips to ~0.8 at 5-10º, then slowly rises to ~1.2 at
118
–30º. The directivity of this QI plate is asymmetric even though the wave velocity is orientation-independent. It appears that subsurface plies are responsible for this asymmetric behavior. When this experiment is run using a larger transmitter, Panametrics V101 (500 kHz, 25-mm element size), with Pico as a receiver, the directivity is strongly affected as shown in Fig. 14. In comparison to Pico transmitter, the ka value is eight times larger for V101. The amplitude was reduced to 0.2~0.3 at 30-40º on both sides and the peak height at θ = 10º reached only 1.2. Obvi-ously, this behavior is due to narrower beam generated by a larger transmitter, accentuating the asymmetric behavior.
Fig. 13 Asymmetric directivity in CFRP-QI plate. 0º orientation. 100 mm () and 150 mm () propagation distance. Transmitter: Pico, Receiver: Pico.
Fig. 14 Asymmetric directivity in CFRP-QI plate. 0º orientation. 150 mm propagation distance. Transmitter: V101, Receiver: Pico.
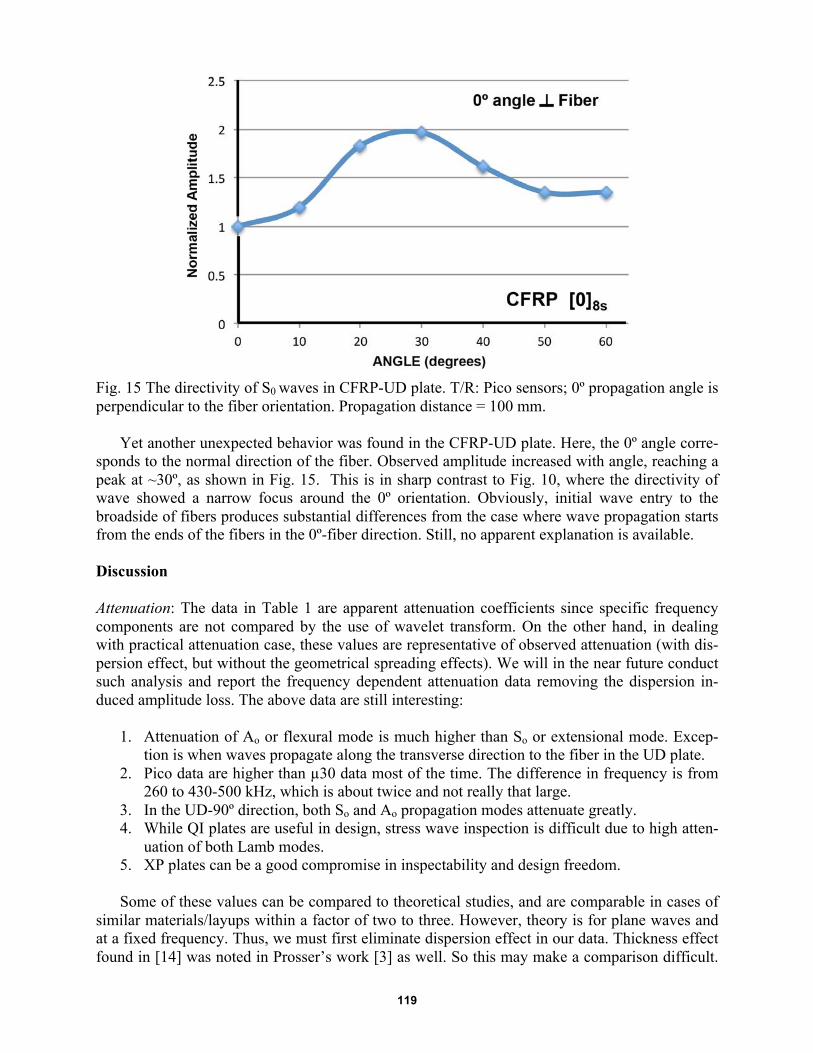
119
Fig. 15 The directivity of S0 waves in CFRP-UD plate. T/R: Pico sensors; 0º propagation angle is perpendicular to the fiber orientation. Propagation distance = 100 mm. Yet another unexpected behavior was found in the CFRP-UD plate. Here, the 0º angle corre-sponds to the normal direction of the fiber. Observed amplitude increased with angle, reaching a peak at ~30º, as shown in Fig. 15. This is in sharp contrast to Fig. 10, where the directivity of wave showed a narrow focus around the 0º orientation. Obviously, initial wave entry to the broadside of fibers produces substantial differences from the case where wave propagation starts from the ends of the fibers in the 0º-fiber direction. Still, no apparent explanation is available. Discussion Attenuation: The data in Table 1 are apparent attenuation coefficients since specific frequency components are not compared by the use of wavelet transform. On the other hand, in dealing with practical attenuation case, these values are representative of observed attenuation (with dis-persion effect, but without the geometrical spreading effects). We will in the near future conduct such analysis and report the frequency dependent attenuation data removing the dispersion in-duced amplitude loss. The above data are still interesting:
1. Attenuation of Ao or flexural mode is much higher than So or extensional mode. Excep-tion is when waves propagate along the transverse direction to the fiber in the UD plate.
2. Pico data are higher than µ30 data most of the time. The difference in frequency is from 260 to 430-500 kHz, which is about twice and not really that large.
3. In the UD-90º direction, both So and Ao propagation modes attenuate greatly. 4. While QI plates are useful in design, stress wave inspection is difficult due to high atten-
uation of both Lamb modes. 5. XP plates can be a good compromise in inspectability and design freedom.
Some of these values can be compared to theoretical studies, and are comparable in cases of similar materials/layups within a factor of two to three. However, theory is for plane waves and at a fixed frequency. Thus, we must first eliminate dispersion effect in our data. Thickness effect found in [14] was noted in Prosser’s work [3] as well. So this may make a comparison difficult.
120
We attempted to use lower frequency sensors at 30-150 kHz, but mode mixing prevented us from getting meaningful data. Larger plates are also necessary for such experiments. For the case of XP plate, we can compare with Aljets’ data for twill-weave CFRP of 2.5-mm thick [11]. Along the fiber direction, he obtained 1.78 Np/m for S0 waves at 250-300 kHz, and 6.17 Np/m for A0 waves at 150-200 kHz, respectively. These values were recalculated from his Fig. 56. Signal source was pencil-lead breaks. At the direction 45º to the fibers, attenuation coef-ficients were slightly higher at 2.67 and 6.49 Np/m for S0 and A0 waves, respectively. The atten-uation coefficients for S0 waves were significantly higher than our XP results. A possible origin is their use of twill-weave, which produces undulations of fibers and higher resin contents. The differences for A0 waves were smaller; our µ30 data is only 50% higher than Aljets data. What this work shows is that it is indeed difficult to conduct AE or acousto-ultrasonic exper-iments at frequency above 250 kHz due to high attenuation. As CARP’s procedures for FRP tank inspection used under 100-kHz range, aerospace composite NDE should look for the lower fre-quency range to provide workable and practical solutions. In acousto-ultrasonic methods, typical excitation mode is surface-driven sensor. This generates mainly flexural mode, which attenuates highly. We need to devise a means to excite extensional mode with good efficiency and movabil-ity. Directivity: Preliminary examination of directivity in CFRP has revealed a complex behavior. In UD-composite along the fiber direction, waves travel along the fibers with narrow beam spread. In most other cases, ready understanding is unavailable except that the transmitter radiation pat-tern and the directional attenuation of CFRP plates jointly produced the observed characteristics. It is necessary to accumulate more experimental results before consistent interpretations can be developed. It will be helpful if we can separate radiation pattern and orientation dependent atten-uation as a function of frequency and propagation modes. Obviously, high-level modeling is needed to explain these findings. However, understanding these characteristics will benefit future AE applications on composite materials. Conclusion Apparent attenuation of Lamb wave propagation was measured for specific modes on CFRP plates of three different layups. Generally, attenuation is high limiting the reach of stress-wave based NDE methods. It is essential to utilize a lower frequency range for practical NDE methods. Directivity of wave propagation revealed complex behavior, requiring further studies.
Acknowledgement Assistance of Zhiyuan Wu in experiment and of Elisabet Suárez Vargas in analysis is highly appreciated. References 1. U. Schnars, R. Henrich, “Applications of NDT methods on composite structures in aerospace industry”, Online-Proc. Conf. on Damage in Composite Materials – CDCM2006, Vol. 12, No. 12 (2006). http://www.ndt.net/article/cdcm2006/ 2. T. Ullmann, T. Schmidt, S. Hofmann, R. Jemmali, “In-line quality assurance for the manufac-turing of carbon fiber reinforced aircraft structures”, 2nd Intl Symp. on NDT in Aerospace 2010 -
121
Tu.1.A.4. http://www.ndt.net/article/aero2010/papers/tu1a4.pdf 3. W.H. Prosser, “Advanced AE techniques in composite materials research”, J. Acoustic Emis-sion, vol. 14, 1996, pp. S1-S11. 4. A.K. Mal, Y. Bar-Cohen and S.S. Lih, "Wave attenuation in fiber-reinforced composites," M3D: Mechanics and Mechanisms of Material Damping, ASTM STP 1169, American Society for Testing and Materials, 1992, pp. 245-261. 5. M. Castaings, B. Hosten, “Air-coupled measurement of plane wave, ultrasonic plate transmission for characterising anisotropic, viscoelastic materials”, Ultrasonics, vol. 38, 2000, pp. 781–786. 6. M. Castaings, B. Hosten, T. Kundu, “Inversion of ultrasonic, plane-wave transmission data in composite plates to infer viscoelastic material properties. NDT & E International, vol. 33, no.6, 2000, pp. 377–92. 7. B. Hosten, “Heterogeneous structure of modes and Kramers–Kronig relationship in aniso-tropic viscoelastic materials”, J. Acoust. Soc. Am. vol. 104 (3), September 1998, pp. 1382-1388. 8. M. Castaings, M.V. Predoi, B. Hosten, “Ultrasound propagation in viscoelastic material guides”, Proceedings of the COMSOL Multiphysics User's Conference 2005 Paris, 6 p. 9. M. Calomfirescu, “Lamb Waves for Structural Health Monitoring in Viscoelastic Composite Materials”, Logos Verlag, Berlin, Germany, 2008. 119 p. 10. M. Sause, Identification of failure mechanisms in hybrid materials utilizing pattern recogni-tion techniques applied to acoustic emission signals, Augsburg Univ. doctoral dissertation, Mensch und Buch Verlag, 2010, 305 p. 11. D. Aljets, “Acoustic Emission Source Location in Composite Aircraft Structures using Modal Analysis”, Ph.D. Thesis, Faculty of Advanced Technology, University of Glamorgan, June 2011, 163 p. http://dspace1.isd.glam.ac.uk/dspace/bitstream/10265/575/1/PhD%20Thesis%20Dirk %20Aljets.pdf 12. M.A. Torres-Arredondo, C.-P. Fritzen, “A viscoelastic plate theory for the fast modelling of Lamb wave solutions in NDT/SHM applications”, Ultragarsas (Ultrasound), vol. 66, No. 2, 2011, pp. 7-13. 13. Acousto-Ultrasonics, Special Issue, J. Acoustic Emission, vol. 12, nos. 1/2, pp. 1-103. 14. H. Kasama, M. Takemoto, K. Ono, “Attenuation measurement of Laser excited So-Lamb wave by the wavelet transform and porosity estimation in superplastic Al-Mg plate”, Hihakai-kensa (Nondestructive Testing), vol. 49, no. 4, 2000, pp. 269-276. 15. H. Kasama, MS Thesis, Dept. Mechanical Engineering, Aoyama Gakuin Univ., Sagamihara, Kanagawa, Japan, 1999, 102 p. 16. D.A. Hutchins, R.J. Dewhurst, and S.B. Palmer, “Directivity patterns of laser‐generated ul-trasound in aluminum”, J. Acoust. Soc. Am. vol. 70, 1981, pp. 1362-1369. 17. S.J. Davies, C. Edwards, G.S. Taylor and S.B. Palmer, “Laser-generated ultrasound: its properties, mechanisms and multifarious applications“, J. Phys. D: Appl. Phys. vol. 26 (1993) 329-348. 18. X.M. Tang, Zhenya Zhu, and M.N. Toksöz, “Radiation patterns of compressional and shear transducers at the surface of an elastic half-space’, J. Acoust. Soc. Am. 95 (1), 1994, 71-76. 19. H. Suzuki, “Fracture dynamics via inverse analysis of viscoelastic waves”, doctoral thesis, Tokyo Inst. Technology, 2000, 176 p.
122
Appendix
Fig. A1 Laser generation and detection of Lamb waves in Al sheet. [15]
Fig. A2 Extraction of So component, WT analysis and fitting to geometrical spread-attenuation curve (eqn. 1)[15].
123
Fig. A3 Curve fitting of WT peak amplitude to eqn. 1. Three examples for 1.0-mm thick Al [15]
Fig. A4 Curve fitting of WT energy to eqn. 2. Three examples each for 0.7- and 1.0-mm thick Al [15].


![Attenuation of Lamb Waves in CFRP Plates · wave attenuation characteristics and AE has encountered stiff barriers against its uses in the air-craft industry [1,2]. Problems are mounted](https://img.pdfslide.us/doc/110x75/5e705467b7bed33a0c09ca37/attenuation-of-lamb-waves-in-cfrp-plates-wave-attenuation-characteristics-and-ae.jpg)


![CFRP [Wet-preg]](https://img.pdfslide.us/doc/110x75/546e6828b4af9faa268b4674/cfrp-wet-preg.jpg)