Embed Size (px)
Citation preview
8/6/2019 Attenuation Low Freq Waves New Madrid
http://slidepdf.com/reader/full/attenuation-low-freq-waves-new-madrid 1/13
Bulle t in o f the Seismological Soc ie ty of Ame r ica , Vol . 68 , No. 2 , pp . 343-355 , Apri l , 1978
A TIME-DOMAIN STUDY OF THE ATTENUATION OF 10-Hz WAVES IN
THE NEW MADRID SEISMIC ZONE
BY OTTO W. NUTTLI
ABSTRACT
F r o m a ti m e - d o m a i n s t u d y , t h e a m p l i t u d e o f l O - H z P w a v e s i n t h e N e w M a d r i d
s e i s m i c z o n e w a s f o u n d t o f a l l o f f a s t h e i n v e r s e 1 . 4 p o w e r o f t h e e p i c e n t r a l
d i s t a n c e . T h e a m p l i t u d e o f l O - H z Lg w a v e s w a s f o u n d t o d e c a y a s f o r a n A i r y
p h a s e w i t h a c o e f f i c i e n t o f a n e l a s t i c a t t e n u a t i o n o f 0 . 0 0 6 k m - ' . I n a l m o s t a l l
c a s e s t h e Lg m o t i o n w a s f o u n d t o b e l a r g e r t h a n t h a t o f P , e v e n a t e p i c e n t r a l
d i s t a n c e s o f 5 k m a n d l e s s . T h u s d e s i g n e a r t h q u a k e m o t i o n s n e e d t o b e
c o n c e r n e d w i th Lg w a v e s , w h o s e c o d a a l s o h a v e a lo n g e r d u r a ti o n th a n t h o s e o f
t h e P w a v e s .
T h e a p p a r e n t Q f o r t h e l O - H z Lg w a v e s ' i s 1 5 0 0 , i d e n t i c a l t o t h a t fo u n d
p r e v i o u s l y b y N u t t li ( 1 9 7 3 ) f o r h ig h e r m o d e 1 - H z Lg w a v e s . T h e a t t e n u a t i o n o f
l O - H z Lg w a v e s i s s u f f i c ie n t l y s m a l l t h a t o n e m u s t p a y a t t e n t i o n t o t h e i r d a m a g e
p o t e n t i a l a t d i s t a n c e s a s l a r g e a s a f e w h u n d r e d k i lo m e t e r s .
INTRODUCTION
Damaging ground accelerations usually are associated with relatively high-fre-
quency wave motion, in the range of I to 10 Hz. A knowledge of the attenuation of
this wave motion is required for the specificationof the ground motion at a given
site, for the purpose of designing structures.
Previously, Nuttli (1973) estimated the anelastic attenuation coefficientof l-HzLgwaves for the central United States to be 0.07 deg-I (0.0006 kin-l). He determined
that at frequencies near I Hz theLgwave carried the maximumamplitude, at least
for distances of 25 km and greater. Data for this study came from WWSSN stations
or eastern North America stations which had short-period seismographs with
response similar to those of the WWSSN stations. Since the summer of 1974 a
microearthquake network has been operating in the New Madrid seismic zone
(Stauderet al., 1976). As the peak response of the microearthquake seismographs
occurs at frequencies near I0 Hz, the network provides ideal data for a time-domain
study of the attenuation of 10-Hz waves. This paper is concerned with an analysis
of the P- and Lg-wave attenuation of these high-frequencywaves.
THE DATA
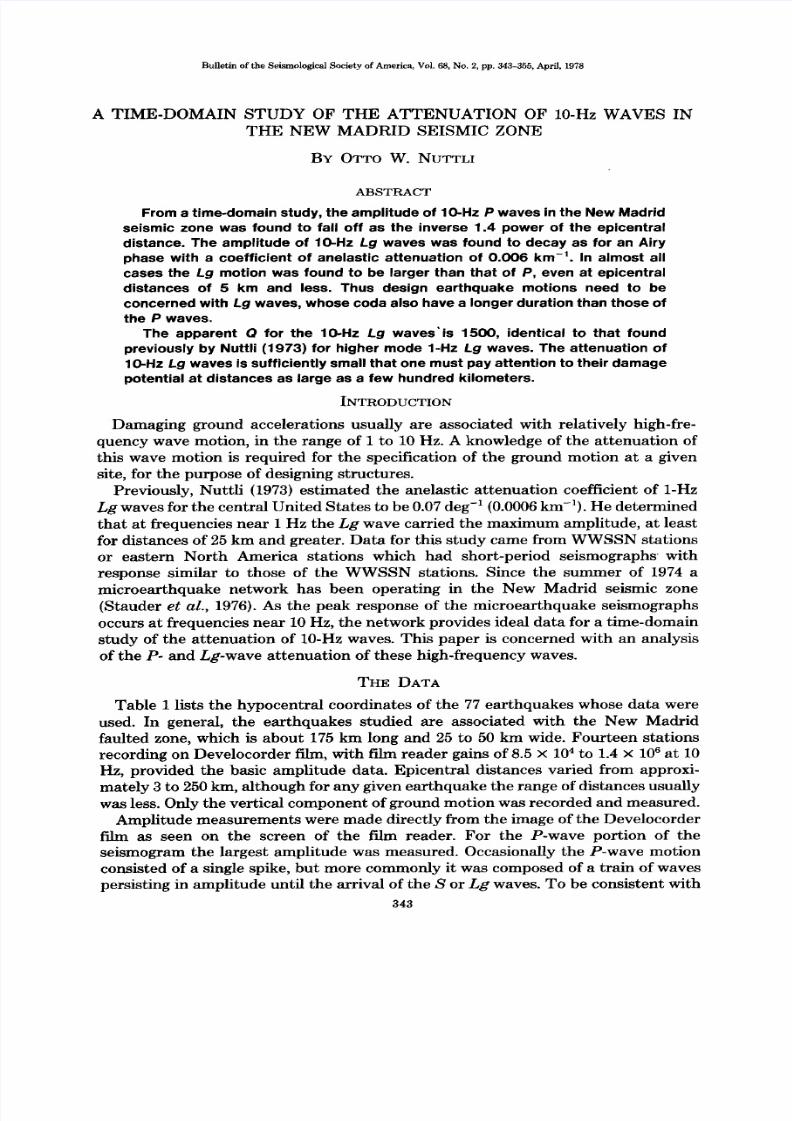
Table 1 lists the hypocentral coordinates of the 77 earthquakes whose data were
used. In general, the earthquakes studied are associated with the New Madrid
faulted zone, which is about 175 km long and 25 to 50 km wide. Fourteen stations
recording on Develocorder film, with film reader gains of 8.5 × 10⁴ to 1.4 × 10⁶ at 10
Hz, provided the basic amplitude data. Epicentral distances varied from approxi-
mate ly 3 to 250 kin, although for any given earthquake the range of distances usually
was less. Only the vertical componen t of ground motion was recorded and measured.
Amplitude measu rements were made directly from the image of the Develocorderfilm as seen on the screen of the film reader. For the P-wave portion of the
seismogram the largest amplitude was measured. Occasionally the P-wave motion
consisted of a single spike, but more commonly it was composed of a tra in of waves
persisting in amplitude until the arrival of the S or Lg waves. To be consistent with
343
8/6/2019 Attenuation Low Freq Waves New Madrid
http://slidepdf.com/reader/full/attenuation-low-freq-waves-new-madrid 2/13
3 4 4 OTTO W. NUT TLI
TABLE 1
LIST OF EARTHQUAKESSTUDIED
No. Date Origin Time Latitude (deg. N) Longitudedeg.W) mh
1 16 Au g 74 07-30-57.9 36.15 89.70 1.1
2 01 Fe b 75 16-04-24.5 36.05 89.87 1.9
3 20 Fe b 75 02-52-21.4 36.08 89.84 1.3
4 01 Sep 75 15-33-11.2 36.55 89.86 1.0
5 05 Sep 75 21-46-14.5 36.13 89.43 1.7
6 10 Sep 75 12-41-45.9 36.30 91.80 0.6
7 13 Sep 75 06-53-52.9 36.73 89.21 1.4
8 18 Sep 75 08-20-23.3 36.63 89.51 1.7
9 21 Sep 75 08-08-32.6 36.31 89.51 1.1
10 21 Sep 75 22-09-21.5 36.57 89.76 0.8
11 24 Sep 75 10-37-54.4 36.72 89.69 2.2
12 04 Oct 75 06-53-15.3 35.81 90.17 1.4
13 12 Oct 75 14-47-40.1 36.08 89.78 1.9
14 07 De c 75 12-18-28.7 35.71 90.06 1.8
15 05 Jan 76 03-46-30.0 35.94 89.52 1.5
16 10 Jan 76 10-28-35.9 36.13 89.74 1.2
17 15 Jan 76 07-40-52.6 37.37 90.00 1.5
18 20 Jan 76 12-44-08.5 36.57 89.60 1.5
19 03 Feb 76 07-04-01.3 36.48 89.56 1.2
20 16 Fe b 76 04-31-50.3 36.04 89.84 1.1
21 28 Fe b 76 00-14-35.2 36.51 89.54 1.9
22 06 Ma r 76 23-07-32.1 36.48 89.56 1.4
23 15 Mar 76 16-15-26.7 36.57 89.46 1.2
24 04 Ap r 76 02-16-17.8 37.82 90.99 2.0
25 06 Ap r 76 18-42-54.4 36.51 89.62 1.4
26 08 Ap r 76 16-28-17.8 37.12 88.88 2.1
27 10 Ap r 76 02-47-55.9 36.55 89.66 1.4
28 10 Ap r 76 03-20-23.4 36.05 89.82 1.4
29 10 Ap r 76 12-50-34.6 36.44 89.51 1.2
30 10 Apt 76 14-16-18.3 36.10 89.73 1.2
31 14 Ap r 76 23-47-54.0 35.65 90.47 1.9
32 15 Ap r 76 10-25-33.9 36.72 89.52 1.0
33 09 May 76 10-11-29.5 37.10 90.97 1.5
34 17 Ma y 76 05-17-57.9 36.38 89.53 1.2
35 20 Ma y 76 03-12-46.4 35.82 90.18 1.5
36 21 Ma y 76 10-41-28.2 36.22 89.38 1.2
37 23 May 76 08-37-09.5 36.13 89.74 1.7
38 24 May 76 07-30-17.5 36.07 89.45 1.6
39 27 May 76 08-47-47.2 35.67 90.42 1.7
40 28 Ma y 76 07-10-50.7 36.60 89.59 1.2
41 28 May 76 07-41-36.0 35.85 90.01 1.2
42 03 Jun 76 13-54-14.4 35.94 90.13 1.8
43 18 Jun 76 20-13-31.8 36.40 89.54 1.1
44 27 Jun 76 02-41-35.1 36.30 89.51 1.0
45 04 Jul 76 03-02-50.5 36.77 89.15 1.7
46 04 Ju l 76 07-21-53.9 36.77 89.15 1.5
47 23 Jul 76 11-38-36.3 36.91 88.96 1.3
48 27 Jul 76 01-38-27.8 36.46 89.53 1.0
49 03 Au g 76 04-52-39.0 36.69 89.79 1.4
50 11 Au g 76 02-15-29.3 36.67 89.56 1.651 21 Au g 76 07-31-01.0 35.03 90.41 2.1
52 27 Au g 76 04-03-52.5 36.17 89.41 1.0
53 11 Sep 76 05-59-13.2 35.97 89.81 1.2
54 15 Se p 76 11-08-40.9 36.57 89.63 1.2
8/6/2019 Attenuation Low Freq Waves New Madrid
http://slidepdf.com/reader/full/attenuation-low-freq-waves-new-madrid 3/13
A T IM E - D O M A I N S T U D Y O F T H E A T T E N U A T I O N O F 1 0-H Z W A V E S
T A B L E 1--continued
3 4 5
No . Da te Or ig in T im e La t i t u d e ( d eg . N) Lo n g i tu d e ( d eg .W ) r n ~
55 Ol O ct 76 14-44-56.1 36.55 89.67 1.5
56 03 O ct 76 03-46-03.5 36.56 89.72 1.3
57 04 O ct 76 12-06-00.2 35.84 90.14 1.658 19 O ct 76 07-15-58.3 37.08 88.77 1.2
59 22 O ct 76 03-12-22.1 36.43 89.51 1.3
60 22 O ct 76 09-59-02.3 36.43 89.49 1.2
61 29 O ct 76 06-29-54.8 36.43 89.49 1.0
62 06 N ov 76 11-37-59.4 37.28 89.47 1.7
63 14 N ov 76 11-39-46.0 35.66 90.46 2.4
64 15 N ov 76 01-31-46.4 35.61 89.90 1.4
65 23 N ov 76 01-24-15.5 36.55 89.62 1.2
66 23 N ov 76 05-36-10.2 36.26 89.45 1.4
67 06 D ec 76 23-14-53.2 35.82 90.15 1.1
68 15 D ec 76 11-57-07.1 36.07 89.80 1.9
69 01 Ja n 77 11-40-06.2 36.92 90.42 1.370 02 Ja n 77 20-33-23.3 36.47 89.55 1.4
71 04 Ja n 77 03-59-18.2 36.54 89.66 1.3
72 04 Ja n 77 12-21-27.6 36.12 89.73 1.1
73 23 Ja n 77 21-03-15.3 37.55 89.78 2.2
74 01 F eb 77 09-30-04.3 36.28 89.47 1.2
75 08 F eb 77 10-20-42.5 36.50 89.57 1.6
76 09 F eb 77 06-25-47.5 35.86 90.09 1.2
77 13 F eb 77 09-15-29.2 36.23 89.49 1.2
t h e a m p l i t u d e s t u d y o f 1 - H z w a v e s ( N u t t l i , 1 9 73 ), t h e L g a m p l i t u d e m e a s u r e d w a s
t h a t o f t h e m a x i m u m s u s t a i n e d m o t i o n , i. e ., t h e l a r g e s t a m p l i t u d e e q u a l e d o re x c e e d e d b y a t l e a s t t h r e e c y c l e s o f w a v e m o t i o n . T h e r e a s o n f o r u s i n g m a x i m u m
s u s t a i n e d r a t h e r t h a n p e a k m o t i o n i s t h a t t h e m a x i m u m s u s t a i n e d m o t i o n i s
c o n s i d e r e d a b e t t e r m e a s u r e o f t h e s i z e o f t h e e a r t h q u a k e a n d o f t h e d a m a g e
p o t e n t i a l o f t h e L g w a v e s t h a n t h e s i n g l e p e a k a m p l i t u d e , b e c a u s e t h e s i n g le p e a k
i s o f s h o r t d u r a t i o n a n d m a y r e s u l t f r o m f o r t u i t o u s c o n s t r u c t i v e i n t e r f e r e n c e .
A N A L Y S I S OF T H E D A T A
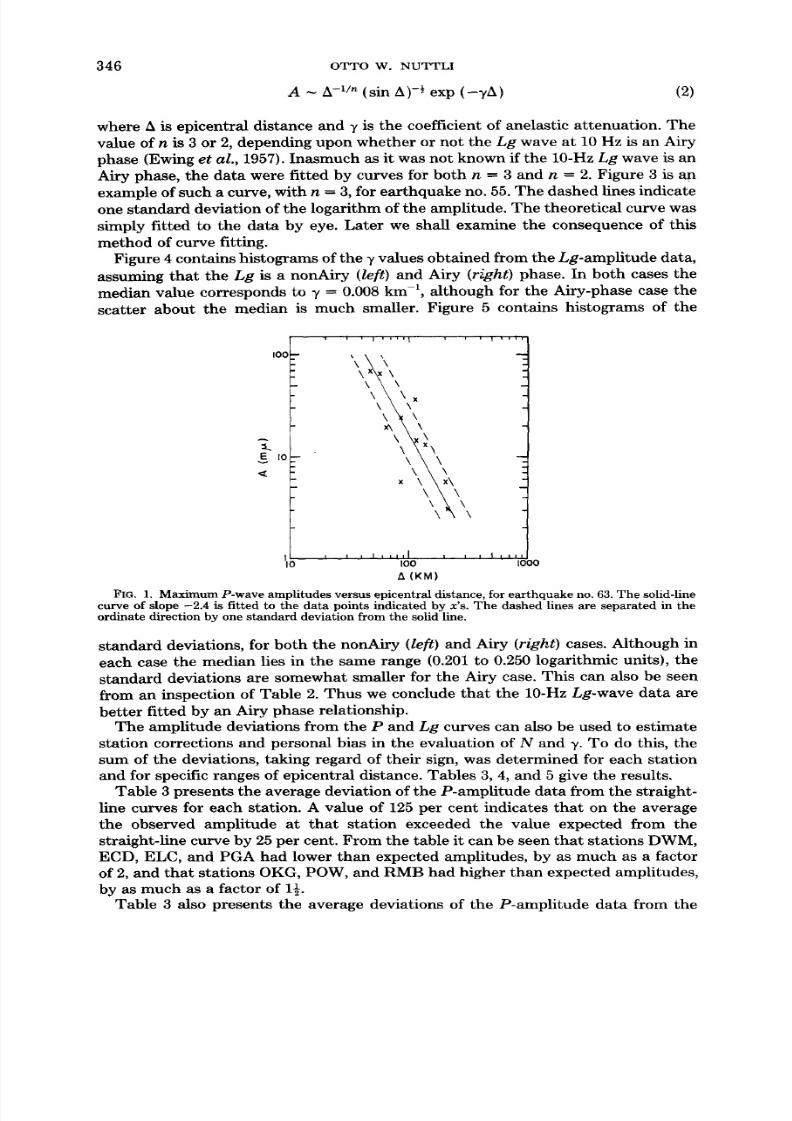
T h e P - w a v e a m p l i t u d e s w e r e p l o t t e d o n l o g - l o g p a p e r a s a f u n c t io n o f e p i c e n t r a l
d i s t a n c e A , a n d f i t t e d b y a s t r a i g h t - l i n e c u r v e . T h e s l o p e o f t h e c u r v e i s - N , w h e r e
A ~ A - g . ( 1 )
F i g u r e 1 g i v e s a n e x a m p l e o f s u c h a p l o t , f o r e a r t h q u a k e n o . 6 3. T h e d a s h e d l i n e s a r e
s e p a r a t e d f r o m t h e s t r a i g h t - l i n e c u rv e b y o n e s t a n d a r d d e v i a t i o n o f t h e l o g a r i t h m o f
t h e a m p l i t u d e . I t i s c u s t o m a r y t o f i t c l o s e - i n P - w a v e d a t a b y a n e m p i r i c a l e q u a t i o n
s u c h a s ( 1) , e v e n t h o u g h t h a t e q u a t i o n d o e s n o t t a k e a c c o u n t o f t h e s o u r c e r a d i a t i o n
p a t t e r n , a n e l a s t i c i t y , a n d c o n s t r u c t i v e a n d d e s t r u c t i v e i n t e r f e r e n c e o f r e f l e c t e d a n d
r e f r a c t e d w a v e s . T h e s c a t t e r i n t h e P - w a v e a m p l i t u d e d a t a , w h i c h c a n b e a s l a r g e a s
a n o r d e r o f m a g n i t u d e , c a n b e a t t r i b u t e d t o t h e s e a n d o t h e r p h e n o m e n a s u c h a ss c a t t e r i n g a n d s o i l a m p l i f i c a t i o n .
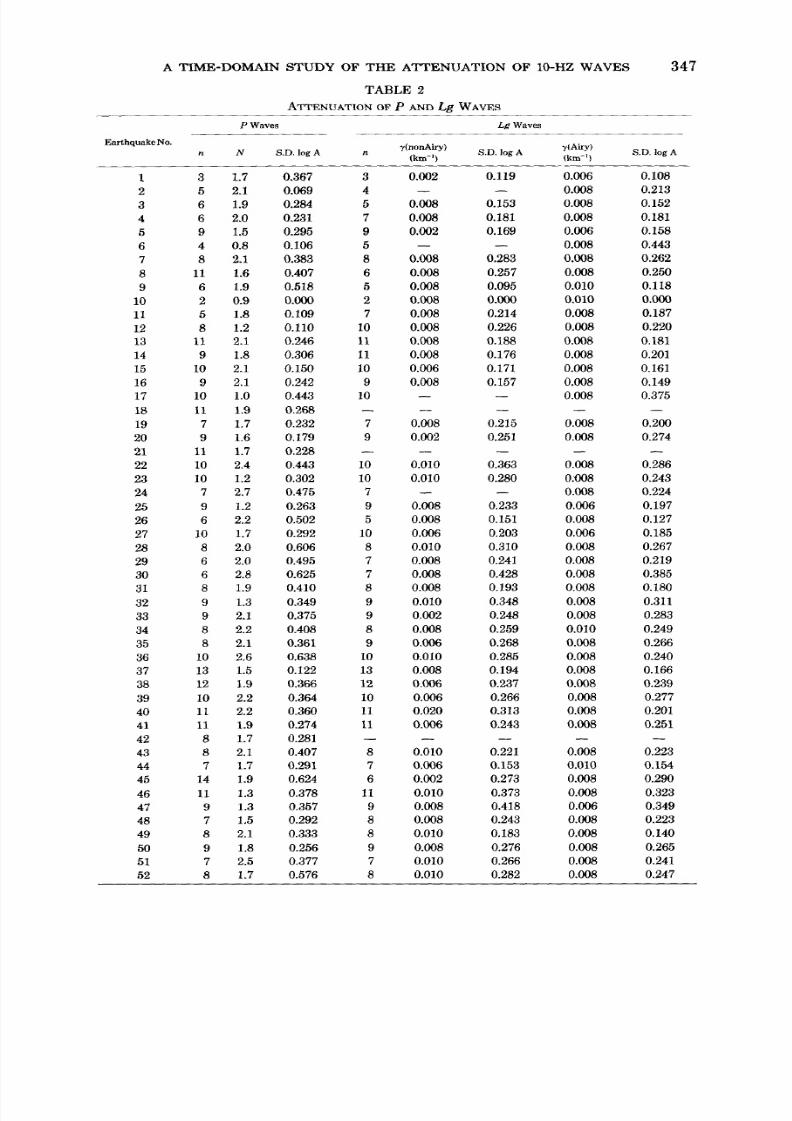
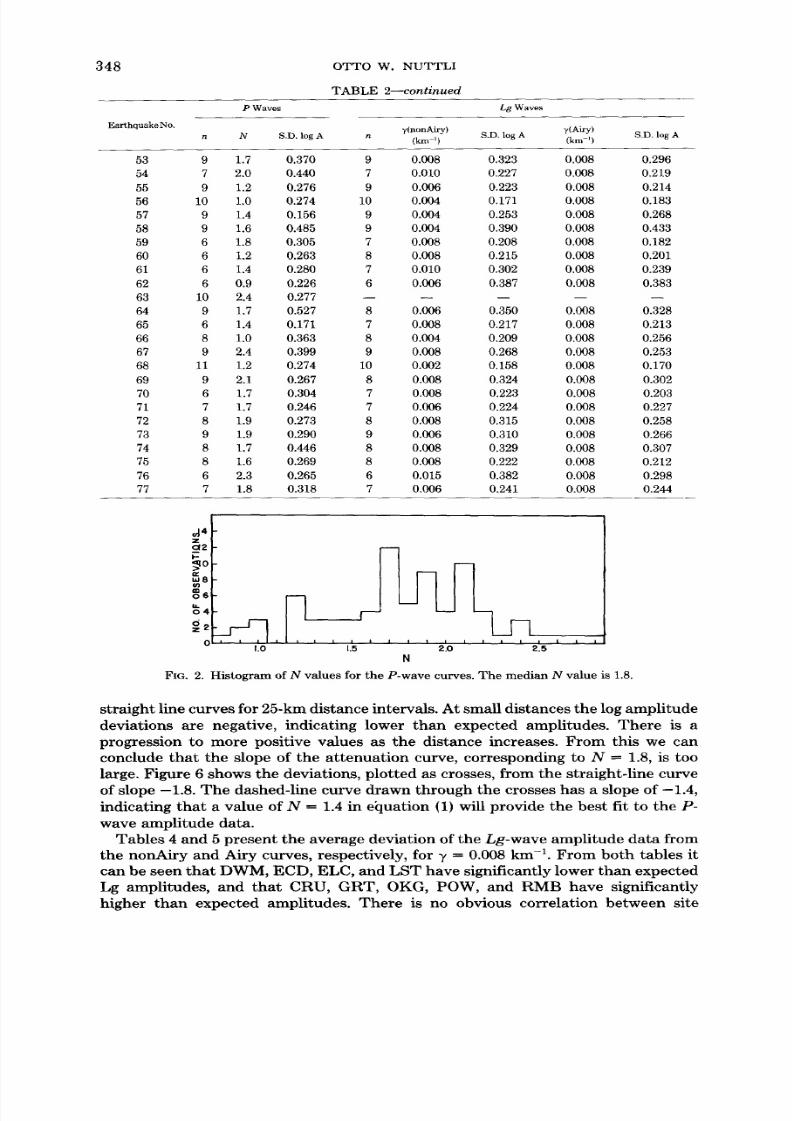
T a b l e 2 c o n t a i n s t h e s l o p e s ( N } a n d t h e s t a n d a r d d e v i a t i o n s o f t h e l o g a r i t h m o f
t h e a m p l i t u d e f o r t h e P - w a v e m o t i o n . F i g u r e 2 i s a h i s t o g r a m o f t h e N v a l u e s . F r o m
i t o r f r o m T a b l e 2 i t c a n b e s e e n t h a t t h e m e d i a n v a l u e o f N i s 1 .8 .
I t w a s a s s u m e d t h a t t h e L g - a m p l i t u d e d a t a s a t i s f y t h e r e l a t i o n ( E w i n g et al . ,
1 9 5 7 )
8/6/2019 Attenuation Low Freq Waves New Madrid
http://slidepdf.com/reader/full/attenuation-low-freq-waves-new-madrid 4/13
3 4 6 O T T O W . N U T T L I
A ~ h - I / " ( s in h ) -½ e x p ( - T h ) (2)
w h e r e ~ i s e p i c e n t r a l d i s t a n c e a n d 7 i s t h e c o e f f ic i e n t o f a n e l a s t ic a t t e n u a t i o n . T h e
v a l u e o f n i s 3 o r 2, d e p e n d i n g u p o n w h e t h e r o r n o t t h e L g w a v e a t 1 0 H z i s a n A i r y
p h a s e ( E w i n g e t a l . , 1 95 7) . I n a s m u c h a s i t w a s n o t k n o w n i f t h e 1 0 - H z L g w a v e i s a nA i r y p h a s e , t h e d a t a w e r e f i t t e d b y c u r v e s f o r b o t h n = 3 a n d n = 2 . F i g u r e 3 i s a n
e x a m p l e o f s u c h a c u r v e , w i t h n = 3, f o r e a r t h q u a k e n o . 55 . T h e d a s h e d l in e s i n d i c a te
o n e s t a n d a r d d e v i a t io n o f t h e l o g a r i th m o f t h e a m p l i t u de . T h e t h e o r e t i c a l c u rv e w a s
s i m p l y fi t t e d to t h e d a t a b y e y e . L a t e r w e s h a l l e x a m i n e t h e c o n s e q u e n c e o f t h i s
m e t h o d o f c u r v e f i tt in g .
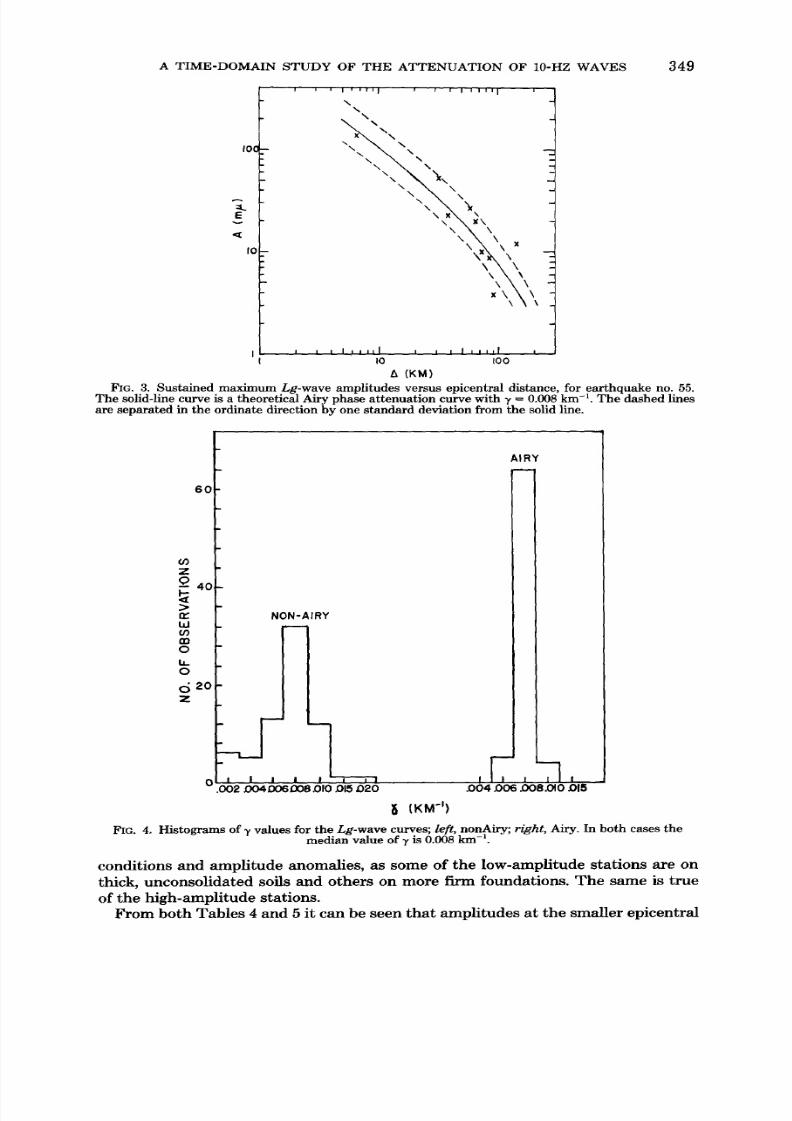
F i g u r e 4 c o n t a i n s h i s t o g r a m s o f t h e 7 v a l u e s o b t a i n e d f r o m t h e L g - a m p l i t u d e d a t a ,
a s s u m i n g t h a t t h e L g i s a n o n A i r y ( l e f t ) a n d A i r y ( r i g h t ) p h a s e . I n b o t h c a s e s t h e
m e d i a n v a l u e c o r r e s p o n d s t o 7 = 0 .0 08 k m -1 , a l t h o u g h f o r t h e A i r y - p h a s e c a s e t h e
s c a t t e r a b o u t t h e m e d i a n i s m u c h s m a l le r . F i g u r e 5 c o n t a i n s h i s t o g r a m s o f t h e
E I o
I , I ' i ' ' 1
I O 0 ~\ '\
\ \ ' ~ \ \ x
\ \ \ ~ \ \
x \ \ \ ~ \ \
\\ \\
I 0 I 0 0
A ( K M )
, t , I
, | I i
0 0 0
FIG. 1. Max imum P-wave am plitudes versus epicentral distance, for earthquake no. 63. The solid-linecurve of slope -2.4 is fitted to th e d ata points indicated by x's. Th e dashed lin es are separated in th eordinate direction by one standard deviation from the solid line.
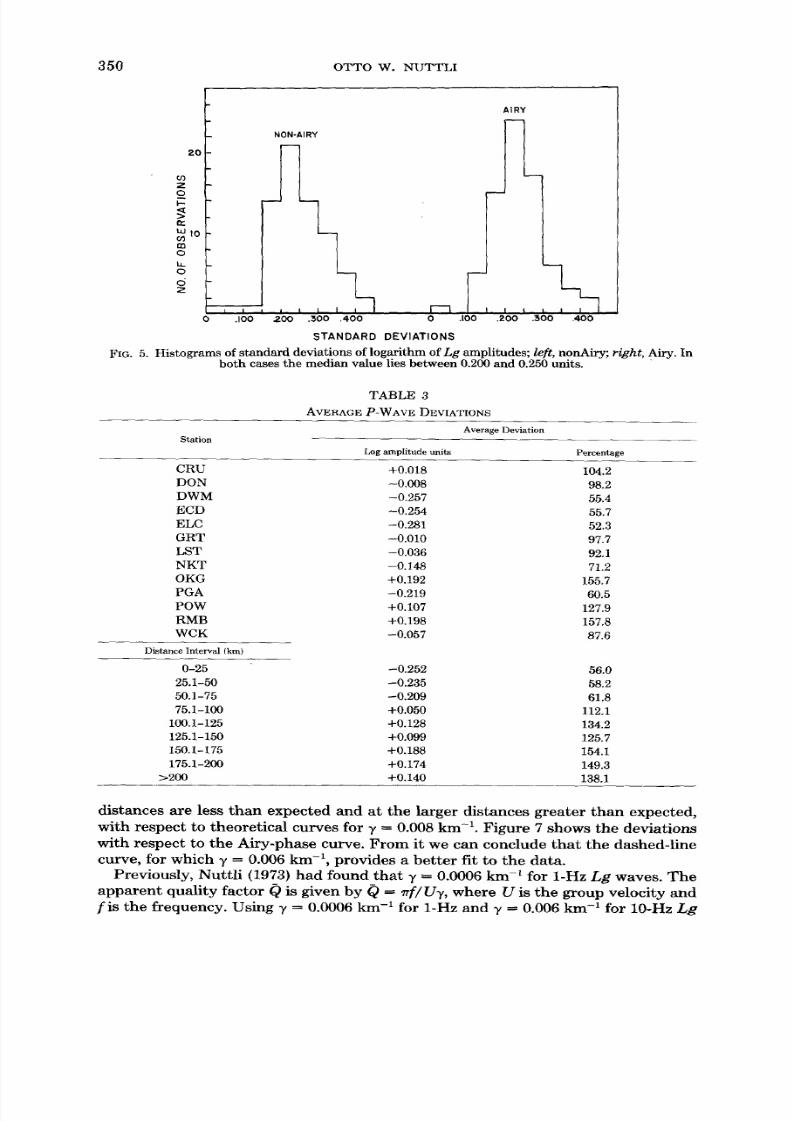
s t a n d a r d d e v ia t io n s , fo r b o t h t h e n o n A i r y ( l e f t ) a n d A i r y ( r i g h t ) c a s e s . A l t h o u g h i n
e a c h c a s e t h e m e d i a n l i e s i n t h e s a m e r a n g e ( 0. 20 1 t o 0 .2 5 0 l o g a r i t h m i c u n i t s ) , t h es t a n d a r d d e v i a t i o n s a r e s o m e w h a t s m a l l e r f o r t h e A i r y c a se . T h i s c a n a l so b e s e e n
f r o m a n i n s p e c t i o n o f T a b l e 2. T h u s w e c o n c l u d e t h a t t h e 1 0 -H z L g - w a v e d a t a a r e
b e t t e r f i t t e d b y a n A i r y p h a s e r e l a ti o n s h i p .
T h e a m p l i t u d e d e v i a ti o n s f r o m th e P a n d L g c u r v e s c a n a l s o b e u s e d t o e s t i m a t e
s t a t i o n c o r r e c t i o n s a n d p e r s o n a l b i a s i n t h e e v a l u a t i o n o f N a n d y . T o d o t h is , t h e
s u m o f t h e d e v i a t io n s , t a k i n g r e g a r d o f t h e i r s ig n , w a s d e t e r m i n e d f o r e a c h s t a t i o n
a n d f o r s p e c if i c r a n g e s o f e p i c e n t r a l d i s t a n c e . T a b l e s 3 , 4 , a n d 5 g iv e t h e r e s u l t s .
T a b l e 3 p r e s e n t s t h e a v e r a g e d e v i a t i o n o f t h e P - a m p l i t u d e d a t a f r o m t h e s t ra i g ht -
l in e c u r v e s f o r e a c h s t a ti o n . A v a l u e o f 12 5 p e r c e n t i n d i c a t e s t h a t o n t h e a v e r a g e
t h e o b s e r v e d a m p l i t u d e a t t h a t s t a ti o n e x c e e d e d t h e v a l u e e x p e c t e d f r o m t h es t r a ig h t - l in e c u r v e b y 2 5 p e r c e n t . F r o m t h e t a b l e i t c a n b e s e e n t h a t s t a t io n s D W M ,
E C D , E L C , a n d P G A h a d l o w e r th a n e x p e c t e d am p l i t u d es , b y a s m u c h a s a f a c t o r
o f 2, a n d t h a t s t a ti o n s O K G , P O W , a n d R M B h a d h i g h e r t h a n e x p e c t e d a m p l it u d e s ,
b y a s m u c h a s a f a c t o r o f 1½.
T a b l e 3 al so p r e s e n t s t h e a v e r a g e d e v i a t io n s o f t h e P - a m p l i t u d e d a t a f r o m t h e
8/6/2019 Attenuation Low Freq Waves New Madrid
http://slidepdf.com/reader/full/attenuation-low-freq-waves-new-madrid 5/13
A TIME-DOMAIN STUDY OF THE ATTENUATION OF 10-HZ WAVES
TABLE 2
ATTENUATION OF P ANDLg WAVES
347
E a r t h q u a k e N o .
P W a v e s Lg W a v e s
;,(nonAiry) ~dAiry)a N S.D. log A n S.D. log A
(kin-') (kin ~)S .D . l o g A
1 3 1,7 0,367 3 0.002 0.119 0.006
2 5 2.1 0.069 4 - - - - 0.008
3 6 1.9 0.284 5 0.008 0.153 0.008
4 6 2.0 0.231 7 0,008 0,181 0.008
5 9 1.5 0.295 9 0.002 0.169 0.006
6 4 0.8 0.106 5 -- - - 0.008
7 8 2.1 0.383 8 0.008 0.283 0.008
8 11 1.6 0.407 6 0.008 0.257 0.008
9 6 1.9 0.518 5 0.008 0.095 0.010
10 2 0.9 0.000 2 0,008 0.000 0.010
11 5 1.8 0.109 7 0.008 0.214 0.008
12 8 1.2 0.110 10 0.008 0.226 0,00813 11 2.1 0.246 11 0.008 0.188 0.008
14 9 1.8 0.306 11 0,008 0.176 0.008
15 10 2.1 0.150 10 0.006 0.171 0.008
16 9 2.1 0.242 9 0.008 0.157 0.008
17 10 1.0 0.443 10 - - - - 0.008
18 11 1.9 0.268 . . . .
19 7 1,7 0.232 7 0.008 0,215 0.008
20 9 1.6 0.179 9 0.002 0.251 0.008
21 11 1.7 0.228 . . . .
22 10 2.4 0.443 10 0.010 0.363 0.008
23 10 1.2 0.302 10 0.010 0.280 0.908
24 7 2.7 0.475 7 -- - - 0.00825 9 1.2 0.263 9 0.008 0.233 0.006
26 6 2.2 0.502 5 0.008 0.151 0.008
27 10 1.7 0.292 10 0.006 0.203 0.006
28 8 2.0 0.606 8 0.010 0.310 0.008
29 6 2.0 0.495 7 0.008 0.241 0.008
30 6 2.8 0.625 7 0.008 0.428 0.008
31 8 1.9 0.410 8 0.008 0.193 0,008
32 9 1,3 0.349 9 0.010 0.348 0,008
33 9 2.1 0,375 9 0.002 0.248 0.008
34 8 2.2 0.408 8 0.008 0.259 0.010
35 8 2.1 0.361 9 0.006 0.268 0.008
36 10 2.6 0.638 10 0.010 0.285 0.00837 13 1.5 0.122 13 0.008 0.194 0.008
38 12 1.9 0.366 12 0.006 0.237 0.008
39 10 2.2 0.364 10 0.006 0.266 0.008
40 11 2.2 0.360 11 0.020 0.313 0.008
41 11 1.9 0.274 I1 0.096 0.243 0.008
42 8 1.7 0.281 . . . .
43 8 2.1 0.407 8 0.010 0.221 0.008
44 7 1.7 0.291 7 0.006 0.153 0.010
45 14 1.9 0.624 6 0.002 0.273 0.008
46 11 1.3 0.378 11 0.010 0.373 0.008
47 9 1.3 0.357 9 0.008 0.418 0.006
48 7 1,5 0.292 8 0.008 0.243 0.00849 8 2.1 0.333 8 0.010 0,183 0.008
50 9 1.8 0.256 9 0.008 0.276 0.008
51 7 2.5 0.377 7 0.010 0.266 0.008
52 8 1.7 0.576 8 0.010 0.282 0.008
0.108
0.213
0.152
0.181
0.158
0.443
0.262
0.250
0.118
0.000
0.187
0.2200,181
0.201
0.161
0.149
0.375
0.200
0.274
0.286
0.243
0.2240.197
0.127
0.185
0.267
0.219
0.385
0.180
0.311
0.283
0.249
0.266
0.2400.166
0.239
0.277
0.201
0.251
0,223
0.154
0.290
0.323
0.349
0.2230.140
0.265
0.241
0.247
8/6/2019 Attenuation Low Freq Waves New Madrid
http://slidepdf.com/reader/full/attenuation-low-freq-waves-new-madrid 6/13
8/6/2019 Attenuation Low Freq Waves New Madrid
http://slidepdf.com/reader/full/attenuation-low-freq-waves-new-madrid 7/13
A T I M E - D O M A I N S T U D Y O F T H E A T T E N U A T I O N O F 10 -H Z W A V E S 3 4 9
I 0 (
E
Io
, I , , I , ~ I r f I I I l l I ,
\
" x x - - , ,
" - , , \ " ~ , ,
" " " ~ \ , ~ , ,\ \ ~ \ \ x
\ \ x ~ \ \
x \ \ \ \
I , I I I t J l l l I I I I , , , , I ,
I 0 I00
A ( K M )
F I G . 3 . S u s t a i n e d m a x i m u m L g - w a v e a m p l i t u d e s v e r s u s e p i c e n t r a l d i s t a n c e , f o r e a r t h q u a k e n o . 5 5 .T h e s o l id - l in e c u r v e is a t h e o r e t i c a l A i r y p h a s e a t t e n u a t i o n c u r v e w i t h 7 - 0 .0 08 k m - L T h e d a s h e d l i n e sa r e s e p a r a t e d i n t h e o r d i n a t e d i r e c t i o n b y o n e s t a n d a r d d e v i a t i o n f ro m t h e s o l id li n e .
ooZ
9
>
n-
bJ
6 0
4 0
N O N - A I R Y
A I R Y
co
@0
0
h
0
o 20z
(KM")
FIG. 4. Histograms of 7 values for the Lg-wave curves; eft , nonAiry; r ~ h t , Airy. In both cases hem e d i a n v a l u e o f 7 i s 0 .008 k in - ' .
c o n d i t io n s a n d a m p l i t u d e a n o m a l i e s , a s s o m e o f t h e l o w - a m p l i t u d e s t a t i o n s a r e o n
t h ic k , u n c o n s o l i d a t e d s o i l s a n d o t h e r s o n m o r e f ir m f o u n d a t i o n s . T h e s a m e i s t r u e
o f t h e h i g h - a m p l i t u d e s t a ti o n s .
F r o m b o t h T a b l e s 4 a n d 5 i t c a n b e s e e n t h a t a m p l i t u d e s a t t h e s m a l l er e p i c e n t r a l
8/6/2019 Attenuation Low Freq Waves New Madrid
http://slidepdf.com/reader/full/attenuation-low-freq-waves-new-madrid 8/13
350 OTTO W. NUTTLI
2 0
¢ .0zo
tom
o
L L
o
~ 5
I I0 . 1 0 0 2 . 1 0 0
N O N - A I R Y
\
Ei l ~ I---I
. 3 0 0 , 4 0 0 0
STANDARD D E V I A T I O N S
A I R Y
II 0 0 2 0 0 3 0 0 . 4 0 0
FIG. 5. Histogr ams of standard devi ations of logar ithm of L g amplitudes; left, nonAiry; r ight , Airy. Inbot h cases the m edian value lies betwee n 0.200 and 0.250 units.
TABLE 3
AVERAGE P-WAVE DEVIATIONS
StationAverage Deviation
Log amplitudeunits Percentage
CRU +0.018 104.2
DON -0,008 98.2
DWM -0.257 55.4
ECD -0.254 55.7
ELC -0.281 52.3
GRT -0.010 97.7
LST -0,036 92.1
NK T -0.148 71.2
OKG +0.192 155,7
PGA -0.219 60,5
POW +0.107 127,9
RM B +0.198 157,8
WCK -0,057 87,6
Distance Interval (kin)
0-25 - 0 , 252 56.0
25.1-50 -0.235 58,2
50.1-75 --0.209 61,8
75.1-100 +0.050 112,1
100.1-125 +0.128 134.2
125.1-150 +0.099 125.7
150.1-175 +0.188 154.1
175.1-200 +0.174 149.3
>200 +0.140 138.1
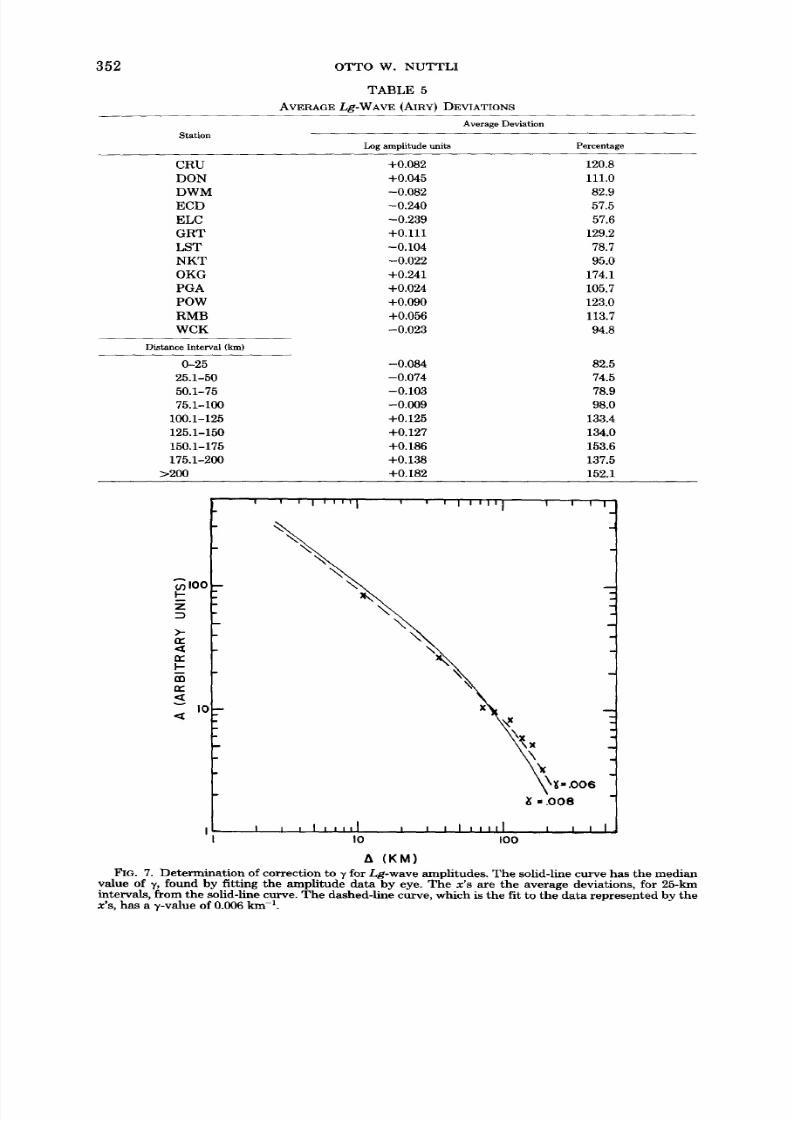
d i s t a n c e s a r e le s s t h a n e x p e c t e d a n d a t t h e l a r g e r d i s t a n c e s g r e a t e r t h a n e x p e c t e d ,
w i t h r e s p e c t t o t h e o r e t i c a l c u r v e s f o r y = 0 .0 08 k m -1 . F i g u r e 7 s h o w s t h e d e v i a t i o n s
w i t h r e s p e c t t o t h e A i r y - p h a s e c u r ve . F r o m i t w e c a n c o n c l u d e t h a t t h e d a s h e d - l i n e
c u r v e , f o r w h i c h 7 = 0 .0 06 k m - 1, p r o v i d e s a b e t t e r f i t to t h e d a t a .
P r e v i o u s l y , N u t t l i ( 19 73 ) h a d f o u n d t h a t y = 0 . 00 06 k m -~ f o r 1 - H z Lg w a v e s . T h e
a p p a r e n t q u a l i t y f a c t o r (~ i s g i v e n b y ( ~ = ~rf/Uy,w h e r e U is t h e g r o u p v e l o c i t y a n d
f i s t h e f r e q u e n c y . U s i n g 7 = 0 .0 00 6 k m -1 f o r 1 - H z a n d 7 - - 0 .0 0 6 k m - 1 f o r 1 0 - H z Lg
8/6/2019 Attenuation Low Freq Waves New Madrid
http://slidepdf.com/reader/full/attenuation-low-freq-waves-new-madrid 9/13
A T I M E - D O M A I N S T U D Y O F T H E A T T E N U A T I O N O F 1 0-H Z W A V E S 3 5 1
A
co I00I- -.,..,.
z
) -B=:
p-. . . . .
ElE:
'--" I0
, t v , ~ r i , i f I i , , , | i , ~ f'
\
\ XX
-2
I 0 I 0 0
h ( K M )
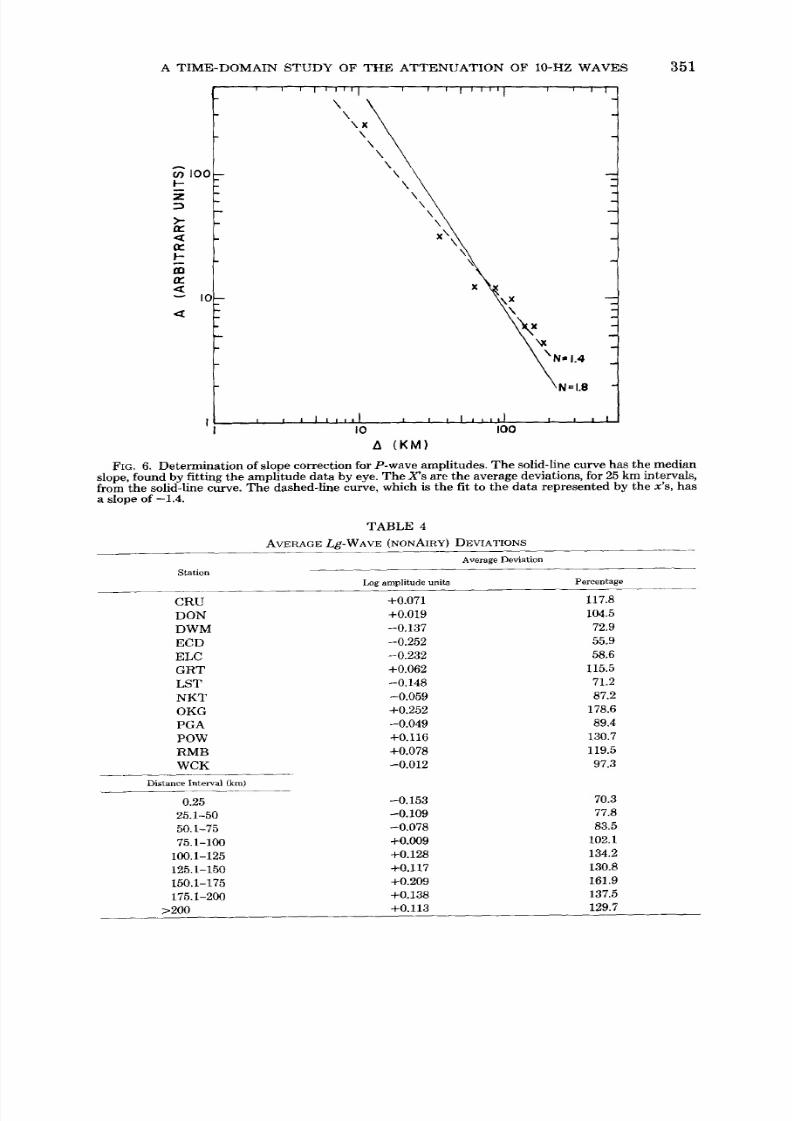
FIG . 6 . D e t e r m i n a t i o n o f s l o p e co r r ec t i o n f or P - w a v e am p l i t u d es . T h e s o l id - l in e cu r v e h as t h e m ed i ans l op e , f o u n d b y f i t ti n g t h e a m p l i t u d e d a t a b y ey e . T h e X ' s a r e t h e a v e r ag e d ev i a t i o n s , f or 25 k m i n t e r v a l s,f r o m t h e s o l i d - li n e cu rv e . T h e d as h ed - l i n e cu r v e , w h i ch i s t h e f i t t o t h e d a t a r ep r e s en t e d b y t h e x ' s , h a s
a s lo p e o f - 1 . 4 .
T A B L E 4
AVERAGE Lg-WA VE (NONAIRY) DEVIATIONS
S t a t i o n
Average Deviation
Log amplitude units Percentage
CR U +0 .071 117.8
D ON +0.019 104.5
D W M - 0 . 1 3 7 7 2, 9
E C D - 0 .2 5 2 5 5 .9
E L C - 0 .2 3 2 5 8.6GR T +0.062 115.5
L ST - 0 ,1 4 8 7 1.2
N K T - 0 , 0 5 9 8 7.2
OK G +0 .252 178 .6
PG A - 0 .0 4 9 8 9.4
PO W +0,116 130 .7
RM B +0 .078 119 .5
W CK - -0.012 97 .3
D i s t a n c e I n t e r v a l ( k i n )
0.25 -0. 15 3 70.3
25 .1 -50 -0 .1 09 77.8
50. t -75 -0 .0 78 83 .5
75.1-100 +0.009 102.1
100.1-125 +0.128 134.2
125.1-150 +0.117 130.8
150.1-175 +0.209 161.9
175.1-200 +0.138 137.5
>200 +0.113 129.7
8/6/2019 Attenuation Low Freq Waves New Madrid
http://slidepdf.com/reader/full/attenuation-low-freq-waves-new-madrid 10/13
352 OTTO W, NUTTLI
TABLE 5
AVERAGE Lg-WAvE (AIRY) DEVIATIONS
Station
AverageDeviation
Log amplitudeunits Percentage
CRUDON
DW M
EC D
ELC
GR T
LST
NKT
OKG
PG A
POW
RMB
WCK
Distance Interval (km)
0-25
25.1-50
50.1-75
75.1-100
100.1-125
125.1-150
150.1-175
175.1-200
>2OO
+0.082+0.045
-0.082
-0.240
-0.239
+0.111
-0.104
-0.022
+0.241
+0.024
+0.090
+O.056
-0.023
-0.084
-0.074
-0.103
- 0 . 0 0 9
+0.125
+0,127
+0.186
+0.138
+0.182
120.8111.0
82,9
57,5
57.6
129.2
78.7
95.0
174.1
105.7
123.0
113.7
94.8
82.5
74.5
78.9
98.0
133.4
134.0
153.6
137.5
152.1
'~10oI-
ii:
I---
n~,¢
10
i i I ' I ' I I , , I I I i l l I I I I
~ = . 0 0 6X • . 0 0 8
i , i I , , , , I I J I l i , , , l ' I I
I0 I00
/~ ( K M )
FIG. 7. De term inat ion of correct ion to 7 or Lg-wave amplitudes. The solid-line curve has the medianvalue of y, found by fitting the amplitude data by eye. The x's are the average deviations, for 25-kinintervals, from the solid-line curve. Th e dashed-line curve, which is the fit to the data repres ented by thex's, h as a y-value o f 0.006 km -1.
8/6/2019 Attenuation Low Freq Waves New Madrid
http://slidepdf.com/reader/full/attenuation-low-freq-waves-new-madrid 11/13
A TIME-DOMAIN STUDY OF THE ATTENUATION OF 10"HZ WAVES 353
waves, and U = 3.5 km/sec for bo th f requency waves, we get Q = 1,500 for both 1-
and 10-Hz waves.
Espinosa (1977), from a spectral analysis of the 1971 San Fernan do earth quake
accelerograms, fitted straight-line curves to the logarithm of the spectral velocity
versus the logarithm of the epicentral distance. His curves for T -- 0.1 sec and 1 sec,for the vertical component of the spectral velocity at distances of 10 to 100 km, have
slopes which are in substantial agreement with the values found for the New Madrid
zone, i.e., his slopes correspond to 7 = 0.0006 km -1 for 1-sec waves and 0.006 km -1for 0.1-sec waves. Espinosa also gave a curve for 0.3-sec waves, which corresponds
to 7 = 0.020 km -1, implying a low ~) value for 0.3-sec period waves. It will be
interesting to see if spectral analyses of the New Madrid microearthquake data also
TABLE 6
A(P)/A(Lg)
Kilometers
0-5 5.1-10 10.1-15 15.1-20 20.L-25 25.1-30 30.1-35
0.79
0.78
0.72
0.60
0.46
3.17" 1.29 2.78* 2.89* 5.96* 2.66*
1.20 1.05 1.66 1.94" 1.80" 2.52*
1.07 0.92 1.25" 1.29 1.33 1.10
0.96 0.75 1.00 1.16" 1.00 1.08'
0.92 0.73 0.84 1.00 0.73 1.00
0.88 0.70 0.83 0.96 0.50 1.00
0.86 0.55 0.80 0.81 0.40 1.00
0.80 0.53 0.76 0.78 0.38 0.89
0.75 0.53 0.67 0.74 0.36 0.83
0.53 0.66 0.65 0.36 0.80
0.34 0.59 0.60 0.28 0.62
0.50 0.57 0.54
0.30 0.56 0.50
0.29 0.50 0.44
0.22 0.45 0.40
0.20 0.41 0.32
0.40 0.27
0.33 0.24
0.25 0.18
0.14
0.13
0.11
0.05
* The Lg amplitude was anomalously small.
indicate a relatively high anelastic att enu at ion for 0.3-sec period waves or if, rather,
they indicate a constant Q between periods of 0.1 and 1 sec.
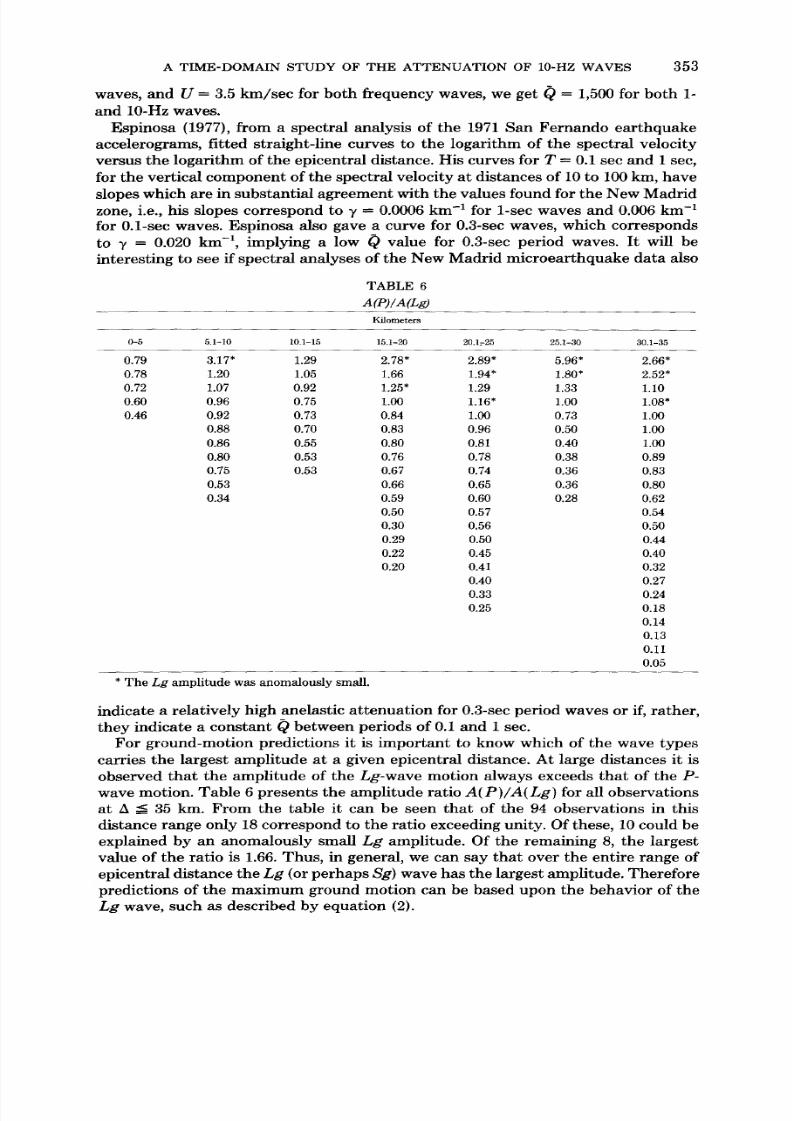
For ground-motion predictions it is important to know which of the wave types
carries the largest amplitude at a given epicentral distance. At large distances it is
observed that the amplitude of the Lg-wave motion always exceeds that of the P-
wave motion. Table 6 presents the amplitude ratio A( P ) /A(Lg) for all observations
at ~ < 35 km. From the table it can be seen tha t of the 94 observations in this
distance range only 18 correspond to the rat io exceeding unity . Of these, 10 could beexplained by an anomalously small L g amplitude. Of the remaining 8, the largest
value of the ratio is 1.66. Thus, in general, we can say that over the entire range of
epicentral distance the L g (or perhaps Sg) wave has the largest amplitude. Therefore
predictions of the maximum ground motion can be based upon the behavior of the
L g wave, such as described by equation (2).
8/6/2019 Attenuation Low Freq Waves New Madrid
http://slidepdf.com/reader/full/attenuation-low-freq-waves-new-madrid 12/13
354 O T T O W . N U T T L I
D I S C U S S I O N A N D C O N C L U S IO N S
A time-domain study of the attenuat ion of 10-Hz, vertical-component P and L g
waves in the New Madrid seismic zone indicates that the amplitude of the P waves
decreases as
A = Ao h-l4
and that of the L g waves as
A = Ao (5 ) -1/3 (sin A) -1/2 exp (--0.006 h),
where 5 is in kilometers, for the distance range of 3 to 250 km. The data were
obtained from microea rthquakes of m~ approximately 1 to 2 as recorded on Devel-
ocorder film. For these small magnitude earthquakes the source region is of very
small dimensions, on the order of tens of meters. For larger earthquakes withextended source regions the att enua tion relations given above may break down for
small epicentral distances.
For almost all the observation points the amplitude of the Lg-wave motion
exceeded that of the P-wave motion, even at small epicentral distances. Thus for
predicting maximum ground mo tion one need only be concerned with the effects of
the L g wave. Although durat ion of ground motion was not studied quan titat ively in
this investigation, it was observed that the Lg-wave motion and its coda are of
longer duration tha n the P-wave motion, making the L g motion compara tively even
more significant.
The high apparent Q for 10-Hz L g waves, 1,500, is identical to th at foundpreviously for 1-Hz L g waves (Nuttli , 1973). By contrast , the Q of fundamental -
mode surface waves of the same frequency is about one order of magnitude lower,
resulting in larger absorption and more rapid att enuat ion with distance. Compared
to the higher-mode waves the high-frequency fundamental-mode waves are most
strongly excited by very shallow earthquakes (Herr mann and Nutfli, 1975). The
Illinois earthquake of August 14, 1965, with a focal dept h of 1 km, provides an
example of such a shallow earthquake with high epicentral intensity and rapid
att enuat ion of intensity with epicentral distance (Nuttli and Zollweg, 1974).
Both the 1- and 10-Hz L g waves are higher mode waves. Their high Q value is
typical of that found for the lower half of the crust in the cent ral United Sta tes byHerrmann and Mitchell (1975).
Aki and Chouet {1975), from a study of coda waves, concluded tha t Q at 10 to 20
Hz was of the order of 1,000 for both the regions of Tsukuba, Ja pan and Stone
Canyon, California. The y at tributed this high Q value to scattering of body waves
in the lithosphere. At 1 Hz they obtained a Q of approximately 200 at Tsuku ba and
70 at Stone Canyon. They concluded that these lower Q values are indicative of the
scattering of surface waves in the upper crustal layers. Perhaps their data also could
be explained by scattering of higher-mode surface waves at the high frequencies and
of fundamental-mode surface waves at frequencies near 1 Hz. Herrmann (1975)
presented a time-domain coda model, based on empirical observations of the shapeof the coda envelope with time, which did not take account of the var iation of the
coda envelope with frequency and epicentral distance. In a later paper (Herrmann,
1977) he examined the dependence of the coda frequency content upon the corner
frequency of the source spectrum, and obtained good agreement between observed
8/6/2019 Attenuation Low Freq Waves New Madrid
http://slidepdf.com/reader/full/attenuation-low-freq-waves-new-madrid 13/13
A T I M E - D O M A I N S T U D Y O F T H E A T T E N U A T I O N O F 10 -H Z W A V E S 355
coda and calculated ones. His results support t he conclusion that Q has a high value
for frequencies in the range of 1 to 10 Hz.
Although the details of the relation of Q and of the coefficient of anelastic
attenuat ion in the frequency band of 1 to 10 Hz remain to be resolved, the present
study and the others cited indicate that waves of 10-Hz frequency can producesignificant ground motions at distances of as much as a few hundred kilometers.
Their absorption is not near ly as great as the a utho r thought it would be before this
study was carried out.
A C K N O W L E D G M E N T S
I w i s h to t h a n k R . B . H e r r m a n n a n d B . J . M i t c h e l l f o r h e l p f u l d i s c u ss i o n s o n t h e n a t u r e o f t h e Q
b e h a v i o r in t h e c r us t . T h i s r e s e a r ch w a s s u p p o r t e d i n p a r t b y t h e W a t e rw a y s E x p e r i m e n t S t a t i o n o f t h e
C o r p s o f E n g i n e e r s ( C o n t r a c t D A C W 3 9 - 7 7- C - 00 3 8 ) , t h e E a r t h S c i e n c e s S e c t i o n o f th e N a t i o n a l S c i e n c e
F o u n d a t i o n ( G r a n t D E S 7 4 - 22 8 5 2 A 0 1) a n d t h e D i v is i on o f A d v a n c e d E n v i r o n m e n t a l R e s e a r c h a n d
T e c h n o lo g y , N a t i o n a l S c i e n c e F o u n d a t i o n ( G r a n t E N V 7 6- 20 8 75 ). T h e d a t a c a m e f r o m t h e N e w M a d r i d
S e i s m i c N e t w o r k , w h i c h i s o p e r a t e d u n d e r U . S . G e o l o g i c a l S u r v e y c o n t r a c t 1 4 - 0 8 - 0 0 0 1 - 1 5 8 6 7 .
R E F E R E N C E S
A k i , K . a n d B . C h o u e t ( 19 75 ). O r i g i n o f c o d a w a v e s : s o u r c e , a t t e n u a t i o n , a n d s c a t t e r i n g e f fe c t s, J .
Geophys. Res. 80 , 3322-3342 .
E s p i n o s a , A . F . (1 97 7) . P a r t i c le - v e l o c i t y a t t e n u a t i o n r e l a t i o n s h i p : S a n F e r n a n d o e a r t h q u a k e o f F e b r u a r y
9, 1971, Bull. Seism. Soc. Am. 67, 1195-1214.
E w i n g , M . , W . S . J a r d e t z k y , a n d F . P r e s s ( 19 57 ). Elastic Waves in Layered Media, p . 3 58 , M c G r a w - H i l l ,
N e w Y o r k.
H e r r m a n n , R . B . ( 19 75 ). T h e u s e o f d u r a t i o n a s a m e a s u r e o f se i s m i c m o m e n t a n d m a g n i t u d e , Bull.
Seism. Soc. Am. 6 5 , 8 9 9 - 9 1 3 .
H e r r m a n n , R . B . ( 1 97 7). A m e t h o d f o r s y n t h e s i s o f t h e s e i s m i c c o d a o f l o c a l e a r t h q u a k e s , Geophys. J. 4 3 ,
341-350 .H e r r m a n n , R . B . a n d B . J . M i t c h e l l ( 19 75 ). S t a t i s t i c a l a n a l y s is a n d i n t e r p r e t a t i o n o f s u r f a c e -w a v e
a n e l a s t ic a t t e n u a t i o n f o r t h e s t a b l e i n t e r i o r o f N o r t h A m e r i c a , Bull. Seism. Soc. Am. 65, 1115-1128.
H e r r m a n n , R . B . a n d O . W . N u t t l i ( 19 75 ). G r o u n d - m o t i o n m o d e l l in g a t r e g i o n a l d i s t a n c e s f or e a r t h q u a k e s
i n a c o n t i n e n t a l i n t e r io r , I I. E f f e c t o f f o c al d e p t h , a z i m u t h a n d a t t e n u a t i o n , Earthquake Eng. Struct.
Dyn. 4 , 5 9 - 7 2 .
N u t t l i , O . W . ( 1 9 7 3 ) . S e i s m i c w a v e a t t e n u a t i o n a n d m a g n i t u d e r e l a t i o n s f o r e a s t e r n N o r t h A m e r i c a , J .
Geophys. Res. 7 8 , 8 7 6 - 8 8 5 .
N u t t l i , O . W . a n d J . E . Z o l lw e g ( 19 74 ). T h e r e l a t i o n b e t w e e n f e l t a r e a a n d m a g n i t u d e f o r c e n t r a l U n i t e d
S t a t e s e a r t h q u a k e s, Bull. Seism. Soc. Am. 64 , 73-85 .
S t a u d e r , W . , M . K r a m e r , G . F i s c h e r , S . S c h a e f e r , a n d S . T . M o r r i s s e y ( 19 7 6) . S e i s m i c c h a r a c t e r i s t i c s o f
s o u t h e a s t M i s s o u r i a s i n d i c a t e d b y a r e g i o n a l t e l e m e t e r e d m i c r o e a r t h q u a k e a r r a y , Bull. Seism. Soc.
Am. 66 , 1953-1964 .
DEPARTMENT OF EARTH AND ATMOSPHERIC SCIENCES
SAINT LOUIS UNIVERSITY
SAINT LOUIS, MISSOURI 63103
M a n u s c r i p t r e c e i v e d O c t o b e r 7 , 1 97 7