Embed Size (px)
Citation preview
Attentional andneuromotor deficits inADHD
J Steger PhD, Laboratory for Biomechanics, Eidgenössiche
Technische Hochschule (ETH) Zurich;
K Imhof PhD;
E Coutts lic phil;
R Gundelfinger MD;
H-Ch Steinhausen MD PhD;
D Brandeis*PhD, Department of Child and Adolescent
Psychiatry, University of Zurich, Switzerland.
*Correspondence to last author at Department of Child and
Adolescent Psychiatry, University of Zurich,
Neumünsterallee 9/ Postfach, CH-8032 Zürich, Switzerland.
E-mail: [email protected]
In order to classify attention-deficit–hyperactivity disorder(ADHD) in 11-year-old children, the role of specificattentional and motor deficits was examined. Participantscomprised 22 children with ADHD (19 male, 3 female;median age 11 years, range 8.8 to 13.5 years) and 20 controlchildren (17 male, 3 female; median age 10.6 years, range 8.2to 12.6 years). Neuromotor assessment indicated that whileboth groups needed more time to complete finger compared tohand movements, this increase was more pronounced inchildren with ADHD. Reaction-time testing with continuous-force recording identified both motor and attentional deficitsin children with ADHD. Longer intervals between force onsetand force peak, and higher rate of responses with multipleforce peaks (particularly in the bilateral condition) revealedspecific deficits in the speed and quality of their motor output.Increase in errors and variability of force onsets indicatedattentional deficits. Prediction analysis indicated that force-onset variability contributed significantly to groupclassification which was 85.7% correct. Neither neuromotorassessment nor specific motor deficits contributedsignificantly to classification, indicating that pure motor-speed measures play a minor role in characterizing ADHD inthis age range.
Attention-deficit–hyperactivity disorder (ADHD) is charac-
terized by developmentally inappropriate attention, overac-
tivity, and impulsivity, but several lines of evidence suggest
that children with ADHD also have motor deficits. Some
research suggests that the overlap between ADHD and motor
deficits is close to 50% and therefore high enough to warrant a
separate diagnostic category (deficit in attention, motor con-
trol, and perception DAMP; Gillberg 1995) while other
research suggests that motor processing is typically unaffected
in ADHD (Leung and Connolly 1998). Such large discrepan-
cies are likely to result from addressing different populations,
and from differences in the assessment and conceptualization
of motor deficits, ADHD, and their combination.
Motor deficits in ADHD have been assessed in a wide
range of tests. In the neuromotor assessment battery of
Denckla and Rudel (1978), the speed of pure motor func-
tions is strongly represented. The time needed for repetitive
simple movements or movement sequences in the different
tasks, is measured for finger, hand, and foot. Denckla and
Rudel (1978), Carte and colleagues (1996), and Schuerholz
and coworkers (1997) all used these tasks to examine chil-
dren with ADHD with a mean age below 10 years. Denckla
and Rudel (1978) reported that slowing of gross movements
(i.e. heel–toe taps) differentiated the ADHD and control
groups most accurately while Carte and colleagues (1996)
found that hand and foot movements were significantly
slower in children with ADHD. Both Denckla and Rudel
(1978) and Carte and colleagues (1996) showed that neuro-
motor parameters contributed significantly to group dis-
crimination between children with ADHD and control
children. Schuerholz and colleagues (1997) reported that
even though children with ADHD showed no overall slow-
ing of finger movements, they had a larger time discrepancy
between simple and patterned movements, and performed
fewer tasks within the age-appropriate speed limits than
children with Tourette syndrome. More subtle motor
deficits which affect movement quality rather than speed are
also found in ADHD. These include motor overflow, i.e.
involuntary associated movements such as mirror movements
(Denckla and Rudel 1978). Motor overflow also appears to cor-
relate with inattentiveness in normally developing school-age
children (Waber et al. 1985, Lazarus and Todor 1991).
More complex tests of fine motor skills based on handwrit-
ing, manual dexterity, ball skills, and balance have also
indicated deficits in children with ADHD. However these
tests tend to measure both pure motor as well as visuomotor
or higher cognitive functions, similar to neuropsychological
frontal-lobe tests such as copying a complex design or maze
tracing. Compared to control children, children with ADHD
were found to have impaired handwriting skills (McMahon
and Greenberg 1977, Barkley 1990), poorer fine visuomotor
ability (Whitmont and Clark 1996), and poorer performance
in visuomotor frontal-lobe tests (review in Barkley et al.
1992). In addition, different types of motor deficits appear
to characterize different ADHD subgroups (Piek et al. 1999).
Children of the inattentive subtype of ADHD had significantly
poorer manual dexterity skills, whereas children of the com-
bined subtype experienced greater difficulty with balance.
Direct experimental manipulation of premotor processing
via low or irregular event rate (Chee et al. 1989, van der Meere
et al. 1992, Földényi et al. 2000) or via stimulus–response
incompatibility (van der Meere et al. 1989) have also revealed
172 Developmental Medicine & Child Neurology 2001, 43: 172–179
some specific premotor deficits in ADHD. However, these
premotor deficits are derived from manipulations affecting
higher-order regulation, and are less consistent than the
attentional and inhibitory deficits (Oosterlaan and Sergeant
1998) revealed by increases of response-time variability and
errors of omission and commission, i.e. misses and false alarms
(Földényi et al. 2000). The fact that neither choice reaction
time nor movement time are increased in children with ADHD
(Leung and Connolly 1998) suggests that there is little evi-
dence for specific motor-speed deficits in simple motor tests.
In summary, the majority of studies with neuromotor
standard assessments indicate that the quality and speed of
simple movement sequences discriminate between those
with ADHD and control children. However this conclusion
receives little support from a study using simple motor labo-
ratory tests that measure motor sequencing speed on a trial-
by-trial basis (Leung and Connolly 1998). Continuous-force
recordings rather than discrete button presses would be
required to assess the quality of motor output in such labora-
tory tests. Other types of motor coordination have not been
examined on a trial-by-trial basis in ADHD children.
Bilateral responding (i.e. synchronization of unilateral
responses) reflects a basic form of motor coordination that
results in slower reaction times (around 5%) than unilateral
response (Jeeves and Dixon 1970, Ohtsuki 1981, Anson and
Bird 1993). This bilateral reaction-time deficit is present even if
separate blocks of uni- and bilateral trials permit optimal atten-
tional strategies and response preparation (Kawabe 1989).
This may be due to additional motor coordination rather than
attentional or cognitive coordination. In addition, the reduc-
tion of this bilateral timing deficit in patients with split-brains
(Gazzaniga and Sperry 1966, Wyke 1971) indicates that it is
mediated by the corpus callosum. As some studies indicate
that certain callosal regions are reduced in children with
ADHD (Semrud-Clikeman et al. 1994, Castellanos et al. 1996,
but see Overmeyer et al. 2000), impaired bilateral coordina-
tion may be expected in this group.
The aims of the present study were: (1) to determine spe-
cific motor processing deficits in children with ADHD using
neuromotor assessment and continuous-force recordings
in a reaction-time test involving bilateral coordination, and
(2) to clarify the contribution of attentional and motor
measures to the prediction of an ADHD diagnosis.
MethodPARTICIPANTS
Forty-two right-handed children (IQ>80; age range 8.2 to
13.5 years) were selected for this study. The 22 children with
ADHD (mean age 10.9 years, range 8.8 to 13.5 years) and 20
sex- and age-matched control children (mean age 10.6 years
range 8.2 to 12.6 years) were grouped on the basis of DSM-
III-R (American Psychiatric Association 1987) diagnoses
derived from a structured interview (Schaffer et al. 1993) car-
ried out by trained undergraduate psychology students. The
children with ADHD were recruited from our patients (n=11),
from parents’ organizations (n=5), from an epidemiological
field study (n=4; Steinhausen et al. 1998), and from nearby
schools through teachers (n=1), or school psychologists
(n=1). They all met the ADHD diagnosis and had no comor-
bid disorders except for oppositional defiant disorder (11
children) and/or conduct disorder (two children), and/or
one isolated phobia (five children). Control children were
recruited from regular schools through teachers or laboratory
staff members or from the same field study. No DSM-III-R diag-
noses were allowed except for a single isolated phobia (two
children). Control children’s T-scores (mean 50, SD 10) on the
Attention Problem Scale of the Child Behavior Check List
(CBCL; Achenbach 1991a) had to be lower than 55, i.e. less
than half a standard deviation above the normative value. The
sample description (for both the full group and subgroup
selected for additional analyses) is given in Table I.
At initial assessment the children’s parents and teachers
reported on behavior problems at home (CBCL) and at school
(Teacher’s Report Form, TRF; Achenbach 1991b). In the first
laboratory session all children underwent neuromotor assess-
ment and several neuromotor tests. An abbreviated version of
the revised Wechsler Intelligence Scale for Children (WISC)
with German normative values (Bründler and Schallberger
1988) was used to determine IQ. In a second laboratory ses-
sion a reaction-time test involving bilateral coordination was
performed in addition to other neuropsychological tests. All
children were free of medication at the time of testing; those
children with ADHD taking methylphenidate (n=7) had been
off medication for at least 24 hours.
Attentional and Neuromotor Deficits in ADHD J Steger et al. 173
Table I: Description of sample
Full group SubgroupADHD Control p ADHD Control pn=22 n=20 n=14 n=14
Age 10.93 10.55 >0.3 10.54 10.78 >0.5
Sex (F/M) 3/19 3/17 0/14 0/14
IQ 98.67 105.56 <0.05 101.43 104.10 >0.3
CBCL attention problems 66.13 43.10 <0.0001 64.31 43.11 <0.0001
(T-scores)
Comorbidity (nr children)
Multiple comorbidities 4 – – 2 – –
Single comorbidity 10 2 – 8 2 –
ODD 11 – – 7 – –
CD 2 – – 1 – –
Phobias 5 2 – 4 2 –
CBCL, Child Behavior Checklist; ODD, Oppositional defiant disorder; CD, Conduct disorder.
NEUROMOTOR ASSESSMENT
Each child was examined by trained child psychiatrists using
a neuromotor assessment battery (Largo and Caflisch 1999)
based on Denckla’s (1974) six tasks of repeated movements.
The children were instructed to execute each of the follow-
ing tasks rapidly but precisely while the time needed to com-
plete the movements was measured: (1) Finger repetition
(simple movement), the child touches index finger to
thumb (20 repetitions). (2) Finger sequention (patterned
movement), the child touches each finger successively to
thumb, moving from the index finger to the little finger each
time (5 repetitions). (3) Hand pat (simple movement), the
child pats the thigh with the palm of the hand, with the heel
of the palm resting on the thigh (20 repetitions). (4) Hand
pronation–supination (patterned movement), the child
pats the thigh with the back and palm of the hand alternately
(10 repetitions). (5) Toe taps (simple movement), the child
taps toe with the heel resting on the floor (20 repetitions).
(6) Heel–toe (patterned movement), the child alternates
touching heel and toe to the floor in a rocking motion (10
repetitions).
REACTION-TIME TEST
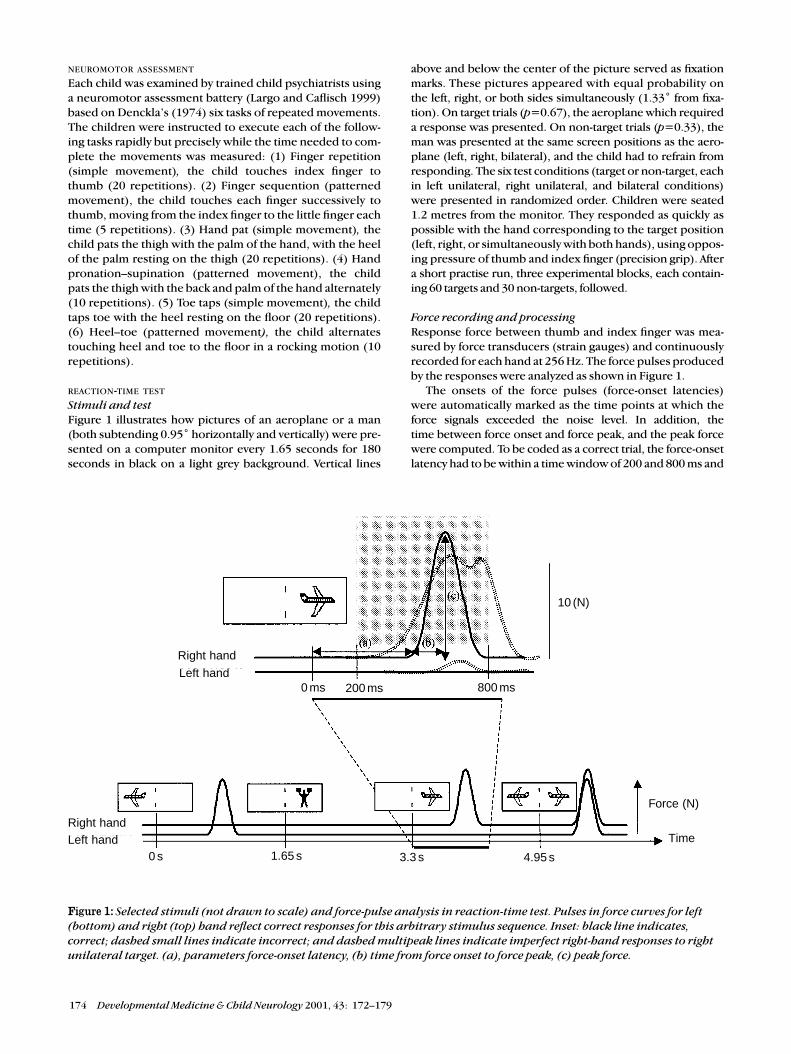
Stimuli and testFigure 1 illustrates how pictures of an aeroplane or a man
(both subtending 0.95˚ horizontally and vertically) were pre-
sented on a computer monitor every 1.65 seconds for 180
seconds in black on a light grey background. Vertical lines
above and below the center of the picture served as fixation
marks. These pictures appeared with equal probability on
the left, right, or both sides simultaneously (1.33˚ from fixa-
tion). On target trials (p=0.67), the aeroplane which required
a response was presented. On non-target trials (p=0.33), the
man was presented at the same screen positions as the aero-
plane (left, right, bilateral), and the child had to refrain from
responding. The six test conditions (target or non-target, each
in left unilateral, right unilateral, and bilateral conditions)
were presented in randomized order. Children were seated
1.2 metres from the monitor. They responded as quickly as
possible with the hand corresponding to the target position
(left, right, or simultaneously with both hands), using oppos-
ing pressure of thumb and index finger (precision grip). After
a short practise run, three experimental blocks, each contain-
ing 60 targets and 30 non-targets, followed.
Force recording and processingResponse force between thumb and index finger was mea-
sured by force transducers (strain gauges) and continuously
recorded for each hand at 256 Hz. The force pulses produced
by the responses were analyzed as shown in Figure 1.
The onsets of the force pulses (force-onset latencies)
were automatically marked as the time points at which the
force signals exceeded the noise level. In addition, the
time between force onset and force peak, and the peak force
were computed. To be coded as a correct trial, the force-onset
latency had to be within a time window of 200 and 800 ms and
174 Developmental Medicine & Child Neurology 2001, 43: 172–179
Figure 1: Selected stimuli (not drawn to scale) and force-pulse analysis in reaction-time test. Pulses in force curves for left(bottom) and right (top) hand reflect correct responses for this arbitrary stimulus sequence. Inset: black line indicates,correct; dashed small lines indicate incorrect; and dashed multipeak lines indicate imperfect right-hand responses to rightunilateral target. (a), parameters force-onset latency, (b) time from force onset to force peak, (c) peak force.
Left hand
Right hand
0 ms 200 ms 800 ms
10 (N)
Force (N)
Time
0 s 1.65 s 3.3 s 4.95 s
Right handLeft hand
peak force had to be higher than 0.5 N (grey box in Fig. 1).
In addition to the traditional error types (omission and
commission errors, side errors, unilateral responses in the
bilateral condition, and bilateral responses in unilateral con-
ditions), several imperfect but correct responses were coded
and analysed. These were: (1) trials with force-onset laten-
cies shorter than 200 ms or longer than 800 ms, (2) trials with
mirror movements (correct but additional response pulses
below 0.5 N with the incorrect hand, see Fig. 1), (3) trials
with multiple force peaks (see Fig. 1), and (4) trials with
poor synchronization of bilateral responses (defined as
force-onset latency differences of more than 60 ms ). These
imperfect responses were not included in the total error
count in order to maintain compatibility with previous error
analyses. All errors were transformed into percentages and
time measures were log transformed (base 10).
DATA ANALYSIS
Group and condition effects were first tested separately for
the parameters of the neuromotor assessment, and the reac-
tion-time test. Multivariate analysis of variance for repeated
measures covaried for IQ (MANCOVA/GLM) were used for
this purpose. Equivalent F values for Wilk’s Lambda are
reported. These multivariate analyses were followed by uni-
variate analyses of covariance (ANCOVA) for specific tasks or
test conditions. Due to the fact that sex and IQ were suspect-
ed to correlate with an ADHD diagnosis, all analyses were
also performed on subgroups matched for sex and IQ
(instead of covarying for IQ). These subgroup results are
only reported if there were discrepancies with the full
group analyses. As no significant differences were obtained
between left- and right-sided responses, their mean was
taken for all analyses. For the neuromotor assessment, the
time (in seconds) needed to complete the movements in the
six tasks was analyzed with the factors group (ADHD versus
control), extremity (finger versus hand versus leg), move-
ment mode (simple versus patterned), and with age as an
additional covariate. For the reaction-time test, the time and
error measures listed above were analyzed with the factors
group, bilaterality (mean unilateral versus bilateral), and tar-
get/non-target (targets versus non-targets, only for error
parameters). These analyses were performed both with and
without age as an additional covariate.
For the group prediction (ADHD or control group, full
groups only), the best group discriminator from the neuro-
motor analysis, and the best group discriminator from the
reaction-time analyses were selected. These two measures
and the IQ were entered together in a logistic regression.
Due to several measures in the reaction-time test indicating
high significance group differences (p<0.001) logistic regres-
sions were computed for each of those measures alone to
determine the one with the best predictive value. Specific
settings of all these maximum-likelihood predictions includ-
ed: forward and backward stepwise method, entry p=0.05,
removal p=0.1; classification cut off p=0.05; and 20 maxi-
mum iterations. In case of discrepancies between forward
and backward solutions, the window between entry and
removal criterion was reduced (entry p=0.05, removal
p=0.06). Subanalyses with single predictors were run to clari-
fy the effects. Significance values of the Wald statistic are based
on the χ2 distribution.
ResultsTable I shows that the mean IQ was lower for children with
ADHD than for control children whereas the analysis of the
subgroups (n=14 for each group, males only) showed no
significant IQ differences. According to the CBCL, children
with ADHD had significantly higher attention-problem scores
than control children. No significant age differences between
the ADHD and control children were found.
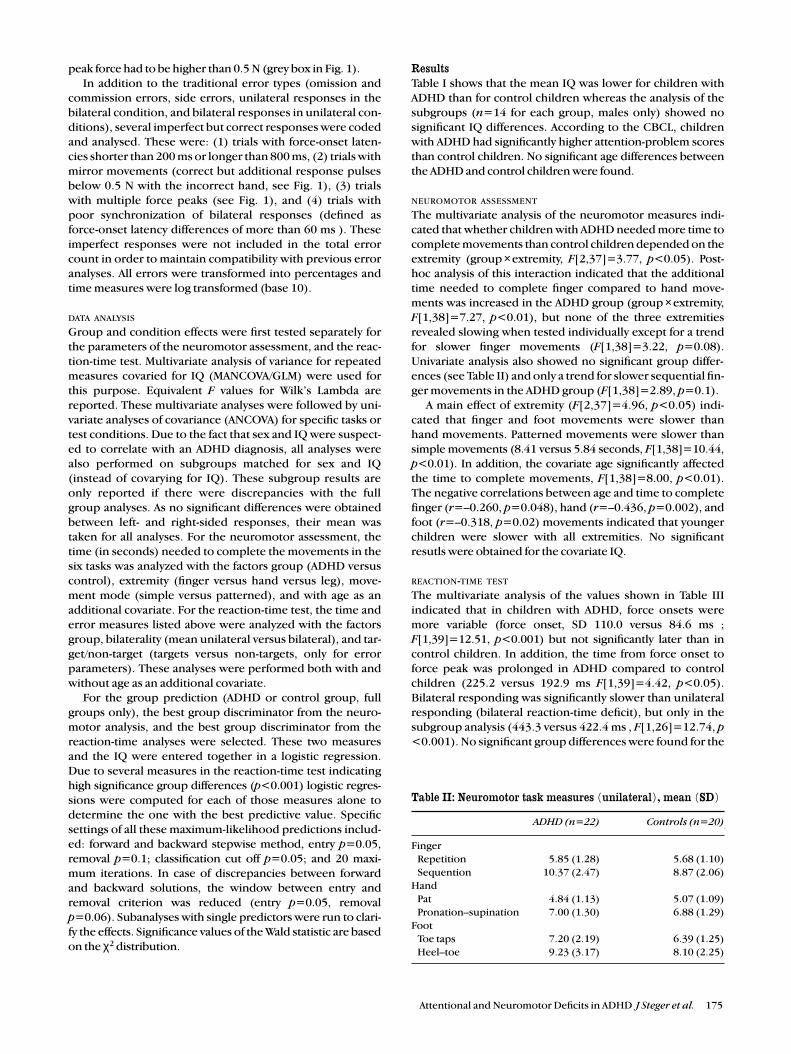
NEUROMOTOR ASSESSMENT
The multivariate analysis of the neuromotor measures indi-
cated that whether children with ADHD needed more time to
complete movements than control children depended on the
extremity (group ×extremity, F[2,37]=3.77, p<0.05). Post-
hoc analysis of this interaction indicated that the additional
time needed to complete finger compared to hand move-
ments was increased in the ADHD group (group ×extremity,
F[1,38]=7.27, p<0.01), but none of the three extremities
revealed slowing when tested individually except for a trend
for slower finger movements (F[1,38]=3.22, p=0.08).
Univariate analysis also showed no significant group differ-
ences (see Table II) and only a trend for slower sequential fin-
ger movements in the ADHD group (F[1,38]=2.89, p=0.1).
A main effect of extremity (F[2,37]=4.96, p<0.05) indi-
cated that finger and foot movements were slower than
hand movements. Patterned movements were slower than
simple movements (8.41 versus 5.84 seconds, F[1,38]=10.44,
p<0.01). In addition, the covariate age significantly affected
the time to complete movements, F[1,38]=8.00, p<0.01).
The negative correlations between age and time to complete
finger (r=–0.260, p=0.048), hand (r=–0.436, p=0.002), and
foot (r=–0.318, p=0.02) movements indicated that younger
children were slower with all extremities. No significant
resutls were obtained for the covariate IQ.
REACTION-TIME TEST
The multivariate analysis of the values shown in Table III
indicated that in children with ADHD, force onsets were
more variable (force onset, SD 110.0 versus 84.6 ms ;
F[1,39]=12.51, p<0.001) but not significantly later than in
control children. In addition, the time from force onset to
force peak was prolonged in ADHD compared to control
children (225.2 versus 192.9 ms F[1,39]=4.42, p<0.05).
Bilateral responding was significantly slower than unilateral
responding (bilateral reaction-time deficit), but only in the
subgroup analysis (443.3 versus 422.4 ms , F[1,26]=12.74, p<0.001). No significant group differences were found for the
Attentional and Neuromotor Deficits in ADHD J Steger et al. 175
Table II: Neuromotor task measures (unilateral), mean (SD)
ADHD (n=22) Controls (n=20)
Finger
Repetition 5.85 (1.28) 5.68 (1.10)
Sequention 10.37 (2.47) 8.87 (2.06)
Hand
Pat 4.84 (1.13) 5.07 (1.09)
Pronation–supination 7.00 (1.30) 6.88 (1.29)
Foot
Toe taps 7.20 (2.19) 6.39 (1.25)
Heel–toe 9.23 (3.17) 8.10 (2.25)
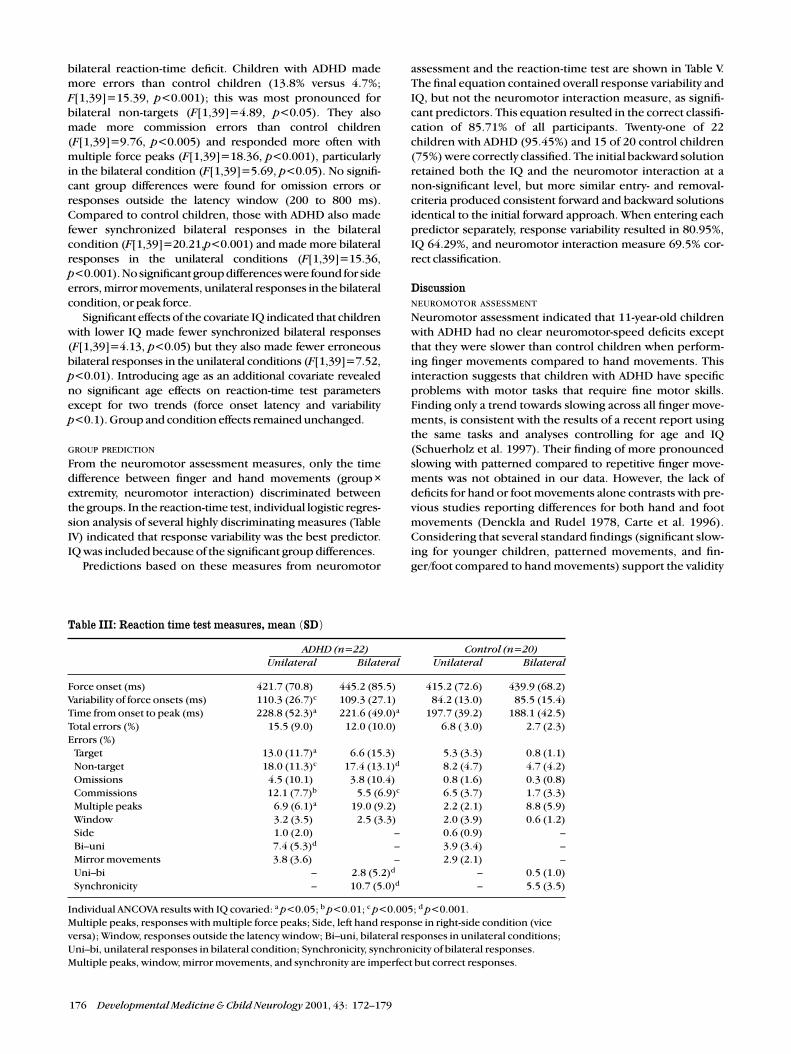
bilateral reaction-time deficit. Children with ADHD made
more errors than control children (13.8% versus 4.7%;
F[1,39]=15.39, p<0.001); this was most pronounced for
bilateral non-targets (F[1,39]=4.89, p<0.05). They also
made more commission errors than control children
(F[1,39]=9.76, p<0.005) and responded more often with
multiple force peaks (F[1,39]=18.36, p<0.001), particularly
in the bilateral condition (F[1,39]=5.69, p<0.05). No signifi-
cant group differences were found for omission errors or
responses outside the latency window (200 to 800 ms).
Compared to control children, those with ADHD also made
fewer synchronized bilateral responses in the bilateral
condition (F[1,39]=20.21,p<0.001) and made more bilateral
responses in the unilateral conditions (F[1,39]=15.36,
p<0.001). No significant group differences were found for side
errors, mirror movements, unilateral responses in the bilateral
condition, or peak force.
Significant effects of the covariate IQ indicated that children
with lower IQ made fewer synchronized bilateral responses
(F[1,39]=4.13, p<0.05) but they also made fewer erroneous
bilateral responses in the unilateral conditions (F[1,39]=7.52,
p<0.01). Introducing age as an additional covariate revealed
no significant age effects on reaction-time test parameters
except for two trends (force onset latency and variability
p<0.1). Group and condition effects remained unchanged.
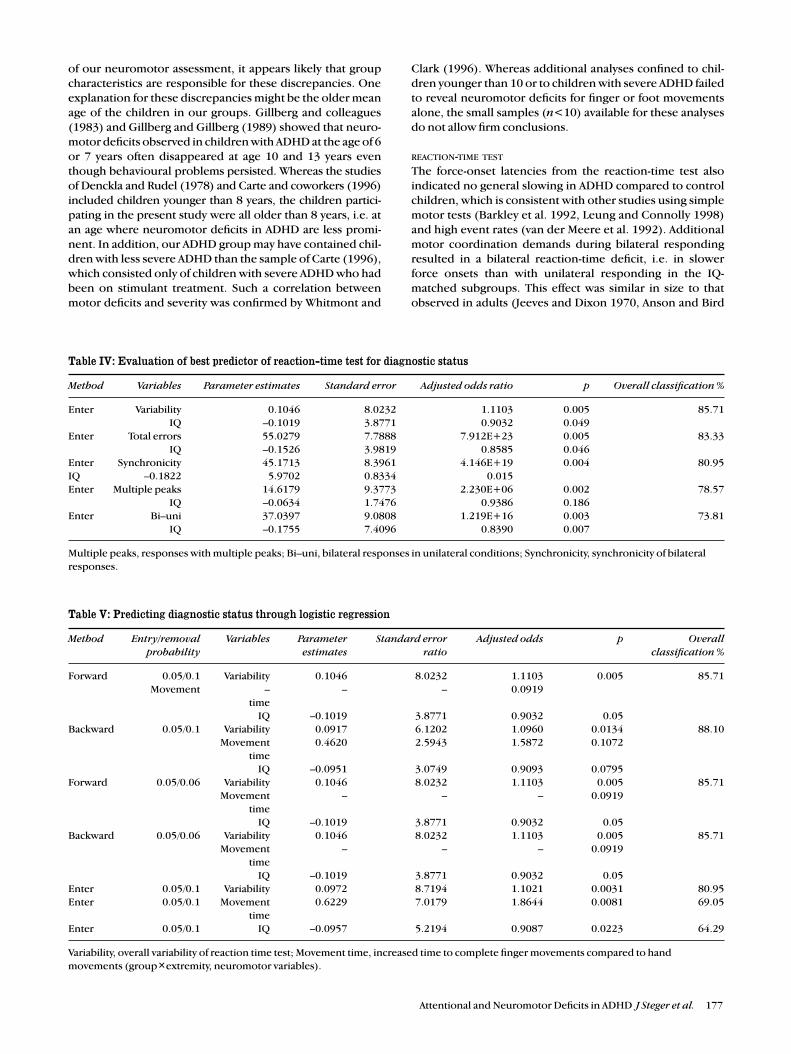
GROUP PREDICTION
From the neuromotor assessment measures, only the time
difference between finger and hand movements (group ×extremity, neuromotor interaction) discriminated between
the groups. In the reaction-time test, individual logistic regres-
sion analysis of several highly discriminating measures (Table
IV) indicated that response variability was the best predictor.
IQ was included because of the significant group differences.
Predictions based on these measures from neuromotor
assessment and the reaction-time test are shown in Table V.
The final equation contained overall response variability and
IQ, but not the neuromotor interaction measure, as signifi-
cant predictors. This equation resulted in the correct classifi-
cation of 85.71% of all participants. Twenty-one of 22
children with ADHD (95.45%) and 15 of 20 control children
(75%) were correctly classified. The initial backward solution
retained both the IQ and the neuromotor interaction at a
non-significant level, but more similar entry- and removal-
criteria produced consistent forward and backward solutions
identical to the initial forward approach. When entering each
predictor separately, response variability resulted in 80.95%,
IQ 64.29%, and neuromotor interaction measure 69.5% cor-
rect classification.
DiscussionNEUROMOTOR ASSESSMENT
Neuromotor assessment indicated that 11-year-old children
with ADHD had no clear neuromotor-speed deficits except
that they were slower than control children when perform-
ing finger movements compared to hand movements. This
interaction suggests that children with ADHD have specific
problems with motor tasks that require fine motor skills.
Finding only a trend towards slowing across all finger move-
ments, is consistent with the results of a recent report using
the same tasks and analyses controlling for age and IQ
(Schuerholz et al. 1997). Their finding of more pronounced
slowing with patterned compared to repetitive finger move-
ments was not obtained in our data. However, the lack of
deficits for hand or foot movements alone contrasts with pre-
vious studies reporting differences for both hand and foot
movements (Denckla and Rudel 1978, Carte et al. 1996).
Considering that several standard findings (significant slow-
ing for younger children, patterned movements, and fin-
ger/foot compared to hand movements) support the validity
176 Developmental Medicine & Child Neurology 2001, 43: 172–179
Table III: Reaction time test measures, mean (SD)
ADHD (n=22) Control (n=20)Unilateral Bilateral Unilateral Bilateral
Force onset (ms) 421.7 (70.8)c 445.2 (85.5)a 415.2 (72.6) 439.9 (68.2)
Variability of force onsets (ms) 110.3 (26.7)c 109.3 (27.1)a 84.2 (13.0) 85.5 (15.4)
Time from onset to peak (ms) 228.8 (52.3)a 221.6 (49.0)a 197.7 (39.2) 188.1 (42.5)
Total errors (%) 15.5 (9.0)a 12.0 (10.0)a 6.8 ( 3.0) 2.7 (2.3)
Errors (%)
Target 13.0 (11.7)a 6.6 (15.3)d 5.3 (3.3) 0.8 (1.1)
Non-target 18.0 (11.3)c 17.4 (13.1)d 8.2 (4.7) 4.7 (4.2)
Omissions 4.5 (10.1)c 3.8 (10.4)d 0.8 (1.6) 0.3 (0.8)
Commissions 12.1 (7.7)b 5.5 (6.9)c 6.5 (3.7) 1.7 (3.3)
Multiple peaks 6.9 (6.1)a 19.0 (9.2)c 2.2 (2.1) 8.8 (5.9)
Window 3.2 (3.5)a 2.5 (3.3)c 2.0 (3.9) 0.6 (1.2)
Side 1.0 (2.0)a – 0.6 (0.9) –
Bi–uni 7.4 (5.3)d – 3.9 (3.4) –
Mirror movements 3.8 (3.6)d – 2.9 (2.1) –
Uni–bi – 2.8 (5.2)dd – 0.5 (1.0)
Synchronicity – 10.7 (5.0)d – 5.5 (3.5)
Individual ANCOVA results with IQ covaried: a p<0.05; b p<0.01; c p<0.005; d p<0.001.
Multiple peaks, responses with multiple force peaks; Side, left hand response in right-side condition (vice
versa); Window, responses outside the latency window; Bi–uni, bilateral responses in unilateral conditions;
Uni–bi, unilateral responses in bilateral condition; Synchronicity, synchronicity of bilateral responses.
Multiple peaks, window, mirror movements, and synchronity are imperfect but correct responses.
k
of our neuromotor assessment, it appears likely that group
characteristics are responsible for these discrepancies. One
explanation for these discrepancies might be the older mean
age of the children in our groups. Gillberg and colleagues
(1983) and Gillberg and Gillberg (1989) showed that neuro-
motor deficits observed in children with ADHD at the age of 6
or 7 years often disappeared at age 10 and 13 years even
though behavioural problems persisted. Whereas the studies
of Denckla and Rudel (1978) and Carte and coworkers (1996)
included children younger than 8 years, the children partici-
pating in the present study were all older than 8 years, i.e. at
an age where neuromotor deficits in ADHD are less promi-
nent. In addition, our ADHD group may have contained chil-
dren with less severe ADHD than the sample of Carte (1996),
which consisted only of children with severe ADHD who had
been on stimulant treatment. Such a correlation between
motor deficits and severity was confirmed by Whitmont and
Clark (1996). Whereas additional analyses confined to chil-
dren younger than 10 or to children with severe ADHD failed
to reveal neuromotor deficits for finger or foot movements
alone, the small samples (n<10) available for these analyses
do not allow firm conclusions.
REACTION-TIME TEST
The force-onset latencies from the reaction-time test also
indicated no general slowing in ADHD compared to control
children, which is consistent with other studies using simple
motor tests (Barkley et al. 1992, Leung and Connolly 1998)
and high event rates (van der Meere et al. 1992). Additional
motor coordination demands during bilateral responding
resulted in a bilateral reaction-time deficit, i.e. in slower
force onsets than with unilateral responding in the IQ-
matched subgroups. This effect was similar in size to that
observed in adults (Jeeves and Dixon 1970, Anson and Bird
Attentional and Neuromotor Deficits in ADHD J Steger et al. 177
Table IV: Evaluation of best predictor of reaction-time test for diagnostic status
Method Variables Parameter estimates Standard error Adjusted odds ratio p Overall classification %
Enter Variability 0.1046 8.0232 1.1103 0.005 85.71
IQ –0.1019 3.8771 0.9032 0.049
Enter Total errors 55.0279 7.7888 7.912E+23 0.005 83.33
IQ –0.1526 3.9819 0.8585 0.046
Enter Synchronicity 45.1713 8.3961 4.146E+19 0.004 80.95
IQ –0.1822 5.9702 0.8334 0.015
Enter Multiple peaks 14.6179 9.3773 2.230E+06 0.002 78.57
IQ –0.0634 1.7476 0.9386 0.186
Enter Bi–uni 37.0397 9.0808 1.219E+16 0.003 73.81
IQ –0.1755 7.4096 0.8390 0.007
Multiple peaks, responses with multiple peaks; Bi–uni, bilateral responses in unilateral conditions; Synchronicity, synchronicity of bilateral
responses.
Table V: Predicting diagnostic status through logistic regression
Method Entry/removal Variables Parameter Standard error Adjusted odds p Overallprobability estimates ratio classification %
Forward 0.05/0.1 Variability 0.1046 8.0232 1.1103 0.005 85.71
Movement – – – 0.0919
time
IQ –0.1019 3.8771 0.9032 0.05
Backward 0.05/0.1 Variability 0.0917 6.1202 1.0960 0.0134 88.10
Movement 0.4620 2.5943 1.5872 0.1072
time
IQ –0.0951 3.0749 0.9093 0.0795
Forward 0.05/0.06 Variability 0.1046 8.0232 1.1103 0.005 85.71
Movement – – – 0.0919
time
IQ –0.1019 3.8771 0.9032 0.05
Backward 0.05/0.06 Variability 0.1046 8.0232 1.1103 0.005 85.71
Movement – – – 0.0919
time
IQ –0.1019 3.8771 0.9032 0.05
Enter 0.05/0.1 Variability 0.0972 8.7194 1.1021 0.0031 80.95
Enter 0.05/0.1 Movement 0.6229 7.0179 1.8644 0.0081 69.05
time
Enter 0.05/0.1 IQ –0.0957 5.2194 0.9087 0.0223 64.29
Variability, overall variability of reaction time test; Movement time, increased time to complete finger movements compared to hand
movements (group×extremity, neuromotor variables).
1993), which suggests that the underlying processes were
relatively mature in our 11-year-old children. Whether the
bilateral deficit in adults is also eliminated by covarying IQ
remains to be examined. The groups did not differ in the size
of their bilateral deficits. This contrasts with the reduced
bilateral deficit of patients with split-brains and suggests that
those callosal functions supporting bilateral motor coordi-
nation are unaffected in children with ADHD.
Measuring continuous-force output in this test provided
direct measures of motor function that are unavailable with
typical reaction-time testing. Due to the fact that peak force
was comparable between ADHD and control children, the
prolonged time from force onset to force peak in children
with ADHD must reflect a pure motor-speed deficit. Another
type of specific motor deficit was revealed by the increased
rate of multiple response peaks in children with ADHD
which was most pronounced under bilateral coordination
demands. Deterioration of the quality of motor output,
therefore, increased with demands. This may contribute to
the high rates of motor deficits in children with ADHD which
are obtained if qualitative aspects of motor performance in
more complex skills are also scored (Gillberg 1995, Kadesjo
and Gillberg 1998).
Mirror movements are another aspect of motor function
that can only be measured with continuous-force recordings
in reaction-time studies. The mirror movements were not
significantly increased in the group with ADHD, which con-
trasts with a neuromotor assessment study in younger chil-
dren (Denckla and Rudel 1978) and parallels the lack of
significant neuromotor timing differences in this age range.
Future studies with younger children, who are known to
exhibit more mirror movements, could clarify the relation-
ship between mirror movements derived from quantifica-
tion of continuous-force output and from visual ratings
during neuromotor assessments.
Children with ADHD made more errors than control chil-
dren and showed increased variability of force-onset latencies
during correct responding. These findings are consistent
with previous studies (Mitchell et al. 1990, Schachar 1991,
Oosterlaan and Sergeant 1998, Rubia et al. 1998, Földényi et
al. 2000) and are thought to reflect attentional deficits in chil-
dren with ADHD. In particular, high response variability has
been associated with non-optimal regulation of attentional or
energetic states (Oosterlaan and Sergeant 1998). Similarly, the
fewer synchronized bilateral responses of children with
ADHD may be due to the increased variability of the participat-
ing unilateral responses. As neither the latency nor the vari-
ability of bilateral responses were specifically increased in
the group with ADHD, contributions from a specific transcal-
losal coordination deficit appear less likely.
Children with ADHD made slightly more unilateral instead
of bilateral responses than control children, but they made
many more erroneous bilateral responses on unilateral trials,
and particularly on unilateral non-targets (commission errors).
This suggests a bias towards bilateral responding throughout
the test and could reflect attentional response–control deficits
in children with ADHD. Commission errors were more fre-
quent in ADHD than in control children, which is consistent
with findings from other tests using similarly high response
rates (50%) either throughout or after cues (Michael et al.
1981, van Leeuwen et al. 1998). The lack of significant group
differences in omission errors is also consistent with previous
studies; omission errors are typically prominent only in vigi-
lance tests with low-response probability.
Taken together, continuous-force measurements during
the reaction-time test revealed both specific motor and atten-
tional deficits in children with ADHD but no clear age effects
and no general motor slowing. This finding is consistent with
recent event-related potential findings during the same test,
which indicate that both premotor and attentional brain
activity is reduced in boys with ADHD despite normal laten-
cies (Steger et al. 2000). The neuromotor assessment also
indicated no general motor slowing in children with ADHD,
but instead resulted in clear age effects. Both modes of test-
ing thus indicated that children with ADHD have no general
motor slowing but specific deficits which differ from those
characterizing younger children.
Correlating neuromotor with reaction-time parameters
provided further insight into the determinants of movement
speed during the neuromotor assessment. Finger movement
time correlated with force-onset latency during correct
responding (r=0.387, p=0.011) but not with the latency
between force onset and peak or with error rate in the reac-
tion-time test. This suggests that the time needed to com-
plete finger movements primarily varies with force-onset
latencies and is relatively unaffected by movement time and
errors of movement or sequencing in this child population.
GROUP PREDICTION
Prediction analysis indicated that force-onset variability and IQ
contributed to 85.7% correct group classification. Force-onset
variability provided the main contribution to group discrimi-
nation and IQ a minor contribution. Neuromotor interaction
(finger versus hand) not only led to poorer classification than
force-onset variability when tested separately, but was
removed from the final equation in the iterative procedures.
Similarly, the motor parameter in the reaction-time test led to
a lower classification than latency variability and errors did.
This contrasts with the results from neuromotor studies of
younger children and with significant group differences for
individual neuromotor measures. In the study by Carte and
colleagues (1996), neuromotor variables provided one of the
highest independent contributions to the 82% correct group
classification (using discriminant analysis of eight age-adjust-
ed measures), similar to the 80.6% correct classification
obtained by Denckla and Rudel (1978).
In conclusion, even in simple motor reaction-time tests,
attentional measures seem to discriminate better than motor
measures between 11-year-old children with ADHD and con-
trol children. Strong support for the conclusion that motor
deficits are less pronounced in this age range comes from the
fact that subtle deficits, which are unlikely to allow visual scor-
ing, could be measured reliably through continuous-force
recording. Further studies have to prove the clinical feasibility
of this new method of assessing neuromotor function.
Accepted for publication 8th June 2000.
AcknowledgmentsWe wish to thank the child psychiatrists of the clinic assessing theneuromotor state of all children and H Haas from the Laboratory forBiomechanics (ETH Zurich) for the construction and technical supportof the force measurement device. This work was supported by theSwiss National Science Foundation (31-43790.95 and 32-43144.95).
178 Developmental Medicine & Child Neurology 2001, 43: 172–179
ReferencesAchenbach TM. (1991a) Manual for the Child Behavior Check-
List/4-18 and 1991 Profile. Burlington, VT: Department ofPsychiatry, University of Vermont.
— (1991b) Manual for the Youth Self-Report and 1991Profile.Burlington, VT: Department of Psychiatry, University of Vermont.
American Psychiatric Association. (1987) Diagnostic and StatisticalManual of Mental Disorders. 3rd revised edn. Washington DC:American Psychiatric Association.
Anson JG, Bird YN. (1993) Neuromotor programming: bilateral andunilateral effects on simple reaction time. Human MovementScience 12: 37–50.
Barkley RA. (1990) Attention Deficit Hyperactivity Disorder: ahandbook for diagnosis and treatment. New York: GuildfordPress.
— Grodzinsky G, DuPaul GJ. (1992) Frontal lobe functions inattention-deficit disorder with and without hyperactivity: a reviewand research report. Journal of Abnormal Child Psychology 20:163–88.
Bründler M, Schallberger U. (1988) HAWIK-R Ergänzungsband mitNormentabellen und Testanweisungen für die deutschsprachigeSchweiz. Bern, Switzerland: Huber. (In German).
Carte ET, Nigg JT, Hinshaw SP. (1996) Neuropsychological functioning,motor speed, and language processing in boys with and withoutADHD. Journal of Abnormal Child Psychology 24: 481–98.
Castellanos FX, Giedd JN, Marsh WL, Hamburger SD, Vaituzis AC,Dickstein DP, Sarfatti SE, Vauss YC, Snell JW, Lange N et al. (1996)Quantitative brain magnetic resonance imaging in attention-deficit–hyperactivity disorder. Archives of General Psychiatry53: 607–16.
Chee P, Logan G, Schachar R, Lindsay P, Wachsmuth R. (1989) Effectsof event rate and display time on sustained attention inhyperactive, normal, and control children. Journal of AbnormalChild Psychology 17: 371–91.
Denckla MB. (1974) Development of motor co-ordination innormal children. Developmental Medicine & Child Neurology16: 729–41.
— Rudel RG. (1978) Anomalies of motor development inhyperactive boys. Annals of Neurology 3: 231–3.
Földényi M, Imhof K, Steinhausen H-C. (2000) Zur klinischenValidität der computerunterstützten Testbatterie (TAP) beiKindern mit Aufmerksamkeits- / Hyperaktivitätsstörungen.Zeitschrift für Neuropsychologie. 11: 154–167.
Gazzaniga MS, Sperry RW. (1966) Simultaneous doublediscrimination response following brain bisection.Psychonomic Science 4: 261–2.
Gillberg C. (1995) Clinical Child Neuropsychiatry. New York:Cambridge University Press.
— Carlstrom G, Rasmussen P. (1983) Hyperkinetic disorders inseven-year-old children with perceptual, motor and attentionaldeficits. Journal of Child Psychology and Psychiatry24: 233–46.
Gillberg IC, Gillberg C. (1989) Children with preschool minorneurodevelopmental disorders. IV: Behaviour and schoolachievement at age 13. Developmental Medicine & ChildNeurology 31: 3–13.
Jeeves MA, Dixon NF. (1970) Hemisphere differences in responserates to visual stimuli. Psychonomic Science 20: 249–51.
Kadesjo B, Gillberg C. (1998) Attention deficits and clumsiness inSwedish 7-year-old children. Developmental Medicine & ChildNeurology 40: 796–804.
Kawabe S. (1989) Effects of force output and preparatory set onpremotor time of simultaneous bilateral response. Perceptualand Motor Skills 68: 619–25.
Largo RM, Caflisch JA. (1999) Neuromotor development fromkindergarten age to adolescence. In: AF Kalverboer and AGramsbergen, editors. Handbook on Brain and Behavior inHuman Development. (Forthcoming).
Lazarus JC, Todor JI. (1991) The role of attention in the regulationof associated movement in children. Developmental Medicine& Child Neurology 33: 32–9.
Leung PW, Connolly KJ. (1998) Do hyperactive children have motororganization and/or execution deficits? Developmental Medicine& Child Neurology 40: 600–7.
McMahon SA, Greenberg LM. (1977) Serial neurologic examinationof hyperactive children. Pediatrics 59: 584–7.
Michael RL, Klorman R, Salzman LF, Borgstedt AD, Dainer KB.(1981) Normalizing effects of methylphenidate on hyperactivechildren’s vigilance performance and evoked potentials.Psychophysiology 18: 665–77.
Mitchell S, Bradley VA, Welch JL, Britton PG. (1990) Coma arousalprocedure: a therapeutic intervention in the treatment of headinjury. Brain Injury 4: 273–9.
Ohtsuki T. (1981) Increase in simple reaction time of kneeextension induced by simultaneous bilateral performance.Perceptual and Motor Skills 53: 27–30.
Oosterlaan J, Sergeant JA. (1998) Response inhibition and responsere-engagement in attention-deficit–hyperactivity disorder,disruptive, anxious and normal children. Behavioral BrainResearch 94: 33–43.
Overmeyer S, Simmons A, Santosh J, Andrew C, Williams SC, TaylorA, Chen W, Taylor E. (2000) Corpus callosum may be similar inchildren with ADHD and siblings of children with ADHD.Developmental Medicine & Child Neurology 42: 8–13.
Piek JP, Pitcher TM, Hay DA. (1999) Motor coordination andkinaesthesis in boys with attention-deficit–hyperactivity disorder.Developmental Medicine & Child Neurology 41: 159–65.
Rubia K, Oosterlaan J, Sergeant JA, Brandeis D, v. Leeuwen T. (1998)Inhibitory dysfunction in hyperactive boys. Behavioral BrainResearch 94: 25–32.
Schachar R. (1991) Childhood hyperactivity. Journal of ChildPsychology and Psychiatry 32: 155–91.
Schaffer DM, Fisher PS-S, Cohen P, Piacentini J, Davies M, ConnersCK, Regier D. (1993) The diagnostic interview schedule forchildren, revised version (DISC-R) I: Preparation, field testing,interrater reliability, and acceptability. Journal of the AmericanAcademy of Child and Adolescent Psychiatry 32: 643–50.
Schuerholz LJ, Cutting L, Mazzocco MM, Singer HS, Denckla MB.(1997) Neuromotor functioning in children with Tourettesyndrome with and without attention-deficit–hyperactivitydisorder. Journal of Child Neurology 12: 438–42.
Semrud-Clikeman M, Filipek PA, Biederman J, Steingard R, KennedyD, Renshaw P, Bekken K. (1994) Attention-deficit–hyperactivitydisorder: magnetic resonance imaging morphometric analysis ofthe corpus callosum. Journal of the American Academy of Child& Adolescent Psychiatry 33: 875–81.
Steger J, Imhof K, Steinhausen H-C, Brandeis D. (2000) Brainmapping of bilateral interactions in attention-deficit–hyperactivity disorder and control boys. ClinicalNeurophysiology 111: 1141–56
Steinhausen HC, Metzke CW, Meier M, Kannenberg R. (1998)Prevalence of child and adolescent psychiatric disorders: the Zurichepidemiological study. Acta Psychiatrica Scandinavica 98: 262–71.
van der Meere J, van Baal M, Sergeant J. (1989) The additive factormethod: a differential diagnostic tool in hyperactivity and learningdisability. Journal of Abnormal Child Psychology 17: 409–22.
— Vreeling HJ, Sergeant J. (1992) A motor presetting study inhyperactive, learning disabled and control children. Journal ofChild Psychology and Psychiatry 33: 1347–54.
van Leeuwen TH, Steinhausen HC, Overtoom CCE, Pascual-MarquiRD, van’t Klooster B, Rothenberger A, Sergeant JA, Brandeis D.(1998) The continuous performance test revisited withneuroelectric mapping: impaired orienting in children withattention deficits. Behavioral Brain Research 94: 97–110.
Waber DP, Mann MB, Merola J, Bauermeister M, Cohen C, Ferber R,Wolff PH. (1985) Motor overflow and attentional processes innormal school-age children. Developmental Medicine & ChildNeurology 27: 491–7.
Whitmont S, Clark C. (1996) Kinaesthetic acuity and fine motorskills in children with attention-deficit–hyperactivity disorder: apreliminary report. Developmental Medicine & Child Neurology38: 1091–8.
Wyke M. (1971) The effects of brain lesions on the performance ofbilateral arm movements. Neuropsychologia 9: 33–44.
Attentional and Neuromotor Deficits in ADHD J Steger et al. 179