Embed Size (px)
Citation preview
OXIDIZING POWER OF THE SURFACE OF
ATTAPULGITE CLAY
by
JOHN G. MILLER
Universi ty of Pennsylvania, Philadelphia, Pa.
W . LINWOOD HADEN, JR. , a n d T. DIXON OULTON
Minerals and Chemicals Philipp Corporation, Menlo Park, New Jersey
A B S T R A C T
I t has been demonstra ted t ha t ferric iron is the principal source of the oxidizing action of the surface of at tapulgite clay. The extent of oxidizing action in a- given time (the oxidizing power) has been determined as a function of the temperature of calcination of the clay in the range 100-900~
The oxidizing power was measured with TiC1 a in aqueous acid medium by direct t i trat ion of the clay in situ and by t i trat ion of extracts of the clay. The dissolution of the metallic cations of the clay was also studied in the same medium. The results have been correlated with structural changes caused by the calcination of attapulgite.
I N T R O D U C T I O N
AMONG the distinctive properties of attapulgite clay, the large surface area is outstanding. The importance of this and tile other properties of the clay in many uses has been reviewed recently by Haden (1963).
This surface, like that of other clays and clay minerals, exerts an oxidizing action upon substances adsorbed on it. As an example, some of the color tests for clay minerals such as attapulgite utilize this oxidizing action in the formation of the characterizing color of molecules adsorbed on the surface. The source of this oxidative capacity and the effect of such variables as temperature on its behavior have not been examined com- pletely. Dodd (1955) in his review of the matter has pointed to the need for further s tudy of the nature of this oxidizing action.
The present study, made with attapulgite clay, used a strong reducing agent, TiCls, to measure the oxidizing power of the clay surface. The 0.2 N HC1 and by t i tration of extracts of the clay obtained with the same aqueous acid. The dissolution of magnesium, aluminum, iron and calcium from the clay in the aqueous acid was also studied. These measurements were made considerably more useful by determining the changes brought about by calcining the clay.
381
382 TWELFTH NATIONAL CONFERENCE ON CLAYS AND CLAY MINERALS
The results show tha t ferric iron is clearly the dominant oxidizing agent at the surface of at tapulgi te clay. The effect of temperature on the re- act ivi ty of the iron and the other metal cations present provides a correla- tion between the oxidizing power and the structural changes known to take place in at tapulgi te as a result of calcination.
I t is a pleasure to acknowledge the advice and assistance given by C. G. Albert, R. E. Grim, G. A. Hemstoek, E. W. Sawyer, Jr. , and E. J. Triglia.
M A T E R I A L S A N D E X P E R I M E N T A L P R O C E D U R E S
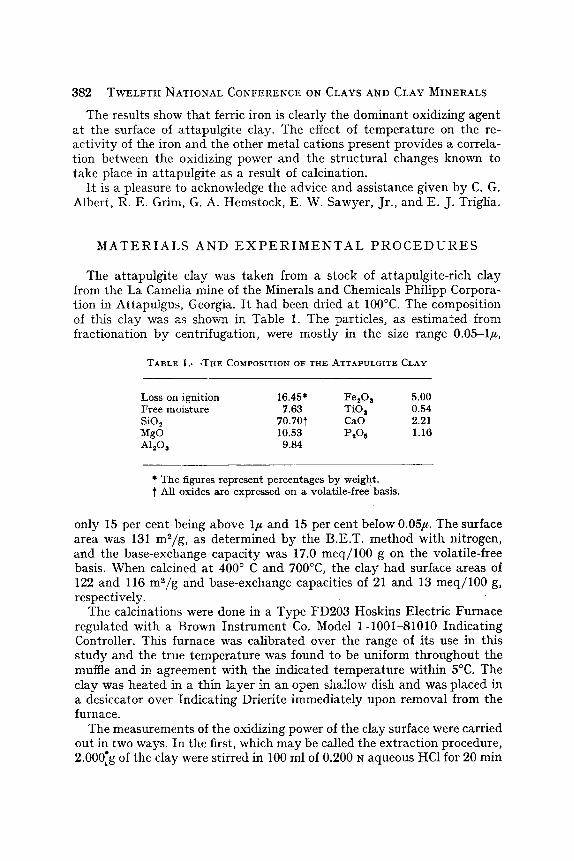
The at tapulgite clay was taken from a stock of at tapulgite-rich clay from the La Camelia mine of the Minerals and Chemicals Philipp Corpora- tion in Attapulgus, Georgia. I t had been dried at 100~ The composition of this clay was as shown in Table 1. The particles, as est imated from fractionation by centrifugation, were mostly in the size range 0.05-1#,
TABLE 1.--THE COMPOSITION OF THE ATTAPULGITE CLAY
Loss on ignition 16.45' Fe20 s 5.00 Free moisture 7.63 TiO, 0.54 SiO2 70.70t CaO 2.21 MgO 10.53 P,O 6 1.16 A120 , 9.84
* The figures represent percentages by weight. All oxides are expressed on a volatile-free basis.
only 15 per cent being above 1# and 15 per cent below 0.05/z. The surface area was 131 mS/g, as determined by the B.E.T. method with nitrogen, and the base-exchange capaci ty was 17.0 meq/100 g on the volatile-free basis. When calcined at 400 ~ C and 700~ the clay had surface areas of 122 and 116 m2/g and base-exchange capacities of 21 and 13 meq/100 g, respectively.
The calcinations were done in a Type FD203 Hoskins Electric Furnace regulated with a Brown Ins t rument Co. Model 1-1001-81010 Indicating Controller. This furnace was calibrated over the range of its use in this s tudy and the true temperature was found to be uniform throughout the muffle and in agreement with the indicated temperature within 5~ The clay was heated in a thin layer in an open shallow dish and was placed in a desiccator over Indicating Drierite immediately upon removal from the furnace.
The measurements of the oxidizing power of the clay surface were carried out in two ways. In the first, which may be called the extraction procedure, 2.000[g of the clay were stirred in 100 ml of 0.200 N aqueous HC1 for 20 min
OXIDIZING POWER OF THE SURFACE OF ATTAPULGITE CLAY 383
and then filtered rapidly. The residue was washed rapidly on the filter with 15 ml of water taken in two portions. The filtrates, or extracts, were t i t rated for oxidizing agents.
In the second way, which may be called the in situ procedure, 2.000 g of the clay were t i t ra ted directly in 100 ml of 0.200 ~ HC1, the ti tration being planned so tha t the end point was reached 20 mirL after the clay was added to the liquid medium, flushing with nitrogen being carried out before the t i trat ion was started. In some of these ti trations it was nearly impossible to reach the end point exactly on the 20-min mark. In these cases the effect of t ime on the rate of oxidation of the added reagent was determined and was used to correct the values to the 20-rain basis.
All of the t i trations were carried out potentiometrically in an air-free cell using TiC18 as a reducing agent. This reagent was chosen because of its strength as a reducing agent and because of its speed of reaction. The storage vessel for the TiC13, the buret, and the cell in which the ti trations were made were interconnected and equipped with inlets and outlets for using nitrogen t o t ransport the reagent to the buret, to flush the liquids, and to provide an inert atmosphere for the titrations. The cell was equipped with a plat inum electrode and a calomel (in saturated KC1) electrode and had magnetic stirring.
The TIC13 reagent was 0.0125 M in 1.7 M HC1 when first prepared but underwent s teady decomposition despite storage under nitrogen in a dark container. The zero-order rate of decrease in concentration was approxi- mately 0.0004 M per day. The reagent was calibrated against 0.01 M ferric ammonium sulfate a t each time of use.
A Fisher Titr imeter was used as a potentiometer in the titrations. In order to interpret the absolute value of the voltage of the cell, calibration was made with separate solutions of different IFe+ ~1/[Fe+21 ratios covering the range 0.08 to 10 in thirteen steps. In this way the formal equation for the voltage of the cell, r in the temperature range (25 ~ ~ 4~ in which it was used, was found to be:
e = (0.430 4- 0.002) + (RT/F) In ([Fe+a]/[Fe+2]).
Separate extracts obtained in exactly the same manner as for the de- termination of oxidizing power, i.e. by extracting 2.000 g of clay with 100 ml of 0.200 N HC1 for 20 min, were analyzed by standard analytical procedures for iron, aluminum, magnesium and calcium.
R E S U L T S
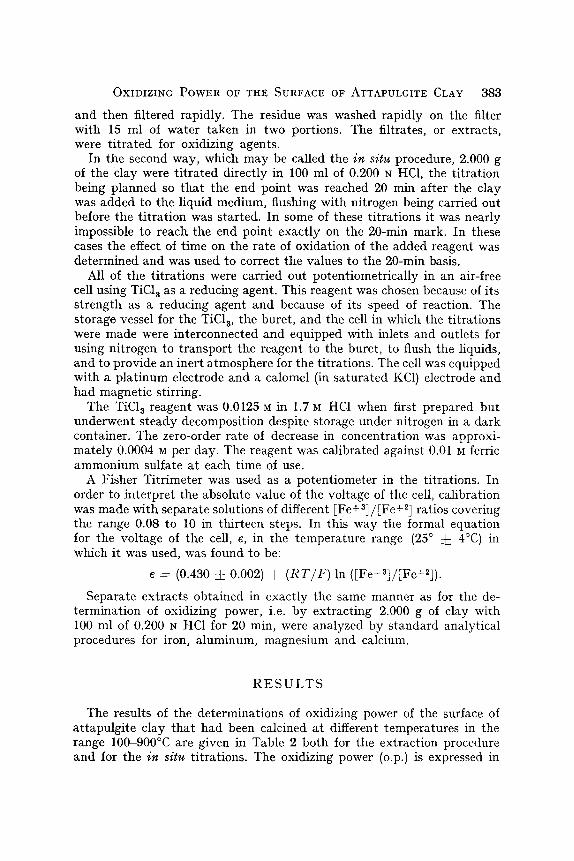
The results of the determinations of oxidizing power of the surface of at tapulgite clay tha t had been calcined a t different temperatures in the range 100-900~ are given in Table 2 both for the extraction procedure and for the in situ titrations. The oxidizing power (o.p.) is expressed in
3 8 4 TWELFTH NATIONAL CONFERENCE ON CLAYS AND CLAY MINERALS
< z
0 ~
0
0
Z
N 0 N b~
I.
o
.o .o
o~'~
. ~
o
~ ' ~
~.~
y.
OXIDIZING P O W E R OF THE SURFACE OF ATTAPULGITE CLAY 3 8 5
o
o
o
d q
~ o
m ~ a m o ~
�9 ~ u ~
386 TWELFTH NATIONAL CONFERENCE ON CLAYS AND CLAY MINERALS
Extract
ap. LO -
o~
o
0 = I t I I 1 I I I I 0 I(30 200 300 400 500 600 700 800 900 I(300
Temperoture (~ o [hr. �9 4hr
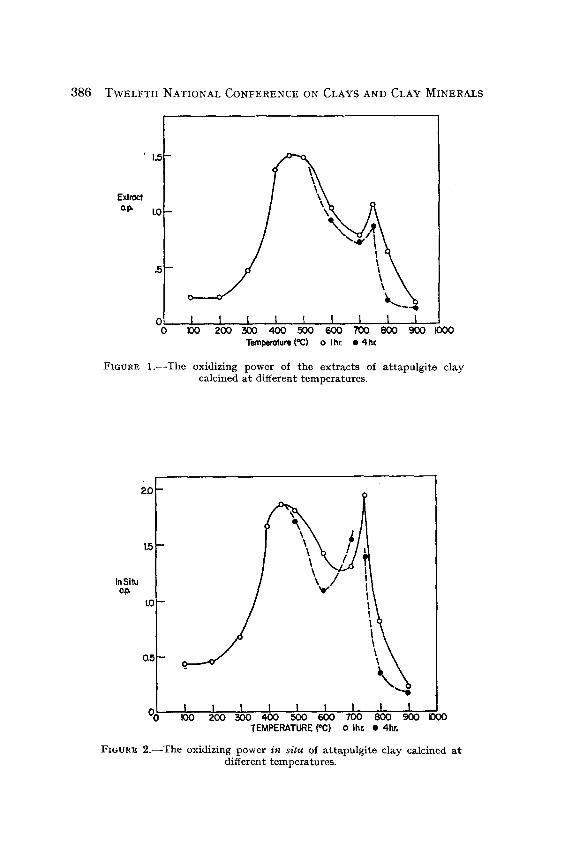
FIGURE l . - - T h e oxidizing power of the extracts of at tapulgite clay calcined at different temperatures.
2D
I I L I I o~ & , 0 0 - 4'~ ~ ~ ~ ~ ~ o TEMPERATURE ('C) o th~ �9 4hro
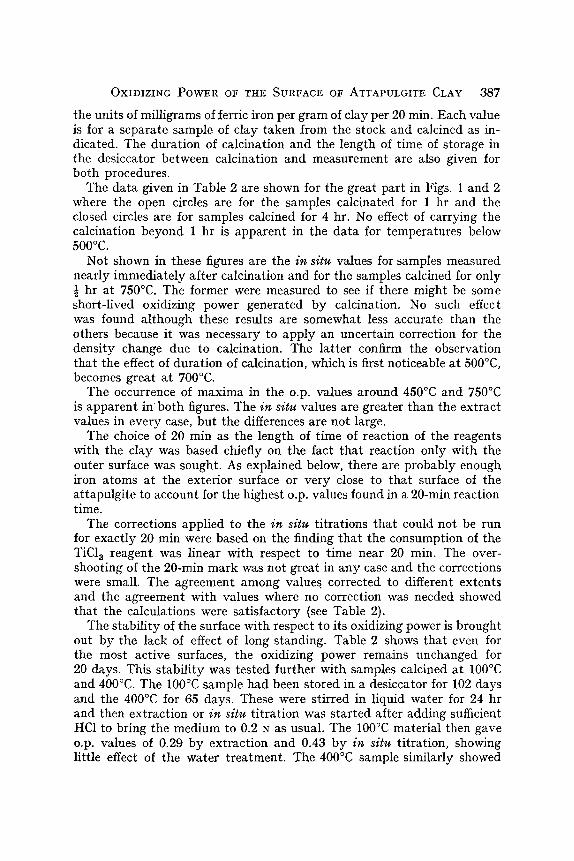
FZGURR 2 . - -The oxidizing power in situ of at tapulgite clay calcined a t different temperatures.
OXIDIZING POWER OF THE SURFACE OF ATTAPULGITE CLAY 387
the units of milligrams of ferric iron per gram of clay per 20 min. Each value is for a separate sample of clay taken from the stock and calcined as in- dicated. The duration of calcination and the length of t ime of storage in the desiccator between calcination and measurement are also given for both procedures.
The data given in Table 2 are shown for the great part in Figs. 1 and 2 where the open circles are for the samples calcinated for 1 hr and the closed circles are for samples calcined for 4 hr. No effect of carrying the calcination beyond 1 hr is apparent in the data for temperatures below 500~
Not shown in these figures are the in situ values for samples measured nearly immediately af ter calcination and for the samples calcined for only �89 hr at 750~ The former were measured to see if there might be some short-lived oxidizing power generated by calcination. No such effect was found al though these results are somewhat less accurate than the others because it was necessary to apply an uncertain correction for the density change due to calcination. The lat ter confirm the observation that the effect of duration of calcination, which is first noticeable a t 500~ becomes great at 700~
The occurrence of maxima in the o.p. values around 450~ and 750~ is apparent in both figures. The in situ values are greater than the extract values in every case, but the differences are not large.
The choice of 20 min as the length of t ime of reaction of the reagents with the clay was based chiefly on the fact tha t reaction only with the outer surface was sought. As explained below, there are probably enough iron a toms at the exterior surface or very close to that surface of the attapulgite to account for the highest o.p. values found in a 20-min reaction time.
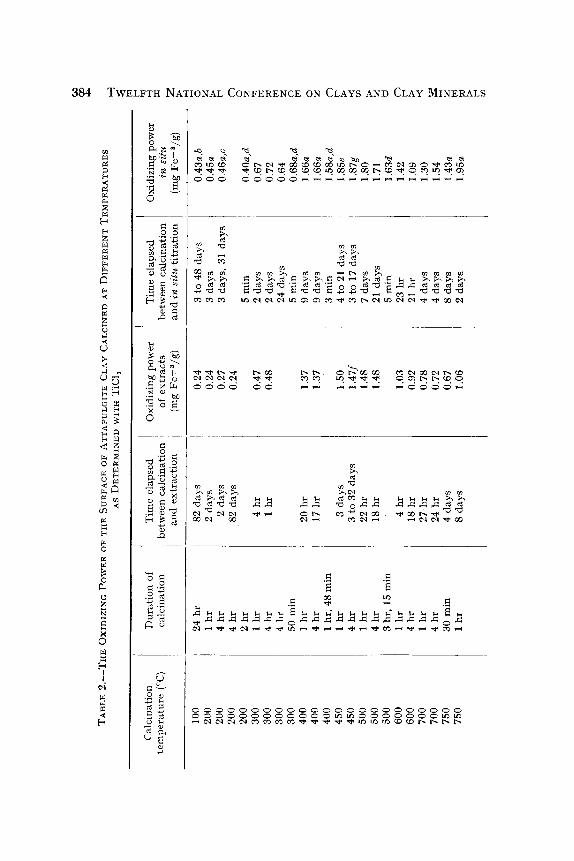
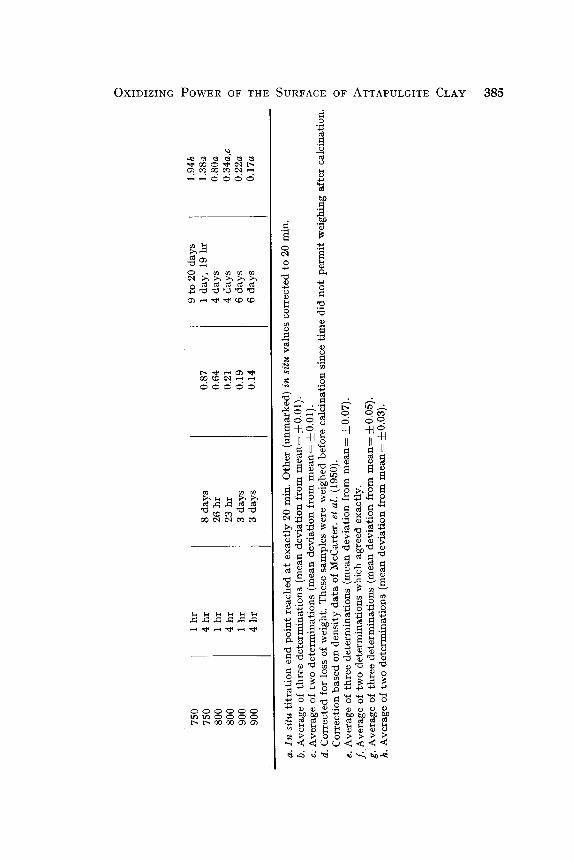
The corrections applied to the in situ t i trations that could not be run for exactly 20 min were based on the finding tha t the consumption of the TiC13 reagent was linear with respect to t ime near 20 min. The over- shooting of the 20-min mark was not great in any case and the corrections were small. The agreement among values, corrected to different extents and the agreement with values where no correction was needed showed that the calculations were sat isfactory (see Table 2).
The stabil i ty of the surface with respect to its oxidizing power is brought out by the lack of effect of long standing. Table 2 shows that even for the most active surfaces, the oxidizing power remains unchanged for 20 days. This stabil i ty was tested further with samples calcined at 100~ and 400~ The 100~ sample had been stored in a desiccator for 102 days and the 400~ for 65 days. These were stirred in liquid water for 24 hr and then extraction or in situ t i t rat ion was s tar ted after adding sufficient HC1 to bring the medium to 0.2 N as usual. The 100~ material then gave o.p. values of 0.29 by extraction and 0.43 by in situ t i tration, showing httle effect of the water t reatment . The 400~ sample similarly showed
3 8 8 T W E L F T H NATIONAL CONFERENCE ON CLAYS AND CLAY MINERALS
an in situ value of 1.64 which is nearly identical with the value shown in Table 2 for the sample kept dry and stored for only 9 days.
The possibility tha t the extraction of the iron from the clay m a y proceed through stages of equilibrium between the ions in solution and the ions in the at tapulgi te lattice was tested to see if this may account for some of the difference between the in situ and extraction values. This test was made by adding ferric iron to the HC1 medium used in the extraction of the clay. Amounts of iron up to twice the amount extracted were added. No such equilibrium was detected, the o.p. values being the same as without addition of the iron ions.
The relative rates of extraction of iron; aluminum, magnesium and calcium ions from the surface of the clay may be judged from the results of the s tandard chemical analyses made of the extracts obtained in the same way as for the extraction procedure of measuring the oxidizing power. These results are listed in Table 3.
TABL ;t 3 . ~ T H E AMOUNTS OF IRON, ALUMINUM, MAGNESIUM, AND CALCIUM EXTRACTED FROM THE ATTAPULGITE CLAY IN THE EXTRACTION PROCEDURE
Calcinat ion t e m p e r a t u r e
(~
200 200 300 300 400 400 450 500 500 600 600 700 700 750 800 800 9O0 90O
D u r a t i o n of
ca lc ina t ion
1 hr 4 hr 1 h r 4 h r 1 h r 4 h r 4 h r I h r 4 h r 1 h r 4 h r 1 h r 4 h r 4 h r 1 h r 4 h r 1 h r 4 h r
T i me elapsed be tween
ca lc ina t ion and ex t r ac t i on
2 days 2 days
4 h r I 1 hr 20 h r
: 17 h r 3 days 22 h r 18 h r 4 hrs 18 h r 27 h r 24 h r 23 days 26 h r 23 h r 3 days 3 days
Mil l igrams ex t r ac t ed per g r a m of c lay
Fe
0.35 0.43 0.60 0.60 1.75 1.50 1.47 1.70 1.65 1.10 1.00 0.67 0.61 0.95 0.60 0.07 0.14 0.08
A1 Mg ~ Ca
0.85 1.75 : 14.9 0.65 1.70 14.5 0.85 2.25 i 15.4 0.95 2.30 15.6 3.80 5.75 15.8 3.25 5.25 15.6 3.52 5.70 17.4 3.90 6.25 16.4 3.85 5.95 16.0 3.30 5.60 15.8 3.10 5.30 15.8 1.99 4.14 14.3 1.52 3.28 13.0 2.73 5.80 10.1 1.83 3.46 9.65 0.33 0.30 8.30 0.87 0 7.90 0.44 0 7.95
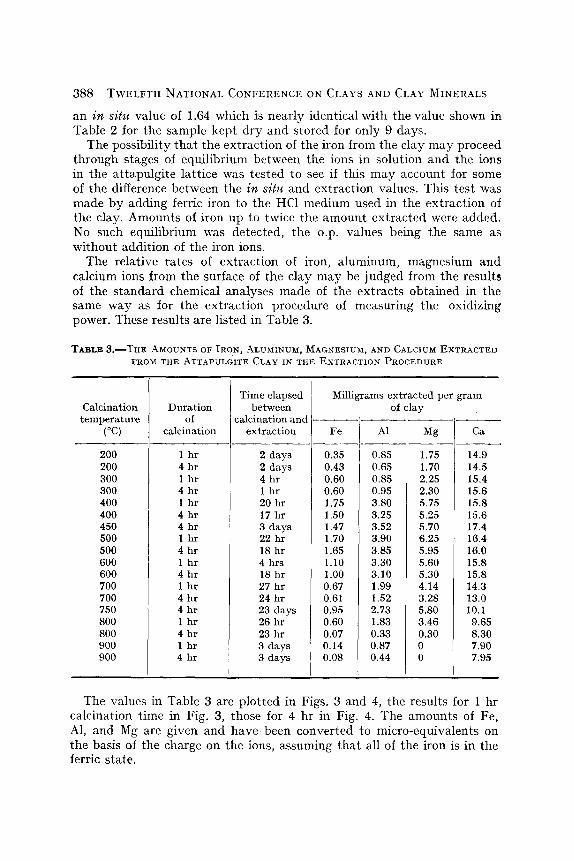
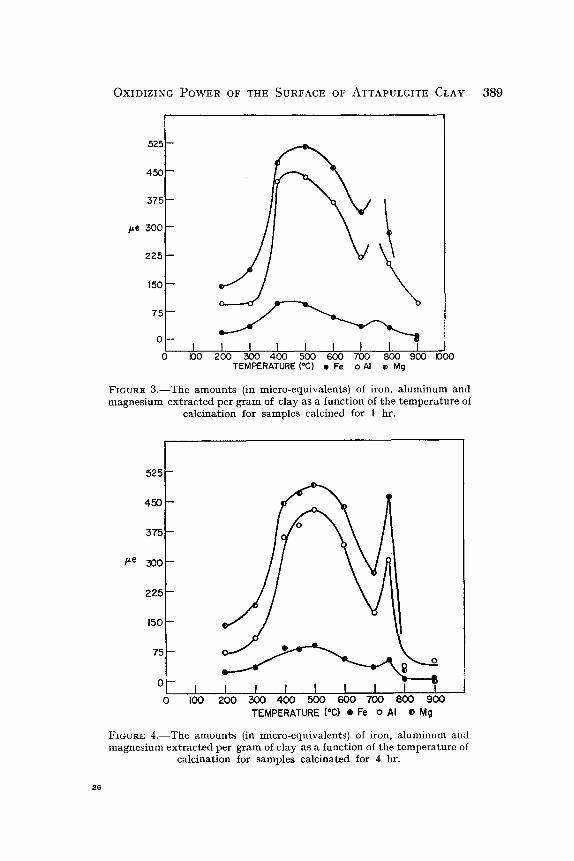
The values in Table 3 are plotted in Figs. 3 and 4, the results for 1 hr calcination time in Fig. 3, those for 4 hr in Fig. 4. The amounts of Fe, AI, and Mg are given and have been converted to micro-equivalents on the basis of the charge on the ions, assuming that all of the iron is in the ferric state.
OXIDIZING POWER OF THE SURFACE OF ATTAPULGITE CLAY 389
525
450
375
/~e 300
225
150
m
7 5 ~
0 - - I
o DO I I 1 I I I I I
200 300 400 500 600 700 800 900 I000 TEMPERATURE (~ I Fe o AI �9 Mg
FIGURE 3 . - -The amounts (in micro-equivalents) of iron, a luminum and magnes ium extracted per gram of clay as a function of the temperature of
calcination for samples calcined for 1 hr.
525
450
375
~.e ~00
225
150
75
q
0 - t
0 I00 I I t I t I I I
200 300 400 500 600 700 800 900 TEMPERATURE {~ �9 Fe o AI r Mg
FIGURE 4 . - -The amounts (in micro-equivalents) of iron, a luminum and magnes ium extracted per gram of clay as a function of the temperature of
calcination for samples calcinated for 4 hr.
Z 6
390 TWELFTH NATIONAL CONFERENCE ON CLAYS AND CLAY MINERALS
These figures show that the extractions of all of the octahedral-layer cations have maxima at calcination temperatures near those exhibited by the oxidizing power. The amount of iron extracted is nearly the same as the oxidizing power extracted but is somewhat higher for clay calcined at lower temperatures. This may indicate that some of the iron is in the ferrous state in the clay. Calcination in air would convert some of this to the ferric state, especially at higher temperatures. Par t of the difference between these values for iron and for oxidizing power is due to error in the analyses. The standard chemical procedures for estimation of total iron content of the extracts are not as accurate as the estimates of the extent of reaction of the extracts with the TiC1 s reagent for such small concentrations of iron. The data of Table 3 when plotted on the scale used in Fig. 1 show greater scattering and poorer resolution of the maxima than do the oxidizing-power values. Nevertheless, Table 3 and Figs. 3 and 4 show that the oxidizing power of the extracts can be accounted for by the amount of iron extracted. This is confirmed by the fact that the voltage of the cell in both the in situ and extract ti trations of oxidizing power corresponded to that expected if only ferric iron were acting as an oxid- izing agent.
The amounts of magnesium and aluminum extracted are somewhat greater than one would expect from the amount of iron extracted and the total composition of the clay. This mat ter will be discussed below.
The calcium appears to be nearly completely extracted from the whole body of the clay in 20 min. One gram of clay contains 15.8 mg of calcium on the volatile-free basis and, allowing for the presence of some water in the clay, this is very close to the amount obtained in the extracts of samples calcined in the range 100-700~ The amount decreases greatly at higher temperatures. No doubt, up to 700~ the calcium is present principally in exchangeable condition and in the form of readily soluble impurities such as calcite.
D I S C U S S I O N
One of the principal results of this s tudy is the finding that the chief, and perhaps the only, source of the oxidizing action of the surface of attapulgite clay is the ferric iron present a t that surface. This has been found in different ways. The voltage of the cell in which all of the titrations were carried out with the TiC1 s reagent always corresponded to the value expected if Fe+ s were the only oxidant being titrated. The agreement of the oxidizing-power values with the determinations of total iron content of the extracts may also be cited as evidence. The great stability of the oxidizing action indicates further that only a small part, if any, of the oxidizing action comes from electron-deficient sites on the surface such as can be caused by mechanical stresses and fractures due to calcination.
OXIDIZING POWER OF THE SURFACE OF ATTAPULGITE CLAY 391
Long standing and even immersion in liquid water for long periods did not affect the oxidizing powers of even the most active samples.
A second notable feature of the results is the way in which they may by correlated with chemical and structural phenomena known to occur in attapulgite crystals during calcination. This correlation explains changes in reactivity of the iron atoms and the other metallic atoms of the clay as due principally to changes in the attapulgite lattice.
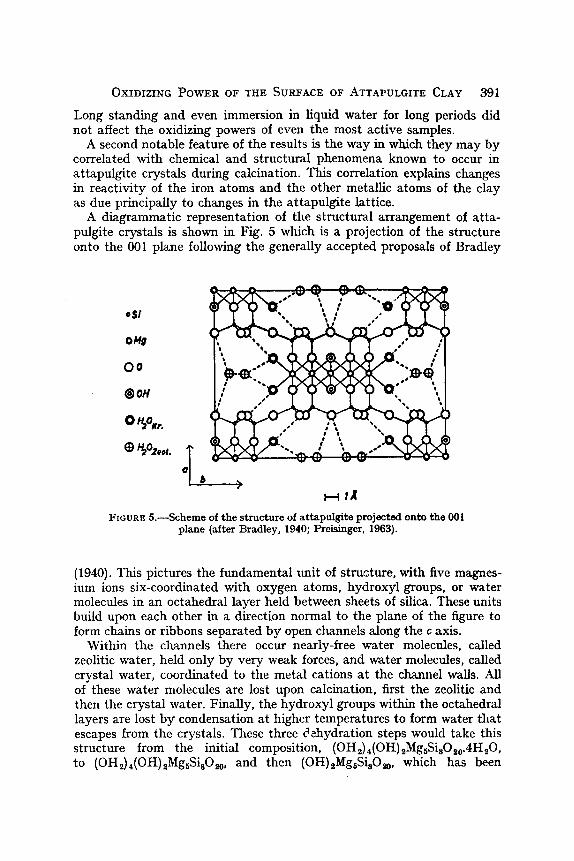
A diagrammatic representation of the structural arrangement of atta- pulgite crystals is shown in Fig. 5 which is a projection of the structure onto the 001 plane following the generally accepted proposals of Bradley
,Sl
oMe
OO
@OH
0 H2% "
�9 H~Ozoot" e~b >
FIGURE 5.--Scheme of t h e s t ruc ture of attapulgite projected onto the 001 plane (after Bradley, 1940; Preisinger, 1963).
(1940). This pictures the fundamental unit of structure, with five magnes- ium ions six-coordinated with oxygen atoms, hydroxyl groups, or water molecules ill an octahedral layer held between sheets of silica. These units build upon each other in a direction normal to the plane of the figure to form chains or ribbons separated by open channels along the c axis.
Within the channels there occur nearly-free water molecules, called zeolitic water, held only by very weak forces, and water molecules, called crystal water, coordinated to the metal cations at the channel walls. All of these water molecules are lost upon calcination, first the zeolitic and then the crystal water. Finally, the hydroxyl groups within the octahedral layers are lost by condensation at higher temperatures to form water that escapes from the crystals. These three dehydration steps would take this structure from the initial composition, (OH2)4(OH)~MgsSisO20.4H20, to (OH2)4(OH)~MgsSis02 o, and then (OH)tMgsSi802 o, which has been
392 TWELFTH NATIONAL CONFERENCE ON CLAYS AND CLAY MINERALS
called "attapulgite anhydride", and finally to MghSisO2x, the volatile- free unit. No one stage would be expected to be completed before the following one is underway, but the stages are rather distinct because of the difference in the strengths of the bonds tha t are broken.
Aluminum and iron ions occur in this attapulgite structure principally by substitution for magnesium ions in the octahedral layer, three mag- nesium ions being replaced by two aluminum or ferric iron ions upon such substitution.
The Si-O-Si bonds of the silica sheets appear to be weak at the corners of the channels where oppositely oriented tetrahedra are connected. This explains the ready cleavage parallel to 110 which accounts for the needle or lathshaped habit and small size of the crystals of attapulgite. Such cleavage would also populate the exterior surface selectively with those octahedral-layer cations which in Fig. 5 are shown at the channel walls and coordinated with water molecules. Taking the dimensions of the unit cell suggested by Bradley (1940), there should be one such metal cation per 80 (A)2 of exterior surface, the other cations lying at lower levels.
The exterior surface area of the 100~ clay used here was 131 m2/g. McCarter, Krieger and Heinemann (1950) have shown that the surface area of attapulgite decreases very little with calcination up to 700~ but that beyond that temperature the surface area falls off greatly, especially on prolonged calcination. Indeed, the surface area of the clay used here was still 116 m2/g at 700~ Using the observed surface area and com- position of the clay and assuming that the iron is all in the octahedral layer by substitution which takes place at random, caculation shows that there would be 1.5 mg of ferric iron at the exterior surface of 1 g of the clay. This amount of iron directly at the surface is of the same magnitude as the observed oxidizing power of the clay at its higher levels of activity. I t is obvious also that the observed changes in oxidizing power up to 750~ cannot be explained by the small changes in exterior surface area.
The dehydration processes described above may be used to explain the observed behavior of the oxidizing power. The loss of the zeolitic water is nearly complete at 100~ even within tile channels below the surface and in any case would be expected to have little effect on the reactivity of the iron or other octahedral-layer cations because of the weakness of the forces on those cations. On the other hand, loss of water coordinated to the cations should have considerable effect on the reactivity of those cations, which, furthermore, are also the cations at the exterior surface. I t would also be expected to produce a change in the structure of the crystals when the forces it creates have accumulated to a sufficient extent.
One might predict, therefore, tha t the second stage of dehydration would increase the reactivity of the ferric iron at the surface almost im- mediately and that also, but later in the stage, the structural change would occur and do away with those bonding forces and diminish the chemical reactivity. The reactivity as seen in part by the oxidizing power
OXIDIZING POWER OF THE SURFACE OF ATTAPULGITE CLAY 393
would thus be expected to rise, pass through a maximum, and then fall off as a result of tiffs dehydration.
The coordinated or crystal water is lost over a temperature range which is roughly the same as tha t in which the first sharp increase in oxidizing power occurs, i.e. 200-400~ Differential thermal analysis curves given by Grim and Rowland (1942), Grim (1953, p.199; 1962, p.93) and Kulbicki (1959) show an endotherm over this region and Grim (1953, p.243) in a review of the dehydrat ion of at tapulgite concludes tha t this endotherm is associated with the loss of those water molecules.
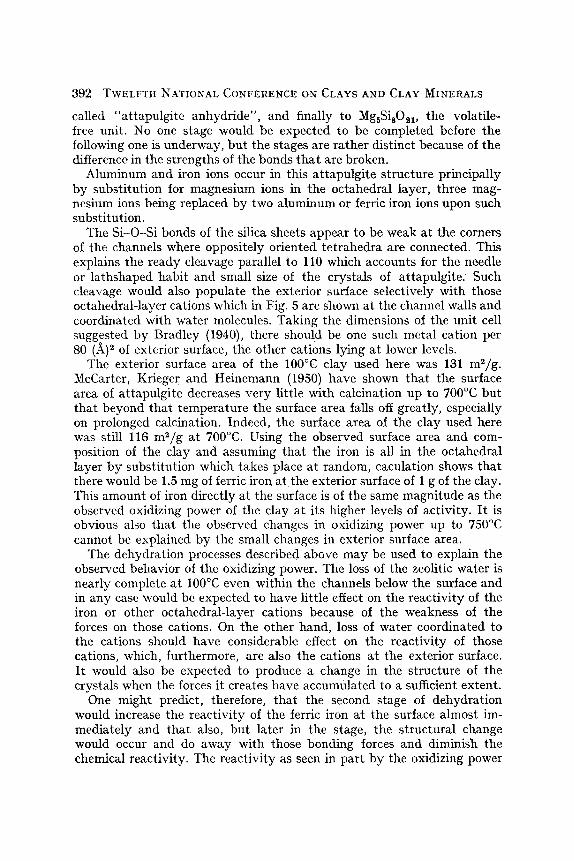
The structural effect tha t ensues upon the loss of crystal water to
osi oMg
Oo
�9 oH
a I b
FIGURE 6.--Scheme of the structure of dehydrated attapulgite projected on the 001 plane (after Preisinger, 1962), showing the t i l t ing of the ribbons.
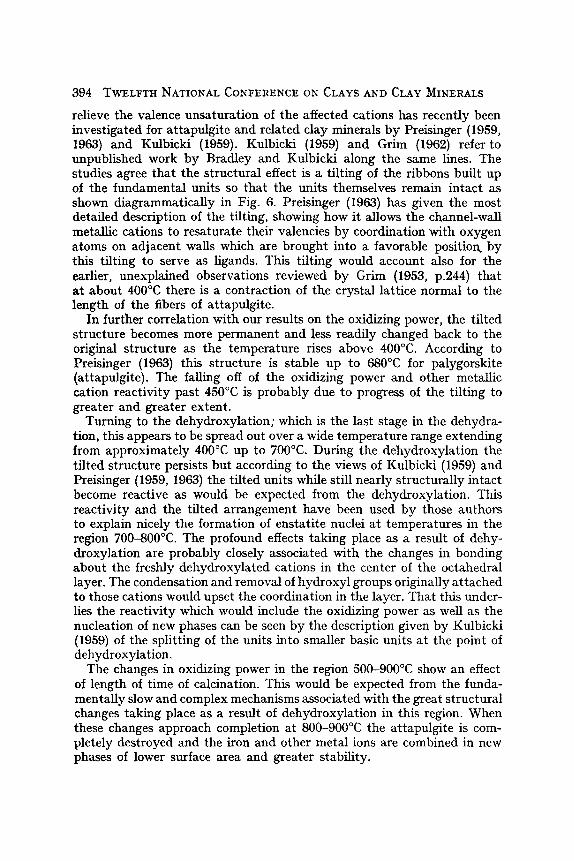
394 TWELFTH NATIONAL CONFERENCE ON CLAYS AND CLAY MINERALS
relieve the valence unsaturation of the affected cations has recently been investigated for attapulgite and related clay minerals by Preisinger (1959, 1963) and Kulbicki (1959). Kulbicki (1959) and Grim (1962) refer to unpublished work by Bradley and Kulbicki along the same lines. The studies agree that the structural effect is a tilting of the ribbons built up of the fundamental units so that the units themselves remain intact as shown diagrammatically in Fig. 6. Preisinger (1963) has given the most detailed description of the tilting, showing how it allows the channel-wall metallic cations to resaturate their valencies by coordination with oxygen atoms on adjacent walls which are brought into a favorable position, by this tilting to serve as ligands. This tilting would account also for the earlier, unexplained observations reviewed by Grim (1953, p.244) that at about 400~ there is a contraction of the crystal lattice normal to the length of the fibers of attapulgite.
In further correlation with our results on the oxidizing power, the tilted structure becomes more permanent and less readily changed back to the original structure as the temperature rises above 400~ According to Preisinger (1963) this structure is stable up to 680~ for palygorskite (attapulgite). The falling off of the oxidizing power and other metallic cation reactivity past 450~ is probably due to progress of the tilting to greater and greater extent.
Turning to the dehydroxylation; which is the last stage in the dehydra- tion, this appears to be spread out over a wide temperature range extending from approximately 400~ up to 700~ During the dehydroxylation the tilted structure persists but according to the views of Kulbicki (1959) and Preisinger (1959, 1963) the tilted units while still nearly structurally intact become reactive as would be expected from the dehydroxylation. This reactivity and the tilted arrangement have been used by those authors to explain nicely the formation of enstatite nuclei at temperatures in the region 700-800~ The profound effects taking place as a result of dehy- droxy]ation are probably closely associated with the changes in bonding about the freshly dehydroxylated cations in the center of the octahedral layer. The condensation and removal of hydroxyl groups originally attached to those cations would upset the coordination in the layer. That this under- lies the reactivity which would include the oxidizing power as well as the nucleation of new phases can be seen by the description given by Kulbicki (1959) of the splitting of the units into smaller basic units at the point of dehydroxylation.
The changes in oxidizing power in the region 500-900~ show an effect of length of time of calcination. This would be expected from the funda- mentally slow and complex mechanisms associated with the great structural changes taking place as a result of dehydroxylation in this region. When these changes approach completion at 800-900~ the attapulgite is com- pletely destroyed and the iron and other metal ions are combined in new phases of lower surface area and greater stability.
OXIDIZING POWER OF THE SURFACE OF ATTAPULGITE CLAY 395
I t appears probable that the position of the second maximum, which is met around 750~ is affected by the length of calcination time and other variables known to affect the occurrence of the new phases. Both Kulbicki (1959) and Preisinger (1963) have found evidence that the higher tempera- ture phase changes are affected by the amount of substitution of such ions as aluminum and iron for magnesium in the octahedral layer and by the location of the different cations within the layer. The different rates of extraction of the magnesium, aluminum and iron observed in the present s tudy may similarly be caused by the number and dispositions of those substitutions.
The excess of the in situ values over the extract values is probably due simply to reaction of the titanous ions directly with ferric ions still attached to the exterior surface. I t is hardly likely that the titanous ions are able to penetrate the channels within the attapulgite crystals, and this penetration would be expected to be diminished rather than increased in the samples calcined at higher temperatures.
The results given above suggest that the variation of the activity of ferric iron in different clay minerals and in other substances in the dye color tests discussed by Dodd (1955) is related to the variation in bonding of that iron in those materials.
REFERENCES
Bradley, W. F. (1940) The structural scheme of attapulgite: Amer. Min., v.25, pp.405-410.
Dodd, C. G. (1935) Dye adsorption as a method of identifying clays: in Clays and Clay Technology: Proceedings of the First National Conference on Clays and Clay Technology, California Division of Mines Bulletin 169, pp.105-111.
Grim, R. E. (1953) Clay Mineralogy: McGraw-Hill, New York, 384 pp. Grim, R. E. (1962) Applied Clay Mineralogy: McGraw-Hill, New York, 422 pp. Grim, R. E., and Rowland, R. A. (1942) Differential thermal analyses of clay minerals
and other hydrous materials: Amer. Min., v.27, pp.746-761,801-818. Haden, W. L., Jr. (1963) Attapulgite: properties and uses: in Clays and Clay Minerals,
lOth Conf., Pergamon Press, New York, pp.284-290. Kulbicki, G. (1959) High temperature phases in sepiolite, attapulgite and saponite:
Amer. Min., v.44, pp.752-764. McCarter, W. S. W., Krieger, K. A., and Heinemann, H. (1950) Thermal activation of
Attapulgus clay: Ind. Eng. Chem., v.42, pp.529-533. Preisinger, A. (1959) X-ray study of the structure of sepiolite: in Clays and Clay
Minerals, 6lh Conf., Pergamon Press, New York, pp.61--67. Preisinger, A. (1963) Sepiolite and related compounds: its stability and application: in
Clays and Clay Minerals, lOth Conf., Pergamon Press, New York, pp.363--371.