Embed Size (px)
Citation preview

STUDY COMPLETION REPORT SITE-SPECIFIC SEISMIC HAZARD STUDY (16.6)
Susitna-Watana Hydroelectric Project Alaska Energy Authority FERC Project No. 14241 October 2015
ATTACHMENT 4: WATANA SEISMIC NETWORK STATION VS30 MEASUREMENTS

Technical Memorandum 14-12-TM
v0.0
Susitna-Watana Hydroelectric Project Seismic Monitoring Stations Vs30 Measurements
AEA11-022
Prepared for: Prepared by: Alaska Energy Authority Fugro Consultants, Inc. for MWH 813 West Northern Lights Blvd. 1777 Botelho Drive, Suite 262 Anchorage, AK 99503 Walnut Creek, CA 94596
March 20, 2014
16-1412-TM-032014

THIS PAGE INTENTIONALLY LEFT BLANK


THIS PAGE INTENTIONALLY LEFT BLANK
ALASKA ENERGY AUTHORITY AEA11-022 16-1412-TM-032014 TABLE OF CONTENTS
1.0 INTRODUCTION ........................................................................................................................ 1
1.1 Methodology IMASW ................................................................................................................ 1
1.2 Seismic Survey Objectives ......................................................................................................... 2
1.3 Seismic Survey Locations .......................................................................................................... 2
1.4 Field Methodology ..................................................................................................................... 3
2.0 IMASW INVERSION .................................................................................................................. 4
2.1 IMASW Inversion Results ......................................................................................................... 5
2.1.1 IMASW WAT-1 ..................................................................................................................... 5
2.1.2 IMASW WAT-2 ..................................................................................................................... 6
2.1.3 IMASW WAT-3 ..................................................................................................................... 7
2.1.4 IMASW WAT-4 ..................................................................................................................... 7
2.1.5 IMASW WAT-5 ..................................................................................................................... 7
2.1.6 IMASW WAT-6 ..................................................................................................................... 8
2.1.7 IMASW WAT-7 ..................................................................................................................... 8
3.0 SUMMARY AND CONCLUSIONS ........................................................................................... 9
4.0 REFERENCES ........................................................................................................................... 10
Page i 03/20/14

ALASKA ENERGY AUTHORITY AEA11-022 16-1412-TM-032014 List of Tables
Table 1. Seimic Monitoring Station Details
Table 2. Summary of Geology
Table 3. Summary of Vs30 Calculations
List of Figures Figure 1. Seismic Survey Line Locations
Figure 2. IMASW Survey Locations, WAT-1 Site
Figure 3. IMASW Bi-directional Slowness-Frequency Rayleigh-Wave Dispersion Curve Stack with Picks for Final Inversion, WAT-1 (N-S Line)
Figure 4. IMASW Bi-directional Slowness-Frequency Rayleigh-Wave Dispersion Curve Stack with Picks for Final Inversion, WAT-1 (E-W Line)
Figure 5. IMASW S-Wave Velocity Models WAT-1, N-S Line (top) and E-W Line (bottom)
Figure 6. IMASW Survey Locations, WAT-2 Site
Figure 7. IMASW Bi-directional Slowness-Frequency Rayleigh-Wave Dispersion Curve Stack with Picks for Final Inversion, WAT-2 (N-S Line)
Figure 8. IMASW Bi-directional Slowness-Frequency Rayleigh-Wave Dispersion Curve Stack with Picks for Final Inversion, WAT-2 (E-W Line)
Figure 9. IMASW S-Wave Velocity Models WAT-2, N-S Line (top) and E-W Line (bottom)
Figure 10. IMASW Survey Locations, WAT-3 Site
Figure 11. IMASW Bi-directional Slowness-Frequency Rayleigh-Wave Dispersion Curve Stack with Picks for Final Inversion, WAT-3 (N-S Line)
Figure 12. IMASW Bi-directional Slowness-Frequency Rayleigh-Wave Dispersion Curve Stack with Picks for Final Inversion, WAT-3 (E-W Line)
Figure 13. IMASW S-Wave Velocity Models WAT-3, N-S Line (top) and E-W Line (bottom)
Figure 14. IMASW Survey Locations, WAT-4 Site
Figure 15. IMASW Bi-directional Slowness-Frequency Rayleigh-Wave Dispersion Curve Stack with Picks for Final Inversion, WAT-4 (N-S Line)
Page ii 03/20/14

ALASKA ENERGY AUTHORITY AEA11-022 16-1412-TM-032014 Figure 16. IMASW Bi-directional Slowness-Frequency Rayleigh-Wave Dispersion Curve Stack with Picks for Final Inversion, WAT-4 (E-W Line)
Figure 17. IMASW S-Wave Velocity Models WAT-4, N-S Line (top) and E-W Line (bottom)
Figure 18. IMASW Survey Locations, WAT-5 Site
Figure 19. IMASW Bi-directional Slowness-Frequency Rayleigh-Wave Dispersion Curve Stack with Picks for Final Inversion, WAT-5 (N-S Line)
Figure 20. IMASW Bi-directional Slowness-Frequency Rayleigh-Wave Dispersion Curve Stack with Picks for Final Inversion, WAT-5 (E-W Line)
Figure 21. IMASW S-Wave Velocity Models WAT-5, N-S Line (top) and E-W Line (bottom)
Figure 22. IMASW Survey Locations, WAT-6 Site
Figure 23. IMASW Bi-directional Slowness-Frequency Rayleigh-Wave Dispersion Curve Stack with Picks for Final Inversion, WAT-6 (N-S Line)
Figure 24. IMASW Bi-directional Slowness-Frequency Rayleigh-Wave Dispersion Curve Stack with Picks for Final Inversion, WAT-6 (E-W Line)
Figure 25. IMASW S-Wave Velocity Models WAT-6, N-S Line (top) and E-W Line (bottom)
Figure 26. IMASW Survey Locations, WAT-7 Site
Figure 27. IMASW Bi-directional Slowness-Frequency Rayleigh-Wave Dispersion Curve Stack with Picks for Final Inversion, WAT-7 (N-S Line)
Figure 28. IMASW Bi-directional Slowness-Frequency Rayleigh-Wave Dispersion Curve Stack with Picks for Final Inversion, WAT-7 (E-W Line)
Figure 29. IMASW S-Wave Velocity Models WAT-7, N-S Line (top) and E-W Line (bottom)
List of Appendices
Appendix A: Vs30 Survey Site Photographs
Page iii 03/20/14

ALASKA ENERGY AUTHORITY AEA11-022 16-1412-TM-032014 Explanation of Abbreviations
A2LA American Association of Laboratory Accreditation AEC Alaska Earthquake Center CGF Correlation Green’s Function FCL Fugro Consultants, Inc. GPS Global positioning system Hz Hertz (cycles/second) IMASW Interferometric Multichannel Analysis of Surface Waves ISO International Organization for Standardization MASW Multichannel Analysis of Surface Waves MWH MWH Americas, Inc. NGA Next Generation Attenuation PSHA Probabilistic Seismic Hazard Analysis ReMi Refraction Microtremor S-Wave Shear Wave Vs Shear Wave Velocity Vs30 30 Meter Depth Averaged Shear Wave Velocity USGS United States Geological Survey
Explanation of Units
Measurements in this report were made using the International System of Units (SI), and converted to English system for reference. For the conversions, the measurements reported in the English system were rounded off for simplification purposes. Both sets of numbers are presented for the reader.
Page iv 03/20/14

ALASKA ENERGY AUTHORITY AEA11-022 16-1412-TM-032014
1.0 INTRODUCTION
This appendix presents results of the Fugro Consultants, Inc. (FCL) surface geophysical investigation, Interferometric Multichannel Analysis of Surface Waves (IMASW) for the Susitna-Watana project. Seismic surface wave data were acquired by an FCL team at seven survey locations between July 10 and 15, 2013. Seismic survey lines were positioned to estimate shear wave velocities (Vs) at seven existing and proposed seismic recording stations operated for the Susitna Dam project by the Alaska Earthquake Center (AEC) and shown on Figure 1. Collection of shear wave velocity information at each of the stations is intended to facilitate future analyses and comparisons of local and regional earthquake recordings for use in evaluating seismic hazards to the project. These data are also used to assist in prioritizing which of the seismic recording stations would be most appropriate for installation of strong motion recorders and to provide preliminary characterization of site velocity parameters for the Probabilistic Seismic Hazard Analyses (PSHA).
1.1 Methodology IMASW
Multichannel analysis of surface waves (MASW) (Park et al., 1999) and refraction microtremor (ReMi) (Louie, 2001) are standard practice non-invasive methods for measuring shallow Vs. They use linear arrays of vertically-oriented geophones positioned along the ground surface, where the maximum depth of resolved Vs is generally a function of array length and resonant sensor frequency (although source energy in MASW and background noise levels in ReMi are important factors). MASW requires active-source generation of surface waves from impulsive or swept vibratory signals (e.g., sledgehammer or Vibroseis). ReMi records passive ambient noise and/or microtremors without an active seismic source. This investigation uses a supplementary data acquisition and interferometric processing approach called Interferometric MASW (IMASW) that exploits the strengths of combined active source (MASW) and/or ambient noise records (ReMi) to improve the resolution of Vs-depth and increase the maximum depth of significant Vs resolution by maximizing low-frequency Rayleigh-wave dispersion constraints (O’Connell and Turner, 2011). Using surface methods (e.g. IMASW), the maximum depth of resolvable Vs is limited by a decrease in phase slowness-frequency resolution as frequency decreases (Forbriger, 2003a; Socco and Strobbia, 2004). Advancements in data acquisition and processing approaches are important to adequately resolve Vs calculated average to ~100 ft (30 m) (Vs30) and to increase depth of meaningful Vs resolution to 328 ft (100 m) or more while continuing to use standard geophone spreads, in this case ~300 ft (92 m). The IMASW approach improves resolution of low frequency Rayleigh-wave phase slownesses, relative to MASW and ReMi, by obtaining deterministic Correlation Green’s function (CGF) seismograms from passive and active source records using seismic interferometric methods described by Curtis and others (2006), Wapenaar and Snieder (2007), Halliday and others (2007; 2008), O’Connell (2007), Wapenaar and others (2008), and Snieder and others (2009). These CGF seismic record sections are ideal for time-domain Rayleigh-wave group and phase slowness
Page 1 03/20/14

ALASKA ENERGY AUTHORITY AEA11-022 16-1412-TM-032014 processing approaches that complement and augment the frequency-domain approaches of Miller and others (1999) and Louie (2001) used in MASW and ReMi analyses. CGF seismograms also allow waveform inversion for velocity structure, therefore avoiding problems related to modal identification and phase slowness estimation (Forbriger, 2003b; O’Neill et al., 2003; O’Neill and Matsuoka, 2005).
1.2 Seismic Survey Objectives
The primary objectives of the seismic surveys for Susitna project are to estimate S-wave velocity at each individual recording station and to estimate ~100-ft (30 m) depth-averaged shear-wave velocities (Vs30). This investigation focuses on the primary depth range of interest for S-wave velocity profile, the upper ~100 ft (30 meters). Sufficient data were obtained for the seven IMASW locations to estimate shear-wave velocities to a depth of ~100 ft (30 m). These IMASW results often provide well-constrained shear-wave velocities significantly deeper than ~100 ft (30 m). Vs30 is required to estimate site-specific ground motion parameters. Two IMASW profiles were acquired per seismic station WAT-2 through WAT-7, and three profiles were acquired at WAT-1 (Figure 1). The third line of data collected at WAT-1 was collected to replace the east-west profile that was found during preliminary processing to have poor data quality, and ultimately, with final processing, found to be unusable data. Further discussion about each location’s data plots is included in Section 2. The primary goal of IMASW profiling is to determine line averages of vertical shear-wave velocity variations. The slowest observable high-frequency fundamental mode phase and group velocities are used to constrain near-surface velocity structure to ensure that the estimated velocity structure represents the lowest velocity near-surface regions of the profile in order to avoid overestimating Vs30.
1.3 Seismic Survey Locations
Seismic survey locations were accessed by helicopter navigation to station GPS locations provided by MWH (Table 1). The survey areas where either existing or proposed seismic monitoring stations. At each location a 24-channel ~300 ft (92-m) survey line was deployed by measuring tape and the line location was referenced to existing monitoring stations (if present). Additionally, handheld GPS locations were also taken at the ends and mid points of each seismic line and used to plot line location on site drawings/topography maps. Survey lines were located by centering on existing stations (if present) when possible, or by GPS locations of proposed stations. At each survey location, outcrops along the lines were examined to determine the local bedrock lithology. Table 2 summarizes these observations and lists geologic map units shown by Wilson et al. (2009) and (1998), and Acres (1982) for each site.
Page 2 03/20/14

ALASKA ENERGY AUTHORITY AEA11-022 16-1412-TM-032014 The individual survey lines were roughly conducted perpendicular to each other, but were adjusted to optimize survey layout based on the site terrain. Lines were positioned as much as possible to avoid large variations in topography and widely variable sub-surface conditions, such as: having half the line on a rock outcrop and the other half on a thick soil layer. For most of the survey locations, WAT-2 through WAT-7, this primarily meant adjusting the crossing point of the lines such that one direction was not oriented along or “wrapping over” a steep slope break. Many of the existing seismic stations were located near the high points of the topography and thus often near steeply sloping topography. At WAT-1, the existing seismic station is located on an isolated rock outcrop that generally trends east-west. The vegetation and topography suggest thicker soil surrounding this location, which is different from the other survey areas that are at somewhat higher elevations and more influenced by peri-glacial type processes. So, the north-south and east-west lines were measured slightly northward of the outcrop, and within the relatively thicker soil area where the entire 92-m line was on consistent substrate. However, the original east-west line data was most likely negatively affected by this potentially steeply dipping soil/rock contact and the data needed to be reacquired. The second east-west line was confined to the outcrop near the seismic station, and the line shortened to minimize the variability in terrain; this line was referenced as WAT-1 line 3. Figure 2 shows the locations of the lines performed near WAT-1. The longer east-west line did not obtain usable data but is shown to demonstrate an area of suspected thicker soil cover over rock. The area to the south of the monitoring station was not accessible due to land permitting issues at the time of the survey.
1.4 Field Methodology
Seismic data acquisition equipment comprised a DAQLink II 24-bit Acquisition System unit, twenty-four 4.5 Hz vertical-component geophones, a ~300 ft (92 m) seismic cable with ~13 ft (4 m) spacing and a Dell laptop computer with VScope software. The seismic data acquisition equipment was calibration-tested and verified to operate properly at the Applied Technical Services, an ISO 17025 (A2LA) accredited calibration testing facility in Marietta, Georgia on May 6th, 2013. The primary active seismic noise source was a 12-pound dead-blow sledgehammer manually delivered.
Data acquisition started with geophone testing to ensure adequate coupling of the geophones to the ground and proper connection of the geophones to the data cable. Active noise sources were recorded at various distances off both ends of the seismic line. Data was recorded as 4-second records at 2-millisecond sampling. This approach concurrently and opportunistically records existing background and active source noise simultaneously. Slowness-frequency images were calculated after data acquisition and viewed concurrent with data recording on the field laptop to visually assess the bandwidth range and slowness-frequency resolution of Rayleigh wave dispersion data in real-time.
Page 3 03/20/14

ALASKA ENERGY AUTHORITY AEA11-022 16-1412-TM-032014
2.0 IMASW INVERSION
The IMASW slowness inversion approach is designed to achieve several objectives. It provides quick estimation of velocity models during field data acquisition to ensure that consistent fundamental-mode data records are obtained; difficulties obtaining relatively simple velocity models consistent with phase p-f picks often reveals strong interference from undesirable higher modes or side-swipe noise during acquisition. In such cases, a quick slowness inversion identifies when reconfiguration of the seismic source or geophone array may improve excitation of fundamental-mode energy or eliminate unwanted side-swipe noise.
A second objective is more robust estimation of slowness-depth than is provided by a single maximum-likelihood model. Maximum-likelihood methods can fail by over-fitting parts of the data perfectly; solutions may have enormous posterior probability density, but only over a very small volume of parameter space, so the probability mass associated with these likelihood spikes can be very small (MacKay, 2003). This pathology of likelihood is evident when inverting dispersion data for slowness as a function of depth, particularly when low-velocity zones are permitted. Yet, low-velocity zones can occur, so it is important to determine when low-velocity zones are required and find an effective method to estimate accurate slowness models that include low-velocity zones. An effective approach for probabilistic slowness-depth estimation is to couple Monte Carlo inversion with a modified likelihood function that penalizes low-velocity zones. Thus, IMASW uses a fully nonlinear Monte Carlo inversion approach to provide a clear quantitative signal showing the maximum depth of resolvable slowness; linearized estimates of slowness covariance do not achieve this objective.
One challenge encountered in Monte Carlo sampling is that large-dimensional spaces tend to be largely empty because most of the space consists of near-zero likelihood (Tarantola, 2005). IMASW uses a linearized inversion that starts with a simple starting model consistent with the high-frequency (shallow) phase slowness to produce a productive starting model for Monte Carlo inversion. The linearized inversion method is slightly different than Levenburg-Marquardt damped least squares, and uses a damping approach that extracts detailed slowness-model information while limiting the scale of proposed model perturbations. While this approach is inappropriate for final slowness-depth or uncertainty estimates, it does provide robust starting model parameters for further Monte Carlo inversion. A hybrid multi-state leapfrog sampling approach is used to speed up the Monte Carlo inversion, using ideas presented in MacKay (2003), and sampling at what is analogous to six simulated annealing constant “temperatures” to ensure appropriate sampling of the posterior. Inversion implementation details and relationships to simulated annealing are presented in O’Connell and Turner (2011).
Page 4 03/20/14

ALASKA ENERGY AUTHORITY AEA11-022 16-1412-TM-032014 The most prominent effect of laterally discontinuous soil with variable thickness is a tendency for highly variable excitation of fundamental and higher modes. Only group velocity constraints that are consistent in both propagation directions and correspond to fundamental mode are used in the velocity inversions. Sometimes, group velocities are not consistent for both propagation directions with the frequency bandwidth of the fundamental mode. At frequencies greater than 50 Hz, the airwave is prominent and nearly non-dispersive. Consequently, the airwave group velocity is nearly equal to the airwave phase velocity. Unfortunately, the airwave group velocity is usually comparable to the group velocities associated with the shallowest soil. Since it is not possible to definitively separate the airwave group arrival from the shallow soil group arrival, no group velocity constraints are used for frequencies greather than 50 Hz. In cases where group velocity constraints are not available for frequencies less than 50 Hz, only phase slowness data are used in the velocity inversions. When group velocity constraints are absent or only available over a small frequency bandwidth, velocity inversions are performed with strong low-velocity-zone penalty functions to obtain the smoothest velocity models consistent with the available dispersion data.
2.1 IMASW Inversion Results
Three pages of data plots are presented as figures for each of the seven IMASW survey locations, which are discussed hereafter in Sections 2.1.1 through 2.1.7. Also, a survey line location figure is included with each survey location’s data figures. For each IMASW survey location the figures present data arranged in the following manner:
1. Survey lines and seismometer locations overlain on shaded relief topographic map with geology.
2. Bidirectional stack slowness-frequency Rayleigh wave final inversion.
3. S-wave Velocity Model, North-South (N-S) line (upper plot); and S-wave Velocity Model, East-West (E-W) line (lower plot).
In general, only S-wave velocities are well resolved. P-wave velocities from IMASW are included in the inversions to avoid introducing biases in estimated S-wave velocity, but P-wave velocities are generally only weakly resolved. P-wave velocities would be better obtained by refraction seismic method if desired.
2.1.1 IMASW WAT-1
As described previously, WAT-1 was observed to have surface characteristics and subsurface rock variations that differ from the other six survey locations. This includes thicker than expected soils and a non-horizontal top of rock surface that was believed to have contributed to the need for recollecting the
Page 5 03/20/14

ALASKA ENERGY AUTHORITY AEA11-022 16-1412-TM-032014 east-west line. The re-collected east-west line labeled “Line 3” was collected by varying the acquisition parameters for a shorter line and relocating it immediately adjacent to the existing seismic station (Figure 2). Other general observations related to the velocity difference calculated at WAT-1 versus the other six locations are:
• The rock observed at the local outcrop was more weathered than the other locations surveyed. Predominately the other stations were mainly frost fractured rock exposed at the surface with some mossy vegetation but little presence of soil or regolith cover.
• The amount and size of the vegetation near the rock outcrop suggest a thicker soil layer and possible dipping bedrock in the subsurface.
• The difficulty with the data collected over the original east-west line location may also be an indicator of the seismic source energy side-swiping our line as it was reflected from a parallel steeply dipping rock surface. The thicker soil layer and possible complex energy path is most likely the poor slowness plots for the original east-west data line.
Although, WAT-1 exhibits the greatest variation in velocities between the north-south and east-west lines, this was expected due to the presumed difference in data collected over soil/rock (N-S) and just rock (E-W). In general, the velocities and calculated Vs30 are still relatively high. Excellent phase-velocity constraints were obtained in the 22-35 Hz frequency band on both the lines collected at WAT-1 (Figures 3 and 4). When evaluating the S-wave velocity models, the N-S line model (Figure 5, top panel) represents what is generally expected with a soil/rock profile. From depths of approximately 0 to ~20 ft (0 to 6 m) the velocities are strongly constrained. Shear-wave velocities that are within acceptable uncertainties were modeled to ~200 ft (62 m) depth, see Figure 5. Shear-wave velocities were modeled as a higher velocity layer at a depth between about ~82 and ~100 ft (25 and 30 m). The bottom panel on Figure 5 is the velocity model for Line 3 or the E-W line at WAT-1. This line exhibits similar strong velocity constraints from approximately 0 to ~32 ft (0 to 10 m) depth. At depths beyond ~32 ft (10 m), the velocity constraints are moderate to poor; however the velocities at the lower bounds exhibit reasonable constraints to below ~100 ft (30 m).
2.1.2 IMASW WAT-2
WAT-2, as with many of the remaining survey locations, this location is positioned near the crest of a hill. The N-S seismic line was positioned parallel to the ridge and the E-W line is perpendicular to the ridge and trending down slope away from the seismic station location. As much as possible the seismic lines were positioned to avoid large changes in relative elevation but often were on conducted on generally sloping terrain. See Figure 6 for seismic line layouts and site topography at WAT-2. Figures 7 and 8 are the frequency slowness plots used during the data processing. Due to these lines being conducted basically on the rock surface with very little lower velocity material present, the phase-
Page 6 03/20/14

ALASKA ENERGY AUTHORITY AEA11-022 16-1412-TM-032014 velocity constraints were obtained in what is typically considered the high frequency band; S-N line was picked between approximately 110-130 Hz, and the E-W line was picked between approximately 65-110 Hz. The S-Wave models presented on Figure9 , show similar Vs values which produces similar calculated Vs30 values, but the E-W model represents better constrained velocities to a depth of approximately ~130 ft (40 m). Again, the conservative lower bound velocities for both lines are still well above the velocities typically desired for seismic monitoring stations.
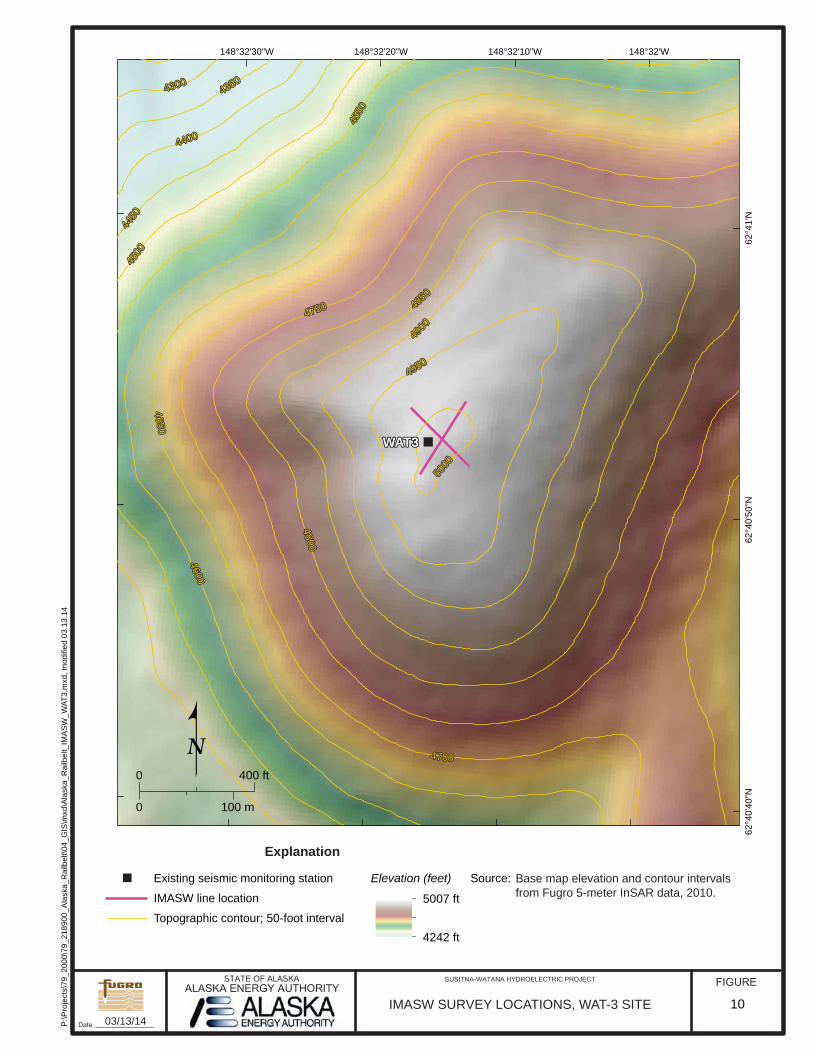
2.1.3 IMASW WAT-3
Figure 10 is a plot of the seismic lines collected near WAT-3. For consistency of nomenclature, lines are referenced N-S and E-W, where N-S labeled line represents the southwest to northeast trending line and the E-W labeled line represents the northwest to southeast trending line, see Figure 10. Excellent phase-velocity constraints were obtained in the 50 to over 100 Hz frequency band on both of the lines, see Figures 11 and 12. Generally to help increase the depth model the lower bounds of the frequency band are picked, when possible. S-Wave models and velocity plots presented on Figure 13 both produce similar calculated Vs30 values; however the E-W line model presents the highest Vs30 value calculated across the seven WAT sites. Neither the N-S or E-W lines have strongly constrained velocities; however the lower bound velocities represent a reasonable conservative model.
2.1.4 IMASW WAT-4
WAT-4 was one of the most level survey locations, with a slight topographic drop west of the seismic station. The N-S line was conducted parallel to a slight ridge, with thin vegetation to exposed rock. The E-W line was positoned perpendicular to the same ridge and extended eastward away from the existing seismic station. The vegetation mat increased in thickness also to the east. Line orientations are shown on Figure 14. Well constrained phase-velocities for the N-S seismic line were obtained within the 20 to 60 Hz band and picked between 20-30 Hz for modeling, see Figure 15. Similarly, well constrained phase-velocities for the E-W seismic line were obtained within the 30 to 65 Hz band and picked between 30-50 Hz for modeling, see Figure 16. The S-Wave velocity models presented on Figure 17 are the N-S model (upper plot) and the E-W model (lower plot), these models have similar lower bound velocities in the ~16 ft to ~100 ft (5 to 30 m) depth range. The N-S model demonstrates moderate velocity constraints within the ~16 ft to ~ 82 ft (5 - 25 m) depth range.
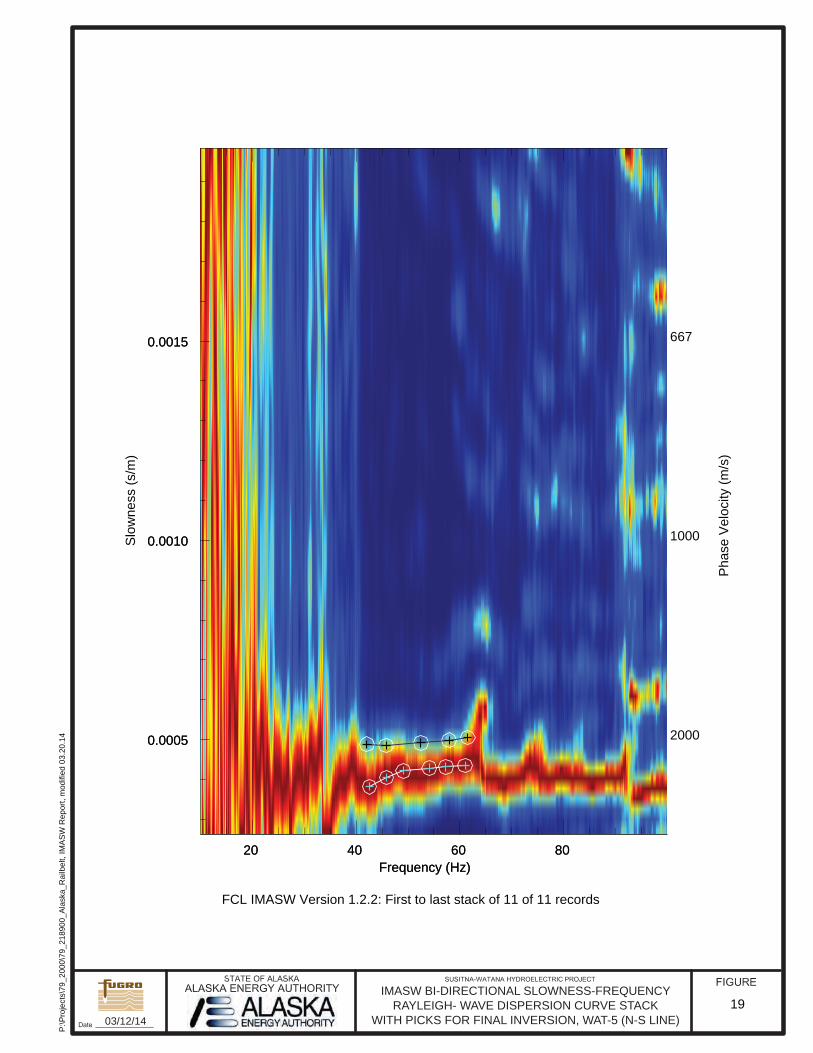
2.1.5 IMASW WAT-5
WAT-5 was a proposed seismic station and did not have an existing monitor at the time of our surveys. However, while navigating to this location using helicopter navigations, a monitoring station (possibly for weather) was located on an adjacent ridge and was mistakenly identified as our survey location, see Figure 18. This location error was not realized till after plotting the GPS line locations upon our return. Although the location surveyed is at a slightly lower elevation the geologic unit remains the same and
Page 7 03/20/14

ALASKA ENERGY AUTHORITY AEA11-022 16-1412-TM-032014 the velocity models should be representative for the actual WAT-5 location. The N-S labeled line was oriented southwest to northeast to minimize the effects of the topographic relief of this area. The E-W labeled survey line was oriented parallel to the ridge at a slight northeast to southwest trending line, see Figure 18. Good phase-velocity constraints were obtained in the 40 - 60 Hz frequency band on the N-S line (Figure 19) and within the 20 - 40 Hz band on the E-W line (Figure 20). Generally to help increase the depth model the lower bounds of the frequency band were picked, when possible. S-Wave models and velocity plots presented on Figure 21 both produce similar calculated Vs30 values. Neither the N-S or E-W lines have strongly constrained velocities; however both the N-S and E-W line models present moderately constrained velocities at a depth range of approximately ~10 ft to 26 ft (3 to 8 m). Also, both lines exhibit an increased velocity layer centered around ~82 ft (25 m) depth then continue on a general increase in velocity with depth with good correlation till a depth of approximately ~100 ft and ~130 ft (30 and 40 m).
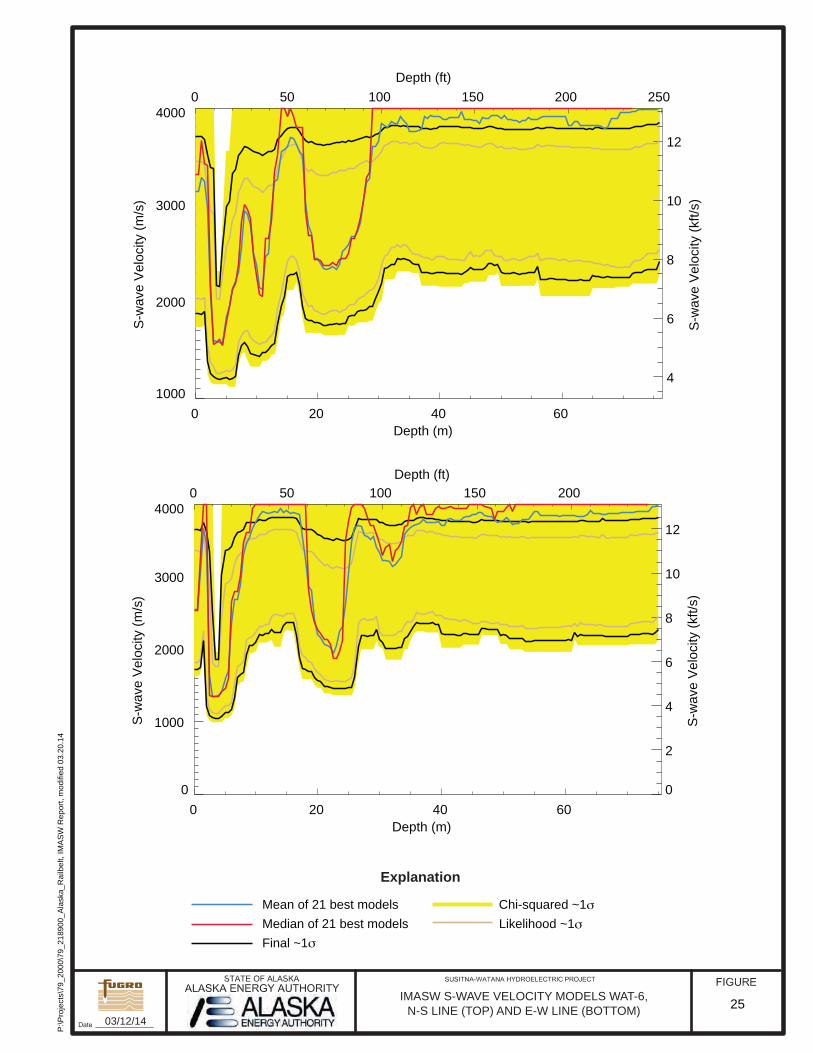
2.1.6 IMASW WAT-6
Figure 22 is a plot of the seismic lines collected near proposed station, WAT-6. For consistency of nomenclature, lines are referenced N-S and E-W, where N-S label represents the line trending nearly north-south with a slight counter clockwise rotation and the E-W labeled line represents the northwest to southeast trending line, see Figure22. Good to moderate phase-velocity constraints were obtained in the 40 to 60 Hz frequency band on both the lines collected at WAT-6, see Figures 23 and 24. The S-Wave velocity models presented on Figure25 are the N-S model (upper plot) and the E-W model (lower plot), that both have similar lower bound velocities in the ~16 ft to ~100 ft (5 to 30 m) depth range. Neither the N-S or E-W lines have strongly constrained velocities; however the lower bound velocities represent a reasonable conservative model
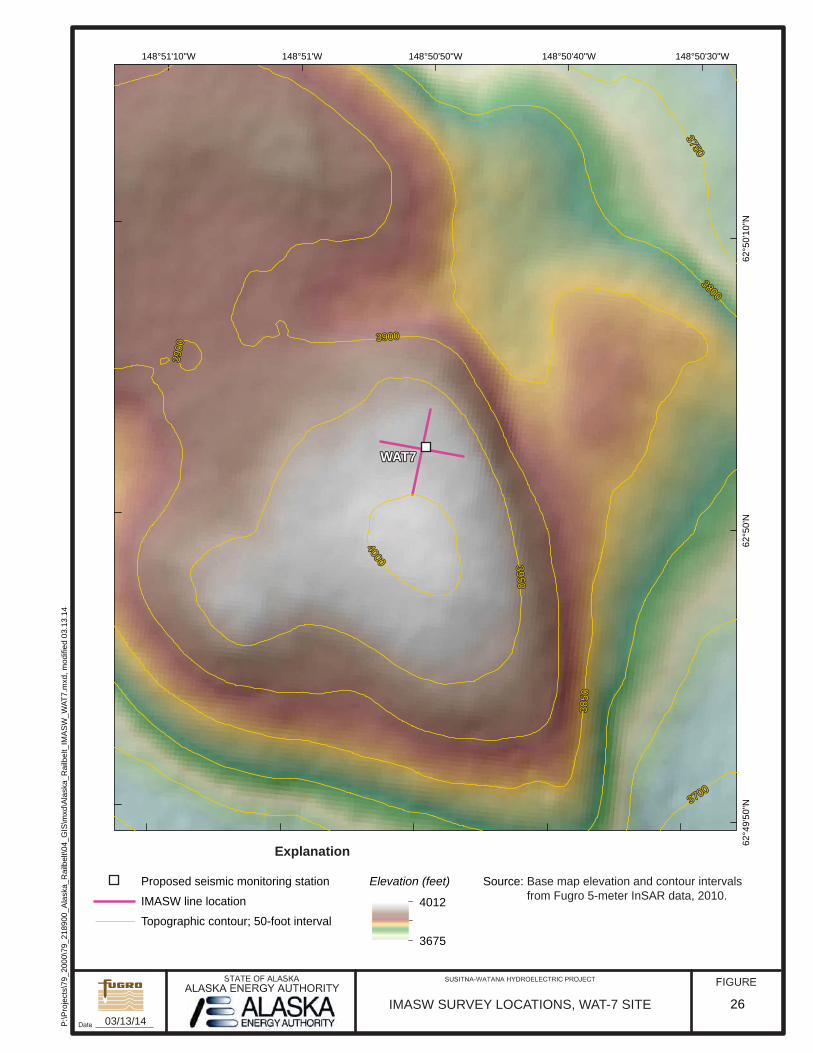
2.1.7 IMASW WAT-7
WAT-7 is another proposed seismic station positioned near the crest of a hill so the N-S seismic line was positioned down slope along a slight ridge and the E-W line is perpendicular to the slope and centered on the proposed monitoring location. As possible the seismic lines were positioned to avoid large changes in relative elevation but were often conducted on generally sloping terrain. See Figure 26 for seismic line layouts and site topography. Good phase-velocity constraints were obtained in the 25 to 40 Hz frequency band on both the lines collected at WAT-7, see Figures 27 and 28. S-Wave models and velocity plots presented on Figure 29 both produce similar calculated Vs30 values; however neither model has strongly constrained velocities. However, the lower bound velocities represent appear reasonable to a depth of approximately ~130 ft (40 m) and exhibit a general increase of velocity with depth as expected.
Page 8 03/20/14
ALASKA ENERGY AUTHORITY AEA11-022 16-1412-TM-032014
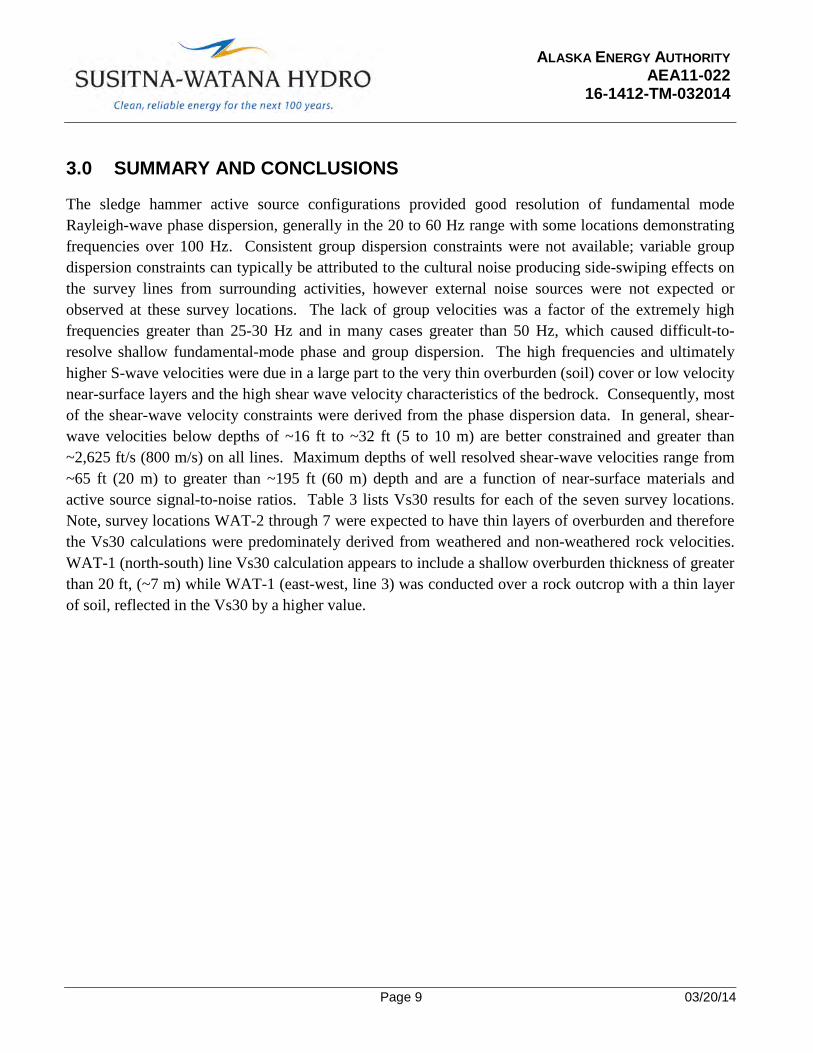
3.0 SUMMARY AND CONCLUSIONS
The sledge hammer active source configurations provided good resolution of fundamental mode Rayleigh-wave phase dispersion, generally in the 20 to 60 Hz range with some locations demonstrating frequencies over 100 Hz. Consistent group dispersion constraints were not available; variable group dispersion constraints can typically be attributed to the cultural noise producing side-swiping effects on the survey lines from surrounding activities, however external noise sources were not expected or observed at these survey locations. The lack of group velocities was a factor of the extremely high frequencies greater than 25-30 Hz and in many cases greater than 50 Hz, which caused difficult-to-resolve shallow fundamental-mode phase and group dispersion. The high frequencies and ultimately higher S-wave velocities were due in a large part to the very thin overburden (soil) cover or low velocity near-surface layers and the high shear wave velocity characteristics of the bedrock. Consequently, most of the shear-wave velocity constraints were derived from the phase dispersion data. In general, shear-wave velocities below depths of ~16 ft to ~32 ft (5 to 10 m) are better constrained and greater than ~2,625 ft/s (800 m/s) on all lines. Maximum depths of well resolved shear-wave velocities range from ~65 ft (20 m) to greater than ~195 ft (60 m) depth and are a function of near-surface materials and active source signal-to-noise ratios. Table 3 lists Vs30 results for each of the seven survey locations. Note, survey locations WAT-2 through 7 were expected to have thin layers of overburden and therefore the Vs30 calculations were predominately derived from weathered and non-weathered rock velocities. WAT-1 (north-south) line Vs30 calculation appears to include a shallow overburden thickness of greater than 20 ft, (~7 m) while WAT-1 (east-west, line 3) was conducted over a rock outcrop with a thin layer of soil, reflected in the Vs30 by a higher value.
Page 9 03/20/14

ALASKA ENERGY AUTHORITY AEA11-022 16-1412-TM-032014
4.0 REFERENCES
Abrahamson, N., G. Atkinson, D. Boore, Y. Bozorgnia, K. Campbell, B. Chiou, I. Idriss, W. Silva, and R. Youngs (2008). Comparisons of the NGA ground-motion relations, Earthquake Spectra 24, 45-66.
Acres, (1982), Susitna Hydroelectric Project, 1982 Supplement to the 1980-1981 Geotechnical Report, Volume 2, unpublished consultant’s report prepared by Acres for Alaska Power Authority, dated December 1982, 236 p. and 250 pp of Appendices.
Curtis, A., P. Gerstoft, H. Sato, R . Snieder, K. Wapenaar (2006). Seismic interferometry—turning noise into signal, The Leading Edge, 25, 1082–1092.
Forbriger, T. (2003a). Inversion of shallow-seismic wavefields: I. Wavefield transformation, Geophys. J. Int. 153, 719–734.
Forbriger, T. (2003b). Inversion of shallow-seismic wavefields: II. Inferring subsurface properties from wavefield transforms. Geophys. J. Int. 153, 735–752.
Halliday, D., A. Curtis, D., J. van Manen, J. Robertsson (2007). Interferometric surface wave isolation and removal. Geophysics, 72, A69–A73.
Halliday, D., A. Curtis, E. Kragh (2008). Seismic surface waves in a suburban environment - active and passive interferometric methods, The Leading Edge, 27, 210-218.
International Code Council (2006). The 2006 International Building Code. Washington, D.C., International Code Council, 303 pp.
Louie, J. N. (2001). Faster, better: shear-wave velocity to 100 meters depth from refraction microtremor arrays, Bull. Seism. Soc. Am. 91,347 –364.
MacKay, D. J. C. (2003). Information Theory, Inference, and Learning Algorithms, Cambridge University Press, London, United Kingdom, 640 pp.
Miller, R.D., J. Xia, C.B. Park, and J.M. Ivanov (1999). Multichannel analysis of surface waves to map bedrock, Leading Edge, 18, 1392-1396.
Next Generation Attenuation (NGA), 2008, Earthquake Spectra, Volume 24, Issue 1, Guest editors: Stewart, J.P., Archuleta, R.J., Power, M.S., pp. 1-341.
O'Connell, D. R. H. (2007). Concrete dams as seismic imaging sources, Geophys. Res. Lett. 34, L20307, doi:10.1029/2007GL031219.
Page 10 03/20/14

ALASKA ENERGY AUTHORITY AEA11-022 16-1412-TM-032014 O’Connell, D.R.H., Turner, J.P. (2011). Interferometric Multichannel Analysis of Surface Waves
(IMASW), Bulletin of the Seismological Society of America, Vol. 101, No. 5, pp. 2122-2141, doi 10.1785/0120100230.
O’Neill, A., M. Dentith, and R. List (2003). Full-waveform P-SV reflectivity inversion of surface waves for shallow engineering applications, Exploration Geophysics 34, 158–173.
O’Neill, A., and T. Matsuoka (2005). Dominant higher surface-wave modes and possible inversion pitfalls. J. Env. Eng. Geophysics 10, 185–201.
Park, C. B., R. D. Miller, and J. Xia, 1999, Multichannel analysis of surface waves, Geophysics, 64 ,800 –808.
Snieder, R., M. Miyazawa, E. Slob, I. Vasconcelos, I. and K. Wapenaar (2009). A comparison of strategies for seismic interferometry, Surveys in Geophysics, 30, 503-523.
Socco, L.V. and C. Strobbia (2004). Surface-wave method for near-surface characterization: a tutorial, Near Surface Geophys. 2, 165-185.
Stephenson, W. J., J. N. Louie, S. Pullammanappallil, R. A. Williams, and J. K. Odum (2005). Blind shear-wave velocity comparison of ReMi and MASW results with boreholes to 200 m in Santa Clara Valley: Implications for earthquake ground-motion assessment, Bull. Seism. Soc. Am. 95, 2506 – 2516.
Wilson, F.H., Dover, J.H., Bradley, D.C., Weber, F.R., Bundtzen, T.K., and Haeussler, P.J., (1998), Geologic map of central (interior) Alaska: U.S. Geological Survey Open-File Report 98-0133-B, 63 p., 3 sheets.
Wilson, F. H., Hults, C.P., Schmoll, H.R., Haeussler, P.J., Schmidt, J.M., Yehle, L.A. and Labay K.A., (2009), Preliminary Geologic Map of the Cook Inlet Region, Alaska U.S. Geological Survey Open-File Report 2009-1108, 54 p., 2 sheets.
Page 11 03/20/14

ALASKA ENERGY AUTHORITY AEA11-022 16-1412-TM-032014
Table 1. Seismograph Location Details
ID Name Type Elev-ft Townshi
p Rang
e Sectio
n Meridian Ownership Installed Status LONG_NAD83 LAT_NAD83
WAT1 SM, BB 2343 32N 5E 29 Seward State 8/31/2012 Existing -148.55084 62.82948
WAT2 SM, BB 4442 22S 5W 31 Fairbanks State 9/3/2012 Existing -148.58546 62.96282
WAT3 SM, BB 4993 30N 5E 21 Seward BLM 10/13/2012 Existing -148.53763 62.68121
WAT4 BB 3858 32N 8E 27 Seward State 8/29/2012 Existing -147.94212 62.83485
WAT5 BB 5548 21S 4W 25 Fairbanks BLM 8/4/2013 Existing -148.22938 63.06323
WAT6 BB 5515 29N 9E 27 Seward State 8/5/2013 Existing -147.73517 62.57612
WAT7 SM, BB 4042 32N 3E 26 Seward State 8/5/2013 Existing -148.84711 62.83403
Page 12 03/20/14
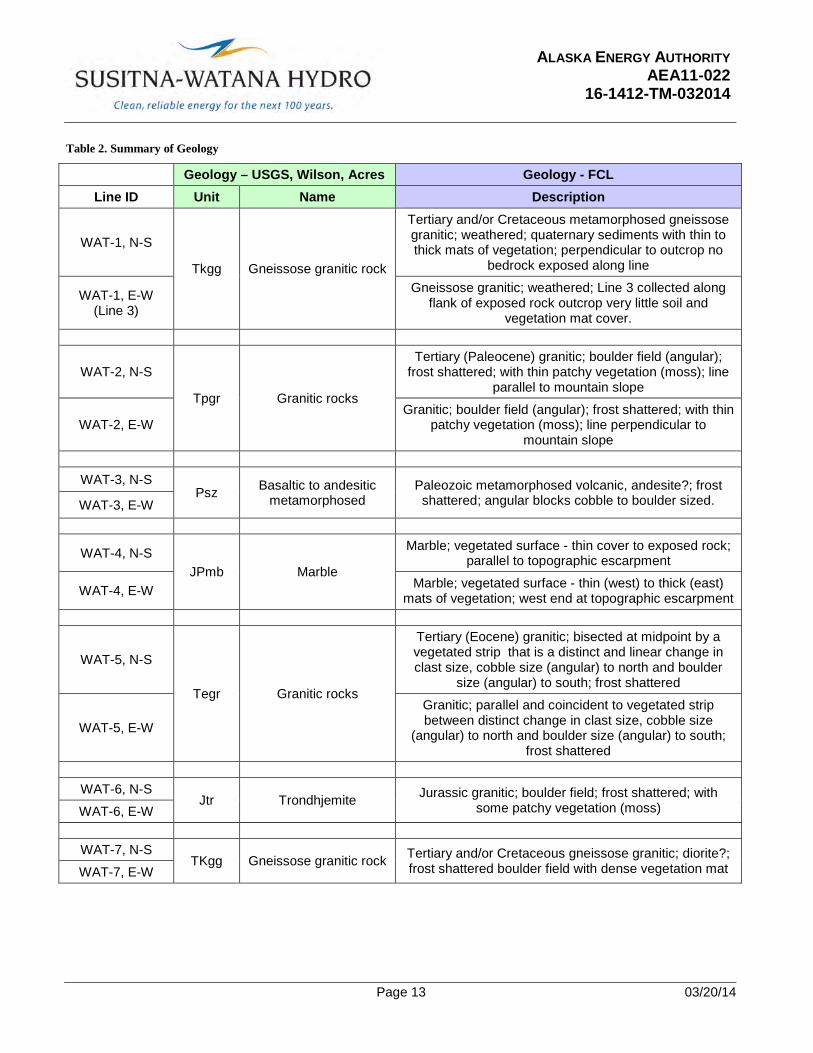
ALASKA ENERGY AUTHORITY AEA11-022 16-1412-TM-032014 Table 2. Summary of Geology
Geology – USGS, Wilson, Acres Geology - FCL Line ID Unit Name Description
WAT-1, N-S
Tkgg Gneissose granitic rock
Tertiary and/or Cretaceous metamorphosed gneissose granitic; weathered; quaternary sediments with thin to thick mats of vegetation; perpendicular to outcrop no
bedrock exposed along line
WAT-1, E-W (Line 3)
Gneissose granitic; weathered; Line 3 collected along flank of exposed rock outcrop very little soil and
vegetation mat cover.
WAT-2, N-S
Tpgr Granitic rocks
Tertiary (Paleocene) granitic; boulder field (angular); frost shattered; with thin patchy vegetation (moss); line
parallel to mountain slope
WAT-2, E-W Granitic; boulder field (angular); frost shattered; with thin
patchy vegetation (moss); line perpendicular to mountain slope
WAT-3, N-S
Psz Basaltic to andesitic metamorphosed
Paleozoic metamorphosed volcanic, andesite?; frost shattered; angular blocks cobble to boulder sized. WAT-3, E-W
WAT-4, N-S JPmb Marble
Marble; vegetated surface - thin cover to exposed rock; parallel to topographic escarpment
WAT-4, E-W Marble; vegetated surface - thin (west) to thick (east) mats of vegetation; west end at topographic escarpment
WAT-5, N-S
Tegr Granitic rocks
Tertiary (Eocene) granitic; bisected at midpoint by a vegetated strip that is a distinct and linear change in clast size, cobble size (angular) to north and boulder
size (angular) to south; frost shattered
WAT-5, E-W
Granitic; parallel and coincident to vegetated strip between distinct change in clast size, cobble size
(angular) to north and boulder size (angular) to south; frost shattered
WAT-6, N-S
Jtr Trondhjemite Jurassic granitic; boulder field; frost shattered; with some patchy vegetation (moss) WAT-6, E-W
WAT-7, N-S
TKgg Gneissose granitic rock Tertiary and/or Cretaceous gneissose granitic; diorite?; frost shattered boulder field with dense vegetation mat WAT-7, E-W
Page 13 03/20/14

ALASKA ENERGY AUTHORITY AEA11-022 16-1412-TM-032014 Table 3. Summary of Vs30 Calculations
IMASW Line Vs30 (m/s) Vs30 (ft/s)
WAT-1 (N-S) 737.0 2418.0
WAT-1 (E-W) Line3 1083.9 3556.1
WAT-2 (N-S) 2758.0 9048.5
WAT-2 (E-W) 2745.7 9008.2
WAT-3 (N-S) 2822.7 9260.8
WAT-3 (E-W) 3154.2 10348.4
WAT-4 (N-S) 1744.2 5722.4
WAT-4 (E-W) 2036.6 6681.7
WAT-5 (N-S) 2243.2 7359.6
WAT-5 (E-W) 2068.0 6784.8
WAT-6 (N-S) 2588.4 8492.1
WAT-6 (E-W) 2705.6 8876.6
WAT-7 (N-S) 1878.7 6163.7
WAT-7 (E-W) 2296.0 7532.8
Page 14 03/20/14

_̂
WAT7WAT7
WAT6WAT6
WAT5WAT5
WAT4WAT4
WAT3WAT3
WAT2
WAT1WAT1
Proposed Dam Site
ST8
SSSSSSSuuuuuuusssssssiiiiiiiiiittttttttttttttttttnnnnnnnnnnnnnnnnaaaaaaaaaaaaaaaaaaaaaaaaaaaaaa RRRRRRRRRRRRRRRRRRRRiiiiiiiiiiiiiiiiivvvvvvvvvvvvvvvvvvvvvveeeeeeeeeeeeeeeeerrrrrrrrrrr
KKKKKKKKKKoooooooooossssssssss
iiiiiiiinnnnnaaa
CCCCCCCCCCCCCCCCCCCCCrrreeeeee
eeeeekkkk
PPPPPPPPPPPPPPPPPPPPPPPPPPPPoooooooooooorrrrrrrrrrrttttttttttttttttttttaaaaaaaaaaaaaaaaagggggggggggggggggggggggggggggeeeeeeeeeeee CCCCCCCCCCCCCCCCCCCCCCrrrrrrrrreeeeeeeeeeeeeeeeeeeeekkkkkkkkkkkkk
TTTTTTTTTTTTTTTTTTTTTTTTTssssssssssssssssssssssTTTTTTTTTTTTTTT uuuuuuuuuuuuuuuuuuuuuuuusssssssssssssssseeeeeeeeeeeeeeeennnnnnnnnnn
aaaaaaaaaCCCCCCCCC
rrrrreeeeeeeeeeeeeekkkk
JJJJJJaaaayyyyy CCCCCCCCCCCCCCCCCCCrrrrrrrrrrreeeeeeeeeeeeeeeeeeeeeeeeeeeeeeekkkkkkkkkkkkkkkkk
TTTTTTTTTTsssssssssTTTTTTTTTTTTTTTiiiiiiiiiiiiisssssssssiii
CCCCCCrrrrreeeeeeeeeeeeeeeeeekkkkkkkkkkkk
FFFFFFFFFooooooogggggggg CCCCCCCrrrrrreeeeeeeeeeekkkkk
DDDDD
eeeeaaaaaaaddddddmmmm
aaaannnnCCCCCCCC
rrrrrreeeeeeeekkkk
GGGGGGGGGGGGGGGGGGiiiiiiii lllllllll bbbbbbbbbbb eeeeeeerrrtt CCCCCCCCCCCCCCCCCrrrrrreeeeeeeeeekkkkkkk
ClClClCClClClClClClClClClClClClCClCCClClClllaaraaaaarraaaararararaaararraaaaaaaaararaaarararraarararararrrrrk k k k kkk kkkkkkkkkkkkkkk CrCrCrCrCrCrCrCrCrCCCrCrCCCCCCrCCCrCCCreeeeeeeeeeeeeeeeeeeeeeeeeeeeeeeeeeeeeekkkkkkkkkkkkkkk
GGGGGGGGGGGGGGGGGoooooooooooooooooooo
ssssseeeeeeeeeeCCCCCCCCCCCCCCCCCCCC
rrrrrreeeeeeeeeeeeekkkkkkkkkkk
BBBBBBBBBBuuuuuuuuuuttttttttttttttttttttttttttteeeeeeeeeeCCCCCCrrrreeeeeeeeeeeeekkkkkkk
kkkkk
Co
Co
Calal
CCCCCCereekkkekekk
Co
Co
C
DDDDDDDDDDDDDDDDDDDDeeeeeelllluuuussssiiiiiiioooooooooo
nnnnCCCCCCC
rrrreeeeeeeekkkkkkkk
DDDDDDDDDDDDDDDDDDeeeeeeeeeeeeeeevvvvvvvvvvvv
iiiiiiiiiiiiiiiiiiillllllllllllllllll
CCCCCCCCCCCCCCCCCCCrrrrrrrrrrrrreeeeeeeeeeeeeeeeeeeeeeeekkkkkkkkkkkkkkkk NNNNNNNNNNNNNNNNoooooooooooooorrrrrrrrrrrrrrttttttttttttthhhhhhhhhhhhhhh
PPPPPPPPPPPPPrrrrrrrrraaaaaaaaaaaiiiiiiiiiiiiiirrrrrrrrrrrrrriiiiiii eeeee
CCCCCCCrrrrrrreeeeeee
eeeeekkkkkkkkkkkkkkkkk
TTTTTTTTTTTTTTaaaaaaaaaaaTTTTTTTTTTTT lllllllllllllllllllkkkkkkkkkkkkkkkeeeeeeeeeeeeeeeeeeeeeeeeeeeeeeeeeeettttttttttnnnnnnnnnnnnnnnnnaaaaaaaaaaaaaaaaa RRRRRRRRRRRRRRRRRRRRRRiiiiiiiiiiiiiiivvvvvvvvvvvveeeeeeeeeeeeeeeeeeeerrrrrrrrrrrrrrrrrrrrr
GGGGGGGGGGGGGGGGGGGGGGGGGGooooooooooooooooooooolllllllllllllllllldddddddddddddddddddddddd
CCCCCCCCCCCCCCCCCCCCCCCCCCCCCCCCCrrrrrrrreeeeeeeeeeeeeeeeeeeeeeeekkkkkkkkkkkkkk
OOOOOOOOOOsssssssssshhhhhh
eeeeeettttnnnnnnaaaaa
RRRRRRRRRRRRRRRRiiiiiiiiiivvvvvvvvveeeeeeeerrrrrrrr
TTTTTTTTTTTeeeeeeeeeTTTTTTTTTTTTTTT rrrrrrrrrrrrrrrrrraaaaaaaaaacccccccccceeeeeeeee CCCCCCCCCCCCrrrrrrrrrrrrrrreeeeeeeeeeeeeeeeeeeeeeeeeeeeeeeeeeeeeeeekkkkkkkkDDDDDDDDDDDDDDDDDDD
eeeeeeeeeeeaaaaaaaaadddddddmmmmmmmm
aaaaaaaaaaaaannnnnnnnnCCCCCCCC
rrrrrreeeeeeeeeeeeeekkkkkkkkkkkkkkkkk
WWWWWWWWWWWWWWaaaaaaaaaaaa
WWWWWWWWWWWWtttttttttaaaaaaaaaa
nnnnnnnnnnnnnnnnaaaaaaaaaaaaaCCCCCCrrrreeeeeeeeeeeeekkkkkk
_̂̂
147°30'W148°0'W148°30'W149°0'W
63°0
'N62
°50'
N62
°40'
N
Source: Base map elevation from Fugro 5-meter InSAR data, 2010.
N0 4 mi
0 4 km
SEISMIC SURVEY LINE LOCATIONS 103/13/14
P:\P
roje
cts\
79_2
000\
79_2
1890
0_A
lask
a_R
ailb
elt,
IMA
SW
Rep
ort,
mod
ified
03.
20.1
4
Existing seismic monitoring station
Proposed seismic monitoring station
ExplanationElevation (feet)
6919
1010

"
148°32'50"W148°33'W148°33'10"W148°33'20"W
62°5
0'N
62°4
9'50
"N62
°49'
40"N
6806806806806868068068068068066868068868086808066668080800
22502250
22002200
2150
2150
21002100
23002300
20502050
23502350
20002000
23502350
23502350
Existing seismic monitoring station
IMASW line location
Topographic contour; 50-foot interval
Sources: 1.
2.3.
Explanation
0 400 ft
0 100 m
N
2IMASW SURVEY LOCATIONS, WAT-1 SITE
P:\P
roje
cts\
79_2
000\
79_2
1890
0_A
lask
a_R
ailb
elt\0
4_G
IS\m
xd\A
lask
a_R
ailb
elt_
IMA
SW
_WAT
1.m
xd,m
odifi
ed 0
3.13
.14
03/13/14
Elevation from 1-meter Matanuska-Susitna Borough LiDAR data, 2011.Aerial imagery from Matanuska-Susitna Borough, 2011.50-ft interval contours from 1-meter Matanuska-Susitna Borough LiDAR data, 2011.
WAT1WAT1

20 30 40Frequency (Hz)
0.002
0.004
0.006
0.008
0.010Sl
owne
ss (s
/m)
FCL IMASW Version 1.2.2: First to last stack of 10 of 10 records
20 30 40
0.002
0.004
0.006
0.008
0.010Sl
owne
ss (s
/m)
500
250
167
125
100
Phas
e Ve
loci
ty (m
/s)
3IMASW BI-DIRECTIONAL SLOWNESS-FREQUENCY
RAYLEIGH- WAVE DISPERSION CURVE STACK WITH PICKS FOR FINAL INVERSION, WAT-1 (N-S LINE)03/12/14
P:\P
roje
cts\
79_2
000\
79_2
1890
0_A
lask
a_R
ailb
elt,
IMA
SW
Rep
ort,
mod
ified
03.
20.1
4

10 20 30 40Frequency (Hz)
0.0005
0.0010
0.0015
0.0020
0.0025
0.0030
Slow
ness
(s/m
FCL IMASW Version 1.2.2: First to last stack of 9 of 9 records
10 20 30 40Frequency (Hz)
0.0005
0.0010
0.0015
0.0020
0.0025
0.0030
Slow
ness
(s/m
)
2000
1000
667
500
400
333
Phas
e Ve
loci
ty (m
/s)
4IMASW BI-DIRECTIONAL SLOWNESS-FREQUENCY
RAYLEIGH- WAVE DISPERSION CURVE STACKWITH PICKS FOR FINAL INVERSION, WAT-1 (E-W LINE)03/12/14P
:\Pro
ject
s\79
_200
0\79
_218
900_
Ala
ska_
Rai
lbel
t, IM
AS
W R
epor
t, m
odifi
ed 0
3.20
.14

0 20 40 60Depth (m)
0
1000
2000
3000
4000
S-w
ave
Velo
city
(m/s
)
0 50 100 150 200Depth (ft)
0
2
4
6
8
10
12
S-w
ave
Velo
city
(kft/
s)
0 20 40 60Depth (m)
0
1000
2000
3000
4000
S-w
ave
Velo
city
(m/s
)
0 50 100 150 200Depth (ft)
0
2
4
6
8
10
12
S-w
ave
Velo
city
(kft/
s)
5IMASW S-WAVE VELOCITY MODELS WAT-1, N-S LINE (TOP) AND E-W LINE (BOTTOM)
03/12/14
P:\P
roje
cts\
79_2
000\
79_2
1890
0_A
lask
a_R
ailb
elt,
IMA
SW
Rep
ort,
mod
ified
03.
20.1
4
Explanation
Likelihood ~1σChi-squared ~1σMean of 21 best models
Median of 21 best modelsFinal ~1σ

" WAT2WAT2
148°34'50"W148°35'W148°35'10"W148°35'20"W148°35'30"W
62°5
7'50
"N62
°57'
40"N
4300
4300
42504250
42004200
4150
4150
4100
4100
44004400
4450
4450
4350
4350
40504050
40004000
39503950
45004500
45004500
45004500
0 400 ft
0 100 m
N
6IMASW SURVEY LOCATIONS, WAT-2 SITE
P:\P
roje
cts\
79_2
000\
79_2
1890
0_A
lask
a_R
ailb
elt\0
4_G
IS\m
xd\A
lask
a_R
ailb
elt_
IMA
SW
_WAT
2.m
xd, m
odifi
ed 0
3.13
.14
03/13/14
Elevation (feet)4514
3930
Existing seismic monitoring station
IMASW line location
Topographic contour; 50-foot interval
Source:
Explanation
Base map elevation and contour intervals from Fugro 5-meter InSAR data, 2010.

60 80 100 120 140Frequency (Hz)
0.0005
0.0010
0.0015
Slow
ness
(s/m
)
FCL IMASW Version 1.2.2: First to last stack of 10 of 10 records
60 80 100 120 140Frequency (Hz)
0.0005
0.0010
0.0015
2000
1000
667
Phas
e Ve
loci
ty (m
/s)
7IMASW BI-DIRECTIONAL SLOWNESS-FREQUENCY
RAYLEIGH- WAVE DISPERSION CURVE STACKWITH PICKS FOR FINAL INVERSION, WAT-2 (N-S LINE)03/12/14P
:\Pro
ject
s\79
_200
0\79
_218
900_
Ala
ska_
Rai
lbel
t, IM
AS
W R
epor
t, m
odifi
ed 0
3.20
.14

FCL IMASW Version 1.2.2: First to last stack of 8 of 8 records
20 40 60 80 100 120 140Frequency (Hz)
0.0005
0.0010
0.0015
Slow
ness
(s/m
20 40 60 80 100 120 140Frequency (Hz)
0.0005
0.0010
0.0015
)
2000
1000
667
Phas
e Ve
loci
ty (m
/s)
8IMASW BI-DIRECTIONAL SLOWNESS-FREQUENCY
RAYLEIGH- WAVE DISPERSION CURVE STACKWITH PICKS FOR FINAL INVERSION, WAT-2 (E-W LINE)03/12/14P
:\Pro
ject
s\79
_200
0\79
_218
900_
Ala
ska_
Rai
lbel
t, IM
AS
W R
epor
t, m
odifi
ed 0
3.20
.14

0 20 40 60Depth (m)
1500
2000
2500
3000
3500
4000
S-w
ave
Velo
city
(m/s
)
0 50 100 150 200Depth (ft)
6
8
10
12
S-w
ave
Velo
city
(kft/
s)
0 20 40 60Depth (m)
1000
1500
2000
2500
3000
3500
4000S-
wav
e Ve
loci
ty (m
/s)
0 50 100 150 200Depth (ft)
4
6
8
10
12
S-w
ave
Velo
city
(kft/
s)
9IMASW S-WAVE VELOCITY MODELS WAT-2, N-S LINE (TOP) AND E-W LINE (BOTTOM)
03/12/14
P:\P
roje
cts\
79_2
000\
79_2
1890
0_A
lask
a_R
ailb
elt,
IMA
SW
Rep
ort,
mod
ified
03.
20.1
4
Explanation
Likelihood ~1σChi-squared ~1σMean of 21 best models
Median of 21 best modelsFinal ~1σ
"
148°32'W148°32'10"W148°32'20"W148°32'30"W
62°4
1'N
62°4
0'50
"N62
°40'
40"N
46004600
46504650
47004700
47504750
48004800
4850
4850
4550
4550
4900
4900
4500
4500
4450
4450
49504950
44004400
43504350
43004300
5000
5000
1003/13/14
IMASW SURVEY LOCATIONS, WAT-3 SITE
P:\P
roje
cts\
79_2
000\
79_2
1890
0_A
lask
a_R
ailb
elt\0
4_G
IS\m
xd\A
lask
a_R
ailb
elt_
IMA
SW
_WAT
3.m
xd, m
odifi
ed 0
3.13
.14
0 400 ft
0 100 m
N
WAT3WAT3
Existing seismic monitoring station
IMASW line location
Topographic contour; 50-foot interval
Source:
Explanation
Base map elevation and contour intervals from Fugro 5-meter InSAR data, 2010.
Elevation (feet)
5007 ft
4242 ft

FCL IMASW Version 1.2.2: First to last stack of 10 of 10 records
50 100 150Frequency (Hz)
0.0005
0.0010
0.0015
0.0020
Slow
ness
(s/m
50 100 150Frequency (Hz)
0.0005
0.0010
0.0015
0.0020
Slow
ness
(s/m
)
2000
1000
667
500
Phas
e Ve
loci
ty (m
/s)
11IMASW BI-DIRECTIONAL SLOWNESS-FREQUENCY
RAYLEIGH- WAVE DISPERSION CURVE STACKWITH PICKS FOR FINAL INVERSION, WAT-3 (N-S LINE)03/12/14
P:\P
roje
cts\
79_2
000\
79_2
1890
0_A
lask
a_R
ailb
elt,
IMA
SW
Rep
ort,
mod
ified
03.
20.1
4

FCL IMASW Version 1.2.2: First to last stack of 10 of 10 records
50 100 150Frequency (Hz)
0.0005
0.0010
0.0015
0.0020
Slow
ness
(s/m
50 100 150Frequency (Hz)
0.0005
0.0010
0.0015
0.0020
Slow
ness
(s/m
)
2000
1000
667
500
Phas
e Ve
loci
ty (m
/s)
12IMASW BI-DIRECTIONAL SLOWNESS-FREQUENCY
RAYLEIGH- WAVE DISPERSION CURVE STACKWITH PICKS FOR FINAL INVERSION, WAT-3 (E-W LINE)03/12/14P
:\Pro
ject
s\79
_200
0\79
_218
900_
Ala
ska_
Rai
lbel
t, IM
AS
W R
epor
t, m
odifi
ed 0
3.20
.14

0 20 40 60Depth (m)
1000
1500
2000
2500
3000
3500
4000S-
wav
e Ve
loci
ty (m
/s)
0 50 100 150 200Depth (ft)
4
6
8
10
12
S-w
ave
Velo
city
(kft/
s)
0 20 40 60Depth (m)
1500
2000
2500
3000
3500
4000
S-w
ave
Velo
city
(m/s
)
0 50 100 150 200Depth (ft)
6
8
10
12
S-w
ave
Velo
city
(kft/
s)
13IMASW S-WAVE VELOCITY MODELS WAT-3, N-S LINE (TOP) AND E-W LINE (BOTTOM)
03/12/14P:\P
roje
cts\
79_2
000\
79_2
1890
0_A
lask
a_R
ailb
elt,
IMA
SW
Rep
ort,
mod
ified
03.
20.1
4
Explanation
Likelihood ~1σChi-squared ~1σMean of 21 best models
Median of 21 best modelsFinal ~1σ

" WAT4WAT4
147°56'10"W147°56'20"W147°56'30"W147°56'40"W147°56'50"W
62°5
0'10
"N62
°50'
N
3700370037503750
36503650
36003600
3800
3800
35503550
38503850
39003900
35003500
39503950
14IMASW SURVEY LOCATIONS, WAT-4 SITE
P:\P
roje
cts\
79_2
000\
79_2
1890
0_A
lask
a_R
ailb
elt\0
4_G
IS\m
xd\A
lask
a_R
ailb
elt_
IMA
SW
_WAT
4.m
xd,m
odifi
ec 0
3.13
.14
03/13/14
0 400 ft
0 100 m
N
Existing seismic monitoring station
IMASW line location
Topographic contour; 50-foot interval
Source:
ExplanationBase map elevation and contour intervals from Fugro 5-meter InSAR data, 2010.
Elevation (feet)
4006
3461

20 40 60 80Frequency (Hz)
0.0005
0.0010
0.0015
Slow
ness
(s/m
20 40 60 80Frequency (Hz)
0.0005
0.0010
0.0015
)
2000
1000
667
Phas
e Ve
loci
ty (m
/s)
FCL IMASW Version 1.2.2: First to last stack of 12 of 12 records
15IMASW BI-DIRECTIONAL SLOWNESS-FREQUENCY
RAYLEIGH- WAVE DISPERSION CURVE STACKWITH PICKS FOR FINAL INVERSION, WAT-4 (N-S LINE)03/12/14
P:\P
roje
cts\
79_2
000\
79_2
1890
0_A
lask
a_R
ailb
elt,
IMA
SW
Rep
ort,
mod
ified
03.
20.1
4

20 40 60 80Frequency (Hz)
0.0005
0.0010
0.0015
Slow
ness
(s/m
)
FCL IMASW Version 1.2.2: First to last stack of 12 of 12 records
20 40 60 80Frequency (Hz)
0.0005
0.0010
0.0015
2000
1000
667
Phas
e Ve
loci
ty (m
/s)
16IMASW BI-DIRECTIONAL SLOWNESS-FREQUENCY
RAYLEIGH- WAVE DISPERSION CURVE STACKWITH PICKS FOR FINAL INVERSION, WAT-4 (E-W LINE)03/12/14
P:\P
roje
cts\
79_2
000\
79_2
1890
0_A
lask
a_R
ailb
elt,
IMA
SW
Rep
ort,
mod
ified
03.
20.1
4

0 20 40 60 80 100Depth (m)
0
1000
2000
3000
4000
S-w
ave
Velo
city
(m/s
)
0 50 100 150 200 250 300Depth (ft)
0
2
4
6
8
10
12
S-w
ave
Velo
city
(kft/
s)
0 20 40 60Depth (m)
0
1000
2000
3000
4000
S-w
ave
Velo
city
(m/s
)
0 50 100 150 200 250Depth (ft)
0
2
4
6
8
10
12
S-w
ave
Velo
city
(kft/
s)
17IMASW S-WAVE VELOCITY MODELS WAT-4, N-S LINE (TOP) AND E-W LINE (BOTTOM)
03/12/14
P:\P
roje
cts\
79_2
000\
79_2
1890
0_A
lask
a_R
ailb
elt,
IMA
SW
Rep
ort,
mod
ified
03.
20.1
4
Explanation
Likelihood ~1σChi-squared ~1σMean of 21 best models
Median of 21 best modelsFinal ~1σ

148°13'20"W148°13'30"W148°13'40"W148°13'50"W148°14'W
63°4
'N63
°3'5
0"N
63°3
'40"
N
53005300
52505250
53505350
53505350
53005300
52505250
5200520051505150
54005400
54005400
54505450
51005100
55005500
54505450
18IMASW SURVEY LOCATIONS, WAT-5 SITE
P:\P
roje
cts\
79_2
000\
79_2
1890
0_A
lask
a_R
ailb
elt\0
4_G
IS\m
xd\A
lask
a_R
ailb
elt_
IMA
SW
_WAT
5.m
xd, m
odifi
ed 0
3.13
.14
03/13/14
WAT5WAT5
0 400 ft
0 100 m
N
Proposed seismic monitoring station
IMASW line location
Topographic contour; 50-foot interval
Source:
Explanation
Base map elevation and contour intervals from Fugro 5-meter InSAR data, 2010.5518
5085
Elevation (feet)
20 40 60 80Frequency (Hz)
0.0005
0.0010
0.0015
Slow
ness
(s/m
)
FCL IMASW Version 1.2.2: First to last stack of 11 of 11 records
20 40 60 80Frequency (Hz)
0.0005
0.0010
0.0015
2000
1000
667
Phas
e Ve
loci
ty (m
/s)
19IMASW BI-DIRECTIONAL SLOWNESS-FREQUENCY
RAYLEIGH- WAVE DISPERSION CURVE STACKWITH PICKS FOR FINAL INVERSION, WAT-5 (N-S LINE)03/12/14
P:\P
roje
cts\
79_2
000\
79_2
1890
0_A
lask
a_R
ailb
elt,
IMA
SW
Rep
ort,
mod
ified
03.
20.1
4

20 40 60 80Frequency (Hz)
0.0005
0.0010
0.0015
Slow
ness
(s/m
)
FCL IMASW Version 1.2.2: First to last stack of 13 of 13 records
20 40 60 80Frequency (Hz)
0.0005
0.0010
0.0015
2000
1000
667
Phas
e Ve
loci
ty (m
/s)
20IMASW BI-DIRECTIONAL SLOWNESS-FREQUENCY
RAYLEIGH- WAVE DISPERSION CURVE STACKWITH PICKS FOR FINAL INVERSION, WAT-5 (E-W LINE)03/12/14
P:\P
roje
cts\
79_2
000\
79_2
1890
0_A
lask
a_R
ailb
elt,
IMA
SW
Rep
ort,
mod
ified
03.
20.1
4

0 20 40 60Depth (m)
0
1000
2000
3000
4000S-
wav
e Ve
loci
ty (m
/s)
0 50 100 150 200Depth (ft)
0
2
4
6
8
10
12
S-w
ave
Velo
city
(kft/
s)
0 20 40 60 80Depth (m)
0
1000
2000
3000
4000
S-w
ave
Velo
city
(m/s
)
0 50 100 150 200 250 300Depth (ft)
0
2
4
6
8
10
12
S-w
ave
Velo
city
(kft/
s)
21IMASW S-WAVE VELOCITY MODELS WAT-5, N-S LINE (TOP) AND E-W LINE (BOTTOM)
03/12/14
P:\P
roje
cts\
79_2
000\
79_2
1890
0_A
lask
a_R
ailb
elt,
IMA
SW
Rep
ort,
mod
ified
03.
20.1
4
Explanation
Likelihood ~1σChi-squared ~1σMean of 21 best models
Median of 21 best modelsFinal ~1σ

WAT6WAT6
147°43'50"W147°44'W147°44'10"W147°44'20"W147°44'30"W
62°3
4'40
"N62
°34'
30"N
5500
5500
54505450
54005400
54005400
53505350
55505550
55005500
54505450
53505350
53005300
52505250
56005600
22IMASW SURVEY LOCATIONS, WAT-6 SITE
P:\P
roje
cts\
79_2
000\
79_2
1890
0_A
lask
a_R
ailb
elt\0
4_G
IS\m
xd\A
lask
a_R
ailb
elt_
IMA
SW
_WAT
6.m
xd, m
odifi
ed 0
3.13
.14
03/13/14
Proposed seismic monitoring station
IMASW line location
Topographic contour; 50-foot interval
Source:
Explanation
Base map elevation and contour intervals from Fugro 5-meter InSAR data, 2010.
Elevation (feet)
5604
5230

20 40 60 80Frequency (Hz)
0.0005
0.0010
0.0015
Slow
ness
(s/m
)
FCL IMASW Version 1.2.2: First to last stack of 10 of 10 records
20 40 60 80Frequency (Hz)
0.0005
0.0010
0.0015
2000
1000
667
Phas
e Ve
loci
ty (m
/s)
23IMASW BI-DIRECTIONAL SLOWNESS-FREQUENCY
RAYLEIGH- WAVE DISPERSION CURVE STACKWITH PICKS FOR FINAL INVERSION, WAT-6 (N-S LINE)03/12/14
P:\P
roje
cts\
79_2
000\
79_2
1890
0_A
lask
a_R
ailb
elt,
IMA
SW
Rep
ort,
mod
ified
03.
20.1
4

20 40 60 80Frequency (Hz)
0.0005
0.0010
0.0015
Slow
ness
(s/m
)
20 40 60 80Frequency (Hz)
0.0005
0.0010
0.0015
2000
1000
667
Phas
e Ve
loci
ty (m
/s)
FCL IMASW Version 1.2.2: First to last stack of 12 of 12 records
24IMASW BI-DIRECTIONAL SLOWNESS-FREQUENCY
RAYLEIGH- WAVE DISPERSION CURVE STACKWITH PICKS FOR FINAL INVERSION, WAT-6 (E-W LINE)03/12/14
P:\P
roje
cts\
79_2
000\
79_2
1890
0_A
lask
a_R
ailb
elt,
IMA
SW
Rep
ort,
mod
ified
03.
20.1
4
0 20 40 60Depth (m)
1000
2000
3000
4000
S-w
ave
Velo
city
(m/s
)
0 50 100 150 200 250Depth (ft)
4
6
8
10
12
S-w
ave
Velo
city
(kft/
s)
0 20 40 60Depth (m)
0
1000
2000
3000
4000
S-w
ave
Velo
city
(m/s
)
0 50 100 150 200Depth (ft)
0
2
4
6
8
10
12
S-w
ave
Velo
city
(kft/
s)
25IMASW S-WAVE VELOCITY MODELS WAT-6, N-S LINE (TOP) AND E-W LINE (BOTTOM)
03/12/14
P:\P
roje
cts\
79_2
000\
79_2
1890
0_A
lask
a_R
ailb
elt,
IMA
SW
Rep
ort,
mod
ified
03.
20.1
4
Explanation
Likelihood ~1σChi-squared ~1σMean of 21 best models
Median of 21 best modelsFinal ~1σ
WAT7WAT7
148°50'30"W148°50'40"W148°50'50"W148°51'W148°51'10"W
62°5
0'10
"N62
°50'
N62
°49'
50"N
3850
3850
39003900
38003800
39503950
37503750
40004000
37003700
3900
3900
26IMASW SURVEY LOCATIONS, WAT-7 SITE
P:\P
roje
cts\
79_2
000\
79_2
1890
0_A
lask
a_R
ailb
elt\0
4_G
IS\m
xd\A
lask
a_R
ailb
elt_
IMA
SW
_WAT
7.m
xd, m
odifi
ed 0
3.13
.14
03/13/14
Proposed seismic monitoring station
IMASW line location
Topographic contour; 50-foot interval
Source:
Explanation
Base map elevation and contour intervals from Fugro 5-meter InSAR data, 2010.4012
3675
Elevation (feet)

FCL IMASW Version 1.2.2: First to last stack of 10 of 10 records
20 40 60 80Frequency (Hz)
0.0005
0.0010
0.0015
Slow
ness
(s/m
)
20 40 60 80Frequency (Hz)
0.0005
0.0010
0.0015
2000
1000
667
Phas
e Ve
loci
ty (m
/s)
27IMASW BI-DIRECTIONAL SLOWNESS-FREQUENCY
RAYLEIGH- WAVE DISPERSION CURVE STACKWITH PICKS FOR FINAL INVERSION, WAT-7 (N-S LINE)03/12/14
P:\P
roje
cts\
79_2
000\
79_2
1890
0_A
lask
a_R
ailb
elt,
IMA
SW
Rep
ort,
mod
ified
03.
20.1
4

20 40 60 80Frequency (Hz)
0.0005
0.0010
0.0015
Slow
ness
(s/m
)
FCL IMASW Version 1.2.2: First to last stack of 10 of 10 records
20 40 60 80Frequency (Hz)
0.0005
0.0010
0.0015
2000
1000
667
Phas
e Ve
loci
ty (m
/s)
28IMASW BI-DIRECTIONAL SLOWNESS-FREQUENCY
RAYLEIGH- WAVE DISPERSION CURVE STACKWITH PICKS FOR FINAL INVERSION, WAT-7 (E-W LINE)03/12/14P
:\Pro
ject
s\79
_200
0\79
_218
900_
Ala
ska_
Rai
lbel
t, IM
AS
W R
epor
t, m
odifi
ed 0
3.20
.14

0 20 40 60 80Depth (m)
0
1000
2000
3000
4000S-
wav
e Ve
loci
ty (m
/s)
0 50 100 150 200 250 300Depth (ft)
0
2
4
6
8
10
12
S-w
ave
Velo
city
(kft/
s)
0 20 40 60 80 100Depth (m)
0
1000
2000
3000
4000
S-w
ave
Velo
city
(m/s
)
0 50 100 150 200 250 300
Depth (ft)
0
2
4
6
8
10
12
S-w
ave
Velo
city
(kft/
s)
29IMASW S-WAVE VELOCITY MODELS WAT-7, N-S LINE (TOP) AND E-W LINE (BOTTOM)
03/12/14P:\P
roje
cts\
79_2
000\
79_2
1890
0_A
lask
a_R
ailb
elt,
IMA
SW
Rep
ort,
mod
ified
03.
20.1
4
Explanation
Likelihood ~1σChi-squared ~1σMean of 21 best models
Median of 21 best modelsFinal ~1σ

ALASKA ENERGY AUTHORITY AEA11-022
16-1412-TM-032014
Appendix A: Vs30 Survey Site Photographs
03/20/14

ALASKA ENERGY AUTHORITY AEA11-022
16-1412-TM-032014
Page A-1 03/20/14
WAT-1 view from approach, looking southwest. Note two structures on ridge, seismic monitoring station (left), solar panel and weather station (right).
WAT-1 (N-S line) Looking south-southwest along N-S seismic line from center point of line. Note monitoring station upper left hand corner at top of ridge.

ALASKA ENERGY AUTHORITY AEA11-022
16-1412-TM-032014
Page A-2 03/20/14
WAT-1 Looking west along the shorter E-W line (Line 3). Seismic station vault at center of line and seismic station shelter at top of ridge, upper right.
WAT-1, Looking east from seismic monitoring station shelter towards vault.
ALASKA ENERGY AUTHORITY AEA11-022
16-1412-TM-032014
Page A-3 03/20/14
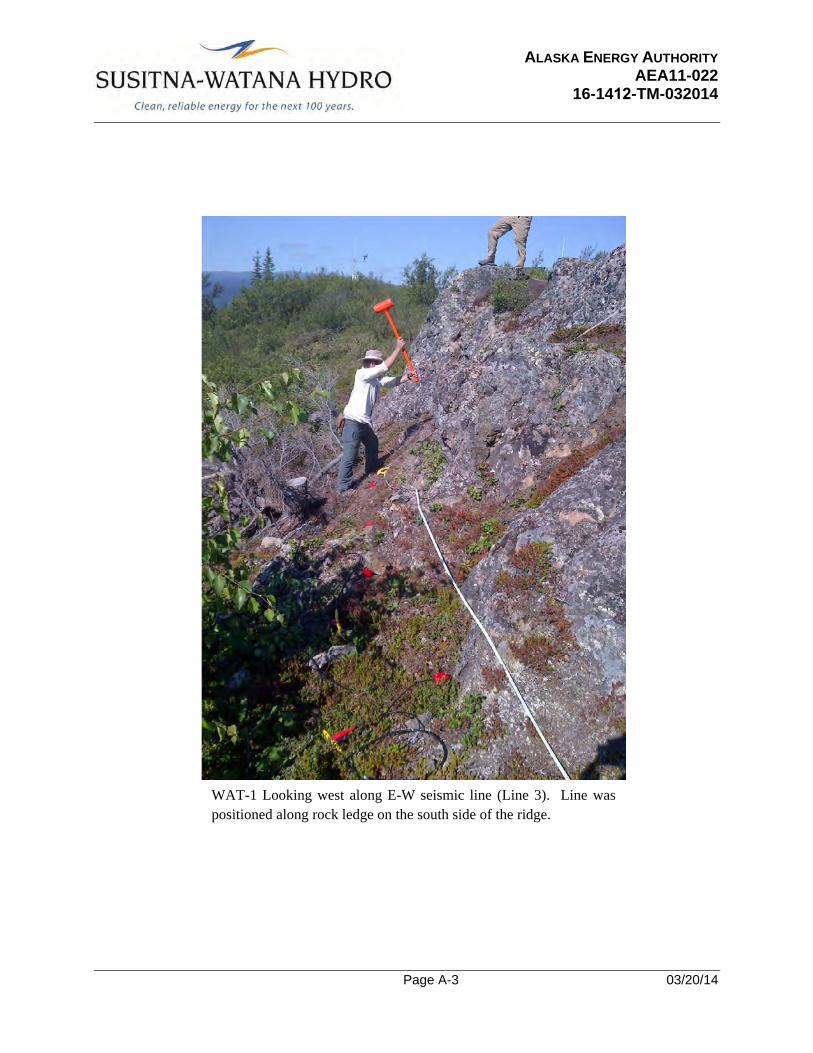
WAT-1 Looking west along E-W seismic line (Line 3). Line was positioned along rock ledge on the south side of the ridge.

ALASKA ENERGY AUTHORITY AEA11-022
16-1412-TM-032014
Page A-4 03/20/14
WAT-2 Looking north from southern end of N-S line. Note the seismic monitoring station at top of ridge, center of photo.
WAT‐2 Looking east from center point of E‐W line towards seismic station. Note the
seismic station shelter at the center top of ridge.

ALASKA ENERGY AUTHORITY AEA11-022
16-1412-TM-032014
Page A-5 03/20/14
WAT-3, Looking southwest along N-S line (line trends SW to NE). Monitoring station vault is located at the center of line, note yellow vault lid just off the right-hand side of the cable.
WAT-3, Looking northwest along E-W line (line trends SE to NW). Note line was centered on the monitoring station vault, between the vault (right) and station shelter (left).

ALASKA ENERGY AUTHORITY AEA11-022
16-1412-TM-032014
Page A-6 03/20/14
WAT-4, Looking westward along the E-W line from the center point toward the seismic monitoring station. Note the station shelter center of photo.
WAT-4, Looking north along N-S line from south end towards center point near the seismic monitoring station.

ALASKA ENERGY AUTHORITY AEA11-022
16-1412-TM-032014
Page A-7 03/20/14
WAT-5, Looking west from center point of E-W line.

ALASKA ENERGY AUTHORITY AEA11-022
16-1412-TM-032014
Page A-8 03/20/14
WAT-5, Looking north from center point of N-S line towards the assumed weather monitoring station. N-S line was in the process of layout, the cable was run from upper right of photo to lower left of photo.

ALASKA ENERGY AUTHORITY AEA11-022
16-1412-TM-032014
Page A-9 03/20/14
WAT-6, Looking westward along E-W line from the center point.
ALASKA ENERGY AUTHORITY AEA11-022
16-1412-TM-032014
Page A-10 03/20/14
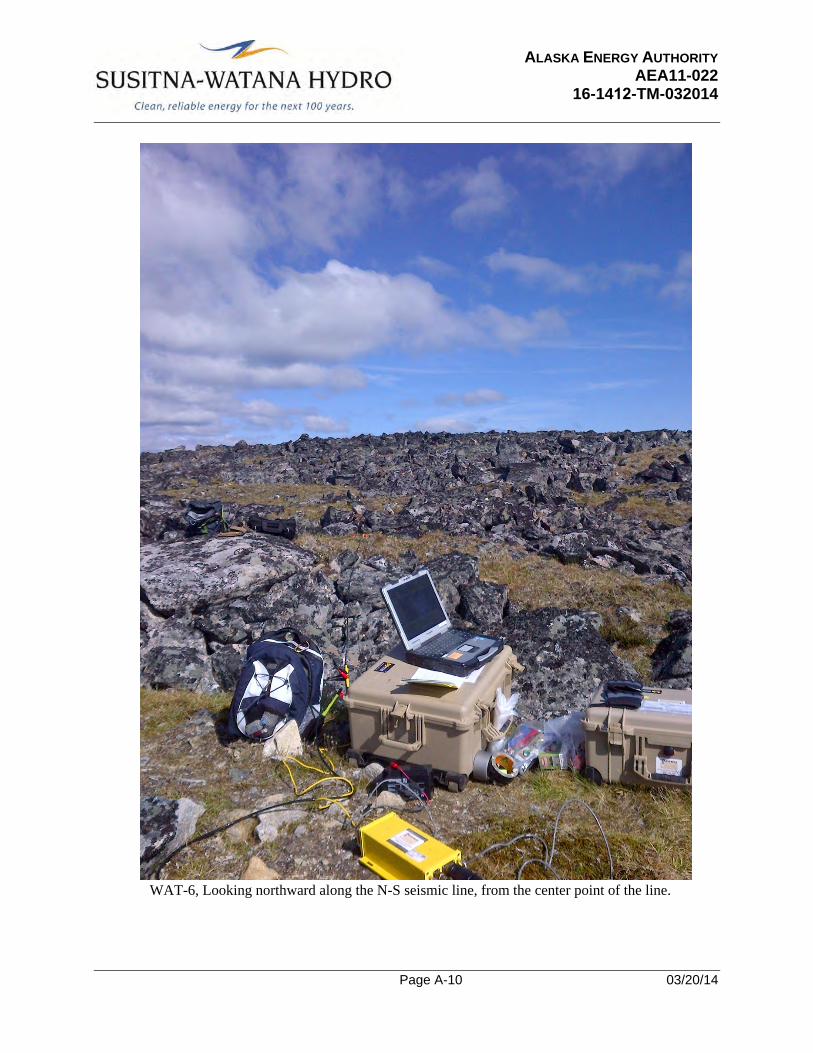
WAT-6, Looking northward along the N-S seismic line, from the center point of the line.

ALASKA ENERGY AUTHORITY AEA11-022
16-1412-TM-032014
Page A-11 03/20/14
WAT-7 looking west along E-W line from approximately the center point of the line.
WAT-7, looking north, northeast along the N-S line towards the north end of the line. Fugro crew in orange shirt is performing sledgehammer hits during data acquisition.