Embed Size (px)
Citation preview

\,)
ATTACHMENT 2
IMPINGEMENT RESULTS
Gl - TRAVELING SCREEN AND BAR RACK WEEKLY SURVEYS
G2 - HEAT TREATMENT SURVEYS

Impingement Results
Encina Power Station Impingement Abundance: Traveling Screen and Bar Rack Survey Data
Survey: EPSIAOOI Survey Date: June 24 - 25, 2004Sample Count: 19
Survey Length Weight TotalTaxon Common Name Count Range (mm) Range (g) Weight (g)FISHESCymatogaster aggregata shiner surfperch 186 40-84 1.3-15.3 729.7
Engraulis mordax northern anchovy 46 37-90 0.4-10.5 69.2Heterostichus rostratus giant kelpfislt 8 81-113 4.1-8.2 47.9Heterostichus spp, kelpfislt 7 81-118 4.0-12,2 47,8
Anchoa compressa deepbody anchovy 6 31-107 0,1-1\.6 13.7
Engraulidae anchovies 4 \.6 \.6
Atherinops affinis topsmelt 3 54-115 0,9-18.8 25.5Porichthys myriaster specklefin midshipman 3 300-378 210 210.0
unidentified fish unid. fish 3 34 0.5-2.0 4.4
Hyporhamphus rosae California halfbeak 2 111-125 10.9-1 I.7 22.6Paralabrax spp. sand bass 2 33-55 0.7-2.0 2.7
Anchoa delicatissima slough anchovy I 3.0 2.8Atherinopsidae silverside I 46 \.0 \.0
Hypsoblennius spp. blennies I 252 267 267.0
Pleuronichthys verticalis hornyhead turbot I 291 227 226.5
Sphyraena argentea California barracuda I 136 0.8 0.8
Syngnathus leptorhynchus bay pipefish I 290 9.7 9.7
SHARKSIRAYSGymnura marmorata California butterfly ray 9 253-410 143-521 1,984.7
Urolophus halleri round stingray 2 285-337 244-444 688.0
INVERTEBRATESPachygrapsus crassipes striped shore crab 7 15-34 2.0-18.0 66.1
Total: 294
Survey: EPSlAOO2 Survey Date: June 30 - July 1, 2004Sample Count: 19
Survey Length Weight TotalTaxon Common Name Count Range (mm) Range (g) Weight(g)FISHESCymatogaster aggregata . shiner surfperch 242 40-115 1.6-31.0 957.0Roncador steamsi spotfin croaker 51 33-205 0.6-106 260.4
Engraulis mordax northern anchovy 36 35-103 0.2-14.0 57.6
Heterostichus rostratus giant kelpfish 33 74-128 3.4-16.0 209.8Atherinops qlfinis topsmelt 29 34-115 0.5-15.2 117.3Strongylura exilis California needlefish 5 95-142 0.6-2.0 6.1Hypsopsetta guttulata diamond turbot 3 104-140 27.7-79.4 173.4Porichthys myriaster specklefm midshipman 3 250-305 160-312 633.0Anchoa delicatissima slough anchovy 2 65 1.1-3.1 4.2Paralichthys californicus California halibut 2 55-95 2.9-11.5 14.4
Sphyraena argentea California barracuda 2 78-85 2.0-3.6 5.6Anchoa compressa deepbody anchovy I 43 2.2 2.2Paralabrax nebulifer barred sand bass I 230 312 312.0
SeriphusPOlilus queenfish I 102 15.7 15.7unidentified fish unid. fish I 0.1 0.1
unidentified fish, damaged unid. damaged fish I 0.4 0.4
SHARKsIRAYSGymnura marmorata California butterfly ray 5 224-505 112-600 1,505.6Myliobatis californica bat ray I 295 392.0 391.5
INVERTEBRATESPachygrapsus crassipes striped shore crab 5 19-47 5.7-47.6 96.3Octopus spp. octopus I 10.1 10.1
Total: 425
G1-1

Impingement Results
Encina Power Station Impingement Abundance:: Traveling Screen and Bar Rack Survey Data
Survey: EPSIAOOJ Survey Date: July 07 - 08, 2004Sample Count: 19
Survey Length Weight TotalTaxon Common Name Count Range (mm) Range (g) Weight (g)FISHESCymatogaster aggregata shiner surfperch 83 45-66 2.5-7.0 363.0Roncador stearnsi spotfin croaker 31 35-52 0.7-2.0 40.1
Heterostichus rostratus giant kelpfish 29 75-123 3.2-14.9 181.2Anchoa compressa deepbody anchovy 17 35-99 0.9-10.5 64.1Strongylura exilis California needlefish 13 75-135 0.3-9.5 64.4Engraulis mordax northern anchovy 9 42-46 0.5-1.3 6.5Atherinops affinis topsmelt 4 60-110 2.2-28.8 43.4Anchoa delicatissima slough anchovy 3 1.3 1.3Paralichthys cali/omicus California halibut 3 43-63 1.5-3.8 7.3Engraulidae anchovies 2 1.2 1.2Porichthys myriaster specklefin midshipman 2 249-270 200-250 450.0
Anchoa spp. anchovy I 65 2.5 2.5Cheilotrema saturnum black croaker I 48 1.8 1.8
Gibbonsia montereyensis crevice kelpfish I 88 8.3 8.3Hypsopsetta giatulata diamond turbot I 285 400 400.0Sardinops sagax Pacific sardine I 35 0.4 0.4
SHARKSIRAYSGymnura marmorata California butterfly ray 7 225-293 165-375 1,715.1Myliobatis cali/omica bat ray I 245 240 239.5
INVERTEBRATESPachygrapsus crassipes striped shore crab 6 26-34.5 6.2-12.1 54.0
Total: 215
Survey: EPSlA004 Survey Date: July 14 - 15, 2004Sample Count: 19
Survey Length Weight TotalTaxon Common Name Count Range (mm) Range (g) Weight (g)FISHESEngraulis mordax northern anchovy 228 34-109 0.4-11.0 186.9Cymatogaster aggregata shiner surfperch 191 45-228 2.3-326 1,327.3
Atherinops qffinis topsmelt 126 45-139 0.8-26.9 472.1Heterostichus rostratus giant kelpfish 119 57-137 1.5-19.6 834.0
Roncador steamsi spotfm croaker 38 37-226 0.8-149 306.5Anchoa delicatissima slough anchovy 28 33-42 0.2-1.5 24.4Seriphus poUlus queenfish 25 35-60 0.7-3.3 41.7Strongylura exilis California needlefish 17 84-375 0.6-45.4 91.8Sardinops sagax Pacific sardine 15 35-59 0.4-2.3 15.4Anchoa compressa deepbody anchovy 10 60-116 2.5-22.5 76.1
Porichthys nryriaster specklefm midshipman 7 164-354 53.3-369.3 1,692.9
ParaUchthys cali/ornicus California halibut 5 41-99 1.3-10.6 32.5Syngnathus spp. pipefishes 4 103-179 0.8-4.2 11.6
Hypsopsetta guttulata diamond turbot I 145 79.1 79.1Scomberjaponicus Pacific mackerel I 63 2.2 2.2Symphurus atricauda California tonguefish I 90 7.3 7.3
SHARKSIRAYS. Gymnura marmorata California butterfly ray 20 268-421 179-600 5,135.9
Urolophus holleri round stingray I 85 29.7 29.7Myliobatis cali/ornica bal ray 5 248-317 236.7-531.3 2,010.0
INVERTEBRATESPachygrapsus crassipes striped shore crab 3 21-33 5.8-16.1 32.7Octopus spp. octopus I 239.4 239.4
Total: 846
G1-2
Impingement Results
\
) Encina Power Station Impingement Abundance: Traveling Screen and Bar Rack Survey Data
Survey: EPSlAOO5 Survey Date: July 21 - 22, 2004Sample Count: 19
Survey Length Weight TotalTaxon Common Name Count Range (mm) Range (g) Weight (g)FISHESCymatogaster aggregata shiner surfperch 70 51-71 3.5-10.0 459.0
Sardinops sagax Pacific sardine 64 40-68 0.5-4.0 90.5
Engraulis mordax northern anchovy 35 41-106 0.5-9.6 35.1Seriphus politus queenfish 20 36-499 0.9-97.6 160.4
Heterostichus rostratus giant kelpfish 13 81-II6 3.6-12.5 93.9
Atherinops affinis topsmelt 9 54-129 0.8-20.1 56.6
Roncador stearnsi spotfin croaker 9 46-76 2.4-7.7 35.2
Porichthys myriaster specklefin midshipman 6 233-378 132-600 1,766.6
Anchoa delicatissima slough anchovy 5 45 0.6 4.5
Cheilotrema saturnwn black croaker 5 43-52 1.3-2.3 9.3
Syngnathus spp. pipefishes 4 137-207 0.8-3.8 8.0
Anchoa compressa deepbody anchovy 3 80-116 5.9-19.9 32.7
Atractoscion nobilis white seabass 2 79-83 7.6-11.4 19.0
Hypsopsetta guttulata diamond turbot 2 141-163 73-124 196.7
unidentified fish unid. fish 2 50-58 1.4-1.6 3.0
Paralichthys cali/omicus California halibut I 54 2.2 2.2
Scomberjaponicus Pacific mackerel 1 89 7.8 7.8
Strongylura exilis California needlefish I 377 39.3 39.3
SHARKSIRAYSGymnura marmorata California butterfly ray II 273-618 191-1212 4,244.2
INVERTEBRATES..
" Pachygrapsus crassipes striped shore crab 3 21-42 2.2-14.8 2I.l
) Total: 266
Survey: EPSIA006 Survey Date: July 28 - 29, 2004Sample Count: 19
Survey Length Weight Total
Taxon Common Name Count Range (mm) Range (g) Weigbt(g)FISHESSeriphus palitus queenfish 95 41-240 1.1-156 530.0
Cymatogaster aggregata shiner surfperch 53 52-109 2.2-25.5 341.2
Heterostichus rostratus giant kelpfish 23 45-II6 1.9-12.9 130.0
Engraulis mordax northern anchovy 22 41-93 0.4-7.8 28.0
Atherinops ajJinis topsmelt 17 55-107 1.2-11.9 86.1
Strongylura exilis California needlefish II 76-372 0.4-55.7 90.4Porichthys myriaster specklefin midshipman 8 285-380 226-410 2,608.8
Anchoa delicatissima slough anchovy 4 65-84 3.4-6.5 17.9
Sardinops sagax Pacific sardine 3 55-72 1.5-5. I 9.4
Anchoa spp. anchovy 2 7.4 7.4
Paralichthys cali/omicus California halibut 2 87- II4 8.6-16.3 24.9
Anchoa compressa deepbody anchovy 1 66 2.9 2.9
Cheilotrema saturnum black croaker I 50 2.9 2.9
Sphyraena argentea California barracuda I 45 0.3 0.3
Syngnathus spp. pipefishes I 175 I.l I.I
SHARKSIRAYSGymnura marmorata California butterfly ray 8 265-368 160-410 1,898.7
Urolophus halleri round stingray 2 160-170 217-278 495.0
Myliobatis cali/ornica bat ray I 254 204.3 204.3
INVERTEBRATESPachygrapsus crassipes striped shore crab 2 25-42 8.4-24.1 32.5
Total: 257
G1-3

Impingement Results
)Encina Power Station Impingement Abundance: Traveling Screen and Bar Rack Survey Data
Survey: EPSlAOO7 Survey Date: August 04 - 05, 2004Sample Count: 19
Survey Length Weight TotalTaxon Common Name Count Range (mm) Range (g) Weight (g)FISHESSeriphus polilUs queenfish 19 43-80 \.4-6.3 63.0Atherinops affinis topsmelt 13 57-100 0.9-9.8 38.0Cymatogaster aggregata shiner surfperch II 55-99 2.9-21.1 77.4Heterostichus rostratus giant kelpfish 3 83-115 5.1-1 \.4 26.6Porichthys myriaster specklefin midshipman 3 294-309 242-331 872.5Hypsopsetta guttulata diamond turbot 2 139-270 69.5-282.5 352.0Strongylura exilis California needlefish 2 62-131 0.1-1.1 \.2Anchoa compressa deepbody anchovy I 104 15.9 15.9Anchoa delicatissima slough anchovy I 92 9,4 9.4Engraulis mordax northern anchovy I 70 4,0 4,0Sardinops sagax Pacific sardine I 57 \.4 1.4Sciaenidae unid, croaker I 25 0.1 0.1S)mgnathus spp. pipefishes I 186 1.4 1.4unidentified fish unid. fish I 315 700 700,0
SHARKSIRAYSGymnura marmorata California butterfly ray 7 252-296 133-213 1,250.8Myliobatis californica bat ray 3 240-250 175.4-183,9 537.3
INVERTEBRATESPachygrapsus crassipes striped shore crab I 25 6,3 6,3
Loxorhynchus crispatus moss crab I 7,3 1.1 1.1Total: 72
Survey: EPSlA008 Survey Date: August 11 - 12, 2004Sample Count: 19
Survey Length Weight Total
Taxon Common Name Count Range (mm) Range (g) Weight (g)FISHESAtherinops affinis topsmelt 375 37-156 0.5-40.8 1,068.2Cymatogaster aggregata shiner surfperch 97 56-109 5.1-29.4 895,0Anchoa compressa deepbody anchovy 43 64-169 3.1-19.9 426.7Seriphus politus queenfish 28 35-167 \.0-62.1 239.2Heterostichus rostratus giant kelpfish 24 73-137 2.9-2 \.6 175.2Sardinops sagax Pacific sardine 17 59-92 2.5-9.3 65.8Syngnathus spp. pipefishes 16 145-210 0.5-2.8 23.3Engraulis mordax northern anchovy 12 54-95 \.7-7.7 37.6Strongylura exilis California need1efish 12 78-297 0.8-20.2 59.6Porichthys myriaster specklefm midshipman 9 53-309 \.9-306.2 1,556,9Leuresthes tenuis California grunion 8 52-71 \.4-2.9 17.9Anchoa delicatissima slough anchovy 2 75-101 4.6-11.1 15,7Cheilotrema satumwn black croaker 2 62-119 3.7-20.7 24.4Hypsopsetta guttulata diamond turbot 2 91-202 8.4-190 198.1Anisotremus davidsonii sargo I 243 34 \.2 34\.2Hyperprosopon argenteum walleye surfperch I 153 96.9 96.9Paralabrax spp. sand bass I 32 0,9 0,9Pleuronichthys verticalis hornyhead turbot I 152 97.3 97.3Roncador steamsi spotfin croaker I 164 57.1 57,1Sciaenidae unid. croaker I 38 2.7 2.7
SHARKSIRAYSGymnura marmorata California butterfly ray 8 259-341 150-297 1,595.1Urolophus halleri round stingray 8 124-242 133-600 2,290.9Myliobatis californica bat ray 9 230-315 11\.6-404.8 2,602.8Platyrhinoidis triseriata thornback I 53 10.2 10.2
INVERTEBRATESPachygrapsus crassipes striped shore crab 3 25.3-36 8,0-21.1 38,7Loxorhynchus crispatus moss crab I I I 0,8 0.8Hemigrapsus oregonensis yellow shore crab 2 18-20 0.9-2.8 3.7Pelia twnida dwarf teardrop crab I 13 \.9 \.9
Total: 686
G1-4

Impingement Results
Encina Power Station Impingement Abundance: Traveling Screen and Bar Rack Survey Dab
Survey: EPSIA009 Survey Date: August 18 - 19,2004Sample Count: 19
Survey Lengtb Weight TotalTaxon Common Name Count Range (mm) Range (g) Weigbt(glFISHESAtherinops affinis topsmelt 18 56-124 1.7-15.8 81.2Heterostichus rostratus giant kelpfish 14 66-158 3.4-33.2 122.2Strongylura exilis California needlefish 13 87-170 0.4-3.7 28.3Sardinops sagax Pacific sardine 10 65-85 3.0-9.4 90.6Cymatogaster aggregata shiner surfperch 5 57-75 5.0-11.3 41.6Se!iphus poUtus queenfish 5 57-70 3.5-5.5 22.9Anchoa delicatissima slough anchovy 2 70-71 3.6-4.4 8.0Hermosilla azurea zebra perch 2 53"260 4.8-600 604.8Paralichthys californicus California halibut 2 81-103 6.9-16.0 22.9Porichthys myriaster specklefin midshipman 2 75-268 5.5-200 205.5unidentified fish unid. fish 2 37-44 2.1-2.6 4.7Hypsoblennius gentilis bay blenny 1 95 14.7 14.7Hypsopsetta guttulata diamond turbot I 136 57.9 57.9Leuresthes tenuis California grunion 1 146 19.9 19.9Syngnathus spp. pipefishes 1 184 2.5 2.5
SHARKSIRAYSGymnura marmorata California butterfly ray 2 270-288 162-190 352.2Urolophus halleri round stingray 2 133-230 95-123 218.0Myliobatis californica bat ray 1 340 550 550.0Ophichthus zophochir yellow snake eel 1 420 51.8 51.8Platyrhinoidis triseriata thomback 1 630 1,500 1,500.0
INVERTEBRATESPachygrapsus crassipes striped shore crab 2 22-30 6.1-15.6 21.7Pyromaia tuberculata tuberculate pea crab 1 15 3.2 3.2Octopus spp. octopus
Total: 89
m!'~~~; '" ";lfir~'i'~~'m_
Survey: EPSlA010 Survey Date: August 25 - 26, 2004Sample Count: 19
Survey Lengtb Weight TotalTaxon Common Name Count Range (mm) Range (g) Weigbt(g)FISHESAnchoa compressa deepbody anchovy 24 39-115 0.7-16.1 110.5Seriphus politus queenfish 13 46-121 1.5-20.2 80.6Atherinops qifinis topsmelt 9 64-133 2.1-17.0 68.0Heterostichus rostratus giant kelpfish 9 74-125 3.1-15.8 60.8Sardinops sagax Pacific sardine 8 8.0 36.8Cymatogaster aggregata shiner surfperch 7 64-80 6.3-11.3 60.7Leuresthes tenuis California grunion 6 59-81 1.6-3.4 13.4Engraulis mordax northern anchovy 3 54-56 1-1.8 4.4Porichthys myriaster specklefm midshipman 3 275-314 180-350 725.8Hermosilla azurea zebra perch 2 35-70 1.1-8.1 9.2Hypsopsetta guttulata diamond turbot 2 188-216 39.1-254 293.4Strongylura e~;ilis California needJefish 2 105-508 1.2-290 291.2Paralabrax nebulifer barred sand bass I 57 2.6 2.6Roncador stearnsi spotfm croaker I 280 500 500.0unidentified fish unid. fish I 20.1 20.1
SHARKSIRAYSGymnura marmorata California butterfly ray 3 260-300 145-220 546.2Urolophus halleri round stingray 3 125-147 89.4-148 353.4Myliobatis californica bat ray 2 208-240 148-185 332.4Rhinobatos productus shove1nose guitarfish 1 410 300 300.0
INVERTEBRATESPachygrapsus crassipes striped shore crab 4 18.5-39 0.8-24.3 25.1Lophoponopeus spp. black-clawed crabs 1 14 1.3 1.3
Total: 105
G1-5

Impingement Results
Encina Power Station Impingement Abundance: Traveling Screen and Bar Rack Survey Data
Survey: EPSIAOll Survey Date: September 01 - 02, 2004Sample Count: 19
Survey Lengtb Weigbt TotalTaxon Common Name Count Range (mm) Range (g) Weight (g)FISHESHeterostichus rostraJus giant kelpfish 10 80-97 3.8-10.1 60.6Anchoa delicatissima slough anchovy 4 60-73 2.1-4.0 10.4Leuresthes tenuis California grunion 4 65-112 2.2-13.5 25.7Seriphus politus queenfish 3 55-63 2.3-5.9 11.9Cymatogaster aggregata shiner surfperch 2 68-70 8.2-8.9 17.1Paralichthys californicus California halibut 2 59-118 3.1-25.8 28.9Anchoa compressa deepbody anchovy I 79 7.4 7.4Paralabrax spp. sand bass I 39 1.1 1.1Porichthys myriaster specklefin midshipman I 400 550 550.0Sardinops sagax Pacific sardine I 75 3.6 3.6Strongylura exilis California needlefish I 1.8 1.8SyngnaJhus spp. pipefishes I 152 0.6 0.6unidentified fish, damaged unid. damaged fish I 137.4 137.4
SHARKSIRAYSGymnura marmoraJa California butterfly ray 327 233.3 233.3MyliobaJis californica bat ray 340 400 400.0
INVERTEBRATESPachygrapsus crassipes striped shore crab I 25 4.0 4.0Taliepus nuttallii globose kelp crab I II 0.7 0.7
Total: 36
--,
'J Survey: EPSIA012 Survey Date: September 08 - 09, 2004Sample Count: 19
Survey Length Weigbt TotalTaxon Common Name Count Range (mm) Range (g) Weigbt(g)FISHESAnchoa compressa deepbody anchovy 93 42-94 0.2-12.3 301.0Leuresthes tenuis California grunion 43 54-73 1.0-5.0 94.7Seriphus politus queenfish 29 32-155 0.6-53.0 218.0Heterostichus rostratus giant kelpfish 24 60-122 2.1-16.2 172.7Engraulis mordax northern anchovy 15 52-71 1.2-4.1 29.5Cymatogaster aggregaJa shiner surfperch 7 53-95 4.9-25.0 79.0Porichthys notatus plainfin midshipman 5 53-400 1.6-420 723.6Sphyraena argentea California barracuda 5 48-73 0.6-3.3 10.2Xenistius califoriensis saiema 4 31-55 0.7-2.3 4.9Paralabrax nebulifer barred sand bass -- 3 46-124 2.0-28.4 43.5Sardinops sagax Pacific sardine 3 68-75 3.5-4.1 11.2Cheilotrerna saJurnum black croaker 2 35-55 1.2-4.3 5.5Phanerodonfurcatus white surfperch 2 85-93 19.7-20.0 39.7Porichthys myriaster specklefm midshipman 2 54-360 1.8-410 411.8Atherinops qffinis topsmelt I 103 9.9 9.9Hypsopsetta guttulaJa diamond turbot I 231 380 380.0Paralichthys californicus California halibut I 105 19.0 19.0Pleuronectiformes unid. flatfishes I 54.7 .54.7Roncador stearnsi spotfm croaker I 250 380 380.0Strongylura exilis California needlefish I 138 2.0 2.0SyngnaJhus spp. pipefishes I 133 0.9 0.9
SHARKSIRAYSGymnura marmorata California butterfly ray 4 254-599 137-265 708.2Myliobatis californica bat ray I 110 110.0Urolophus halleri round stingray I 200 200.0
INVERTEBRATESHemigrapsus oregonensis yellow shore crab I 18 2.5 2.5
Total: 251
G1-6
Impingement Results
Encina Power Station Impingement Abundance: Traveling Screen and Bar Rack Survey Data
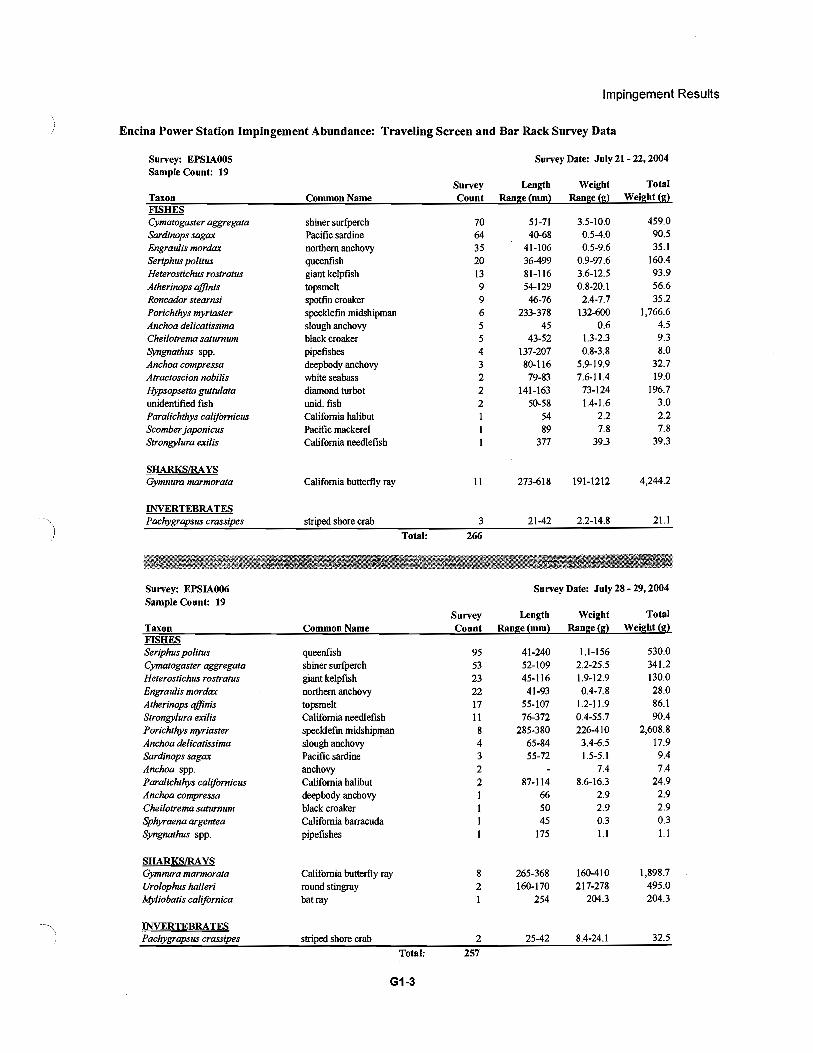
Survey: EPSIA013 Survey Date: September 15· 16, 2004Sample Count: 19
Survey Length Weight TotalTaxon Common Name Count Range (mm) Range (g) Weight(g)FISHESCymatogaster aggregata shiner surfperch 24 55-100 5.1-29.6 216.5Leuresthes tenuis California grunion 15 48-124 0.9-15.8 72.3Anchoa delicatissima slough anchovy 10 40-70 0.5-3.5 22.4Anchoa compressa deepbody anchovy 9 58-86 2.0-5.7 30.9Heterostichus rostratus giant kelpfish 8 82-124 3.4-15.8 59.2Sphyraena argentea California barracuda 4 81-90 2.8-3.6 13.3Trachurus symmetricus jack mackerel 4 36-40 0.6-0.9 3.0Atherinops affinis topsmelt 3 79-101 3.9-9.8 19.5Strongylura exi/is California needlefish 3 184-410 4.0-64.8 89.5Porichthys myriaster specklefm midshipman 2 57-229 1.8-247 248.8Sardinops sagax Pacific sardine 2 67-73 3.1-3.2 6.3Seriphus politus queenfish 2 71-73 4.0-5.2 9.2Xenistius califoriensis salema 2 37-40 0.8-1.2 2.0Brachyistius frenatus kelp surfperch I 95 28.9 28.9Cheilotrema saturnum black croaker I 43 0.6 0.6Engraulis mordax northern anchovy I 72 2.6 2.6Paralichthys californicus California halibut I 60 3.1 3.1Umbrina roncador yellowfin croaker I 37 1.0 1.0unidentified fish, damaged unid. damaged fish I 20.3 20.3
SHARKSIRAYSMyliobatis californica bat ray 2 299-422 201-298 499.0
INVERTEBRATESPortunus xantusii Xantus' swimming crab 5 30-58 2.5-17.5 33.2Pachygrapsus crassipes striped shore crab 2 18-35 0.5-24.8 25.3Pugettia spp. kelp crabs I 22 4.1 4.1
Total: 104
G1-7
Impingement Results
Encina Power Station Impingement Abundance: Traveling Screen and Bar Rack Survey Data
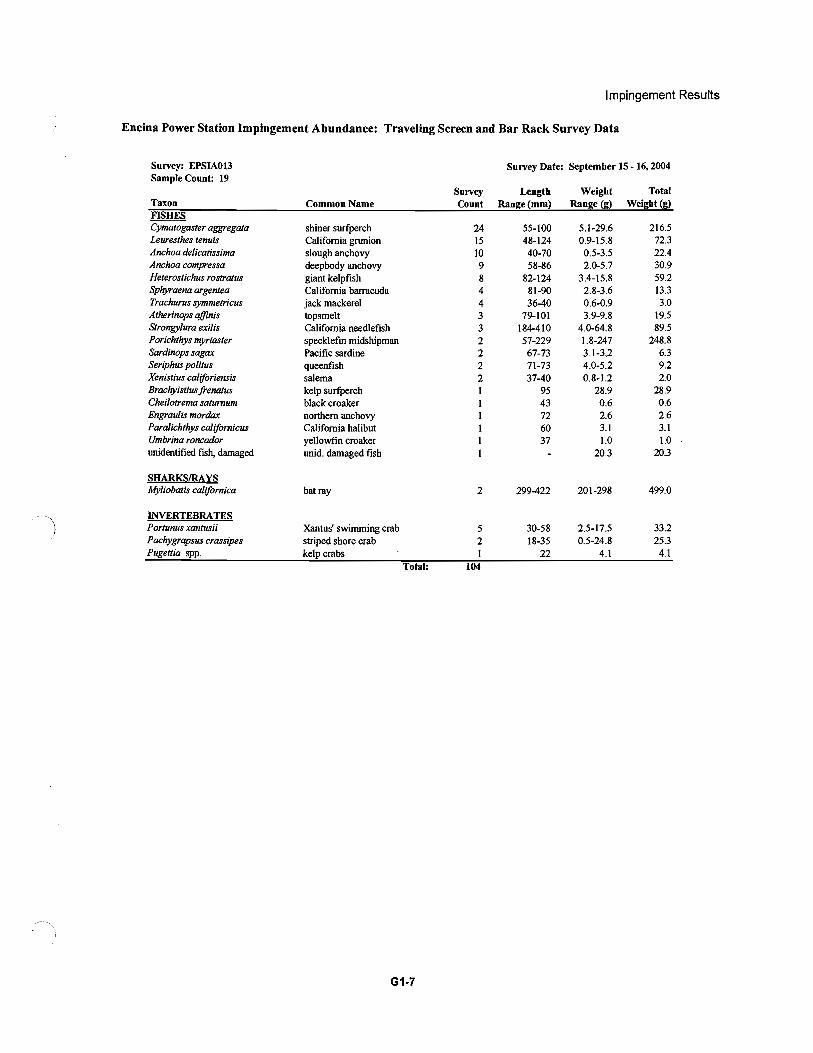
Survey: EPSIA014 Survey Date: September 22 - 23, 2004Sample Count: 19
Survey Length Weight TotalTaxon Common Name Count Range (mm) Range (g) Weight (g)FISHESAnchoa compressa deepbody anchovy 52 22-94 0.8-9.3 119.4Seriphus po/itus queenfish 34 22-82 0.1-8.4 102.1Leuresthes tenuis California grunion 20 49-115 \.0-17.1 89.4Cymatogaster aggregata shiner surfperch 17 56-90 5.6-18.3 162.5Anchoa de/icatissima slough anchovy 5 50-76 1.8-4.0 12.3Sardinops sagax Pacific sardine 4 62-80 2.8-10.6 20.3Anisotremus davidsonii sargo 3 42-72 \.9-10.6 16.9Heterostichus rostratus giant kelpfish 3 90-98 5.2-7.3 17.7Roncador stearnsi spotfin croaker 3 90-93 9.6-17.7 42.3Xenistius califoriensis salema 3 30-41 0.6-\.9 4.2Atractoscion nobilis white seabass 2 36-75 0.5-3.4 3.9Cheilopogon pinnatibarbatus spotted flyingfish 2 310-313 291-310 601.1Cheilotrema saturnum black croaker 2 62-87 5.9-14.4 20.3Engraulis mordax northern anchovy 2 57-58 1.1-1.5 2.6Paralabrax nebulifer barred sand bass 2 43-50 1.5-3.0 4.5Sphyraena argentea California barracuda 2 72-111 2.3-8.3 10.6Strongylura exilis California needlefish 2 118-225 1.7-12.5 14.2Umbrina roncador yellowfin croaker 2 50-55 2.5-3.6 6.1Atherinopsis californiensis jacksmelt I 125 22.1 22.1Menticirrhus undulatus California corbina I 108 18.9 18.9Oxylebius pictus painted greenling I 66 4.8 4.8Porichthys myriaster specklefin midshipman I 163 4 \.2 4 \.2Syngnathus spp. pipefishes I 505 50.0 50.0
SHARKSIRAYSGymnura marmorata California butterfly ray 340 330 330.0My/iobatis californica bat ray 297 375 375.0
lNVERTEBRATESLoligo opalescens market squid 3 75-129 7.4-10.8 26.2Cal/inectes spp. crab I 26 13.8 13.8Pachygrapsus crassipes striped shore crab I 28 10.1 10.1Pyromaia tuberculata tuberculate pea crab I 12
Total: 173
G1-8

Impingement Results
) Encina Power Station Impingement Abundance: Traveling Screen and Bar Rack Survey Data
Survey: EPSIA015 Survey Date: September 29 .30, 2004Sample Count: 19
Survey Length Weight TotalTaxon Common Name Count Range (mm) Range (g) Weight (g)FISHESSeriphus politus queenfish 28 35-78 0.5-7.0 77.4Leuresthes tenuis California grunion 16 57-150 1.5-36.0 136.0Engrau/is mordax northern anchovy 11 33-116 0.2-14.0 24.7Anchoa compressa deepbody anchovy 10 45-81 0.5-5.0 22.0Hyperprosopon argenteum walleye surfperch 10 49-85 2.0-15.0 80.5Xenistius califoriensis salema 10 35-63 0.5-4.0 19.5Anchoa delicatissima slough anchovy 5 56-77 1.0-5.0 14.0Anisotremus davidsonii sargo 4 38-58 1.0-5.0 9.5Heterostichus rostratus giant kelpfish 4 95-121 4.0-22.0 45.0Sphyraena argentea California barracuda 4 88-115 4.0-10.0 24.0Strongylura exilis California needlefish 4 139-325 0.7-42.0 54.7Atherinops affinis topsmelt 2 64-78 3.0-6.0 9.0Embiotoca jacksoni black surfperch 2 164-175 170-200 370.0Paralichthys califomicus California halibut 2 120-133 20.0-35.0 55.0Sardinops sagax Pacific sardine 2 71-75 2.0-3.5 5.5Atherinopsis californiensis jacksmelt I 181 47.0 47.0Atractoscion nobilis white seabass I 145 45.0 45.0Genyonemus lineatus white croaker 1 100 2.1 2.1Paralabrax macu/atofasciatus spotted sand bass 1 81 10.5 10.5Peprilus simillimus Pacific butterfish 1 130 50.0 50.0Roncador stearnsi spotfm croaker 1 115 20.0 20.0
SHARKSIRAYSGymnura marmorata California butterfly ray 292 190 190.0Urolophus halleri round stingray 272 270 270.0
INVERTEBRATESPortunus xantusii Xantus' swimming crab 7 18-33 2.5-9.0 36.2Cancer antennarius brown rock crab 2 11-25 0.2-1.7 1.9Lophoponopeusfrontalis molarless crestleg crab 2 11-13 0.4 0.8Cancer praductus red rock crab 1 26 3.4 3.4Loligo opalescens market squid I 70 7.0 7.0Panulirus interruptus California spiny lobster I 66.0 66.0Pyromaia tubercu/ata tuberculate pea crab 1 9 0.6 0.6
Total: 137
G1-9

Impingement Results
Encina Power Station Impingement Abundance: Traveling Screen and Bar Rack Survey Data
Survey: EPSlAOI6 Survey Date: October 06 - 07, 2004Sample Count: 19
Survey Lengtb Weigbt TotalTaxon Common Name Count Range (mm) Range (g) Weigbt(g)FISHESAtherinopsidae silverside 57 48-130 0.5-20.8 289.5Seriphus poUtus queenfish 47 35-98 1.0-14.8 222.3Anchoa compressa deepbody anchovy 35 45-95 1.0-10.7 141.8Cymatogaster aggregata shiner surfperch 19 57-82 5.0-13.7 175.2Engraulis mordax northern anchovy 17 50-103 1.2-8.9 30.5Xenistius califoriensis salema 17 27-58 0.5-4.0 22.6Anchoa delicatissima slough anchovy 5 53-85 1.0-6.0 14.0Sphyraena argentea California barracuda 4 96-435 3.0-110 139.9Porichthys myriaster specklefin midshipman 3 87-390 7.2-460 822.2Heterostichus rostratus giant kelpfish 2 72-275 1.0-195 196.0Paralichthys californicus California halibut 2 128-133 39.0-40.0 79.0Strongy/ura exilis California needlefish 2 73-82 0.3 0.7Leuresthes tenuis California grunion 1 68 2.0 2.0Paralabrax macu/atofasciatus spotted sand bass 1 29 1.5 1.5Sardinops sagax Pacific sardine 1 66 3.0 3.0
SHARKSIRAYSUr%phus holleri round stingray 3 60-154 13.6-195 368.6Myliobatis californica bat ray 2 294 400 400.0
INVERTEBRATESLoligo opalescens market squid 11 47-66 4.0-10.0 70.6Portunus xantusii Xantus' swimming crab 10 10-50 0.5-9.0 38.9
~, Taliepus nuttallii globose kelp crab 2 5-6 0.5 1.0
) Cancer spp. cancer crabs I 24 2.6 2.6Pachygrapsus crassipes striped shore crab 1 12 2.5 2.5Pachygrapsus spp. shore crab I 15 0.9 0.9Pugettia producta northern kelp crab 1 8Pyromaia tubercu/ata tuberculate pea crab I 6
Total: 246
G1·10

Impingement Results
Encina Power Station Impingement Abundance: Traveling Screen and Bar Rack Survey Data
Survey: EPSlA017 Survey Date: October 13 - 14, 2004Sample Count: 13
Survey Length Weight TotalTaxon Common Name Count Range (mm) Range (g) Weight (g)FISHESAtherinopsidae silverside 5 55-65 1.2-3.0 2.0Atractoscion nobilis white seabass 2 252 140-144 1.2Engraulis mordax northern anchovy 2 48-51 1.2 2.4Seriphus politus queenfish 2 43-65 1.1-3.9 1.3Anchoa compressa deepbody anchovy I 56 2.0 4.6Anchoa delicatissima slough anchovy I 58 1.2 3.1Cymatogaster aggregata shiner surfperch I 74 8.1 8.1Sardinops sagax Pacific sardine I 77 3.1 11.9unidentified fish unid. fish I 4.6 284.0Xenistius califoriensis salema I 44 1.3 5.0
INVERTEBRATESPortunus xantusii Xantus' swimming crab 20 23-41 2.6-12.9 113.4Pugettia producta northern kelp crab I 80 5.4 5.4Taliepus nuttallii globose kelp crab
Total: 38
ifillU1EIUllilillll!IIR nil E 'r_· I: I •. ·'UUJIfIlIIIIIJ IUIII1IISurvey: EPSlA018 Survey Date; October 20 - 21, 2004Sample Count: 13
Survey Length Weight TotalTaxon Common Name Count Range (mm) Range (g) Weight (g)FISHESAtherinopsidae silverside 114 52-193 1.4-32.0 905.9Seriphus politus queenfish 35 28-77 0.4-7. I 61.0Xenistius califoriensis salema 32 30-50 0.4-2.0 30.0Anchoa compressa deepbody anchovy 18 40-68 1.3-3.7 41.0Engraulis mordax northern anchovy 16 54-70 1.8-4.0 42.6Brachyistiusfrenatus kelp surfperch 14 62-102 6.0-25.0 135.6Atractoscion nobilis white seabass 4 223-243 135.2-185.0 640.2Lepomis cyanellus green sunfish 4 104-126 26.0-68.0 194.7Ameiurus natalis yellow bullhead 3 162-175 65.0-80.0 220.0Paralichthys califomicus California halibut 3 110-151 21.0-45.0 111.0Strongylura exilis California needJefish 3 370-397 67.0-84.0 221.0Acanthogobiusflavimanus yellowfin goby 2 115-148 18.0-37.2 55.2Anisotremus davidsonii sargo 2 44-69 1.8-7.0 8.8Anchoa spp. anchovy I 6.8 6.8Cymatogaster aggregata shiner surfperch 1 84 7.5 7.5Hypsopsetta guttulata diamond turbot I 125 53.0 53.0Paralabrax c1athratus kelp bass I 48 2.0 ' 2.0Porichthys myriaster specklefm midshipman I 47 1.0 1.0Sardinops sagax Pacific sardine 1 65 3.0 3.0Sphyraena argentea California barracuda 1 72 2.0 2.0
SHARKSIRAYSMyliobatis califomica bat ray 300 200 200.0
INVERTEBRATESPortunus xantusii Xantus' swimming crab 6 21-46 2.1-12.4 38.4Pugettia producta northern kelp crab 6 4-15 0.1-1.4 2.8Loxorhynchus spp. spider crabs 2 5 0.1-0.5 0.6Brachyuran unid. unidentified crab 1 8 0.4 0.4Caridean unid. unidentified shrimp I 159 28.0 28.0
Total: 274
G1-11

Impingement Results
Encina Power Station Impingement Abundance: Traveling Screen and Bar Rack Survey Data
Survey: EPSlA019 Survey Date: October 27 • 28, 2004Sample Count: 13
Survey Length Weight TotalTaxon Common Name Count Range (mm) Range (g) Weight (g)FISHESAtherinopsidae silverside 64 52-134 1.0-27.0 256.5Xenistius califoriensis salema 41 19-45 0.3-1.7 43.8Seriphus palitus queenfish 32 32-78 1.3-6.4 94.4Lepomis cyanellus green sunfish 10 95-117 30.5-77.5 442.8Micropterus salmoides large mouth bass 9 49-57 2.4-3.4 26.9Cymatogaster aggregata shiner surfperch 8 63-82 5.9-11.6 66.0Engraulis mordax northern anchovy 8 59-64 2.1-2.7 19.0Strongylura exilis California needlefish 5 392-577 70.0-230 635.0Anchoa delicatissima slough anchovy 4 42-66 1.7-7.1 22.2Lepomis macrochirus bluegill 3 34-121 1.8-55.5 111.3Anchoa compressa deepbody anchovy 2 60-77 2.5-5.7 8.2Paralichthys califamicus California halibut 2 42-44 1.2-1.3 2.5PhanerodonjiJrcatus white surfperch 2 89-119 13.5-27.4 40.9Sphyraena argentea California barracuda 2 48-63 0.9-1.6 2.5Tilapia spp. tilapia 2 27-46 2.4-4.2 6.6Trachurus symmetricus jack mackerel 2 37-38 1.1 2.2Rhacochilus vacca pile surfperch I 263 465 465.0Heterostichus rostratus giant kelpfish I 96 5.4 5.4Porichthys myriaster specklefm midshipman I 342 221 221.0PorichJhys notatus plainfm midshipman I 385 460 460.0Syngnathus spp. pipefishes I 161 1.3 1.3unidentified fish, damaged unid. damaged fish I 16.0 16.0
SHARKSIRAYSGymnura marmorata California butterfly ray 4 272-550 165-1,100 1,775.0
)INVERTEBRATESPortunus xantusii Xantus' swimming crab 31 7-41 0.9-13.9 195.5Octopus bimaculatus California two-spot octopus 4 5.2-25.3 58.1Loxorhynchus crispotus moss crab I 7 0.3 0.3Pugettia spp. kelp crabs I 2 0.1 0.1
Total: 243
Survey: EPSlA020 Survey Date: November 03 - 04, 2004Sample Count: 13
Survey Length Weight TotalTaxon Common Name Count Range (mm) Range (g) Weight (g)FISHESAnchoa compressa deepbody anchovy 35 37-85 0.9-7.1 101.6Engraulis mordax northern anchovy 30 57-76 1.9-4:6 -85;8-
Atherinopsidae silverside 20 50-147 1.1-33.0 148.5Seriphus palitus queenfish 9 34-66 0.8-4.3 19.8Xenistius califoriensis salema 2 37-42 0.9-1.3 2.1Cymatogaster aggregata shiner surfperch I 70 8.7 8.7Trachurus symmetricus jack mackerel I 2.0 2.0
SHARKSIRAYSGymnura marmorata California butterfly ray 304 120 120.0
INVERTEBRATESPortunus xantusii Xantus' swimming crab 8 21-29 3.8-9.7 58.4Brachyuran unid. unidentified crab I 17 2.8 2.8Crangon spp. bay shrimp I 107 20.9 20.9Loligo opi:llescens market squid IRhithropanopeus harrisii Harris' mud crab I 30 18.0 18.0
Total: III
G1-12

Impingement Results
Encina Power Station Impingement Abundance: Traveling Screen and Bar Rack Survey Data
Survey: EPSIA021 Survey Date: November 10 - 11, 2004Sample Count: 13
Survey Length Weight TotalTaxon Common Name Count Range (mm) Range (g) Weight (g)FISHESAtherinopsidae silverside 14 62-164 2.0-21.3 76.0Seriphus poUlus queenfish 5 46-82 1.4-7. I 13.9Scorpaena guttata spotted scorpinfish I 110 38.0 38.0Xenistius califoriensis salema I 40 I.I I.I
INVERTEBRATESPortunus xanlusii Xantus' swimming crab 26 15-60 0.9-15.7 193.5Pachygrapsus crassipes striped shore crab 2 12-27 0.5 0.5Cye/oxonthops navemdentatus ninetooth pebble crab I 19 2.6 2.6
Total: 50
•• J 7 Ja ...1Z7LEIIZZ71I IdE III 112iSt-
Survey: EPSlA022 Survey Date: November 17 -18, 2004Sample Count: 13
Survey Length Weight TotalTaxon Common Name Count Range (mm) Range (g) Weight (g)
FISHESAtherinopsis californiensis jacksmelt 29 45-146 0.8-33.0 123.9Seriphus poUlus queenfish 18 37-89 0.8-11.1 41.6Atherinops affinis topsmelt 4 70-124 2.5-17.6 27.3Hyperprosopon argenteum walleye surfperch 2 135-160 61.5-101 162.0Paralichthys califomicus California halibut 2 49-132 1.8-35.6 37.3Anchoa compressa deepbody anchovy I 66 3.5 3.5Cheilotrema saturnum black croaker I 127 38.6 38.6Leuresthes tenuis California grunion I 63 1.7 1.7Sarda chiUensis Pacific bonito I 336 500 500.0Xenistius califoriensis salema I 48 2.0 2.0
SHARKSIRAYSUrolophus holleri round stingray 80 27.7 27.7
INVERTEBRATESPortunus xontusii Xantus' swimming crab 9 16-36 2.0-17.0 68.4Pachygropsus crassipes striped shore crab 3 32-35 15.0-18.8 49.5
Total: 73
G1-13

Impingement Results
Encina Power Station Impingement Abundance: Traveling Screen and Bar Rack Survey Data
Survey: EPSIA023 Survey Date; November 22 • 23, 2004
Sample Count: 13Survey Length Weight Total
Taxon Common Name Count Range (mm) Range (g) Weight (g)
FISHESLeuresthes tenuis California grunion 12 59-155 \.6-3 \.2 70.1
Seriphus politus queenfish II 30-82 0.7-6.7 22.3
Anchoa compressa deepbody anchovy 5 55-70 1.5-4.8 12.9
Atherinopsis californiensis jacksmelt 3' 62-160 2.3-45.3 56.1
Atractoscion nobilis white seabass 2 255-291 200-302 502.1
Engraulis mordax northern anchovy 2 65 2.0-2.9 4.9
Hypsoblennius spp. blennies I 50 3.5 3.5
Mentici"hus undulatus California corbina I 72 5.1 5.1
Micrometrus minimus dwarf surfperch I 70 8.3 8.3
Paralabrax clathratus kelp bass I 40 \.7 \.7
Paralichthys califomicus California halibut I 50 \.7 \.7
unidentified fish, damaged unid. damaged fish I 250 200 200.0
Xenistius califoriensis salema I 47 \.8 \.8
SHARKSIRAYSMyliobatis califomica bat ray 400 460 460.0
INVERTEBRATESPortunus xantusii Xantus' swimming crab 34 18-46 2.4-18.2 154.9
Cancer magister dungeness crab IPugettia richii cryptic kelp crab I 12 1.3 I.3Pugettia spp. kelp crabs I
Total: 80
Survey: EPSIA024 Survey Date: December 01 - 02, 2004Sample Count: 19
Survey Length Weight Total
Taxon Common Name Count Range (mm) Range (g) Weight (g)
FISHESAnchoa compressa deepbody anchovy 801 50-112 0.7-12.1 2,47 \.4
Xenistius califoriensis salema 514 40-60 U-5.3 1,404.0
Seriphus politus queenfish 320 29-100 0.5-19.3 1,94\.7
Cymatogaster aggregata shiner surfperch 212 61-94 5.1-18.1 2,343.6
Leuresthes tenuis California grunion 65 31-125 0.3-18.5 265.2
unidentified fish, damaged unid. damaged fish 6Anisotremus davidsonii sargo 4 51-70 2.9-8.3 22.5
Atherinops qffinis topsmelt 4 57-118 1.2-14.2 19.2
Atherinopsis californiensis jacksmelt 4 63-108 2.2-10.5 19.8
Sardinops sagax Pacific sardine 3 82-91 4.8-7.5 17.2
Genyonemus lineatus white croaker I 115 30.0 30.0
Heterostichus rostratus giant kelpfish I 65 5.3 5.3
Hypsoblennius gentilis bay blenny I 56 2.6 2.6
Hypsoblennius gilberti rockpool blenny I 70 4.3 4.3
Mentici"hus undulatus California corbina I 74 5.0 5.0
Paralichthys califomicus California halibut I 160 60.1 60.1
Sphyraena argentea California barracuda I 115 7.4 7.4
Strongylura exilis California needlefish I 462 115.1 115.1
Syngnathus spp. pipefishes I 249 3.0 3.0
Umbrina roncador yellowfin croaker I 67 5.4 5.4
SHARKSIRAYSPlatyrhinoidis triseriata thornback 2 181-192 305-342 647.0
Urolophus ha/leri round stingray 2 149-155 183-210 393.0
INVERTEBRATESPortunus xantusii Xantus' swimming crab 13 20-65 2.7-23.6 1l0.9
Loligo opalescens market squid 4 88-114Pachygrapsus crassipes striped shore crab 3 6-35 0.2-19.5 31.3
Pugettia spp. kelp crabs 1 9 0.3 0.3
Total: 1,968
G1-14

Impingement Results
\
) Encina Power Station Impingement Abundance: Traveling Screen and Bar Rack Survey Data
Survey: EPSIA025 Survey Date: December 08 - 09, 2004Sample Count: 19
Survey Lengtb Weigbt TotalTaxon Common Name Count Range (mm) Range (g) Weight (g)FISHESLeuresthes tenuis California grunion 96 49-130 1.1-26.5 440.8Seriphus politus queenfish 90 27-175 0.5-58.9 512.7Anchoa compressa deepbody anchovy 71 53-111 0.9-12.6 223.8Xenistius califoriensis salema 23 20-70 0.9-5.6 51.4Cymatogaster aggregata shiner surfperch 16 65-105 7.1-25.1 223.8Sardinops sagax Pacific sardine 10 73-108 3.7-13.3 70.9Atherinops qffinis topsmelt 7 63-140 2.2-11.0 30.7unidentified fish, damaged unid. damaged fish 4 14.8 14.8Strongylura exilis California needlefish 2 455-482 120-125 245.0Chromis punctipinnis blacksmith I 105 27.0 27.0Micrometrus minimus dwarfsurfperch I 54 4.4 4.4Paraclinus integripinnis reef finspot I 65 3.7 3.7
SHARKSIRAYSMyliobatis califomica bat ray 305 400 400.0Platyrhinoidis triseriata thornback 490 650 650.0
INVERTEBRATESPortunus xantusii Xantus' swimming crab 14 23-60 3.0-19.0 101.5Pachygrapsus crassipes striped shore crab 4 5-40 0.1-20.9 29.7Pugettia spp. kelp crabs 2 10-13 0.4-1.1 1.5Octopus spp. octopus I 200 200.0
--. Pyromaia tuberculata tuberculate pea crab I 22 2.3 2.3
) Total: 346I
Survey: EPSlA026 Survey Date: December 15 - 16, 2004Sample Count: 19
Survey Lengtb Weigbt TotalTaxon Common Name Count Range (mm) Range (g) Weigbt(g)FISHESLeuresthes tenuis California grunion 99 20-124 0.6-21.2 341.8Seriphus politus queenfish 44 47-102 1.4-13.5 268.2Xenistius califoriensis salema 28 38-57 1.1-3.5 55.3Cymatogaster aggregata shiner surfperch II 64-83 7.8-16.5 112.9Atractoscion nobilis white seabass 8 229-295 150-310 1,655.0Engraulis mordax northern anchovy 6 38-109 0.5-13.6 24.1Anchoa compressa deepbody anchovy 5 55-92 1.0-8.6 15.4Atherinops affinis topsmelt 2 53-84 1.4-6.2 7.6Chromis punctipinnis blacksmith I 39 1.0 1.0Hyperprosopon argenteum walleye surfperch I 140 75.4 75.4
Sardinops sagax Pacific sardine I 86 4.1 4.1Umbrina roncador yellowfin croaker I 94 9.7 9.7
INVERTEBRATESPortunus xantusii Xantus' swimming crab 15 25-83 3.6-11.0 103.1Pachygrapsus crassipes striped shore crab 3 9-42 0.5-28.0 33.6Loligo opalescens market squid I 52 24.1 24.1Pugettia spp. kelp crabs I 9 0.5 0.5
Total: 227
G1-15

Impingement Results
Encina Power Station Impingement Abundance: Traveling Screen and Bar Rack Survey Data
Survey: EPSIA027 Survey Date: December 20 - 21, 2004Sample Count: 19
Survey Lengtb Weight TotalTaxon Common Name Count Range (mm) Range (g) Weight (g)FISHESSeriphus palitus queenfish 25 23-95 0.5-11.7 102.4Anchoa compressa deepbody anchovy 16 40-112 0.8-14.3 93.7Leuresthes tenuis California grunion 10 57-113 1.5-10.3 37.5Atherinopsis californiensis jacksmelt 6 62-133 2.4-23.6 37.3Atherinopsidae silverside 3 73-105 2.3-8.3 13.5Sardinops sagax Pacific sardine 2 80-89 4.5-5.7 10.2Anchaa delicatissima slough anchovy I 68 3.3 3.3Atractoscion nobi/is white seabass I 290 265 265.0Hyperprosopon argenteum walleye surfperch I 169 115 115.0Xenistius califoriensis salema I 37 \.0 \.0
INVERTEBRATESPortunus xantusii Xantus' swimming crab 17 23-61 2.8-19.6 166.1Cancer spp. cancer crabs I 26 28.0 28.0Pachygrapsus crassipes striped shore crab I 15 2.2 2.2Pugettia spp. kelp crabs I 11 1.4 1.4
Total: 86
r ... n 4 RT'm ...... ilL '11 -Survey: EPSIA028 Survey Date: December 29 - 30, 2004Sample Count: 19
Survey Lengtb Weight TotalTaxon Common Name Count Range (mm) Range (g) Weigbt (g)
"-
')FISHESAtherinopsidae silverside 721 43-145 1.2-28.2 2,746.2Xenistius califoriensis salema 283 39-59 0.5-3.0 529.6Anchaa compressa deepbody anchovy 57 19-105 0.3-10.0 204.5Cymatogaster aggregata shiner surfperch 29 70-110 7.9-21.3 409.1Sardinops sagax Pacific sardine 21 72-85 2.8-5.2 83.7Seriphus politus queenfish 8 40-140 0.9-3 \.6 67.2Strongylura exilis California needlefish 5 400-508 79.4-160 532.0Paralabrax c/athratus kelp bass 2 45-73 1.7-7.2 8.9Syngnathus spp. pipefishes 2 171-194 1.4-2.4 3.8Atherinops affinis topsmelt IChub unid. unid. chub I 75 7.3 7.3Citharichthys stigmaeus speckled sanddab I 69 4.6 4.6Hypsopsetta guttulata diamond turbot I 225 250 250.0Lepamis spp. sunfishes I 102 29.9 29.9Micrometrus minimus dwarfsurfperch I 56 4.5 4.5Paralichthys californicus California halibut I 65 3.0 3.0Phanerodonfurcatus white surfperch I 69 9.4 9.4Porichthys nryriaster specklefin midshipman I 73 3.3 3.3
SHARKSIRAYSGymnura marmorata California butterfly ray 6 337-478 425-1,100 4,395.0Myliobatis californica bat ray 3 321-500 255-500 1,135.0
INVERTEBRATESCancer spp. cancer crabs 18 16-33 0.1-2.3 18.7Pachygrapsus crassipes striped shore crab 8 10-31 0.2-9.5 26.8Portunus xantusii Xantus' swimming crab 8 21-58 0.2-24.9 55.4Pugettia spp. kelp crabs 5 5-22 0.1-4.1 7.4Loligo opalescens market squid 3 78-100 19.4-34.7 80.8Taliepus nuttallii globose kelp crab 2 7-8 0.2-0.5 0.7Brachyuran unid. unidentified crab I
Total: 1,191
G1-16

Impingement Results
Encina Power Station Impingement Abundance: Traveling Screen and Bar Rack Survey Data
Survey: EPSlA029 Survey Date: January 05 - 06, 2005Sample Count: 19
Survey Lengtb Weigbt TotalTaxon Common Name Count Range (mm) Range (g) Weigbt(g)FISHESAtherinops affinis topsrnelt 344 48-137 0.9-33.5 2,151.8Leuresthes tenuis California grunion 60 53-159 1.2-36.4 361.6Xenistius califoriensis salerna 42 41-55 1.1-3.3 80.9Cymatogaster aggregata shiner surfperch 14 78-100 6.5-27.2 240.6
Anchoa delicatissima slough anchovy 10 55-81 1.6-4.4 24.8
Strongylura exilis California needlefish 10 408-563 90.0-270 1,620.0unidentified fish, damaged unid. damaged fish 10 50-65 0.4-2.4 26.5Sardinops sagax Pacific sardine 7 44-88 0.7-4.7 25.1
Anisotremus davidsonii sargo 4 48-81 2.5-11.6 30.1Anchoa compressa deepbody anchovy 3 60-100 2.0-12.2 23.7Seriphus politus queenfish 3 44-144 1.2-34.0 40.4Atroctoscion nobilis white seabass 2 270 85.0-180 265.0Engraulis mordax northern anchovy 2 42-45 0.6 1.3Paralabrax clathratus kelp bass 2 62-64 2.8-5.1 7.9
PhanerodonjUrcatus white surfperch 2 179-224 115-240 355.2
Hyperprosopon argenteum walleye surfperch I 98 20.7 20.7
Hyperprosopon spp. surfperch I 165 115 115.0
Hypsopsetta guttulata diamond turbot I 28 0.5 0.5
Lepomis macrochirus bluegill I 114 45.0 45.0
Lepomis spp. sunfishes I 106 35.6 35.6
Symphurus atricauda California tonguefish 1 92 8.1 8.1
Syngnarhus spp. pipefishes 1 248 4.5 4.5
SHARKSIRAYS
) Myliobatis califomica bat ray 2 274-307 320-410 730.0
Ophichthus zophochir yellow snake eel 2 489-520 120 240.0Gymnura marmorata California butterfly ray 1 465 648 648.0.Platyrhinoidis triseriata thornback 1 178.0 177.9
INVERTEBRATESPortunus xantusii Xantus' swimming crab 22 19-55 2.6-19.7 198.2
Pachygrapsus crassipes striped shore crab 5 10-31 0.4-10.2 18.7
Pugettia spp. kelp crabs 3 7-25 1.1-6.1 8.7
Callianassa californiensis ghost shrimp 2 41-49 1.0-1.9 2.9Cancerjordani hairy rock crab 2 21-30 1.3-5.8 7.1Octopus spp. octopus 2 20.4-114.8 135.2
Cancer antennarius brown rock crab 1 21 2.3 2.3
Cancer productus red rock crab 1 37 10.5 10.5Pugettia producta northern kelp crab 1 15 1.5 1.5Taliepus nuttallii globose kelp crab 1 10 0.5 0.5
Total: 568
G1-17
Impingement Results
Encina Power Station Impingement Abundance: Traveling Screen and Bar Rack Survey Data
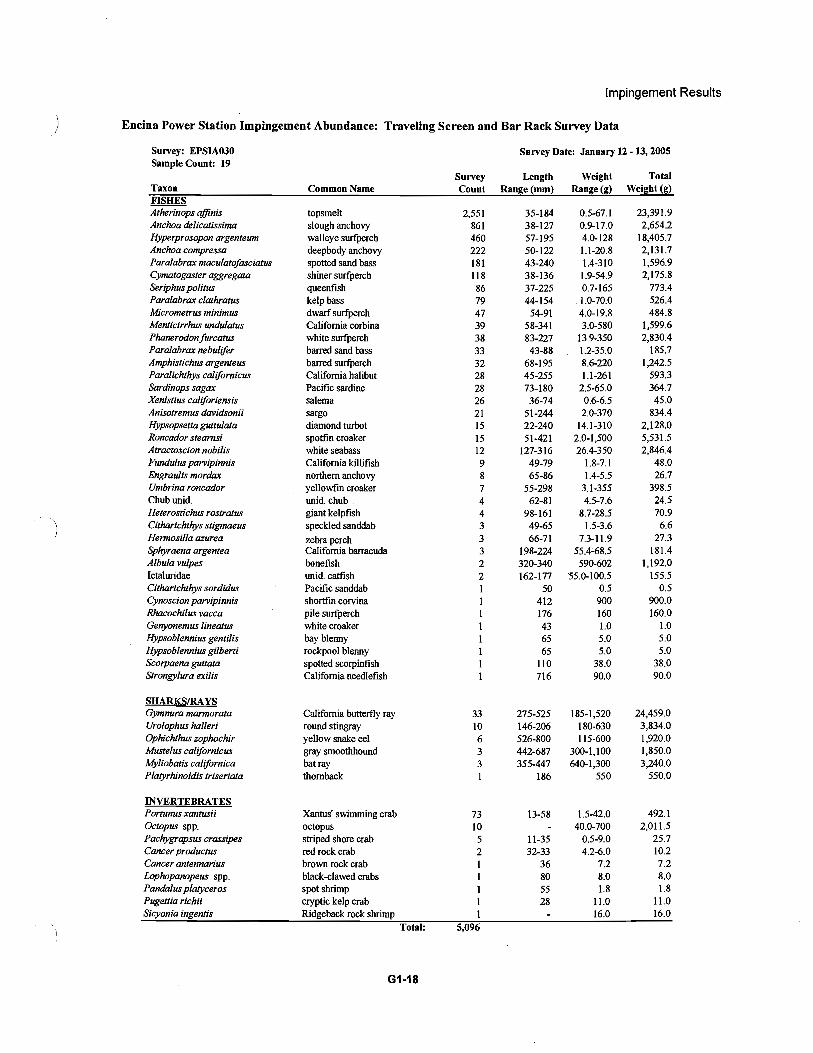
Survey: EPSIA030 Survey Date: January 12 - 13, 2005Sample Count: 19
Survey Length Weight TotalTaxon Common Name Count Range (mm) Range (g) Weight (g)FISHESAtherinops affinis topsmelt 2,551 35-184 0.5-67.1 23,391.9Anchoa delicatissirna slough anchovy 861 38-127 0.9-17.0 2,654.2Hyperprosopon argenteum walleye surfperch 460 57-195 4.0-128 18,405.7Anchoa compressa deepbody anchovy 222 50-122 1.1-20.8 2,131.7
Paralabrax maculatofasciatus spotted sand bass 181 43-240 1.4-310 1,596.9
Cymatogaster aggregata shiner surfperch 1i8 38-136 1.9-54.9 2,175.8
Seriphus politus queenfish 86 37-225 0.7-165 773.4Paralabrax clathratus kelp bass 79 44-154 . 1.0-70.0 526.4Micrometrus minimus dwarf surfperch 47 54-91 4.0-19.8 484.8Menticirrhus undulatus California corbina 39 58-341 3.0-580 1,599.6Phanerodonfurcatus white surfperch 38 83-227 13.9-350 2,830.4Paralabrax nebulifer barred sand bass 33 43-88 1.2-35.0 185.7Amphistichus argenteus barred surfperch 32 68-195 8.6-220 1,242.5Paralichthys califomicus California halibut 28 45-255 1.1-261 593.3Sardinops sagax Pacific sardine 28 73-180 2.5-65.0 364.7
Xenistius califoriensis salema 26 36-74 0.6-6.5 45.0
Anisotremus davidsonii sargo 21 51-244 2.0-370 834.4
Hypsopsetta guttulata diamond turbot 15 22-240 14.1-310 2,128.0Roncodor stearnsi spotfin croaker 15 51-421 2.0-1,500 5,531.5Atractoscion nobilis white seabass 12 127-316 26.4-350 2,846.4
Fundulus parvipinnis California killifish 9 49-79 1.8-7.1 48.0
Engraulis mordax northern anchovy 8 65-86 1.4-5.5 26.7
Umbrina roncodor yellowfin croaker 7 55-298 3.1-355 398.5
Chubunid. unid. chub 4 62-81 4.5-7.6 24.5Heterostichus rostratus giant kelpfish 4 98-161 8.7-28.5 70.9
) Citharichthys stigmaeus speckled sanddab 3 49-65 1.5-3.6 6.6
Hermosilla azurea zebra perch 3 66-71 7.3-11.9 27.3Sphyraena argentea California barracuda 3 198-224 55.4c68.5 181.4Albula vulpes bonefish 2 320-340 590-602 1,192.0Ictaluridae unid. catfish 2 162-177 55.0-100.5 155.5Citharichthys sordidus Pacific sanddab 1 50 0.5 0.5Cynoscion parvipinnis shortfm corvina I 412 900 900.0
Rhacochilus vacca pile surfperch I 176 160 160.0Genyonemus lineatus white croaker 1 43 1.0 1.0Hypsoblennius gentilis bay blenny I 65 5.0 5.0
Hypsoblennius gilberti rockpool blenny 1 65 5.0 5.0
Scorpaena guttata spotted scorpinfish 1 110 38.0 38.0
Strongylura exilis California needlefish 1 716 90.0 90.0
SHARKSIRAYSGymnura marmorata California butterfly ray 33 275-525 185-1,520 24,459.0
Urolophus halleri round stingray 10 146-206 180-630 3,834.0
Ophichthus zophochir yellow snake eel 6 526-800 115-600 1,920.0Mustelus califomicus gray smoothhound 3 442-687 300-1,100 1,850.0Myliobatis californica bat ray 3 355-447 640-1,300 3,240.0Platyrhinoidis triseriata thornback I 186 550 550.0
INVERTEBRATESPortunus xantusii Xantus' swimming crab 73 13-58 1.5-42.0 492.1Octopus spp. octopus 10 40.0-700 2,011.5Pachygrapsus crassipes striped shore crab 5 11-35 0.5-9.0 25.7Cancer productus red rock crab 2 32-33 4.2-6.0 10.2
Cancer antennarius brown rock crab 1 36 7.2 7.2
Lophopanopeus spp. black-clawed crabs I 80 8.0 8.0
Pandalus platyceras spot shrimp I 55 1.8 1.8
Pugettia richii cryptic kelp crab 1 28 11.0 11.0Sicyonia ingentis Ridgeback rock shrimp 1 16.0 16.0
Total: 5,096
Gi-i8

Impingement Results
) Encina Power Station Impingement Abundance: Traveling Screen and Bar Rack Survey Data
Survey: EPSlA031 Survey Date: January 19 - 20, 2005Sample Count: 19
Survey Length Weight TotalTaxon Common Name Count Range (mm) Range (g) Weight (g)FISHESAtherinops ajjinis topsmelt 492 50-179 1.0-30.0 2,256.5Sardinops sagax Pacific sardine 32 55-127 2.5-15.5 180.4Arractoscion nobilis white seabass 18 80-235 40.0-160 1,521.0Anchoa delicatissima slough anchovy 12 55-79 1.0-5.0 29.7Anchoa compressa deepbody anchovy 8 60-96 2.5-10.0 36.0Cymatogaster aggregata shiner surfperch 6 69-110 9.0-35.0 103.0Xenistius caJiforiensis salema 5 39-55 1.0-3.0 10.0Hyperprosopon argenteum walleye surfperch 4 106-141 33.0-72.0 189.0ParaJabrax clathratus kelp bass 4 53-66 3.0-6.0 20.0Anisotremus davidsonii sargo 2 55 2.5-7.0 9.5ParaJabrax macu/atofasciatus spotted sand bass 2 65-79 4.5-9.5 14.0ParaJabrax nebu/ifer barred sand bass 2 63-75 4.0-8.0 12.0Seriphus poUtus queenfish 2 47-74 1.0-5.0 6.0Citharichthys stigmaeus speckled sanddab I 38 1.0 1.0Hypsoblennius spp. blenilies I 70 7.0 7.0Hypsopsetta guttulata diamond turbot I 253 350 350.0Leuresthes tenuis California grunion I 91 5.0 5.0
Micromerrus minimus dwarf surfperch I 67 7.5 7.5Pleuronichthys ritteri spotted turbot I 70 6.5 6.5
SHARKSIRAYSMyUobatis califomica bat ray 2 182-404 460-850 1,310.0Platyrhinoidis rriseriata thornback 2 159-349 200-260 460.0
, Gymnura marmorata California butterfly ray I 392 380 380.0
)INVERTEBRATESPortunus xantusii Xantus' swimming crab 40 12-60 1.0-22.0 286.0Pachygrapsus crassipes striped shore crab 5 12-33 1.0-10.0 24.5Blepharipoda occidentalis spiny mole crab I 24 9.0 9.0Cancer productus red rock crab I 35 7.0 7.0Octopus bimacu/atus California two-spot octopus I 80 110 110.0Pugettia spp. kelp crabs I 32 7.5 7.5
Total: 649
G1·19

Impingement Results
Encina Power Station Impingement Abundance: Traveling Screen and Bar Rack Survey Data
Survey: EPSIA032 Survey Date; January 26 - 27, 2005Sample Count: 19
Survey Length Weight TotalTaxon Common Name Count Range (mm) Range (g) Weight (g)FISHESAtherinops affinis topsmelt 243 46-277 1.0-65.0 1,435.4Anchoa compressa deepbody anchovy 16 70-111 3.0-15.0 146.9Seriphus palitus queenfish II 35-96 1.0-13.0 75.5Atractoscion nobilis white seabass 9 159-284 50.0-210 722.0Cymatogaster aggregata shiner surfperch 5 62-110 7.0-38.0 86.0Hypsopsetta gutlUlata diamond turbot 3 162-225 85.0-310 615.0Sardinops sagax Pacific sardine 3 79-145 5.0-29.0 56.0Xenistius califoriensis salema 3 38-52 1.5-3.0 6.5Phanerodonftncatus white surfperch 2 87-95 16.0-23.0 39.0Anchoa delicatissima slough anchovy I 61 2.0 2.0Heterostichus rostratus giant kelpfish I 75 3.1 3.1Hyperprosopan argenteum walleye surfperch I 98 21.0 21.0Micrometrus minimus dwarfsurfperch I 74 16.0 16.0Paralabrax clathratus kelp bass I 0.5 .0.5Paralabrax maculatofasciatus spotted sand bass I 65 5.5 5.5unidentified fish, damaged unid. damaged fish I 182 70.0 70.0
SHARKS/RAYSMyliobatis californica bat ray 2 309-395 400-490 890.0Gymnura marmorata California butterfly ray I 365 390 390.0Torpedo californica Pacific electric ray I 311 3,750.0 3,750.0
INVERTEBRATESPorlUnus xantusii Xantus' swimming crab 30 24-51 1.5-23.5 325.0
) Pachygrapsus crassipes striped shore crab 4 12-50 2.0-18.0 42.0Cancer spp. cancer crabs 2 28-32 2.0-3.0 5.0Cancer productus red rock crab I 35 5.0 5.0Caridean unid. unidentified shrimp I 7.0 7.0Panulirus interruptus California spiny lobster I 30.0 30.0
Total: 345
G1-20
\)
Impingement Results
Encina Power Station Impingement Abundance: Traveling Screen and Bar Rack Survey Data
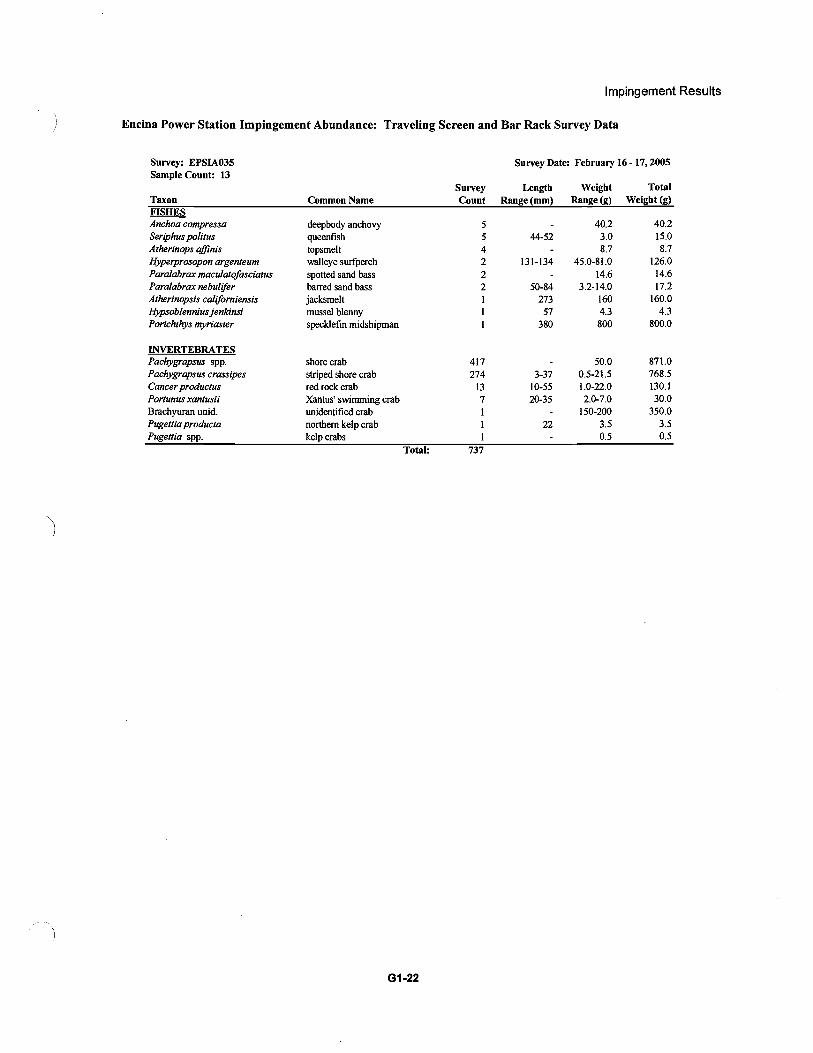
Survey: EPSIA035 Survey Date: February 16 - 17, 2005Sample Count: 13
Survey Length Weight TotalTaxon Common Name Count Range (mm) Range (g) Weight (g)FISHESAnchoa compressa deepbody anchovy 5 40.2 40.2Seriphus paUtus queenfish 5 44-52 3.0 15.0Atherinops ajJinis topsmelt 4 8.7 8.7Hyperprosopon argenteum walleye sutfperch 2 131-134 45.0-81.0 126.0Paralabrax maculatofasciatus spotted sand bass 2 14.6 14.6Paralabrax nebulifer barred sand bass 2 50-84 3.2-14.0 17.2Atherinopsis californiensis jacksmelt I 273 160 160.0Hypsoblennius jenkinsi mussel blenny I 57 4.3 4.3Porichthys myriaster specklefin midshipman I 380 800 800.0
INVERTEBRATESPachygrapsus spp. shore crab 417 50.0 871.0Pachygrapsus crassipes striped shore crab 274 3-37 0.5-21.5 768.5Cancer productus red rock crab 13 10-55 1.0-22.0 130.1Portunus xantusii Xantus' swimming crab 7 20-35 2.0-7.0 30.0Brachyuran unid. unidentified crab I 150-200 350.0Pugettia producta northern kelp crab I 22 3.5 3.5Pugettia spp. kelp crabs I 0.5 0.5
Total: 737
G1-22

Impingement Results
I Encina Power Station Impingement Abundance: Traveling Screen and Bar Rack Survey Data
Survey: EPSlA036 Survey Date: February 23 - 24, 2005Sample Count: 13
Survey Length Weight TotalTaxon Common Name Count Range (mm) Range (g) Weight (g)FISHESAnchoa compressa deepbody anchovy 306 54-120 2.0-21.0 3,203.2Atherinops affinis topsmelt 304 57-171 1.2-54.7 4,887.9Cymatogaster aggregata shiner surfperch 189 72-188 8.9-61.0 5,211.9Chubunid. unid. chub 91 62-164 3.0-100 845.5Paralabrax maculatofasciatus spotted sand bass 88 43-315 2.0-670 1,318.9Paralabrax nebuliftr barred sand bass 64 42-94 2.0-15.0 439.8Hyperprosopon argenteum walleye surfperch 36 1l0-164 36.0-116.4 2,564.4Ictaluridae unid. catfish 33 124-259 60.0-300 4,123.0Fundulus parvipinnis California killifish 31 66-91 4.0-12.0 235.5Anchoa delicatissima slough anchovy 24 57-74 2.0-5.0 73.5Seriphus politus queenfish 21 49-172 2.0-79.0 410.5Lepomis macrochirus bluegill 16 42-135 2.0-86.9 513.7Lepomis cyanellus green sunfish 15 47-168 3.0-138 532.0Anisotremus davidsonii sargo 10 53-81 3.5-13.0 68.4Hypsopsetta guttulata diamond turbot 7 25-233 0.8-260 956.8Paralichthys califomicus California halibut 6 47-221 1.5-170 200.8Atractoscion nobilis white seabass 4 239-432 155-260 775.0Pylodictis olivaris flathead catfish 4 158-210 90.0-170 480.0Chromis punctipinnis blacksmith 3 55-101 4.0-21.0 32.0PhanerodonjiJrcatus white surfperch 3 156-191 85.8-180 385.8unidentified fish, damaged unid. damaged fish 3 40-95 1.0-60.0 62.5Paralabrax clathratus kelp bass 2 65-90 5.0-14.0 19.0Ameiurus nebulosus brown bullhead I 149 100 100.0Citharichthys stigmaeus speckled sanddab I 45 3.0 3.0
') Embiotoca jacksoni black surfperch I 225 370 370.0Heterostichus rostratus giant kelpfish I 183 50.0 50.0Lepomis spp. sunfishes I 141 130 130.0Micrometrus minimus dwarf surfperch I 57 5.0 5.0Micropterus dolomieu smallmouth bass I 186 150 150.0Pleuronectiforrnes unid. flatfishes I 38 0.5 0.5Syngnathus spp. pipefishes I 105 1.0 1.0Xenistius califoriensis salema I 48 1.8 1.8
SHARKSIRAYSOphichthus zophochir yellow snake eel 4 549-769 150-450 1,380.0
INVERTEBRATESOctopus spp. octopus 17 17-117 16.0-520 3,170.0Portunus xantusii Xantus' swimming crab 15 11-52 1.3-14.0 73.8Pachygrapsus crassipes striped shore crab 6 11-22 1.0-4.0 13.0Octopus bimaculatus California two-spot octopus 3 90-95 240-370 940.0Blepharipoda occidentalis spiny mole crab I 18 3.0 3.0
Total: 1,316
G1-23
Impingement Results
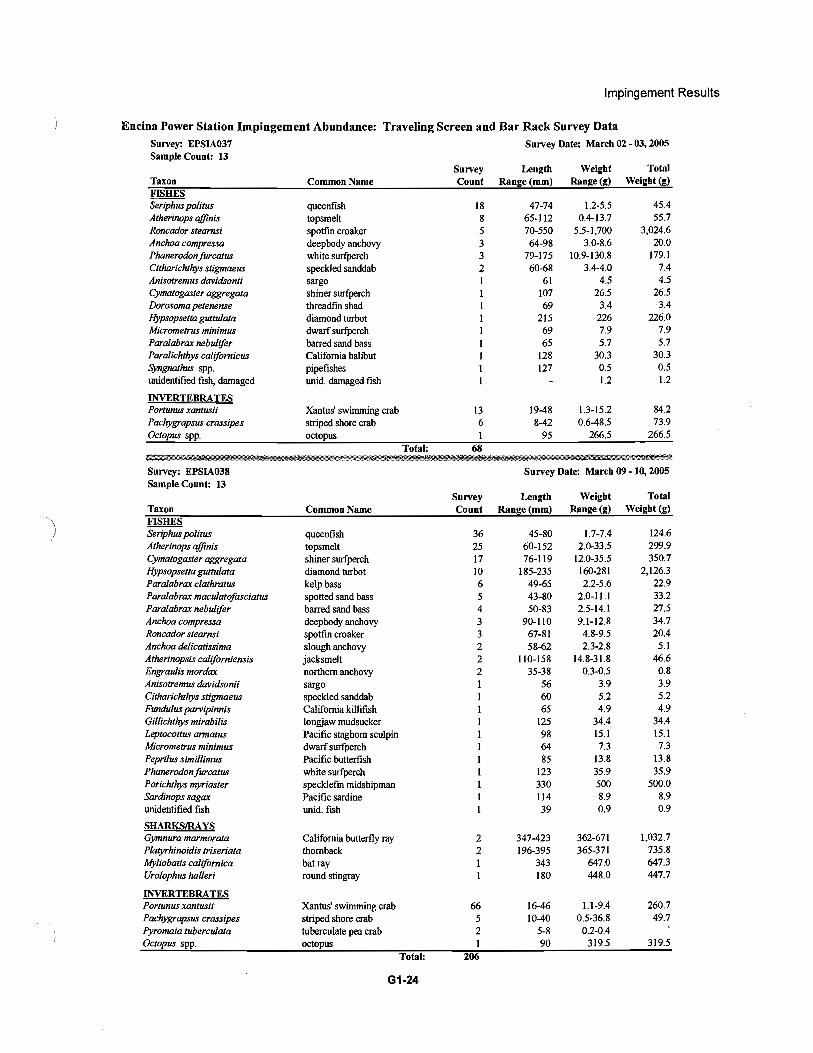
Encina Power Station Impingement Abundance: Traveling Screen and Bar Rack Survey DataSurvey: EPSIA037 Survey Date; March 02 - 03, 2005Sample Count: 13
Survey Length Weight TotalTaxon Common Name Count Range (mm) Range (g) Weight (g)FISHESSeriphus politus queenfish 18 47-74 1.2-5.5 45.4Atherinops afJinis topsmelt 8 65-112 0.4-13.7 55.7Roncador stearnsi spotfin croaker 5 70-550 5.5-1,700 3,024.6Anchoa compressa deepbody anchovy 3 64-98 3.0-8.6 20.0Phanerodonfurcatus white swfperch 3 79-175 10.9-130.8 179.1Citharichthys stigmaeus speckled sanddab 2 60-68 3.4-4.0 7.4Anisotremus davidsonii sargo I 61 4.5 4.5Cymatogaster aggregata shiner swfperch I 107 26.5 26.5Dorosoma petenense threadfin shad I 69 3.4 3.4Hypsopsetta guttulata diamond turbot I 215 226 226.0Micrometrus minimus dwarf surfperch I 69 7.9 7.9Paralabrax nebulifer barred sand bass I 65 5.7 5.7Paralichthys californicus California halibut I 128 30.3 30.3Syngnathus spp. pipefishes I 127 0.5 0.5unidentified fish, damaged unid. damaged fish I 1.2 1.2
INVERTEBRATESPortunus xantusii Xantus' swimming crab 13 19-48 1.3-15.2 84.2Pachygrapsus crassipes striped shore crab 6 8-42 0.6-48.5 73.9Octopus spp. octopus I 95 266.5 266.5
Total: 68~-s..~iliiiYili!!.'!iiliw.i%relill!~,)lmI;Di%>¥~~...3l!lilii-~
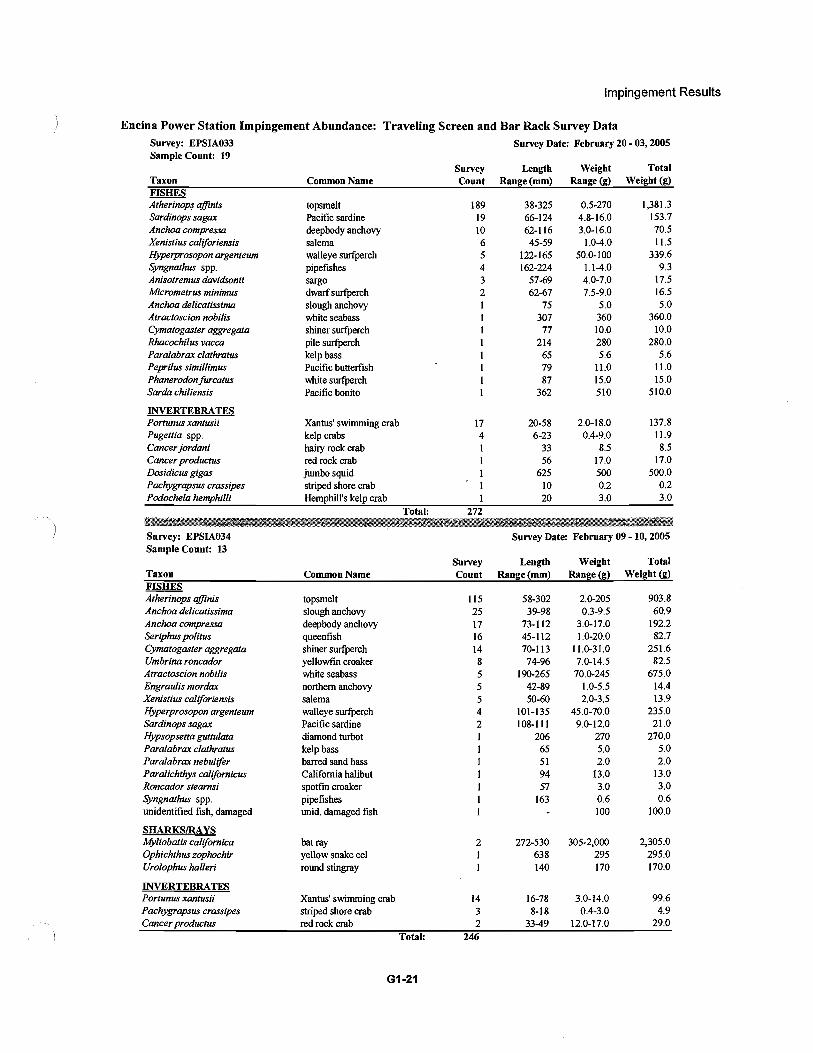
Survey: EPSIA038 Survey Date: March 09 - 10, 2005Sample Count: 13
Survey Length Weight TotalTaxon Common Name Count Range (mm) Range (g) Weight (g)
. ,
') FISHES
)Seriphus politus queenfish 36 45-80 1.7-7.4 124.6Atherinops afJinis topsmelt 25 60-152 2.0-33.5 299.9Cymatogaster aggregata shiner swfperch 17 76-119 12.0-35.5 350.7Hypsopsetta guttulata diamond turbot 10 185-235 160-281 2,126.3Paralabrax clathratus kelp bass 6 49-65 2.2-5.6 22.9Paralabrax maculatofasciatus spotted sand bass 5 43-80 2.0-11.1 33.2Paralabrax nebulifer barred sand bass 4 50-83 2.5-14.1 27.5Anchoa compressa deepbody anchovy 3 90-110 9.1-12.8 34.7Roncador stearnsi spotfm croaker 3 67-81 4.8-9.5 20.4Anchoa delicatissima slough anchovy 2 58-62 2.3-2.8 5.1Atherinopsis californiensis jacksmelt 2 110-158 14.8-31.8 46.6Engraulis mordax northern anchovy 2 35-38 0.3-0.5 0.8Anisotremus davidsonii sargo 1 56 3.9 3.9Citharichthys stigmaeus speckled sanddab I 60 5.2 5.2Fundulus parvipinnis California killifish I 65 4.9 4.9Gillichthys mirabilis longjaw mudsucker I 125 34.4 34.4Leptocottus armatus Pacific staghom sculpin 1 98 15.1 15.1Micrometrus minimus dwarfswfperch 1 64 7.3 7.3Peprilus simillimus Pacific butterfish I 85 13.8 13.8PhanerodonjiJrcatus white swfperch 1 123 35.9 35.9Porichthys myriaster specklefm midshipman 1 330 500 500.0Sardinops sagax Pacific sardine I 114 8.9 8.9unidentified fish unid. fish 1 39 0.9 0.9
SHARKSIRAYSGymnura marmorata California butterfly ray 2 347-423 362-671 1,032.7Platyrhinoidis triseriata thornback 2 196-395 365-371 735.8Myliobatis californica bat ray 1 343 647.0 647.3Urolophus halleri round stingray I 180 448.0 447.7
INVERTEBRATESPortunus xantusii Xantus' swimming crab 66 16-46 1.1-9.4 260.7Pachygrapsus crassipes striped shore crab 5 10-40 0.5-36.8 49.7Pyromaia tuberculata tuberculate pea crab 2 5-8 0.2-0.4Octopus spp. octopus 1 90 319.5 319.5
Total: 206
G1-24
)
Impingement Results
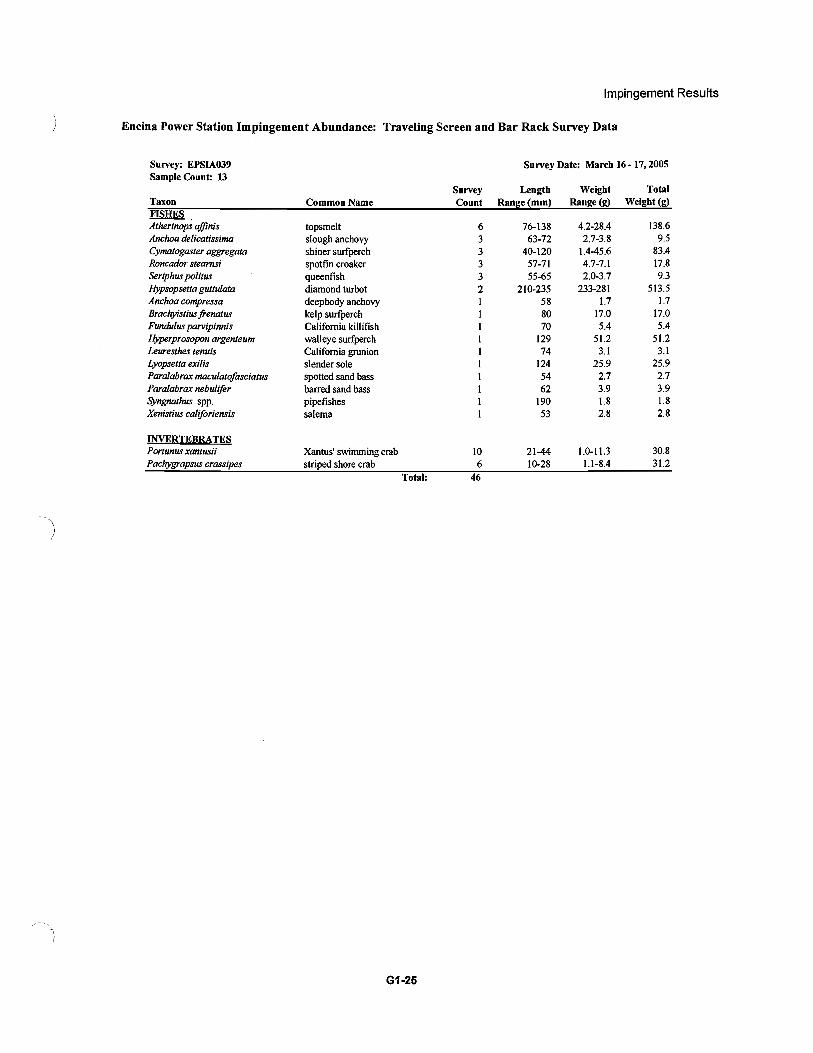
Encina Power Station Impingement Abundance: Traveling Screen and Bar Rack Survey Data
Survey: EPSlA039 Survey Date: March 16· 17,2005Sample Count: 13
Survey Length Weight TotalTaxon Common Name Count Range (mm) Range (g) Weight (g)FISHESAtherinop~affinis topsrnelt 6 76-138 4.2-28.4 138.6Anchoa delicatissima slough anchovy 3 63-72 2.7-3.8 9.5Cymatogaster aggregata shiner surfperch 3 40-120 1.4-45.6 83.4Roncador stearnsi spotfin croaker 3 57-71 4.7-7.1 17.8Seriphus politus queenfish 3 55-65 2.0-3.7 9.3Hypsopsetta guttulata diamond turbot 2 210-235 233-281 513.5Anchoa compressa deepbody anchovy 1 58 1.7 1.7Brachyistius frenatus kelp surfperch 1 80 17.0 17.0Fundulus parvipinnis California killifish 1 70 5.4 5.4Hyperprosopon argenteum walleye surfperch 1 129 51.2 51.2Leuresthes tenuis California grunion 1 74 3.1 3.1Lyopsetta exilis slender sole 1 124 25.9 25.9Paralabrax maculatofasciatus spotted sand bass 1 54 2.7 2.7Paralabrax nebuliftr barred sand bass 1 62 3.9 3.9Syngnathus spp. pipefishes 1 190 1.8 1.8Xenistius calijiJriensis salerna 1 53 2.8 2.8
INVERTEBRATESPortunus xantusii Xantus' swimming crab 10 21-44 1.0-11.3 30.8Pachygrapsus crassipes striped shore crab 6 10-28 1.1-8.4 31.2
Total: 46
~
')
G1·25

Impingement Results
Endna Power Station Impingement Abundance: Traveling Screen and Bar Rack Survey Data
Survey: EPSlA040 Survey Date: March 23 - 24, 2005Sample Count: 19
Survey Length Weight TotalTaxon Common Name Count Range (mm) Range (g) Weight (g)FISHESAtherinops ajJinis topsmelt 77 60-155 2.0-50.2 776.2Cymatogaster aggregata shiner surfperch 62 33-123 0.8-41.6 1,385.7Seriphus politus queenfish 31 35-111 1.3-14.0 155.4Anchoa compressa deepbody anchovy 25 54-80 1.6-5.4 73.2Anchoa delicatissima slough anchovy 14 55-70 2.3-3.7 40.6Roncador stearnsi spotfin croaker 9 64-83 3.0-12.4 57.6Syngnathus spp. pipefishes 9 183-235 1.6-3.5 22.0Strongylura exi/is California needlefish 6 330-538 37.5-181 592.8Genyonemus lineatus white croaker 4 31-34 0.6 2.7Leuresthes tenuis California grunion 4 70-104 3.3-9.2 20.9Paralabrax nebuli[er barred sand bass 4 59-64 3.8-5.2 18.3Hypsopsetta guttu/ata diamond turbot 3 205-224 184.4-203.0 574.8Leptocottus armatus Pacific staghorn sculpin 3 60-105 3.3-18.8 28.6Phanerodonfurcatus white surfperch 3 41-166 8.8-87.7 116.2Anisotremus davidsonii sargo 2 55-59 4.3-5.0 9.3Chromis punctipinnis blacksmith 2 119-125 32.7-35.0 67.7Hyperprosopon argenteum walleye surfperch 2 39-177 1.5-190 191.1Paralabrax clathratus kelp bass 2 74-76 5.6-8.0 13.6Pleuronectiformes unid. flatfishes 2 55-60 3.2-3.7 6.9Citharichthys stigmaeus speckled sanddab 1 60 2.9 2.9Engraulis mordax . northern anchovy 1 87 3.9 3.9Fundulus parvipinnis California killifish I 66 5.2 5.2Hypsoblennius gilberti rockpool blenny I 70 6.3 6.3
-" Paralabrax maculatofasciatus spotted sand bass I 53 2.6 2.6\I Pepri/us simi//imus Pacific butterfish I 87 14.3 14.3j Pleuronichthys verticalis hornyhead turbot I 138 68.9 68.9
Porichthys myriaster specklefin midshipman 1 370 350 350.0Umbrina roncador yellowfin croaker 1 70 5.4 5.4unidentified fish unid. fish I 156 77.6 77.6unidentified fish, damaged unid. damaged fish 1 65 1.6 1.6Xenistius califoriensis salema 1 51 2.9 2.9
SHARKSIRAYSOphichthus zophochir yellow snake eel 2 750-752 393-457 849.4Urolophus ha//eri round stingray 2 119-120 95.2-98.0 193.2Gymnura marmorata California butterfly ray 1 395 185.0 185.0Rhinobatosproductus shovelnose guitarfish 1 775 1,800.0 1,800.0
INVERTEBRATESPortunus xantusii Xantus' swimming crab 56 9-46 0.9-19.0 200.2Pachygrapsus crassipes striped shore crab 9 15-40 1.0-31.9 95.6
Total: 347
G1-26

Impingement Results
Encina Power Station Impingement Abundance: Traveling Screen and Bar Rack Survey Data
Survey: EPSIA041 Survey Date: March 30 - 31, 2005Sample Count: 19
Survey Length Weight TotalTaxon Common Name Count Range (mm) Range (g) Weight (g)FISHESAtherinops affinis topsmelt 85 58-135 2.5-21.7 552.4Seriphus politus queenfish 44 40-130 1.8-33.4 258.7Cymatogaster aggregata shiner surfperch 36 32-125 0.6-43.9 798.4Anchoa compressa deepbody anchovy 13 65-1 II 1.6-17.3 98.9ParaJahrax nebuliftr barred sand bass II 49-75 2.4-8.6 50.9Hyperprosopon argenteum walleye surfperch 8 27-43 0.5·1.8 10.8Anchoa delicatissima slough anchovy 5 58-69 2.0-3.4 13.3Anisotremus davidsonii sargo 5 54-68 3.8-7.0 26.7Embiotoca jacksoni black surfperch 5 46-64 3.0-6.8 20.5Leuresthes tenuis California grunion 5 64-131 1.2-17.0 43.3Umbrina roncador yellowfin croaker 5 65-108 4.8-20.0 45.2Paralichthys californicus California halibut 2 70-176 2.2-33.7 35.9Phanerodonfurcatus white surfperch 2 41-50 1.8-2.5 4.3Genyonemus lineatus white croaker I 45 1.6 1.6Hypsoblennius gentilis bay blenny I 42 1.6 1.6Menticirrhus undulatus California corbina I 262 277.5 277.5ParaJahrax maculatofasciatus spotted sand bass I 80 9.6 9.6Roncador stearnsi spotfm croaker I 77 7.5 7.5Strongylura e~:ilis California needlefish I 324 26.3 26.3Syngnathus spp. pipefishes I 207 3.6 3.6Xenistius caJiforiensis salerna I 55 3.1 3.1
')SHARKSIRAYSGymnura marmorata California butterfly ray 2 330-398 305-550 855.2Urolophus haIleri round stingray 2 104-108 56.0-62.1 II8.1Platyrhinoidis triseriata thornback I 279 1,500.0 1,500.0Rhinobatos productus shovelnose guitarfish I 1126 4,400.0 4,400.0
INVERTEBRATESPortunus xantusii Xantus' swimming crab 20 15-58 0.9-16.8 77.1Pachygrapsus crassipes striped shore crab 17 5-40 0.3-31.9 85.4
Total: 277
G1-27

Impingement Results
) Encina Power Station Impingement Abundance: Traveling Screen and Bar Rack Survey Data
Survey: EPSlA042 Survey Date: April 6 - 7, 2005Sample Count: 19
Survey Length Weight Total
Taxon Common Name Count Range (mm) Range (g) Weight (g)FISHESCymatogaster aggregata shiner surfperch 29 42-131 3.0-65.2 732.7Atherinops affinis topsmelt 23 60-127 3.0-24.0 238.0Seriphus politus queenfish 17 55-81 4.0-10.0 94.5Hyperprosopon argenteum walleye surfperch 6 40-161 2.0-100 204.0
Anchoa compressa deepbody anchovy 4 68-78 4.0-6.5 19.0Atherinopsis californiensis jacksmelt 4 75-252 5.0-140 177.0
Leuresthes tenuis California grunion 4 78-151 3.8-28.0 58.8Embiotocajacksoni black surfperch 3 53-218 4.5-452 464.0Porichthys myriaster specklefm midshipman 3 370-410 800-1,250 2,950.0
Paralabrax nebulifer barred sand bass 2 50-56 3.0-4.0 7.0Amphistichus argenteus barred surfperch I 42 2.0 2.0
Anchoa delicatissima slough anchovy 1 63 3.5 3.5
Anisotremus davidsonii sargo I 68 8.5 8.5
Chromis punctipinnis blacksmith I 95 18.5 18.5Engraulis mordax northern anchovy 1 57 2.5 2.5
Genyonemus lineatus white croaker I 110 21.0 21.0Paralabrax maculatofasciatus spotted sand bass I 65 7.0 7.0Sardinops sagax Pacific sardine 1 128 19.5 19.5
Strongylura exilis California needlefish I 345 45.0 45.0
Syngnathus leptorhynchus bay pipefish I 208 4.0 4.0Xenistius califoriensis salema I 52 4.0 4.0
SHARKSIRAYSGymnura marmorata California butterfly ray 2 415-462 600-1,050 1,650.0Urolophus halleri round stingray I 168 420 420.0
INVERTEBRATESPortunus xantusii Xantus' swimming crab 40 17-70 1.5-20.0 300.0
Pachygrapsus crassipes striped shore crab 8 17-32 3.0-13.5 43.0
Hippolytidae unid. hippolytid shrimps ITotal: 158
G1-28

Impingement Results
/ Encina Power Station Impingement Abundance: Traveling Screen and Bar Rack Survey Data
Survey: EPSIA043 Survey Date: April 13 - 14, 2005Sample Count: 19
Survey Length Weight TotalTaxon Common Name Count Range (mm) Range (g) Weight (g)
FISHESCymatogaster aggregata shiner surfperch 93 48-143 6.9-59.8 1,565.9Atherinops ajjinis topsmelt 35 65-155 3.0-39.9 415.6Anisotremus davidsonii sargo 13 40-91 3.9-25.2 127.2Paralabrax maculatofasciarus spotted sand bass 10 65-263 3.9-259.1 398.9
Anchoa compressa deepbody anchovy 9 80-120 6.6-22.5 123.9Leuresthes tenuis California grunion 6 110-160 7.6-23.1 83.4Hyperprosopon argenteum walleye surfperch 5 40-50 1.6-2.5 10.1Atherinopsis californiensis jacksmelt 3 194-325 61.4-223 462.1Paralabrax clathrarus kelp bass 3 65-75 3.2-5.6 12.5Seriphus polirus queenfish 3 61-84 3.5-7.7 15.2Chromis punctipinnis blacksmith 2 154-156 106.6-143.1 249.7
Embiotocajacksoni black surfperch 2 56-58 4.3-4.4 8.7Girella nigricans opaleye 2 140-190 86.0-260.1 346.1Hennosilla azurea zebra perch 2 73-255 10.9-445 455.9
Hypsopsetta guttulata diamond turbot 2 155-198 107.3-185.1 292.4Leptocottus annatus Pacific staghorn sculpin 2 58-66 3.5 7.0Porichthys myriaster specldefin midshipman 2 263-352 271-673 943.5Roncador stearnsi spotfm croaker 2 80-222 9.5-174.1 183.6Anchoa delicatissima slough anchovy I 70 3.8 3.8Genyonemus lineatus white croaker I 169 92.6 92.6Heterostichus rostratus giant kelpfish I 88 4.9 4.9Hypsoblennius gentilis bay blermy I 58 4.7 4.7
Hypsoblenniusjenkinsi mussel blenny I 91 13.0 13.0
Paralabrax nebulifer barred sand bass I 221 266.7 266.7Paralichthys califomicus California halibut I 107 18.2 18.2Phanerodonfurcarus white surfperch I 213 215.1 215.1
Umbrina roncador yellowfin croaker I 60 4.6 4.6
unidentified fish, damaged unid. damaged fish I 91.8 91.8Xenistius califoriensis salema I 50 2.4 2.4
SHARKSIRAYSUrolophus halleri round stingray 9 96-198 37.6-521.1 2,298.0Gymnura marmorata California butterfly ray 2 365-393 443.8-512.9 956.7Myliobatis californica bat ray 2 352-354 673-790 1,463.2
INVERTEBRATESPachygrapsus crassipes striped shore crab 170 7-31 0.3-14.8 544.1Portunus xanrusii Xantus' swimming crab 13 18-51 1.5-19.2 85.9Cancer producrus red rock crab 1 19 -1.4 1.4
Total: 404
G1-29

Impingement Results
Encina Power Station Impingement Abundance: Traveling Screen and Bar Rack Survey Data
SUn'ey: EPSIA044 SUn'ey Date: April 20 • 21, 2005Sample Count: 19
SUn'ey Length Weight TotalTaxon Common Name Count Range (mm) Range (g) Weight (g)
FlSHESCymatogaster aggregata shiner surfperch 32 43-122 1.9-31.8 477.6
Anchoa compressa deepbody anchovy 16 65-119 3.2-18.7 159.0Hyperprosopon argenteum walleye surfperch II 41-225 1.7-275.3 465.4
Anisotremus davidsonii sargo 7 60-75 4.8-9.0 46.8
Atherinops ajJinis topsmelt 7 73-133 3.7-23.3 112.1Seriphus palitus queenfish 6 68-99 4.7-15.7 48.3
Anchoa delicatissima slough anchovy 4 65-74 2.6-4.9 14.9Porichthys myriaster specklefrn midshipman 2 270-335 227-482 708.8
Cheilopogon pinnatibarbatus spotted flyingfish I 114 2.9 2.9Leptocottus armatus Pacific staghorn sculpin I 65 4.6 4.6
Leuresthes tenuis California grunion I 110 11.0 11.0
ParaJabrax nebuJijer barred sand bass I 50 2.3 2.3
Phanerodonfurcatus white surfperch I 36 1.0 1.0
Porichthys spp. midshipman I 200 200.0
Roncodor stearnsi spotfin croaker I 77 8.6 8.6
Strongylura exilis California needlefish I 390 57.9 57.9
unidentified fish, damaged unid. damaged fish I 200 200.0
SHARKS/RAYSUrolophus halleri round stingray 2 100 63.3-150 213.3
INVERTEBRATESPortunus xantusii Xantus' swimming crab 12 18-40 1.5-13.7 65.9Pachygrapsus crassipes striped shore crab 10 4-50 0.2-53.0 82.5
Octopus spp. octopus I 139.7 139.7
Total: 119
G1·30

Impingement Results
Encina Power Station Impingement Abundance: Traveling Screen and Bar Rack Survey Data
Survey: EPSIA045 Survey Date: April 27 - 28, 2005Sample Count: 19
Survey Length Weight TotalTaxon Common Name Count Range (mm) Range (g) Weight (g)FISHESCymatogaster aggregata shiner surfperch 63 39-122 \.2-42.0 810.1Atherinops affinis topsmelt 10 78-136 6.1-23.7 135.0
Hyperprosopon argenteum walleye surfperch 5 39-115 1.1-49.3 103.2
Leptocottus armatus Pacific staghorn sculpin 4 70-80 4.9-7.7 27.5
Paralabrax nebulifer barred sand bass 4 53-91 4.4-14.0 28.4
Anchoa compressa deepbody anchovy 3 80-100 2.3-13.3 2 \.9Anchoa delicatissima slough anchovy 2 61-97 2.9-9.1 12.0
Anisotremus davidsonii sargo 2 63-72 5.7-10.3 16.0Paralabrax clathratus kelp bass 2 61-76 5.1-8.1 13.2Mugil cephalus striped mullet I 57 3.4 3.4Paralichthys californicus California halibut I 101 14.6 14.6Peprilus simillimus Pacific butterfish I 47 2.2 2.2Porichthys myriaster specklefin midshipman I 252 190.0 189.5Seriphus poUtus queenfish I 71 6.9 6.9Xenistius califoriensis salema I 70 7.6 7.6
SHARKSIRAYSMyliobatis californica bat ray 566 2,500.0 2,500.0
INVERTEBRATESPortunus xantusii Xantus' swimming crab 6 19-33 \.8-4.9 18.1Pachygrapsus crassipes striped shore crab 2 11-12 2.9-3.4 6.3
Total: no
Survey: EPSlA046 Survey Date: May 4 - 5, 2005Sample Count: 19
Survey Length Weight Total
Taxon Common Name Count Range (mm) Range (g) Weight (g)
FISHESCymatogaster aggregata shiner surfperch 169 29-148 0.6-78.6 1,251.5Anchoa compressa deepbody anchovy 35 48-100 1.5-13.7 145.2
Atherinops qffinis topsmelt 23 60-126 2.0-26.0 21\.4Hyperprosopon argenteum walleye surfperch 14 48-157 2.2-94.9 162.4Seriphus politus queenfish 6 60-91 2.6-10.3 38.0Leuresthes tenuis California grunion 5 71-112 3.5-17.4 37.3
Paralabrax nebulifer barred sand bass 5 61-80 4.7-1 \.6 38.1Paralabrax maculatofasciatus spotted sand bass 4 75-82 9.1-90.0 122.6Sebastes atrovirens kelp rockfish 4 68-90 5.6-16.4 39.8
Paralichthys californicus California halibut 3 22-80 6.2-9.3 2\.9
Citharichthys stigmaeus speckled sanddab 2 70-79 5.5-6.4 I\.9
Leptocottus armatus Pacific staghorn sculpin 2 73-84 5.3-7.3 12.6
Porichthys myriaster specklefm midshipman 2 80-82 9.9-12.1 22.0
Anisotremus davidsonii sargo I 64 7.4 7.4
Heterostichus rostratus giant kelpfish I 85 2.9 2.9
Strongylura exilis California needleflSh I 400 66.0 66.0
SHARKSIRAYSGymnura marmorata California butterfly ray 555 1,508.0 1,508.0Ophichthus zophochir yellow snake eel 17.8 17.8
Urolophus halleri round stingray 204 525 525.0
INVERTEBRATESPachygrapsus crassipes striped shore crab 4 10-30 1.3-4.8 9.2
Portunus xantusii Xantus' swimming crab 3 40-50 2.2-1 \.9 19.4
Total: 287
G1-31

G1-32

Impingement Results
Encina Power Station Impingement Abundance: Traveling Screen and Bar Rack Survey Data
Survey: EPSIA048 Survey Date: May 18 - 19, 2005Sample Count: 19
Survey Length Weight Total
Taxon Common Name Count Range (mm) Range (g) Weight (g)
FISHESCymatogaster aggregata shiner surfperch 211 30-127 0.5-34.9 782.1
Phanerodonfurcatus white surfperch 21 31-72 0.8-7.1 66.6
Anchoa compressa deepbody anchovy 11 62-116 2.8-18.1 102.1
Hyperprosopon argenteum walleye surfperch 11 33-117 0.8-31.2 69.0
Atherinops affinis topsmelt 9 31-134 7.6-24.5 138.8
Porichthys myriaster specklefin midshipman 9 245-315 167-392 2,419.8
Para/abrax nebulifer barred sand bass 4 65-73 4.4-7.2 23.5
Seriphus po/itus queenfish 4 70-83 4.8-8.4 25.2
Roncador stearnsi spotfm croaker 3 59-76 3.5-7.4 16.9
Anchoa de/icatissima slough anchovy 2 65-77 3.4-4.8 8.2
Heterostichus rostratus giant kelpfish 2 63-87 1.7-4.0 5.7
Leptocottus armatus Pacific staghorn sculpin 2 68-69 6.2-6.7 12.9
Anchoa spp. anchovy I 1.8 1.8
Anisotremus dalJidsonii sargo I 74 10.3 10.3
Atractoscion nobilis white seabass I 155 37.2 37.2
Citharichthys stigmaeus speckled sanddab I 63 3.6 3.6
Hypsopsetta guttuIata diamond turbot I 53 3.6 3.6Leuresthes tenuis California grunion I 40 0.7 0.7
Para/ichthys ca/ifomicus California halibut I 50 1.5 1.5Strongylura exilis California needlefish I 470 145.0 145.2S)mgnathus leptorhynchus bay pipefish 1 221 1.9 1.9
Umbrina roncador yellowfin croaker I 95 14.1 14.1
) SHARKSIRAYSUrolophus halleri round stingray 13 74-200 23.7-504 3,456.7
INVERTEBRATESPachygrapsus crassipes striped shore crab 11 12-24 1.2-9.7 42.6
Portunus xantusii Xantus' swimming crab 5 25-45 3.9-11.2 40.1
Cancer productus red rock crab I 24 2.2 2.2Loxorhynchus crispatus moss crab I 5 0.2 0.2
Pugettia producta northern kelp crab I 20 5.2 5.2
Pugettia spp. kelp crabs I 23 6.3 6.3
Total: 332
G1-33

Impingement Results
Encina Power Station Impingement Abundance: Traveling Screen and Bar Rack Survey Data
SUITey: EPSIA049 Survey Date: May 25 - 26, 2005Sample Count: 19
Survey Length Weight Total
Taxon Common Name Count Range (mm) Range (g) Weight (g)
FISHESCymatogaster aggregata shiner surfperch 94 33-110 0.9-30.1 539.1
Seriphus po/itus queenfish 20 55-94 2.9-11.8 160.7
Anchoa compressa deepbody anchovy 18 66-160 2.8-20.5 194.0
Atherinops ajjinis topsmelt 14 47-132 1.0-32.8 151.8
Phanerodonfurcatus white surfperch 7 50-75 2.9-6.6 31.8
Hyperprosopon argenteum walleye surfperch 6 55-147 3.6-88.1 184.8
Porichthys myriaster specklefin midshipman 6 73-311 5.8-425 994.7
Leptocottus armatus Pacific staghorn sculpin 5 73-95 7.7-15.4 54.1
Roncador stearnsi spotfin croaker 5 90-337 13.3-780 840.5
Amphistichus argenteus barred surfperch 3 54-70 4.7-6.8 18.1Anchoa de/icatissima slough anchovy 2 61-63 2.7-3.1 5.8
Strongylura exi/is California needlefish 2 281-367 22.8-58.4 81.2
Anisotremus davidsonii sargo I 81 11.9 11.9
Rhacochilus vacca pile surfperch I 71 10.1 10.1
Embiotocajacksoni black surfperch I 65 7.1 7.1
Engraulis mordax northern anchovy I 77 3.3 3.3
Paralabrax clathratus kelp bass I 65 4.8 4.8
Paralabrax maculatofasciatus spotted sand bass I 62 4.3 4.3
Paralabrax nebulifer barred sand bass I III 30.4 30.4
Paralichthys califomicus California halibut I 117 22.2 22.2Sardinops sagax Pacific sardine I 165 47.7 47.7
Syngnathus spp. pipefishes I 85 0.2 0.20,
J SHARKSIRAYSUrolophus halleri round stingray 2 119-176 87.3-378 465.1
Gymnura marmorata California butterfly ray I 395 581 580.9
INVERTEBRATESPachygrapsus crassipes striped shore crab 13 10-40 0.4-40.0 82.6
Portunus xantusii Xantus' swimming crab 5 23-29 1.1-5.7 18.2
Cancer productus red rock crab 2 26-30 2.5-3.7 6.2
Total: 215
G1-34

Impingement Results
Encina Power Station Impingement Abundance: Traveling Screen and Bar Rack Survey Data
Survey: EPSIAOSO Survey Date: June 1 - 2, 2005Sample Count: 19
Survey Lengtb Weigbt Total
Taxon Common Name Count Range (mm) Range (g) Weigbt (g)
FISHESCymatogaster aggregata shiner surfperch 140 27-110 1.2-29.4 693.4
Phanerodonfurcatus white surfperch 19 51-78 3.1-8.7 115.6
Atherinops affinis topsmelt II 86-130 4.6-26.9 105.4
Anchoa compressa deepbody anchovy 9 76-105 4.8-14.2 90.2
Porichthys myriaster specklefin midshipman 6 240-280 134-281 1,152.8
Seriphus palitus queenfish 6 38-81 0.7-7.6 17.7
Anchoa delicatissima slough anchovy 5 35-67 0.8-3.2 8.2
Hyperprosopan argenteum walleye surfperch 5 51-60 3.6-5.3 22.8
Paralichthys californicus California halibut 4 40-155 2.9-41.1 106.3
Citharichthys stigmaeus speckled sanddab 3 41-71 1.0-5.7 10.5
Paralabrax clathratus kelp bass 3 57-75 3.8-6.2 15.8
Genyonemus lineatus white croaker 2 82-86 9.0-10.7 19.7
Heterostichus rostratus giant kelpfish 2 75-122 2.8-12.0 14.8
Paralabrax nebulifer barred sand bass 2 63 4.2-5.9 10.1
Atractoscion nobilis white seabass I 441 980 980.0
Hypsopsetta guttulata diamond turbot I 55 3.0 3.0
Leuresthes tenuis California grunion 1 51 1.1 1.1Paralabrax maculatofasciatus spotted sand bass I 250 293.0 292.5
Sardinops sagax Pacific sardine I 40 1.0 1.0
SHARKSIRAYSGymnura marmorata California butterfly ray 2 226-339 119-274 393.0
Urolophus ha/leri round stingray 2 171-297 276-460 735.7
Myliobatis californica bat ray I 940 975 975.0
Rhinobatos productus shovelnose guitarfish I 374 160.8 160.8
INVERTEBRATESPachygrapsus crassipes striped shore crab 10 12-25 1.5-3.6 26.9
Pyromaia tuberculata tuberculate pea crab 4 10-18 1.0-3.3 7.8
Portunus xantusii Xantus' swimming crab 2 30-37 3.9-8.6 12.5
Cancer spp. cancer crabs 1 28 3.0 3.0
Majidae spider crabs I 13 1.8 1.8
Pugettia spp. kelp crabs I II 0.9 0.9
Total: 247
G1-35

Impingement Results
Encina Power Station Impingement Abundance: Traveling Screen and Bar Rack Survey Data
Survey: EPSIA051 Survey Date: June 8 - 9,2005Sample Count: 19
Survey Length Weight Total
Taxon Common Name Count Range (mm) Range (g) Weight (g)
FISHESCymatogaster aggregata shiner surfperch 129 30-93 1.1-19.1 491.1Atherinops ajJinis topsmelt 28 18-209 0.8-51.2 366.3Anchoa compressa deepbody anchovy 14 24-82 0.4-7.3 28.5
Paralichthys cali/omicus California halibut 11 50-128 2.1-30.3 163.3EngrauJis mordax northern anchovy 10 36-110 0.2-10.5 19.9
Seriphus politus queenfish 10 68-110 4.6-19.2 95.4Porichthys myriaster specklefin midshipman 7 235-413 156-739 1,7%.8PhanerodonjUrcatus white surfperch 4 48-67 3.2-7.6 19.6Amphistichus argenteus barred surfperch 3 60-74 5.5-10.9 25.7Leptocottus armatus Pacific staghorn sculpin 3 81-85 8.5-13.7 35.3Strongylura exilis California needlefish 3 368-534 42.3-225 430.6Heterostichus rostratus giant ke1pfish 2 80-95 3.6-6.0 9.6Sardinops sagax Pacific sardine 2 131-132 23.7-25.6 49.3Anchoa spp. anchovy I 8.5 8.5Hyperprosopon argenteum walleye surfperch I 57 4.2 4.2Hypsoblennius gentilis bayblenny I 69 6.4 6.4Hypsopsetta guttuJata diamond turbot I 54 3.7 3.7
SHARKSIRAYSMyliobatis cali/omica bat ray 2 206-255 188-290 477.8
Ophichthus zophochir yellow snake eel I 787 595.0 594.6
INVERTEBRATESPachygrapsus crassipes striped shore crab 5 18-20 0.9-5.5 13.0
Total: 239
Survey: EPSIA052 Survey Date: June 15 - 16, 2005Sample Count: 19
Survey Length Weight Total
Taxon Common Name Count Range (mm) Range (g) Weight (g)
FISHESCymatogaster aggregata shiner surfperch 19 45-109 2.2-25.2 105.4Engraulis mordax northern anchovy 4 59-67 1.0-2.6 7.4
Porichthys myriaster specklefm midshipman 3 230-290 142-243 594.3Atherinops affinis topsmelt 2 90-95 4.5-5.3 9.8
Heterostichus rostratus giant kelpfish 2 61-95 1.3-5.6 6.9
Anchoa compressa deepbody anchovy I 4.2 4.2Atractoscion nobilis white seabass I 340 411 411.0
Citharichthys stigmaeus speckled sanddab I 70 4.9 4.9
Paralabrax maculatofasciatus spotted sand bass I 300 761.0 761.4PhanerodonfUrcatus white surfperch I 60 5.8 5.8
Seriphus politus queenfish I 50 1.6 1.6
INVERTEBRATESPachygrapsus crassipes striped shore crab 7 15-27 0.5-6.6 18.4Portunus xantusii Xantus' swimming crab I 35 6.1 6.1
Total: 45
G1-36

Impingement Results
\J
Encina Power Station Impingement Abundance: Heat Treatment Survey Data
Survey: EPSTSOOISurvey Date: July 03-04, 2004 Length Weight Total
Survey Range Range WeightTaxon Common Name Count (mm) (g) (g)FISHESCymatogaster aggregata shiner surfperch 6,554 47-115 2.9-31.1 31,301.3Anchoa compressa deepbody anchovy 6,439 65-120 2.2-20.5 61,726.7Atherinops affinis topsmelt 5,061 52-108 l.l-15.0 16,090.2Sardinops sagax Pacific sardine 4,401 47-106 0.8-8.5 8,798.2Heterostichus rostratus giant kelpfish 532 47-122 l.l-19.4 3,587.8Atractoscion nobilis white seabass 75 108-366 19.0-650 16,045.0Girella nigricans opaleye 72 44-221 3.0-390 6,223.0Seriphus politus queenftsh 54 83-188 8.0-80.0 2,293.0Strongy/ura exilis California needlefish 53 102-630 1.0-480 806.0Para/abrax macu/atofasciatus spotted sand bass 49 100-358 30.0-980 8,941.7Embiotocajacksoni black surfperch 39 82-197 17.0-270 1,754.0Porichthys myriaster specklefm midshipman 28 124-403 140-820 8,733.0Chromis punctipinnis blacksmith 26 65-163 6.0-140 720.0Hypsoblennius gentilis bay blenny 26 40-91 3.0-25.0 354.3Syngnathus spp. pipefishes 25 128-251 1.0-3.0 29.3Hypsob/ennius spp. blennies 23 35-54 1.0-3.0 46.7Ophichthus zophochir yellow snake eel 14 488-790 1l0-650 4,750.0Roncador stearnsi spotfm croaker 12 80-145 11.0-48.0 395.0
..
" Hyperprosopon argenteum walleye surfperch 8 78-150 12.0-60.0 366.0) Para/abrax nebu/ifer barred sand bass 8 119-252 40.0-320 819.0
Hypsopsetta guttu/ata diamond turbot 4 195-228 210-300 980.0Hypsypops rubicundus garibaldi 3 122-169 73.0-230 523.0Trachurus symmetricus jack mackerel 3 lll-142 17.0-40.0 78.0Umbrina roncador yellowfin croaker 2 137-150 43.0-61.0 104.0Xenistius califoriensis salema 2 88-98 17.0-60.0 77.0Anisotremus davidsonii sargo I 130 44.0 44.0Chei/otrema satumum black croaker I 48 3.0 3.0Parac/inus integripinnis reef finspot I 49 3.0 3.0Para/abrax c/athratus kelp bass I 157 82.0 82.0P/euronichthys ritteri spotted turbot I 152 98.0 98.0Scorpaenidae scorpionfishes I 122 62.0 62.0Sphyraena argentea California barracuda I 91 5.0 5.0
SHARKSIRAYSUrolophus halleri round stingray 439 125-230 100-700 118,655.1My/iobatis californica bat ray 64 221-660 140-4,700 29,566.1Gymnura marmorata California butterfly ray 12 240-550 120-950 4,321.8Muste/us californicus gray smoothhound 1 575 520 520.0Triakis semifasciata leopard shark 1 411 260 260.0
INVERTEBRATESPachygrapsus crassipes striped shore crab 49 32-46 22.0-45.0 269.0Octopus spp. octopus 20 2,500.0 2,500.0Pyromaia tuberculata tuberculate pea crab 19Panulirus interruptus California spiny lobster 1 176 120 120.0Pugettia spp. kelp crabs 1 42 26.0 26.0
Total: 24,127
G2·1

Impingement Results
Encina Power Station Impingement Abundance: Heat Treatment Survey Data
Survey: EPSTS002Survey Date: August 28, 2004 Length Weight Total
Survey Range Range Weight
Taxon Common Name Count (mm) (g) (g)
FISHESAnchoa compressa deepbody anchovy 5,324 72-120 5.9-20.9 59,754.9
Atherinops affinis topsmelt 3,201 51-100 1.0-10.6 17,701.4
Cymatogaster aggregata shiner surtperch 2,801 56-104 5.0-24.5 28,011.1
Sardinops sagax Pacific sardine 1,206 65-130 1.8-25.0 7,355.5
Leuresthes tenuis California grunion 998 43-115 0.8-10.4 2,058.8
Heterostichus rostratus giant kelpfish 299 78-185 2.9-53.6 3,440.4
Seriphus palitus queenfish 265 65-225 2.3-172.3 12,690.8
Atractoscion nobilis white seabass 64 115-265 40.4-260.7 7,425.4
Cheilotrema satumum black croaker 38 64-155 4.8-53.2 617.9
Strongylura exilis California needlefish 27 109-478 1.0-145.2 1,624.8
Paralabrax maculatofasciatus spotted sand bass 20 43-335 1.5-925 7,724.0
Hypsoblennius jenkinsi mussel blenny 18 39-95 0.8-14.7 97.8
Sciaenidae unid. croaker 17 120-200 32.8-138.0 1,212.0
Chromis punctipinnis blacksmith 15 55-165 7.0-105 458.8
Girella nigricans opa1eye 14 55-211 4.5-321 1,567.7
Scomberjapanicus Pacific mackerel 14 67-187 14.5-86.8 650.0
Hermosilla azurea zebra perch 13 35-68 1.1-8.7 41.8
Hypsoblennius gentilis bayblenny 11 42-95 1.4-15.5 99.5
Paralabrax nebulifer barred sand bass 11 160-278 82.3-490 2,866.9
) Syngnothus spp. pipefishes 11 154-208 1.0-2.0 16.0
Ophichthus zophochir yellow snake eel 10 262-900 7.6-750 4,045.4
Hypsoblennius gilberti rockpool blenny 8 55-101 3.2-29.4 77.1
Paralichthys califomicus California halibut 8 201-322 142-600 2,482.0
Embiotoca jacksoni black surtperch 7 70-345 15.0-500 1,049.7
Hypsoblennius spp. blennies 7 45-85 1.3-10.5 20.6
Anisotremus davidsonii sargo 6 38-180 1.0-142 389.3 .
Paralabrax spp. sand bass 6 43-75 1.5-5.8 18.5
Xenistius califoriensis salema 6 87-132 11.4-34.5 117.0
Atherinopsidae silverside 5 47-55 1.1-2.9 11.3
Pleuronichthys ritteri spotted turbot 5 197-220 200-250 1,158.0
Seriola lalandi yellowtail jack 4 33-99 1.0-32.0 56.0
Sphyraeno argentea California barracuda 4 245-268 55.9-78.2 272.6
Trachurus symmetricus jack mackerel 4 90-160 7.1-46.8 105.6
Engraulis mordax northern anchovy 3 64-65 1.8-2.2 5.9
Porichthys myriaster specklefm midshipman 3 255-328 151-260 586.0
Umbrina roncador yellowfin croaker 2 150-165 43.9-63.3 107.2
unidentified fish, damaged unidentified damaged fish 2 165-308 21.6-200 221.6
Hyperprosopon argenteum walleye surtperch 1 140 64.2 64.2
Menticirrhus undulatus California corbina 1 510 1,600.0 1,600.0
Paralabrax clathratus kelp bass 1 138 48.6 48.6
Peprilus simillimus Pacific butterflsh 1 117 33.4 33.4
SHARKSIRAYSUrolophus halleri round stingray 198 198-355 75.0-412 39,361.7
Myliobatis califomica bat ray 31 230-484 200-900 12,310.0
Gymriura marmorata California butterfly ray 3 265-460 120-700 1,220.0
Mustelus califomicus gray smoothhound 2 805-905 1,400-1,600 3,000.0
Dasyatis dipterura diamond stingray 1 274 850 850.0
(table continued)
G2-2

Impingement Results
Encina Power Station Impingement Abundance: Heat Treatment Survey Data
Survey: EPSTS002 (continued)Survey Date: August 28, 2004 Length Weight Total
Survey Range Range WeightTaxon Common Name Count (mm) (g) (g)INVERTEBRATESLophopanopeus spp. black-clawed crabs 26 10-16 0.3-1.8 27.1Octopus spp. octopus 17 27-470 1.1-450 1,851.3Pachygrapsus crassipes striped shore crab 15 17-35 2.3-24.1 139.7Panulirus interruptus California spiny lobster 6 180-211 125-229 944.9Cancerspp. cancer crabs 5 21-32 1.7-6.2 16.9Pugettia producta northern kelp crab 2 12.5-25 1.3-8.7 10.0Panda/us spp. unidentified shrimp 1 42 0.7 0.7
Total: 14,768
G2-3

Impingement Results
Encina Power Station Impingement Abundance: Heat Treatment Survey Data
Survey: EPSTS003Survey Date: October 23, 2004 Length Weight Total
Survey Range Range WeightTaxon Common Name Count (mm) (g) (g)FISHESAtherinopsis californiensis jacksmelt 4,450 59-150 1.7-37.9 44,009.9Leuresthes tenuis California grunior 4,296 56-124 1.5-22.5 25,732.5Anchoa compressa deepbody anchovy 1,694 67-114 3.7-19.8 20,669.4Xenistius califoriensis salema 718 40-68 1.4-7.7 1,510.9Cymatogaster aggregata shiner surtperch 512 58-96 4.5-20.5 6,092.9Sardinops sagax Pacific sardine 507 65-242 3.2-150 6,274.8Cheilotrema saturnum black croaker 249 93-132 16.8-61.5 8,408.2Paralabrax nebulifer barred sand bass 207 55-173 4.5-160.7 4,308.5Paralabrax maculatofasciatus spotted sand bass 188 45-170 2.1-122.3 3,038.3An~ouemusdQvidSonil sargo 185 54-95 2.6-28.8 1,974.4Paralabrax clathratus kelp bass 128 28-96 0.6-23.2 876.0llyperprosoponargenreum walleye surtperch 116 90-152 30.6-118.5 8,891.7Atractoscion nobilis white seabass 100 140-264 90.0-320 18,017.0llypsoblennius spp. blennies 83 422.0llypsoblennius jenkinsi mussel blenny 65 30-80 2.0-16.0 332.0Engraulis mordax northern anchovy 59 64-82 2.4-4.9 194.9lleterostichus rostratus giant kelpfisl: 58 80-200 5.1-79.4 1,531.1Medialuna californiensis halfinoon 49 43-117 2.5-54.6 1,278.5Seriphus palitus queenfish 43 40-160 1.0-80.0 1,428.0llermosilla azurea zebra perch 36 37-71 1.7-11.4 216.0Sphyraena argentea California barracuda 36 135-233 16.9-74.4 1,250.4Girella nigricans opaleye 24 49-256 2.8-740 6,270.3Seriola lalandi yellowtailjack 17 80-194 7.8-145.7 922.3Strongylura exilis California needlefisl 17 400-574 80.0-360 2,650.0Ophichthus zophochir yellow snake eel 13 560-790 170-520 4,589.0Phanerodon furcatus white surtperch 11 69-120 8.6-39.3 195.0Chromis punctipinnis blacksmith 10 47-83 6.1-13.1 96.2llyperprosopan spp. surtperch 7 552.0Embiotoca jacksoni black surtperch 6 78-163 13.7-171.1 525.3Fundulus parvipinnis California killifisl 3 6.9Menticirrhus undulatus California corbinf 3 210-340 110-550 860Amphistichus argenteus barred surfPerch 1 96 25.4 25.4llyporhamphus rosae California haltbea1< 1Mugil cephalus striped mullet 1 152 53.9 53.9Pleuronichthys ritteri spotted turbot 1 185 180 180.0SarckJ chiliensis Pacific bonito 1 340 540 540.0Scomberjaponicus Pacific mackerel 1 250 230 230.0Trachurus symmeUicus jack mackerel 1 144 39.6 39.6
SHARKSIRAYSUrolophus halleri round stingray 55 230-350 130-560 13,610.0Myliobatis californica bat ray 4 280-480 320-1,700 2,930.0Mustelus californicus gray smoothhound 1 790 1,500.0 1,500.0
INVERTEBRATE~
Pachygrapsus crassipes striped shore crab 375 20-40 1.5-10.1 2,489.6Octopus bimaculatus California two-spot octopus 74 2.1-230 2,805.9Octopus spp. octopus 36 1,562.0 1,562.0Cancer antennarius brown rock crab 18 18.0 18.0Cancerproductus red rock crab 11 15-55 1.2-10.5 40.0Pilumnus spinohirsutus retiring hairycral: 4 9-23 0.6-2.5 4.6Pugettia producta northern kelp crab 4 21-28 1.7-4.3 11.3Portunus xantusii Xantus' swimming crab 2 45 4.0-6.1 10.1Panulirus interruptus California spiny lobstel 1 21 8.1 8.1
Total: 14,482
G2-4

Impingement Results
Encina Power Station Impingement Abundance: Heat Treatment Survey Data
Survey: EPSTS004Survey Date: February 13-14, 2005 Length Weight Total
Survey Range Range WeightTaxon Common Name Count (mm) (g) (g)
FISHESAtherinops affinis topsmelt 3,847 62-151 1.5-90.0 17,444.3Atherinopsidae silverside 2,100 8,650.0Hyperprosopon argenteum walleye surtperch 1,828 110-177 34.9-135 80,128.0Atractoscion nobilis white seabass 1,375 104-352 65.5-600 289,213.3Anchoa compressa deepbody anchovy 643 58-122 1.9-18.8 5,786.5Xenistius califoriensis salema 602 43-70 1.4~1O.0 2,102.3Sardinops sagax Pacific sardine 437 45-184 1.6-71.0 3,190.0Paralabrax nebulifer barred sand bass 416 50-127 2.4-43.4 3,323.5
Cymatogaster aggregata shiner surtperch 343 11-134 1.1-72.8 10,082.7
Leuresthes tenuis California gnmion 330 56-82 1.4-4.8 706.0Paralabrax clathratus kelp bass 293 53-102 2.2-20.5 2,397.8Hypsoblennius gentilis bay blenny 288 38-102 1.3-23.7 1,334.3Paralabrax maculatofasciatus spotted sand bass 271 43-265 1.4-440 3,222.3Anisotremus davidsonii sargo 195 49-352 3.4-1,300 33,558.2
Girella nigricans opaleye 171 28-240 1.6-510 2,674.8
Seriphus politus queenfish 57 38-292 0.1-225 641.0
Atherinopsis californiensis jacksmelt 18 112-299 10.9-210 1,142.0Roncaoor stearnsi spotfin croaker 13 238-555 300-3,400 13,831.0
Hypsopsetta guttulata diamond turbot 12 36-246 1.0-350 2,694.6
) Syngnathus spp. pipefishes 12 146-233 0.3-4.4 20.5Chromis punctipinnis blacksmith 11 46-102 2.2-79.5 179.2
Ophichthus zophochir yellow snake eel 11 394-758 32.7-470 3,222.7
Embiotocajacksoni black surtperch 10 105-255 40.9-600 1,403.2
Amphistichus argenteus barred surtperch 9 96-227 27.3-377.6 680.4Heterostichus rostratus giant kelpfish 9 90-225 5.1-110.0 322.1
Genyonemus lineatus white croaker 8 80-95 8.2-14.3 68.8Anchoa delicatissima slough anchovy 7 51-60 0.9-1.9 9.7Chub, unid. unid. chub 7 68-81 4.5-7.8 43.7Hermosilla azurea zebra perch 7 50-365 2.8-590 2,481.3Brachyistiusfrenatus kelp surtperch 6 76-120 11.0-55.8 198.4Engraulis mordax northern anchovy 6 80-125 3.8-15.2 54.1
Pleuronichthys ritteri spotted turbot 5 200-230 215-250 1,145.0MugU cephalus striped mullet 4 345-400 800-1,100 3,800.0
PhanerodonjUrcatus white surtperch 4 112-126 37.7-55.0 190.4
Umbrina roncaoor yellowfm croaker 4 185-280 70.0-300 730.0Paraclinus integripinnis reef finspot 3 58-70 2.0-4.0 9.2Paralichthys californicus California halibut 3 222-350 113-700 1,433.0
Sphyraena argentea California barracuda 3 167-222 21.9-65.0 127.6Trachurus symmetricus jack mackerel 3 95-110 10.0-17.0 42.4Fundulus porvipinnis California killifish 2 7.5-7.8 0.4 0.8Porichthys myriaster specklefm midshipman 2 395-396 820-900 1,720.0Strongylura exilis California needlefish 2 480-490 120-150 270.0Albula vulpes bonefish 1 380 900 900.0
Citharichthys spp. sanddabs 1 3.4 3.4Medialuna californiensis halfinoon 1 234 410 410.0
Sarda chiliensis Pacific bonito 1 0.1 0.1Scorpaenidae scorpionfishes 1 44 1.9 1.9unidentified fish, damaged unidentified damaged fish 1,543.2
(table continued)
G2-5

Encina Power Station Impingement Abundance: Heat Treatment Survey Data
Impingement Results
Survey: EPSTS004 (continued)Survey Date: February 13-14,2005
TaxonSHARKSIRAYSUrolophus halleriMyliobatis californicaGymnura marmorata
Common Name
round stingraybat rayCalifornia butterfly ray
Length Weight Total
Survey Range Range Weight
Count (mm) (g) (g)
10 135-245 101-530 2,576.1
4 335-460 200-1,500 3,130.0
2 430-450 800 1,600.0
INVERTEBRATESPortunus xantusiiCancer jordaniOctopus bimaculatusPachygrapsus crassipesCancer antennariusCancer magisterCaridean unid.Octopus spp.Pandalus spp.Panulirus interruptusPugettia producta
Xantus' swimming crab 44 20-67 1.1-34.4 337.5
hairy rock crab 18 28-47 3.2-16.3 85.5
California two-spot octopus 11 19-180 12-590 2,424.3
striped shore crab 9 13-23 1.0-4.4 16.6
brown rock crab 8 40-50 14.9-27.8 138.2
dungeness crab 1 50 18.1 18.1
unidentified shrimp 1octopus 1 30 300 300.0
unidentified shrimp 1 12 2.3 2.3
California spiny lobster 1 93 150 150.0
northern kelp crab 1 17 1.8 1.8
Total: 13,494
G2-6

Impingement Results
Encina Power Station Impingement Abundance: Heat Treatment Survey Data
Survey: EPSTS005Survey Date: April 10, 2005 Length Weight Total
Survey Range Range Weight
Taxon Common Name Count (mm) (g) (g)
FISHESCymatogaster aggregata shiner surfperch 2,372 90-120 18.0-46.0 93,799.4
Leuresthes tenuis California grunion 1,443 75-145 3.5-37.9 12,351.6
Anchoa compressa deepbody anchovy 1,112 58-120 2.0-21.0 10,598.8
Paralabrax nebulifer barred sand bass 508 54-97 2.6-98.0 4,270.9
Seriphus politus queenfish 306 56-152 3.1-49.6 2,284.2
Hyperprosopon argenteum walleye surfperch 298 101-167 30.2-119 19,132.6
Paralabrax clathratus kelp bass 181 50-94 3.4-18.3 1,546.0
Anisotremus davidsonii sargo 180 55-100 3.6-30.3 22,582.2
Paralabrax maculatofasciatus spotted sand bass 139 50-185 3.0-140.3 2,564.2
Hypsoblennius jenkinsi mussel blenny 92 25-90 1.1-11.6 516.3
Umbrina roncador yellowfm croaker 90 73-290 7.4-474.2 20,568.5
Xenistius califoriensis salema 90 50-74 2.1-7.4 409.2
Girella nigricans opaleye 72 33-197 1.4-309 13,859.1
Hypsopsetta guttulata diamond turbot 51 75-260 11.2-424 11,199.9
Hypsoblennius gentilis bay blenny 27 65·105 4.5-23.5 172.7
Porichthys myriaster specklefin midshipman 24 320-440 100-1,300 20,380.0
Amphistichus argenteus barred surfperch 19 110-130 26.2-66.4 1,562.7
Chromis punctipinnis blacksmith 12 60-115 6.4-41.2 294.7
')Brachyistiusfrenatus kelp surfperch 9 95-145 20.9-65.7 324.9
Strongylura exilis California needlefish 9 336-490 45.5-148.4 733.3
Engraulis mordax northern anchovy 7 67-120 2.9-16.5 41.6
Hermosilla azurea zebra perch 6 104-249 16.2-535 778.7
Syngnathus spp. pipefishes 5 160-340 1.4-12.5 20.4
Roncador stearnsi spotfm croaker 4 85-285 10.5-407 574.8
Atractoscion nobilis white seabass 3 251-320 211-440 1,010.5
Embiotocajacksoni black surfperch 3 55-138 5.0-103 199.6
Leptocottus armatus Pacific staghorn sculpin 3 60-65 3.0-5.0 12.9
Medialuna californiensis halfmoon 3 117-147 43.6-77.6 175.5
Trachurus symmetricus jack mackerel 3 115-430 15.9-270 360.5
Ophichthus zophochir yellow snake eel 2 379-664 29.4-319 348.7
Citharichthys stigmaeus speckled sanddab 1 115 29.5 29.5
Fundulus parvipinnis California killifish 1 53 3.2 3.2
Genyonemus lineatus white croaker 1 79 10.0 10.0
Halichoeres semicinctus rock wrasse 1 124 32.5 32.5
Heterostichus rostratus giant kelpfish 1 176 46.1 46.1
Menticirrhus undulatus California corbina 1 305 430 430.0
Phanerodon jitrcatus white surfperch 1 115 56.0 56.0
Pleuronichthys ritteri spotted turbot 1 175 163.7 163.7
Pleuronichthys verticalis hornyhead turbot 1 55 3.7 3.7
SHARKSIRAYSUrolophus halleri round stingray 25 100-450 50.0-634 8,199.8
Gymnura marmorata California butterfly ray 12 256-568 150-1,714 6,682.1
Myliobatis californica bat ray 6 258-420 230-2,189 5,049.5
Heterodontus francisci hom shark 1 460 850 850.0
.1 Mustelus cali/ornicus gray smoothhound 1 975 1,800.0 1,800.0) (table continued)
G2-7

Impingement Results
Encina Power Station Impingement Abundance: Heat Treatment Survey Data
Survey: EPSTSOOS (continued)Survey Date: April 10, 2005 Length Weight Total
Survey Range Range WeightTaxon Common Name Count (mm) (g) (g)
INVERTEBRATESPachygrapsus crassipes striped shore crab 38 8-43 0.1-45.1 125.2Cancerspp. cancer crabs 31 20-30 1.2-3.4 70.4Portunus xantusii Xantus' swimming crab 13 20-50 2.1-18.1 95.4Octopus bimaculatus California two-spot octopus 6 25-80 5.6-100 233.7Pugettia producta northern kelp crab 2 20-30 4.0-11.5 15.5Cancer antennarius brown rock crab 1 46 14.2 14.2Crangon nigromaculata spotted bay shrimp 1 60 3.7 3.7
Total: 7,219
G2-8

Impingement Results
Encina Power Station Impingement Abundance: Heat Treatment Survey Data
Survey: EPSTSOO(iSurvey Date: June OS, 2005 Length Weight Total
Survey Range Range WeightTaxon Common Name Count (mm) (g) (g)FISHESAnchoa compressa deepbody anchovy 8,144 29-130 1.3-24.3 95,729.6Cymatogaster aggregata shiner surfperch 5,779 37-100 1.1-28.1 50,780.1Atherinops affinis topsmelt 3,587 30-105 0.2-12.5 16,261.1Paralabrax maculatofasciatus spotted sand bass 869 52-204 3.2-255 82,072.6Paralabrax nebulifer barred sand bass 843 60-115 5.4-42.0 17,169.5Anisotremus davidsonii sargo 396 44-135 1.2-42.6 9,980.1Paralabrax clathratus kelp bass 372 45-136 2.1-63.1 8,328.2Hyperprosopon argenteum walleye surfperch 296 20-159 0.3-300 16,851.8Seriphus politus queenfish 204 26-170 2.1-105 2,053.4Porichthys myriaster speckiefin midshipmar 161 190-440 49.3-1,085 35,440.5Xenistius califoriensis salema 159 45-175 4.7-60.5 1,937.9Hypsoblennius gentilis bay blenny 88 50-100 2.4-19.0 853.0Chromis punctipinnis blacksmith 77 60-186 8.0-100 2,682.2Roncador stearnsi spotfm croaker 77 85-140 15.1-55.2 2,359.5Strongylura exilis California needlefisl: 50 260-543 28.4-294 5,815.3Hypsopsetta guttulata diamond turbot 45 121-300 146-374 9,509.2Phanerodon furcatus white surfperch 37 60-100 5.0-23.1 381.5Umbrina roncador yellowfin croaker 29 95-125 16.3-42.7 889.7Sardinops sagax Pacific sardine 27 70-178 1.8-56.5 648.0Engraulis mordax northern anchovy 17 36-129 0.7-19.4 77.5Menticirrhus undulatus California corbim 11 125-388 30.4-806 2,034.7Fundulus porvipinnis California killifisl 10 30.2Paralichthys californicus California halibu 10 72-264 6.7-172 854.2Heterostichus rostratus giant kelpfisl: 9 60-203 1.1-75.2 160.8Amphistichus argenteus barred surt'perch 5 60-160 6.2-75.2 259.3Embiotoca jacksoni black surfperch 4 65-155 15.2-151 435.1Syngnathus spp. pipefishes 3 20-217 0.4-1.8 3.8Brachyistiusfrenatus kelp surfperch 2 115-130 23.1-51.9 75.0Girella nigricans opaleye 2 160-180 87.6-140.9 228.5Hypsypops rubicundus garibald 2 222-232 668-705 1,373.7Leptocottus armatus Pacific staghorn sculpir 2 75 5.2-8.3 13.5Sphyraena argentea California barracuda 2 95-105 4.7-6.6 11.3Atractoscion nobilis white seabass 1 252 345.0 344.8Ophichthus zophochir yellow snake eel 1 650 347 347.0Pleuronichthys verticalis hornyhead turbot 1 197 248.0 247.7Trachurus symmetricus jack mackerel 1 200 75.8 75.8Zoarcidae eelpouts 1 152 17.1 17.1
SHARKSIRAYSUrolophus halleri round stingray 363 105-239 54.3-800 118,389.8Gymnura marmorata California butterfly ra} 41 244-609 182-1,629 22,997.3Myliobatis californica bat ray 23 226-649 205-1,925 15,585.9Mustelus californicus gray smoothhound 17 460-882 225-2,100 13,056.0Dasyatis dipterura diamond stingray 1 275 618.0 617.6Triakis semifasciata leopard shark 1 455 428.0 428.4
INVERTEBRATE~
Cancer productus red rock crab 491 10-55 1.8-12.8 2,835.9Pachygrapsus crassipes striped shore crab 8 19-29 3.7-10.5 61.3Majidae spider crabs 6 10-15 2.1-5.2 20.2Octopus spp. octopus 2 20-45 9.7-86.2 95.9Pugettia producta northern kelp crab 2 22-30 2.4-5.4 7.8
Total: 22,279
G2·9