Embed Size (px)
Citation preview
Attachment 1 – Recommended Manual for Emulsion-Based Chip Seals for Pavement Preservation
This proposed manual prepared as part of NCHRP Project 14-17, “Manual for Emulsion-Based Chip Seals for Pavement Preservation” is a recommendation by NCHRP Project 14-17 staff at Colorado State University. This manual has not been approved by NCHRP or any AASHTO committee or formally accepted for adoption by AASHTO.
I
TABLE OF CONTENTS
ATTACHMENT 1 – RECOMMENDED MANUAL FOR EMULSION-BASED CHIP SEALS FOR PAVEMENT PRESERVATION.................................................................. 1
1 INTRODUCTION....................................................................................................... 1
1.1 Definition of Chip Seals.......................................................................................................................................1
2 FACTORS AFFECTING CHIP SEAL PERFORMANCE .......................................... 2
2.1 Pavement Behavior and Condition .....................................................................................................................2
2.2 Traffic Characteristics ........................................................................................................................................3
2.3 Geometry ...........................................................................................................................................................4
2.4 Highway, Residential, Urban or Rural ..............................................................................................................4
2.5 Materials.............................................................................................................................................................5
2.6 Construction Preparation .................................................................................................................................8
2.7 Maintenance .......................................................................................................................................................8
3 DESIGN AND CONSTRUCTION CONSIDERATIONS............................................ 9
3.1 Identifying Appropriate Pavements to Chip Seal .............................................................................................9
3.2 Type of Seal ..........................................................................................................................................................9 3.2.1 Single Chip Seal..............................................................................................................................................9 3.2.2 Double Chip Seal ............................................................................................................................................9 3.2.3 Single Chip Seal with Choke Stone ................................................................................................................9 3.2.4 Fog Seal Applied to Chip Seals ......................................................................................................................9
3.3 Chip Seal Selection ...........................................................................................................................................10
3.4 Selecting the Aggregate Size ............................................................................................................................10
3.5 Evaluating the Pavement ..................................................................................................................................10 3.5.1 Surface Texture.............................................................................................................................................10 3.5.2 Penetration of Chips into Surface .................................................................................................................10 3.5.3 Variability of Surface Along Alignment.......................................................................................................10
3.6 Materials............................................................................................................................................................11
4 SELECTING THE APPROPRIATE CHIP SEAL.................................................... 18
4.1 Single Seal...........................................................................................................................................................18

Table of Contents
II
4.2 Single Seal with Choke Stone.............................................................................................................................18
4.3 Double Seal.........................................................................................................................................................18
5 CHIP SEAL MATERIALS SELECTION................................................................. 20
5.1 Chip Gradation ..................................................................................................................................................20
5.2 Modified or Unmodified Emulsion...................................................................................................................20
5.3 Fog Seal After Chip Seal ...................................................................................................................................20
5.4 Emulsion-Aggregate Compatibility..................................................................................................................20
6 CHIP SEAL DESIGN ............................................................................................. 22
6.1 Emulsion Application Rate ..............................................................................................................................22
6.2 Aggregate Application Rate..............................................................................................................................31
6.3 Time Until Sweeping and Traffic ....................................................................................................................32
6.4 Other Considerations .......................................................................................................................................32
6.5 Example Design.................................................................................................................................................32
7 CONSTRUCTION .................................................................................................. 34
7.1 Equipment Calibrations....................................................................................................................................34
7.2 Operations ..........................................................................................................................................................36
8 QUALITY CONTROL............................................................................................. 40
8.1 Aggregate Sieve Analysis ..................................................................................................................................40
8.2 Moisture Content of System..............................................................................................................................40
8.3 Embedment Depth Measurement During Construction ...............................................................................41
8.4 Field Viscosity ....................................................................................................................................................41
9 PERFORMANCE ................................................................................................... 42
9.1 Less Than One Year ..........................................................................................................................................42
9.2 Greater Than One Year .................................................................................................................................42
10 REFERENCES..................................................................................................... 43
Table of Contents
III
ATTACHMENT 2 – RECOMMENDED TEST METHODS............................................... 1
Recommended Standard Method of Test for Embedment Depth of Chip Seal Aggregates in the Lab and the Field ..............................................................................................................................................................................1
Recommended Standard Method of Test for Laboratory Chip Loss from Emulsified Asphalt Chip Seal Samples.........................................................................................................................................................................1
Recommended Standard Method of Test for Measuring Moisture Loss from Chip Seals ...................................1
Recommended Standard Method of Test for Recovery of Asphalt from Emulsion by Stirred-Can Method .....1
Recommended Standard Method of Test for Determining the Strain Sensitivity of Asphalt Emulsion Residue Using Strain Sweeps Performed on a Dynamic Shear Rheometer (DSR) ..............................................................1
1
1 Introduction This manual was developed for use in designing and constructing chip seals over hot mix asphalt pavements. It documents best practices gathered from around the world in addition to findings of research during NCHRP Project 14-17, “Manual for Emulsion-Based Chip Seals for Pavement Preservation.” In addition, certain subjective or qualitative judgments previously needed during chip seal construction have been eliminated in favor of field and laboratory testing. These include the moisture content of the seal before traffic can be released, judging surface condition so emulsion application rate can be adjusted for surface demand, and measuring the emulsion consistency in the field. The introduction of these new techniques should improve the probability of success when designing and constructing chip seals but they do not replace the significant judgment required. Also, the success of any chip seal depends on conformance to best practices, and variance or elimination of these practices often leads to disappointing performance.
1.1 Definition of Chip Seals
Chip seals described in this report are based on emulsified asphalt binders and natural mineral aggregate chips. The chip seal is constructed by spraying the asphalt emulsion onto the existing asphalt pavement and then dropping the aggregate chips into the asphalt emulsion. The purpose of the chip seal is to seal minor cracks in the surface of the asphalt pavement and provide additional friction.
2
2 Factors Affecting Chip Seal Performance The performance of a chip seal depends on many factors, including the condition of the pavement to which the chip seal is to be applied, pavement geometry, traffic volume and type, materials and construction practices. The following discussion describes these factors and their effects on performance of the chip seal.
2.1 Pavement Behavior and Condition
2.1.1 Deflection of Substrate
The amount of deflection is an indication whether future fatigue can be expected. If deflection is significant, a chip seal may be inappropriate. The maximum level of deflection will vary depending on the traffic volume, however, if fatigue cracking is already present, chip seal performance may be reduced. However, a chip seal may reduce moisture infiltration into the subgrade, thus reducing the potential for future fatigue. Therefore, the decision to chip seal over existing fatigue cracking requires judgment depending on the performance expectation of the existing pavement.
2.1.2 Cracking Severity
Chip seals are most effective as a pavement preservation technique before cracks are ranked as high severity (Peshkin, et al 2004) defined as greater than 3/8 inches wide. Although the chip seal binder has the ability to seal minor cracks greater than this width, as crack width increases, the emulsion residue is less effective at bridging the gap across the crack and sealants should be used to fill these cracks prior to chip sealing.
2.1.3 Flushing/Bleeding
Chip seals may be applied to remedy friction loss but penetration of chips into flushed pavement surfaces may limit effectiveness unless chips can be retained with lower emulsion application rates. Flushing and bleeding of the existing surface often occurs in wheelpaths. If this occurs, the emulsion application rate must be reduced in the wheelpaths to prevent future flushing and bleeding. This can only be accomplished with variable spray rate distributors or by varying the size of the nozzles in the distributor spray bar.
2.1.4 Texture
Surface roughness affects the amount of emulsion needed to hold aggregate chips in place. The texture of the substrate pavement should be evaluated using the sand patch test or CT Meter prior to chip sealing to determine whether an adjustment to the design emulsion application rate is appropriate and to what level.
Factors Affecting Chip Seal Performance
3
2.1.5 Soft Substrate Surface
A soft substrate surface can allow chips to be embedded in the surface after trafficking, resulting in possible flushing. The ball penetration test has been shown to be an effective tool for measuring this potential.
2.1.6 Uniformity
The amount of emulsion applied to the substrate may need to be varied if the substrate surface does not have the same texture and compliance along the alignment. Uniformity should be mapped prior to construction to identify locations where emulsion application rates should vary from design. Uniformity can also vary transverse to the centerline which often occurs when wheelpaths are flushed. In this case the emulsion application rate should be reduced in the wheelpaths by utilizing a distributor equipped with a variable application spray bar or placing smaller nozzles in the conventional distributor spray bar in locations that will affect the wheelpaths (Shuler 1991, Martin 1989).
2.2 Traffic Characteristics
The traffic volume and type of traffic affects the selection of materials utilized on chip seals. Generally, higher traffic volume and a higher percentage of heavy trucks on an undivided roadway present a greater liklihood for vehicle damage if traffic is not adequately controlled during construction. In addition, the volume and type of the traffic is directly related to the potential for chip embedment in the substrate. Also, traffic acceleration affects chip seal performance as chips are more likely to be dislodged under these loads than constant speeds which can lead to flushing and bleeding of the surface. This section discusses the factors that influence the materials selection process depending on traffic volume, type of traffic and speeds.
2.2.1 Chip Selection
Larger chips provide more tolerance for emulsion application variance and are less likely to become totally embedded by traffic if the substrate is resistant to embedment. Larger chips require higher emulsion application rates for proper embedment, thus increasing the sealing ability of the chip seal. However, large chips are noisier and provide higher risk of vehicular damage during construction.
2.2.2 Emulsion Selection
Emulsions modified with elastomeric polymers provide higher adhesion for aggregate chips often both during construction and later in the life of the seal. Also, research (Shuler 1991)
Factors Affecting Chip Seal Performance
4
indicates that on high traffic facilities (i. e., greater than 7500 vehicles per day per lane), modified asphalt emulsions are required to hold chips in place due to reduced emulsion application rates that are necessary to reduce the potential for embedment in the substrate and consequent flushing.
2.2.3 Fog Seal
The application of a fog seal over a fresh chip seal provides high color contrast that improves visibility of striping, and short-term performance improvement (Shuler 2007). Care should be taken whenever applying a fog seal since pavement friction could be reduced if the fog seal is applied at too high an application rate, the fog seal emulsion has a high residue content, or has not broken sufficiently to support uncontrolled traffic.
2.3 Geometry
2.3.1 Divided/Undivided
Divided alignments generally reduce the possibility for vehicle damage caused by loose, flying chips because of the separation of opposing traffic.
2.3.2 Gradient/Curves
Steep inclines and curves may adversely affect performance due to tractive forces and slower moving vehicles. Therefore, traffic control may need to remain in place until the emulsion has cured sufficiently to retain the chips.
2.3.3 Intersections
Turning, acceleration, and deceleration can cause chip loss and flushing. Therefore, traffic control may need to remain in place until the emulsion has cured sufficiently to retain the chips.
2.3.4 Width
Vehicle movement tends to be more concentrated on narrow, secondary roads than on wider primary facilities. This results in a greater tendency for flushing in the wheelpaths on these types of pavements.
2.4 Highway, Residential, Urban or Rural
2.4.1 Highway
Chip seals can be successfully constructed on highways with over 7500 vehicles per day per lane with little or no consequences with respect to vehicle damage (Shuler 1991) if important principles are followed. However, other factors should be considered regarding the use of chip seals on high traffic highway pavements. Because noise increases with increasing traffic volume and chip size, smaller aggregates are often desired for high traffic facilities. However, more
Factors Affecting Chip Seal Performance
5
accuracy relative to emulsion spray rate is needed when using smaller aggregates because the smaller embedment depth increases the potential for chip loss.
2.4.2 Residential
Chip seals constructed with larger aggregates are rough textured. This rough surface texture is often unpopular among roller skaters, skate-boarders or when individuals lie on the pavement to repair vehicles or other activities.
2.4.3 Rural
Rural settings are the most appropriate for chip seals. Traffic tends to move more consistently with less stopping and starting, volumes are often lower creating wider vehicle separation providing less possibility for vehicle damage.
2.4.4 Urban
Urban environments are often the most challenging environment for chip seals because of the higher traffic volumes and frequent turning, stopping and starting. Although chip seals can be constructed in such environments with success, the time required for emulsions to gain sufficient strength to resist the turning, acceleration, and deceleration of vehicles in large volumes is often long enough to preclude their use.
2.5 Materials
2.5.1 Aggregate Chips
2.5.1.1 Size, Shape and Gradation
Aggregates that interlock after construction rolling and early trafficking provide higher stability under loads. This interlocked aggregate surface is more resistant to displacement, and thus has a lower potential for dislodgement of chips and vehicle damage and flushing.
Larger aggregates require higher emulsion application rates in order to provide an equivalent embedment percentage as smaller aggregates. This higher application rate allows slightly more tolerance during construction with respect to depth of chip embedment in the binder. Also, the higher binder application provides greater sealing ability.
Aggregates retained between two adjacent sieve sizes provide the best interlock followed by aggregates that occupy the space between three adjacent sieve sizes; often described as one and two-sized aggregate chips, respectively. The performance of the one and two-sized chips is related to the manner by which the chips are embedded in the emulsion. If well-graded aggregates are used, the fine aggregate often enters the emulsion before the coarse aggregate causing the coarse aggregate to have less binder available for adhesion resulting in loss of the coarse fraction, vehicle damage and flushing.
2.5.1.2 Cleanliness
Factors Affecting Chip Seal Performance
6
Emulsified asphalts can be produced with the ability to coat aggregate chips containing small quantities of minus No. 200 aggregate. The maximum amount of this fine aggregate is dependent on the emulsion. For example, medium setting emulsions can tolerate a higher percentage than most rapid setting emulsions, often related to the demulsibility of the emulsion. The higher the demulsibility, the less minus No. 200 can be tolerated before setting occurs and loss of adhesion to the coarse chips.
2.5.1.3 Moisture Content
Aggregates in the saturated surface dry condition provide better resistance to sweeping than dry aggregates when asphalt emulsions are used. Therefore, construction aggregates should be moistened by spraying water on the stockpile and mixing with a front-end loader before chip seal operations begin.
2.5.1.4 Toughness and Durability
Aggregates must have enough strength to resist crushing during construction and trafficking. Breakdown of the aggregate during construction and trafficking could lead to inundation and flushing if the coarse particles were reduced to fine particles.
2.5.1.5 Porosity
Porous aggregates will absorb more asphalt than non-porous aggregates. Therefore, the amount of asphalt absorbed must be accounted for during the design stage.
2.5.2 Asphalt Emulsion
The performance of a chip seal is largely dependent on the asphalt emulsion. Performance is related to the adhesive ability of the binder for the aggregate chips and the underlying pavement, the durability and flexibility of the binder, and the ability of the binder to maintain these properties over a wide range of environmental conditions and snowplow action.
2.5.2.2 Emulsion Type
Emulsified asphalts should be rapid setting types. Although rapid setting emulsions allow faster removal of traffic control, they can set too quickly in very hot weather or even form a ‘skin’ on the surface after application creating a barrier to chip embedment. Medium setting emulsions require more time to set, requiring traffic control to remain in place longer and increasing the possibility for vehicle damage. However, while rapid setting emulsions are the most desirable as a chip seal binder, medium setting emulsions have been used successfully on low volume roads when strict traffic control is maintained. Medium setting emulsions have also been successful when chips are more uniformly graded or contain higher quantities of minus No. 200 particles.
2.5.2.3 Emulsion Class
Factors Affecting Chip Seal Performance
7
Emulsions are classified based on the particle charge of the asphalt droplets within the water phase of the suspension. Anionic emulsions have a negative charge and cationic emulsions a positive charge. There are also a limited number of emulsions classified as non-ionic with no appreciable charge. These emulsions can be considered interchangeable as both classifications should provide equal performance with respect to adhesion to aggregate chips. Research has shown no difference in the adhesion of different classes of emulsions to aggregates (Shuler and Lord 2009). However, the selection of emulsion should take into consideration the environmental conditions present during construction. For example, anionic emulsions break by evaporation so humid site conditions could lead to longer setting times for anionic compared with cationic materials. High float emulsions are a class of emulsion that can be either anionic or cationic and are formulated with a gel structure to produce a thicker asphalt coating on aggregate chips. Some high float emulsions contain oil distillates that increase setting time, so increased traffic control may be needed for these products.
2.5.2.4 Viscosity Grade
Emulsions are produced in two viscosity categories, designated “-1” and “-2” for low and high viscosity, respectively. Because aggregate chips require approximately 40 percent initial embedment during construction, the high viscosity emulsions should always be used as the low viscosity emulsions would flow off the substrate.
The viscosity of the emulsion during construction is an important factor. Emulsions with too low viscosity could flow off the pavement before the aggregate chips are embedded resulting in a loss of chips under traffic and potential environmental issues. Emulsions with too high viscosity may not provide adequate coating of the aggregate chips leading to a loss of chips.
2.5.2.5 Application Rate
The binder application rate must be correct during construction to achieve optimum performance of the chip seal. Too little emulsion will not retain chips in place under traffic and too much emulsion will lead to flushing and loss of friction. The optimal application rate is a function of the volume of voids in the compacted aggregate chip layer, the volume and type of traffic, the pavement gradient and the condition of the substrate pavement.
2.5.2.6 Emulsion Application Temperature
Emulsion application temperature should be within a range to provide uniform transverse and longitudinal spraying but should not exceed 185F (85C).
Factors Affecting Chip Seal Performance
8
2.6 Construction Preparation
Preparation of the pavement surface prior to chip seal operations can influence performance of the chip seal. This preparation varies depending on the condition of the existing pavement, but at a minimum should include sweeping the surface to remove loose debris, dust, or other contaminants. 2.6.1 Fog Seal Pre-Treatment of Substrate If the pavement surface is extremely dry or porous or there is possible loss of some of the chip seal binder to the pavement, a light fog seal application should be considered prior to chip sealing. Sometimes hot mix asphalt patches are needed to repair the existing pavement prior to chip sealing. These patched areas should be sprayed with a light fog seal prior to applying the chip seal since fresh hot mix asphalt can absorb the emulsion after chip sealing resulting in significant loss of chips. 2.6.2 Repairs Alligator cracking, potholes, failing patches, and active cracks greater than ¼-inch in width should be repaired to provide a stable surface for the new chip seal.
2.7 Maintenance
Fog seals are often applied to a new chip seal to provide additional binder and higher contrast for pavement striping paint. Care should be taken whenever applying a fog seal since pavement friction could be reduced if the fog seal is applied at too high an application rate, the fog seal emulsion has a high residue content, or has not broken sufficiently to support uncontrolled traffic.
9
3 Design and Construction Considerations Before a chip seal can be designed there are certain factors that must first be known about the project. The first part of this process involves selecting the pavement to chip seal. The second part is selection of the type of seal to be placed.
3.1 Identifying Appropriate Pavements to Chip Seal
Chip seals are most effective for pavement preservation when applied to pavements with limited or no distress, (i. e., cracking has not begun or is less than 1/8-inch wide, rutting is less than 3/8-inch, and structural distress is isolated with low severity fatigue). Pavements with severe cracking and rutting may require multiple patches and crack sealing prior to chip sealing. In general, pavements in poor condition will achieve shorter service lives than pavements in good condition.
3.2 Type of Seal
The types of chip seal include single, double, single chip seal with choke stone, or any of these chip seals with a fog seal applied afterwards.
3.2.1 Single Chip Seal A single chip seal consists of a spray application of asphalt emulsion followed by an application of aggregate chips, preferably one stone layer thick.
3.2.2 Double Chip Seal A double chip seal is two applications of a single chip seal. The first chip seal is constructed with aggregate one sieve size larger than the second chip seal.
3.2.3 Single Chip Seal with Choke Stone This type of seal is a single chip seal but with crushed fine aggregate applied to the surface of the chip seal prior to rolling.
3.2.4 Fog Seal Applied to Chip Seals A fog seal may be applied to a fresh chip seal to provide slightly more asphalt to account for possible deficiencies in emulsion application rate, to provide a higher contrast between pavement markings and the surrounding surface, and may provide improved cracking performance. Care should be taken whenever applying a fog seal since pavement friction could be reduced if the fog seal is applied at too high an application rate, the fog seal emulsion has a high residue content, or has not broken sufficiently to support uncontrolled traffic.
Design and Construction Considerations
10
3.3 Chip Seal Selection
The type of chip seal utilized depends on many factors. Under high traffic volumes double seals or seals with choke stone have lower potential for chip loss and vehicle damage. Double and choke stone seals should provide less tire-pavement noise due to smaller aggregate size. The life expectancy of double seals and seals with choke stone should be higher and the sealing ability should also be greater than single seals under the same conditions. However, the cost of double seals is obviously higher.
3.4 Selecting the Aggregate Size
The chip seals described in this manual are single chip seals consisting of one application of asphalt emulsion and one layer of aggregate chips. The gradation of the chips should consist of one or two consecutive sieve sizes with little or no material passing the 0.075 mm sieve (No. 200). The maximum aggregate size in the chip seal influences the performance of the chip seal. Larger aggregates provide greater sealing performance because of the higher asphalt volume needed to retain the chips in place. However, larger aggregates produce more traffic noise, have rougher texture, and have greater potential to damage vehicles. These advantages and disadvantages must be considered when making decisions regarding chip seal selection.
3.5 Evaluating the Pavement
Some aspects of the pavement surface can have an effect on performance of the chip seal. For example, texture of the surface, resistance of the pavement surface to penetration of the chips under traffic, variability of the pavement surface along the alignment, and pavement gradient all affect chip seal performance. These factors must be considered during the chip seal design process.
3.5.1 Surface Texture
The texture of the pavement surface must be known prior to chip sealing so that an adjustment can be made for the design emulsion spray rate. Texture of the surface can be measured using either sand patch (ASTM E965) or CT Meter (ASTM E 2157) to obtain the texture depth. The correlation between these two tests has been established. An adjustment to emulsion spray rate needs to be applied to account for the texture.
3.5.2 Penetration of Chips into Surface The pavement surface should be tested using the ball penetration test to determine if chips are likely to penetrate the substrate pavement after trafficking and to what level. If penetration is possible, adjustment to the emulsion application rate will be required.
3.5.3 Variability of Surface Along Alignment
Design and Construction Considerations
11
The surface of the pavement affects the emulsion application rate. Therefore, if the surface varies along the alignment, the application rate must change to match these conditions. A thorough map should be made indicating where materials application rates should change in accordance with the changing surface conditions. These changes can be communicated to equipment operators by painting on the pavement surface in front of the distributor truck.
3.6 Materials
The suitability of all materials to be used in the chip seal should be evaluated before construction begins.
3.6.1 Aggregates
Aggregate properties relevant for chip seals include gradation, toughness, soundness, cleanliness, fracture, and polish resistance.
3.6.1.1 Gradation
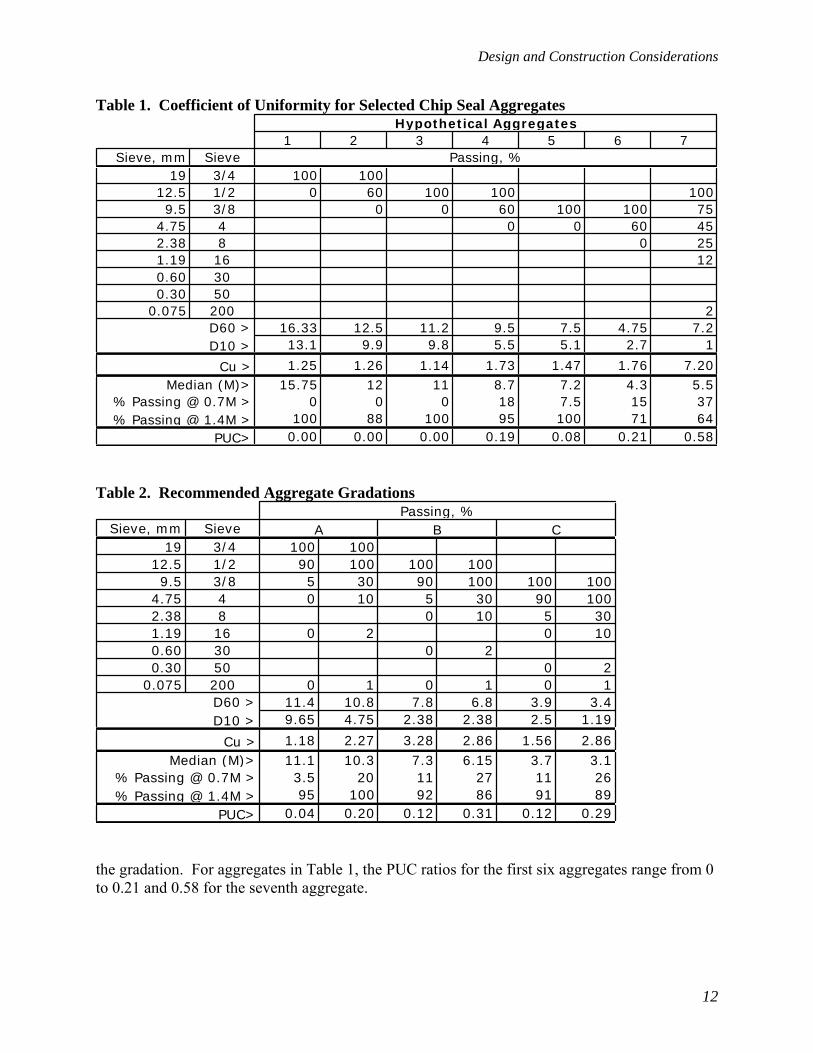
The gradation of the aggregate used in the chip seal is critical to performance. Generally, the more one-sized the aggregate, the better the performance potential. One-sized aggregates include those materials retained within two consecutive sieve sizes. Two-sized aggregates are materials retained between three consecutive sizes. Good performance should be expected for any chip seal with up to two-sized gradations. However, as the gradation becomes less uniform (a wider variety of sizes) obtaining good performance will be more difficult to achieve. Uniformity can be quantified by using the coefficient of uniformity (Cu) used for soil and aggregate classification (ASTM D2487). Coefficient of uniformity (Cu) is defined as the ratio of the size for which 60 percent passes divided by the size for which 10 percent passes. Thus, a more one-sized material will have a smaller coefficient of uniformity. An example of how the Cu value can be used to judge uniformity is provided in Table 1. Hypotheical Aggregates 1, 2, and 3 are examples of one-sized materials and Aggregates 4, 5, and 6 are two-sized. Aggregate 7 has many sizes. A Cu value less than 4.0 is defined as uniformily graded (ASTM D2487). The first six aggregates all have Cu values less than 2.0, therefore, would be defined as uniformly graded. The seventh aggregate with Cu of 7.2 would be considered well-graded. Another approach has been proposed which evaluates the ratio of material passing 70 percent of the median size to that passing 140 percent of the median size, termed the PUC ratio (Lee and Kim 2007). It is expected that particles at 70 percent of the median size will be submerged in asphalt when fully compacted, and particles at 140 percent of the median size will not have enough binder to hold them in place. Thus, the closer PUC ratio is to zero, the more one-sized
Design and Construction Considerations
12
Table 1. Coefficient of Uniformity for Selected Chip Seal Aggregates
Table 2. Recommended Aggregate Gradations
the gradation. For aggregates in Table 1, the PUC ratios for the first six aggregates range from 0 to 0.21 and 0.58 for the seventh aggregate.
1 2 3 4 5 6 7Sieve, mm Sieve
19 3/4 100 10012.5 1/2 0 60 100 100 1009.5 3/8 0 0 60 100 100 75
4.75 4 0 0 60 452.38 8 0 251.19 16 120.60 300.30 50
0.075 200 216.33 12.5 11.2 9.5 7.5 4.75 7.213.1 9.9 9.8 5.5 5.1 2.7 1
1.25 1.26 1.14 1.73 1.47 1.76 7.2015.75 12 11 8.7 7.2 4.3 5.5
0 0 0 18 7.5 15 37100 88 100 95 100 71 64
0.00 0.00 0.00 0.19 0.08 0.21 0.58
% Passing @ 0.7M >% Passing @ 1.4M >
PUC>
D60 >D10 >
Cu >Median (M)>
Hypothetical Aggregates
Passing, %
Sieve, mm Sieve19 3/4 100 100
12.5 1/2 90 100 100 1009.5 3/8 5 30 90 100 100 100
4.75 4 0 10 5 30 90 1002.38 8 0 10 5 301.19 16 0 2 0 100.60 30 0 20.30 50 0 2
0.075 200 0 1 0 1 0 111.4 10.8 7.8 6.8 3.9 3.49.65 4.75 2.38 2.38 2.5 1.19
1.18 2.27 3.28 2.86 1.56 2.8611.1 10.3 7.3 6.15 3.7 3.13.5 20 11 27 11 2695 100 92 86 91 89
0.04 0.20 0.12 0.31 0.12 0.29PUC>
Passing, %A B C
D60 >D10 >
Cu >Median (M)>
% Passing @ 0.7M >% Passing @ 1.4M >
Design and Construction Considerations
13
Aggregates A, B, and C in Table 2 are recommended for use in chip seals. While they are not as uniform as Aggregates 1 through 6 in the hypothetical example, they provide a guide to practical materials suitable for chip seal construction. These aggregates have PUC ratios of 0.04 to 0.31 and Cu values of 1.18 to 3.28.
3.6.1.2 Toughness
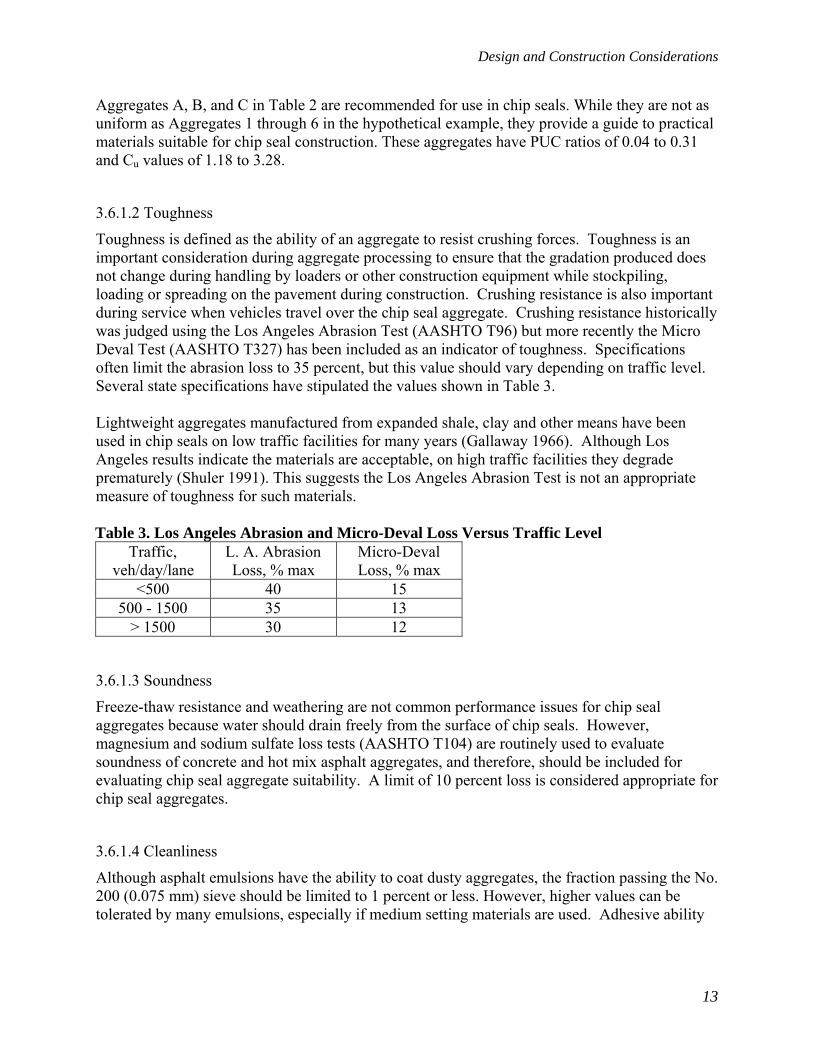
Toughness is defined as the ability of an aggregate to resist crushing forces. Toughness is an important consideration during aggregate processing to ensure that the gradation produced does not change during handling by loaders or other construction equipment while stockpiling, loading or spreading on the pavement during construction. Crushing resistance is also important during service when vehicles travel over the chip seal aggregate. Crushing resistance historically was judged using the Los Angeles Abrasion Test (AASHTO T96) but more recently the Micro Deval Test (AASHTO T327) has been included as an indicator of toughness. Specifications often limit the abrasion loss to 35 percent, but this value should vary depending on traffic level. Several state specifications have stipulated the values shown in Table 3. Lightweight aggregates manufactured from expanded shale, clay and other means have been used in chip seals on low traffic facilities for many years (Gallaway 1966). Although Los Angeles results indicate the materials are acceptable, on high traffic facilities they degrade prematurely (Shuler 1991). This suggests the Los Angeles Abrasion Test is not an appropriate measure of toughness for such materials. Table 3. Los Angeles Abrasion and Micro-Deval Loss Versus Traffic Level
Traffic, veh/day/lane
L. A. Abrasion Loss, % max
Micro-Deval Loss, % max
<500 40 15 500 - 1500 35 13
> 1500 30 12
3.6.1.3 Soundness
Freeze-thaw resistance and weathering are not common performance issues for chip seal aggregates because water should drain freely from the surface of chip seals. However, magnesium and sodium sulfate loss tests (AASHTO T104) are routinely used to evaluate soundness of concrete and hot mix asphalt aggregates, and therefore, should be included for evaluating chip seal aggregate suitability. A limit of 10 percent loss is considered appropriate for chip seal aggregates.
3.6.1.4 Cleanliness
Although asphalt emulsions have the ability to coat dusty aggregates, the fraction passing the No. 200 (0.075 mm) sieve should be limited to 1 percent or less. However, higher values can be tolerated by many emulsions, especially if medium setting materials are used. Adhesive ability
Design and Construction Considerations
14
of the emulsion should be evaluated in the laboratory using the sweep test; the aggregate should be considered suitable for use when 90 percent retention of the aggregate can be achieved. Sieve analyses should be conducted using washed samples since the material passing the No. 200 sieve often adheres to coarse aggregates. Sieve analysis (AASHTO T27) must be done in conjunction with the washing procedure (AASHTO T11).
3.6.1.5 Angularity
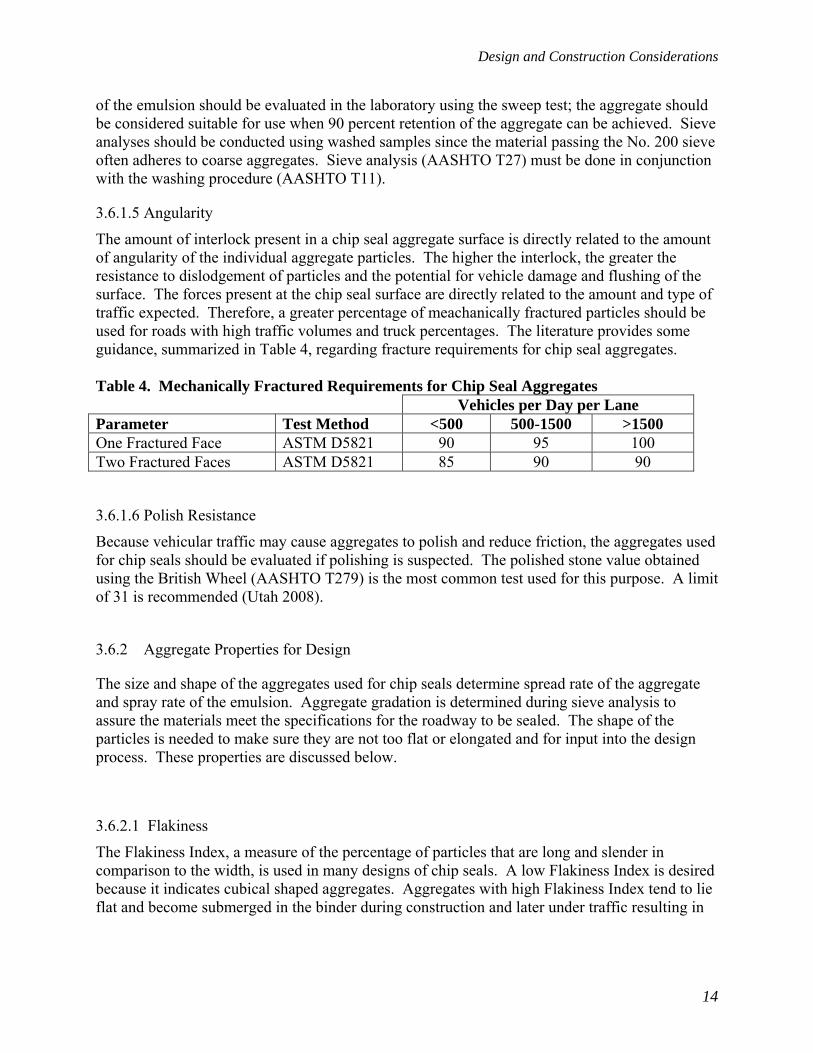
The amount of interlock present in a chip seal aggregate surface is directly related to the amount of angularity of the individual aggregate particles. The higher the interlock, the greater the resistance to dislodgement of particles and the potential for vehicle damage and flushing of the surface. The forces present at the chip seal surface are directly related to the amount and type of traffic expected. Therefore, a greater percentage of meachanically fractured particles should be used for roads with high traffic volumes and truck percentages. The literature provides some guidance, summarized in Table 4, regarding fracture requirements for chip seal aggregates. Table 4. Mechanically Fractured Requirements for Chip Seal Aggregates Vehicles per Day per Lane Parameter Test Method <500 500-1500 >1500 One Fractured Face ASTM D5821 90 95 100 Two Fractured Faces ASTM D5821 85 90 90
3.6.1.6 Polish Resistance
Because vehicular traffic may cause aggregates to polish and reduce friction, the aggregates used for chip seals should be evaluated if polishing is suspected. The polished stone value obtained using the British Wheel (AASHTO T279) is the most common test used for this purpose. A limit of 31 is recommended (Utah 2008).
3.6.2 Aggregate Properties for Design
The size and shape of the aggregates used for chip seals determine spread rate of the aggregate and spray rate of the emulsion. Aggregate gradation is determined during sieve analysis to assure the materials meet the specifications for the roadway to be sealed. The shape of the particles is needed to make sure they are not too flat or elongated and for input into the design process. These properties are discussed below.
3.6.2.1 Flakiness
The Flakiness Index, a measure of the percentage of particles that are long and slender in comparison to the width, is used in many designs of chip seals. A low Flakiness Index is desired because it indicates cubical shaped aggregates. Aggregates with high Flakiness Index tend to lie flat and become submerged in the binder during construction and later under traffic resulting in
Design and Construction Considerations
15
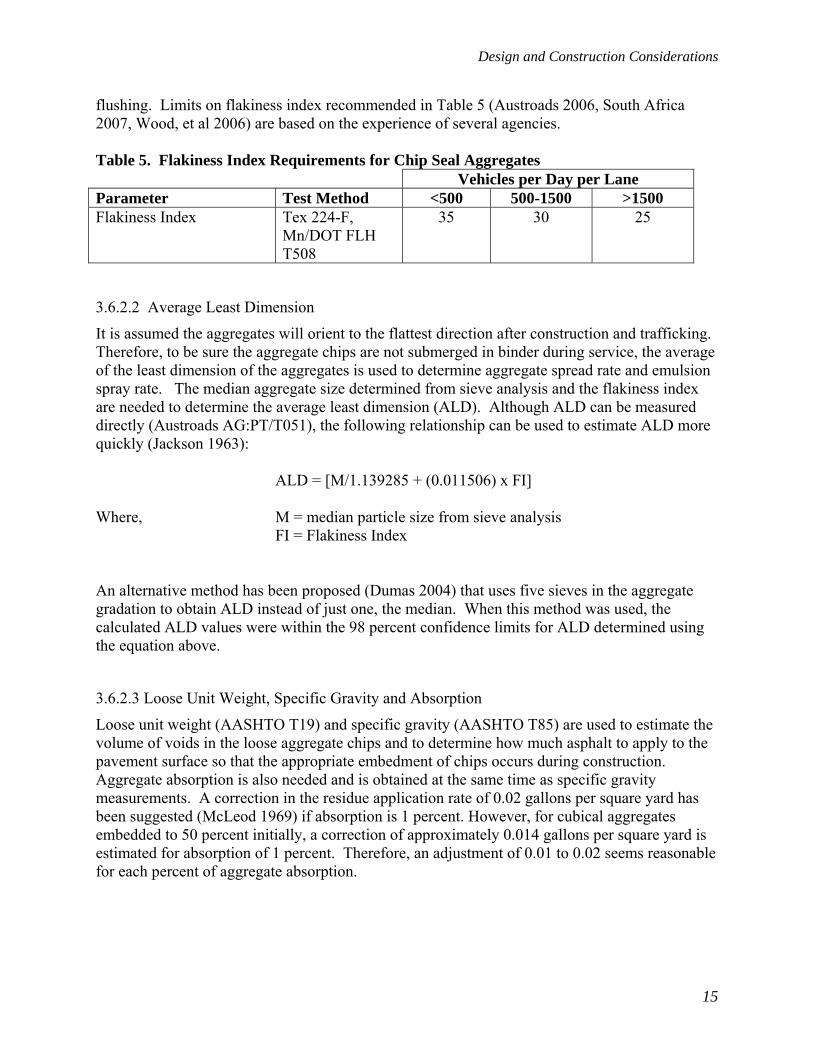
flushing. Limits on flakiness index recommended in Table 5 (Austroads 2006, South Africa 2007, Wood, et al 2006) are based on the experience of several agencies. Table 5. Flakiness Index Requirements for Chip Seal Aggregates Vehicles per Day per Lane Parameter Test Method <500 500-1500 >1500 Flakiness Index Tex 224-F,
Mn/DOT FLH T508
35 30 25
3.6.2.2 Average Least Dimension
It is assumed the aggregates will orient to the flattest direction after construction and trafficking. Therefore, to be sure the aggregate chips are not submerged in binder during service, the average of the least dimension of the aggregates is used to determine aggregate spread rate and emulsion spray rate. The median aggregate size determined from sieve analysis and the flakiness index are needed to determine the average least dimension (ALD). Although ALD can be measured directly (Austroads AG:PT/T051), the following relationship can be used to estimate ALD more quickly (Jackson 1963): ALD = [M/1.139285 + (0.011506) x FI] Where, M = median particle size from sieve analysis FI = Flakiness Index An alternative method has been proposed (Dumas 2004) that uses five sieves in the aggregate gradation to obtain ALD instead of just one, the median. When this method was used, the calculated ALD values were within the 98 percent confidence limits for ALD determined using the equation above.
3.6.2.3 Loose Unit Weight, Specific Gravity and Absorption
Loose unit weight (AASHTO T19) and specific gravity (AASHTO T85) are used to estimate the volume of voids in the loose aggregate chips and to determine how much asphalt to apply to the pavement surface so that the appropriate embedment of chips occurs during construction. Aggregate absorption is also needed and is obtained at the same time as specific gravity measurements. A correction in the residue application rate of 0.02 gallons per square yard has been suggested (McLeod 1969) if absorption is 1 percent. However, for cubical aggregates embedded to 50 percent initially, a correction of approximately 0.014 gallons per square yard is estimated for absorption of 1 percent. Therefore, an adjustment of 0.01 to 0.02 seems reasonable for each percent of aggregate absorption.

Design and Construction Considerations
16
3.6.3 Emulsion Properties
The properties of the emulsion used for chip seals are important and should be checked to assure compliance with requirements. Desirable emulsion properties are provided in Table 6.
These properties are based on current state specifications for both conventional and polymer modified emulsions including anionic, cationic and high float emulsions. Because of the wide array of emulsions available in the U. S., not every combination of conventional and modified emulsion could be included. However, those included below have been successfully used in chip seal construction over a range of environments and traffic conditions.

Design and Construction Considerations
17
Table 6. Asphalt Emulsions Used for Chip Seals
Min. Max. Min. Max. Min. Max. Min. Max. Min. Max. Min. MViscosity SSF,@ 122�F., sec AASHTO T 59 100 300 100 300 100 400 100 400 100 300 100Storage Stability, 1 day, % AASHTO T 59 1 1 1 1 1Sieve Test, % AASHTO T 59 0.1 0.1 0.1 0.1 0.1Demulsibility, % AASHTO T 59 60 95 60 95 60 95 60 95 60 95 60Particle Charge AASHTO T 59 Positive PositiveOil distillate by volume of emulsion, % AASHTO T 59 3 3Residue by Evaporation, % Appendix D 63 63 65 65 63 63Float Test, 140F, s AASHTO T50 1200 1200Penetration, 77F,, 100g, 5s AASHTO T49 100 200 100 200 100 250 100 250 100 200 100Ductility, 77F, 5cm/min, cm AASHTO T5 40 40 40 40 40 40Torsional Recovery, % CT-332* 18 18 18Toughness, in-lbs CPL-2210** 70 70 70Tenacity, in-lbs CPL-2210** 45 45 45Elastic Recovery, % CPL-2211** 58 58 58* California Test Method** Colorado Test Methods
Polymer ModHFRS-2RS-2
Polymer Modified RS-2 CRS-2 HFRS-2
Polymer Modified CRS-2
18
4 Selecting the Appropriate Chip Seal Selecting the appropriate chip seal to use on a specific facility is important. For example, a chip seal using ¾-inch maximum size aggregate may be appropriate for a rural farm to market road with 500 vehicles per day per lane but not for an urban street carrying 10,000 vehicles per day per lane. The following discussion will provide information regarding the seal that is most appropriate for a given project.
4.1 Single Seal
The single application chip seal is the most commonly used chip seal process. These chip seals have been used with success on all pavement types. However, potential disadvantages including vehicle damage, tire noise, and roughness are reasons for considering variations from the single seal. In addition, the sealing ability of a single chip seal is limited based on chip size. An increase in chip size increases sealing ability because of the greater binder volume required to hold the stone in place but it also increases the potential for the noted disadvantages.
4.2 Single Seal with Choke Stone
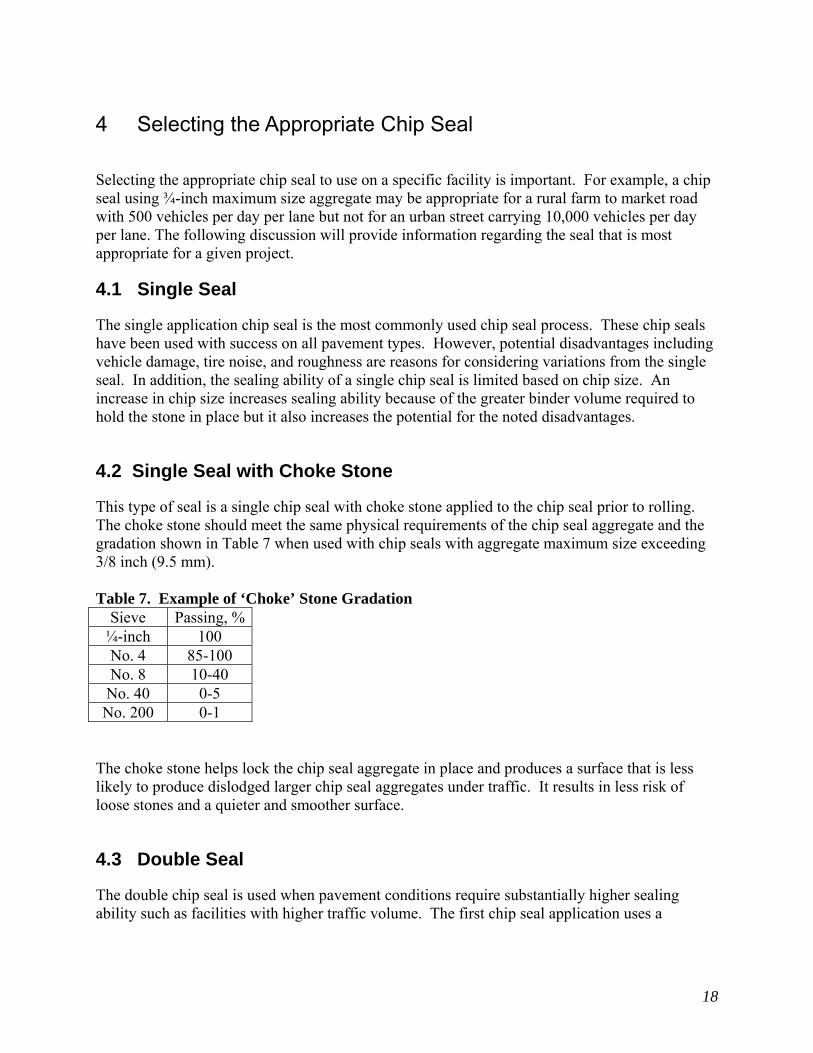
This type of seal is a single chip seal with choke stone applied to the chip seal prior to rolling. The choke stone should meet the same physical requirements of the chip seal aggregate and the gradation shown in Table 7 when used with chip seals with aggregate maximum size exceeding 3/8 inch (9.5 mm). Table 7. Example of ‘Choke’ Stone Gradation
Sieve Passing, %¼-inch 100 No. 4 85-100 No. 8 10-40 No. 40 0-5 No. 200 0-1
The choke stone helps lock the chip seal aggregate in place and produces a surface that is less likely to produce dislodged larger chip seal aggregates under traffic. It results in less risk of loose stones and a quieter and smoother surface.
4.3 Double Seal
The double chip seal is used when pavement conditions require substantially higher sealing ability such as facilities with higher traffic volume. The first chip seal application uses a

Selecting the Appropriate Chip Seal
19
maximum size aggregate that is one sieve size larger than that of the second chip seal. In comparison to other seal types double chip seals provide higher sealing capability, longer service life, less risk of dislodgement of the larger aggregates, smaller aggregate in contact with traffic and snow plows, and a quieter surface. However, double seals are higher in cost and require longer time to construct.
20
5 Chip Seal Materials Selection The performance of a chip seal is largely dependent on the materials used. Therefore, selecting the appropriate aggregates, asphalt emulsion and whether to apply a fog seal to the surface play a significant role in the success of the project. The following discussion provides guidance regarding these factors.
5.1 Chip Gradation
The gradation of the chip should be one or two–sized but the maximum size should be selected based on traffic volume, pavement texture, and the required level of sealing. Generally, larger aggregate provides greater ability to seal because of the higher volume of binder required to hold the chips in place, and depending on traffic volume, provides longer life expectancy. However, larger aggregates increase the chances for vehicle damage, noise, and roughness.
5.2 Modified or Unmodified Emulsion
Modified emulsions usually refer to some sort of elastomeric polymer or rubber added to the emulsion or to the base asphalt binder prior to emulsification. Because modified emulsions should offer greater adhesivity and potentially shorter time required before opening to traffic, they are generally used on higher traffic pavements where vehicle damage potential is greater and where limited time under traffic control is usually desirable.
5.3 Fog Seal After Chip Seal
A fog seal may be applied to any completed chip seal as means of providing a high color contrast for paint stripes. There is also some preliminary indications that the fog seal provides some additional waterproofing (Shuler 2007). Care should be taken whenever applying a fog seal since pavement friction could be reduced if the fog seal is applied at too high an application rate, the fog seal emulsion has a high residue content, or has not broken sufficiently to support uncontrolled traffic.
5.4 Emulsion-Aggregate Compatibility
There is anecdotal evidence of apparent incompatibility arising from use of anionic or cationic emulsions with silaceous or calcareous aggregates, respectively. This incompatibility manifests itself with a loss of aggregate from the chip seal. While this behavior was not observed during the NCHRP Project 14-17 research, a limited number of twenty combinations of aggregates and emulsions were represented. Therefore, unless impractical, anionic emulsions should be pared with positively charged aggregates, e. g., calcareous, and cationic emulsions should be matched

Selecting the Appropriate Chip Seal
21
with negatively charged aggregates, e. g., siliceous to avoid possible incompatibility between the materials.
22
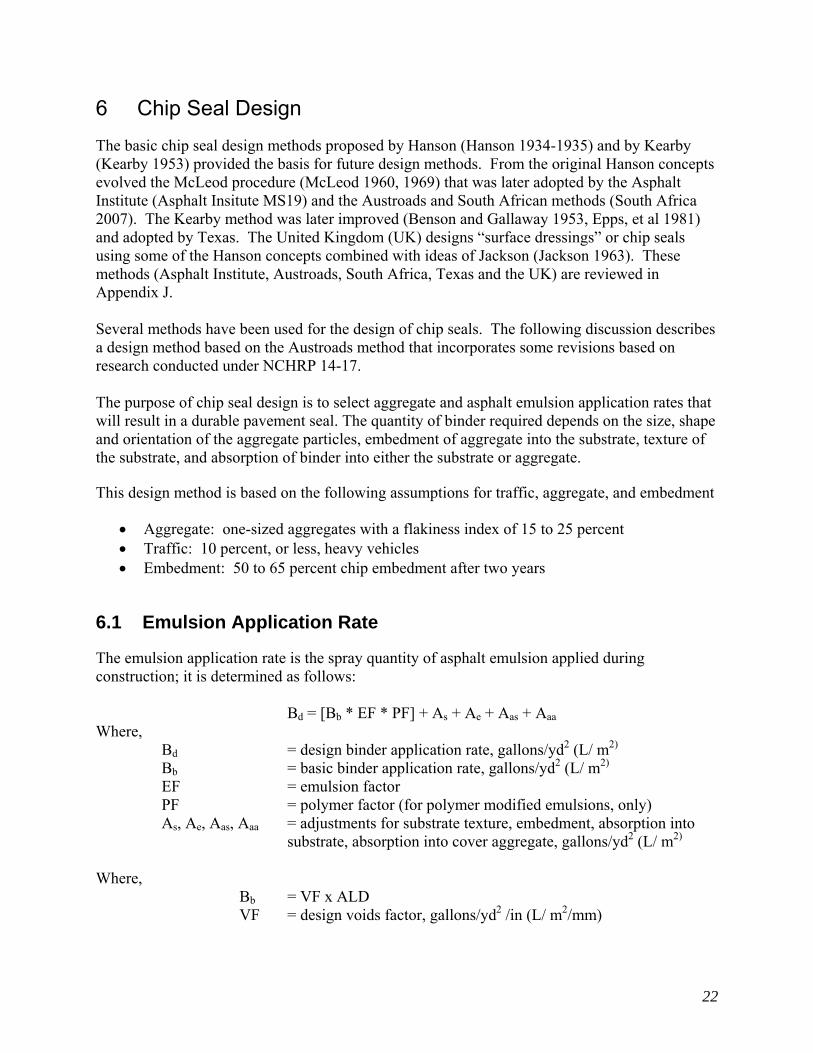
6 Chip Seal Design The basic chip seal design methods proposed by Hanson (Hanson 1934-1935) and by Kearby (Kearby 1953) provided the basis for future design methods. From the original Hanson concepts evolved the McLeod procedure (McLeod 1960, 1969) that was later adopted by the Asphalt Institute (Asphalt Insitute MS19) and the Austroads and South African methods (South Africa 2007). The Kearby method was later improved (Benson and Gallaway 1953, Epps, et al 1981) and adopted by Texas. The United Kingdom (UK) designs “surface dressings” or chip seals using some of the Hanson concepts combined with ideas of Jackson (Jackson 1963). These methods (Asphalt Institute, Austroads, South Africa, Texas and the UK) are reviewed in Appendix J. Several methods have been used for the design of chip seals. The following discussion describes a design method based on the Austroads method that incorporates some revisions based on research conducted under NCHRP 14-17. The purpose of chip seal design is to select aggregate and asphalt emulsion application rates that will result in a durable pavement seal. The quantity of binder required depends on the size, shape and orientation of the aggregate particles, embedment of aggregate into the substrate, texture of the substrate, and absorption of binder into either the substrate or aggregate. This design method is based on the following assumptions for traffic, aggregate, and embedment
• Aggregate: one-sized aggregates with a flakiness index of 15 to 25 percent • Traffic: 10 percent, or less, heavy vehicles • Embedment: 50 to 65 percent chip embedment after two years
6.1 Emulsion Application Rate
The emulsion application rate is the spray quantity of asphalt emulsion applied during construction; it is determined as follows: Bd = [Bb * EF * PF] + As + Ae + Aas + Aaa Where,
Bd = design binder application rate, gallons/yd2 (L/ m2) Bb = basic binder application rate, gallons/yd2 (L/ m2)
EF = emulsion factor PF = polymer factor (for polymer modified emulsions, only) As, Ae, Aas, Aaa = adjustments for substrate texture, embedment, absorption into
substrate, absorption into cover aggregate, gallons/yd2 (L/ m2) Where, Bb = VF x ALD VF = design voids factor, gallons/yd2 /in (L/ m2/mm)
Chip Seal Design
23
ALD = average least dimension of cover aggregate Where,
VF = Vf + Va + Vt Vf = basic voids factor Va = aggregate shape adjustment factor Vt = traffic effects adjustment factor Thus the Design Binder Application Rate is,
Bd ={[(Vf + Va + Vt) * ALD] * EF * PF} + As + Ae + Aas + Aaa Each of these parameters is discussed below.
6.1.1 Basic Voids Factor, Vf
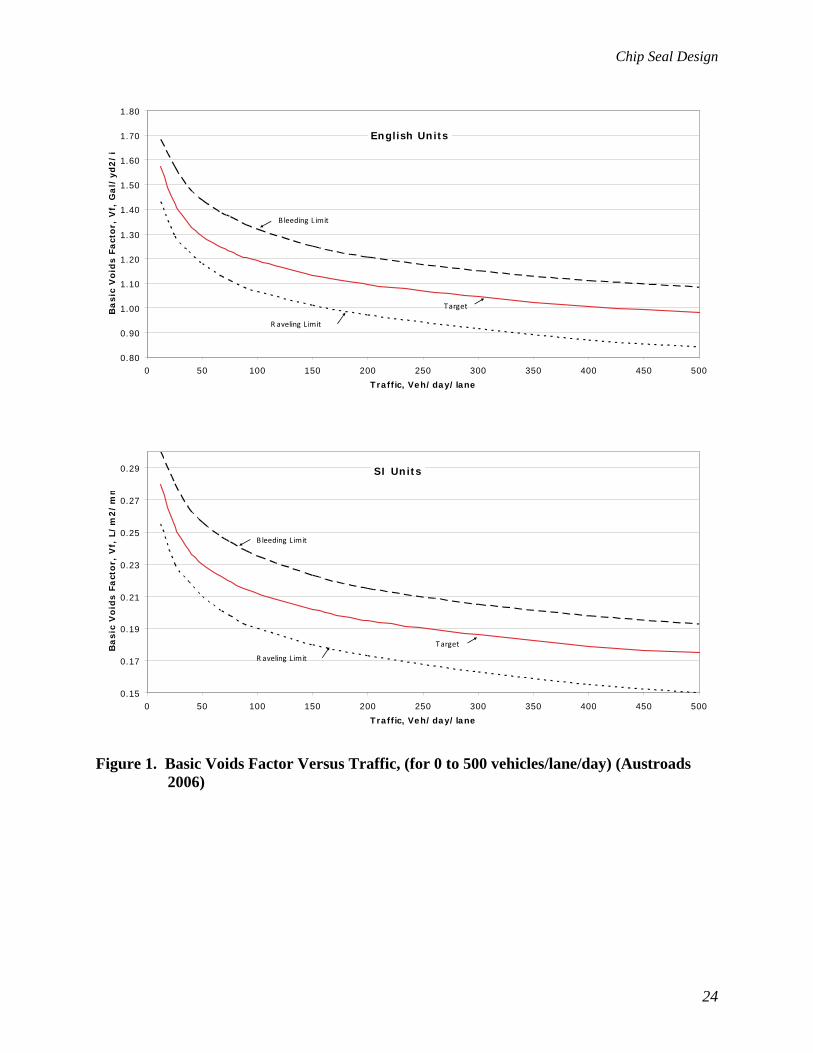
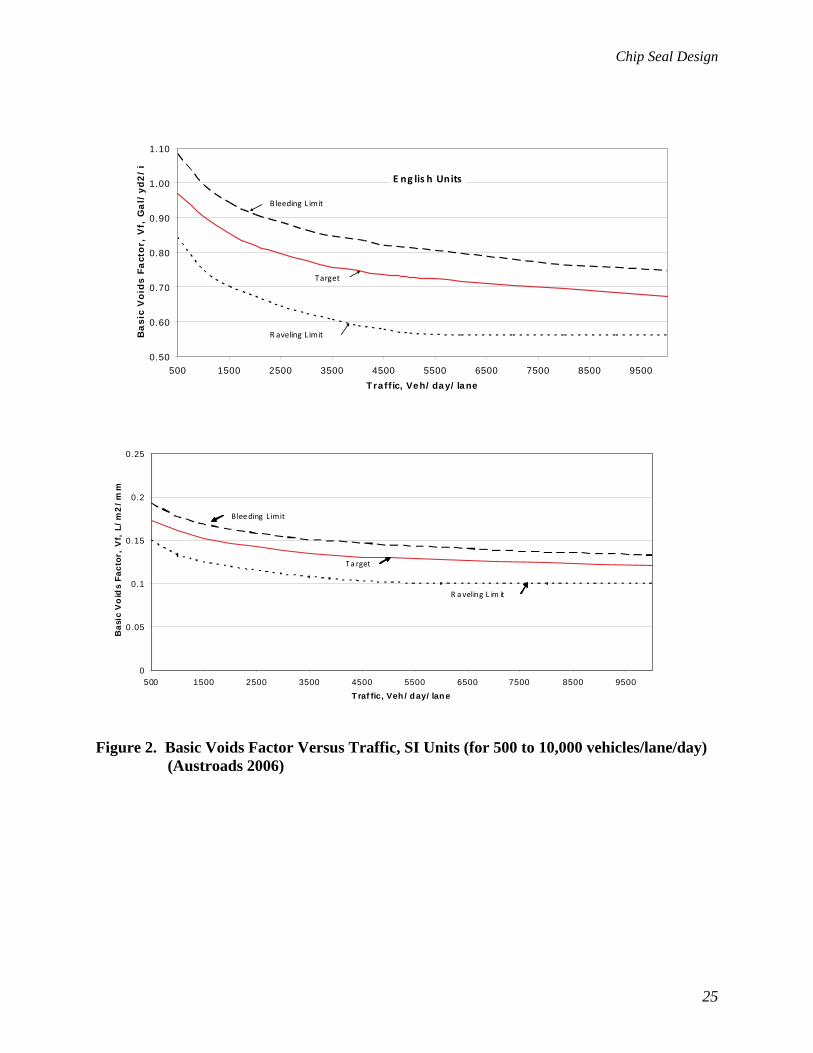
The basic voids factor depends on traffic level because traffic determines how much of the aggregate is embedded in the binder. For traffic less than 500 vehicles per day per lane Figures 1a and 1b are used for SI and English units, respectively. For traffic greater than 500 vehicles per day per lane Figures 2a and 2b are used for SI and English units, respectively. The three curves in each figure represent a range of basic voids factors from a low binder content (raveling limit) to a high binder content (bleeding limit) which should not be exceeded.
6.1.2 Adjustment for Aggregate Shape, Va
The design method assumes the flakiness index will be between 15 and 25; an adjustment must be made for aggregates outside this range. Table 8 provides suggested adjustment factors.
Chip Seal Design
24
0.80
0.90
1.00
1.10
1.20
1.30
1.40
1.50
1.60
1.70
1.80
0 50 100 150 200 250 300 350 400 450 500
Traffic, Veh/day/lane
Ba
sic
Vo
ids F
act
or,
Vf,
Ga
l/yd
2/i
B leeding L imit
R aveling L imit
Target
English Units
0.15
0.17
0.19
0.21
0.23
0.25
0.27
0.29
0 50 100 150 200 250 300 350 400 450 500
Traffic, Veh/day/lane
Basic
Vo
ids F
act
or,
Vf,
L/
m2/
mm
B leeding L imit
R aveling L imit
Target
SI Units
Figure 1. Basic Voids Factor Versus Traffic, (for 0 to 500 vehicles/lane/day) (Austroads
2006)
Chip Seal Design
25
Figure 2. Basic Voids Factor Versus Traffic, SI Units (for 500 to 10,000 vehicles/lane/day)
(Austroads 2006)
0.50
0.60
0.70
0.80
0.90
1.00
1.10
500 1500 2500 3500 4500 5500 6500 7500 8500 9500
Traffic, Veh/day/lane
Ba
sic
Void
s F
act
or,
Vf,
Ga
l/yd2
/i
B leeding L imit
R aveling L imit
Target
E ng lis h Units
0
0.05
0.1
0.15
0.2
0.25
500 1500 2500 3500 4500 5500 6500 7500 8500 9500
Traffic, Veh/day/lane
Basi
c V
oid
s Facto
r, V
f, L
/m
2/m
m
Bleeding Limit
R a veling L im it
T a rget

Chip Seal Design
26
Table 8. Suggested Adjustment for Aggregate Shape, Va (after Austroads 2006) Aggregate
Type Aggregate
Shape Flakiness
Index, FI, % Va,
gal/yd2/in [L/m2/mm]
Very Flaky >35 Too flaky, not recommended
Flaky 26 – 35 0 to -0.056 [0 to -0.01] Angular 15 – 25 0 Cubic <15 +0.056 [+0.01]
Crushed
Rounded - 0 to +0.056 [0 to +0.01] Uncrushed Rounded - +0.056 [+0.01]
6.1.3 Adjustment for Traffic, Vt
The Basic Voids Factor, Vf, was developed for an average mix of light and heavy vehicles in a free traffic flow situation. When this is not the case due to composition, non-trafficked areas, overtaking lanes with few heavy vehicles or for large proportions of heavy vehicles, channelization and slow moving, heavy vehicles in climbing lanes or stop/start conditions an adjustment, Vt, needs to be made. Table 9 shows recommended adjustments.
Table 9. Traffic Adjustment, Vt (after Austroads 2006)
Traffic Adjustment, Vt, gal/yd2/in [L/m2/mm] Flat or Downhill Slow Moving-Climbing Lanes Traffic
Normal Channelized Normal Channelized Overtaking lanes
of multi-lane rural roads where traffic is mainly cars with
HV <=10%
+0.056 [+0.01] 0 0 0
Non-traffic areas such as shoulders,
medians and parking
+0.112 [+0.02] 0 0 0
0-15 0 -0.056 [-0.01] -0.056 [-0.01] -0.112 [-0.02] 16-25 -0.056 [-0.01] -0.112 [-0.02] -0.112 [-0.02] -0.168 [-0.03] 26-45 -0.112 [-0.02] -0.168 [-0.03] -0.168 [-0.03] -0.224 [-0.04]**
EHV*, %
> 45 -0.168 [-0.03] -0.224 [-0.04]** -0.224 [-0.04]** -0.281 [-0.05]** * Equivalent Heavy Vehicles, EHV, % = HV% + LHV% x 3
Where, HV = vehicles over 3.5 tons and LHV = vehicles with seven or more axles ** If adjustments for aggregate shape and traffic effects result in a reduction in Basic Voids Factor, Vf, of
0.224 gal/yd2/in [0.4 L/m2/mm] or more, special consideration should be given to the suitability of the treatment and the selection of alternative treatments. Note that a minimum Design Voids Factor, VF,
Chip Seal Design
27
of 0.56 gal/yd2/in [0.10 L/m2/mm] is recommended for any situation.
6.1.4 Average Least Dimension
The volumetric design of a chip seal is based on the assumption that aggregate particles tend to lie with the least dimension vertical. The least dimension is defined as the smallest dimension of a particle when placed on a horizontal surface; the particle being most stable when lying with the least dimension vertical. Thus in a chip seal, the final orientation of most particles is such that the least dimension is near vertical, providing there is sufficient room for the particles to realign. This average least dimension, ALD, is as follows: ALD, mm = M, mm / [1.139285 + (0.011506 x FI]] or, ALD, in = ALD, mm / 25.4 Where, M = median size of the aggregate (mm) FI = flakiness index
6.1.5 Emulsion Factor
An emulsion factor is applied to the Basic Binder Application Rate (before allowances) when using asphalt emulsions. This factor allows a greater volume of binder around the aggregate particles to compensate for reduced aggregate reorientation as a result of rapid increase in binder stiffness after the initial breaking of the emulsion. The Basic Binder Application Rate for emulsions, Bbe, is calculated as follows: Bbe = Bb x EF Where, Bbe = Basic Binder Emulsion Application Rate rounded to the nearest 0.2 gallons/yd2 [0.1
L/ m2] Bb = Basic Binder Application Rate, gallons/yd2 (L/ m2)
EF = Emulsion Factor = 1.0 for emulsions with less than 67 percent residue and 1.1 to 1.2
for emulsions with residues greater than 67 percent. Binder application rates are residual binder and do not include the water content of emulsion.
Chip Seal Design
28
6.1.6 Polymer Modified Emulsion Factor
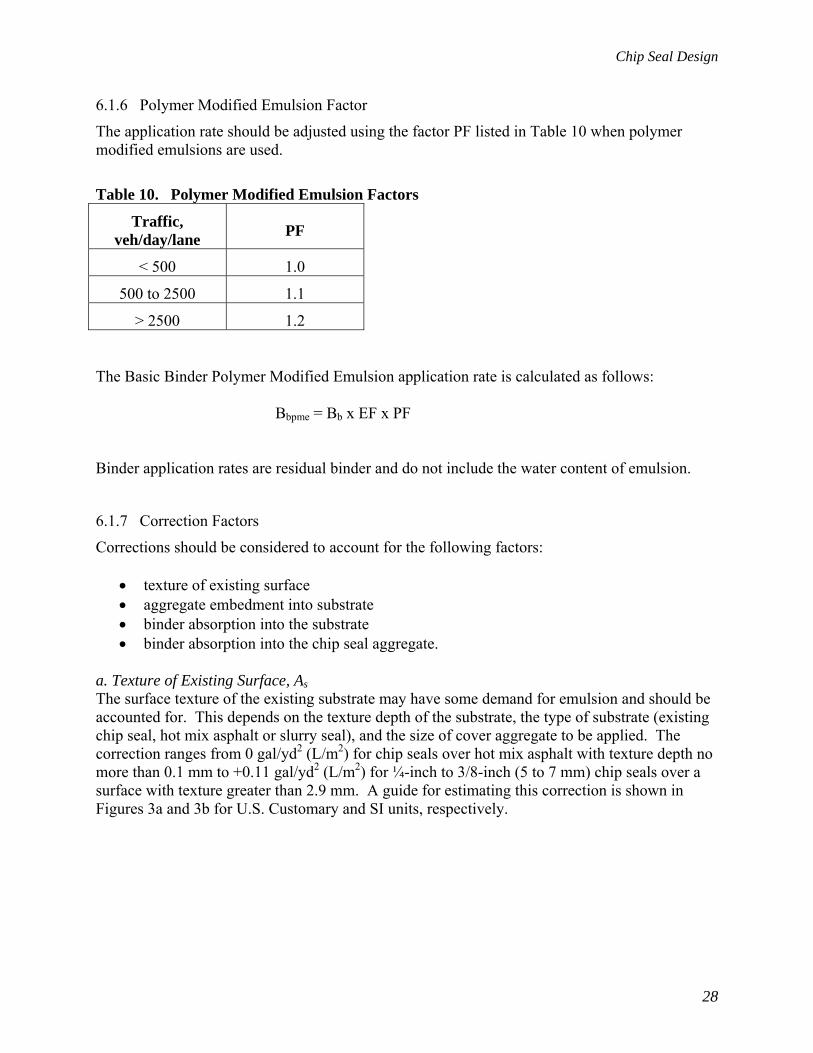
The application rate should be adjusted using the factor PF listed in Table 10 when polymer modified emulsions are used.
Table 10. Polymer Modified Emulsion Factors
Traffic, veh/day/lane PF
< 500 1.0
500 to 2500 1.1
> 2500 1.2 The Basic Binder Polymer Modified Emulsion application rate is calculated as follows: Bbpme = Bb x EF x PF Binder application rates are residual binder and do not include the water content of emulsion.
6.1.7 Correction Factors
Corrections should be considered to account for the following factors:
• texture of existing surface • aggregate embedment into substrate • binder absorption into the substrate • binder absorption into the chip seal aggregate.
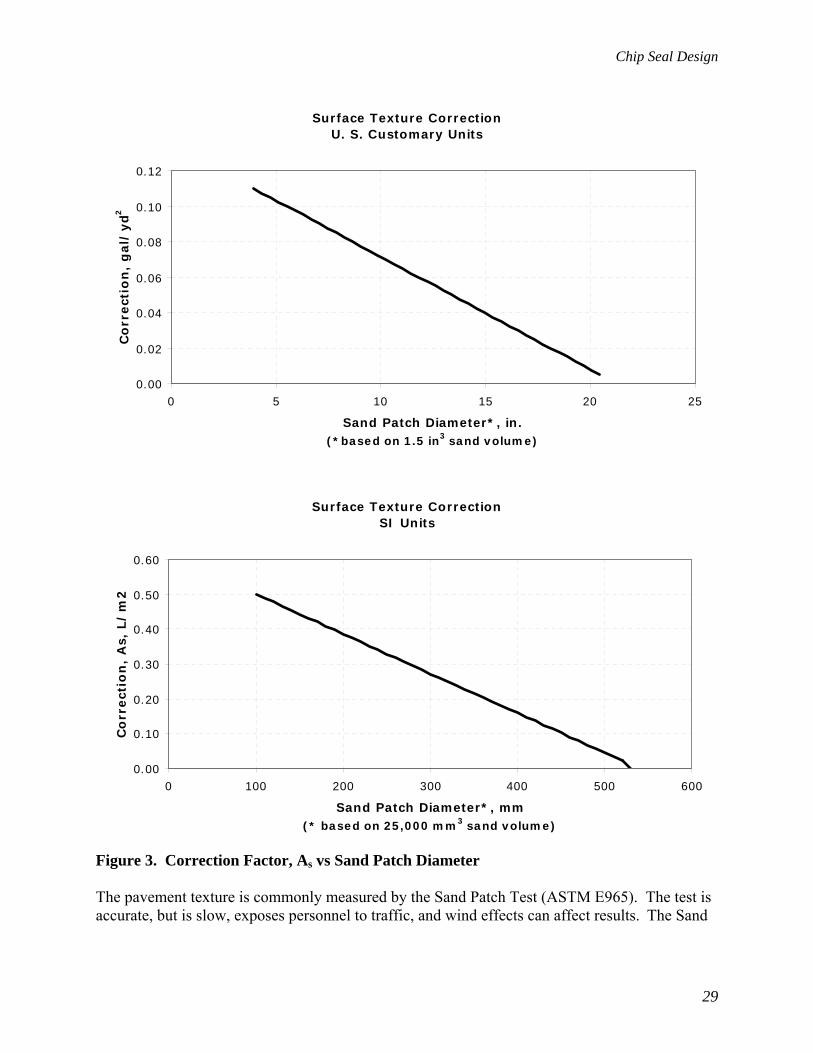
a. Texture of Existing Surface, As The surface texture of the existing substrate may have some demand for emulsion and should be accounted for. This depends on the texture depth of the substrate, the type of substrate (existing chip seal, hot mix asphalt or slurry seal), and the size of cover aggregate to be applied. The correction ranges from 0 gal/yd2 (L/m2) for chip seals over hot mix asphalt with texture depth no more than 0.1 mm to +0.11 gal/yd2 (L/m2) for ¼-inch to 3/8-inch (5 to 7 mm) chip seals over a surface with texture greater than 2.9 mm. A guide for estimating this correction is shown in Figures 3a and 3b for U.S. Customary and SI units, respectively.
Chip Seal Design
29
Surface Texture CorrectionU. S. Customary Units
0.00
0.02
0.04
0.06
0.08
0.10
0.12
0 5 10 15 20 25
Sand Patch Diameter*, in.(*based on 1.5 in3 sand volume)
Co
rrect
ion
, g
al/
yd
2
Surface Texture CorrectionSI Units
0.00
0.10
0.20
0.30
0.40
0.50
0.60
0 100 200 300 400 500 600
Sand Patch Diameter*, mm(* based on 25,000 mm3 sand volume)
Co
rrect
ion
, A
s, L
/m
2
Figure 3. Correction Factor, As vs Sand Patch Diameter The pavement texture is commonly measured by the Sand Patch Test (ASTM E965). The test is accurate, but is slow, exposes personnel to traffic, and wind effects can affect results. The Sand
Chip Seal Design
30
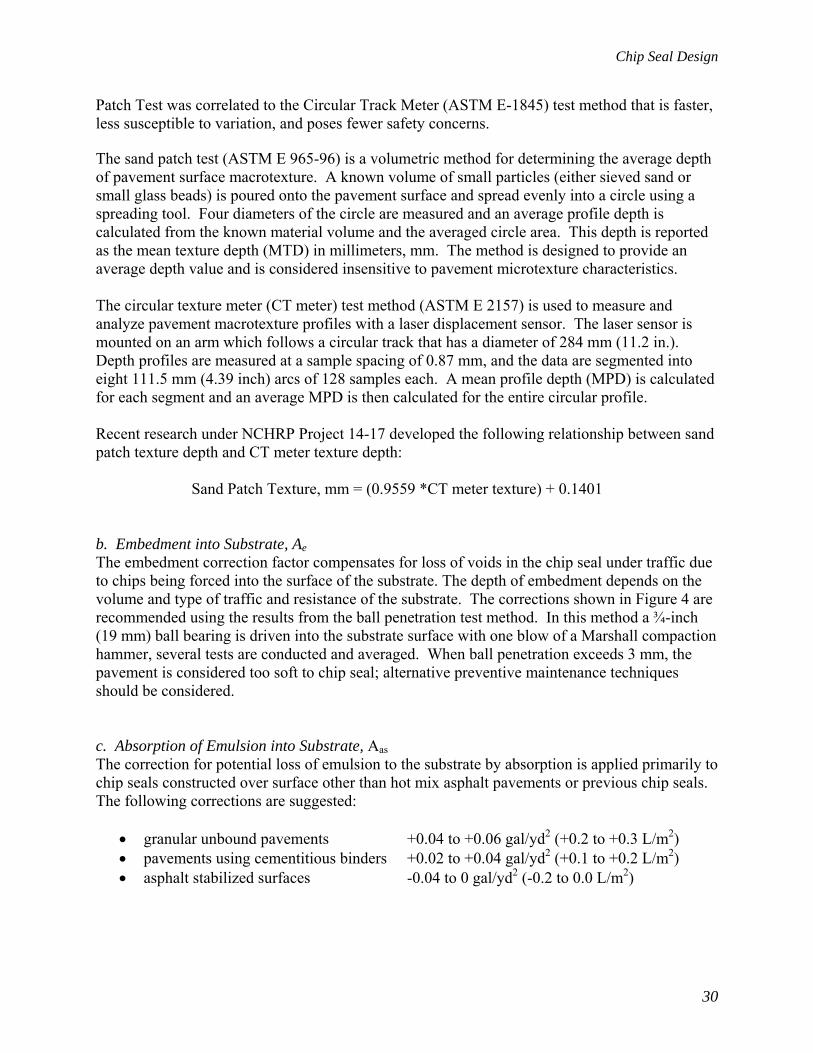
Patch Test was correlated to the Circular Track Meter (ASTM E-1845) test method that is faster, less susceptible to variation, and poses fewer safety concerns. The sand patch test (ASTM E 965-96) is a volumetric method for determining the average depth of pavement surface macrotexture. A known volume of small particles (either sieved sand or small glass beads) is poured onto the pavement surface and spread evenly into a circle using a spreading tool. Four diameters of the circle are measured and an average profile depth is calculated from the known material volume and the averaged circle area. This depth is reported as the mean texture depth (MTD) in millimeters, mm. The method is designed to provide an average depth value and is considered insensitive to pavement microtexture characteristics. The circular texture meter (CT meter) test method (ASTM E 2157) is used to measure and analyze pavement macrotexture profiles with a laser displacement sensor. The laser sensor is mounted on an arm which follows a circular track that has a diameter of 284 mm (11.2 in.). Depth profiles are measured at a sample spacing of 0.87 mm, and the data are segmented into eight 111.5 mm (4.39 inch) arcs of 128 samples each. A mean profile depth (MPD) is calculated for each segment and an average MPD is then calculated for the entire circular profile. Recent research under NCHRP Project 14-17 developed the following relationship between sand patch texture depth and CT meter texture depth:
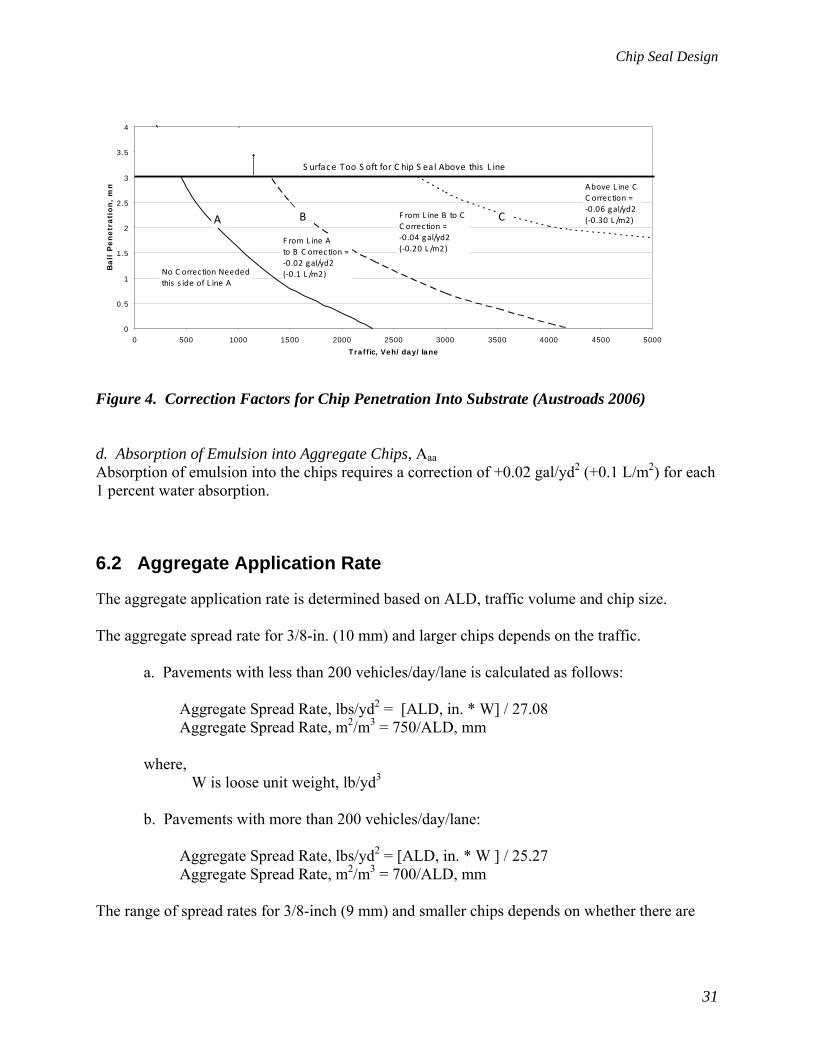
Sand Patch Texture, mm = (0.9559 *CT meter texture) + 0.1401 b. Embedment into Substrate, Ae The embedment correction factor compensates for loss of voids in the chip seal under traffic due to chips being forced into the surface of the substrate. The depth of embedment depends on the volume and type of traffic and resistance of the substrate. The corrections shown in Figure 4 are recommended using the results from the ball penetration test method. In this method a ¾-inch (19 mm) ball bearing is driven into the substrate surface with one blow of a Marshall compaction hammer, several tests are conducted and averaged. When ball penetration exceeds 3 mm, the pavement is considered too soft to chip seal; alternative preventive maintenance techniques should be considered. c. Absorption of Emulsion into Substrate, Aas The correction for potential loss of emulsion to the substrate by absorption is applied primarily to chip seals constructed over surface other than hot mix asphalt pavements or previous chip seals. The following corrections are suggested:
• granular unbound pavements +0.04 to +0.06 gal/yd2 (+0.2 to +0.3 L/m2) • pavements using cementitious binders +0.02 to +0.04 gal/yd2 (+0.1 to +0.2 L/m2) • asphalt stabilized surfaces -0.04 to 0 gal/yd2 (-0.2 to 0.0 L/m2)
Chip Seal Design
31
Figure 4. Correction Factors for Chip Penetration Into Substrate (Austroads 2006) d. Absorption of Emulsion into Aggregate Chips, Aaa Absorption of emulsion into the chips requires a correction of +0.02 gal/yd2 (+0.1 L/m2) for each 1 percent water absorption.
6.2 Aggregate Application Rate
The aggregate application rate is determined based on ALD, traffic volume and chip size. The aggregate spread rate for 3/8-in. (10 mm) and larger chips depends on the traffic.
a. Pavements with less than 200 vehicles/day/lane is calculated as follows:
Aggregate Spread Rate, lbs/yd2 = [ALD, in. * W] / 27.08 Aggregate Spread Rate, m2/m3 = 750/ALD, mm
where, W is loose unit weight, lb/yd3
b. Pavements with more than 200 vehicles/day/lane:
Aggregate Spread Rate, lbs/yd2 = [ALD, in. * W ] / 25.27 Aggregate Spread Rate, m2/m3 = 700/ALD, mm
The range of spread rates for 3/8-inch (9 mm) and smaller chips depends on whether there are
0
0.5
1
1.5
2
2.5
3
3.5
4
0 500 1000 1500 2000 2500 3000 3500 4000 4500 5000
Traffic, Veh/day/lane
Ba
ll P
en
etr
ati
on
, m
m
B CA
Above L ine CC orrection =‐0.06 gal/yd2(‐0.30 L /m2)
F rom L ine B to CC orrection =‐0.04 gal/yd2(‐0.20 L /m2)
F rom L ine A to B C orrection =‐0.02 gal/yd2(‐0.1 L /m2)No C orrection Needed
this s ide of L ine A
S urface Too S oft for C hip S eal Above this L ine
Chip Seal Design
32
one or two layers of chips placed. It ranges from 0.104W to 0.093W (290 to 260 m2/m3) for a single layer to 0.089 W to 0.072W (250 to 200 m2/m3) for two layers.
6.3 Time Until Sweeping and Traffic
The time required before sweeping or traffic can be allowed on the fresh chip seal is related to the moisture content in the chip seal (Shuler 2009). The laboratory test described in Attachment 2 may be used to determine when the chip seal can withstand sweeping and traffic stresses. Test specimens of the emulsion and chips are fabricated in the laboratory and tested at three moisture contents. The moisture at which less than 10 percent of the chips are dislodged during the test is the target moisture content to be achieved in the field before sweeping or traffic operations should commence.
6.4 Other Considerations
6.4.1 Chips Required to Avoid Roller Pick-up
Additional aggregates than are actually estimated to produce a one-stone layer should be spread during chip seal construction to aid in reducing the potential for embedded chips to be picked up by pneumatic rollers. The amount of additional material will vary, but generally is between 5 and 10 percent.
6.5 Example Design
An example of how to use the above design follows: If, Maximum Aggregate Size = ½ in. Median Aggregate Size = 3/8 in. Flakiness Index = 30% Loose Unit Weight, W = 110 lbs/ft3 Traffic = 1500 veh/day/lane, channelized, with Equivalent Heavy Vehicles, EHV%=16 Polymer Modified Emulsion binder with 70% residue Sand Patch Diameter for Texture = 18 in. Ball Penetration = 0.5 mm Substrate is old chip seal with no expected absorption potential Chip seal aggregate has 1% water absorption

Chip Seal Design
33
Design Binder Application Rate is:
Bd = [(Vf + Va + Vt) * ALD] * [EF * PF] + As + Ae + Aas + Aaa] Vf = 0.85 gal/yd2/in., from Figure 2b, Va = -0.028 gal/yd2/in., from Table 8 Vt = -0.112 gal/yd2/in., from Table 9 ALD = 0.328 in. EF = 1.2, from Section 6.1.5 PF = 1.1, from Table 10 As = 0.02 gal/yd2, from Figure 3a Ae = 0, from Figure 4 Aas = 0, Section 6.1.7c Aaa = +0.02 gal/yd2, Section 6.1.7d Bd = [(0.85 - 0.028 - 0.112) * 0.328 * 1.2 * 1.1] + 0.02 + 0 + 0 + 0.02) = 0.35 gal/yd2 Aggregate Spread Rate = [ALD, in * W, lbs/yd3 ] / 25.27, from Section 6.2 = 0.328 * 110 * 27/ 25.27 = 38.5 lbs/yd2
34
7 Construction
7.1 Equipment Calibrations
7.1.1 Distributor
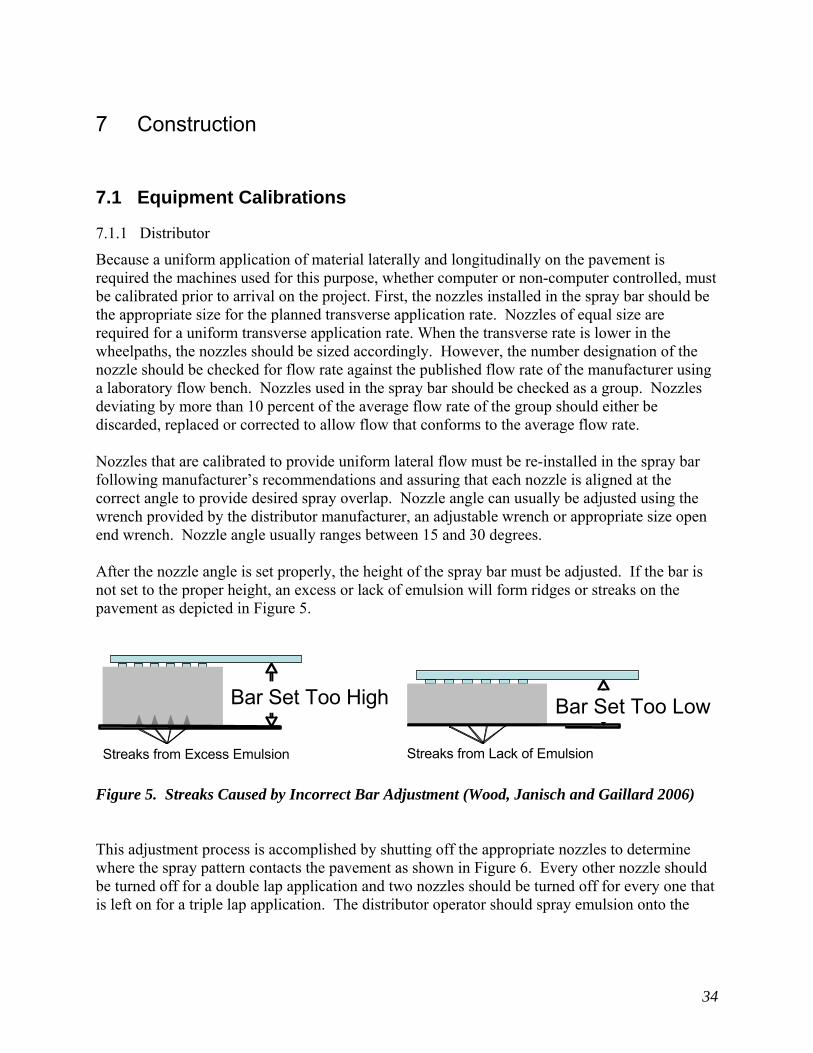
Because a uniform application of material laterally and longitudinally on the pavement is required the machines used for this purpose, whether computer or non-computer controlled, must be calibrated prior to arrival on the project. First, the nozzles installed in the spray bar should be the appropriate size for the planned transverse application rate. Nozzles of equal size are required for a uniform transverse application rate. When the transverse rate is lower in the wheelpaths, the nozzles should be sized accordingly. However, the number designation of the nozzle should be checked for flow rate against the published flow rate of the manufacturer using a laboratory flow bench. Nozzles used in the spray bar should be checked as a group. Nozzles deviating by more than 10 percent of the average flow rate of the group should either be discarded, replaced or corrected to allow flow that conforms to the average flow rate. Nozzles that are calibrated to provide uniform lateral flow must be re-installed in the spray bar following manufacturer’s recommendations and assuring that each nozzle is aligned at the correct angle to provide desired spray overlap. Nozzle angle can usually be adjusted using the wrench provided by the distributor manufacturer, an adjustable wrench or appropriate size open end wrench. Nozzle angle usually ranges between 15 and 30 degrees. After the nozzle angle is set properly, the height of the spray bar must be adjusted. If the bar is not set to the proper height, an excess or lack of emulsion will form ridges or streaks on the pavement as depicted in Figure 5.
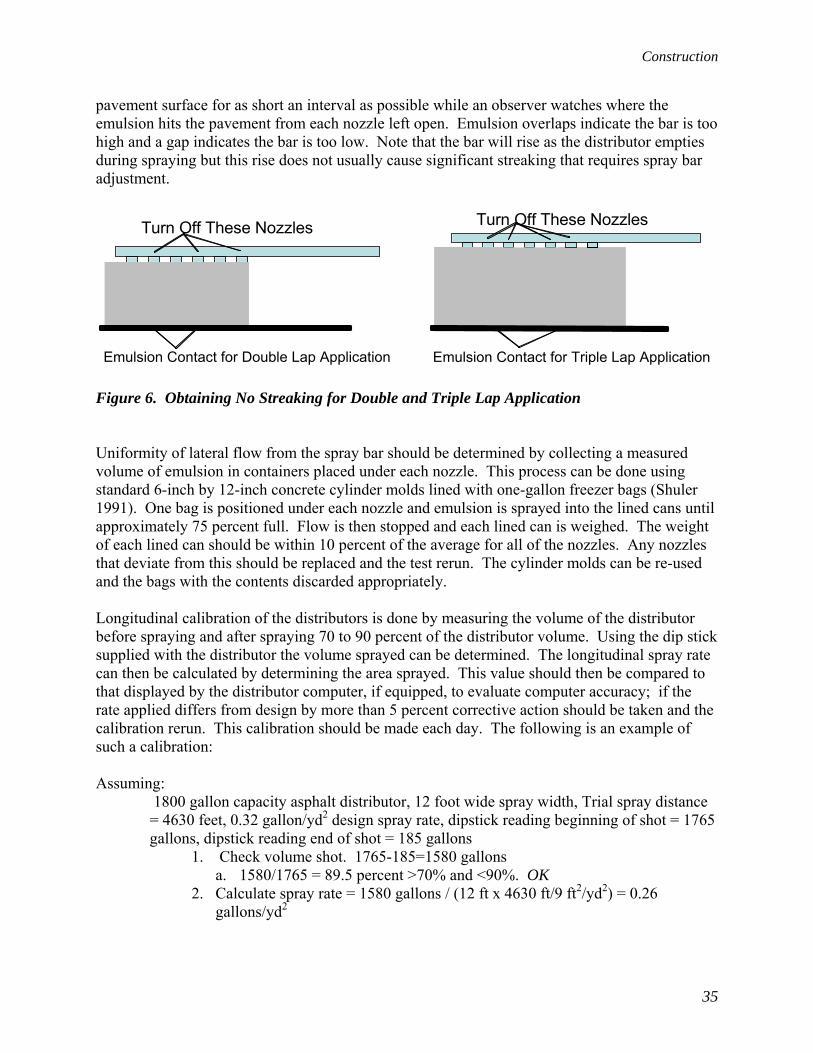
Figure 5. Streaks Caused by Incorrect Bar Adjustment (Wood, Janisch and Gaillard 2006) This adjustment process is accomplished by shutting off the appropriate nozzles to determine where the spray pattern contacts the pavement as shown in Figure 6. Every other nozzle should be turned off for a double lap application and two nozzles should be turned off for every one that is left on for a triple lap application. The distributor operator should spray emulsion onto the
Bar Set Too High
Streaks from Excess Emulsion
Bar Set Too Low
Streaks from Lack of Emulsion
Construction
35
pavement surface for as short an interval as possible while an observer watches where the emulsion hits the pavement from each nozzle left open. Emulsion overlaps indicate the bar is too high and a gap indicates the bar is too low. Note that the bar will rise as the distributor empties during spraying but this rise does not usually cause significant streaking that requires spray bar adjustment.
Figure 6. Obtaining No Streaking for Double and Triple Lap Application Uniformity of lateral flow from the spray bar should be determined by collecting a measured volume of emulsion in containers placed under each nozzle. This process can be done using standard 6-inch by 12-inch concrete cylinder molds lined with one-gallon freezer bags (Shuler 1991). One bag is positioned under each nozzle and emulsion is sprayed into the lined cans until approximately 75 percent full. Flow is then stopped and each lined can is weighed. The weight of each lined can should be within 10 percent of the average for all of the nozzles. Any nozzles that deviate from this should be replaced and the test rerun. The cylinder molds can be re-used and the bags with the contents discarded appropriately. Longitudinal calibration of the distributors is done by measuring the volume of the distributor before spraying and after spraying 70 to 90 percent of the distributor volume. Using the dip stick supplied with the distributor the volume sprayed can be determined. The longitudinal spray rate can then be calculated by determining the area sprayed. This value should then be compared to that displayed by the distributor computer, if equipped, to evaluate computer accuracy; if the rate applied differs from design by more than 5 percent corrective action should be taken and the calibration rerun. This calibration should be made each day. The following is an example of such a calibration: Assuming:
1800 gallon capacity asphalt distributor, 12 foot wide spray width, Trial spray distance = 4630 feet, 0.32 gallon/yd2 design spray rate, dipstick reading beginning of shot = 1765 gallons, dipstick reading end of shot = 185 gallons
1. Check volume shot. 1765-185=1580 gallons a. 1580/1765 = 89.5 percent >70% and <90%. OK
2. Calculate spray rate = 1580 gallons / (12 ft x 4630 ft/9 ft2/yd2) = 0.26 gallons/yd2
Emulsion Contact for Double Lap Application
Turn Off These Nozzles
Emulsion Contact for Triple Lap Application
Turn Off These Nozzles
Construction
36
a. 0.32 – 0.26 = 0.06 gal/ yd2 which is greater than 5 percent of the difference between the actual spray rate and the design.
3. Therefore, make adjustments to distributor speed or spray bar until the rate applied is within 5 percent of 0.32.
7.1.2 Chip Spreader
The chip spreader should be checked for uniform application both laterally and transversely. Lateral distribution is best checked using ASTM D5624, “Standard Test Method for Determining the Transverse-Aggregate Spread Rate for Surface Treatment Applications,” (ASTM D5624). Once accomplished and any spreader gates have been adjusted for variations, the longitudinal spread rate can be measured by applying the entire spreader capacity to the pavement and measuring the application rate. The mass of chips applied can be determined from weigh tickets of trucks loading the chip spreader. Conduct the calibration for three trucks and averaging the results. An example follows: For 12 ton capacity tandem dump trucks, 12 foot wide pavement, 28 pounds per square yard design spread rate
1. For Truck No. 1 a. Load = 23,803 lbs b. Spreader distance = 213 feet c. Rate = 23,803/213x12/3 = 27.9 lbs/yd2
2. For Truck No. 2 a. Load = 23,921 lbs b. Spreader distance = 211 feet c. Rate = 23,921/211 x 12/3 = 28.3 lbs/yd2
3. For Truck No. 3 a. Load = 23,848 lbs b. Spreader distance = 213 feet c. Rate = 23,848/213 x 12/3 = 28.0 lbs/yd2
4. Average Rate = (27.9 + 28.3 + 28.0) / 3 = 28.1 lbs/yd2 5. No adjustment needed (measured rate is within 1 percent of design)
Compensation for moisture on chips must be taken into account when calibrating chip spreaders.
7.2 Operations
7.2.1 Pavement Preparation
The substrate pavement should be structurally sound before chip sealing. Areas exhibiting alligator cracking should be patched the full depth of the pavement section using hot mix asphalt. The surface of these areas should be sprayed with a light application of slow setting asphalt emulsion diluted 50:50 with water at the rate of 0.10 gallons per square yard and allowed to cure
Construction
37
thoroughly before chip sealing so that the new chip seal binder will not be absorbed into the surface of the new patch. Failure to do this could lead to loss of chips under traffic. The substrate pavement should be clean before commencing chip seal operations. Dust and debris on the surface should be removed by power brooms. Pick-up type brooms should be used used in urban areas to avoid spreading surface contaminants onto adjacent properties. Push brooms may be used in rural areas when spreading excess chips onto shoulders does not impact property owners. The surface of the substrate pavement should be damp to dry. A damp surface is acceptable as long as moisture is present only in surface aggregate voids and is not present as free moisture between aggregates.
7.2.2 Environmental Conditions
The pavement temperature for chip seal operations should be a minimum of 70F with little or no wind. However, chip seal operations may commence before the pavement temperature reaches 70F as long as pavement temperatures are expected to be 70F and rising within 60 minutes after commencing work. Wind speeds in excess of 20 mph transverse to the pavement alignment can blow asphalt emulsion onto opposing traffic on two lane facilities, therefore chip seal operations should be avoided under these conditions. Chip seal operations should not be pursued if rain is threatening. A rain storm could wash asphalt emulsion onto concrete gutters or into roadside ditches. Ambient air temperatures in excess of 110F with the sun shining or with moderate winds can cause emulsified asphalts to form a ‘skin’ on the surface such that the emulsion does not set adequately. This situation may require the spread of chips closer to the distributor to obtain proper embedment. However, high air temperatures may lead to lower viscosity emulsion residue resulting in higher potential for pick up on rubber tire rollers. Increasing the demulsibility of anionic emulsions may help remedy this situation (Shuler 1991). There is anecdotal evidence to support limiting the season for chip sealing so construction does not occur when there may be periods of cool to cold weather after the chip seal is completed.
7.2.3 Emulsion Application
Each emulsion application should start and stop by spraying on top of 15 lb/yd2 roofing paper or similar dimensioned, equally heavy craft paper placed transverse to the centerline of the pavement. This creates a neat, sharp transverse joint. The distributor operator should position the spray bar at the rear of the paper on take-off so that by the time the bar reaches the pavement the distributor speed is appropriate for the desired spray rate. Another sheet of roofing paper should be placed across the pavement before the distributor stops. Spraying should stop when the spray bar has passed over the paper. Calculating when approximately 90 percent of the distributor volume has been sprayed is a good method to determine the distance where the second strip of roofing paper should be placed.
Construction
38
7.2.4 Chip Application
Chips should be applied to the surface of the fresh emulsion before it begins to set but not necessarily immediately after spraying. If the chips are applied too early, there is risk that the chips will roll over in the emulsion due to momentum created by the forward movement of the chip spreader. Thus, less binder will be available to hold the chips in place and the exposed binder becomes susceptible to being picked up on roller tires. Therefore, the adhesive quality of the emulsion should be checked to determine when to apply the chips. This may be determined by throwing a handful of chips onto the emulsion and observing whether they stick to the surface or tend to roll over. Some experimentation is necessary to estimate the proper timing, which can be accomplished during the first distributor application. In many cases, changes in environmental conditions during construction will require this test be repeated during the day because humidity, chip moisture, emulsion properties and ambient air temperature affect the adhesive quality of the emulsion.
7.2.5 Rolling
Different types of rollers have been used to embed chips on chip seals. Pneumatic rollers have a tendency to pick up chips due to the affinity of asphalt residues for rubber tires. However, these rollers do not crush chips insitu as do steel wheeled rollers. Although lightweight steel rollers of three tons or less may provide a means of leveling the surface of a new chip seal after pneumatic rolling, caution must be applied to avoid breaking aggregate chips. Steel rollers with rubber coated drums are also a good tool for embedding chips. However, any rigid drum roller will bridge over areas of the pavement with permanent deformation causing these areas to be inadequately rolled. Rollers must be able to keep up with the distributor and chip spreader and provide enough passes to embed the chips. If the rollers travel too fast, embedment will not be achieved. Therefore, the number of rollers used depends on roller speed, roller width, distributor and chip spreader speed and the number of passes required to achieve embedment. The faster the rollers move, the more rollers will be required to achieve embedment. This is because rollers need to ‘linger’ over an area of chip seal to obtain the desired chip embedment (Benson and Gallaway 1953, Elmore, et al 1995). The number of rollers required can be calculated based on this linger time and the assumption that the rollers should match the production of the distributor and chip spreader as follows (Gransberg 2004): N = 6.67 P x / A Where, N = number of rollers P = distributor speed, fpm x = lane width, ft A = area covered in one hour by rollers to get minimum ‘linger’, yd2 As an example, for a distributor traveling at 200 fpm and spraying 12 feet wide at a conservative 5000 square yards per hour coverage rate, N = 3.2. So, use 4 rollers. Fewer rollers will not be able to keep up with the distributor and spreader while maintaining the 5000 yd2 / hr rolling rate.
Construction
39
If they do keep up, the rollers will not spend enough time embedding aggregates because they are traveling too fast.
7.2.6 Initial Sweeping After Rolling
Light brooming should occur as soon as possible after rolling and before vehicular traffic is allowed on the surface to remove any excess chips. This should be possible when the moisture content of the chip seal reaches the level where 10 percent chip loss occurs after the laboratory sweep test. This moisture content, measured by the moisture loss test, was found to be approximately 15 to 25 percent of the total moisture present in the chip seal during research by NCHRP Project 14-17. Findings of NCHRP Project 14-17 indicate total moisture consists of water in the emulsion plus moisture in the aggregate chips, but not moisture in the pavement. Moisture content of the chip seal should be measured in areas of the project where moisture loss is expected to be least rapid, such as shady or cooler locations. Caution should be exercised when implementing this practice since it is based on limited research. Using vacuum brooms or push brooms with nylon (not steel) bristles should be applied with much care to avoid damage to the fresh seal. 7.2.7 Vehicular Traffic Under Traffic Control Vehicular traffic may be allowed on the fresh seal after initial sweeping if speeds can be controlled to less than 20 miles per hour using pilot vehicles. If speeds cannot be controlled to this speed, vehicles should not be allowed on the seal until final sweeping has been completed. Traffic control using pilot vehicles should be applied following the Manual on Uniform Traffic Control Devices for Streets and Highways (MUTCD 2009).
7.2.8 Removing Traffic Control
Traffic control may be removed and vehicular traffic allowed on the fresh chip seal after brooming has been completed to remove excess or loose chips and the moisture content of the seal reaches the level where less than 10 percent chip loss occurs after the laboratory sweep test. This moisture content, measured by the moisture loss test, was found to be approximately 15 to 25 percent of the total moisture present in the chip seal during research by NCHRP Project 14-17. Findings of NCHRP Project 14-17 indicate total moisture consists of water in the emulsion plus moisture in the aggregate chips, but not moisture in the pavement. Moisture content of the chip seal should be measured in areas of the project where moisture loss is expected to be least rapid, such as shady or cooler locations. Caution should be exercised when implementing this practice since it is based on limited research.
40
8 Quality Control Quality control is required to ensure desired performance. The following section describes procedures that should be followed to improve the liklihood of good performance for a chip seal project.
8.1 Aggregate Sieve Analysis
Aggregate gradation should be checked whenever there is potential for significant variation in the chip gradation. For example, if chips have been stockpiled near the project and there is sufficient quantity to supply the entire project, a complete gradation analysis before construction begins, and every 100 tons thereafter should be adequate. Also, loader operations at the stockpile can produce excess material passing the No. 200 screen and should, therefore, be monitored. Aggregate gradation should not deviate from the target design gradation by more than the following tolerances:
Tolerance, Sieve +/-, %
¾ 5 ½ 5 3/8 4 No. 4 3 No. 8 1 No. 200 0.5
When chips are supplied from multiple locations, sampling and testing for gradation should be done with more frequency, including checking each truck if high variability is suspected. Because a full sieve analysis may not be practical, hand sieving in the field using only the coarse aggregate screens can provide information on the suitability of the material or help determine if more laboratory testing is needed.
8.2 Moisture Content of System
The moisture content of the chips should be measured at the beginning and the end of the day for: (1) calculating aggregate spread rate and (2) determining when sweeping can occur and when traffic control can be removed. Moisture content can be determined by complete moisture evaporation from the chips using a forced draft oven or a microwave oven. By weighing the chips before and after removing moisture, the moisture content, w, can be determined as follows: w, % = Wet Weight – Dry Weight x 100 Wet Weight
Quality Control
41
8.3 Embedment Depth Measurement During Construction
Embedment depth is usually determined during construction by pulling several chips out of the binder and visually estimating the amount of embedment. This is difficult and often subjective even if chips have a very low flakiness index. Therefore, a new method is recommended by spreading a volume of 50 cm3 of glass beads over the surface of the embedded chips and measuring the diameter. During the chip seal design the relationship between glass bead diameter and aggregate embedment is determined. During construction the glass beads are spread on the pavement and the diameter measured. Embedment is then determined using the relationship between glass bead diameter and embedment from the design measurements.
8.4 Field Viscosity
The viscosity of the emulsion should be checked for each transport load. This can be done in the absence of a field laboratory using a Wagner flow cup. Flow times of 20 to 70 seconds at 85 to 150F for a 6 mm orifice or 10 to 60 seconds at 85 to 140F for a 7.5 mm orifice have been found to provide satisfactory flow rates. If flow rates using a Wagner cup are not within these limits, the temperature of the emulsion should be checked to determine if emulsion temperature is the cause. If temperature of the emulsion is not causing unacceptable flow rates, other causes should be investigated.
42
9 Performance
9.1 Less Than One Year
Performance during the very early life of the chip seal is judged based on chip loss or flushing. Chip loss can happen as soon as a few hours after removing traffic control. If the loss is greater than 10 percent of the applied chip quantity (assuming a one-layer chip application), the cause should be investigated. Often, early failures of this type are due to high chip application rates, low emulsion application rates, or both. Early chip loss can also be due to excess material passing the No. 200 screen, or aggregate not meeting gradation requirements. Unexpected low temperatures, wet weather, or opening to traffic before adequate residue adhesion has developed can cause early chip loss. Inundation of chips occurs because of high emulsion application rate, embedment of chips in the substrate, or both. Streaking, or roping is caused by the spray bar on the asphalt distributor being either too high or too low. Correction after construction is not possible without the application of another seal.
9.2 Greater Than One Year
Performance after one year can be measured using texture depth. Some specifications (Austroads 2006) limit design life based on texture of less than 0.9 mm on pavements with speeds greater than 43 miles per hour. The following relationship has been proposed as a means of predicting approximate texture after one year (Gransberg et al 2005):
Td1 = 0.07 ALD log Yd + 0.9 where
Td1 = texture depth in 1 year, mm; Yd = design life in years; and
ALD = average least dimension of the aggregate, mm Texture depth is determined using sand patch or CT Meter tests. If texture is less than the predicted value, the texture should be monitored to determine if a loss of texture beyond 0.9 mm is expected.
43
10 References AASHTO T11, “Material Finer Than 75- μm (No. 200) Sieve in Mineral Aggregate by Washing”, Standard Specifications for Transportation Materials and Methods of Sampling and Testing, American Association of State Highway and Transportation Officials, Part 2A: Tests. AASHTO T19, “Bulk Density (“Unit Weight”) and Voids in Aggregate”, Standard Specifications for Transportation Materials and Methods of Sampling and Testing, American Association of State Highway and Transportation Officials, Part 2A: Tests. AASHTO T27, “Sieve Analysis of Fine and Coarse Aggregate”, Standard Specifications for Transportation Materials and Methods of Sampling and Testing, American Association of State Highway and Transportation Officials, Part 2A: Tests. AASHTO T85, “Specific Gravity and Absorption of Fine and Coarse Aggregate”, Standard Specifications for Transportation Materials and Methods of Sampling and Testing, American Association of State Highway and Transportation Officials, Part 2A: Tests. AASHTO T96, “Standard Test Method for Measuring Los Angeles Abrasion”, Standard Specifications for Transportation Materials and Methods of Sampling and Testing, American Association of State Highway and Transportation Officials, Part 2A: Tests. AASHTO T104, “Standard Test Method for Sodium and Magnesium Sulfate Soundness of Aggregate Samples”, Standard Specifications for Transportation Materials and Methods of Sampling and Testing, American Association of State Highway and Transportation Officials, Part 2A: Tests. AASHTO T279, “Standard Test Method for Polishing of Pavement Surfaces Using the British Wheel”, Standard Specifications for Transportation Materials and Methods of Sampling and Testing, American Association of State Highway and Transportation Officials, Part 2A: Tests. AASHTO T327, “Standard Test Method for Measuring Micro Deval of Aggregate Samples”, Standard Specifications for Transportation Materials and Methods of Sampling and Testing, American Association of State Highway and Transportation Officials, Part 2A: Tests. Asphalt Institute, The Basic Asphalt Emulsion Manual, MS-19, 4th Edition, ISBN: 978193415456 ASTM E965-96, “Standard Test Method for Measuring Pavement Macrotexture Using a Volumetric Technique”, American Society for Testing Materials, Vol. 04.03, Road and Paving Materials; Vehicular-Pavement Systems.
References
44
ASTM E1845, “Pratice of r Calculating Pavement Macrotexture Mean Profile Depth”, Volume 04.03, Road and Paving Materials; Vehicular-Pavement Systems. ASTM E 2157-01, “Standard Test Method for Measuring Pavement Macrotexture Properties Using the Circular Track Meter,” Volume 04.03, Road and Paving Materials; Vehicular-Pavement Systems. ASTM D 2487-04, “Standard Test Method for Classifying Soils and Aggregates,” ,Volume 04.03, Road and Paving Materials; Vehicular-Pavement Systems. ASTM D5624-02, “Standard Test Method for Determining the Transverse-Aggregate Spread Rate for Surface Treatment Applications”, American Society for Testing Materials, Vol. 04.03, Road and Paving Materials; Vehicular-Pavement Systems. Austroads Technical Report, Update of the Austroads Sprayed Seal Design Method, AP-T68/06, September 2006, ISBN 1 921139 65 X Austroads Test Method AG:PT/T051 Average least dimension of aggregate by direct measurement (nominal size 10 mm and greater), June 2005. Benson, F., & Gallaway, B. (1953). Retention of cover stone by asphalt surface treatments. Texas Engineering Experiment Station, 133, 1-58 Dumas, B., Proceedings of the 8th Conference on Asphalt Pavements for Southern Africa (CAPSA'04) 12 – 16 September 2004, Sun City, South Africa. ISBN Number: 1-920-01718-6 Elmore, W. E., Solaimanian, M., McGennis, R. B., Phromson, C., and Kennedy, T. W. (1995) “Performance-based Seal Coat Specifications.” CTR Research Report No. 1367-1, Center for Transportation Research, Austin, Texas. Epps, J. A., Gallaway, B. M., and Hughes, C. H., “Field Manual on Design and Construction of Seal Coats”, Texas Transportation Institute, Research Report 214-25, July, 1981. Gallaway, B. M. and W. J. Harper, “A Laboratory and Field Evaluation of Lightweight Aggregates as Coverstone for Seal Coats and Surface Treatments,” Research Report 51-2, Texas Transportation Institute, Texas A&M University, College Station, 1966. Gransberg, D., Karaca, I., & Senadheera, S. (2004, May/June). Calculating Roller Requirements for Chip Seal Projects. Journal of Construction Engineering and Management, 130 (3), 378-384. Gransberg, D., Pidwerbesky, B., Stemprok, R., and Waters, J., “Measuring Chip Seal Surface Texture with Digital Imagery”, International Conference on Surface Friction of Roads and Runways, Christchurch, NZ, May 2005.
References
45
Hanson, F. M., “Bituminous Surface Treatments on Rural Highways”, Proceedings of the New Zealand Society of Civil Engineers, Vol. 21, 1934-1935, p 89. Jackson G.P., 1963 Surface Dressing. Bitumen Division, Shell International Petroleum Co. Ltd. London. Kearby, J. P. Tests and Theories on Penetration Surfaces. In Transportation Research Record: Journal of the Transportation Research Board, No 271, Council, Washington, D.C., 1953, pp. 232-237. Lee, J.S. and Y.R. Kim. "Understanding the Effects of Aggregate and Emulsion Application Rates on the Performance of Asphalt Surface Treatments," In Press, Journal of Transportation Research Board, National Research Council, Washington, D.C., 2007. Manual on Uniform Traffic Control Devices for Streets and Highways (MUTCD 2009), US Department of Transportation, FHWA. Martin, R., (1989), District Maintnenace Engineer, Texas DOT, personal observations of distributor spray nozzle calibration and practice. McLeod, N. W., “Seal Coat Design”, Proceedings of the Association of Asphalt Paving Technologists, Vol. 38, February, 1969. McLeod, N. (1960). Basic Principles for the Design and construction of Seal Coats and Surface Treatments. Proceedings of the Associuation of Asphalt Paving Technologist, 29, 1-150. McLeod, N. W., “Seal Coat Design”, Proceedings of the Association of Asphalt Paving Technologists, Vol. 38, February, 1969. Peshkin, D. G., Hoerner, T. E., and Zimmerman, K. A., “Optimal Timing of Pavement Preventive Maintenance Treatment Applications,” NCHRP Report 523, Transportation Research Board, National Research Council, Washington, D.C., 2004. Shuler, S. (1991). “High Traffic Chip-Seal Construction: The Tulsa Test Road” Transportation Research Record 1300. Transportation Research Board, National Research Council, Washington, D.C., 1991. Shuler, S. (2007). “Interim Report: Pavement Preventive Maintenance Treatments.” Project 10.50 Colorado Department of Transportation, Denver, CO. Shuler, S. and Lord, A., (2009), A New Laboratory Test for Predicting Very Early Chip Seal Performance, Journal of the Association of Asphalt Paving Technologists, Vol. 78, pp South African National Roads Agency, Ltd, Design and Construction of Surfacing Seals, Technical Recommendations for Highways, TRH3 2007, Pretoria, South Africa, pp 1-276.

References
46
Utah DOT, Open-Graded Friction Course (OGFC) Specification, 02786, January 1, 2008. Wood, T. J., Janisch, D. W., and Gaillard, F. S., “Minnesota Seal Coat Handbook 2006”, Report NO. MN/RC-2006-34, June 2006.

1
Attachment 2 – Recommended Test Methods The proposed test methods, prepared as part of NCHRP 14-17. “Manual for Emulsion-Based Chip Seals for Pavement Preservation”, are the recommendations of the NCHRP Project 14-17 staff at Colorado State University. These test methods have not been approved by NCHRP or any AASHTO committee nor have they been accepted as AASHTO specifications.
1
Recommended Standard Method of Test for Embedment Depth of Chip Seal Aggregates in the Lab and the Field
AASHTO Designation: Txxx-xx 1. SCOPE
1.1 This test method provides the average aggregate embedment depth, in asphalt, of field chip seals and laboratory specimens.
1.2 The values stated in SI units are to be regarded as the standard unless otherwise indicated.
1.3 A precision and bias statement for this standard has not been developed at this time. Therefore, this standard should not be used for acceptance or rejection of a material for purchasing purposes.
This standard does not purport to address all of the safety concerns, if any, associated with its use. It is the responsibility of the user of this standard to establish appropriate safety and health practices and determine the applicability of regulatory limitations prior to use.
2. REFERENCED DOCUMENTS
2.1 ASTM Standards:
• D 8, Terminology Relating to Materials for Roads and Pavements
• FHWA Publication - The Asphalt Institute: FHWA-IP-79-1 A Basic Asphalt Emulsion Manual
3. SUMMARY OF TEST METHOD
3.1 Where the void ratio of an area of chip seal may be estimated with acceptable accuracy, and where voids (Note 1) between all chip seal particles are filled with a given mass of glass beads of known packing density, the average height of beads within the chip seal layer may be determined. This average height of beads, between the surface level of the asphalt and the average height level of the chip seal particles, would reflect the chip seal’s texture height. Given the average particle height of the chip seal aggregate, one may perform a calculation, using the evaluated texture height, to yield the chip seal embedment depth.
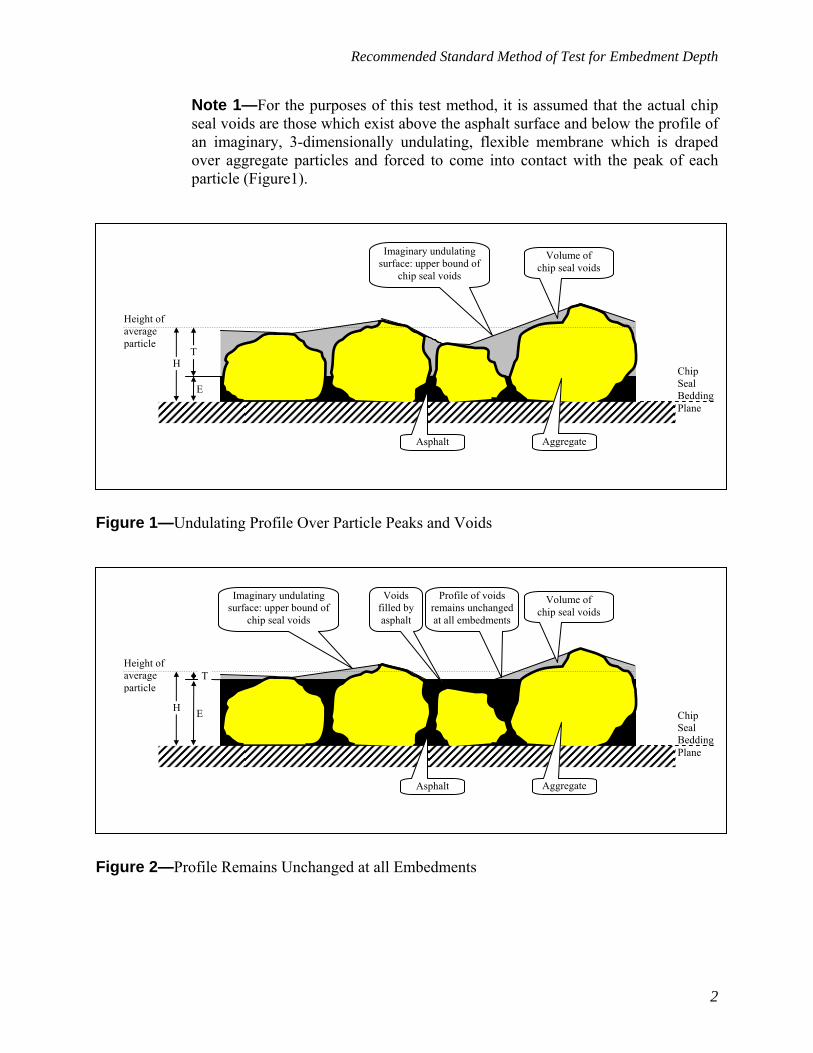
Recommended Standard Method of Test for Embedment Depth
2
Note 1—For the purposes of this test method, it is assumed that the actual chip seal voids are those which exist above the asphalt surface and below the profile of an imaginary, 3-dimensionally undulating, flexible membrane which is draped over aggregate particles and forced to come into contact with the peak of each particle (Figure1).
Figure 1—Undulating Profile Over Particle Peaks and Voids
Figure 2—Profile Remains Unchanged at all Embedments
Chip Seal Bedding Plane
Height of average particle
Asphalt Aggregate
Imaginary undulating surface: upper bound of
chip seal voids
H E
Volume of chip seal voids
T
Voids filled by asphalt
Profile of voids remains unchanged at all embedments
Chip Seal Bedding Plane
Height of average particle
Asphalt Aggregate
Imaginary undulating surface: upper bound of
chip seal voids
H
E
T
Volume of chip seal voids
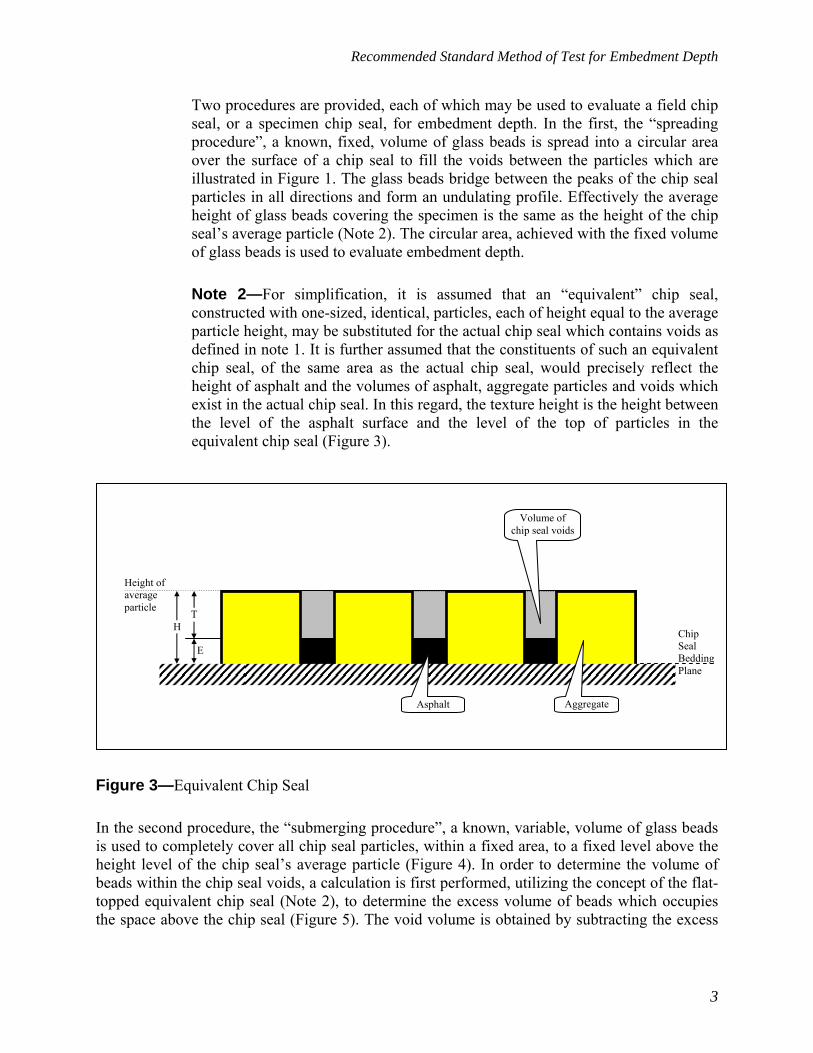
Recommended Standard Method of Test for Embedment Depth
3
Two procedures are provided, each of which may be used to evaluate a field chip seal, or a specimen chip seal, for embedment depth. In the first, the “spreading procedure”, a known, fixed, volume of glass beads is spread into a circular area over the surface of a chip seal to fill the voids between the particles which are illustrated in Figure 1. The glass beads bridge between the peaks of the chip seal particles in all directions and form an undulating profile. Effectively the average height of glass beads covering the specimen is the same as the height of the chip seal’s average particle (Note 2). The circular area, achieved with the fixed volume of glass beads is used to evaluate embedment depth.
Note 2—For simplification, it is assumed that an “equivalent” chip seal, constructed with one-sized, identical, particles, each of height equal to the average particle height, may be substituted for the actual chip seal which contains voids as defined in note 1. It is further assumed that the constituents of such an equivalent chip seal, of the same area as the actual chip seal, would precisely reflect the height of asphalt and the volumes of asphalt, aggregate particles and voids which exist in the actual chip seal. In this regard, the texture height is the height between the level of the asphalt surface and the level of the top of particles in the equivalent chip seal (Figure 3).
Figure 3—Equivalent Chip Seal
In the second procedure, the “submerging procedure”, a known, variable, volume of glass beads is used to completely cover all chip seal particles, within a fixed area, to a fixed level above the height level of the chip seal’s average particle (Figure 4). In order to determine the volume of beads within the chip seal voids, a calculation is first performed, utilizing the concept of the flat-topped equivalent chip seal (Note 2), to determine the excess volume of beads which occupies the space above the chip seal (Figure 5). The void volume is obtained by subtracting the excess
Chip Seal Bedding Plane
Height of average particle
Volume of chip seal voids
H
E
T
Asphalt Aggregate
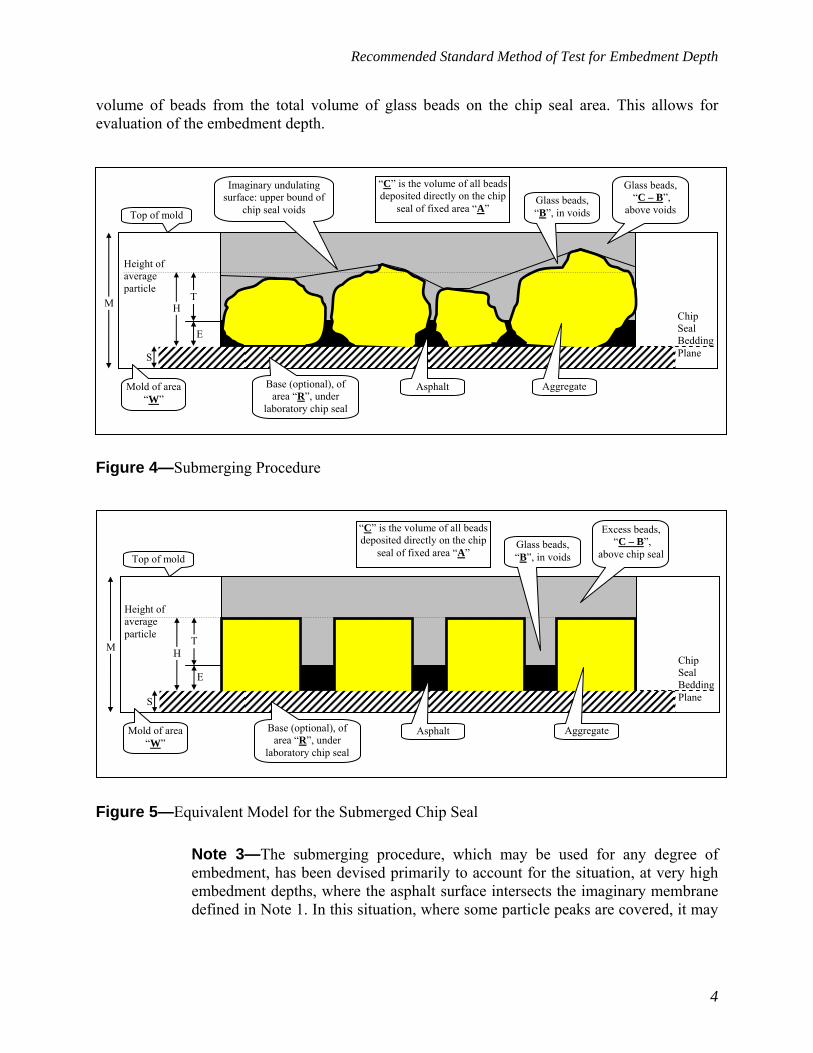
Recommended Standard Method of Test for Embedment Depth
4
volume of beads from the total volume of glass beads on the chip seal area. This allows for evaluation of the embedment depth.
Figure 4—Submerging Procedure
Figure 5—Equivalent Model for the Submerged Chip Seal
Note 3—The submerging procedure, which may be used for any degree of embedment, has been devised primarily to account for the situation, at very high embedment depths, where the asphalt surface intersects the imaginary membrane defined in Note 1. In this situation, where some particle peaks are covered, it may
Chip Seal Bedding Plane
Height of average particle
S
H
E
T
“C” is the volume of all beads deposited directly on the chip
seal of fixed area “A”
M
Base (optional), of area “R”, under
laboratory chip seal
Top of mold
Mold of area “W”
Excess beads, “C – B”,
above chip sealGlass beads, “B”, in voids
Asphalt Aggregate
Chip Seal Bedding Plane
Height of average particle
Asphalt Aggregate
Glass beads, “C – B”,
above voids
S
M
Base (optional), of area “R”, under
laboratory chip seal
Top of mold
Imaginary undulating surface: upper bound of
chip seal voids
H
E
T
“C” is the volume of all beads deposited directly on the chip
seal of fixed area “A”
Mold of area “W”
Glass beads, “B”, in voids
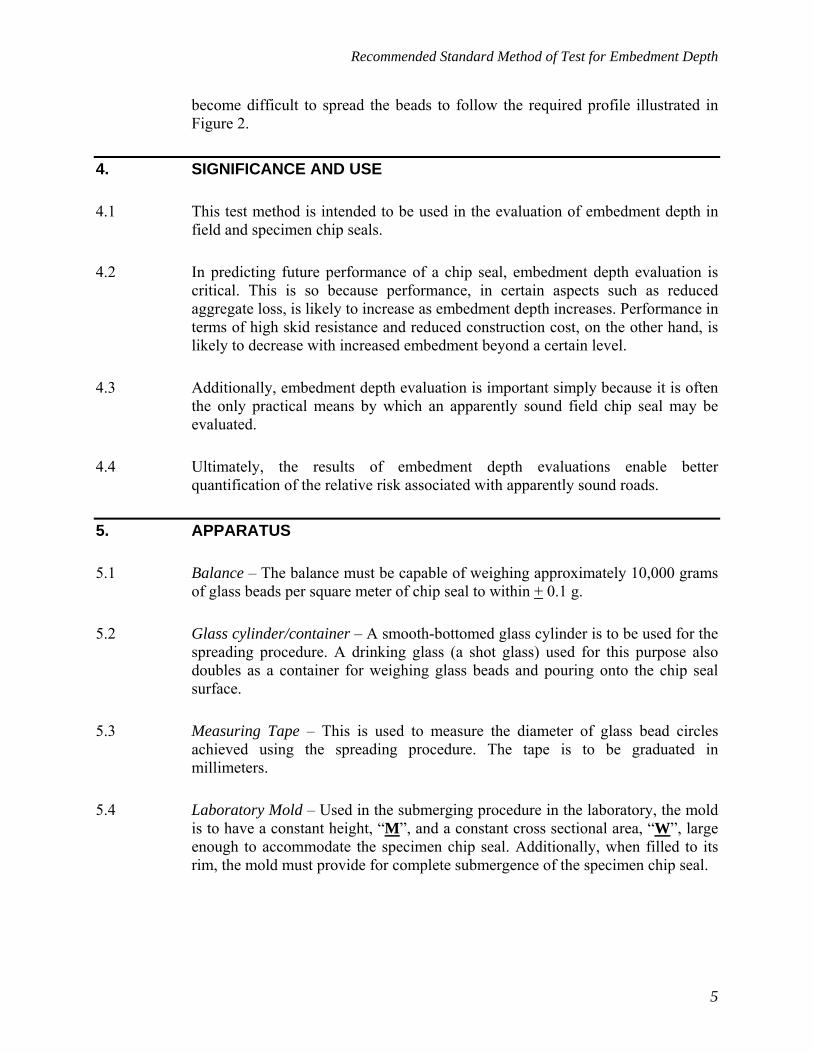
Recommended Standard Method of Test for Embedment Depth
5
become difficult to spread the beads to follow the required profile illustrated in Figure 2.
4. SIGNIFICANCE AND USE
4.1 This test method is intended to be used in the evaluation of embedment depth in field and specimen chip seals.
4.2 In predicting future performance of a chip seal, embedment depth evaluation is critical. This is so because performance, in certain aspects such as reduced aggregate loss, is likely to increase as embedment depth increases. Performance in terms of high skid resistance and reduced construction cost, on the other hand, is likely to decrease with increased embedment beyond a certain level.
4.3 Additionally, embedment depth evaluation is important simply because it is often the only practical means by which an apparently sound field chip seal may be evaluated.
4.4 Ultimately, the results of embedment depth evaluations enable better quantification of the relative risk associated with apparently sound roads.
5. APPARATUS
5.1 Balance – The balance must be capable of weighing approximately 10,000 grams of glass beads per square meter of chip seal to within + 0.1 g.
5.2 Glass cylinder/container – A smooth-bottomed glass cylinder is to be used for the spreading procedure. A drinking glass (a shot glass) used for this purpose also doubles as a container for weighing glass beads and pouring onto the chip seal surface.
5.3 Measuring Tape – This is used to measure the diameter of glass bead circles achieved using the spreading procedure. The tape is to be graduated in millimeters.
5.4 Laboratory Mold – Used in the submerging procedure in the laboratory, the mold is to have a constant height, “M”, and a constant cross sectional area, “W”, large enough to accommodate the specimen chip seal. Additionally, when filled to its rim, the mold must provide for complete submergence of the specimen chip seal.
Recommended Standard Method of Test for Embedment Depth
6
Note 4—The top elevation of the mold needs only be some 3 millimeters higher than the tallest chip seal particle in order to allow smooth screeding of the surface.
5.5 Working Platform – For precision, the specimen chip seal and laboratory mold should always be prepared and configured on a flat and level platform.
5.6 Offset Spacers – To perform the submergence procedure in the field, offset spacers, of known height, are used to establish an offset distance from the bedding plane of the chip seal. The tops of the spacers are equidistant from the bedding plane and higher than the average particle height in order to achieve submergence of chip seal particles.
Note 5—The submerging procedure is not a suitable candidate on steeply sloping roadways or where the level of the bedding plane is unknown. The procedure is suitable on areas where the bedding plane level has been recorded and where the plane is flat and approximately level in the area to be tested.
5.7 Field Mold – When carrying out the submerging procedure in the field, a field mold is to be used to form the glass beads over a fixed area of chip seal. The field mold is to be built up using a perimeter gasket wall and a flat metal surface with a cut-out. The vertical-faced gasket wall, which may consist of moldable putty or silicone, must be shaped such that it dams the spaces between chip seal particles and finishes flush with the cut-out area of the metal surface. Placement of the metal surface is to be accommodated by the use of offset spacers such that it is flat, at a known height above the average chip seal particle, and allows full submergence of the chip seal.
6. PREPARATION OF MATERIALS
6.1 Specimen Chip Seal – For the purposes of this test method, a specimen chip seal is constructed on a flat and level base, or sheet, of known thickness “S” and area “R”. Additionally, for the submerging procedure, it must be possible to place the specimen into a mold or to form a mold (section 5.4) around the chip seal.
6.2 Area of Chip Seal – Precisely measure the chip seal area, “A”, which is being evaluated for embedment.
6.3 Glass Beads – These are fine particles of glass which are able to fit between chip seal particles and, en masse, follow the contours of the particles’ surface.
Recommended Standard Method of Test for Embedment Depth
7
6.4 Packing Density of Glass Beads – Fill the tared mold, of known volume “K”, with glass beads and weigh the filled container. Establish the packed glass beads’ mass per unit volume, “P”, for use in the following procedures.
7. SPREADING PROCEDURE IN THE LAB AND IN THE FIELD
7.1 Using the tared glass cylinder/container, weigh out a pre-calculated mass of glass beads which will provide a chosen volume, “B”, at a packed density, “P” (defined in section 6.). Record the mass to the nearest 0.1 g.
7.2 Pour the glass beads onto the center of the specimen to form a pile. Position the glass cylinder on the pile of glass beads and move it in a circle to spread the beads into a circular area.
7.3 Use the fingers to continue spreading the beads outward in a circle while allowing the beads to accumulate between particle peaks, completely and exactly filling the void volume (Note 1). This is achieved when only the highest point of each aggregate particle (not otherwise submerged by asphalt) is exposed.
7.4 Place a marker at the approximate center of the circular area of beads. Rotating about the marker, take four diameter measurements, with the measuring tape, in line with the marker and rotationally offset 45 degrees from each other. Calculate the average circle diameter “D”.
8. SUBMERGING PROCEDURE IN THE LAB AND IN THE FIELD
8.1 Weigh and record, to the nearest 0.1 g, the mass of a volume, “Y”, of glass beads which will be more than enough to cover the chip seal and fill the mold.
8.2 For the lab procedure, place the specimen chip seal into the mold, or form the mold around the specimen, ensuring that the mold and the specimen are flat and level and that complete submergence of the chip seal will be achieved.
8.3 For the field procedure, install the offset spacers such that they are elevated a known height above the bedding plane of the chip seal as a guide for the installation height of the field mold.
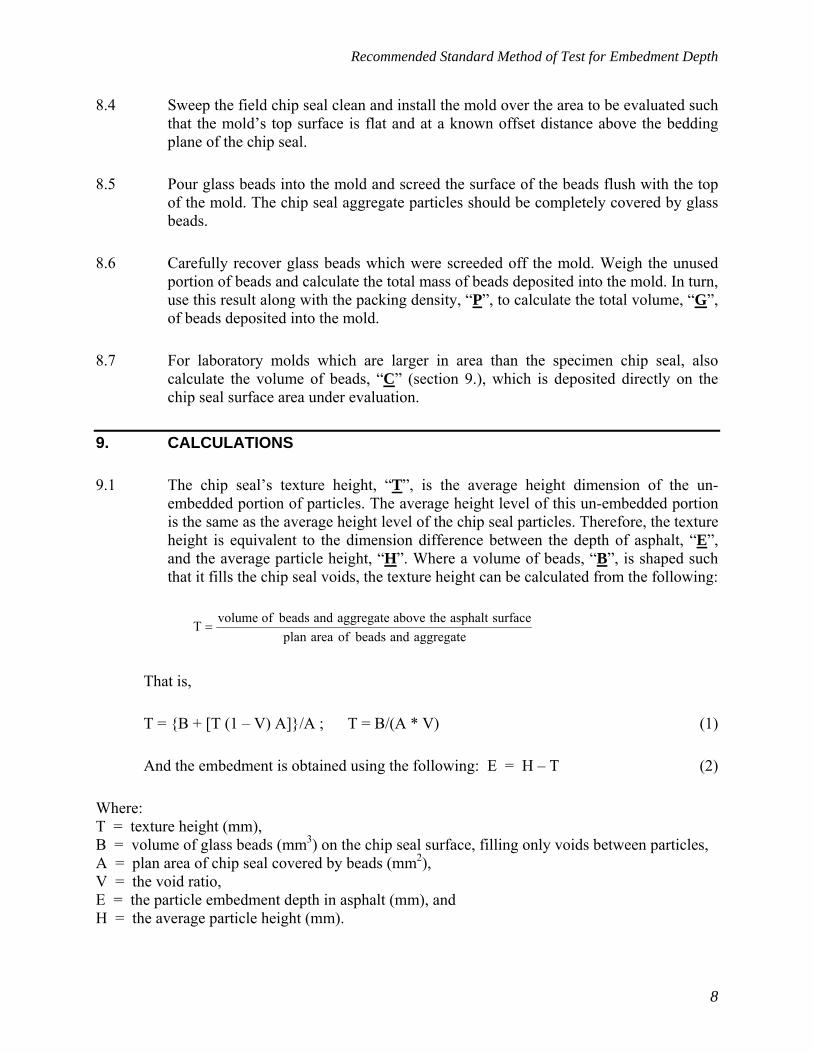
Recommended Standard Method of Test for Embedment Depth
8
8.4 Sweep the field chip seal clean and install the mold over the area to be evaluated such that the mold’s top surface is flat and at a known offset distance above the bedding plane of the chip seal.
8.5 Pour glass beads into the mold and screed the surface of the beads flush with the top of the mold. The chip seal aggregate particles should be completely covered by glass beads.
8.6 Carefully recover glass beads which were screeded off the mold. Weigh the unused portion of beads and calculate the total mass of beads deposited into the mold. In turn, use this result along with the packing density, “P”, to calculate the total volume, “G”, of beads deposited into the mold.
8.7 For laboratory molds which are larger in area than the specimen chip seal, also calculate the volume of beads, “C” (section 9.), which is deposited directly on the chip seal surface area under evaluation.
9. CALCULATIONS
9.1 The chip seal’s texture height, “T”, is the average height dimension of the un-embedded portion of particles. The average height level of this un-embedded portion is the same as the average height level of the chip seal particles. Therefore, the texture height is equivalent to the dimension difference between the depth of asphalt, “E”, and the average particle height, “H”. Where a volume of beads, “B”, is shaped such that it fills the chip seal voids, the texture height can be calculated from the following:
aggregateandbeadsofareaplansurfaceasphalttheaboveaggregateandbeadsofvolumeT =
That is,
T = {B + [T (1 – V) A]}/A ; T = B/(A * V) (1)
And the embedment is obtained using the following: E = H – T (2)
Where: T = texture height (mm), B = volume of glass beads (mm3) on the chip seal surface, filling only voids between particles, A = plan area of chip seal covered by beads (mm2), V = the void ratio, E = the particle embedment depth in asphalt (mm), and H = the average particle height (mm).
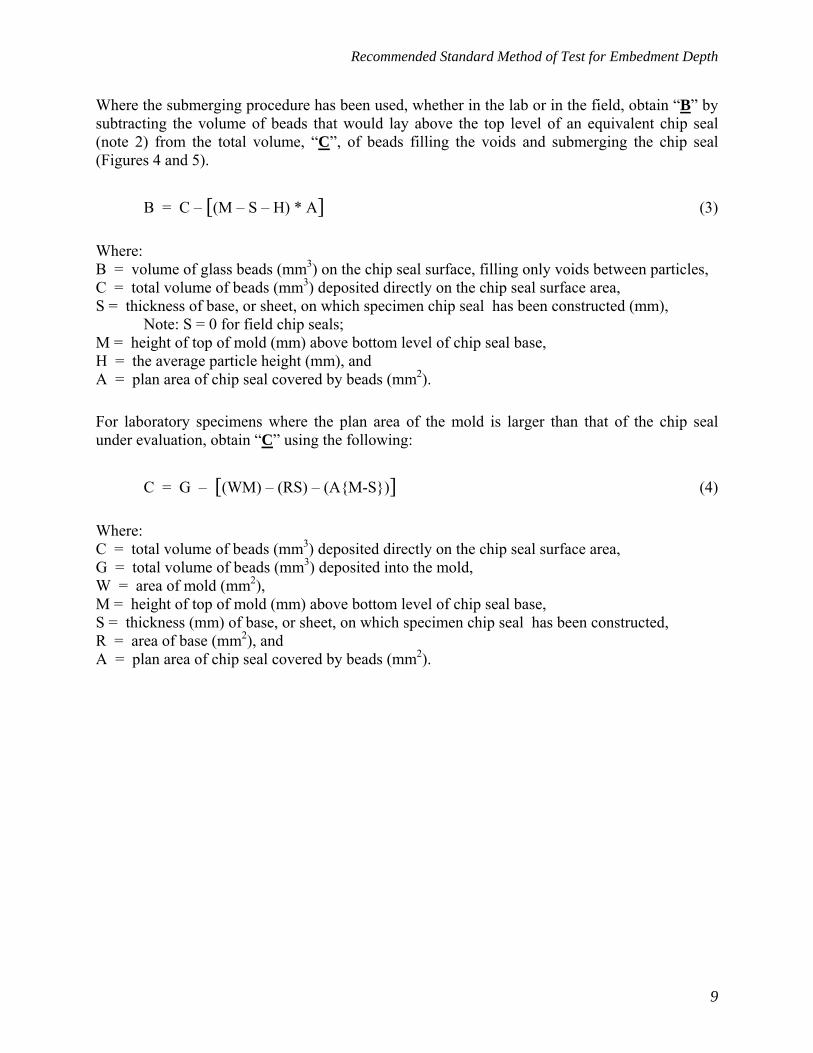
Recommended Standard Method of Test for Embedment Depth
9
Where the submerging procedure has been used, whether in the lab or in the field, obtain “B” by subtracting the volume of beads that would lay above the top level of an equivalent chip seal (note 2) from the total volume, “C”, of beads filling the voids and submerging the chip seal (Figures 4 and 5).
B = C – [(M – S – H) * A] (3)
Where: B = volume of glass beads (mm3) on the chip seal surface, filling only voids between particles, C = total volume of beads (mm3) deposited directly on the chip seal surface area, S = thickness of base, or sheet, on which specimen chip seal has been constructed (mm),
Note: S = 0 for field chip seals; M = height of top of mold (mm) above bottom level of chip seal base, H = the average particle height (mm), and A = plan area of chip seal covered by beads (mm2).
For laboratory specimens where the plan area of the mold is larger than that of the chip seal under evaluation, obtain “C” using the following:
C = G – [(WM) – (RS) – (A{M-S})] (4)
Where: C = total volume of beads (mm3) deposited directly on the chip seal surface area, G = total volume of beads (mm3) deposited into the mold, W = area of mold (mm2), M = height of top of mold (mm) above bottom level of chip seal base, S = thickness (mm) of base, or sheet, on which specimen chip seal has been constructed, R = area of base (mm2), and A = plan area of chip seal covered by beads (mm2).
1
Recommended Standard Method of Test for Laboratory Chip Loss from Emulsified Asphalt Chip Seal Samples
AASHTO Designation: Txxxx-xx 1. SCOPE
1.1 This test method measures the quantity of aggregate lost, at variable moisture levels of systems of asphalt emulsion and aggregate chips, by simulating the brooming of a chip seal in the laboratory.
1.2 The values stated in SI units are to be regarded as the standard unless otherwise indicated.
1.3 A precision and bias statement for this standard has not been developed at this time. Therefore, this standard should not be used for acceptance or rejection of a material for purchasing purposes.
1.4 This standard does not purport to address all of the safety concerns, if any, associated with its use. It is the responsibility of the user of this standard to establish appropriate safety and health practices and determine the applicability of regulatory limitations prior to use.
2. REFERENCED DOCUMENTS
2.1 ASTM Standards:
• C 29, Standard Test Method for Bulk Density (“Unit Weight”) and Voids in Aggregate
• C 127, Test Method for Density, Relative Density (Specific Gravity), and Absorption of Coarse Aggregate
• C 136, Sieve Analysis of Fine and Coarse Aggregates
• D 8, Terminology Relating to Materials for Roads and Pavements
• D 75, Practice for Sampling Aggregates
• D 140, Practice for Sampling Bituminous Materials
• D 226, Specification for Asphalt-Saturated Organic Felt Used in Roofing and Waterproofing
• D 977, Specification for Emulsified Asphalt
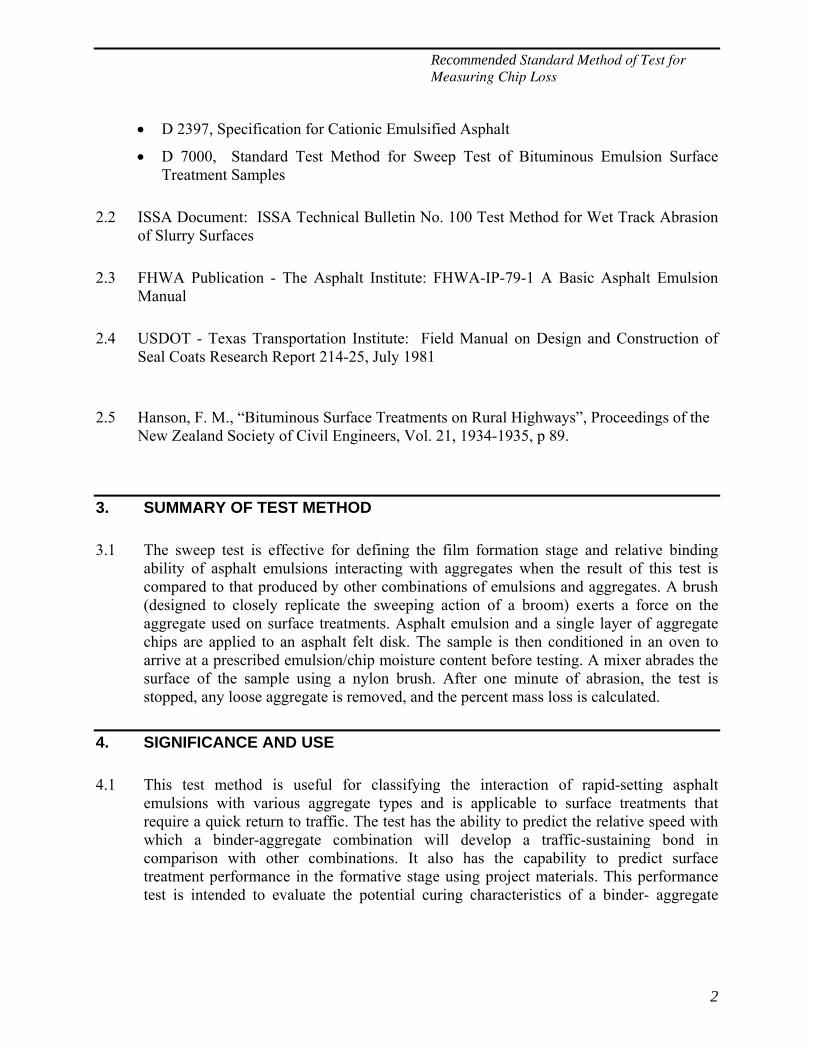
Recommended Standard Method of Test for Measuring Chip Loss
2
• D 2397, Specification for Cationic Emulsified Asphalt
• D 7000, Standard Test Method for Sweep Test of Bituminous Emulsion Surface Treatment Samples
2.2 ISSA Document: ISSA Technical Bulletin No. 100 Test Method for Wet Track Abrasion of Slurry Surfaces
2.3 FHWA Publication - The Asphalt Institute: FHWA-IP-79-1 A Basic Asphalt Emulsion Manual
2.4 USDOT - Texas Transportation Institute: Field Manual on Design and Construction of Seal Coats Research Report 214-25, July 1981
2.5 Hanson, F. M., “Bituminous Surface Treatments on Rural Highways”, Proceedings of the
New Zealand Society of Civil Engineers, Vol. 21, 1934-1935, p 89.
3. SUMMARY OF TEST METHOD
3.1 The sweep test is effective for defining the film formation stage and relative binding ability of asphalt emulsions interacting with aggregates when the result of this test is compared to that produced by other combinations of emulsions and aggregates. A brush (designed to closely replicate the sweeping action of a broom) exerts a force on the aggregate used on surface treatments. Asphalt emulsion and a single layer of aggregate chips are applied to an asphalt felt disk. The sample is then conditioned in an oven to arrive at a prescribed emulsion/chip moisture content before testing. A mixer abrades the surface of the sample using a nylon brush. After one minute of abrasion, the test is stopped, any loose aggregate is removed, and the percent mass loss is calculated.
4. SIGNIFICANCE AND USE
4.1 This test method is useful for classifying the interaction of rapid-setting asphalt emulsions with various aggregate types and is applicable to surface treatments that require a quick return to traffic. The test has the ability to predict the relative speed with which a binder-aggregate combination will develop a traffic-sustaining bond in comparison with other combinations. It also has the capability to predict surface treatment performance in the formative stage using project materials. This performance test is intended to evaluate the potential curing characteristics of a binder- aggregate
Recommended Standard Method of Test for Measuring Chip Loss
3
combination to ensure that the surface treatment is sufficiently cured before allowing traffic onto the chip seal.
5. APPARATUS
5.1 Mixer – Use to abrade the sample.
5.2 Quick-clamp Mounting Base – This base must be an adequate and level support for clamping the sample in place. The test sample should not move during abrasion.
5.3 Pan – An appropriate pan will contain the test sample on the mixer and hold dislodged aggregate.
5.4 Oven – The conditioning oven shall be a constant temperature forced draft oven meeting the requirements given in Table 1 and containing shelves with at least 65% voids. The shelves shall be placed at least 120 mm apart and 100 mm away from the top and floor.
Table 1—Oven Specifications
Oven Type Forced draft oven
Min. Inside D x W x H 460 x 460 x 460 mm
Accuracy + 1.0º C
5.5 Balance – A balance capable of weighing 800 g or more to within + 0.1 g. A minimum platform length and width of 240 mm is required.
5.6 Removable Brush Holder – The brush holder (Figure 1) shall be attachable to the mixer and capable of a free floating vertical movement of 19 + 1 mm having the dimensions listed in Figure 1. The total mass of the brush head and the attached weight shall be 1500 + 15 g. The collar and nylon strip brush are not included in this mass. The brush clamping system shall hold the nylon strip brush in place so that it will not move or dislodge during testing.
Dimensions
ID Name mm
A Collar diameter 36 B Collar height 76 C Brush head length 128 D Overall brush head height 19 E Groove height 17
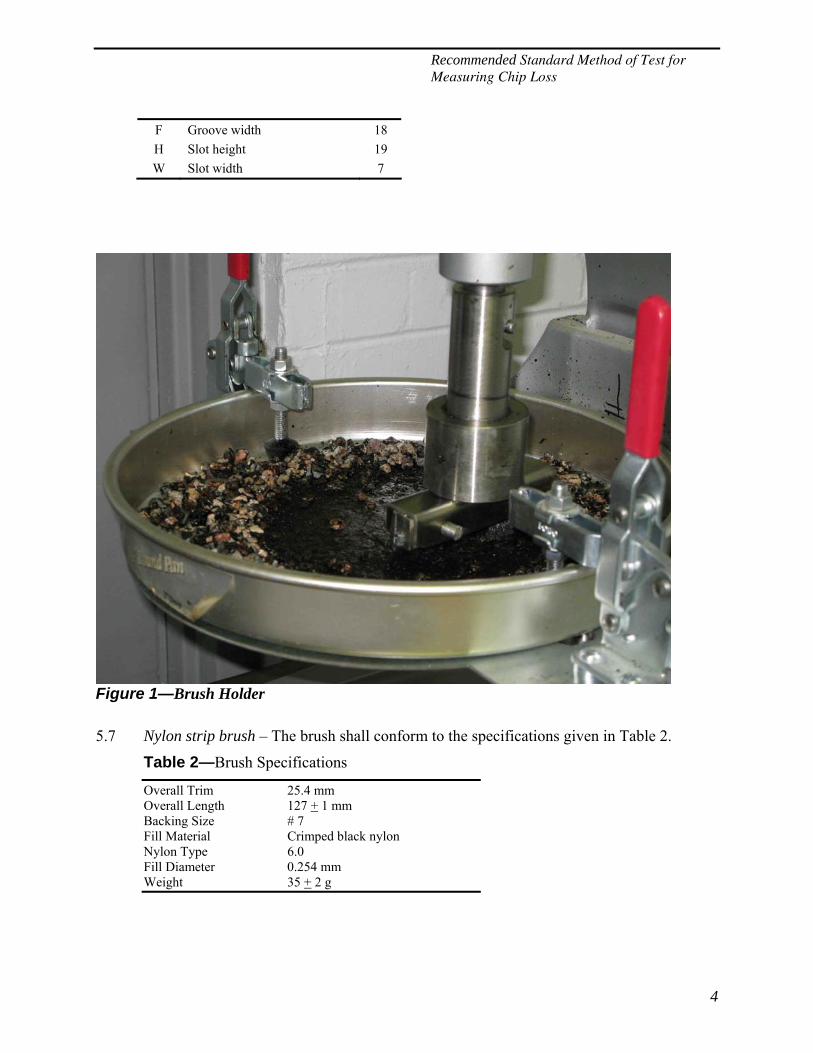
Recommended Standard Method of Test for Measuring Chip Loss
4
F Groove width 18 H Slot height 19 W Slot width 7
Figure 1—Brush Holder
5.7 Nylon strip brush – The brush shall conform to the specifications given in Table 2.
Table 2—Brush Specifications
Overall Trim 25.4 mm Overall Length 127 + 1 mm Backing Size # 7 Fill Material Crimped black nylon Nylon Type 6.0 Fill Diameter 0.254 mm Weight 35 + 2 g
Recommended Standard Method of Test for Measuring Chip Loss
5
5.8 Strike-Off Template – The template should consist of a flat, stainless steel metal plate with approximate overall dimensions of 600 mm x 450 mm to allow for accumulation of excess (struck-off) emulsion on the template surface. It shall include a 280 + 3mm diameter circular cut out with a flush edge. A template fabricated from 16 gage U.S. Standard (Plate and Sheet Metal) material will suffice in most cases. Where several templates are to be used, it is helpful to fabricate all templates with the same overall dimensions and location of the circular cut-out.
Note 1—Emulsion mass may vary according to emulsion viscosity and applied strike off pressure. Alternative gages may be necessary for emulsion mass correction for varying aggregate sizes and shapes. See Appendix A2 for guidelines to calculate the required emulsion volume (and, therefore, the required template gage) for varying emulsion residual contents and aggregate sizes.
5.9 Strike-Off Rod – The 750 + 100 mm long rod shall be made of 12.5 mm electrical metal conduit or 12.5 mm wide x 3 mm thick metal for striking off emulsion from the template surface. See Note 2 for other recommendations.
Note 2—Emulsion viscosity and the cross-sectional thickness of the strike-off rod directly affect the formed emulsion volume. In this regard, it is prudent to experiment with differently shaped strike-off rods in order to arrive at a tool that is compatible with the emulsion in producing an emulsion volume that is consistently related to the template volume. A more viscous emulsion is recommended for this test as it enables easier handling and specimen manufacture. Additionally, a narrow area of contact, such as that between a 3 mm thick, rounded edged, strike-off rod and the emulsion, is recommended to allow for a more consistent strike-off result with a wide range of emulsion viscosities. The rod must be approximately 12.5 mm wide to avoid emulsion mounting over the top edge. It is crucial that the rod be stiff and resistant to flexure and be handled in a manner in order to avoid flexure.
6.0 Sweep Test Compactor – A suitable compaction device with a minimum curved surface radius of 550 + 30 mm and shall weigh 7500 + 500 g. A picture of this apparatus can be seen in Figure 2.
6.1 Working Platform – Specimens are manufactured on the 600 mm x 600 mm working platform which shall be made horizontally level and shall be fixed to a stationary work table. It should be placed at a corner of the work table such that it is comfortably accessible from the two perpendicular sides at the corner of the table. A circular etching is made on the platform surface to allow positioning of the asphalt disks. A metal strip with appropriate markings is permanently fixed to the platform at a location such that the strike-off template may be quickly and easily positioned with its cut out centered over the asphalt disk. The platform also has markings and keyholes for positioning and temporarily fixing the sliding-plate chip dropper apparatus. See Figure 3.
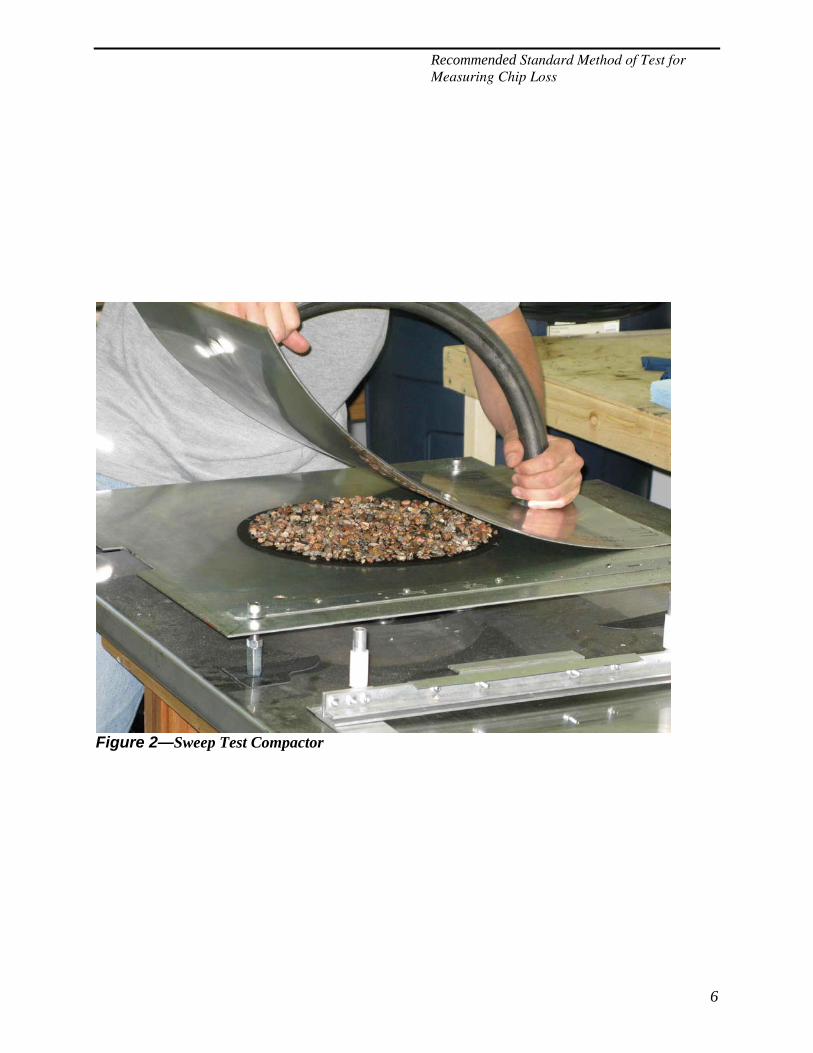
Recommended Standard Method of Test for Measuring Chip Loss
6
Figure 2—Sweep Test Compactor
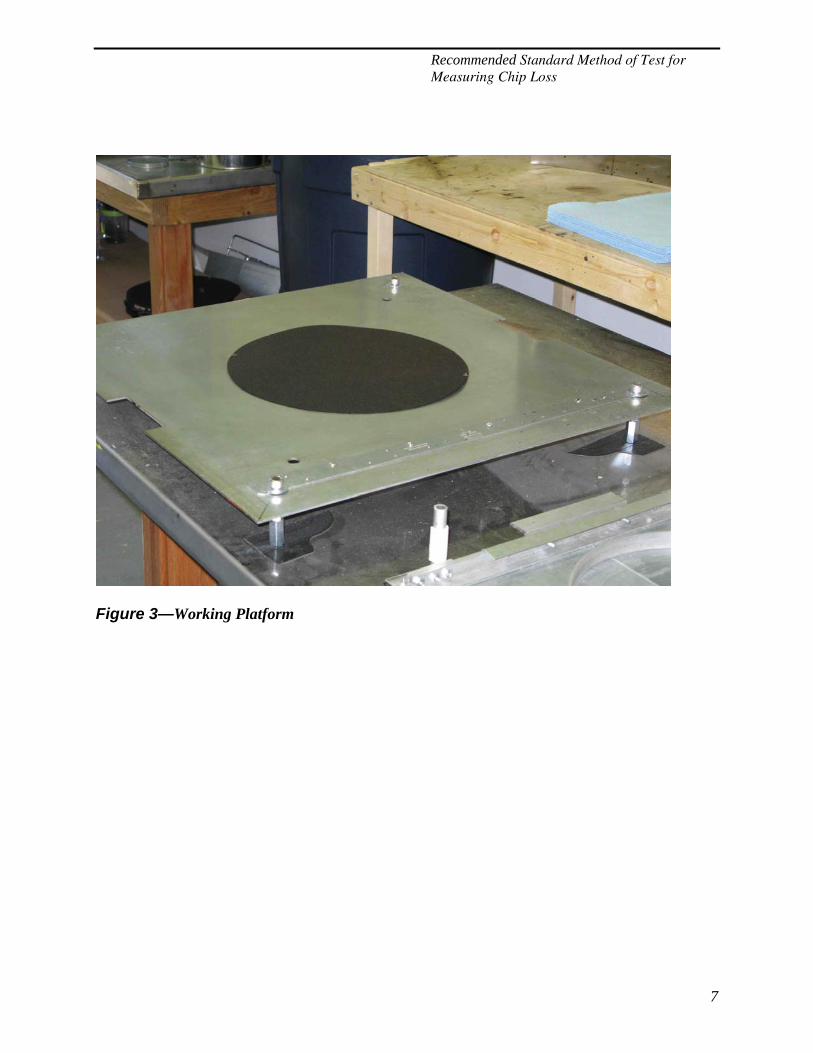
Recommended Standard Method of Test for Measuring Chip Loss
7
Figure 3—Working Platform
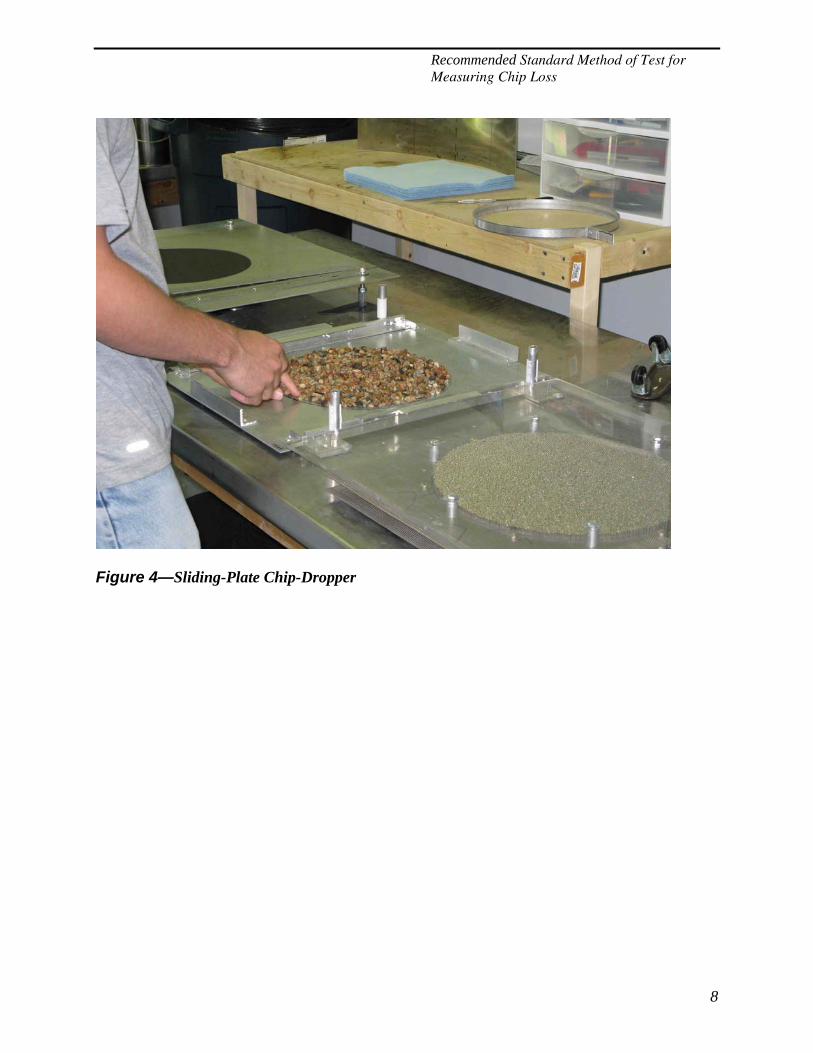
Recommended Standard Method of Test for Measuring Chip Loss
8
Figure 4—Sliding-Plate Chip-Dropper
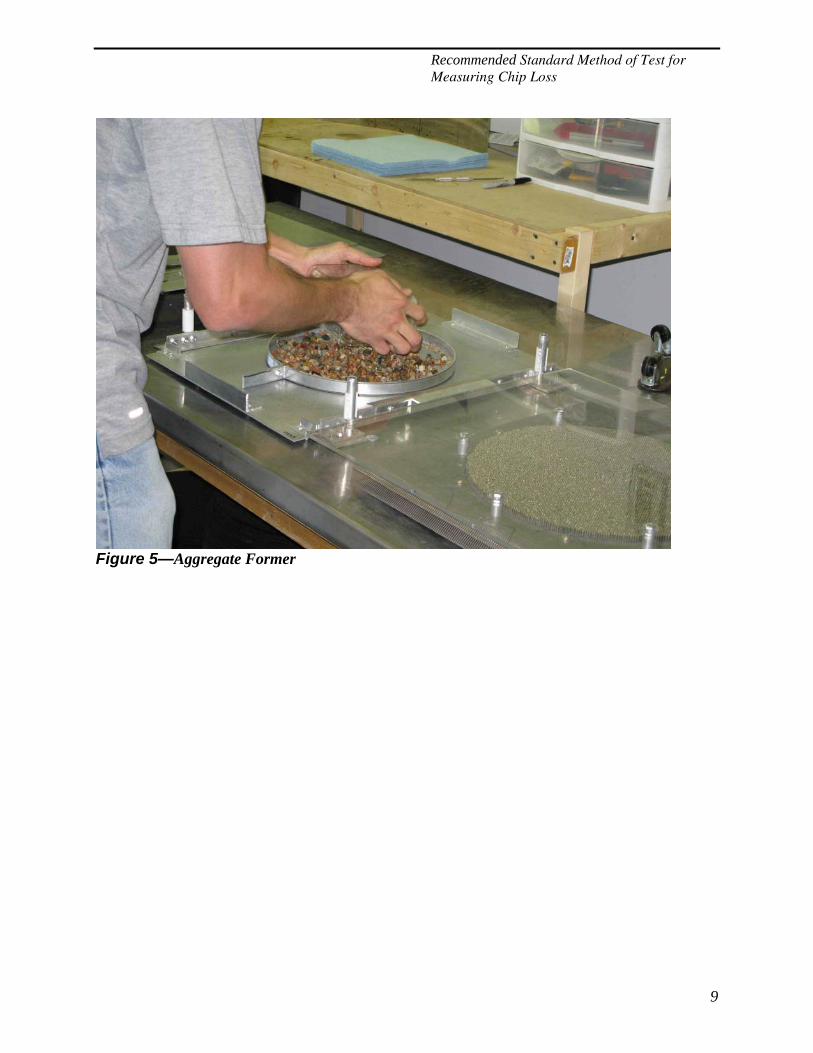
Recommended Standard Method of Test for Measuring Chip Loss
9
Figure 5—Aggregate Former
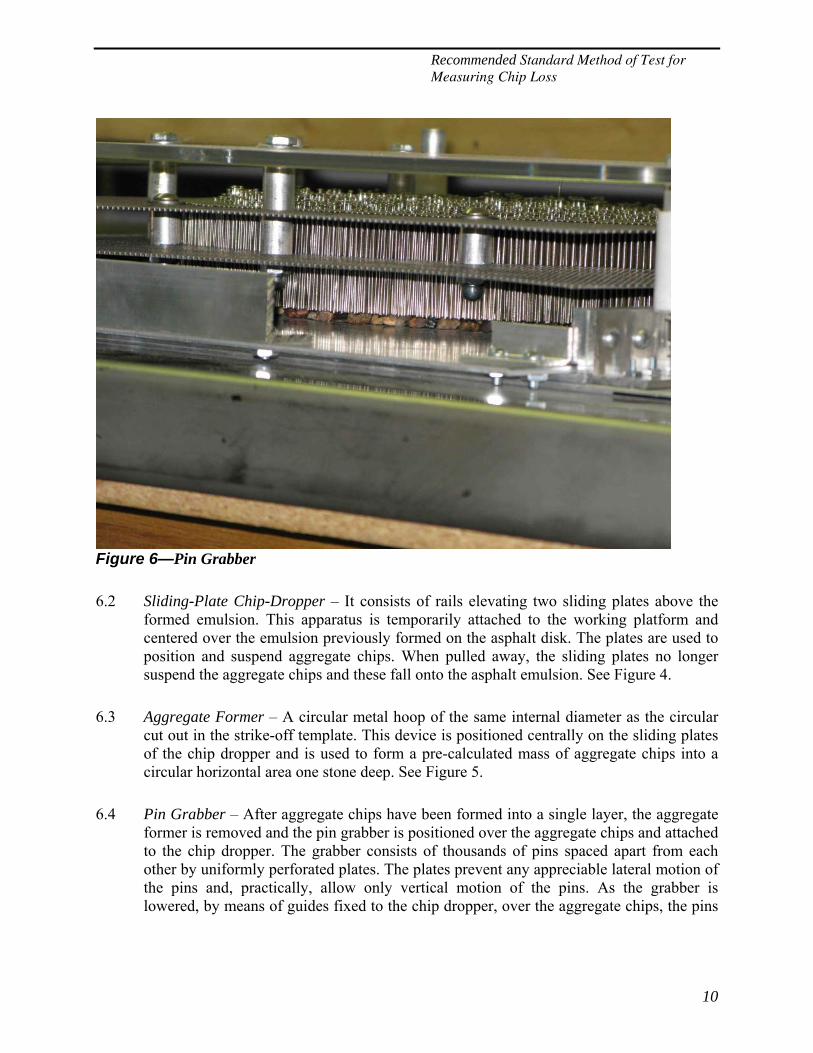
Recommended Standard Method of Test for Measuring Chip Loss
10
Figure 6—Pin Grabber
6.2 Sliding-Plate Chip-Dropper – It consists of rails elevating two sliding plates above the formed emulsion. This apparatus is temporarily attached to the working platform and centered over the emulsion previously formed on the asphalt disk. The plates are used to position and suspend aggregate chips. When pulled away, the sliding plates no longer suspend the aggregate chips and these fall onto the asphalt emulsion. See Figure 4.
6.3 Aggregate Former – A circular metal hoop of the same internal diameter as the circular cut out in the strike-off template. This device is positioned centrally on the sliding plates of the chip dropper and is used to form a pre-calculated mass of aggregate chips into a circular horizontal area one stone deep. See Figure 5.
6.4 Pin Grabber – After aggregate chips have been formed into a single layer, the aggregate former is removed and the pin grabber is positioned over the aggregate chips and attached to the chip dropper. The grabber consists of thousands of pins spaced apart from each other by uniformly perforated plates. The plates prevent any appreciable lateral motion of the pins and, practically, allow only vertical motion of the pins. As the grabber is lowered, by means of guides fixed to the chip dropper, over the aggregate chips, the pins
Recommended Standard Method of Test for Measuring Chip Loss
11
come into contact with the aggregate chips. When the chip dropper plates are slid horizontally, the pins prevent aggregate chips from moving horizontally. As the plates are slid from beneath aggregate chips, the chips fall vertically onto the asphalt emulsion and assume the same orientations that were given to them on the plates prior to sliding. See Figure 6.
6.5 Glass Bowl – A glass container with a secure and air-tight cover that will allow mixing of the moisture with aggregate, thus enabling absorption.
7. MATERIALS
7.1 Aggregates – The job aggregates should be sampled and split according to practice D75. They shall be placed in an oven and dried to a constant weight. Unless naturally sourced aggregate samples are being tested, the aggregates shall be dry sieved to obtain a test sample that has 100% passing the 9.5mm sieve and < 1% passing the 4.75mm sieve. The amount of aggregate used (Note 3) shall be calculated such that a single layer of aggregate is applied to the specimen.
Note 3—Aggregate mass will vary according to bulk specific gravity (BSG), flakiness index, size and shape of the aggregate particles. Aggregate coverage rates are to be calculated for each source. See Appendix A1 for guidelines to calculate the required aggregate mass.
7.2 Asphalt Emulsion – The asphalt emulsion should meet all applicable specifications for the surface treatment application. The asphalt emulsion shall be equilibrated to a temperature of 60º C for sample production.
Note 4—Emulsion volume will vary according to the void volume which exists between aggregate particles and the residual content of the emulsion. Asphalt emulsion coverage rates are to be calculated for each source and for each combination with different aggregates. See Appendix A2 for guidelines to calculate the required emulsion volume.
7.3 Asphalt Felt Disk – Produce sample disks from 30 lb asphalt felt paper, Specification D226, Type II. The asphalt felt disks shall not have breaks, cracks, tears, protuberances, indentations, or splices. The felt shall be cut to make 300 + 10mm diameter disks. The disks shall be placed in a 50º C oven for 24 to 72 h to flatten. Manipulate the disks until they are flat and store at room temperature at least three days before use.
8. TEST SPECIMENS
Recommended Standard Method of Test for Measuring Chip Loss
12
8.1 Pre-weigh the aggregate and record as dry aggregate mass. In a glass bowl, add sufficient water, of known mass (corrected for water loss during specimen production), to the pre-weighed aggregate, targeting the prescribed moisture content for the completed specimen. Immediately cover the bowl to prevent moisture loss. Gently shake, overturn and orient the covered bowl and its contents to coat the particles with moisture and let stand for at least 5 minutes to enable absorption of the moisture by the aggregate. Weigh the asphalt felt disk to the nearest 0.1 g and record as the asphalt sample disk mass. Place the asphalt felt disk on a table. Manipulate the felt disk so that it lies flat against the surface. Replace the disk if the edges curl, bubble, or the disk contains foreign matter. Position the disk on the working platform. During specimen manufacture, and after the application of emulsion, the disk is moved to the scale and back to the working platform for application of aggregate chips. Where the disks are not perfectly circular or uniform, a system must be developed to enable accurate re-positioning of the asphalt disk in its initial position when it is moved back to the platform for application of aggregate chips. A strike-off template is placed over the felt disk, centering the hole of the template over the felt disk. Using the aggregate former, the pre-weighed (and moistened) aggregate is now formed on the sliding-plate chip dropper apparatus which is assembled near to the working platform. The finger tips are used for spreading the aggregate one stone deep, compactly filling the circular area of the former. Next, the aggregate former is removed and the pin grabber is attached to the chip dropper to hold the aggregate in place. 83 + 5 g of asphalt emulsion (application rate of 1.42 kg / m2) at 60º C is poured along the top arc of the exposed felt disk. With the thickness of the strike-off rod in contact with the surface of the template, and the width of the strike-off rod held approximately vertically (the top edge of the strike-off rod leaning toward the user), excess asphalt emulsion is removed with the strike-off rod in a gentle side-to-side continuous motion. This shall be completed within a 3 + 1 s period. The strike-off motion should not be stopped until the excess materials are off of the felt disk. The template is quickly removed (Note 5). The asphalt disk is moved to a scale to determine the applied emulsion mass and then accurately re-positioned on the working platform. A picture of the strike-off procedure can be seen in Figure 7.
Note 5—Downward pressure, strike-off speed, and template thickness can be adjusted to ensure correct emulsion mass. Neat removal of the template is often difficult when low viscosity emulsions are used. In such cases, a bubble forms between the emulsion and the circular edge of the template. When this bubble pops, it splatters, irregularly, onto the asphalt disk. This problem is usually not encountered with the use of thicker bodied emulsions.
8.2 Immediately position the sliding-plate chip dropper on the working platform, over the asphalt disk, and apply the pre-weighed aggregate sample onto the asphalt emulsion. Once the aggregate has been placed on the sample, compact the aggregates using the sweep test compactor three half cycles in one direction and three half cycles in a perpendicular direction to set the aggregate. Care should be taken not to apply any
Recommended Standard Method of Test for Measuring Chip Loss
13
additional manual downward force to the compactor. Immediately weigh the sample and record as sample weight. Place the specimen in the forced draft oven. Sample production and weighing shall take no more than four minutes.
9. CONDITIONING
9.1 The specimen is immediately placed in a forced draft oven for the specified time, temperature, and relative humidity (Note 6) based on desired field performance.
Note 6—Typically, where the performance of the binder-aggregate combination is being tested at various emulsion cure levels, specimens are cured at any convenient temperature and for any time period that provides the required specimen cure level.
9.2 The oven temperature shall be kept to a tolerance of 10 % of the desired values (Note 7). The tolerance of the relative humidity shall be 25 % of the desired value unless otherwise specified.
Note 7—The oven door should only be opened once within a 20 minute period to maintain constant curing conditions.
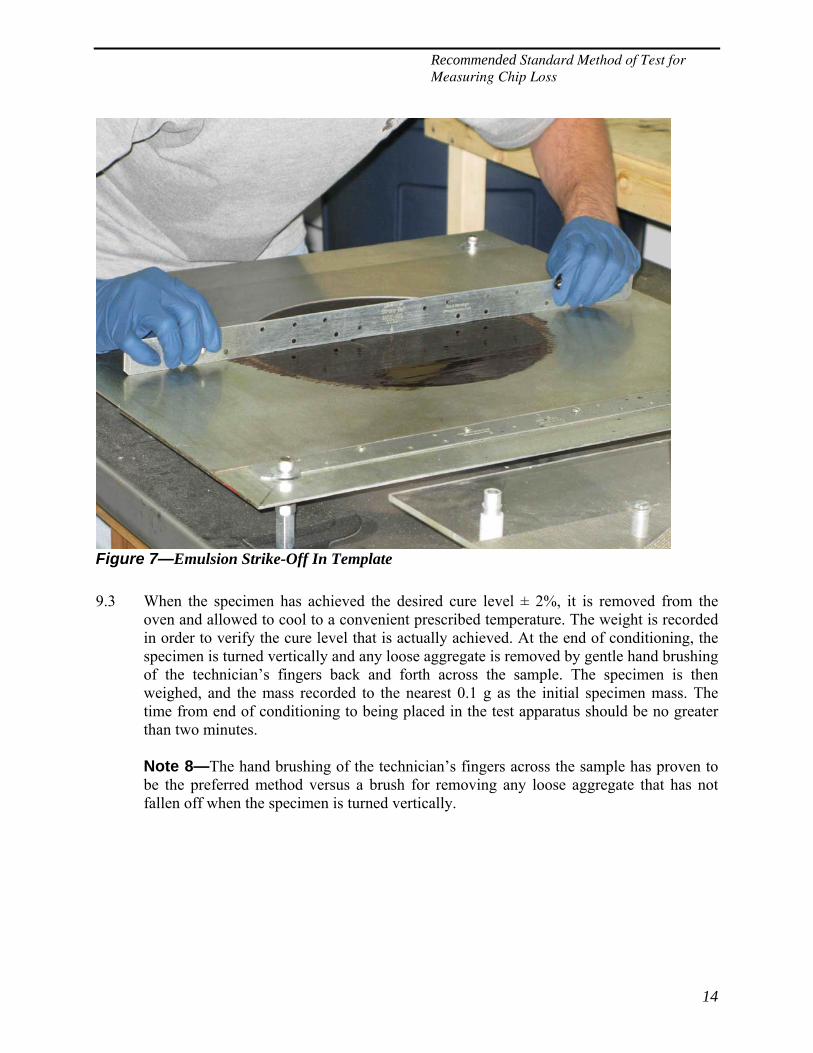
Recommended Standard Method of Test for Measuring Chip Loss
14
Figure 7—Emulsion Strike-Off In Template
9.3 When the specimen has achieved the desired cure level ± 2%, it is removed from the oven and allowed to cool to a convenient prescribed temperature. The weight is recorded in order to verify the cure level that is actually achieved. At the end of conditioning, the specimen is turned vertically and any loose aggregate is removed by gentle hand brushing of the technician’s fingers back and forth across the sample. The specimen is then weighed, and the mass recorded to the nearest 0.1 g as the initial specimen mass. The time from end of conditioning to being placed in the test apparatus should be no greater than two minutes.
Note 8—The hand brushing of the technician’s fingers across the sample has proven to be the preferred method versus a brush for removing any loose aggregate that has not fallen off when the specimen is turned vertically.
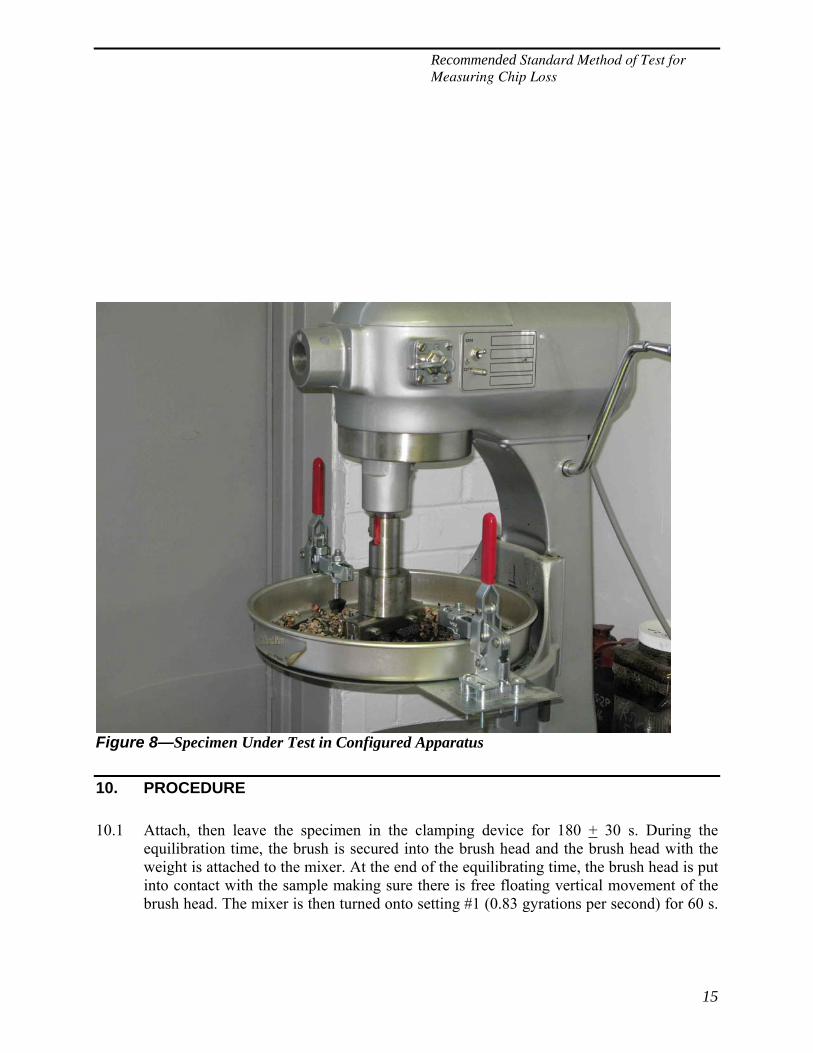
Recommended Standard Method of Test for Measuring Chip Loss
15
Figure 8—Specimen Under Test in Configured Apparatus
10. PROCEDURE
10.1 Attach, then leave the specimen in the clamping device for 180 + 30 s. During the equilibration time, the brush is secured into the brush head and the brush head with the weight is attached to the mixer. At the end of the equilibrating time, the brush head is put into contact with the sample making sure there is free floating vertical movement of the brush head. The mixer is then turned onto setting #1 (0.83 gyrations per second) for 60 s.
Recommended Standard Method of Test for Measuring Chip Loss
16
After the brush head has come to a complete stop, the table is lowered and the sample is removed from the clamping device. The specimen is held vertically and any loose aggregate is removed by gentle hand brushing of the technician’s fingers back and forth across the sample (Note 8). The abraded sample is weighed to the nearest 0.1 g and recorded as final specimen weight. A picture of the configured apparatus, with test specimen, can be seen in Figure 8.
11. CALCULATION
11.1 This equation represents the total mass loss based on the initial aggregate sample weight. The mass loss as a percentage of the area exposed to the abrading force:
33.1100% xxCABALossMass ⎟⎠⎞
⎜⎝⎛
−−
= (1)
where: A = initial specimen mass, B = final specimen mass, and C = asphalt sample disk mass.
APPENDIX The laboratory specimen simulates a chip seal layer. Aggregate, which is dropped onto the binder, is intended to be placed one stone thick and held in place by a combination of particle interaction, brought on by compaction, and binder/aggregate adhesion. The preceding manufacture and testing procedures account for and test the relative strength of the bond developed between asphalt binder and aggregate particles within the chip seal itself.
The required aggregate mass and asphalt cement volume depends on the average aggregate particle dimensions, on an assumed eventual degree of compaction of the aggregate particles and on the assumption that each particle will eventually lay on its widest face. In the laboratory specimen, the degree of compaction of the aggregate simulates that which exists in a newly, and properly, built chip seal. The assumptions made with regard to calculation of the required binder volume (the residual asphalt content of the emulsion) intend to avoid bleeding by accounting for the compaction of the aggregate over time.
In determining the required chip seal aggregate coverage, it is necessary to evaluate the proposed aggregate for its ability to compact. In this regard, our calculated required aggregate mass and asphalt volume will only be approximations since it is not possible to conclusively determine what will be the aggregate void volume immediately after construction or that at ultimate aggregate density. The following useful guidelines for the calculation of required aggregate and emulsion masses used in the manufacture of laboratory specimens are taken from the McLeod and the Modified Kearby single-surface-treatment design methods respectively referenced in the
Recommended Standard Method of Test for Measuring Chip Loss
17
FHWA Asphalt Emulsion Manual, FHWA-IP-79-1, and the USDOT Field Manual on Design and Construction of Seal Coats, Research Report 214-25, July 1981.
A1. AGGREGATE MASS
A2. Although the laboratory compaction of specimen aggregate according to this standard is not equal to that possible in the field with rolling equipment, in the manufacture of the laboratory specimen, care should be taken to ensure that the appropriate mass of aggregate particles is positioned on the working platform as compactly as possible and such that the center of gravity of each particle is as low as possible, or such that a particle’s stability against rotation is maximized.
A2.1 Physical properties of the aggregate are experimentally determined including oven dry bulk specific gravity (G), loose unit weight (W), void volume (V) and particle size characteristics.
A2.2 Dry bulk specific gravity (G) is determined according to ASTM C 127 and dry loose unit weight (W) is determined according to ASTM C 29. These allow calculation of the initial void volume (V) between particles of the loose aggregate from V = (1 – W/62.4G) (A1)
A2.3 F. M. Hanson (Hanson, 1935) observed that the void volume between aggregate particles is approximately 50 % (the loose condition) when the aggregate is dropped onto the asphalt binder. He theorized that, due to reorientation, this reduces to approximately 30 % (60 % of 50 % voids) immediately after rolling and to 20 % (40 % of 50 % voids) after plenty of traffic. This theory of Hanson’s, as it regards surface treatment densification, is reflected in the following outline of the noted chip seal design methods.
A2.4 Although one-sized, and cubical, aggregate perform best in chip seals, and may simplify the design process, graded, and non-cubical, aggregate sources often find use. In these cases, it is often helpful to make use of the design method proposed by McLeod (McLeod, 1969) which calculates the required volume of aggregate at an assumed maximum density. This calculation is possible after approximating the ultimate average mat thickness (average least particle dimension) and through the assumption that, at the ultimate average mat thickness, voids have reduced, after considerable traffic, to 40 % of the initial loose-aggregate void volume. Although the ultimate density is not achieved immediately after construction, this assumed ultimate state of the aggregate is also used to determine the asphalt
Recommended Standard Method of Test for Measuring Chip Loss
18
requirement. In calculating the actual aggregate mass to be dropped from a spreader truck, the user may also use modifying factors to suit local conditions.
A2.5 The oven dry bulk specific gravity (G), the void volume (V) of the loose aggregate and the ultimate average mat depth (H), in conjunction with an assumed ultimate void volume (0.4V) are used to calculate the required coverage mass per unit area at ultimate density. It is important to note that the procedure anticipates that the densification is due to particle reorientation and average mat depth reduction to H as a limit. The coverage mass per unit area, therefore, is assumed to remain practically constant as densification progresses.
A2.6 Using the assumption that particles will ultimately orient themselves on their widest sides, with the vertical dimension being the smallest, an approximation of the ultimate average mat height is made by determining the average least dimension of a representative sample of particles. The procedure involves determination of the median particle size and the flakiness index.
i. A sample of the aggregate material is first sieved according to ASTM C 136. From the aggregate gradation curve, the median size is determined as the theoretical sieve size through which 50 %, by mass, of the aggregate would pass. The flakiness of the material is then determined by testing representative sample particles, taken from the various gradation fractions, on the appropriate slot of a slotted sieve. The flakiness index is the combined mass proportion, of the total mass of tested material, which passes through the slots.
ii. The median size and flakiness index results are used, in conjunction with a chart for determining average least dimension, to arrive at the approximate ultimate mat height of the chip seal.
A2.7 Refer to FHWA-IP-79-1 for a more detailed review of this procedure and its relevant modification factors.
A2.8 In applying the McLeod procedure for use with lab specimens, since it is assumed that specimen aggregate particles are placed on their widest sides, the average mat depth of the specimen is assumed to be equal to the average least dimension (H). However, since compact particle placement and specimen compaction in the lab is not as effective as that possible in the field, it is usually necessary to modify the assumed ultimate void volume to a more practical value approaching that associated with the compact bulk density of the aggregate according to ASTM C 29.
Recommended Standard Method of Test for Measuring Chip Loss
19
A2.9 Where the maximum beneficial effect of aggregate chip / asphalt binder adhesion is being tested, the aggregate should be washed and dried prior to use.
A3. ASPHALT EMULSION VOLUME
A3.1 Asphalt emulsion is determined by volume, as opposed to by mass, since the required amount depends primarily on the void volume available, between aggregate particles, to be filled with asphalt cement.
A3.2 A balance must be struck so that the young chip seal is bound sufficiently by asphalt, such that it will endure its early life, while avoiding the use of too much binder since this will cause the early onset of flushing, reducing the useful life of the chip seal to a shorter time period than otherwise possible. In the field, after a few years when the aggregate particles have been oriented by traffic and the ultimate aggregate density has been achieved, it is typically desired, for good road surface performance, that 70 % of the voids are filled with asphalt binder. In this regard, depending on the road traffic volume and aggregate chip shape, which imply a certain compacted state of the aggregate in a few years, and also depending on the nominal size of aggregate chips, the requirements for initial embedment, immediately following construction of the chip seal, may vary between 20 % and 40 %. In the manufacture of laboratory specimens, observing these field principles will enable the construction of a representative specimen.
A3.3 The thickness of the strike-off template used in the manufacture of laboratory specimens is specified, based on the average particle height and degree of compaction of the aggregate, such that it provides the appropriate struck emulsion volume with the required asphalt residual content.
A3.4 The McLeod method employs factors for surface correction (S) and seasonality (K) in an effort to avoid flushing. Specifically, however, the McLeod method applies a Traffic factor to ensure that the ultimate void volume is filled a maximum of 60 % to 85 %, the higher percentage being applicable to lower volume roads. Additionally, the McLeod procedure assumes that the ultimate void volume is 40 % of the initial void volume of the cover aggregate in the loose weight condition.
Refer to FHWA-IP-79-1 for a more detailed treatment of this procedure and for further references.
A3.5 In laboratory specimens, calculation of the required asphalt binder quantity should follow determination of the aggregate quantity and should reflect the void volume which exists in the
Recommended Standard Method of Test for Measuring Chip Loss
20
specimen aggregate. It may be helpful to assume the applied specimen aggregate to have a void volume of 80 % of that in the loose weight condition.
A3.6 The preceding standard is intended to allow performance evaluation of a combination of asphalt emulsion and aggregate chips as well as relative performance of several combinations of asphalt emulsions with aggregate chips at a certain level of cure. In this regard, it is up to the user to determine the required asphalt quantity based on the use of a constant percent embedment or, alternatively, a constant asphalt volume with different chip types and sizes.
A3.7 This standard is not intended to determine the potential for chip seal flushing due to densification and reorientation of the cover aggregate. It provides the relative performance of chip seal treatment materials, specifically those of a single surface treatment exhibiting compactly-placed and oriented aggregate particles one stone in depth. Through the use of this standard, and as a result of the ability to precisely place a pre-determined aggregate mass, it becomes possible to calculate the precise volume of required asphalt emulsion. Additionally, it is possible to repeatedly combine chip seal materials in constant proportions.
A3.8 It is important to note that, prior to using a template for a recorded test, several trials should be performed in order to determine the rate and repeatability of asphalt emulsion application using the template and the adopted striking-off technique.
1
Recommended Standard Method of Test for Measuring Moisture Loss from Chip Seals
AASHTO Designation: Txxxx-xx 1. SCOPE
1.1 This test method approximates the asphalt emulsion moisture content of a newly built chip seal as it cures by close monitoring of an equivalently constructed and cured specimen chip seal.
1.2 The values stated in SI units are to be regarded as the standard unless otherwise indicated.
1.3 A precision and bias statement for this standard has not been developed at this time. Therefore, this standard should not be used for acceptance or rejection of a material for purchasing purposes.
1.4 It is the responsibility of the user of this standard to establish appropriate safety and health practices and determine the applicability of regulatory limitations prior to use.
2. REFERENCED DOCUMENTS
2.1 ASTM Standards:
• D 7000, Standard Test Method for Sweep Test of Bituminous Emulsion Surface Treatment Samples
2.2 FHWA Publication - The Asphalt Institute: FHWA-IP-79-1 A Basic Asphalt Emulsion Manual
3. SUMMARY OF TEST METHOD
3.1 By quantifying the mass loss of a specimen chip seal, which is significantly equivalent to a field chip seal, and where the emulsion spray rate, the emulsion residual content and initial aggregate moisture content can be approximated, it becomes possible to estimate the specimen’s cure level at different monitoring points throughout a workday.
3.2 In this test, a chip seal specimen is manufactured by site equipment on a board placed on the roadway while the field chip seal is being built. The water-mass loss of materials on the board is then monitored throughout the day to gauge the specimen’s cure level. These
Standard Method of Test for Measuring Moisture Loss from Chip Seals
2
results are projected in evaluating the moisture content of the field chip seal’s asphalt emulsion.
4. SIGNIFICANCE AND USE
4.1 The rate at which bond is developed between asphalt and aggregate in a chip seal depends on the chip seal’s curing characteristics. When asphalt breaks with water in an asphalt emulsion, and films of water evaporate, bond can be more readily developed and a chip seal is said to be curing.
4.2 This test method aims at estimating the mass of water that has evaporated from a field chip seal by monitoring a specimen chip seal that is significantly equivalent in material composition to the field chip seal. Where periodic monitoring is performed, the test indicates the approximate rates of curing which may be present in a field chip seal cured under particular environmental conditions. This information is usually intended to track curing throughout a workday and up to the point where the chip seal materials are bound. Additionally, when performance results from Sweep Tests (ASTM D-7000) at known moisture contents are available, moisture content tracking can assist in decision making regarding the capacity of the chip seal to safely accept traffic at certain moisture contents.
5. APPARATUS
5.1 Balance and (optional) Pedestal – The balance must be capable of weighing 10 kilograms or more to within + 1 g. A tared pedestal, some 10 inches in height and placed on the scale, is usually required to raise the specimen high enough above the scale in order to avoid the specimen area obstructing view of the scale reading.
Note 1—The mass of a configured specimen board is on the order of 1500 grams. In addition to the board mass, the masses of the pedestal and the expected chip seal materials must be considered when determining the adequacy of a scale to bear the full specimen mass (with pedestal).
5.2 Weighing Platform and (optional) Wind Shield – The platform is any convenient flat surface, shimmed as necessary for levelness, on which the balance is placed for weighing specimens. This is usually sited on top of another stationary structure in the field or in the tray of a parked vehicle. Additionally, where windy conditions are expected, the ability to obtain reliable mass readings may depend on the use of a lightweight enclosure to shield the specimen and prevent wind-induced flutter.
5.3 Pocket Level – This is a portable bubble level which is placed on the weighing platform to check for approximate levelness.
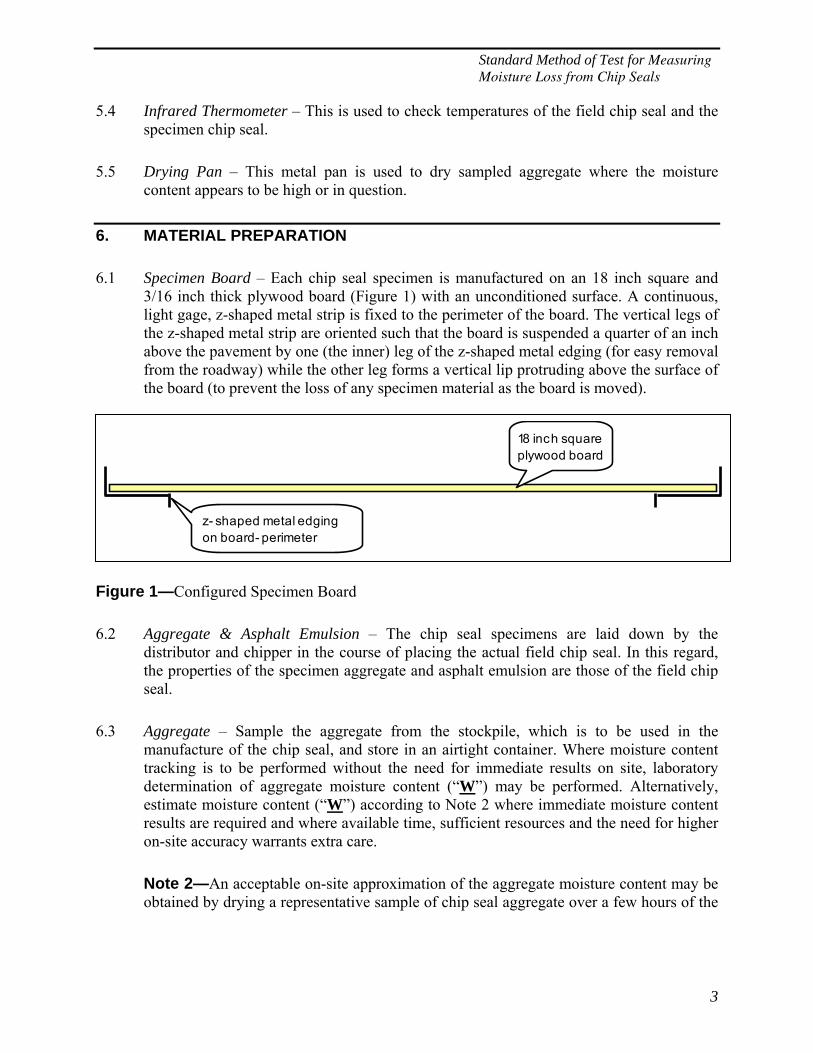
Standard Method of Test for Measuring Moisture Loss from Chip Seals
3
5.4 Infrared Thermometer – This is used to check temperatures of the field chip seal and the specimen chip seal.
5.5 Drying Pan – This metal pan is used to dry sampled aggregate where the moisture content appears to be high or in question.
6. MATERIAL PREPARATION
6.1 Specimen Board – Each chip seal specimen is manufactured on an 18 inch square and 3/16 inch thick plywood board (Figure 1) with an unconditioned surface. A continuous, light gage, z-shaped metal strip is fixed to the perimeter of the board. The vertical legs of the z-shaped metal strip are oriented such that the board is suspended a quarter of an inch above the pavement by one (the inner) leg of the z-shaped metal edging (for easy removal from the roadway) while the other leg forms a vertical lip protruding above the surface of the board (to prevent the loss of any specimen material as the board is moved).
Figure 1—Configured Specimen Board
6.2 Aggregate & Asphalt Emulsion – The chip seal specimens are laid down by the distributor and chipper in the course of placing the actual field chip seal. In this regard, the properties of the specimen aggregate and asphalt emulsion are those of the field chip seal.
6.3 Aggregate – Sample the aggregate from the stockpile, which is to be used in the manufacture of the chip seal, and store in an airtight container. Where moisture content tracking is to be performed without the need for immediate results on site, laboratory determination of aggregate moisture content (“W”) may be performed. Alternatively, estimate moisture content (“W”) according to Note 2 where immediate moisture content results are required and where available time, sufficient resources and the need for higher on-site accuracy warrants extra care.
Note 2—An acceptable on-site approximation of the aggregate moisture content may be obtained by drying a representative sample of chip seal aggregate over a few hours of the
18 inch square plywood board
z- shaped metal edging on board- perimeter
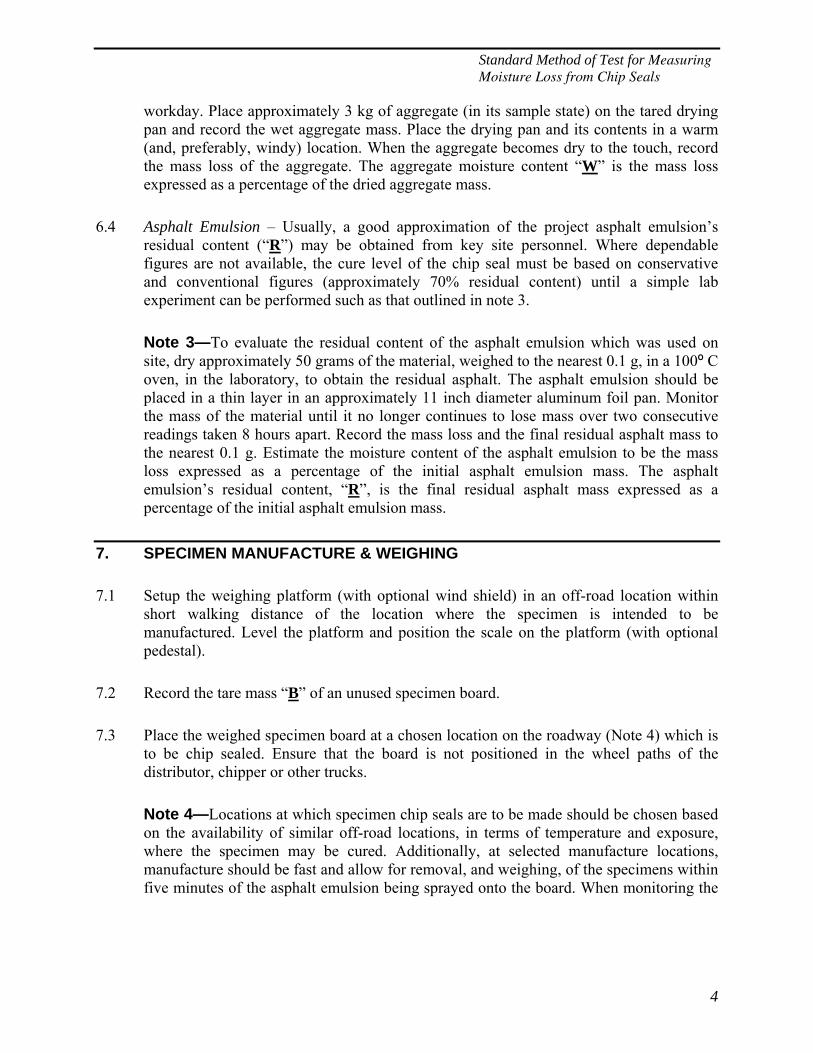
Standard Method of Test for Measuring Moisture Loss from Chip Seals
4
workday. Place approximately 3 kg of aggregate (in its sample state) on the tared drying pan and record the wet aggregate mass. Place the drying pan and its contents in a warm (and, preferably, windy) location. When the aggregate becomes dry to the touch, record the mass loss of the aggregate. The aggregate moisture content “W” is the mass loss expressed as a percentage of the dried aggregate mass.
6.4 Asphalt Emulsion – Usually, a good approximation of the project asphalt emulsion’s residual content (“R”) may be obtained from key site personnel. Where dependable figures are not available, the cure level of the chip seal must be based on conservative and conventional figures (approximately 70% residual content) until a simple lab experiment can be performed such as that outlined in note 3.
Note 3—To evaluate the residual content of the asphalt emulsion which was used on site, dry approximately 50 grams of the material, weighed to the nearest 0.1 g, in a 100º C oven, in the laboratory, to obtain the residual asphalt. The asphalt emulsion should be placed in a thin layer in an approximately 11 inch diameter aluminum foil pan. Monitor the mass of the material until it no longer continues to lose mass over two consecutive readings taken 8 hours apart. Record the mass loss and the final residual asphalt mass to the nearest 0.1 g. Estimate the moisture content of the asphalt emulsion to be the mass loss expressed as a percentage of the initial asphalt emulsion mass. The asphalt emulsion’s residual content, “R”, is the final residual asphalt mass expressed as a percentage of the initial asphalt emulsion mass.
7. SPECIMEN MANUFACTURE & WEIGHING
7.1 Setup the weighing platform (with optional wind shield) in an off-road location within short walking distance of the location where the specimen is intended to be manufactured. Level the platform and position the scale on the platform (with optional pedestal).
7.2 Record the tare mass “B” of an unused specimen board.
7.3 Place the weighed specimen board at a chosen location on the roadway (Note 4) which is to be chip sealed. Ensure that the board is not positioned in the wheel paths of the distributor, chipper or other trucks.
Note 4—Locations at which specimen chip seals are to be made should be chosen based on the availability of similar off-road locations, in terms of temperature and exposure, where the specimen may be cured. Additionally, at selected manufacture locations, manufacture should be fast and allow for removal, and weighing, of the specimens within five minutes of the asphalt emulsion being sprayed onto the board. When monitoring the

Standard Method of Test for Measuring Moisture Loss from Chip Seals
5
field chip seal, observations should be made at a location immediately adjacent to that where the specimen is manufactured.
7.4 Immediately after chips have been dropped onto the specimen board, move the specimen from the roadway and obtain its initial total mass reading “S”.
7.5 Obtain the asphalt emulsion spray rate “E” from appropriate site personnel.
7.6 Throughout the work day, maintain a log of the temperatures and other environmental conditions affecting the cure rates of the specimen and the field chip seals. Relocate the specimen as necessary to ensure similar curing conditions relative to those of the field chip seal.
7.7 Record the total mass “C” of the specimen as it cures throughout the day to various cure levels.
Note 5—Record the specimen mass as often as practical but at least once per hour until a desired cure level has been achieved.
7.8 Where curing conditions throughout the work day are similar for the specimen and the field chip seal, it may be assumed that the chip seal moisture content, at a certain time after construction, is approximated by that of the specimen.
8. CALCULATIONS
8.1 The mass (g) of asphalt emulsion in the specimen is obtained from the following:
O = 3785 (UEAG) (1)
8.2 The mass (g) of dry specimen aggregate is obtained from the following:
D = (S – B – O)/(1 + W) (2)
8.3 The initial mass (g) of all specimen moisture is obtained from the following:
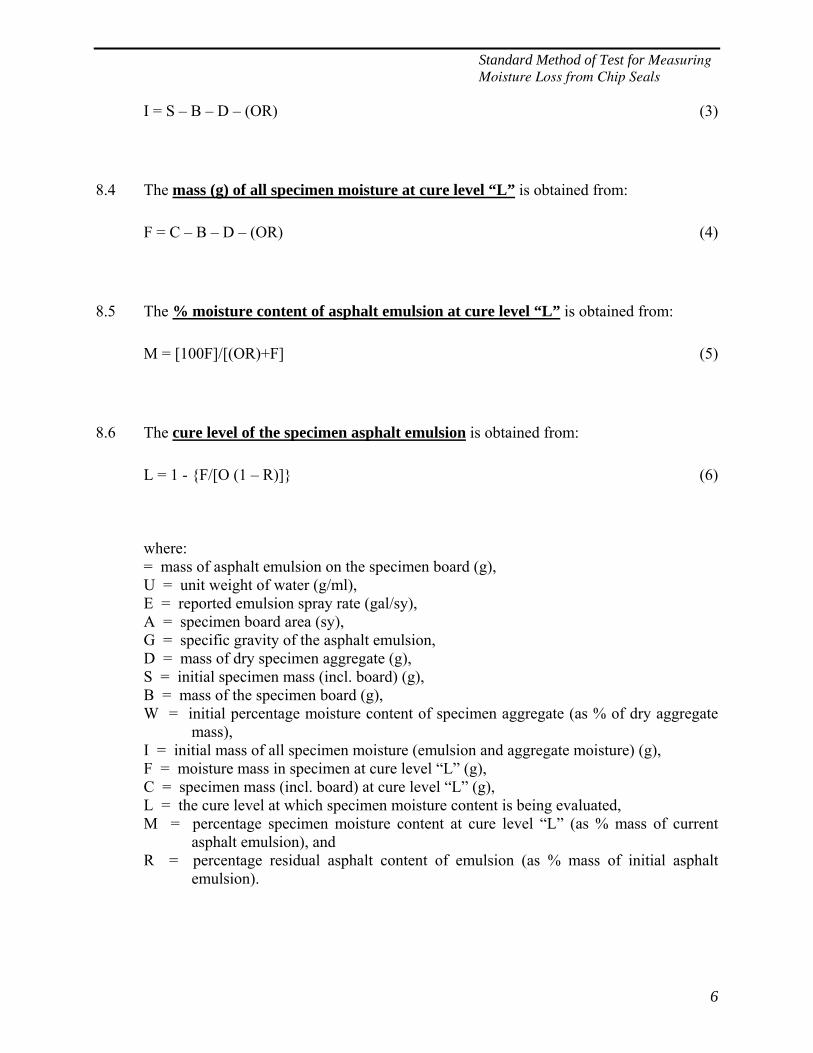
Standard Method of Test for Measuring Moisture Loss from Chip Seals
6
I = S – B – D – (OR) (3)
8.4 The mass (g) of all specimen moisture at cure level “L” is obtained from:
F = C – B – D – (OR) (4)
8.5 The % moisture content of asphalt emulsion at cure level “L” is obtained from:
M = [100F]/[(OR)+F] (5)
8.6 The cure level of the specimen asphalt emulsion is obtained from:
L = 1 - {F/[O (1 – R)]} (6)
where: = mass of asphalt emulsion on the specimen board (g), U = unit weight of water (g/ml), E = reported emulsion spray rate (gal/sy), A = specimen board area (sy), G = specific gravity of the asphalt emulsion, D = mass of dry specimen aggregate (g), S = initial specimen mass (incl. board) (g), B = mass of the specimen board (g), W = initial percentage moisture content of specimen aggregate (as % of dry aggregate
mass), I = initial mass of all specimen moisture (emulsion and aggregate moisture) (g), F = moisture mass in specimen at cure level “L” (g), C = specimen mass (incl. board) at cure level “L” (g), L = the cure level at which specimen moisture content is being evaluated, M = percentage specimen moisture content at cure level “L” (as % mass of current
asphalt emulsion), and R = percentage residual asphalt content of emulsion (as % mass of initial asphalt
emulsion).
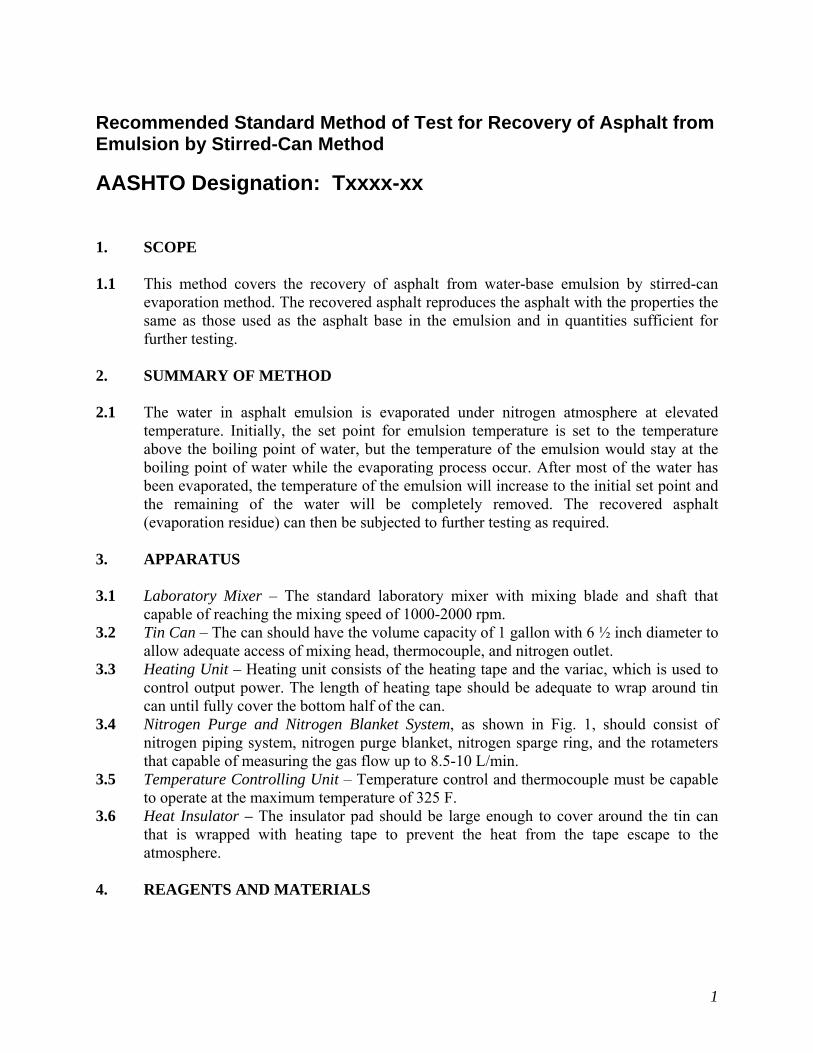
1
Recommended Standard Method of Test for Recovery of Asphalt from Emulsion by Stirred-Can Method
AASHTO Designation: Txxxx-xx 1. SCOPE 1.1 This method covers the recovery of asphalt from water-base emulsion by stirred-can
evaporation method. The recovered asphalt reproduces the asphalt with the properties the same as those used as the asphalt base in the emulsion and in quantities sufficient for further testing.
2. SUMMARY OF METHOD 2.1 The water in asphalt emulsion is evaporated under nitrogen atmosphere at elevated
temperature. Initially, the set point for emulsion temperature is set to the temperature above the boiling point of water, but the temperature of the emulsion would stay at the boiling point of water while the evaporating process occur. After most of the water has been evaporated, the temperature of the emulsion will increase to the initial set point and the remaining of the water will be completely removed. The recovered asphalt (evaporation residue) can then be subjected to further testing as required.
3. APPARATUS 3.1 Laboratory Mixer – The standard laboratory mixer with mixing blade and shaft that
capable of reaching the mixing speed of 1000-2000 rpm. 3.2 Tin Can – The can should have the volume capacity of 1 gallon with 6 ½ inch diameter to
allow adequate access of mixing head, thermocouple, and nitrogen outlet. 3.3 Heating Unit – Heating unit consists of the heating tape and the variac, which is used to
control output power. The length of heating tape should be adequate to wrap around tin can until fully cover the bottom half of the can.
3.4 Nitrogen Purge and Nitrogen Blanket System, as shown in Fig. 1, should consist of nitrogen piping system, nitrogen purge blanket, nitrogen sparge ring, and the rotameters that capable of measuring the gas flow up to 8.5-10 L/min.
3.5 Temperature Controlling Unit – Temperature control and thermocouple must be capable to operate at the maximum temperature of 325 F.
3.6 Heat Insulator – The insulator pad should be large enough to cover around the tin can that is wrapped with heating tape to prevent the heat from the tape escape to the atmosphere.
4. REAGENTS AND MATERIALS
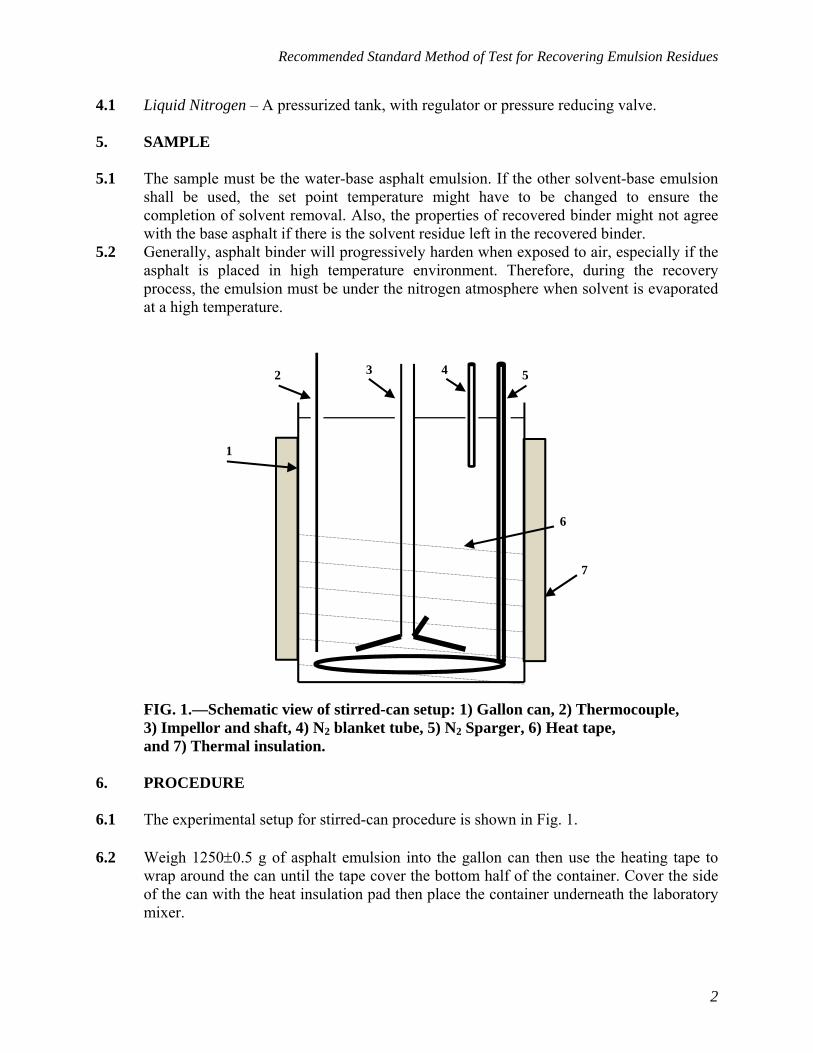
Recommended Standard Method of Test for Recovering Emulsion Residues
2
4.1 Liquid Nitrogen – A pressurized tank, with regulator or pressure reducing valve. 5. SAMPLE 5.1 The sample must be the water-base asphalt emulsion. If the other solvent-base emulsion
shall be used, the set point temperature might have to be changed to ensure the completion of solvent removal. Also, the properties of recovered binder might not agree with the base asphalt if there is the solvent residue left in the recovered binder.
5.2 Generally, asphalt binder will progressively harden when exposed to air, especially if the asphalt is placed in high temperature environment. Therefore, during the recovery process, the emulsion must be under the nitrogen atmosphere when solvent is evaporated at a high temperature.
1
2 3 4 5
6
7
FIG. 1.—Schematic view of stirred-can setup: 1) Gallon can, 2) Thermocouple, 3) Impellor and shaft, 4) N2 blanket tube, 5) N2 Sparger, 6) Heat tape, and 7) Thermal insulation.
6. PROCEDURE 6.1 The experimental setup for stirred-can procedure is shown in Fig. 1. 6.2 Weigh 1250±0.5 g of asphalt emulsion into the gallon can then use the heating tape to
wrap around the can until the tape cover the bottom half of the container. Cover the side of the can with the heat insulation pad then place the container underneath the laboratory mixer.
Recommended Standard Method of Test for Recovering Emulsion Residues
3
6.3 Place the sparge ring into the can, but do not turn the nitrogen sparge on at the beginning
to prevent overflow due to foaming. 6.4 Lower the mixer head into emulsion can and turn the mixer on. Then, place the lid on top
of the container and increase the mixing rate to 1000-2000 RPM depending on how thick the emulsion is. After that, insert the thermocouple into the can. To ensure the accurate temperature controlling, the thermocouple should not touch the side of the can or mixer head.
6.5 Turn on and adjust nitrogen flow to 8.5-10 L/min for the nitrogen blanket tube then place
the nitrogen blanket outlet on the emulsion surface to create a nitrogen blanket. 6.6 Connect the heating tape with the variac and turn the variac on to begin the heating
process then set the temperature controller to 163 C (325 F). The variac providing power for the heating tape is set to 140 V and corresponding power is approximately 430 W. After the heat is supply to the system, the foaming process will start to occur.
6.7 Change voltage on the variac to around 100 V (corresponding power is 260 W) when the
emulsion temperature reaches 100 C (212 F). Approximately, the time from the beginning of the experiment to the time to change the voltage is 20-30 min. Also, if the foaming disappears, start the nitrogen flow into sparge ring (8.5-10 L/min). The emulsion temperature should stay at the boiling point of water until the majority of water is evaporated then the emulsion temperature will start to increase.
6.8 Let the emulsion temperature reaches 325 F and wait for 10 minutes at this temperature
(total recovery time is approximately 180 minutes). After 10 minutes, turn off the variac, remove heat insulation, loosen the heat tape, but maintain the nitrogen flows and stirring while the sample is cooling down.
6.9 Fig. 2 shows the typical temperature evolution curve versus time for KOCH HFRS-2P.
Four regions are evident. The first one is from the beginning to about 18 min. In this region, the temperature increases rapidly and nearly linearly from room temperature (around 72 F, or 22 C) to 212 F (100 C). The water evaporation rate is low in this region and power input primarily increases the temperature. The second region is between 18 min. to 110 min. where the temperature increases slowly from 212 F (100 C) to 250 F (121 C) in about 90 min. Here the power input mainly provides water evaporation. The third region is between 110 min. to 135 min. where the temperature increases linearly from 250 F (121 C) to 325 F (163 C) in about 25 min., a slower rate than in the first region. In this region, much of water has evaporated and the power input primarily increases temperature increase. In the forth region from 135 min. to the end of the experiment, 170 min., the temperature is controlled now, 325 F (163 C) (In Fig. 2, the temperature evolution after 150 min. is not shown because it changes little around 325 F).
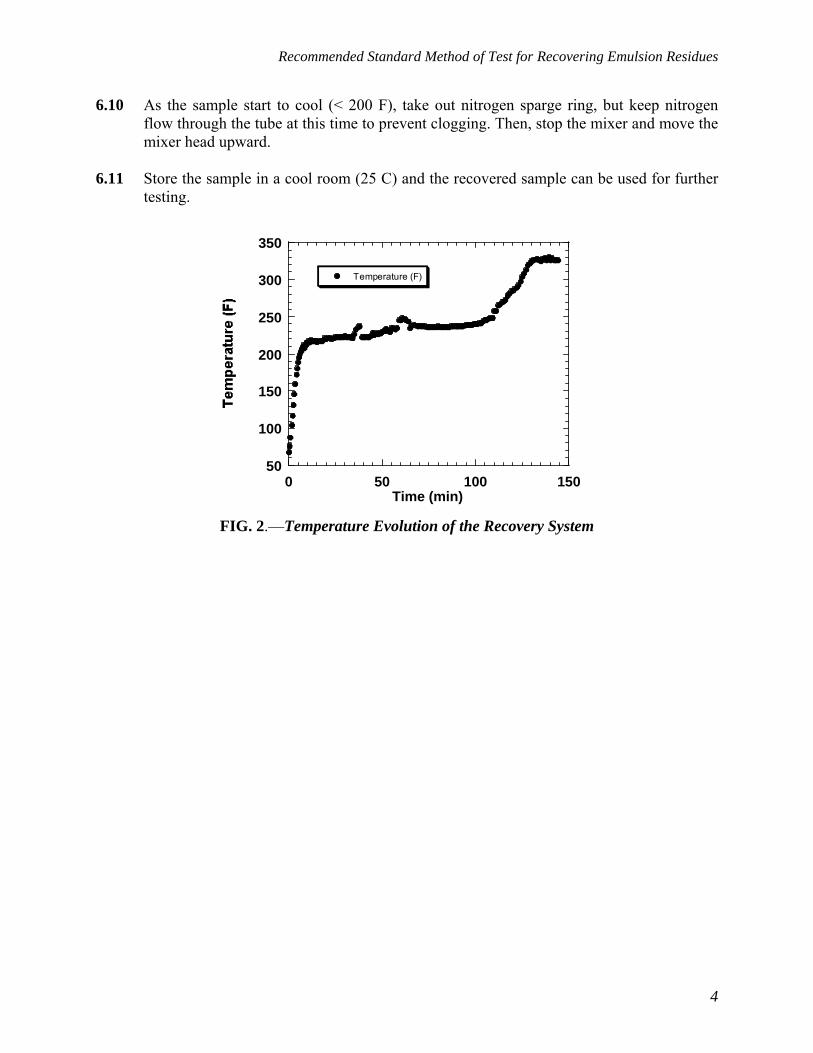
Recommended Standard Method of Test for Recovering Emulsion Residues
4
6.10 As the sample start to cool (< 200 F), take out nitrogen sparge ring, but keep nitrogen flow through the tube at this time to prevent clogging. Then, stop the mixer and move the mixer head upward.
6.11 Store the sample in a cool room (25 C) and the recovered sample can be used for further
testing.
50
100
150
200
250
300
350
0 50 100 150
Temperature (F)
Time (min) FIG. 2.—Temperature Evolution of the Recovery System
1
Recommended Standard Method of Test for Determining the Strain Sensitivity of Asphalt Emulsion Residue Using Strain Sweeps Performed on a Dynamic Shear Rheometer (DSR)
AASHTO Designation: Txxxx-xx 1. SCOPE 1.1. This test method covers the determination of strain sensitivity of asphalt residue from a
water-based emulsion from changes in the dynamic shear modulus obtained from strain sweeps performed using the Dynamic Shear Rheometer. This test method is supplementary to AASHTO T 315-09 and incorporates all of that standard. For this test method, the asphalt binder is the residue obtained by removing the water from a water-based asphalt emulsion.
1.2. This standard is appropriate for unaged material or material aged in accordance with R28. 2. REFERENCED DOCUMENTS 2.1 AASHTO STANDARDS
T 315-09, Determining the Rheological Properties of Asphalt Binder Using a Dynamic Shear Rheometer
M 320, Performance-Graded Asphalt Binder R 28, Accelerated Aging of Asphalt Binder Using a Pressure Aging Vessel (PAV) R 29, Grading or Verifying the Performance Grade (PG) of an Asphalt Binder T40, Sampling of Bituminous Materials
2.2 ASTM Standards
E1, Specification for ASTM Thermometers 3. SUMMARY OF TEST METHOD 3.1 This standard contains the procedure used to measure the complex shear modulus (G*) of
asphalt residues from water based emulsions using a dynamic shear rheometer and parallel plate test geometry.
3.2 The standard is suitable for unaged material or material aged in accordance with R28. 3.3 The standard is suitable for use when the emulsion residue is not too stiff to be torqued
by the DSR.
Recommended Standard Method of Test for Determining Strain Sensitivity of Asphalt Emulsion Residue
2
4. SIGNIFICANCE AND USE 4.1 The test temperature for this test is related to the test temperature experienced by the
pavement maintenance treatment in the geographical area for which the asphalt emulsion is to be applied. Typically the maintenance treatment is applied at moderate ambient temperature, and a default temperature of 25º C can be used for the strain sweep evaluation.
4.2 A plot of Dynamic Shear Modulus G* versus Time will be generated and compared as an
indication of Strain Sensitivity of the residue. 4.3 The complex shear modulus is an indication of the stiffness and the resistance of the
asphalt residue to deformation under load and also as an indication of the ability of the residue to hold aggregate.
5. APPARATUS 5.1 Dynamic Shear Rheometer Test System – Consisting of parallel metal plates, an
environmental control system, a loading device, and a control and data acquisition system.
5.2 Test Plates – The 8 mm plates are used for this test with a 2 mm gap. Preliminary gap
before trimming must be set to achieve an acceptable bulge in the material after trimming.
6. REAGENTS AND MATERIALS 6.1 Varsol or another suitable agent for cleaning the plates. 6.2 Acetone for removal of all remaining residue from the plates. 7. SAMPLE 7.1 The sample is the residue after water is removed from the water-based asphalt emulsion.
The properties of recovered binder might not agree with the base asphalt as other substances have been added to the base binder in the emulsification process.
8. PROCEDURE 8.1 Procedure is as described in AASHTO T 315-09 using the 8 mm plates with a 2 mm gap. 8.2 Prepare the emulsion residue specimen according to AASHTO T 315-09.
Recommended Standard Method of Test for Determining Strain Sensitivity of Asphalt Emulsion Residue
3
8.3 Place the sample in the DSR and trim it according to AASHTO T 315-09. 8.4 Bring the sample and the environmental system to thermal equilibrium accordin to the
manufacturer’s directions and AASHTO T 315-09. 8.5 Perform the Strain Sweep. 8.6 Use the following parameters for the strain sweeps:
Intermediate test temperature, with 25º C being the default temperature; For strain sweeps, the DSR is set in oscillation mode for amplitude sweeps. DSR is set for auto-stress so that stress will be automatically adjusted to achieve
desired strain. Frequency is set to 10 radians per second. Initial stress is set to the lowest stress which the DSR is capable of applying. Strain is set to increment between 1% and 50%, or between 1% and the highest
strain that the DSR can achieve with the material being tested. A preliminary test may be needed, especially with stiff residues, to estimate the highest strain percent that can be set for the test.
Steady shear rate is set to zero and is not used in this test. Number of periods is set to 1. Number of points is set to 256. Number of samples can be between 20 and 30. Determine the number of samples
to test at enough points to define the strain sweep curve when plotting G* versus time.
Strain control sensitivity is set to medium or better. Shear strain sequence is set for Up so that strains are incremented from low to high. Time increments are set to Linear so that the time increments between
measurements are approximately linearly chosen (not logarithmically). Delay time is set to 1 second. Check that integration time is between 1 and 2 seconds, and total test time for the
strain sweeps is less than 2 minutes. 8.7 Visually inspect the sample after the test when removing the sample from the plates.
Note whether the sample is wholly or partially adhered to the plates, and note whether the sample has a ductile or a brittle break when the plates are pulled apart.
8.8 Generate a plot of Dynamic Shear Modulus versus Time, as shown in Figure 1. A flat
curve indicates a strain resilient material. A steep curve indicates a strain sensitive material.