Embed Size (px)
Citation preview
ATT-23 1.0 Scope
ATT-23/96, MOISTURE-DENSITY RELATION,Standard Compaction, -5 000 Fm Material
1.0 SCOPE
This method describes the procedures for determining the relationship betweenmoisture content and dry density of -5 000 Fm soil when compacted in a mold witha 2.5 kg hammer dropped from a height of 304.8 mm.
2.0 EQUIPMENT
102 mm diameter mold, collar, and base plate large mixing panstamper (2.5 kg, 304.8 mm drop) grinding mill5 000 Fm sieve canvas tarpwash basins mixing spoonmedicine bottles plastic sheetingclothes sprinkler grocer scoopbutcher knife small drying pansstraight edge large drying pansputty knife large canvas bagselectronic balance extruderZero Air Voids Tables for Relative Densities of 2.65, 2.70 and 2.75 Degree of Saturation Curves for Relative Densities of 2.65, 2.70 and 2.75
Data Sheet: Moisture-Density Test, MAT 6-22
3.0 PROCEDURE
The following procedure is performed on -5 000 Fm fine grained soils having amaximum of 7% oversize. Soils with more than 7% retained on the 5 000 Fm sievemust be compacted as directed in ATT-19, MOISTURE-DENSITY RELATION, +5000 Fm Material.
3.1 Equipment Preparation
1. Install the concrete block and post as directed in ATT 13.
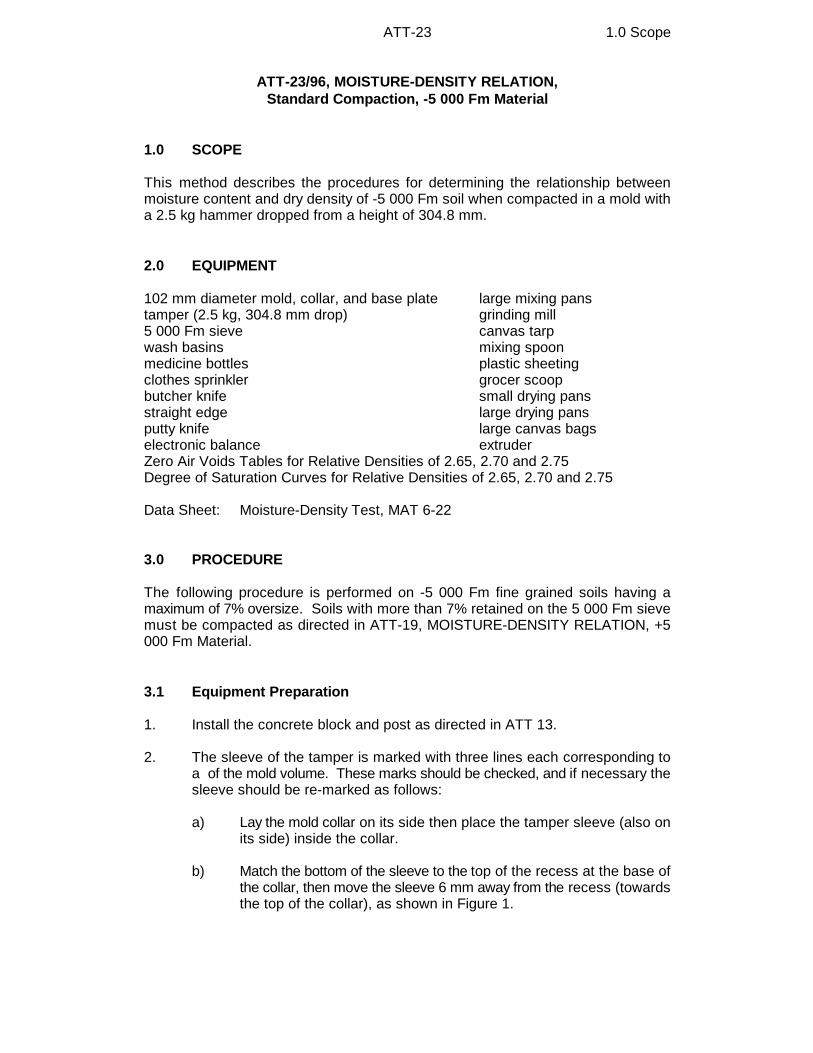
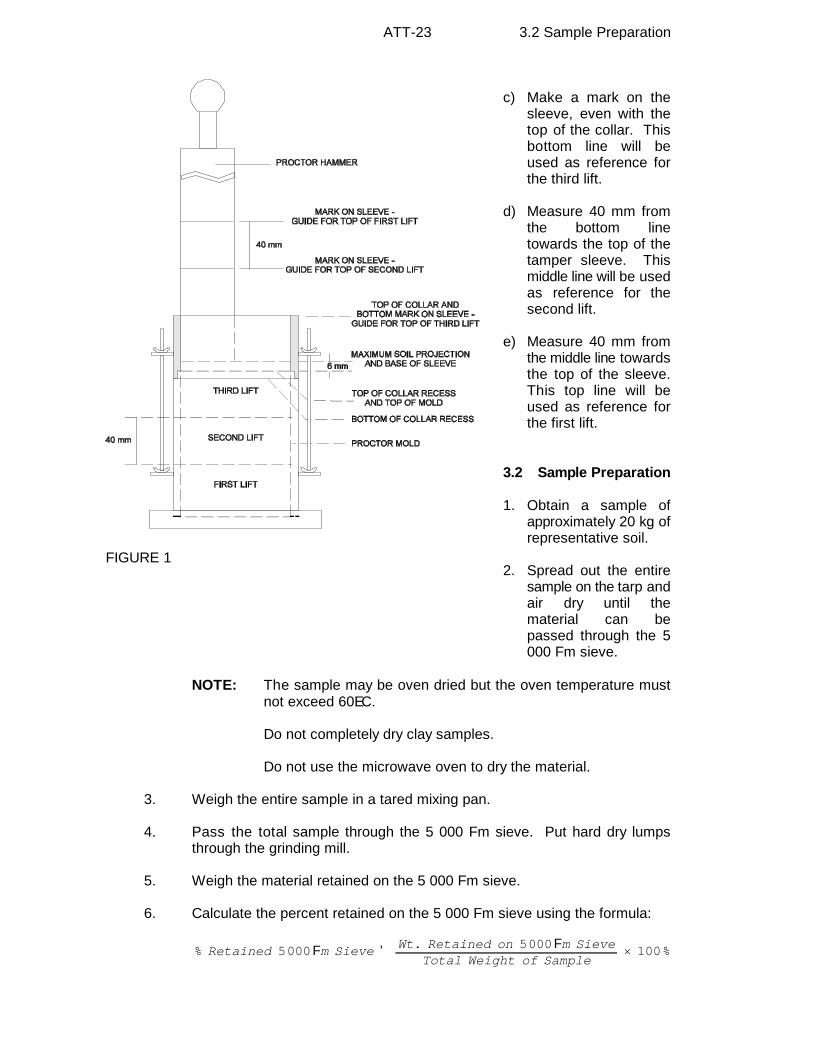
2. The sleeve of the tamper is marked with three lines each corresponding toa of the mold volume. These marks should be checked, and if necessary thesleeve should be re-marked as follows:
a) Lay the mold collar on its side then place the tamper sleeve (also onits side) inside the collar.
b) Match the bottom of the sleeve to the top of the recess at the base ofthe collar, then move the sleeve 6 mm away from the recess (towardsthe top of the collar), as shown in Figure 1.
% Retained 5000Fm Sieve 'Wt. Retained on 5000Fm Sieve
Total Weight of Sample× 100%
FIGURE 1
ATT-23 3.2 Sample Preparation
c) Make a mark on thesleeve, even with thetop of the collar. Thisbottom line will beused as reference forthe third lift.
d) Measure 40 mm fromthe bottom linetowards the top of thetamper sleeve. Thismiddle line will be usedas reference for thesecond lift.
e) Measure 40 mm fromthe middle line towardsthe top of the sleeve.This top line will beused as reference forthe first lift.
3.2 Sample Preparation
1. Obtain a sample ofapproximately 20 kg ofrepresentative soil.
2. Spread out the entiresample on the tarp andair dry until thematerial can bepassed through the 5000 Fm sieve.
NOTE: The sample may be oven dried but the oven temperature mustnot exceed 60EC.
Do not completely dry clay samples.
Do not use the microwave oven to dry the material.
3. Weigh the entire sample in a tared mixing pan.
4. Pass the total sample through the 5 000 Fm sieve. Put hard dry lumpsthrough the grinding mill.
5. Weigh the material retained on the 5 000 Fm sieve.
6. Calculate the percent retained on the 5 000 Fm sieve using the formula:
ATT-23 3.2 Sample Preparation(cont'd)
7. If the result is less than 7%, proceed with step 8.
If the percent retained on the 5 000 Fm sieve is more than 7%, proceed withATT-19, Sections 3.1 and 3.2.
8. Discard the material retained on the 5 000 Fm sieve.
9. Thoroughly mix the -5 000 Fm material.
10. Add water to the entire sample as follows:
a) Insert the clothes sprinkler into the mouth of the medicine bottle.
b) Shake the bottle so that the water sprays out on the soil in the washbasin, at the same time working the soil so that no portion becomesexcessively damp.
c) Mix the soil thoroughly by hand until the moisture is uniformlydistributed.
11. Repeat step 10 until the sample reaches the proper moisture content for thefirst run of the test, 4% below optimum. This moisture condition isapproximately reached when a squeezed handful of soil barely holds togetherwhen dropped 0.5 metres onto the soil.
12. When the required moisture condition is reached, select approximately 12 kgof the wetted soil and place it in a large mixing pan.
13. Weigh 2 250 g of the soil into each of the 5 wash basins, and cover eachwith a sheet of plastic to prevent evaporation.
For the moisture content estimation, it is assumed that 250 g of the soil ineach run is water, and the remaining 2 000 g is dry soil solids.
14. Mark the wash basins with run numbers 1 to 5.
15. Prepare the medicine bottles with water to be added to each run in 40 cm 3
increments as follows:
Run no. 1 40 cm moisture added (+2% in moisture content)3
Run no. 2 80 cm moisture added (+4% in moisture content)3
Run no. 3 120 cm moisture added (+6% in moisture content)3
Run no. 4 160 cm moisture added (+8% in moisture content)3
Run no. 5 no moisture added at this time.
No moisture is added to run no. 5 initially as this sample is kept until the other4 runs have been compacted to see if the final point is required on the wetor the dry side of the moisture-density relation curve.
16. Add the water to runs 1, 2, 3 and 4 as directed in steps 10 (a) to (c), andcover each run with a sheet of plastic.
ATT- 23 3.3 Compaction of Specimens
17. Allow time for the moisture to distribute evenly throughout each sample:
a) A minimum of 12 h for "highly plastic" silts (MH), clays (CI, CH),organic clays and silts (OH) and peat (Pt).
b) A minimum of 3 h for soils with low plasticity such as, clays (CL), silts(ML), organic silts and organic silty clays (OL), clayey gravels (GC)and clayey sands (SC).
c) A minimum of 1 h for silty gravels (GM) and silty sands (SM).
d) There is no time requirement for clean gravels (GW, GP) and cleansands (SW, SP).
3.3 Compaction of Specimens
1. Weigh the mold and base plate excluding the collar. Record as Wt. of Moldon line "C" of the data sheet as shown in Figure 2. Also obtain the volumeof the mold from the supplied zero air voids table folder and record it in line"A".
2. Place the collar on the mold and set it in the recess provided on the block.Be certain that the wing nuts on the base plate are tight.
3. Thoroughly mix the soil for run no.1 by hand.
4. Use the grocer scoop to place an amount of soil in the mold which, whencompacted, will fill a of the mold.
NOTE: Use the lines on the sleeve as a guide in placing the material.Should the first or second lift be too thick or too thin, (±15 mm),the quantity of the soil placed for the following lift shall beadjusted to line up with the proper mark on the tamper. The finallift must extend a maximum of 6 mm above the top of the mold sothat after trimming, no tamper foot imprints are evident. If thethird lift extends by more than 6 mm, the run must be repeated.
5. Place the tamper sleeve on the surface of the soil.
6. Raise the tamper to the top of the sleeve, pause and let the tamper fall. Becertain that the tamper is vertical and that its fall is unrestricted.
7. Repeat step 6 for 25 blows, moving the tamper around the mold, keeping thesleeve close to or touching the walls of the mold.
8. Check the tamper sleeve after each lift to ensure that the tamper's fall is notrestricted by soil adhering to either the sleeve or the hammer.
ATT- 23 3.3 Compaction ofSpecimens (cont'd)
9. Repeat steps 4 to 8 for the second and third lifts.
NOTE: At any time up to 10 blows on the third lift, set the sleeve on thesurface of the soil. If the bottom line on the sleeve is not at thesame level or slightly above the top of the collar, add some morematerial to ensure the top lift will extend 6 mm above the top ofthe mold after compaction.
10. Loosen the collar of the mold from the soil by turning the collar without pullingupward.
NOTE: Where the last lift of soil extends well above the top of the mold,and with the drier runs, use a putty knife to trim a ring of soil awayfrom the collar so that it can be more easily loosened.
11. To remove the collar without tearing away any of the projecting soil, placeyour fingers of one hand on top of the soil and with the other hand, turn thecollar, at the same time lifting, until it is free. If the lifts have been properlyproportioned, the soil should not extend more than 6 mm above the mold.
12. Set the mold in a wash basin.
13. Use the butcher knife to trim the soil projecting above the mold by cuttingtowards you, away from the center with the knife held a few degrees from thehorizontal, leaving the soil in the center of the mold slightly high.
14. Use the straight edge to draw levelling lines across the soil.
15. Trim the high spots with the knife held as flat as possible to avoid gouging.Repeat the levelling and trimming until the surface is level with the mold. Fillin small holes created during the trimming with trimmed soil.
16. Clean off the outside and base of the mold.
17. Weigh the mold, base plate, and contents and record as Wt. of Wet Sample+ Mold on line "B" of the form, in the vertical column corresponding to runnumber 1.
18. Remove the base plate. Label and tare a drying pan. Record the pannumber as Container (line "H") and the pan weight as Tare of Container (line"K") in the column for run number 1.
19. Secure a moisture content sample of at least 250 g net wet weight,representing a cross-section from top to bottom of the compacted sample.
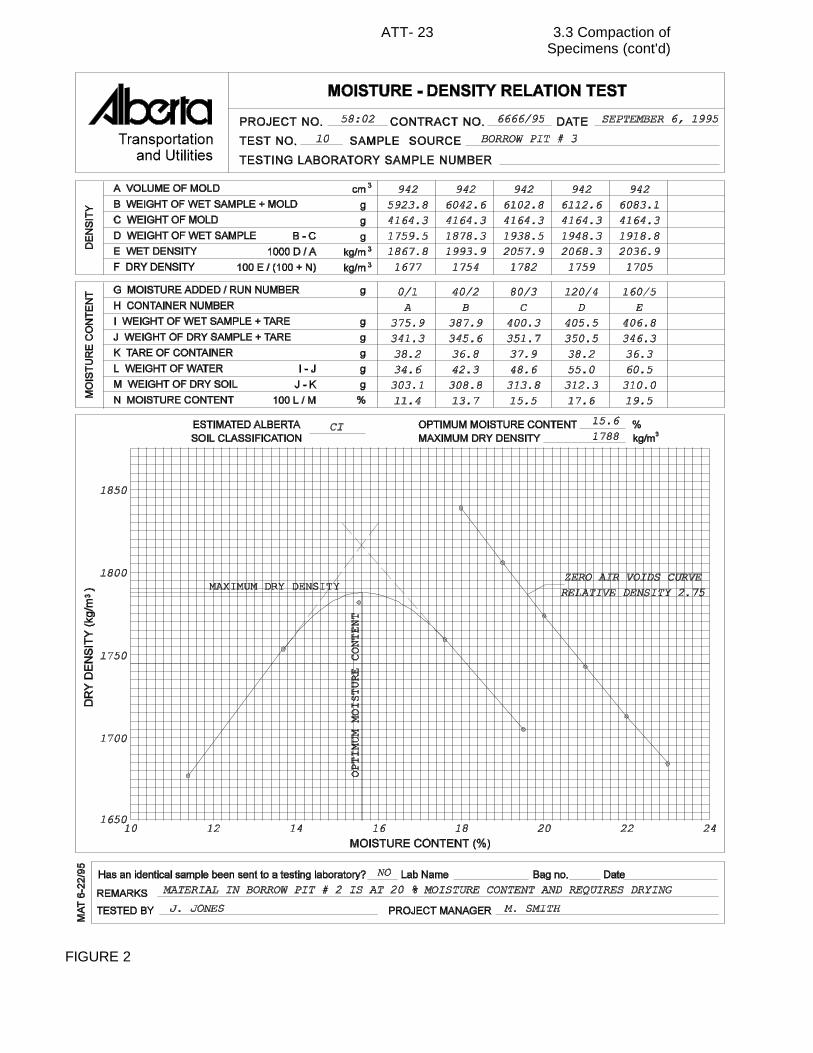
FIGURE 2
ATT- 23 3.3 Compaction ofSpecimens (cont'd)
ATT- 23 3.3 Compaction ofSpecimens (cont'd)
If an extruder is available, obtain the moisture sample as follows:
a) Remove the specimen from the mold by centering the mold in theextruder's base plate which is centered on the jack. Jack theassembly up until the top of the mold is just about touching the topfixed steel plate. Line the inside circumference of the top of the moldup with the hole cut on the top plate, then jack the specimen upthrough the hole, as straight as possible.
b) Use the butcher knife to slice the specimen longitudinally in half.
c) Cut off a thin slice of compacted material from top to bottom and asclose to the center as possible.
d) Break the sample into pieces smaller than 15 mm, for faster andthorough drying.
If an extruder is not available, obtain the moisture content sample as follows:
a) Set the mold in a wash basin or drying pan.
b) Starting from one side, use the putty knife to cut diagonally across tothe other side, down approximately 40 mm.
c) From the exposed surface, remove a representative moisture contentsample cutting down half-way through the compacted sample, andtransfer the sample to the tared drying pan.
d) Invert the mold and repeat (b) and (c) to secure the remainder of thesample.
e) Break the sample into pieces smaller than 15 mm.
20. Weigh the moisture content sample immediately, and record as "Wt. WetSample + Tare" on line "T". Mark the drying container with "Run #1" andplace it in the:
a) conventional oven set at 100EC ± 5EC and dry to constant weight, or
b) microwave oven and dry the sample for the calibrated length of time.
Remove the soil remaining in the mold and thoroughly clean the mold.
21. Repeat steps 2 to 20 for runs 2, 3 and 4.
22. Calculate the wet density for these four runs, as directed in Section 3.4, steps1 and 2.
Wt. of Wet Sample (g) ' Wt. of Wet Sample & Mold & Wt. of Mold
Wet Density (kg/m 3) 'Wt. of Wet Sample (g)Volume of Mold (cm 3)
× 1000
Wt. of Water (g) ' Wt. of Wet Sample & Tare & Wt. of Dry Sample & Tare
Wt. of Dry Soil (g) ' Wt. of Dry Soil & Tare & Tare of Container
ATT-23 3.4 Calculations
23. If the wet density of run number 4 is higher than the wet density of runnumber 3:
a) Add 200 g of water to run number 5, as directed in Section 3.2, step10 (a) to (c),
b) Cover the sample with a sheet of plastic.
c) Allow the moisture to distribute for the minimum time shown inSection 3.2, step 17 (a) to (d),
d) Compact run number 5 as directed in steps 2 to 20 above.
If the wet density of run number 4 is lower than or the same as the wetdensity of run number 3, compact run number 5 without additional wateradded, (at the estimated 4% below optimum) as described in steps 2 to 20.
NOTE: The ideal 5 point curve should have 2 points on the dry side ofoptimum, 2 points on the wet side and the middle point at or nearoptimum. Run number 5 is left until the other four runs have beencompacted for this reason.
3.4 Calculations
1. Calculate the weight of the wet sample in the mold (line "D") as follows:
2. Calculate the wet density of the compacted specimen (line "E") using theformula:
3. Record the dry weights of the moisture content samples as Weight. of DrySample + Tare (line "J"), in the columns corresponding to the appropriate runnumbers.
4. Determine the weight of water removed (line "L") as follows:
5. Determine the dry weight of the moisture content sample (line "M") as follows:
Moisture Content (%) 'Wt. of Water
Wt. of Dry Soil× 100%
Dry Density (kg/m 3) 'Wet Density
100% % Moisture Content in %× 100%
ATT-23 3.5 Plotting
6. Determine the moisture content in percent (line "N") of the compactedspecimen using the formula:
7. Calculate the dry density of the compacted sample (line "F") as follows:
3.5 Plotting
1. On the graph on the bottom of the data sheet, set up a moisture contentscale in increments of 1% horizontally and a dry density scale in incrementsof 25 kg/m vertically, as shown in Figure 2. Select a range of numbers for3
the scales so that all points plot on the graph.
2. Plot the dry density and moisture content co-ordinates for each run.
3. Connect the points with a smooth flowing curve.
4. From the peak of the curve, determine the maximum standard dry densityand optimum moisture content, and record them at the top of the graphportion of the data sheet.
The maximum dry density will be used to determine the percent compactionof the road tests performed on the same material, while the optimummoisture content will be used to control the moisture content of this materialon the road.
3.6 Zero Air Voids Curve
1. Classify the moisture-density relation test soil using:
a) The hand method of soils identification and bottle test as directed inATT-29, and
b) The origin of soil in conjunction with the soils profile.
Record the estimated unified soil classification symbol as Estimate AlbertaSoils Classification at the top of the data sheet graph.
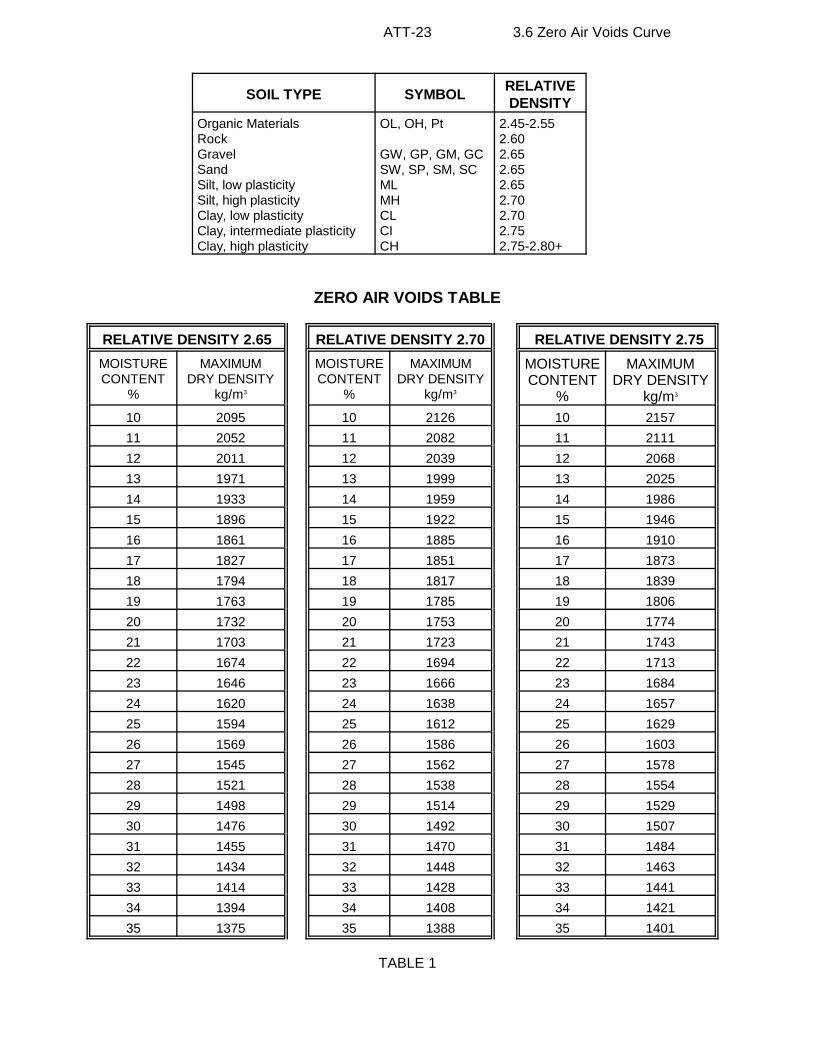
2. The zero air voids table, as shown in Table 1, shows the relationshipbetween moisture content and theoretical maximum dry density of a soil100% saturated and compacted using standard compaction. The table isdivided into 3 groups of soils, according to the soil's relative density.
Choose the zero air voids table which best fits the soil type. Following arethe approximate relative densities of various soil types.
ATT-23 3.6 Zero Air Voids Curve
SOIL TYPE SYMBOL RELATIVEDENSITY
Organic Materials OL, OH, Pt 2.45-2.55Rock 2.60Gravel GW, GP, GM, GC 2.65Sand SW, SP, SM, SC 2.65Silt, low plasticity ML 2.65Silt, high plasticity MH 2.70Clay, low plasticity CL 2.70Clay, intermediate plasticity CI 2.75Clay, high plasticity CH 2.75-2.80+
ZERO AIR VOIDS TABLE
RELATIVE DENSITY 2.65 RELATIVE DENSITY 2.70 RELATIVE DENSITY 2.75
MOISTURE MAXIMUM MOISTURE MAXIMUMCONTENT DRY DENSITY CONTENT DRY DENSITY
% kg/m % kg/m3 3
MOISTURE MAXIMUMCONTENT DRY DENSITY
% kg/m3
10 2095 10 2126 10 215711 2052 11 2082 11 211112 2011 12 2039 12 206813 1971 13 1999 13 202514 1933 14 1959 14 198615 1896 15 1922 15 194616 1861 16 1885 16 191017 1827 17 1851 17 187318 1794 18 1817 18 183919 1763 19 1785 19 180620 1732 20 1753 20 177421 1703 21 1723 21 174322 1674 22 1694 22 171323 1646 23 1666 23 168424 1620 24 1638 24 165725 1594 25 1612 25 162926 1569 26 1586 26 160327 1545 27 1562 27 157828 1521 28 1538 28 155429 1498 29 1514 29 152930 1476 30 1492 30 150731 1455 31 1470 31 148432 1434 32 1448 32 146333 1414 33 1428 33 144134 1394 34 1408 34 142135 1375 35 1388 35 1401
TABLE 1
S(%) 'Moisture Content in % × Dry Density in g/cm 3 × Relative Density
Relative Density & Dry Density (g/cm 3)
S(%) '19.4 × 1.663 × 2.70
2.70 & 1.663' 84%
ATT-23 3.7 Checking the Accuracyof Curve Results
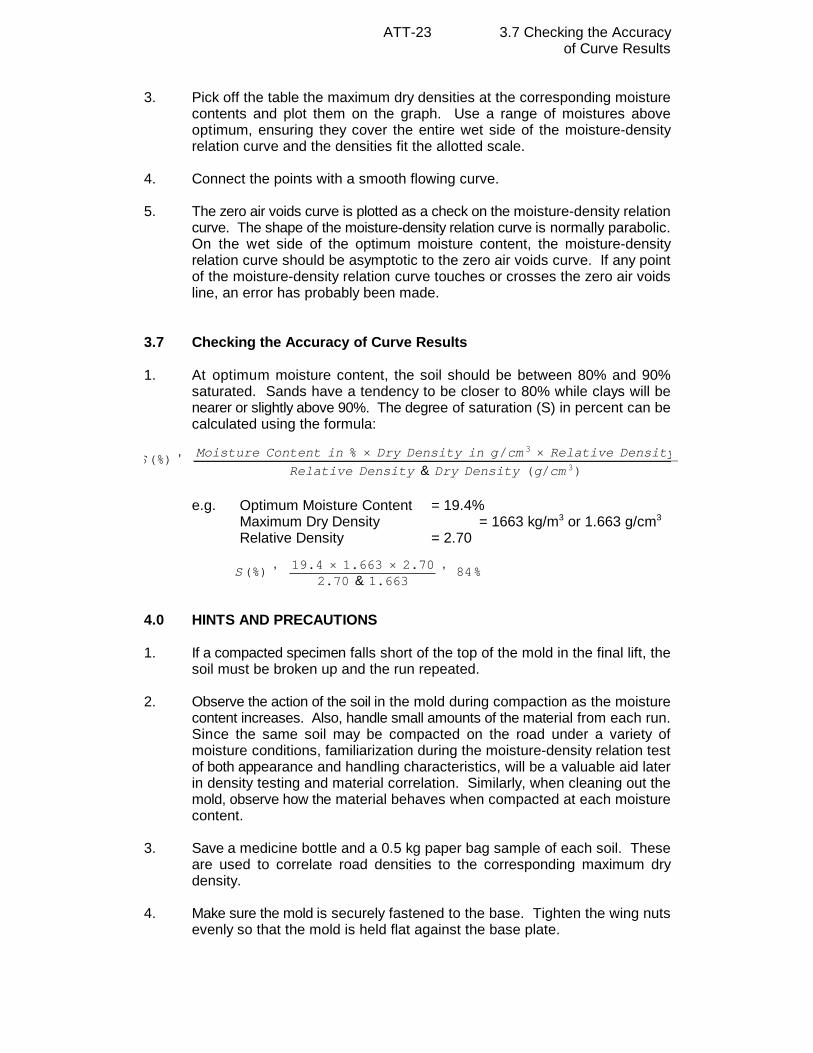
3. Pick off the table the maximum dry densities at the corresponding moisturecontents and plot them on the graph. Use a range of moistures aboveoptimum, ensuring they cover the entire wet side of the moisture-densityrelation curve and the densities fit the allotted scale.
4. Connect the points with a smooth flowing curve.
5. The zero air voids curve is plotted as a check on the moisture-density relationcurve. The shape of the moisture-density relation curve is normally parabolic.On the wet side of the optimum moisture content, the moisture-densityrelation curve should be asymptotic to the zero air voids curve. If any pointof the moisture-density relation curve touches or crosses the zero air voidsline, an error has probably been made.
3.7 Checking the Accuracy of Curve Results
1. At optimum moisture content, the soil should be between 80% and 90%saturated. Sands have a tendency to be closer to 80% while clays will benearer or slightly above 90%. The degree of saturation (S) in percent can becalculated using the formula:
e.g. Optimum Moisture Content = 19.4%Maximum Dry Density = 1663 kg/m or 1.663 g/cm3 3
Relative Density = 2.70
4.0 HINTS AND PRECAUTIONS
1. If a compacted specimen falls short of the top of the mold in the final lift, thesoil must be broken up and the run repeated.
2. Observe the action of the soil in the mold during compaction as the moisturecontent increases. Also, handle small amounts of the material from each run.Since the same soil may be compacted on the road under a variety ofmoisture conditions, familiarization during the moisture-density relation testof both appearance and handling characteristics, will be a valuable aid laterin density testing and material correlation. Similarly, when cleaning out themold, observe how the material behaves when compacted at each moisturecontent.
3. Save a medicine bottle and a 0.5 kg paper bag sample of each soil. Theseare used to correlate road densities to the corresponding maximum drydensity.
4. Make sure the mold is securely fastened to the base. Tighten the wing nutsevenly so that the mold is held flat against the base plate.

ATT-23 4.0 Hints and Precautions
5. If the incorrect zero air voids curve data is used, a curve parallel to the trueone will result. If the shift is towards the wet side of the moisture-densityrelation curve, points on the wet side of the curve will plot closer to the zeroair voids curve and may appear incorrect.


![Moisture Meter English - · PDF fileArt.no 36-6901 Model ET-928 ... ingen knapps trycks in. 5. [ ] Bakgrundsbelysning på/av, SCAN/HOLD för att låsa mätvärde 6. [ ] Val av temperatur](https://img.pdfslide.us/doc/110x75/5a9fc5e67f8b9a8e178d2786/moisture-meter-english-36-6901-model-et-928-ingen-knapps-trycks-in-5-.jpg)