Embed Size (px)
Citation preview
ATRADER Interactive Charting.
Help Documentation Manual.
This Version 18th August 2010.
Contents Contents .........................................................................................................................2
1 Introduction and Key Features...............................................................................4
2 Getting Started. ......................................................................................................5
2.1 Downloading and Installing...............................................................................5
2.2 Getting Connected. ..........................................................................................13
2.2.1 Interactive Brokers...............................................................................13
2.2.2 Getting Connected to DTN ..................................................................14
2.2.3 Getting Connected to Transact/Zenfire................................................14
2.2.4 Special Notes .......................................................................................15
2.3 Configuration ...................................................................................................16
2.4 Configure DataFeed. ........................................................................................17
2.5 Changing Background Colours........................................................................18
2.6 Changing Fonts. ...............................................................................................18
3 Creating a first Chart............................................................................................19
3.1 Workspace Overview.......................................................................................19
3.2 Creating a New Ticker Chart ...........................................................................20
4 Editing a Chart. ....................................................................................................29
4.1 Changing the Chart period or Type. ................................................................31
4.2 Changing the Bar Build Type. .........................................................................32
4.3 Creating a tick chart with volume sub study....................................................34
4.4 Creating a Volume bar Chart. ..........................................................................36
5 Chart Rescaling....................................................................................................37
5.1 Chart Navigation Toolbar ................................................................................37
5.2 Hot Keys ..........................................................................................................38
5.3 Using Chart Navigation ...................................................................................38
5.4 Moving about Charts........................................................................................40
6 More Advanced Charts. .......................................................................................44
6.1 Creating a multiple Symbol Chart. ..................................................................44
6.2 Axes Positions and Overlay Types ..................................................................45
7 Creating a Daily Chart ........................................................................................46
8 Screen Drawing Tools..........................................................................................48
Screen Drawing Default Specifications. ......................................................................50
8.1.1 Setting new Gann Projection Ratios. ...................................................50
8.1.2 Configuring Murray Math Ratios. .......................................................51
8.1.3 Configuring Floor Pivots. ....................................................................52
8.2 Trend lines .......................................................................................................53
8.2.1 Sloping Trendlines ...............................................................................53
8.2.2 Vertical Trendlines...............................................................................54
8.2.3 Horizontal Trendlines ..........................................................................55
8.2.4 Trendlines With Arrows ......................................................................56
8.2.5 Annotating a chart with Text ...............................................................57
8.2.6 Deleting a Trendlines or Graphical Objects.........................................58
8.2.7 Moving a Trendline or Graphical Object.............................................61
8.3 Retracements....................................................................................................62
8.4 Gann Projections. .............................................................................................63
8.4.1 Cycle Finder.........................................................................................63
8.4.2 Gann Time Projection using Range .....................................................64
8.4.3 Gann Time Projection Using Price ......................................................65
8.5 Floor Pivots......................................................................................................66
9 Volume Distribution. ...........................................................................................67
9.1 Creating a Volume Distribution.......................................................................67
9.2 Spacing a Distribution......................................................................................72
9.3 Removing an Overlaid Chart ...........................................................................73
9.4 Creating Multiple Distributions. ......................................................................75
9.5 Creating A Bracket Distribution ......................................................................77
9.6 Creating An Alphabetic Distribution with a Custom TPO Session.................78
9.7 Creating A Custom TPO Session on a Fixed Date Distribution with a Custom
Block Fill. ....................................................................................................................79
9.8 Creating a Distribution with VWAP Analysis.................................................81
10 Creating a Volume Delta Chart........................................................................83
11 Quoteboard.......................................................................................................86
12 Time and Sales. ................................................................................................87
13 Chart Trading ...................................................................................................88
14 Strategy Trading...............................................................................................91
15 Streaming News ...............................................................................................93
16 Custom Programming ......................................................................................94
17 Programming Custom Indicators .....................................................................97
18 Sessions............................................................................................................98
18.1 Using a Session ................................................................................................99
18.2 Available Sessions .........................................................................................101
19 Saving a Chart to Disk ...................................................................................103
20 Send a chart to an FTP server. .......................................................................104
21 ATRADER Live ............................................................................................106
22 FAQ And Problems........................................................................................107
22.1 Cleaning out your archive. .............................................................................107
22.2 Saving a workspace........................................................................................107
22.3 Crash Reports.................................................................................................108
Contents
1 Introduction and Key Features.
• We are a global leader providing high performance software for traders and
investors. With professional expertise in financial markets, software development and
current trading systems the product provides the customer an 'edge' in daytrading and
investing.
• ATRADER is optimised for EMINI traders.
• (ChartTrader) ATRADER offset live order integration with Interactive Brokers
and 2 click trading for orders directly off charts. By simply clicking on a chart, a user
can enter various order types using the API.
• (ProfileTrader) offers probably the most extensive profiling features in the current
marketplace. Profiling of market information is the only 'indicator' shown to
consistently provide profits and is used by floor traders fund and pit traders alike.It is
free of noise and gives the user a unique ability to position himself with the 'herd'.
ATRADER includes the best off the shelf volume and alphabetic distribution analysis
of market data. They include volume, alphabetic, independant, bracket and
cummulative distributions. Please see the learning section for more information on
how to trade the market structure using this method.
• (DeltaTrader) ATRADER provides volume delta profiling, bid/ask/last trade
analysis.
• (StrategyTrader). ATRADER offer position entry and position management
directly of charts.
• (C++Trader). ATRADER offers custom programming indicators in Visual C++.
• (GannTrader) ATRADER has point and click implementation of Gann
Price/Time Projections and Cycle Finders. These are some of Ganns more advanced
features. More features are coming soon, specifically Gann Fans and Gann Vortexes.
• (MurrayTrader) Murray Math and Floor Pivots. ATRADER offers a point and
click implementation of Murray Math and floor pivots. No more messing with
calculators.
• ATRADER currently supports DTN, Interactive Brokers, TRANSACT and
ZENFIRE datafeeds. It directly provides historical daily and intraday data for stocks,
futures and indexes, tick by tick historical intraday stocks , indexes and futures data,
with full backfill and real time integration with vendors historical data servers.
• ATRADER provides integration with Microsoft Excel for custom studies imports.
• ATRADER offers numerous sub studies including RSI, CCI, MACD, Stochastics
to name but a few. ATRADER has advanced overlaid chart facilities, you are only
limited by your imagination and screen real estate.
2 Getting Started.
2.1 Downloading and Installing
Demo Users.
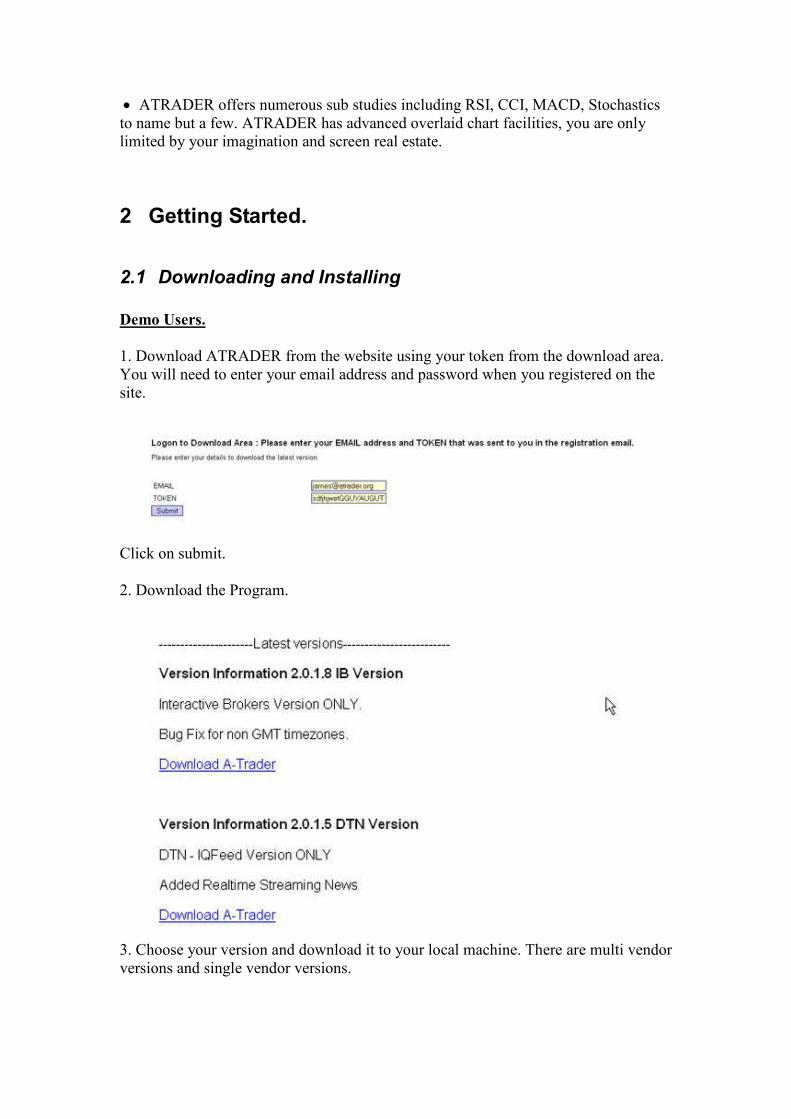
1. Download ATRADER from the website using your token from the download area.
You will need to enter your email address and password when you registered on the
site.
Click on submit.
2. Download the Program.
3. Choose your version and download it to your local machine. There are multi vendor
versions and single vendor versions.
4. Install the ATRADER Pre-requisites specific to your chosen version.
DTN IQFEED.
http://www.iqfeed.net/index.cfm?displayaction=support§ion=download
INTERACTIVE BROKERS TWS
http://www.interactivebrokers.com/en/control/systemstandalone.php?os=win&ib_enti
ty=llc
.
INFINITY AT (TRANSACT)
http://www.tfutures.com/download.htm

4. Install ATRADER.
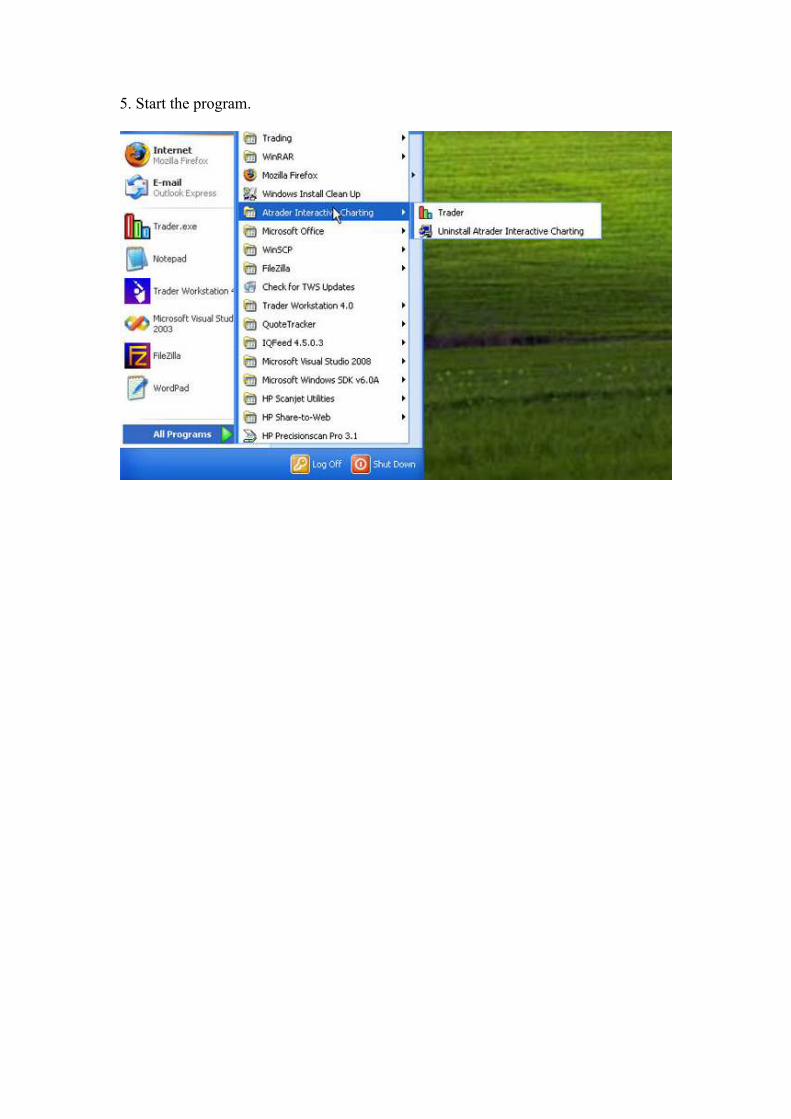
5. Start the program.
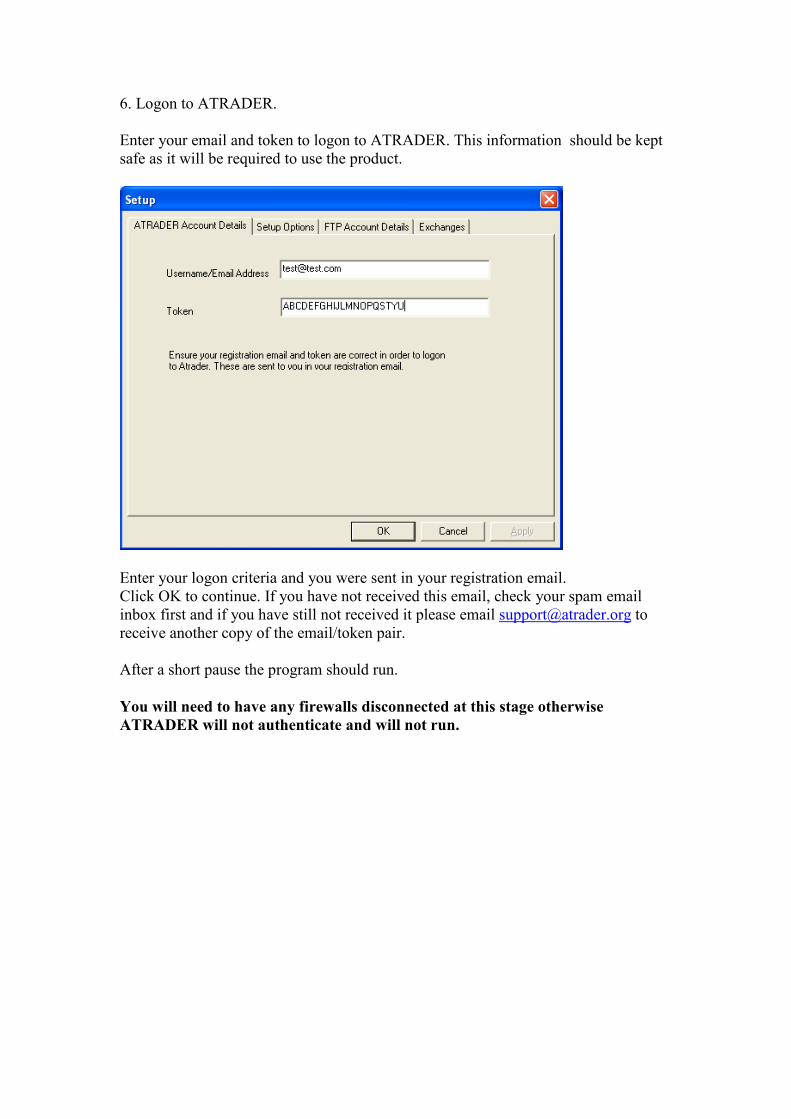
6. Logon to ATRADER.
Enter your email and token to logon to ATRADER. This information should be kept
safe as it will be required to use the product.
Enter your logon criteria and you were sent in your registration email.
Click OK to continue. If you have not received this email, check your spam email
inbox first and if you have still not received it please email [email protected] to
receive another copy of the email/token pair.
After a short pause the program should run.
You will need to have any firewalls disconnected at this stage otherwise
ATRADER will not authenticate and will not run.
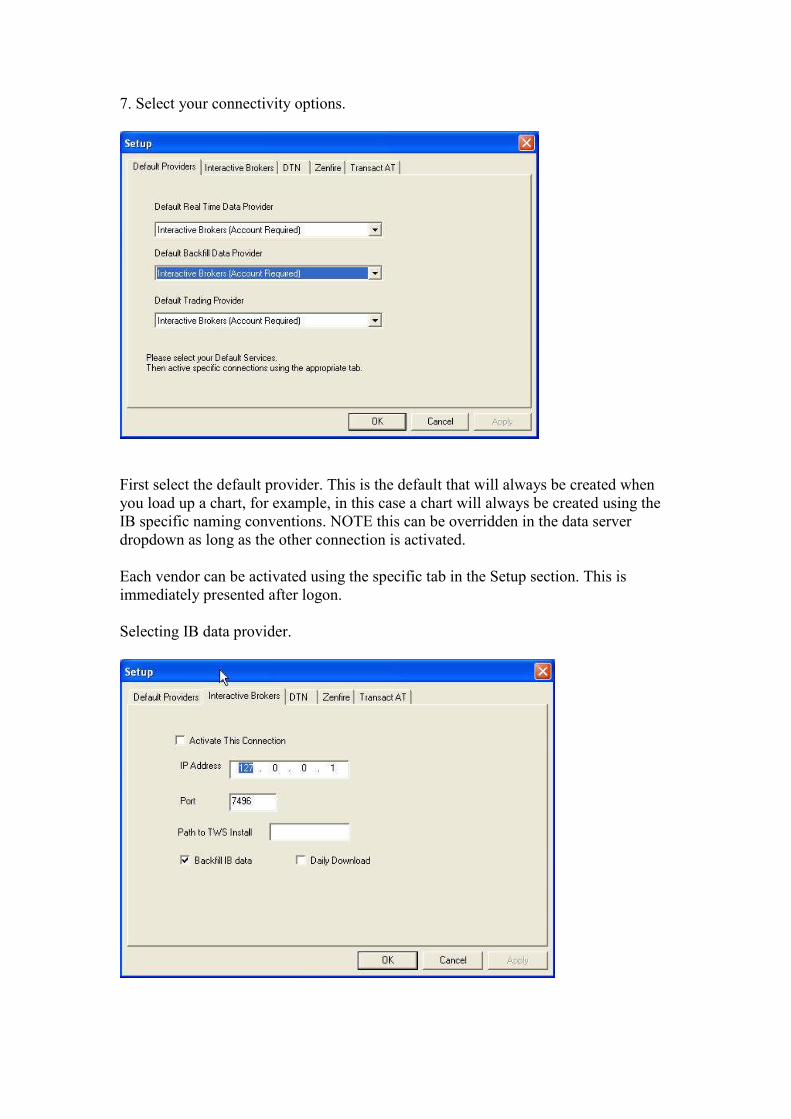
7. Select your connectivity options.
First select the default provider. This is the default that will always be created when
you load up a chart, for example, in this case a chart will always be created using the
IB specific naming conventions. NOTE this can be overridden in the data server
dropdown as long as the other connection is activated.
Each vendor can be activated using the specific tab in the Setup section. This is
immediately presented after logon.
Selecting IB data provider.
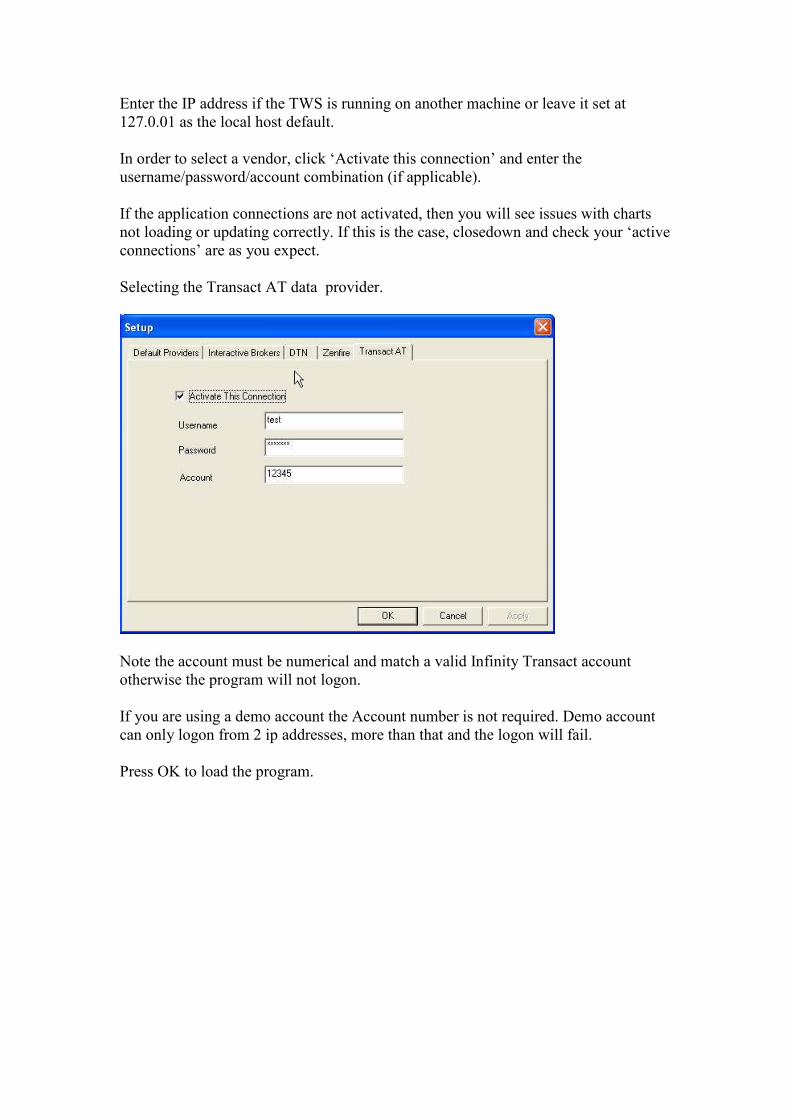
Enter the IP address if the TWS is running on another machine or leave it set at
127.0.01 as the local host default.
In order to select a vendor, click ‘Activate this connection’ and enter the
username/password/account combination (if applicable).
If the application connections are not activated, then you will see issues with charts
not loading or updating correctly. If this is the case, closedown and check your ‘active
connections’ are as you expect.
Selecting the Transact AT data provider.
Note the account must be numerical and match a valid Infinity Transact account
otherwise the program will not logon.
If you are using a demo account the Account number is not required. Demo account
can only logon from 2 ip addresses, more than that and the logon will fail.
Press OK to load the program.
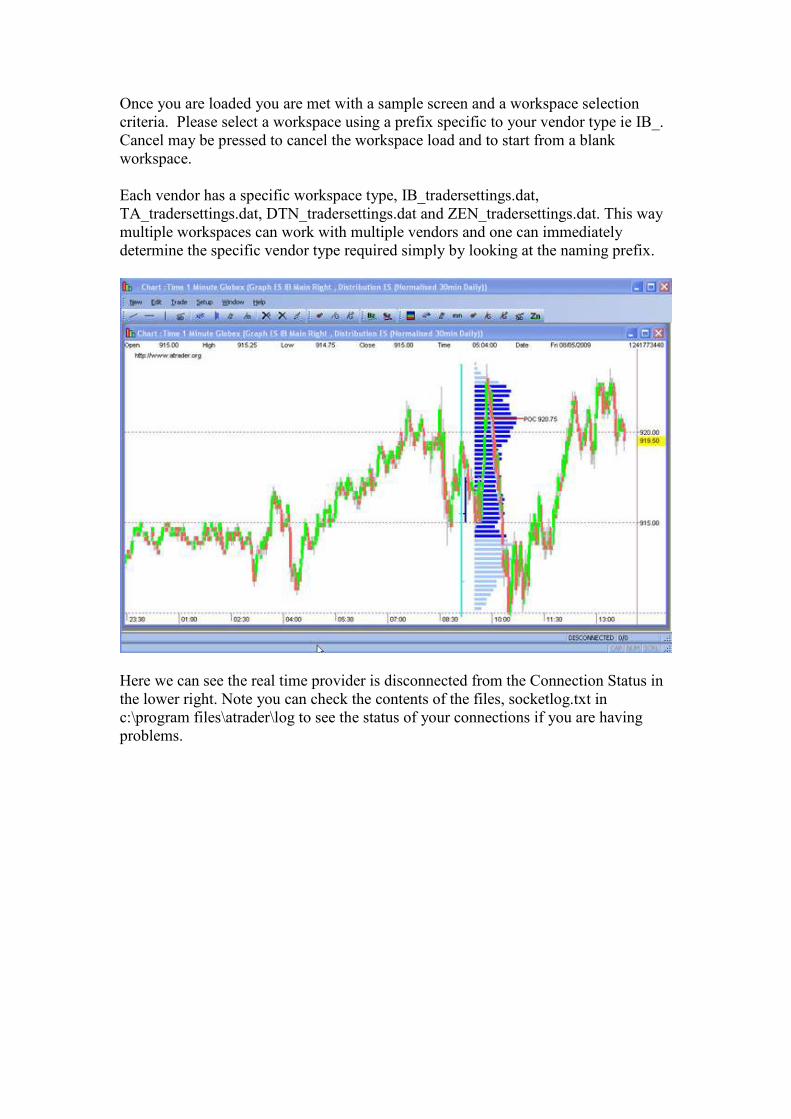
Once you are loaded you are met with a sample screen and a workspace selection
criteria. Please select a workspace using a prefix specific to your vendor type ie IB_.
Cancel may be pressed to cancel the workspace load and to start from a blank
workspace.
Each vendor has a specific workspace type, IB_tradersettings.dat,
TA_tradersettings.dat, DTN_tradersettings.dat and ZEN_tradersettings.dat. This way
multiple workspaces can work with multiple vendors and one can immediately
determine the specific vendor type required simply by looking at the naming prefix.
Here we can see the real time provider is disconnected from the Connection Status in
the lower right. Note you can check the contents of the files, socketlog.txt in
c:\program files\atrader\log to see the status of your connections if you are having
problems.
2.2 Getting Connected.
2.2.1 Interactive Brokers.
Right now you may or may not be already connected to your data provider. If you are
then you will probably be in the data download phase, and the chart may not have
been immediately been created.
If you aren’t already connected then, and have disconnected in you download status,
perform the following
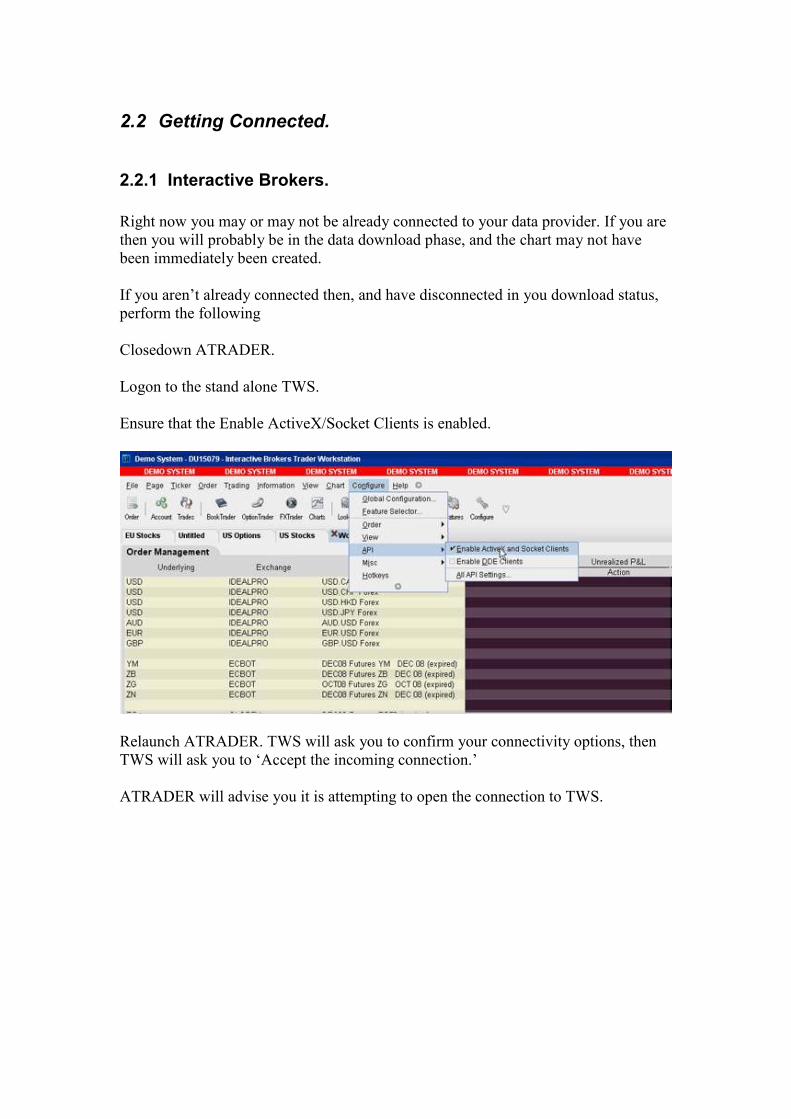
Closedown ATRADER.
Logon to the stand alone TWS.
Ensure that the Enable ActiveX/Socket Clients is enabled.
Relaunch ATRADER. TWS will ask you to confirm your connectivity options, then
TWS will ask you to ‘Accept the incoming connection.’
ATRADER will advise you it is attempting to open the connection to TWS.
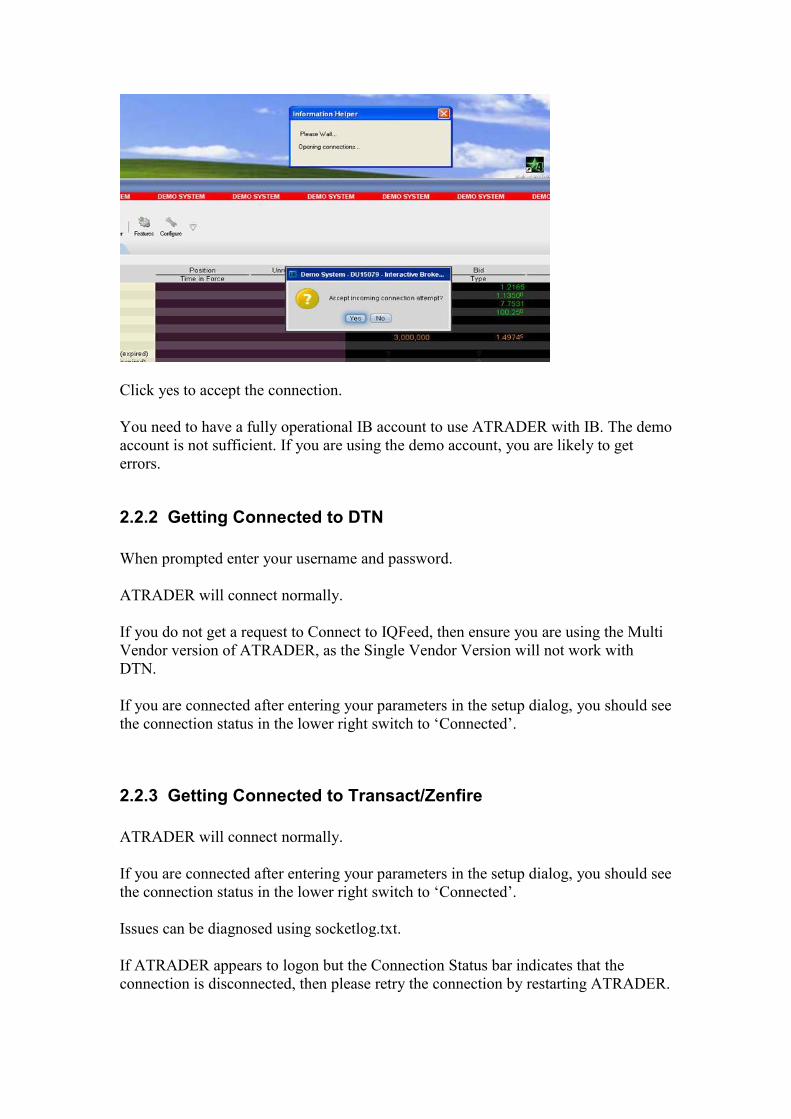
Click yes to accept the connection.
You need to have a fully operational IB account to use ATRADER with IB. The demo
account is not sufficient. If you are using the demo account, you are likely to get
errors.
2.2.2 Getting Connected to DTN
When prompted enter your username and password.
ATRADER will connect normally.
If you do not get a request to Connect to IQFeed, then ensure you are using the Multi
Vendor version of ATRADER, as the Single Vendor Version will not work with
DTN.
If you are connected after entering your parameters in the setup dialog, you should see
the connection status in the lower right switch to ‘Connected’.
2.2.3 Getting Connected to Transact/Zenfire
ATRADER will connect normally.
If you are connected after entering your parameters in the setup dialog, you should see
the connection status in the lower right switch to ‘Connected’.
Issues can be diagnosed using socketlog.txt.
If ATRADER appears to logon but the Connection Status bar indicates that the
connection is disconnected, then please retry the connection by restarting ATRADER.
2.2.4 Special Notes
In order to use a vendor, the Activate Connection must the clicked.
Only the status of the real time provider is shown in the lower right hand corner. If
your historical provider has failed to connect, will get a notification of failure and will
need to restart ATRADER to reconnect.
This will result in invalid charts being displayed or not at all.
If you are using a provider which does not have a backfill provider, you will need to
subscribe to a data provider with backfill capability is order to load correct charts.
To troubleshoot connection issues, check the Activate Connection Check is ticked and
furthermore examine the socketlog.txt for more information.

2.3 Configuration
Various options can be set using the Setup/Options menu.
Clicking Setup Options loads the options box.
Here one can specify the default futures months, that is the one ATRADER will show
in dialogs. Useful after the contract has rolled to the next month.
SPECIAL NOTE
All data in files in stored as GMT.
In order to display the data in you local timezone, you need to specify the visual
display offset. Typically a US trader on EST, will set this value to -5, as this is the
current offset from GMT. Eurozone traders may need to set this to +1, to ensure that
data is shown in CET. Without the correct setting here the data may not be displayed
as you expected. Data will still be stored in datafiles in GMT, but not displayed in the
users applicable timezone.
Ticks may be logged to text files. They are logged to C:\Program
Files\Atrader\TickHistory. Do not select this unless necessary as this will induce a
performance hit especially when monitoring large quoteboards.
Write Ticks Ticks Log All Ticks are logged as they arrive in a generic file.
Write Individual Tick Logs. All ticks are written to an individual file to each security.
Write profile Logs. The profiles are logged in a text format for perusal offline.
One can also specify the number of days to download for each historical backfill. The
chosen provider must support this backfill.
NOTE Some setting require a restart of ATRADER, others are active immediately. If
you don’t see the desired effect then please restart the program.
2.4 Configure DataFeed.
The datafeed type can be changed after installation and initial setup using the Setup/
Data Providers function.
NOTE ATRADER must be restarted in order to work correctly after data providers
are changed.
ATRADER should also use different workspace types after the new data vendor has
been configured as each workspace type is vendor specific. That is if you load a
TRANSACT workspace it will not work with a IB workspace.
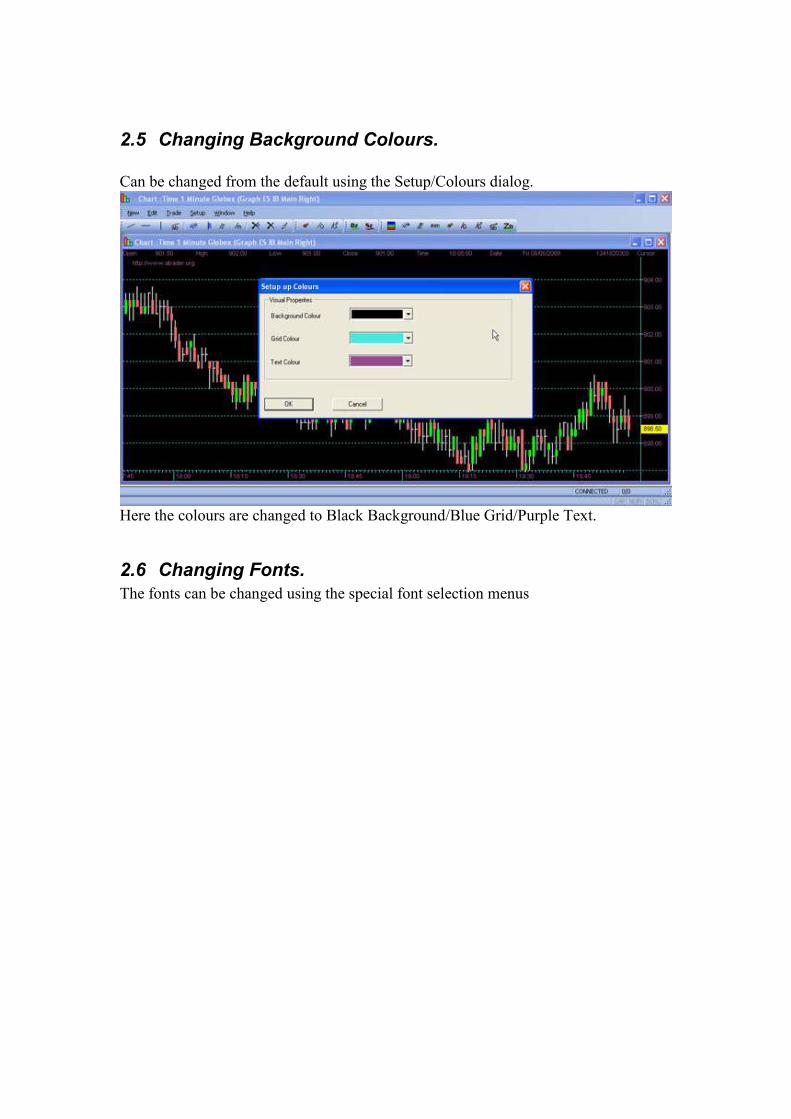
2.5 Changing Background Colours.
Can be changed from the default using the Setup/Colours dialog.
Here the colours are changed to Black Background/Blue Grid/Purple Text.
2.6 Changing Fonts.
The fonts can be changed using the special font selection menus
3 Creating a first Chart.
3.1 Workspace Overview
ATRADER has a number of window types.
Ticker Chart (Intraday).
Daily Chart
Time And Sales
Quoteboard
Streaming News.
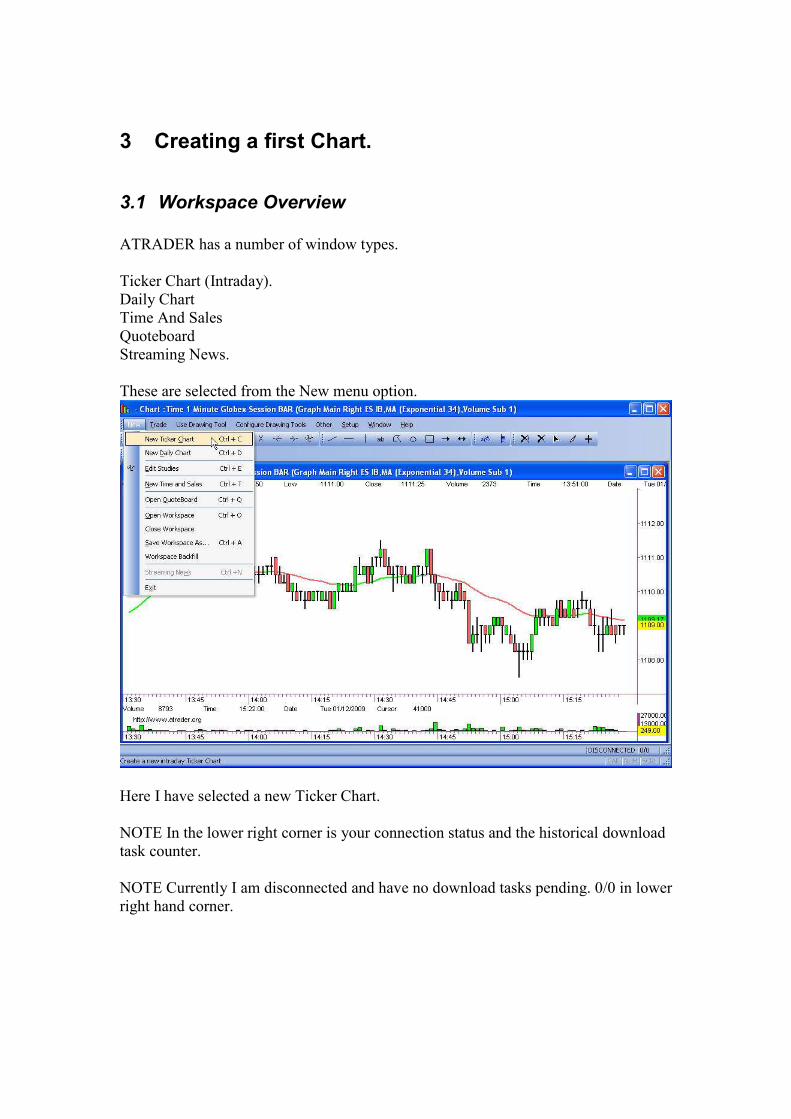
These are selected from the New menu option.
Here I have selected a new Ticker Chart.
NOTE In the lower right corner is your connection status and the historical download
task counter.
NOTE Currently I am disconnected and have no download tasks pending. 0/0 in lower
right hand corner.
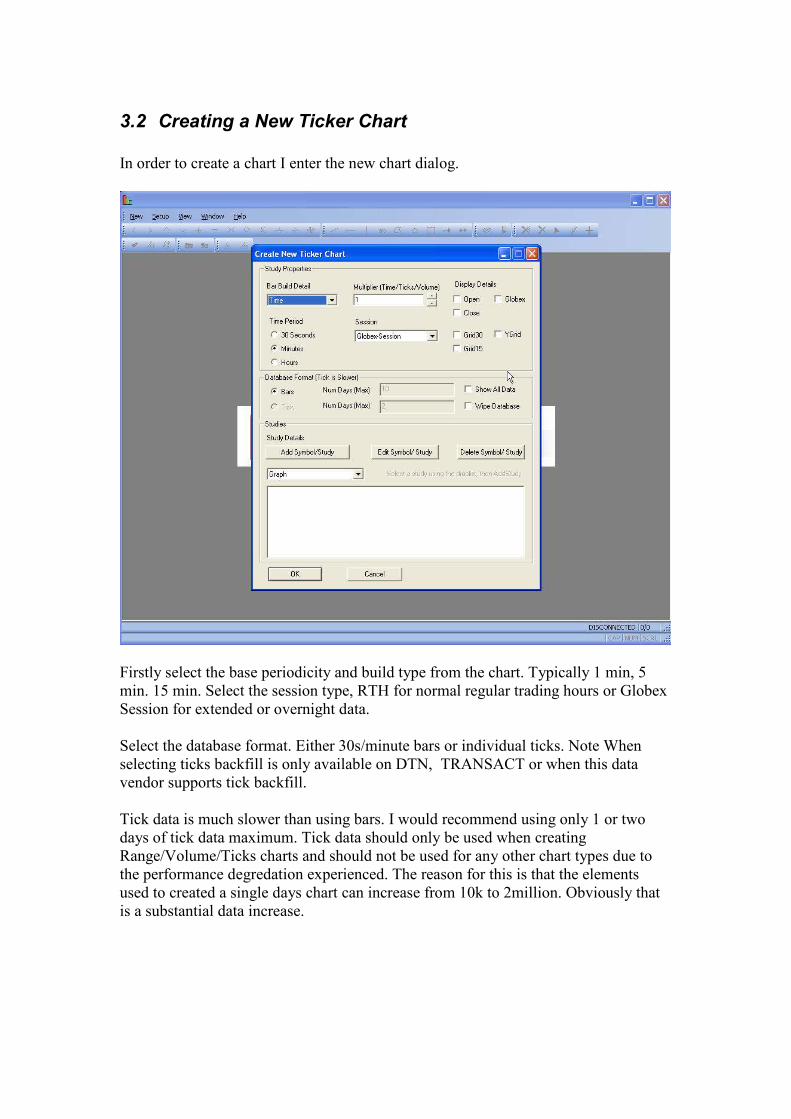
3.2 Creating a New Ticker Chart
In order to create a chart I enter the new chart dialog.
Firstly select the base periodicity and build type from the chart. Typically 1 min, 5
min. 15 min. Select the session type, RTH for normal regular trading hours or Globex
Session for extended or overnight data.
Select the database format. Either 30s/minute bars or individual ticks. Note When
selecting ticks backfill is only available on DTN, TRANSACT or when this data
vendor supports tick backfill.
Tick data is much slower than using bars. I would recommend using only 1 or two
days of tick data maximum. Tick data should only be used when creating
Range/Volume/Ticks charts and should not be used for any other chart types due to
the performance degredation experienced. The reason for this is that the elements
used to created a single days chart can increase from 10k to 2million. Obviously that
is a substantial data increase.
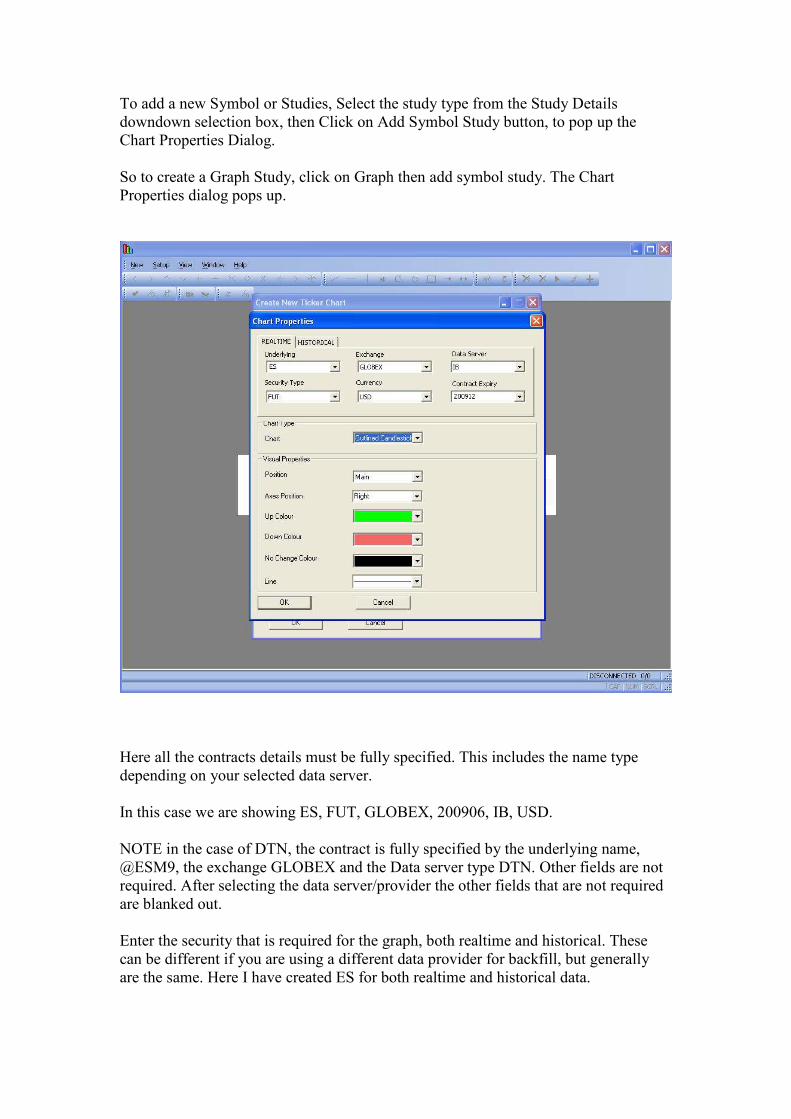
To add a new Symbol or Studies, Select the study type from the Study Details
downdown selection box, then Click on Add Symbol Study button, to pop up the
Chart Properties Dialog.
So to create a Graph Study, click on Graph then add symbol study. The Chart
Properties dialog pops up.
Here all the contracts details must be fully specified. This includes the name type
depending on your selected data server.
In this case we are showing ES, FUT, GLOBEX, 200906, IB, USD.
NOTE in the case of DTN, the contract is fully specified by the underlying name,
@ESM9, the exchange GLOBEX and the Data server type DTN. Other fields are not
required. After selecting the data server/provider the other fields that are not required
are blanked out.
Enter the security that is required for the graph, both realtime and historical. These
can be different if you are using a different data provider for backfill, but generally
are the same. Here I have created ES for both realtime and historical data.
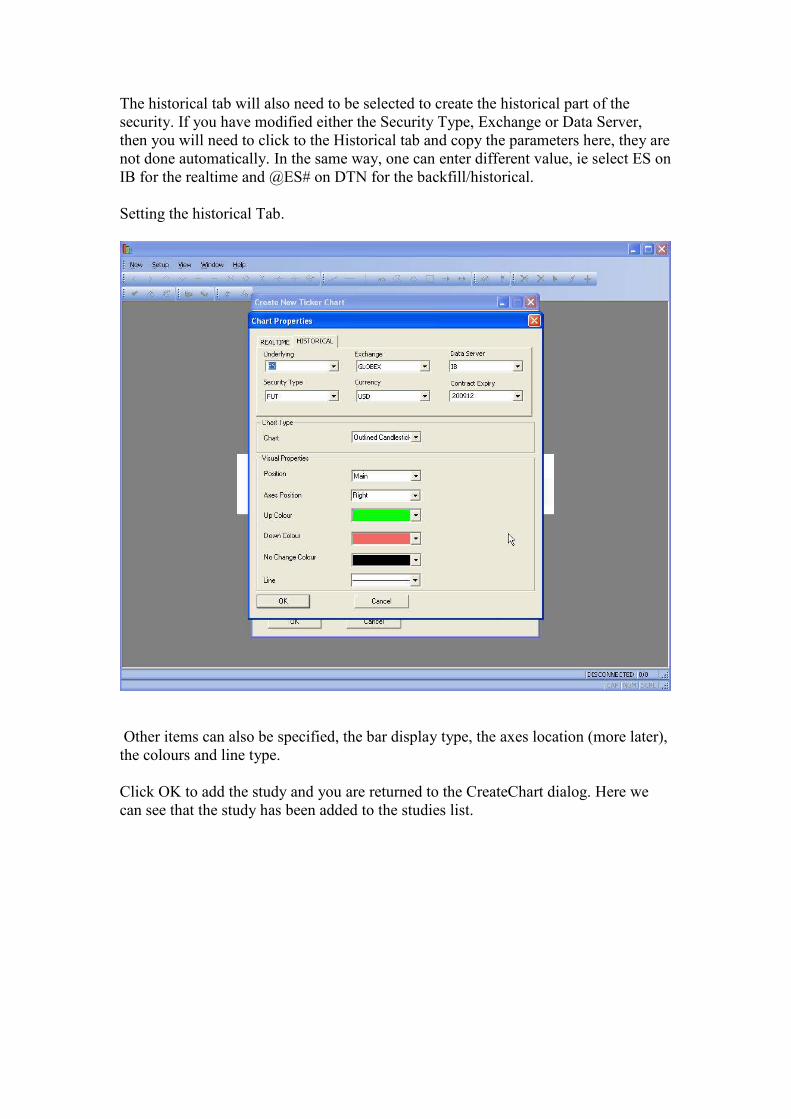
The historical tab will also need to be selected to create the historical part of the
security. If you have modified either the Security Type, Exchange or Data Server,
then you will need to click to the Historical tab and copy the parameters here, they are
not done automatically. In the same way, one can enter different value, ie select ES on
IB for the realtime and @ES# on DTN for the backfill/historical.
Setting the historical Tab.
Other items can also be specified, the bar display type, the axes location (more later),
the colours and line type.
Click OK to add the study and you are returned to the CreateChart dialog. Here we
can see that the study has been added to the studies list.
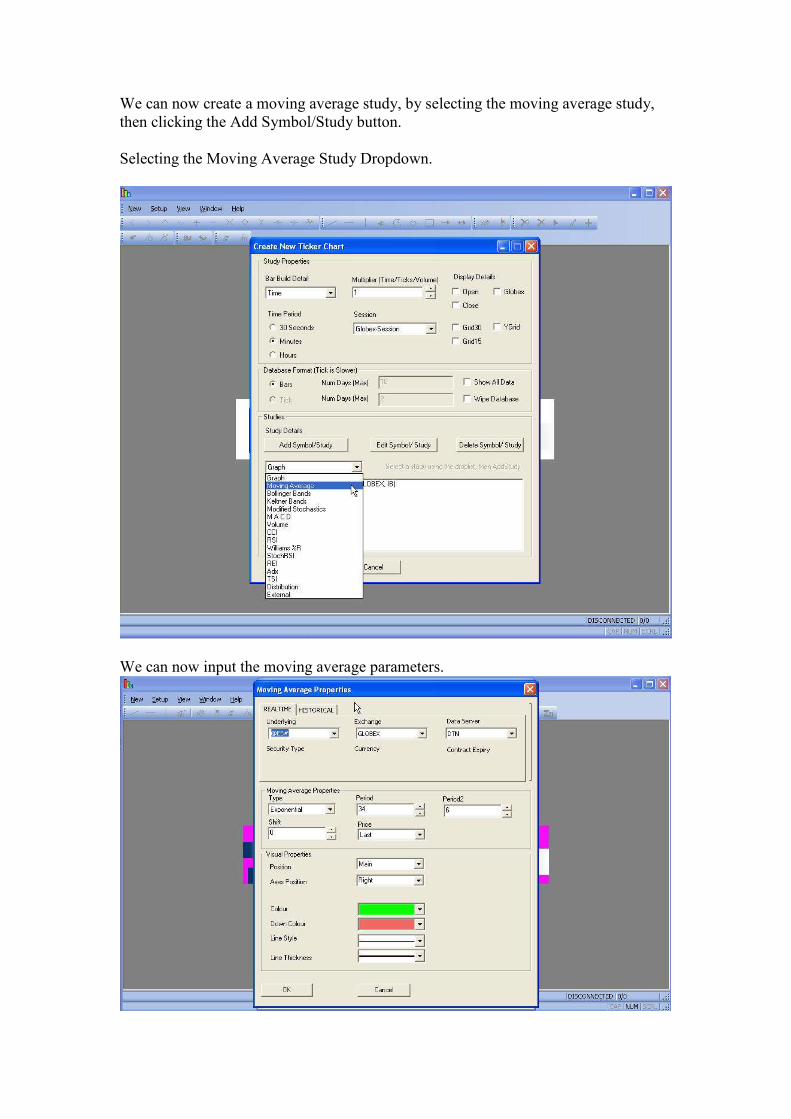
We can now create a moving average study, by selecting the moving average study,
then clicking the Add Symbol/Study button.
Selecting the Moving Average Study Dropdown.
We can now input the moving average parameters.
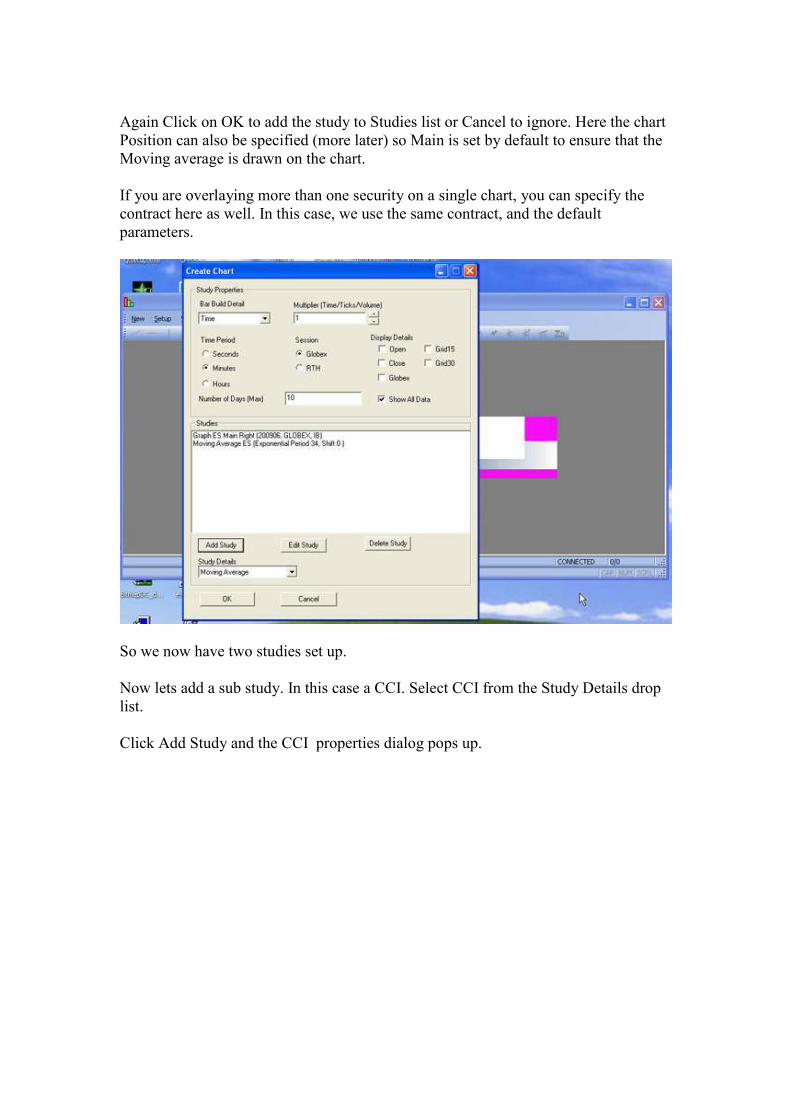
Again Click on OK to add the study to Studies list or Cancel to ignore. Here the chart
Position can also be specified (more later) so Main is set by default to ensure that the
Moving average is drawn on the chart.
If you are overlaying more than one security on a single chart, you can specify the
contract here as well. In this case, we use the same contract, and the default
parameters.
So we now have two studies set up.
Now lets add a sub study. In this case a CCI. Select CCI from the Study Details drop
list.
Click Add Study and the CCI properties dialog pops up.
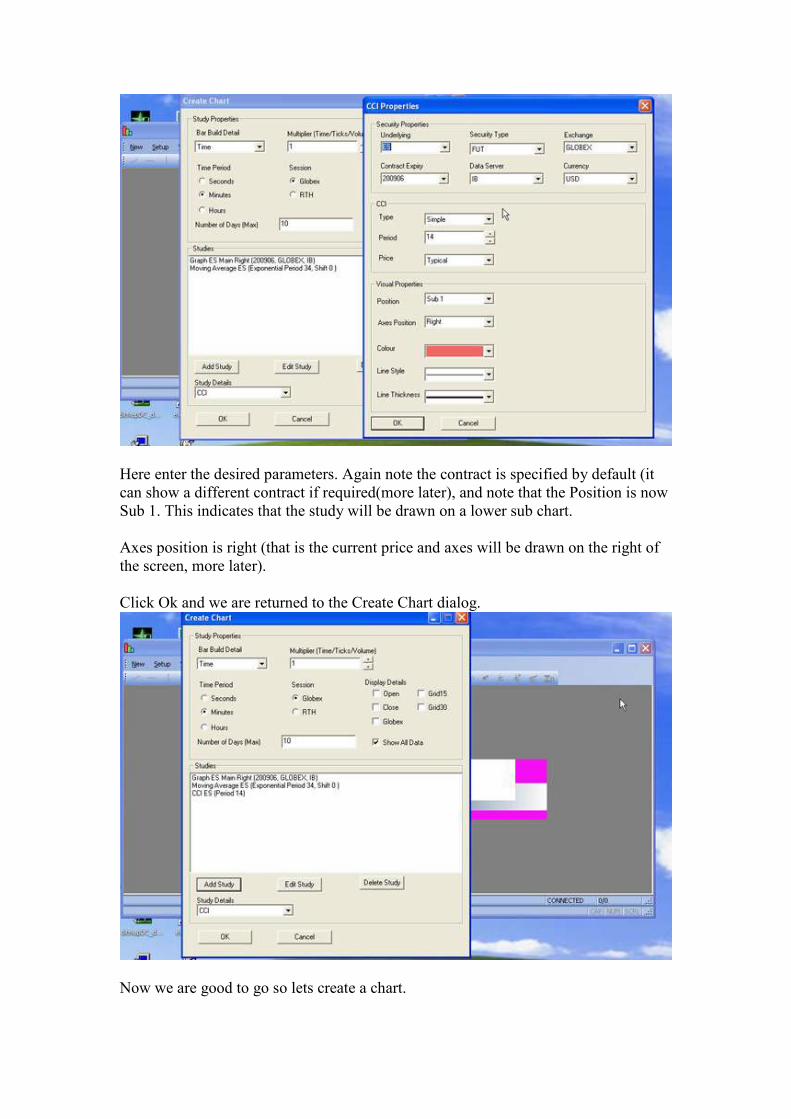
Here enter the desired parameters. Again note the contract is specified by default (it
can show a different contract if required(more later), and note that the Position is now
Sub 1. This indicates that the study will be drawn on a lower sub chart.
Axes position is right (that is the current price and axes will be drawn on the right of
the screen, more later).
Click Ok and we are returned to the Create Chart dialog.
Now we are good to go so lets create a chart.

Click on OK and the chart will load.
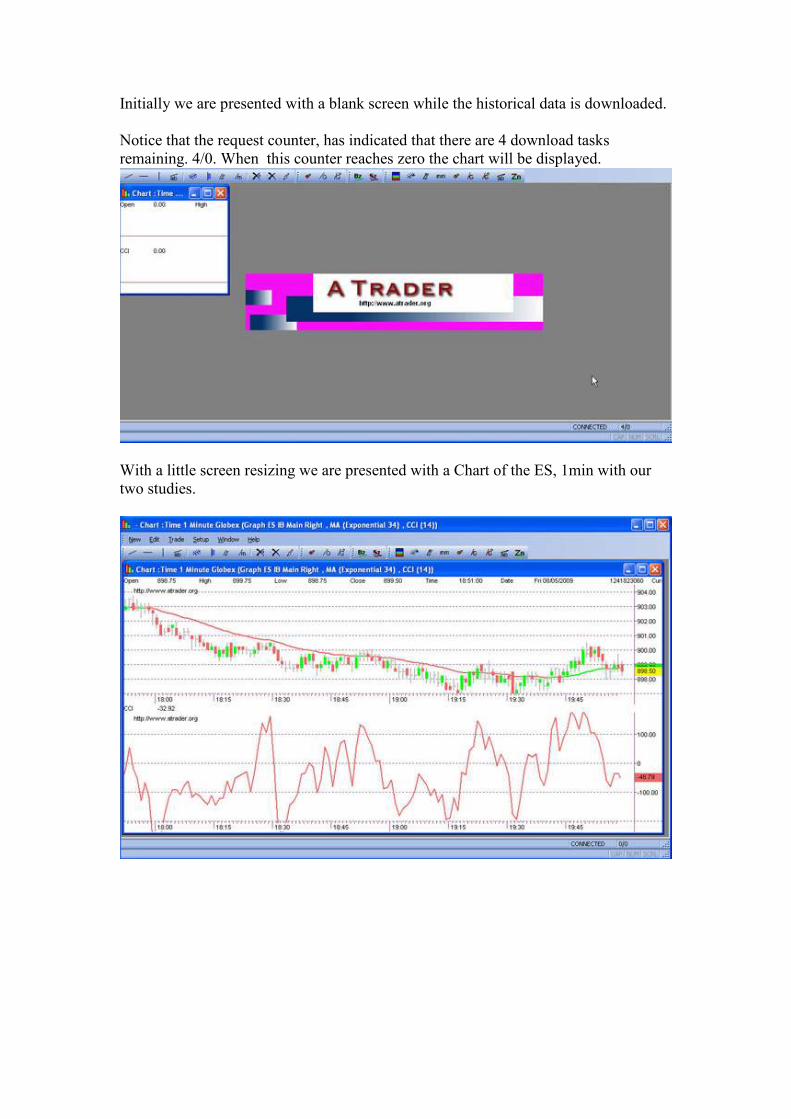
Initially we are presented with a blank screen while the historical data is downloaded.
Notice that the request counter, has indicated that there are 4 download tasks
remaining. 4/0. When this counter reaches zero the chart will be displayed.
With a little screen resizing we are presented with a Chart of the ES, 1min with our
two studies.
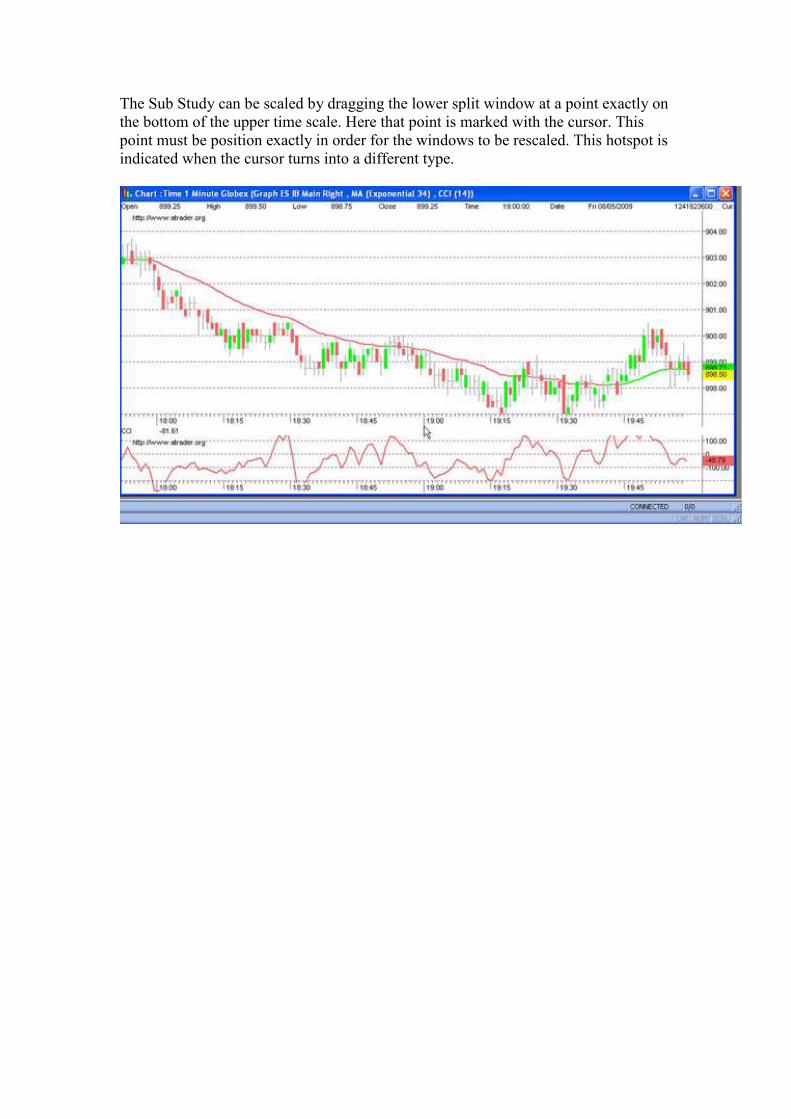
The Sub Study can be scaled by dragging the lower split window at a point exactly on
the bottom of the upper time scale. Here that point is marked with the cursor. This
point must be position exactly in order for the windows to be rescaled. This hotspot is
indicated when the cursor turns into a different type.
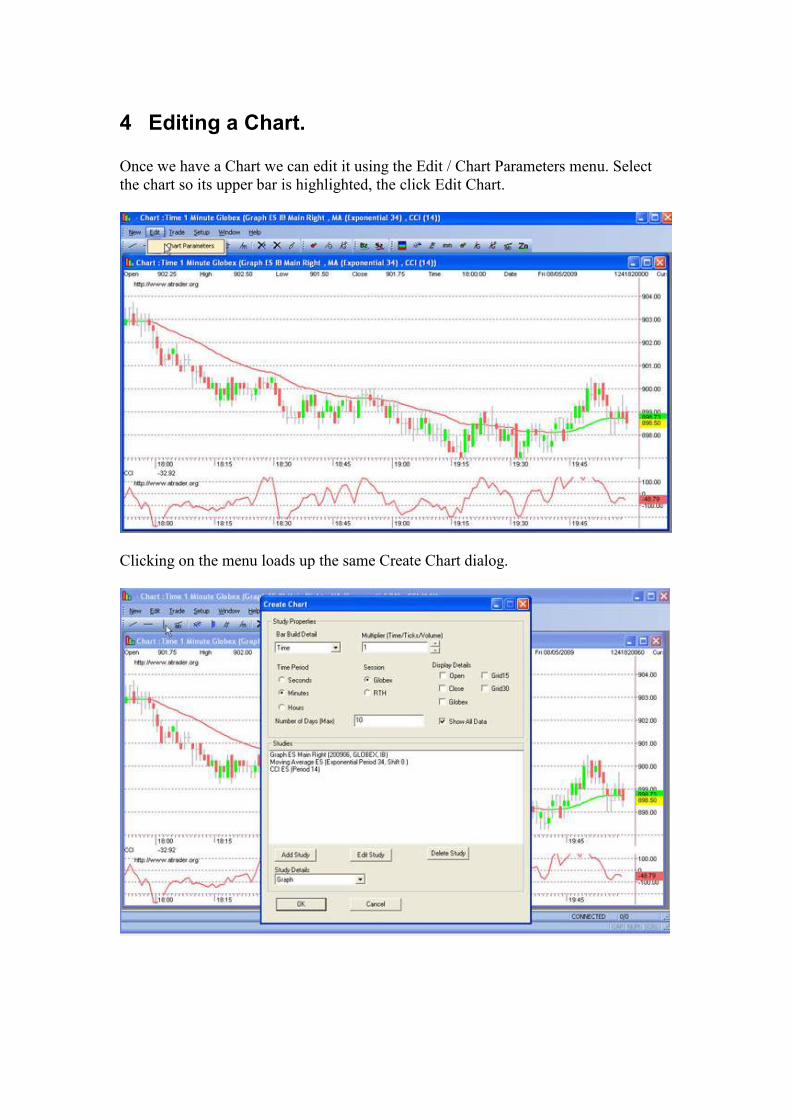
4 Editing a Chart.
Once we have a Chart we can edit it using the Edit / Chart Parameters menu. Select
the chart so its upper bar is highlighted, the click Edit Chart.
Clicking on the menu loads up the same Create Chart dialog.
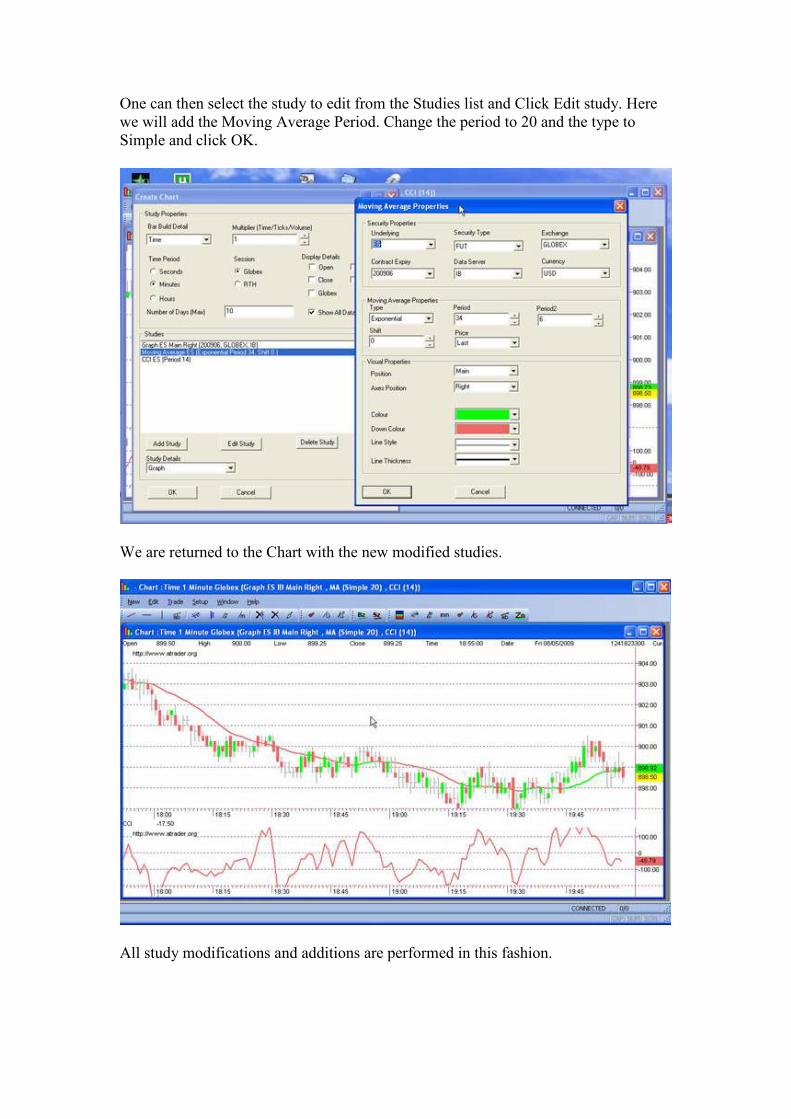
One can then select the study to edit from the Studies list and Click Edit study. Here
we will add the Moving Average Period. Change the period to 20 and the type to
Simple and click OK.
We are returned to the Chart with the new modified studies.
All study modifications and additions are performed in this fashion.
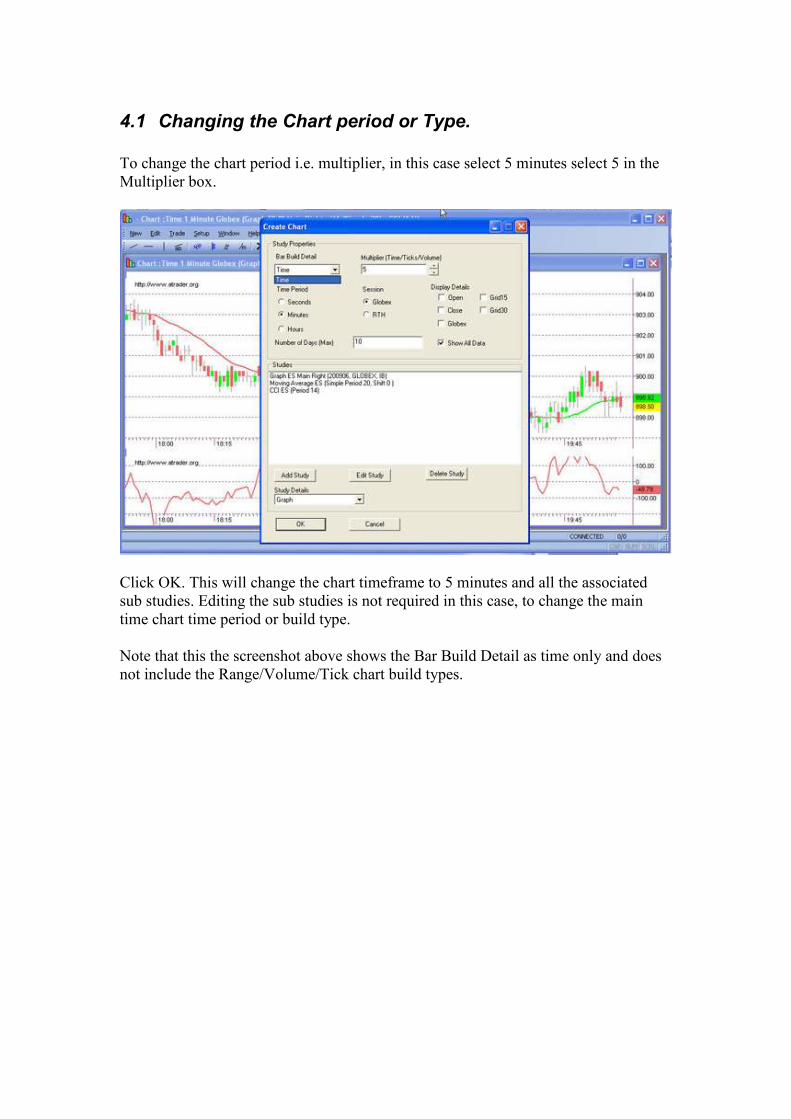
4.1 Changing the Chart period or Type.
To change the chart period i.e. multiplier, in this case select 5 minutes select 5 in the
Multiplier box.
Click OK. This will change the chart timeframe to 5 minutes and all the associated
sub studies. Editing the sub studies is not required in this case, to change the main
time chart time period or build type.
Note that this the screenshot above shows the Bar Build Detail as time only and does
not include the Range/Volume/Tick chart build types.
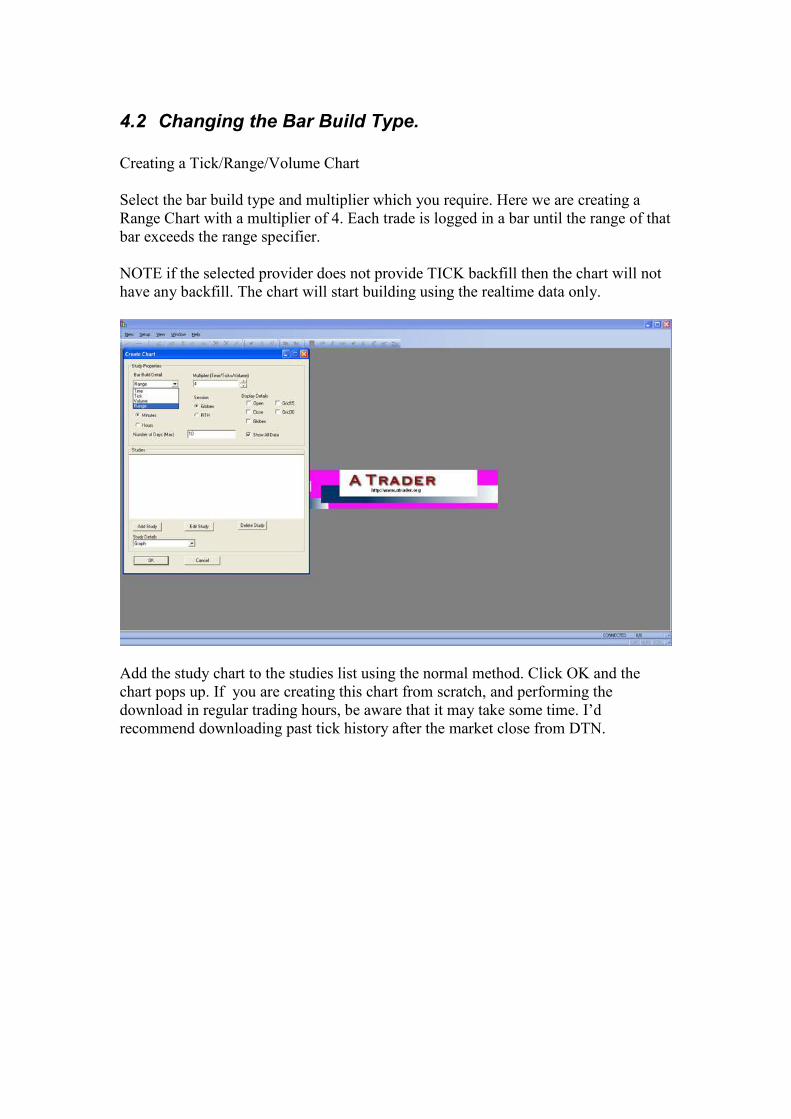
4.2 Changing the Bar Build Type.
Creating a Tick/Range/Volume Chart
Select the bar build type and multiplier which you require. Here we are creating a
Range Chart with a multiplier of 4. Each trade is logged in a bar until the range of that
bar exceeds the range specifier.
NOTE if the selected provider does not provide TICK backfill then the chart will not
have any backfill. The chart will start building using the realtime data only.
Add the study chart to the studies list using the normal method. Click OK and the
chart pops up. If you are creating this chart from scratch, and performing the
download in regular trading hours, be aware that it may take some time. I’d
recommend downloading past tick history after the market close from DTN.
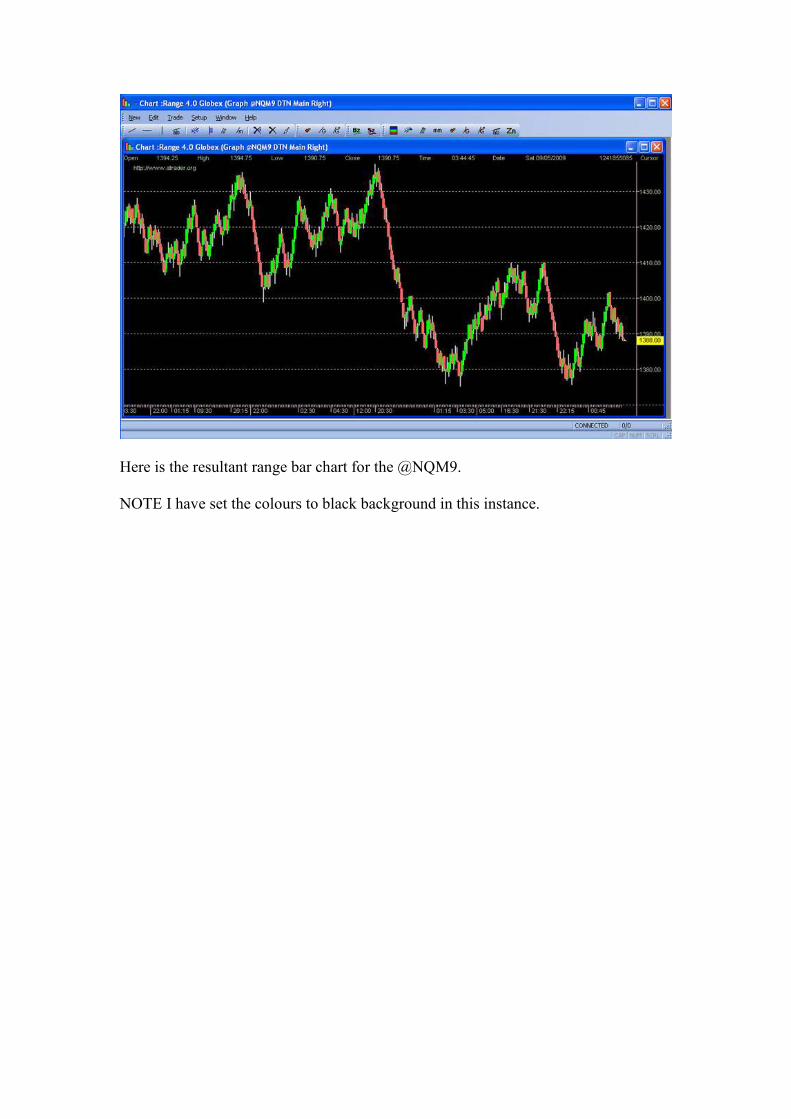
Here is the resultant range bar chart for the @NQM9.
NOTE I have set the colours to black background in this instance.
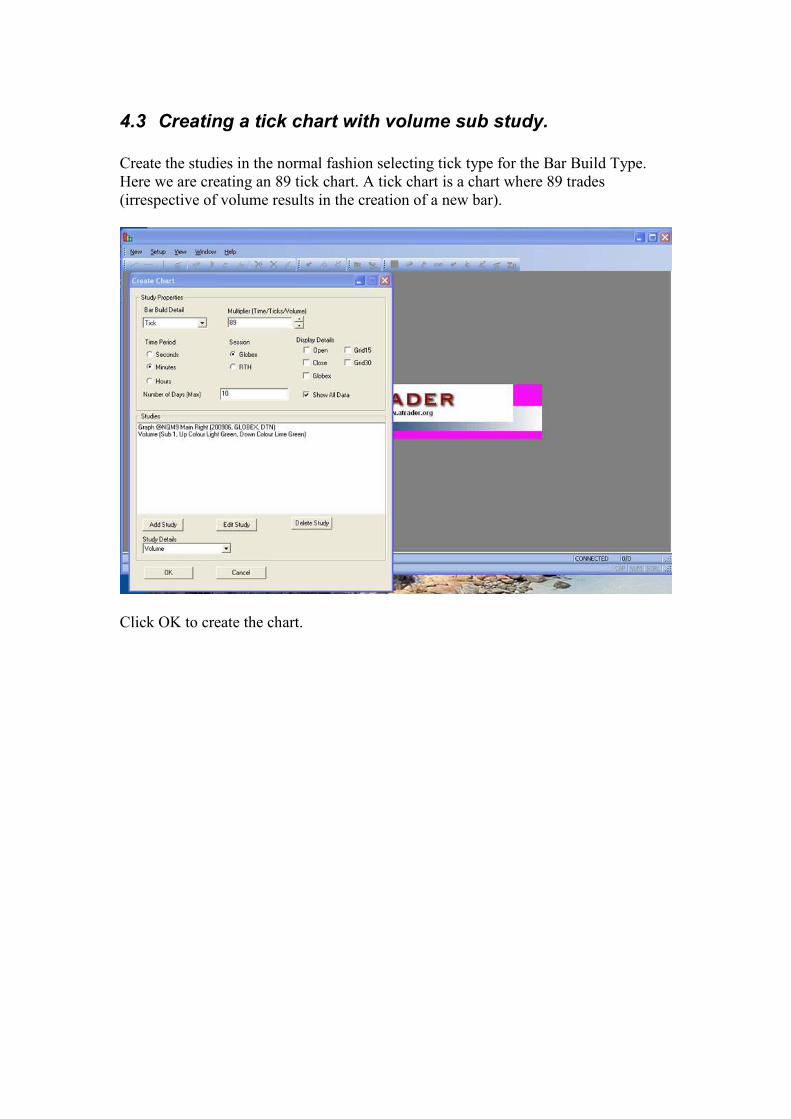
4.3 Creating a tick chart with volume sub study.
Create the studies in the normal fashion selecting tick type for the Bar Build Type.
Here we are creating an 89 tick chart. A tick chart is a chart where 89 trades
(irrespective of volume results in the creation of a new bar).
Click OK to create the chart.
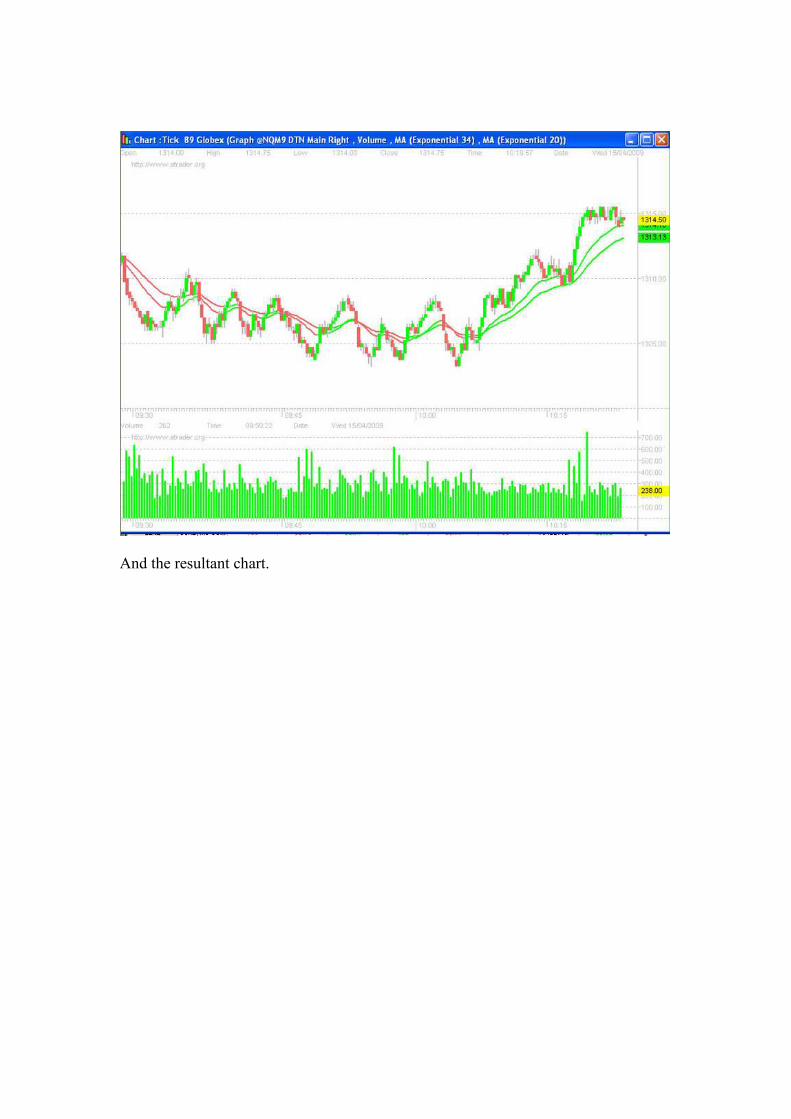
And the resultant chart.
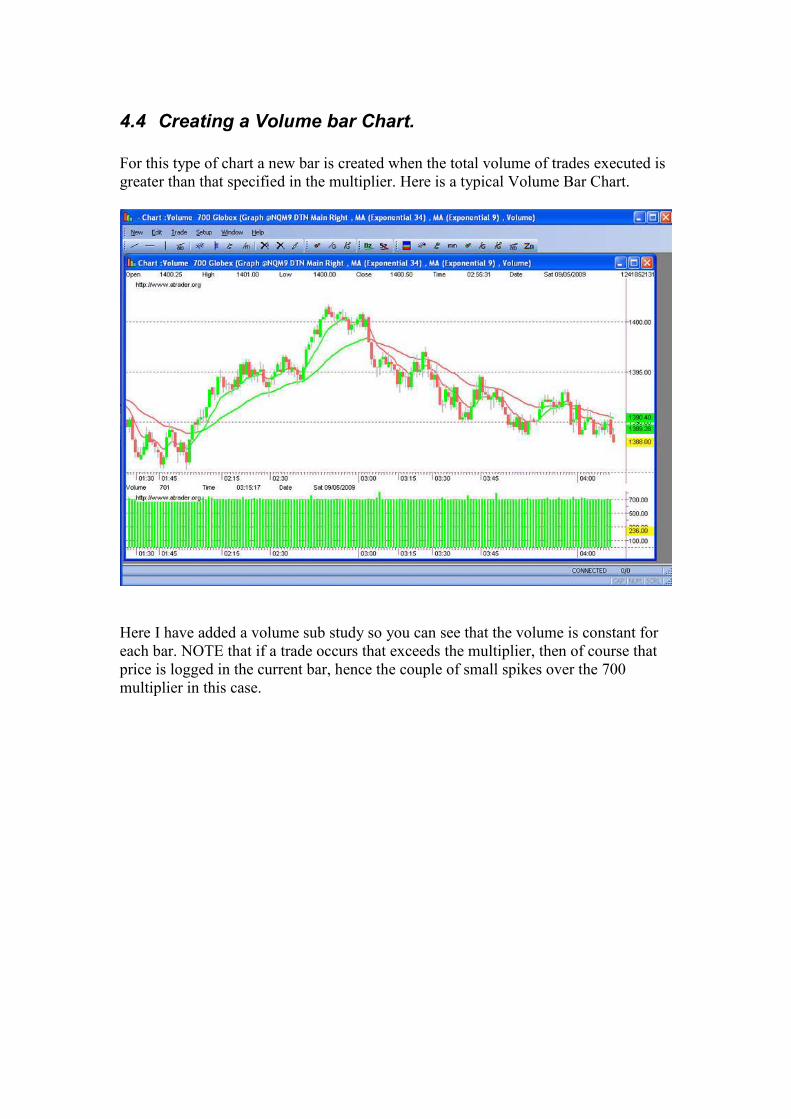
4.4 Creating a Volume bar Chart.
For this type of chart a new bar is created when the total volume of trades executed is
greater than that specified in the multiplier. Here is a typical Volume Bar Chart.
Here I have added a volume sub study so you can see that the volume is constant for
each bar. NOTE that if a trade occurs that exceeds the multiplier, then of course that
price is logged in the current bar, hence the couple of small spikes over the 700
multiplier in this case.
5 Chart Rescaling
The Charts can be sized and rescaled using the onscreen Chart Navigation Toolbar or
using the Hot Keys.
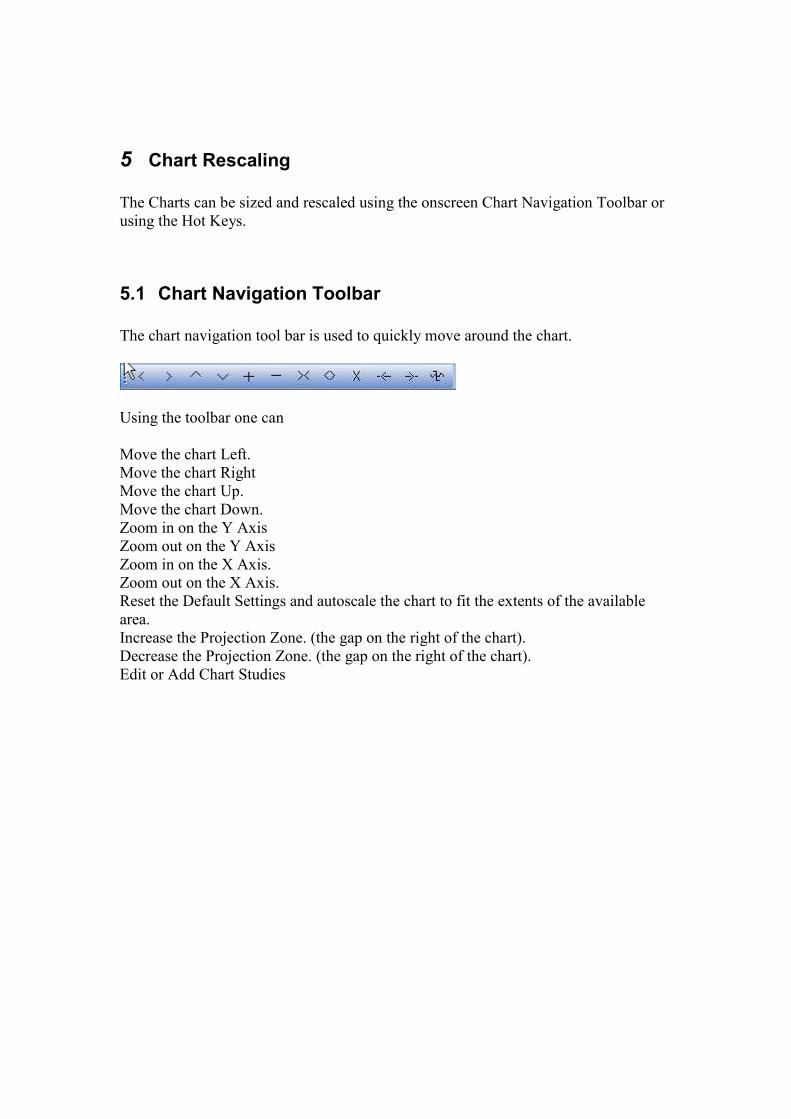
5.1 Chart Navigation Toolbar
The chart navigation tool bar is used to quickly move around the chart.
Using the toolbar one can
Move the chart Left.
Move the chart Right
Move the chart Up.
Move the chart Down.
Zoom in on the Y Axis
Zoom out on the Y Axis
Zoom in on the X Axis.
Zoom out on the X Axis.
Reset the Default Settings and autoscale the chart to fit the extents of the available
area.
Increase the Projection Zone. (the gap on the right of the chart).
Decrease the Projection Zone. (the gap on the right of the chart).
Edit or Add Chart Studies
5.2 Hot Keys
Hot keys are similar to the Chart Navigation Toolbar, but enabled quick movement
about the charts using s single keypress.
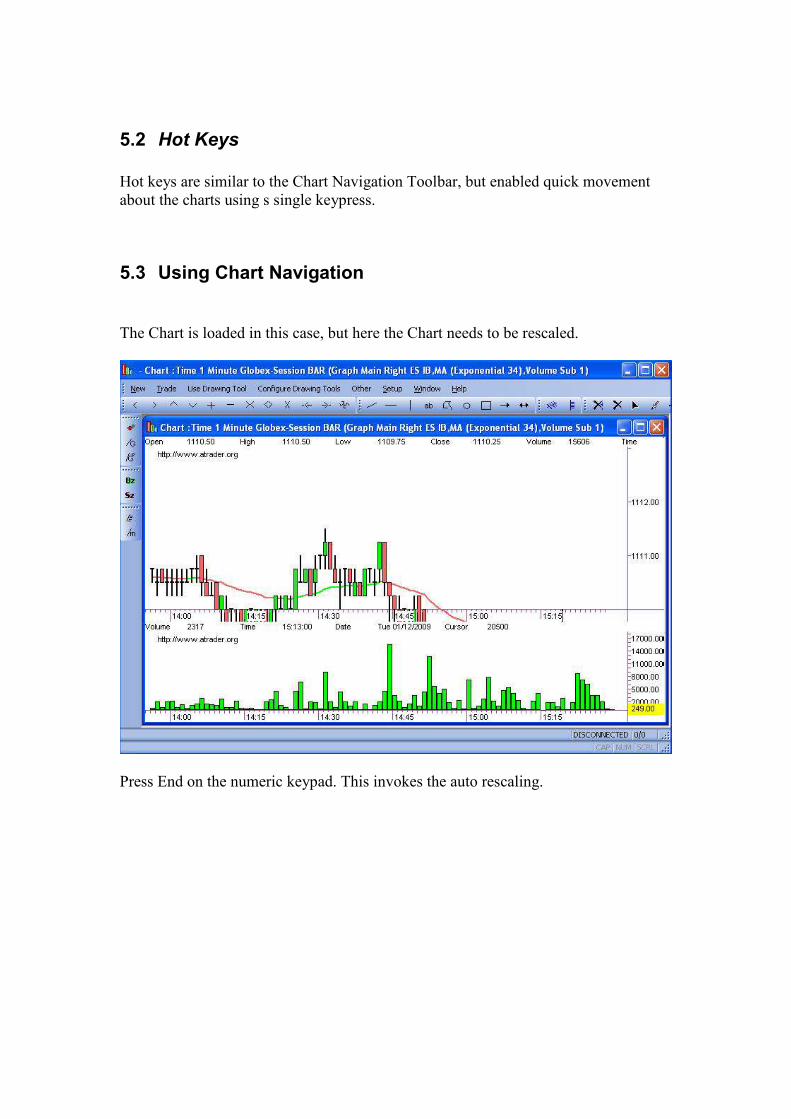
5.3 Using Chart Navigation
The Chart is loaded in this case, but here the Chart needs to be rescaled.
Press End on the numeric keypad. This invokes the auto rescaling.
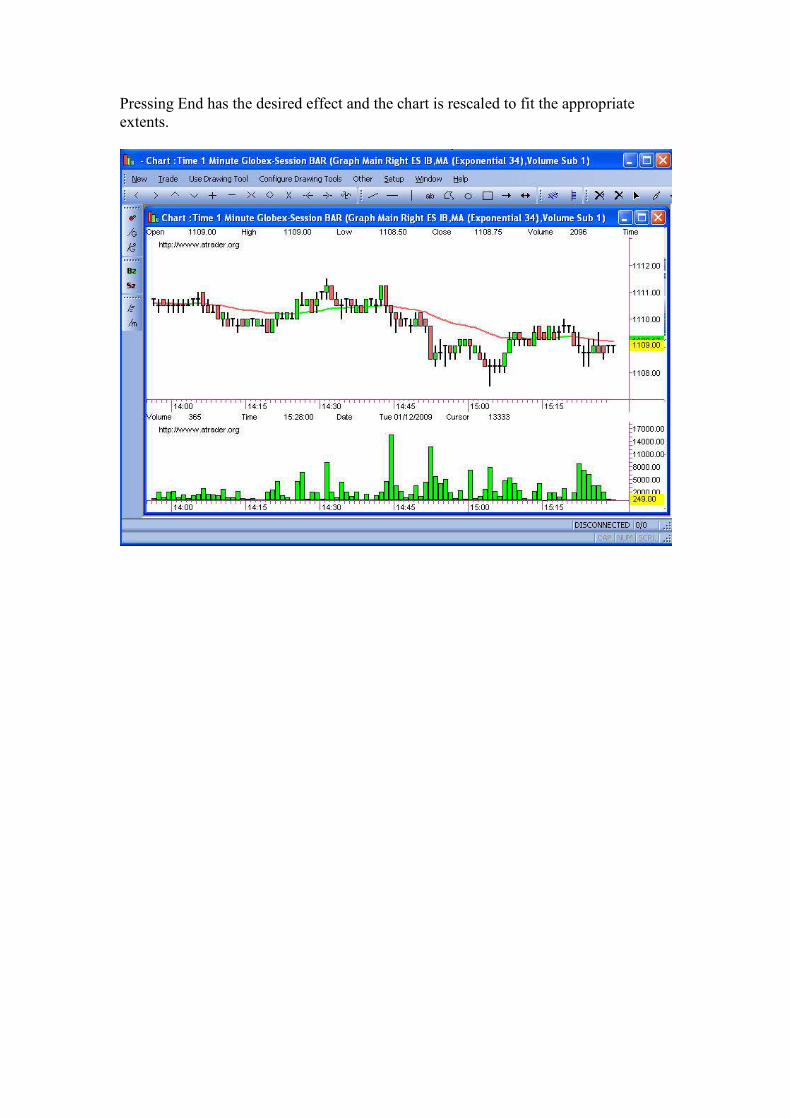
Pressing End has the desired effect and the chart is rescaled to fit the appropriate
extents.
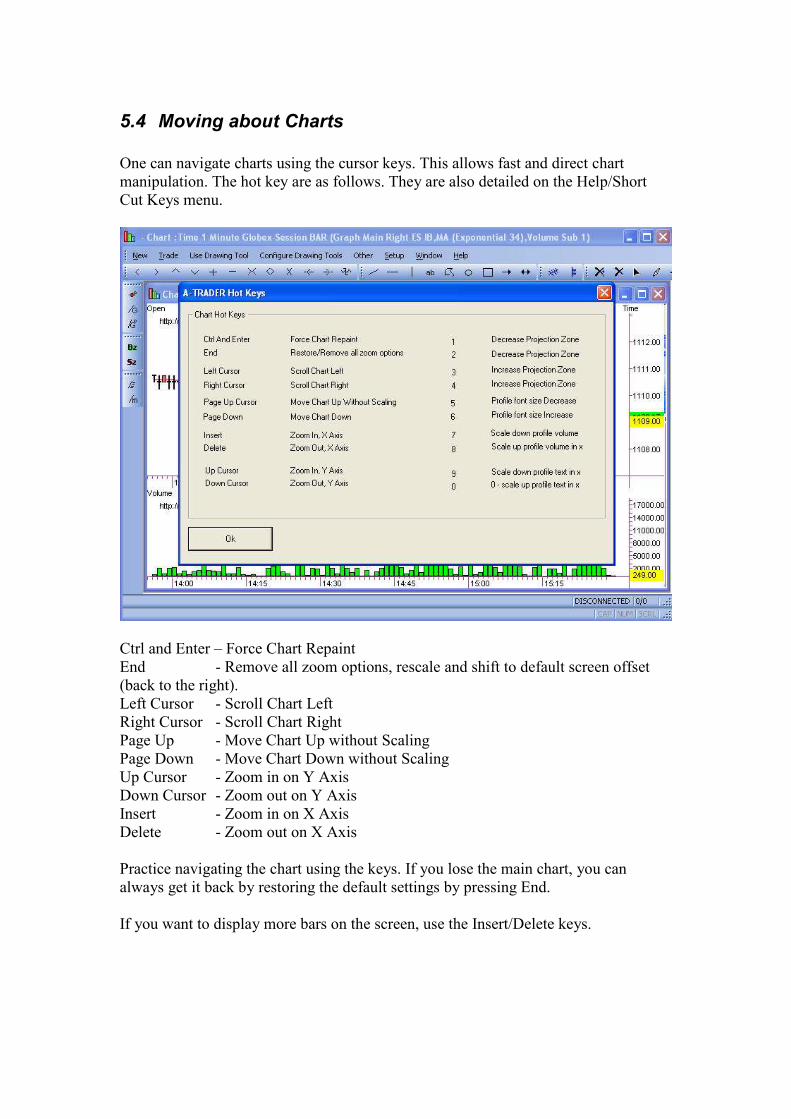
5.4 Moving about Charts
One can navigate charts using the cursor keys. This allows fast and direct chart
manipulation. The hot key are as follows. They are also detailed on the Help/Short
Cut Keys menu.
Ctrl and Enter – Force Chart Repaint
End - Remove all zoom options, rescale and shift to default screen offset
(back to the right).
Left Cursor - Scroll Chart Left
Right Cursor - Scroll Chart Right
Page Up - Move Chart Up without Scaling
Page Down - Move Chart Down without Scaling
Up Cursor - Zoom in on Y Axis
Down Cursor - Zoom out on Y Axis
Insert - Zoom in on X Axis
Delete - Zoom out on X Axis
Practice navigating the chart using the keys. If you lose the main chart, you can
always get it back by restoring the default settings by pressing End.
If you want to display more bars on the screen, use the Insert/Delete keys.
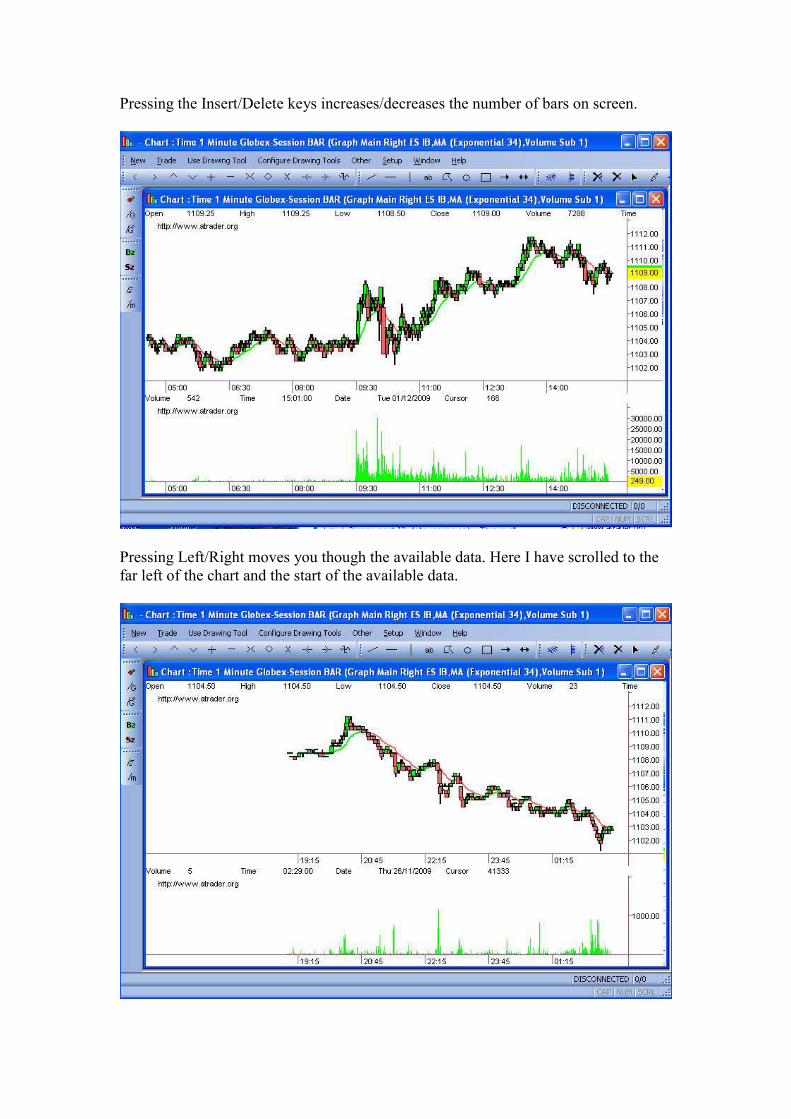
Pressing the Insert/Delete keys increases/decreases the number of bars on screen.
Pressing Left/Right moves you though the available data. Here I have scrolled to the
far left of the chart and the start of the available data.

Press end to restore the original view and current price.
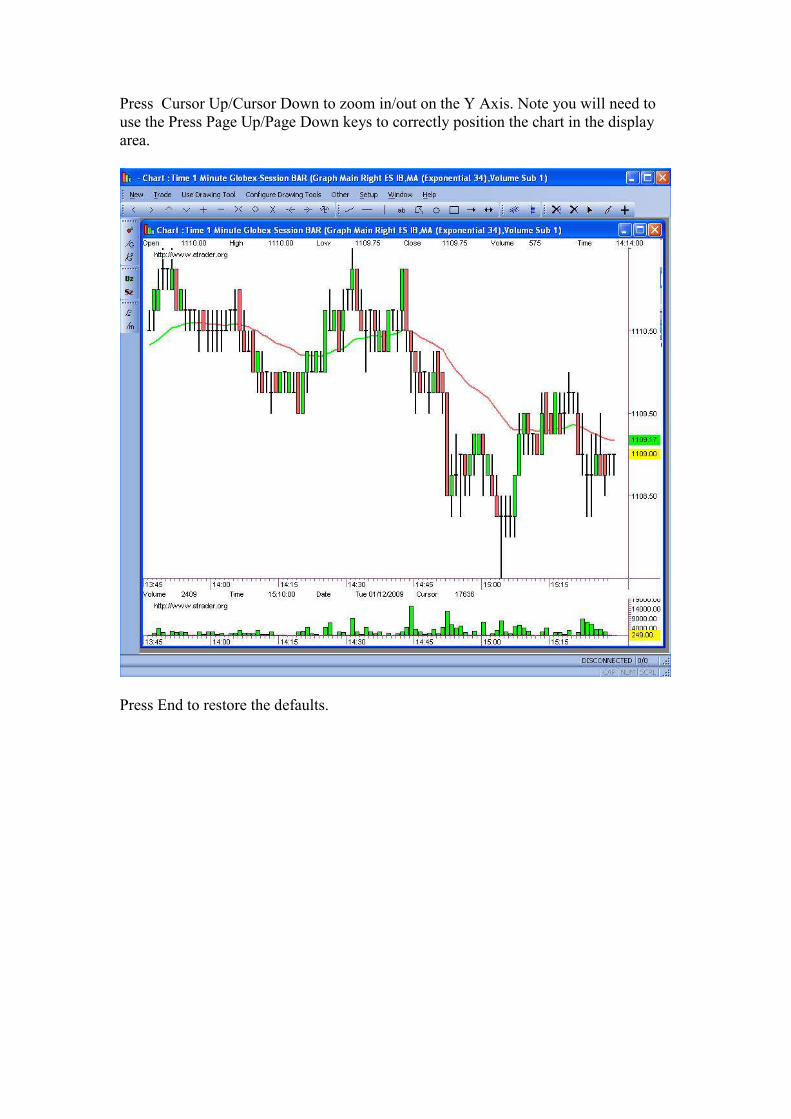
Press Cursor Up/Cursor Down to zoom in/out on the Y Axis. Note you will need to
use the Press Page Up/Page Down keys to correctly position the chart in the display
area.
Press End to restore the defaults.
6 More Advanced Charts.
6.1 Creating a multiple Symbol Chart.
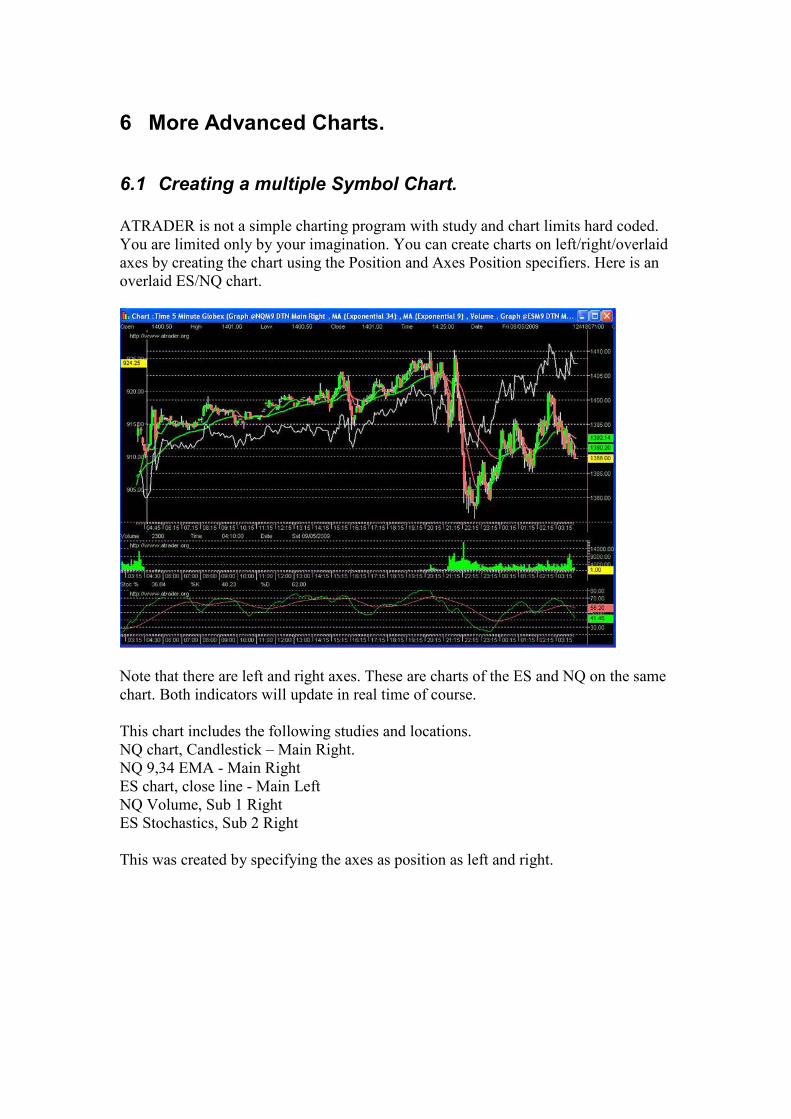
ATRADER is not a simple charting program with study and chart limits hard coded.
You are limited only by your imagination. You can create charts on left/right/overlaid
axes by creating the chart using the Position and Axes Position specifiers. Here is an
overlaid ES/NQ chart.
Note that there are left and right axes. These are charts of the ES and NQ on the same
chart. Both indicators will update in real time of course.
This chart includes the following studies and locations.
NQ chart, Candlestick – Main Right.
NQ 9,34 EMA - Main Right
ES chart, close line - Main Left
NQ Volume, Sub 1 Right
ES Stochastics, Sub 2 Right
This was created by specifying the axes as position as left and right.
6.2 Axes Positions and Overlay Types
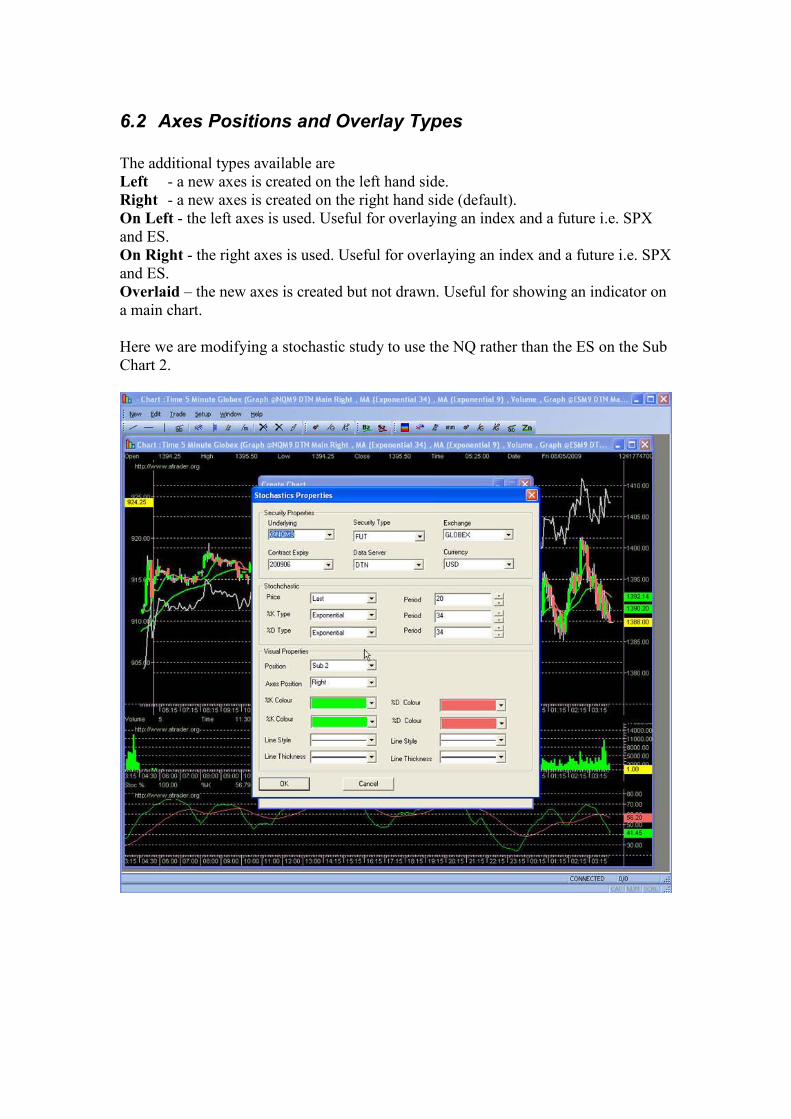
The additional types available are
Left - a new axes is created on the left hand side.
Right - a new axes is created on the right hand side (default).
On Left - the left axes is used. Useful for overlaying an index and a future i.e. SPX
and ES.
On Right - the right axes is used. Useful for overlaying an index and a future i.e. SPX
and ES.
Overlaid – the new axes is created but not drawn. Useful for showing an indicator on
a main chart.
Here we are modifying a stochastic study to use the NQ rather than the ES on the Sub
Chart 2.
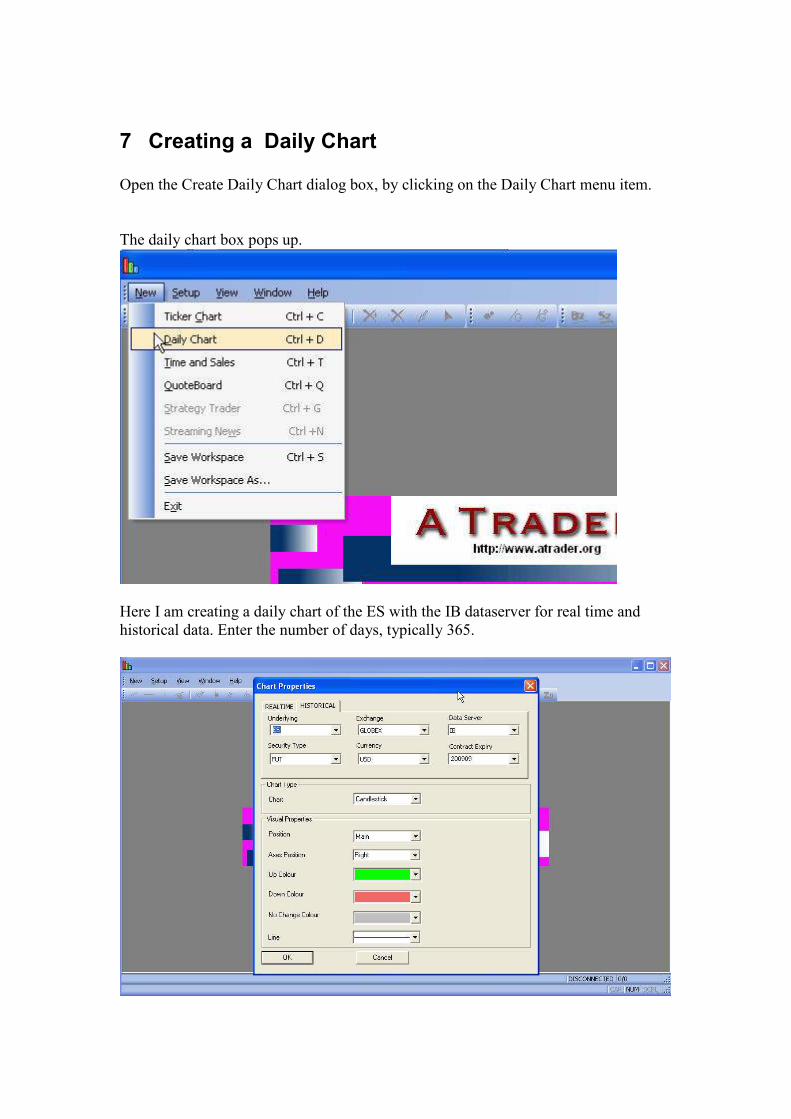
7 Creating a Daily Chart
Open the Create Daily Chart dialog box, by clicking on the Daily Chart menu item.
The daily chart box pops up.
Here I am creating a daily chart of the ES with the IB dataserver for real time and
historical data. Enter the number of days, typically 365.
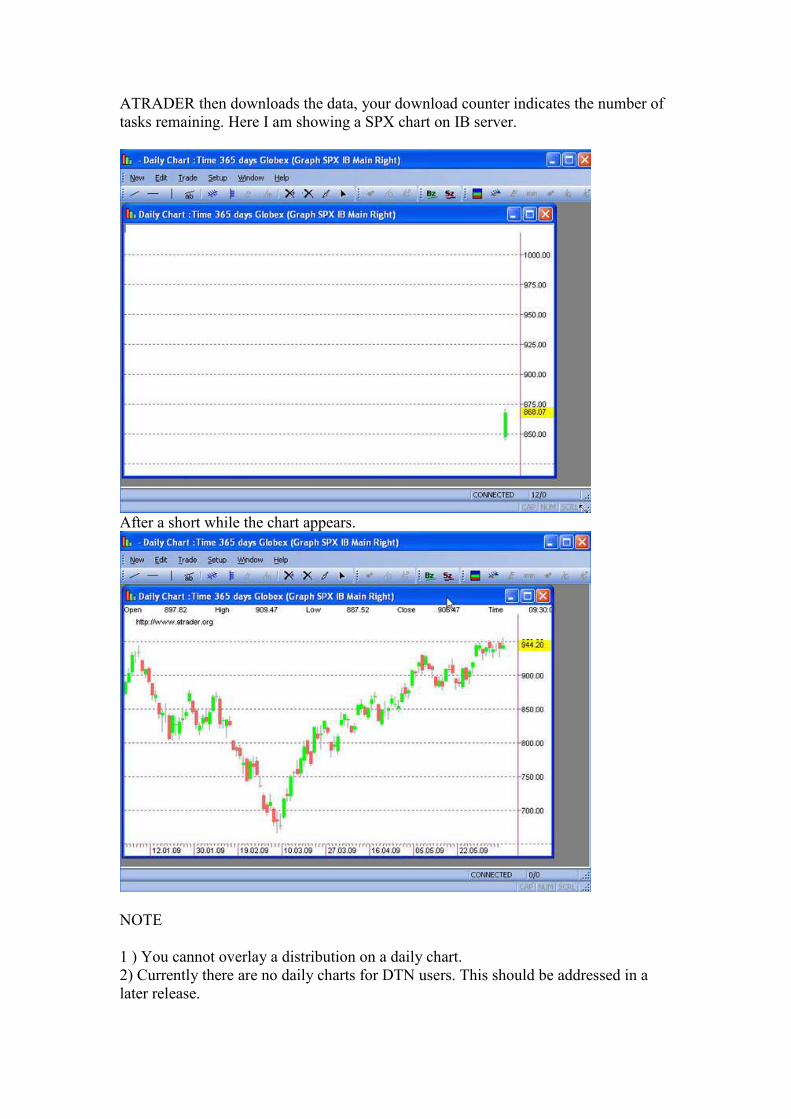
ATRADER then downloads the data, your download counter indicates the number of
tasks remaining. Here I am showing a SPX chart on IB server.
After a short while the chart appears.
NOTE
1 ) You cannot overlay a distribution on a daily chart.
2) Currently there are no daily charts for DTN users. This should be addressed in a
later release.
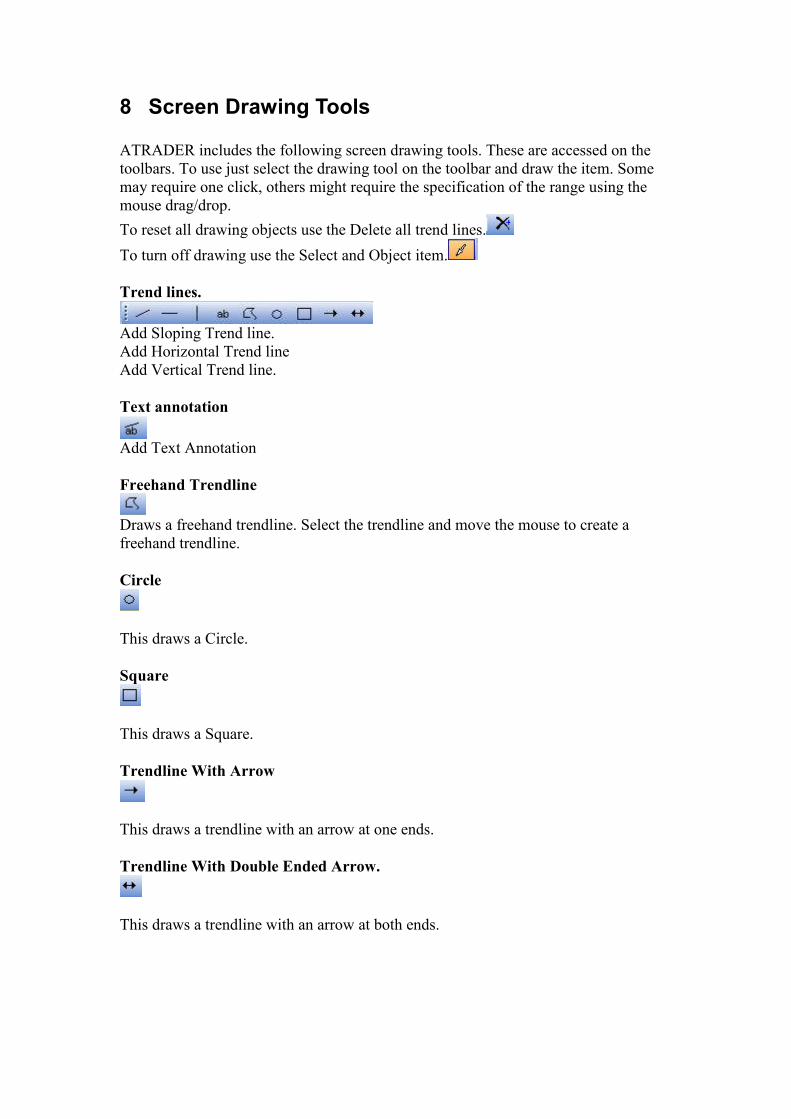
8 Screen Drawing Tools
ATRADER includes the following screen drawing tools. These are accessed on the
toolbars. To use just select the drawing tool on the toolbar and draw the item. Some
may require one click, others might require the specification of the range using the
mouse drag/drop.
To reset all drawing objects use the Delete all trend lines.
To turn off drawing use the Select and Object item.
Trend lines.
Add Sloping Trend line.
Add Horizontal Trend line
Add Vertical Trend line.
Text annotation
Add Text Annotation
Freehand Trendline
Draws a freehand trendline. Select the trendline and move the mouse to create a
freehand trendline.
Circle
This draws a Circle.
Square
This draws a Square.
Trendline With Arrow
This draws a trendline with an arrow at one ends.
Trendline With Double Ended Arrow.
This draws a trendline with an arrow at both ends.
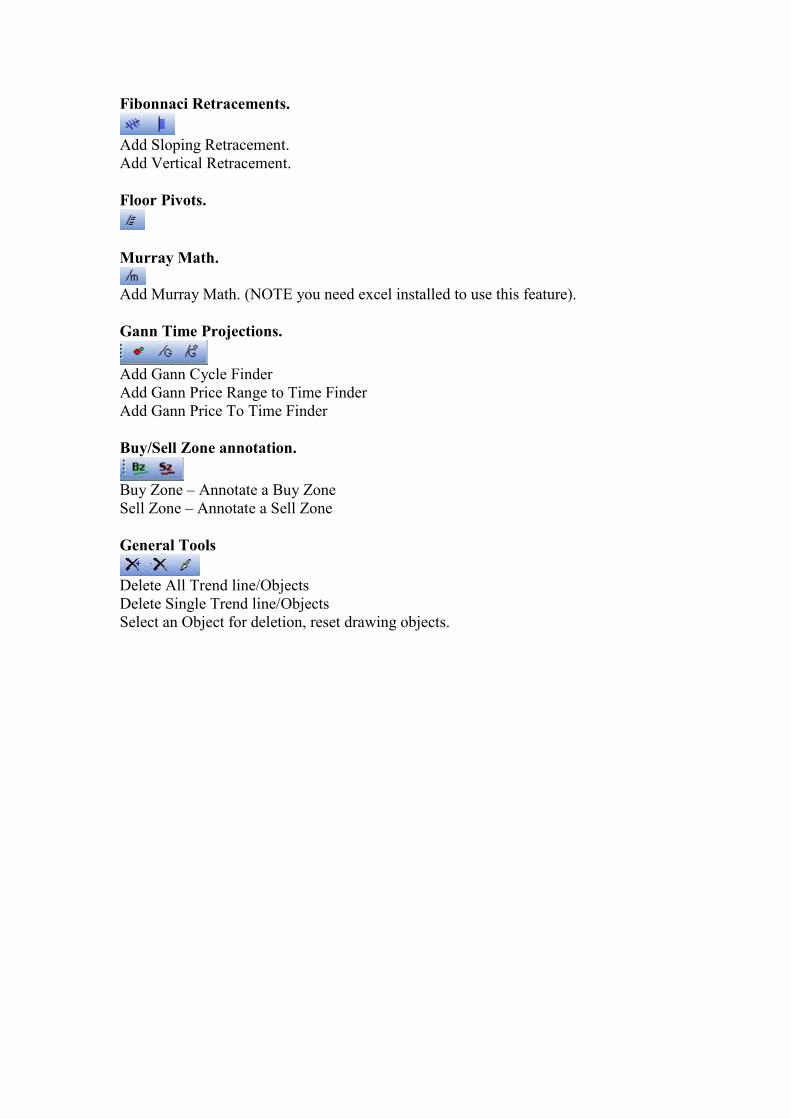
Fibonnaci Retracements.
Add Sloping Retracement.
Add Vertical Retracement.
Floor Pivots.
Murray Math.
Add Murray Math. (NOTE you need excel installed to use this feature).
Gann Time Projections.
Add Gann Cycle Finder
Add Gann Price Range to Time Finder
Add Gann Price To Time Finder
Buy/Sell Zone annotation.
Buy Zone – Annotate a Buy Zone
Sell Zone – Annotate a Sell Zone
General Tools
Delete All Trend line/Objects
Delete Single Trend line/Objects
Select an Object for deletion, reset drawing objects.
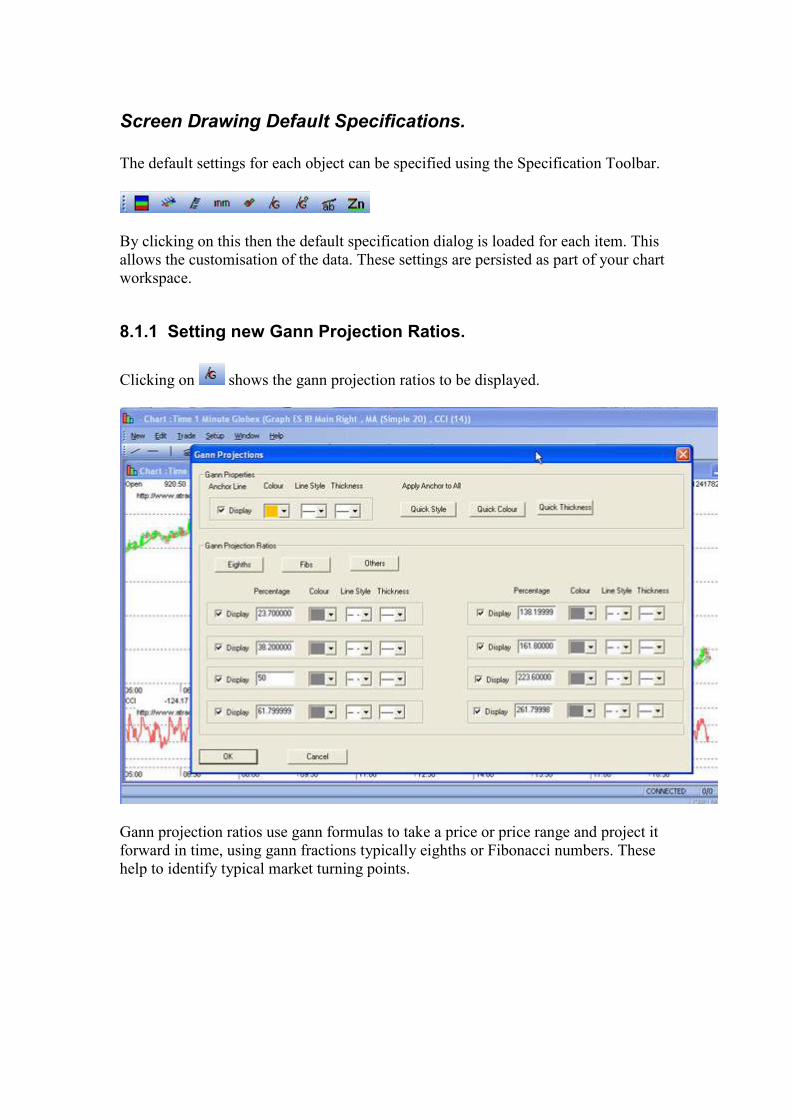
Screen Drawing Default Specifications.
The default settings for each object can be specified using the Specification Toolbar.
By clicking on this then the default specification dialog is loaded for each item. This
allows the customisation of the data. These settings are persisted as part of your chart
workspace.
8.1.1 Setting new Gann Projection Ratios.
Clicking on shows the gann projection ratios to be displayed.
Gann projection ratios use gann formulas to take a price or price range and project it
forward in time, using gann fractions typically eighths or Fibonacci numbers. These
help to identify typical market turning points.
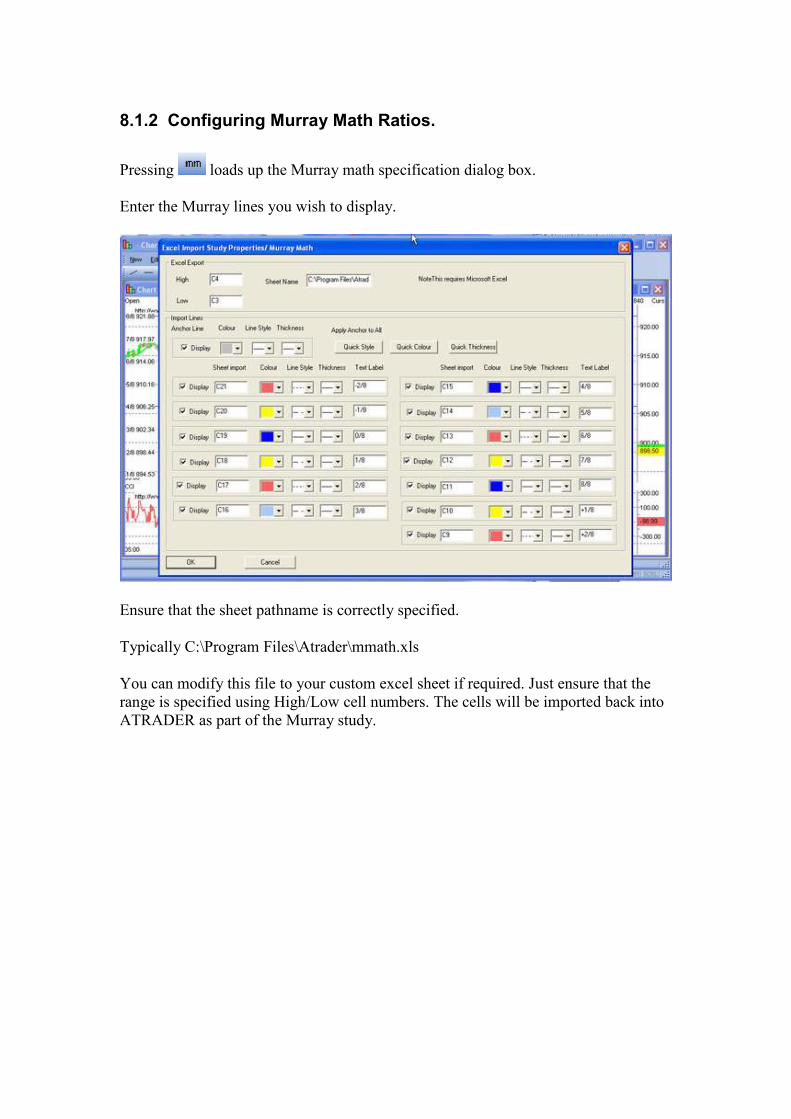
8.1.2 Configuring Murray Math Ratios.
Pressing loads up the Murray math specification dialog box.
Enter the Murray lines you wish to display.
Ensure that the sheet pathname is correctly specified.
Typically C:\Program Files\Atrader\mmath.xls
You can modify this file to your custom excel sheet if required. Just ensure that the
range is specified using High/Low cell numbers. The cells will be imported back into
ATRADER as part of the Murray study.
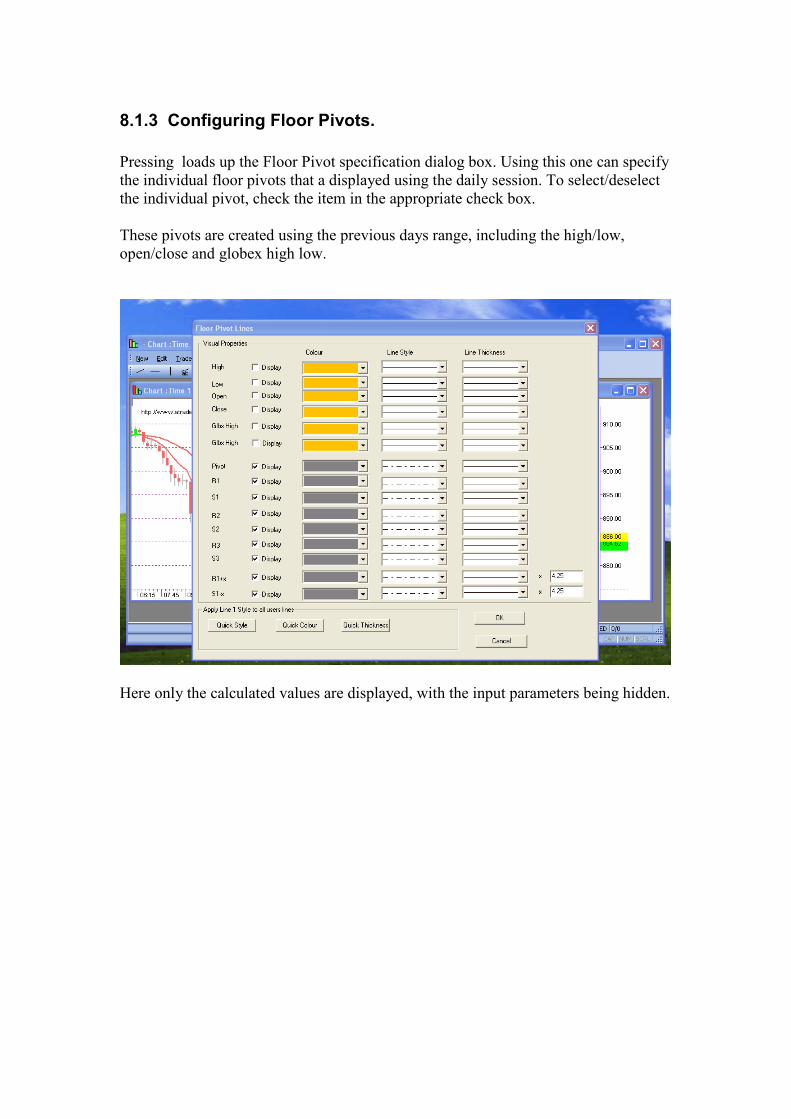
8.1.3 Configuring Floor Pivots.
Pressing loads up the Floor Pivot specification dialog box. Using this one can specify
the individual floor pivots that a displayed using the daily session. To select/deselect
the individual pivot, check the item in the appropriate check box.
These pivots are created using the previous days range, including the high/low,
open/close and globex high low.
Here only the calculated values are displayed, with the input parameters being hidden.
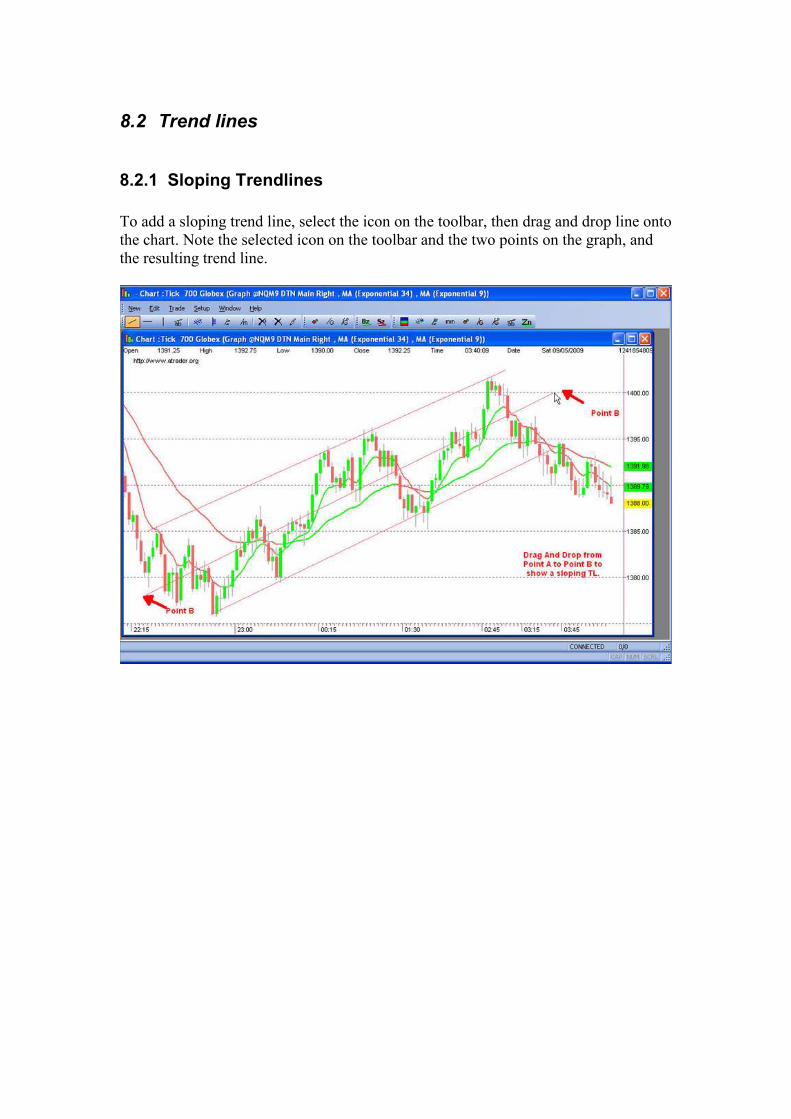
8.2 Trend lines
8.2.1 Sloping Trendlines
To add a sloping trend line, select the icon on the toolbar, then drag and drop line onto
the chart. Note the selected icon on the toolbar and the two points on the graph, and
the resulting trend line.
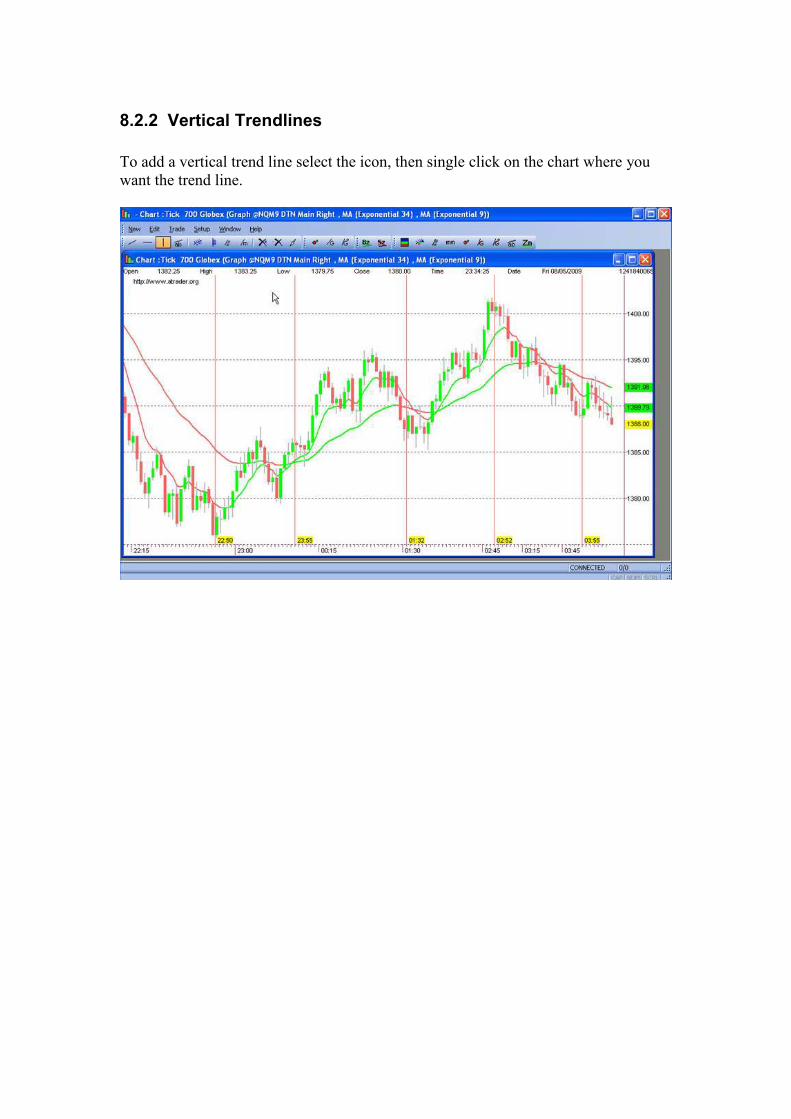
8.2.2 Vertical Trendlines
To add a vertical trend line select the icon, then single click on the chart where you
want the trend line.
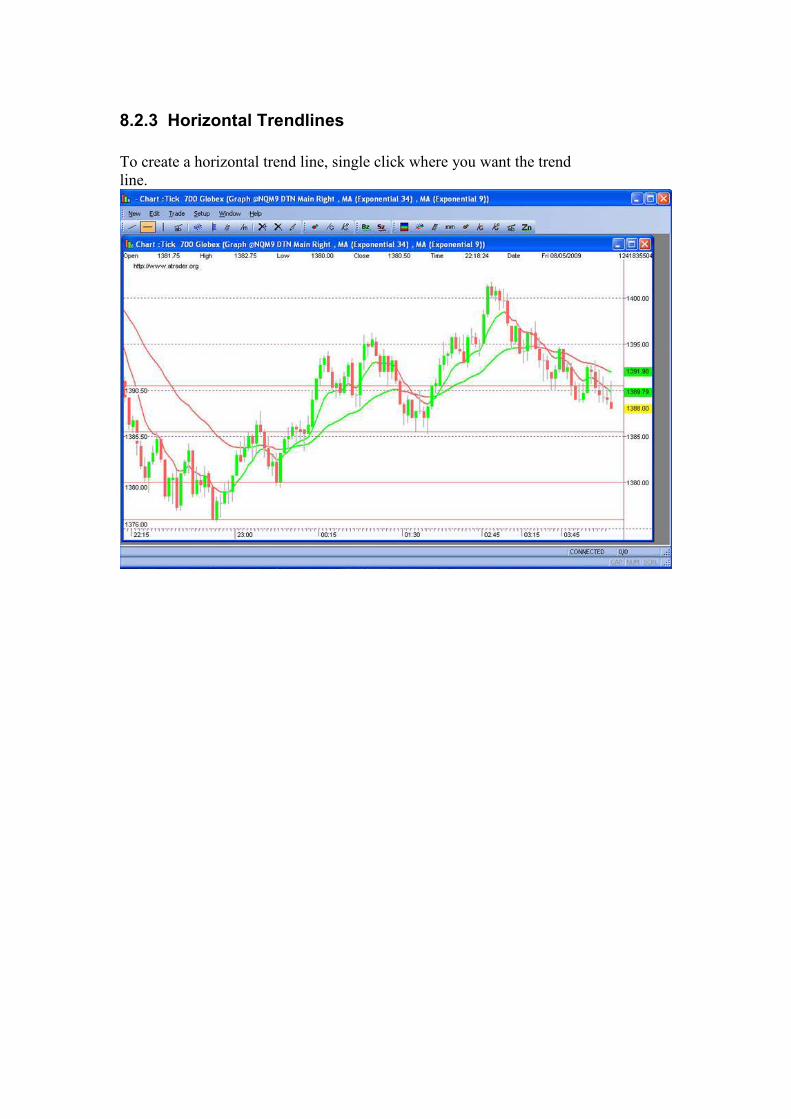
8.2.3 Horizontal Trendlines
To create a horizontal trend line, single click where you want the trend
line.
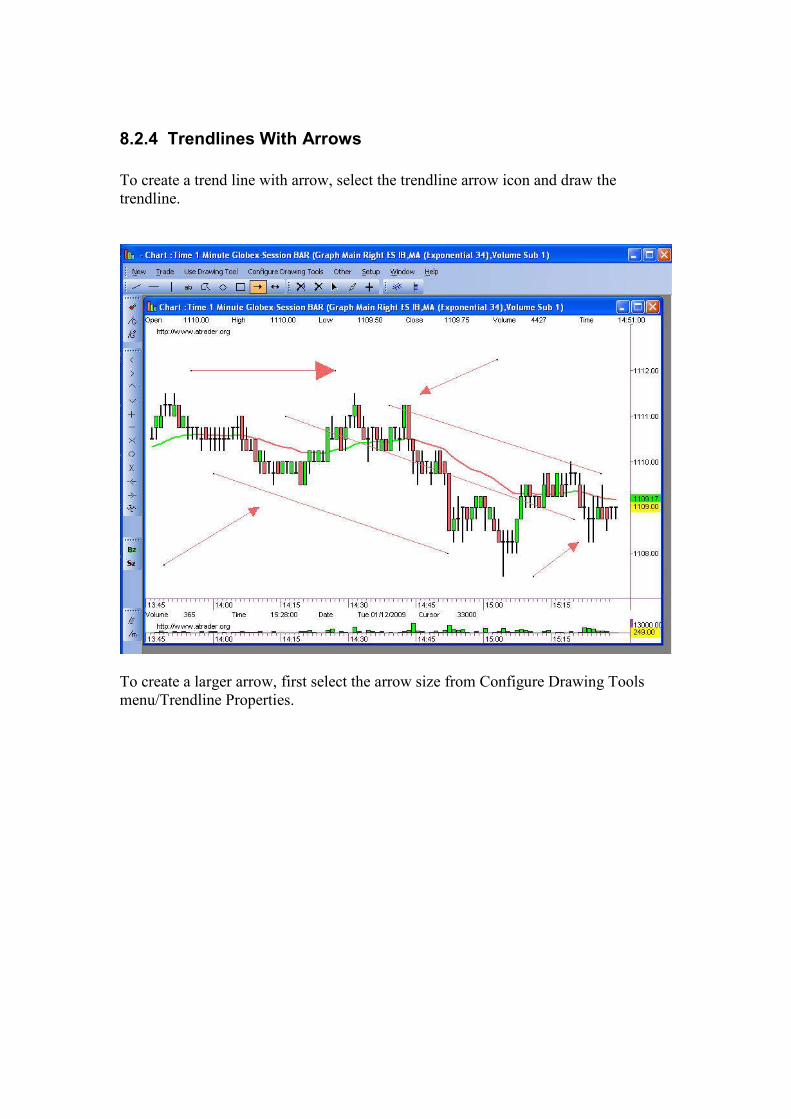
8.2.4 Trendlines With Arrows
To create a trend line with arrow, select the trendline arrow icon and draw the
trendline.
To create a larger arrow, first select the arrow size from Configure Drawing Tools
menu/Trendline Properties.
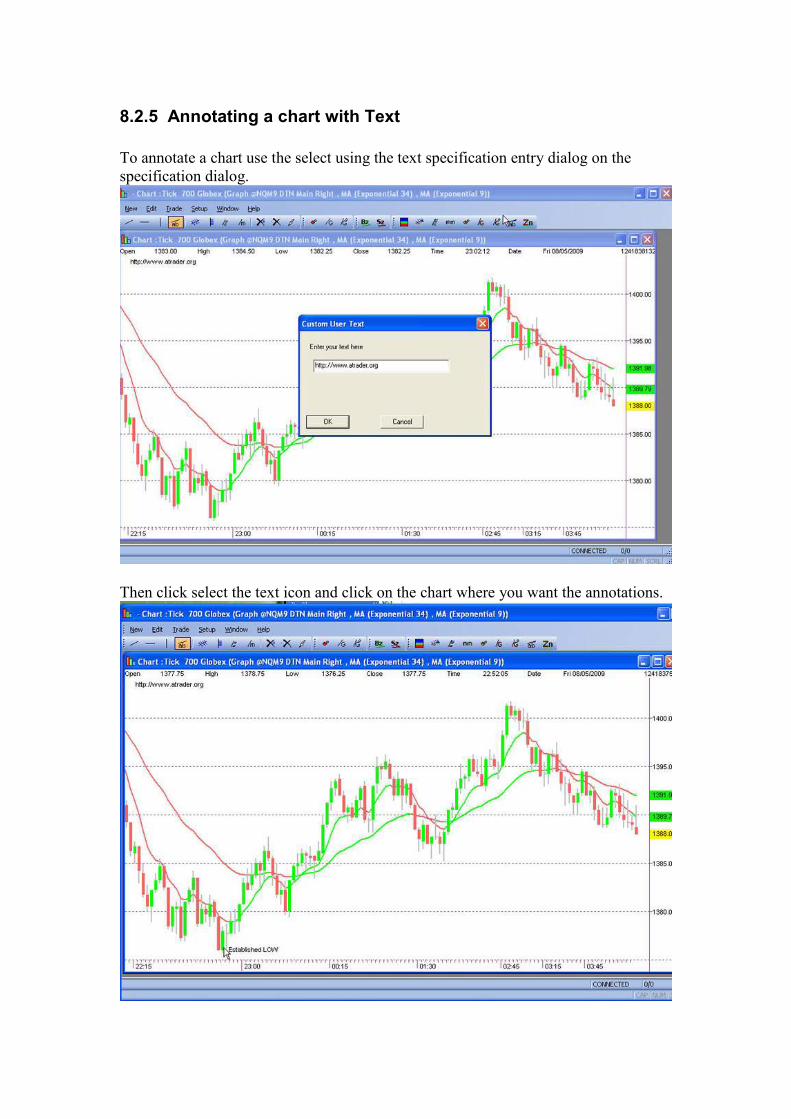
8.2.5 Annotating a chart with Text
To annotate a chart use the select using the text specification entry dialog on the
specification dialog.
Then click select the text icon and click on the chart where you want the annotations.
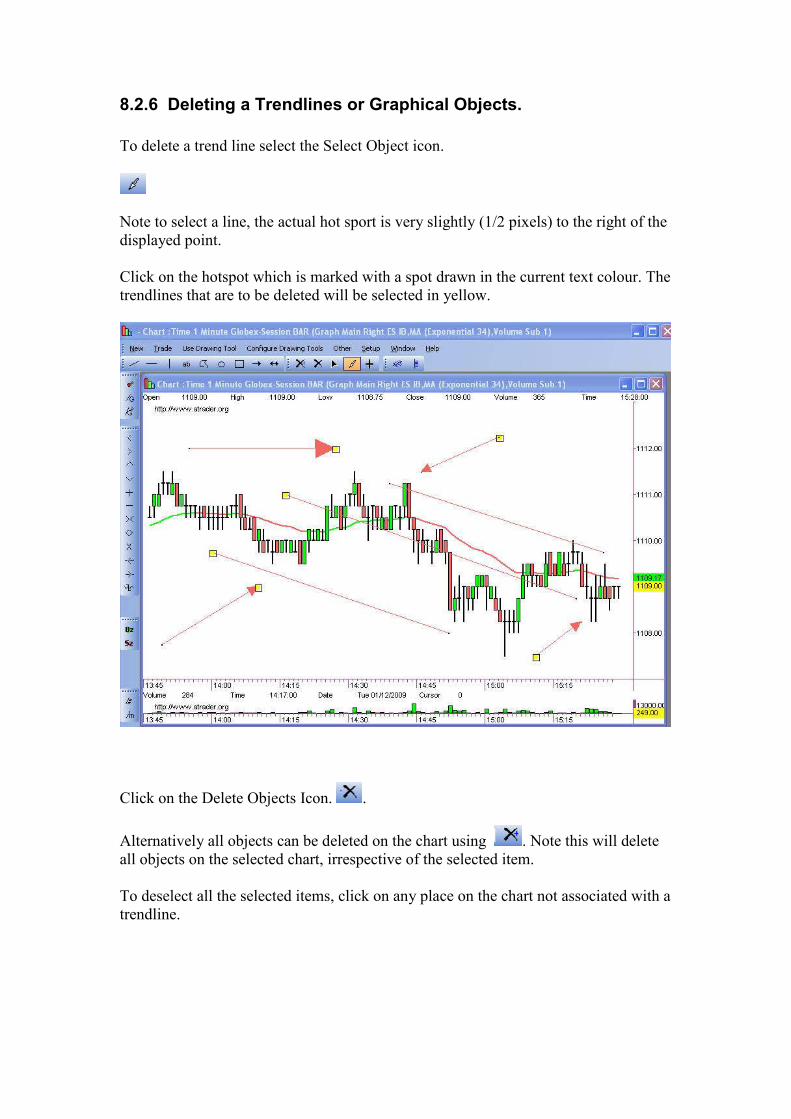
8.2.6 Deleting a Trendlines or Graphical Objects.
To delete a trend line select the Select Object icon.
Note to select a line, the actual hot sport is very slightly (1/2 pixels) to the right of the
displayed point.
Click on the hotspot which is marked with a spot drawn in the current text colour. The
trendlines that are to be deleted will be selected in yellow.
Click on the Delete Objects Icon. .
Alternatively all objects can be deleted on the chart using . Note this will delete
all objects on the selected chart, irrespective of the selected item.
To deselect all the selected items, click on any place on the chart not associated with a
trendline.
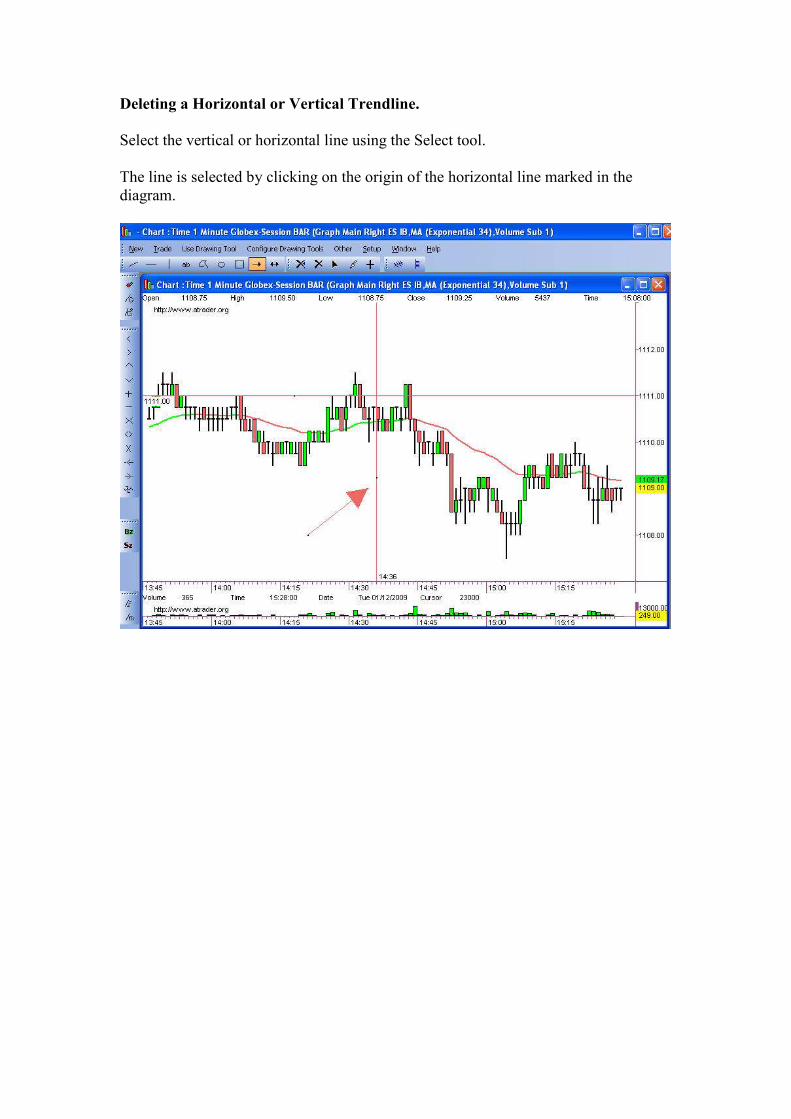
Deleting a Horizontal or Vertical Trendline.
Select the vertical or horizontal line using the Select tool.
The line is selected by clicking on the origin of the horizontal line marked in the
diagram.
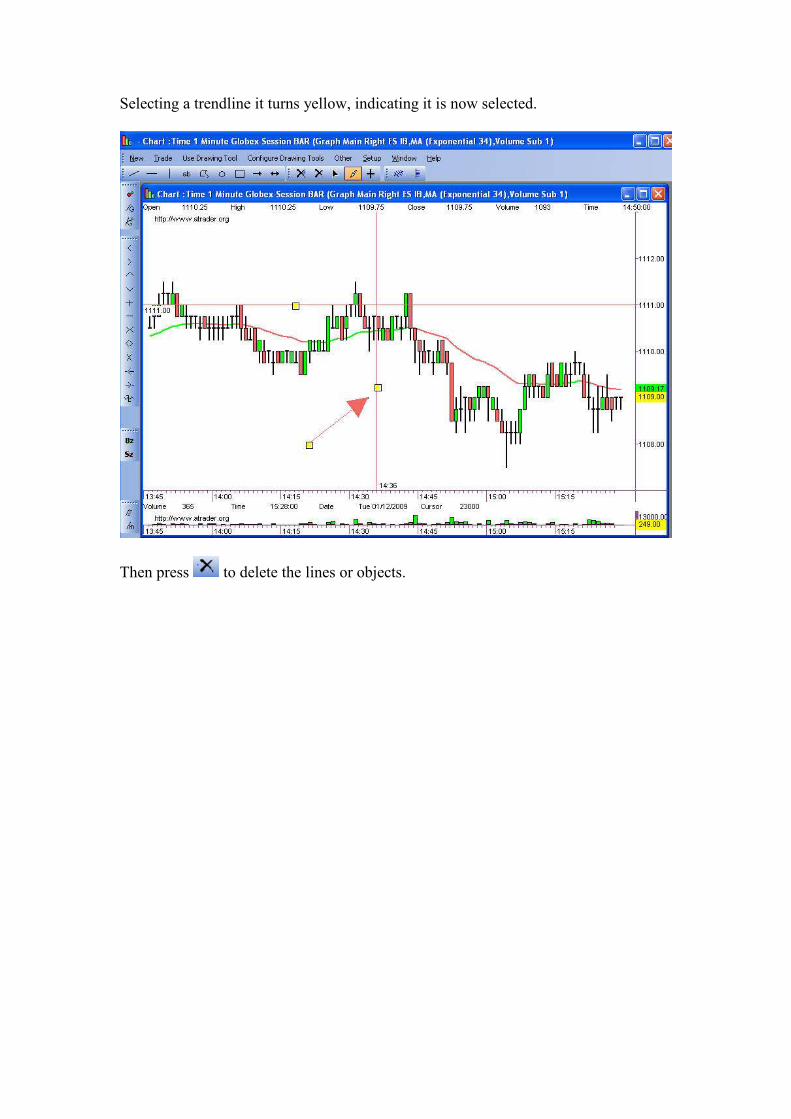
Selecting a trendline it turns yellow, indicating it is now selected.
Then press to delete the lines or objects.
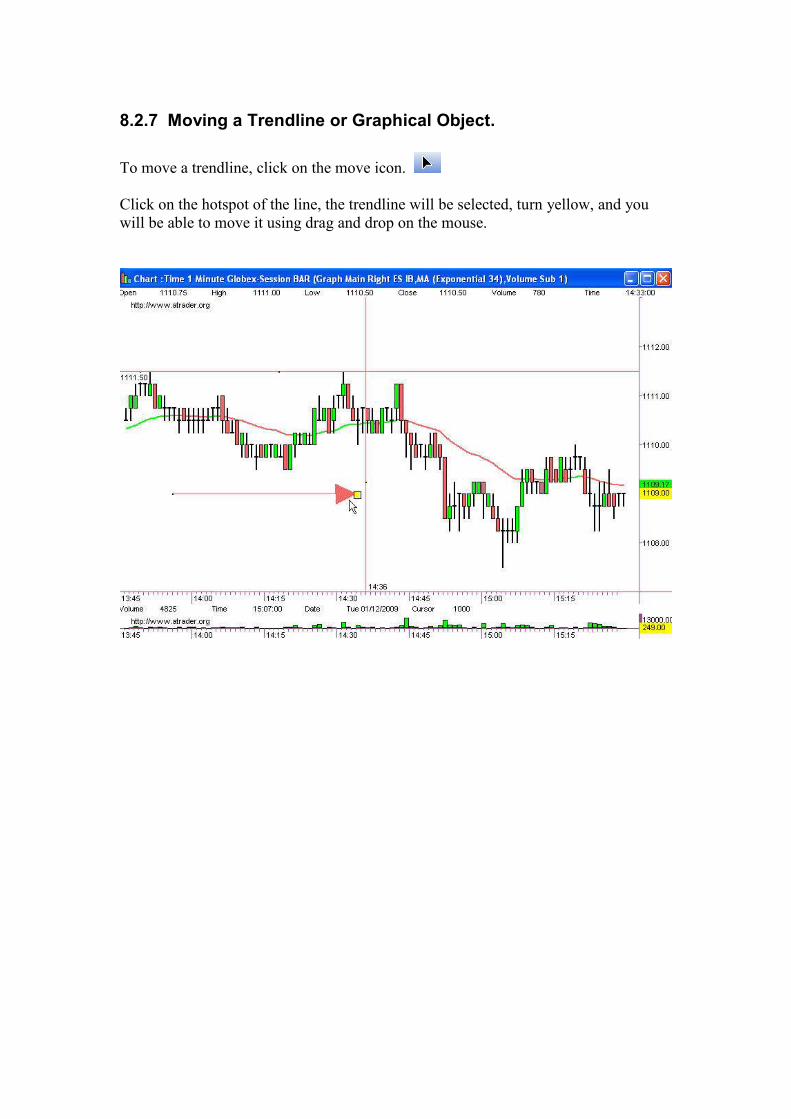
8.2.7 Moving a Trendline or Graphical Object.
To move a trendline, click on the move icon.
Click on the hotspot of the line, the trendline will be selected, turn yellow, and you
will be able to move it using drag and drop on the mouse.
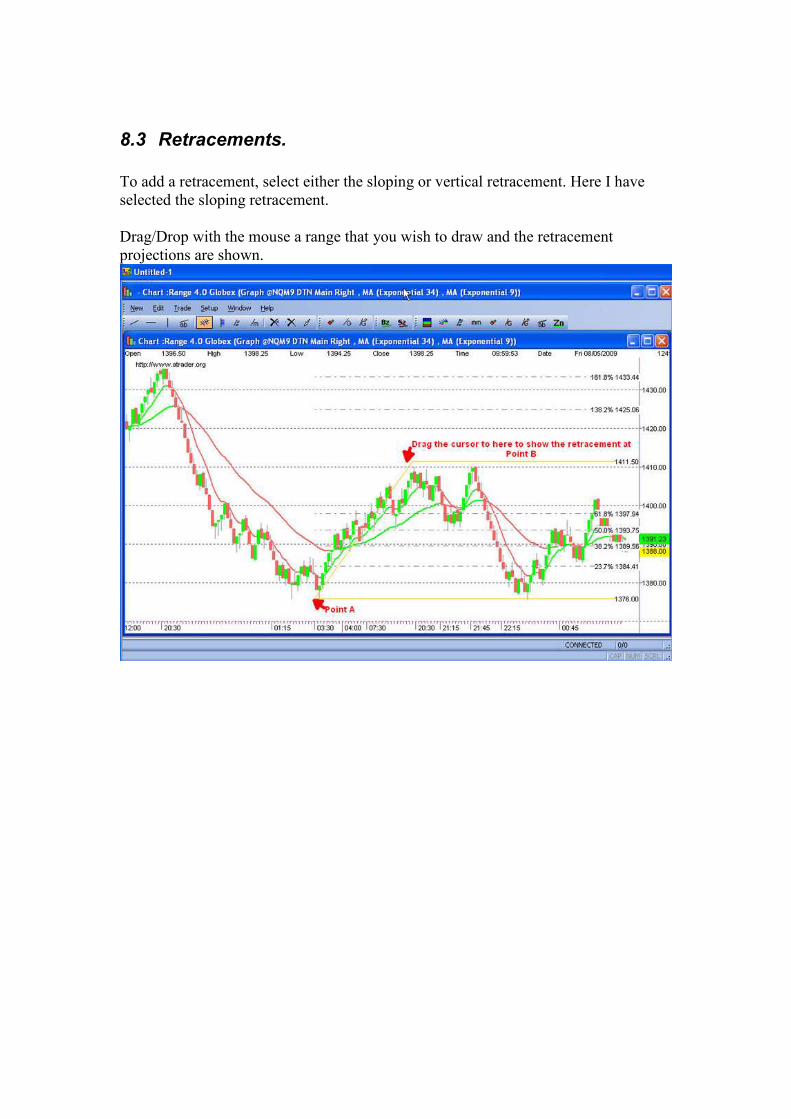
8.3 Retracements.
To add a retracement, select either the sloping or vertical retracement. Here I have
selected the sloping retracement.
Drag/Drop with the mouse a range that you wish to draw and the retracement
projections are shown.
8.4 Gann Projections.
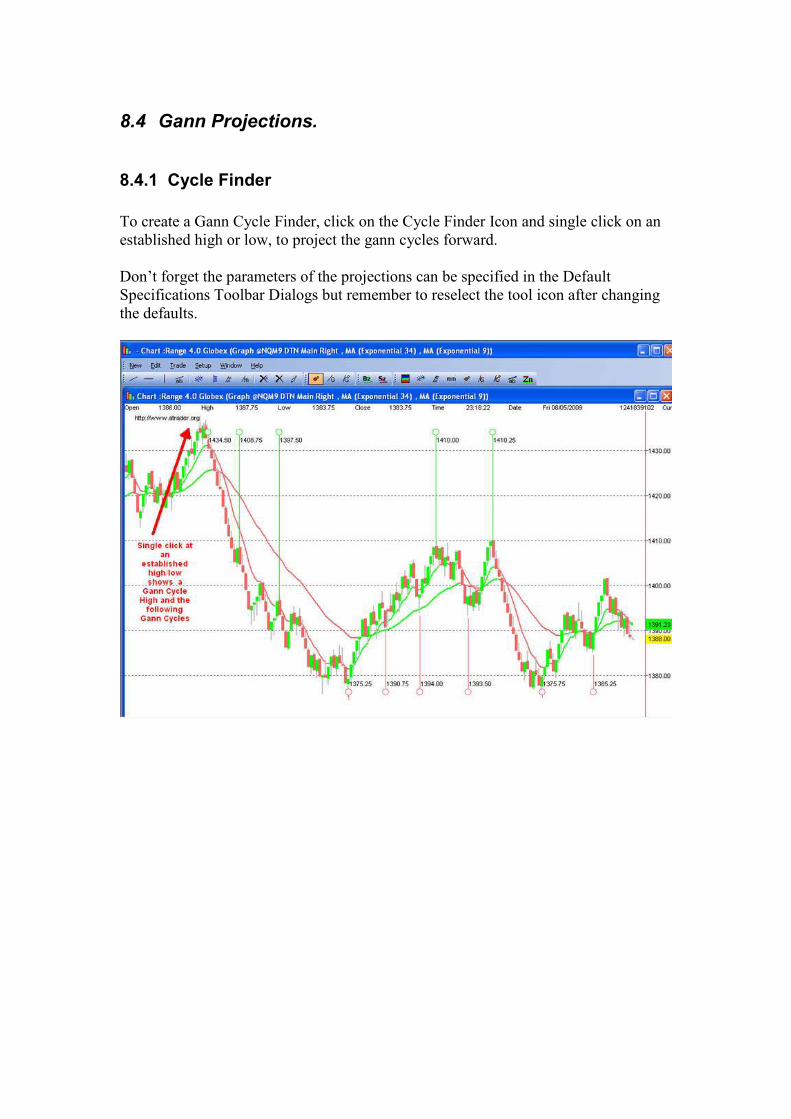
8.4.1 Cycle Finder
To create a Gann Cycle Finder, click on the Cycle Finder Icon and single click on an
established high or low, to project the gann cycles forward.
Don’t forget the parameters of the projections can be specified in the Default
Specifications Toolbar Dialogs but remember to reselect the tool icon after changing
the defaults.
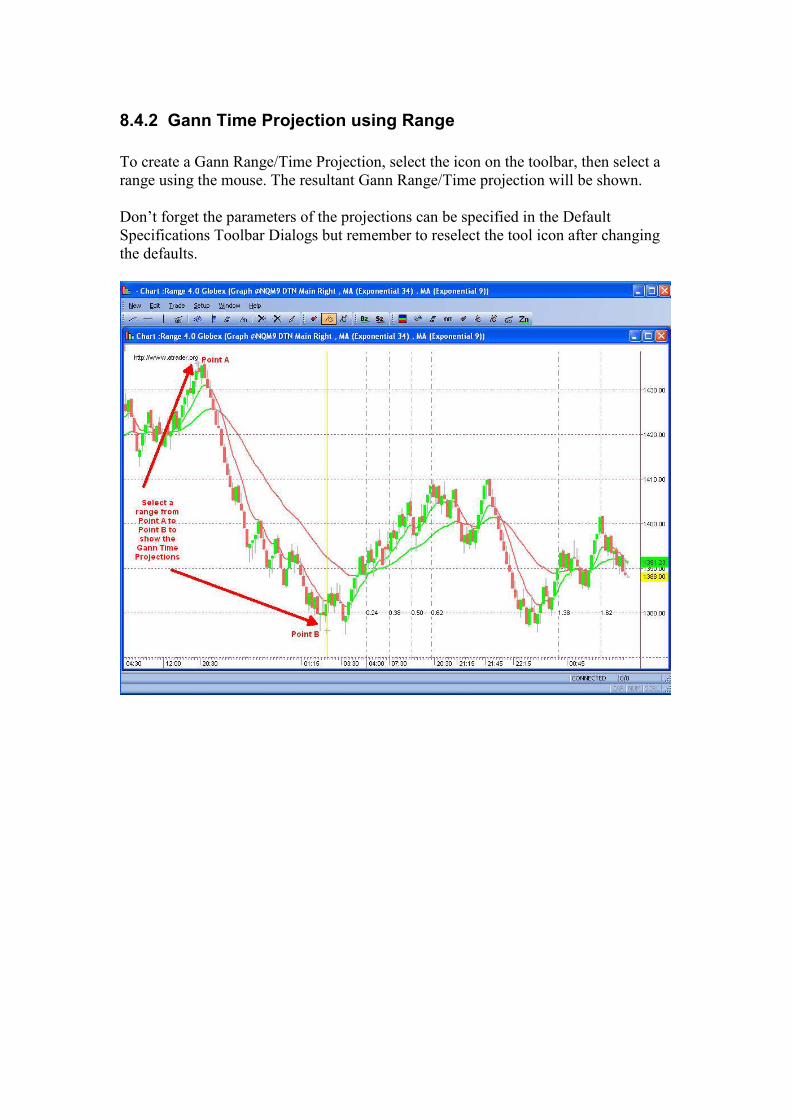
8.4.2 Gann Time Projection using Range
To create a Gann Range/Time Projection, select the icon on the toolbar, then select a
range using the mouse. The resultant Gann Range/Time projection will be shown.
Don’t forget the parameters of the projections can be specified in the Default
Specifications Toolbar Dialogs but remember to reselect the tool icon after changing
the defaults.
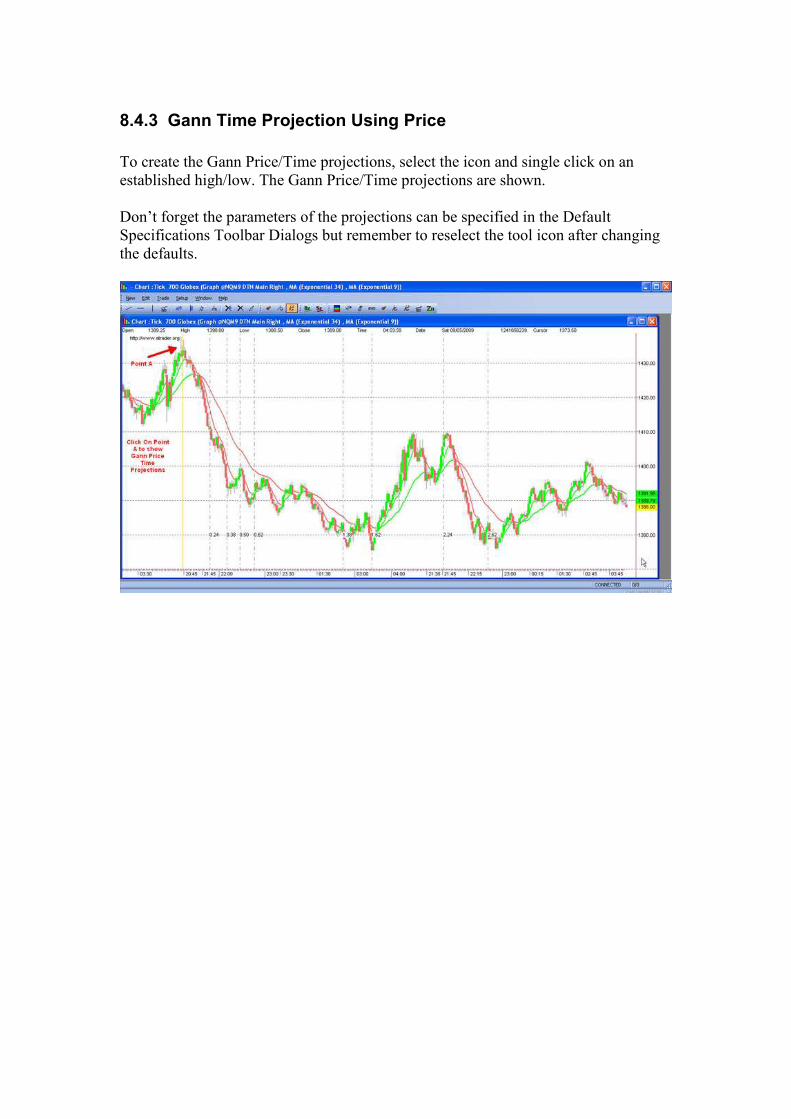
8.4.3 Gann Time Projection Using Price
To create the Gann Price/Time projections, select the icon and single click on an
established high/low. The Gann Price/Time projections are shown.
Don’t forget the parameters of the projections can be specified in the Default
Specifications Toolbar Dialogs but remember to reselect the tool icon after changing
the defaults.
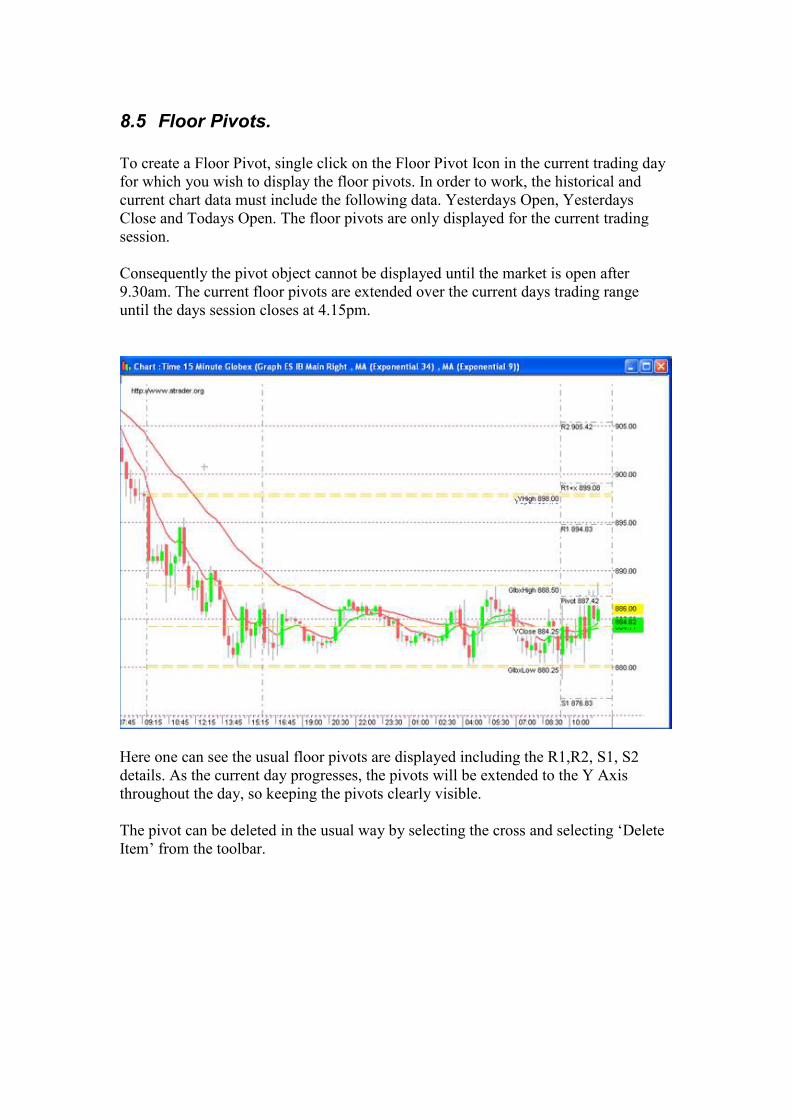
8.5 Floor Pivots.
To create a Floor Pivot, single click on the Floor Pivot Icon in the current trading day
for which you wish to display the floor pivots. In order to work, the historical and
current chart data must include the following data. Yesterdays Open, Yesterdays
Close and Todays Open. The floor pivots are only displayed for the current trading
session.
Consequently the pivot object cannot be displayed until the market is open after
9.30am. The current floor pivots are extended over the current days trading range
until the days session closes at 4.15pm.
Here one can see the usual floor pivots are displayed including the R1,R2, S1, S2
details. As the current day progresses, the pivots will be extended to the Y Axis
throughout the day, so keeping the pivots clearly visible.
The pivot can be deleted in the usual way by selecting the cross and selecting ‘Delete
Item’ from the toolbar.
9 Volume Distribution.
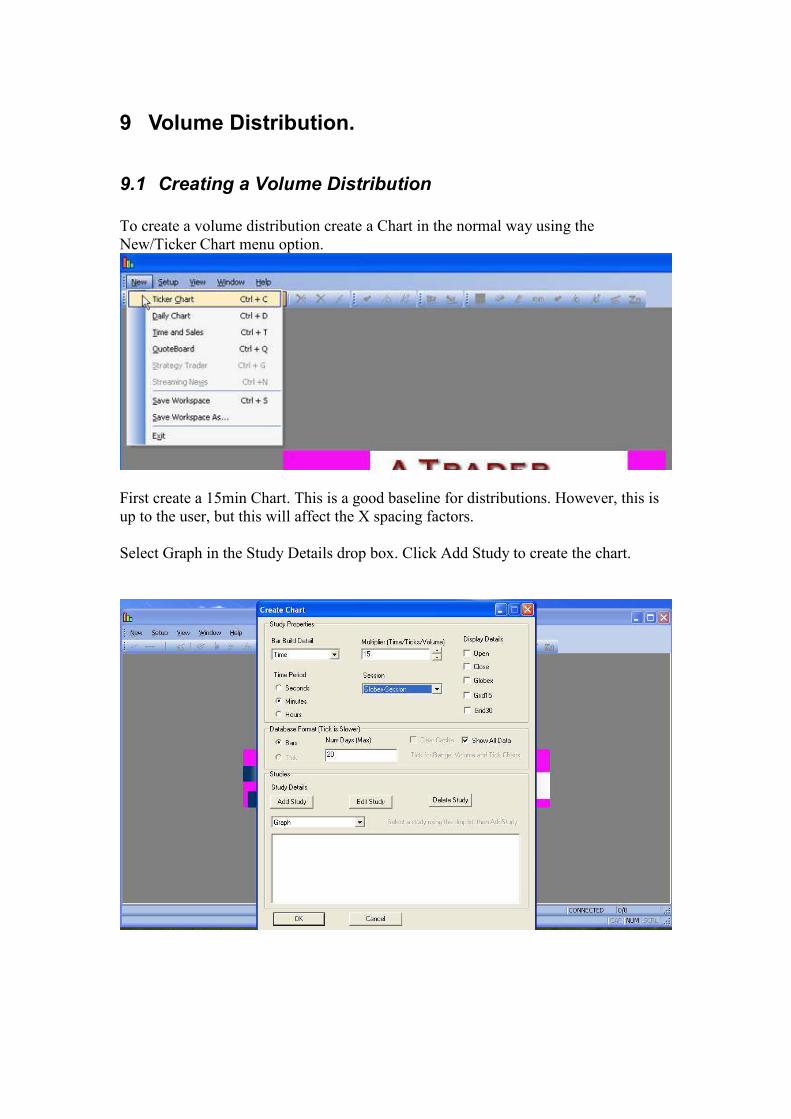
9.1 Creating a Volume Distribution
To create a volume distribution create a Chart in the normal way using the
New/Ticker Chart menu option.
First create a 15min Chart. This is a good baseline for distributions. However, this is
up to the user, but this will affect the X spacing factors.
Select Graph in the Study Details drop box. Click Add Study to create the chart.

Here I am creating a chart of the continuous contract with DTN.
Select Study Details/Distribution and click on Add Study.
The Add Distribution Study pops up.
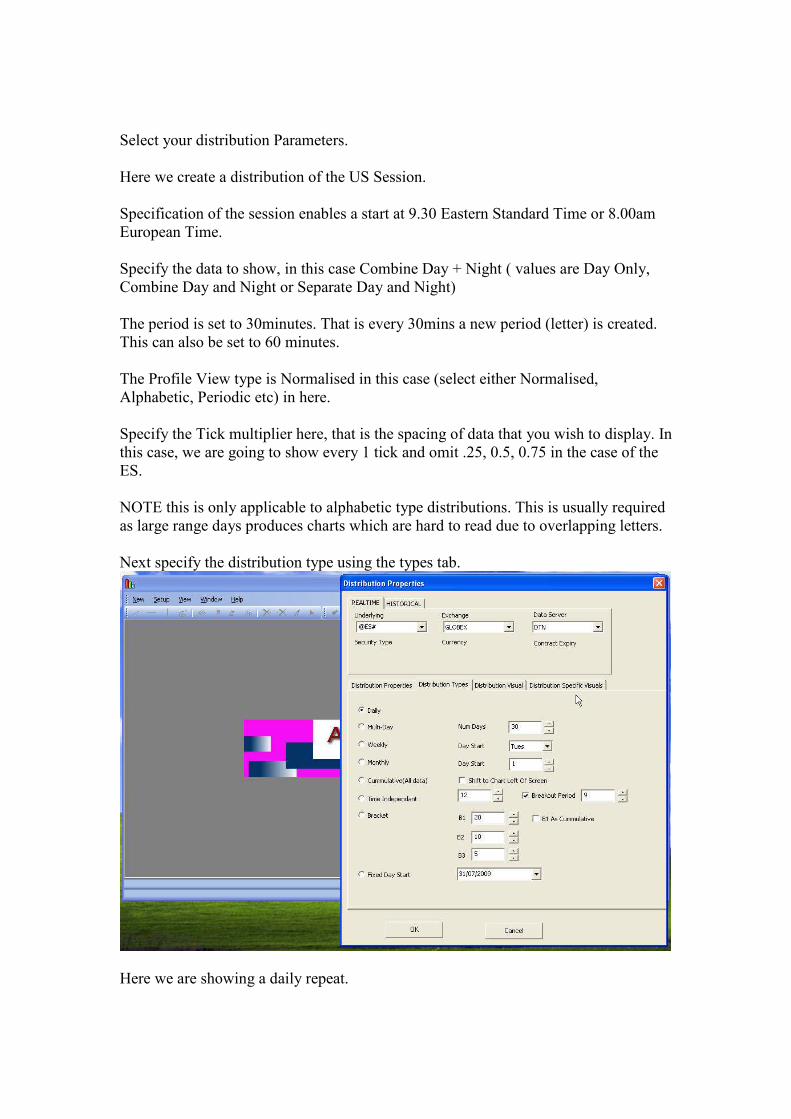
Select your distribution Parameters.
Here we create a distribution of the US Session.
Specification of the session enables a start at 9.30 Eastern Standard Time or 8.00am
European Time.
Specify the data to show, in this case Combine Day + Night ( values are Day Only,
Combine Day and Night or Separate Day and Night)
The period is set to 30minutes. That is every 30mins a new period (letter) is created.
This can also be set to 60 minutes.
The Profile View type is Normalised in this case (select either Normalised,
Alphabetic, Periodic etc) in here.
Specify the Tick multiplier here, that is the spacing of data that you wish to display. In
this case, we are going to show every 1 tick and omit .25, 0.5, 0.75 in the case of the
ES.
NOTE this is only applicable to alphabetic type distributions. This is usually required
as large range days produces charts which are hard to read due to overlapping letters.
Next specify the distribution type using the types tab.
Here we are showing a daily repeat.
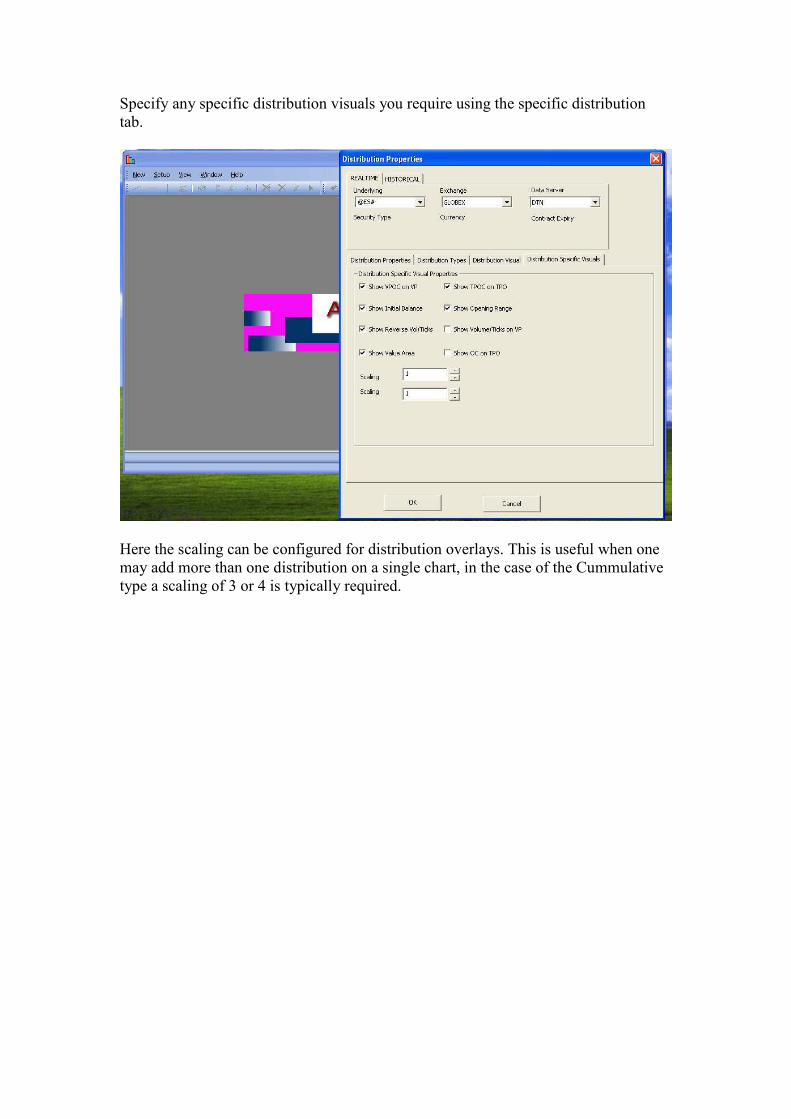
Specify any specific distribution visuals you require using the specific distribution
tab.
Here the scaling can be configured for distribution overlays. This is useful when one
may add more than one distribution on a single chart, in the case of the Cummulative
type a scaling of 3 or 4 is typically required.
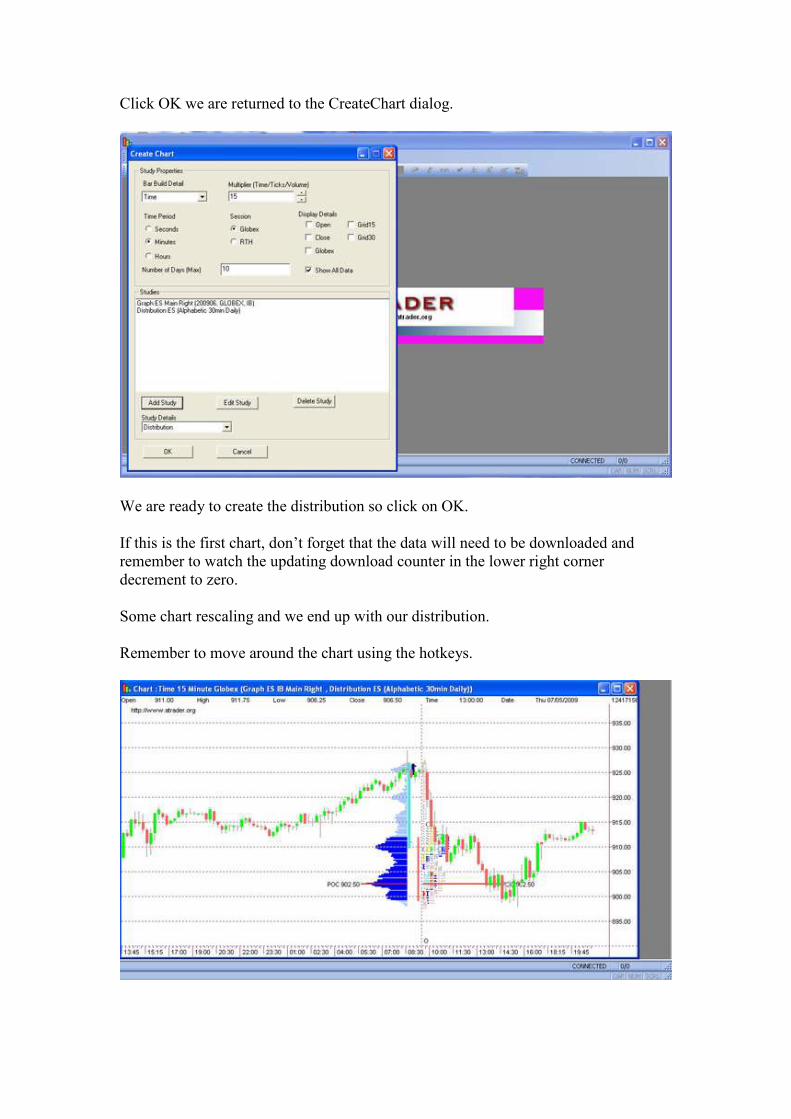
Click OK we are returned to the CreateChart dialog.
We are ready to create the distribution so click on OK.
If this is the first chart, don’t forget that the data will need to be downloaded and
remember to watch the updating download counter in the lower right corner
decrement to zero.
Some chart rescaling and we end up with our distribution.
Remember to move around the chart using the hotkeys.
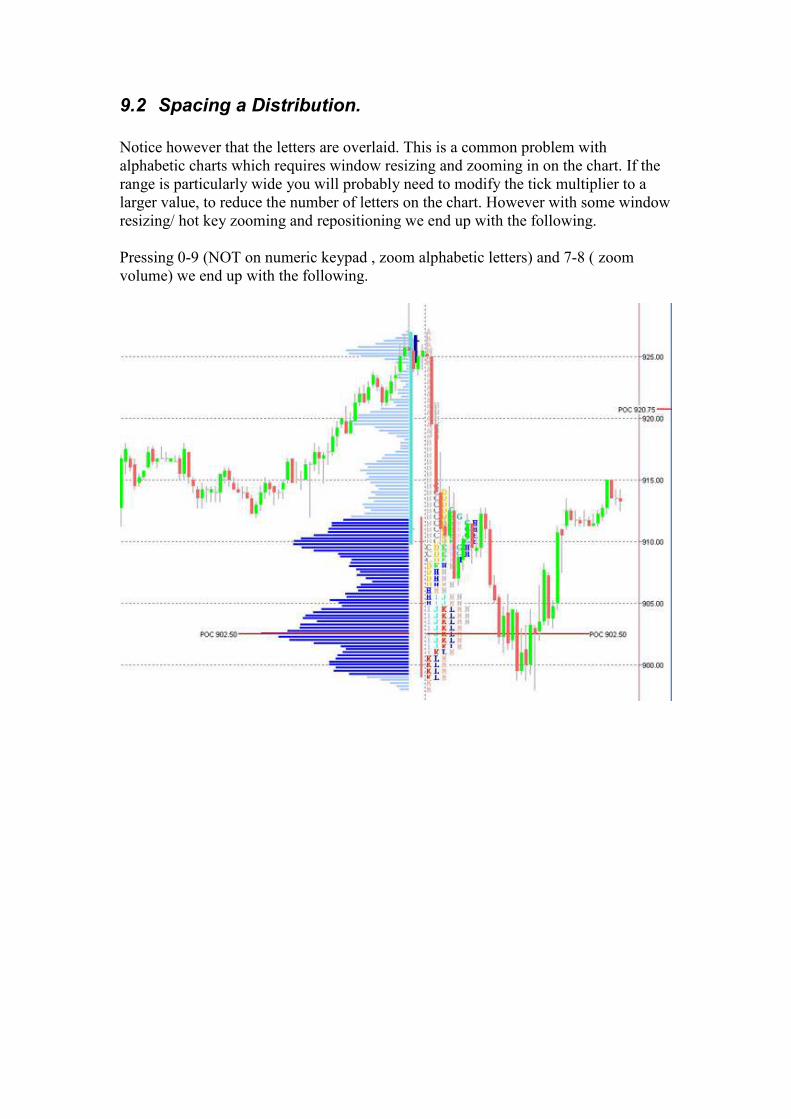
9.2 Spacing a Distribution.
Notice however that the letters are overlaid. This is a common problem with
alphabetic charts which requires window resizing and zooming in on the chart. If the
range is particularly wide you will probably need to modify the tick multiplier to a
larger value, to reduce the number of letters on the chart. However with some window
resizing/ hot key zooming and repositioning we end up with the following.
Pressing 0-9 (NOT on numeric keypad , zoom alphabetic letters) and 7-8 ( zoom
volume) we end up with the following.
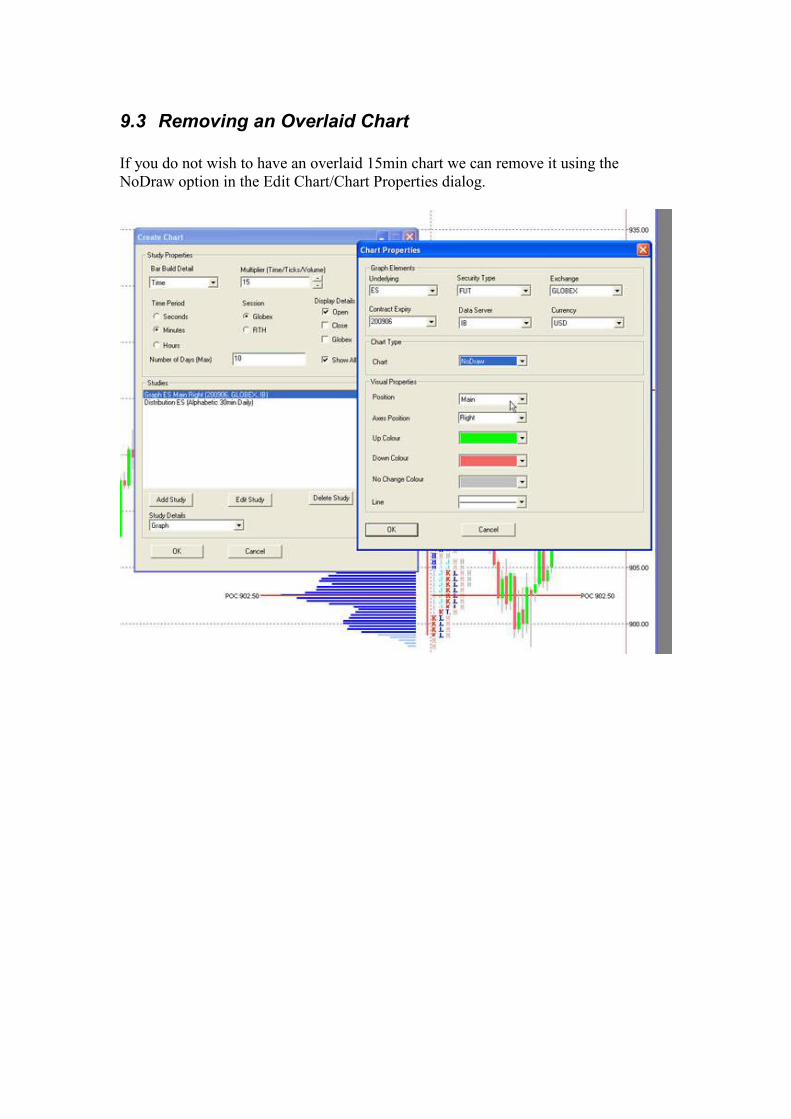
9.3 Removing an Overlaid Chart
If you do not wish to have an overlaid 15min chart we can remove it using the
NoDraw option in the Edit Chart/Chart Properties dialog.
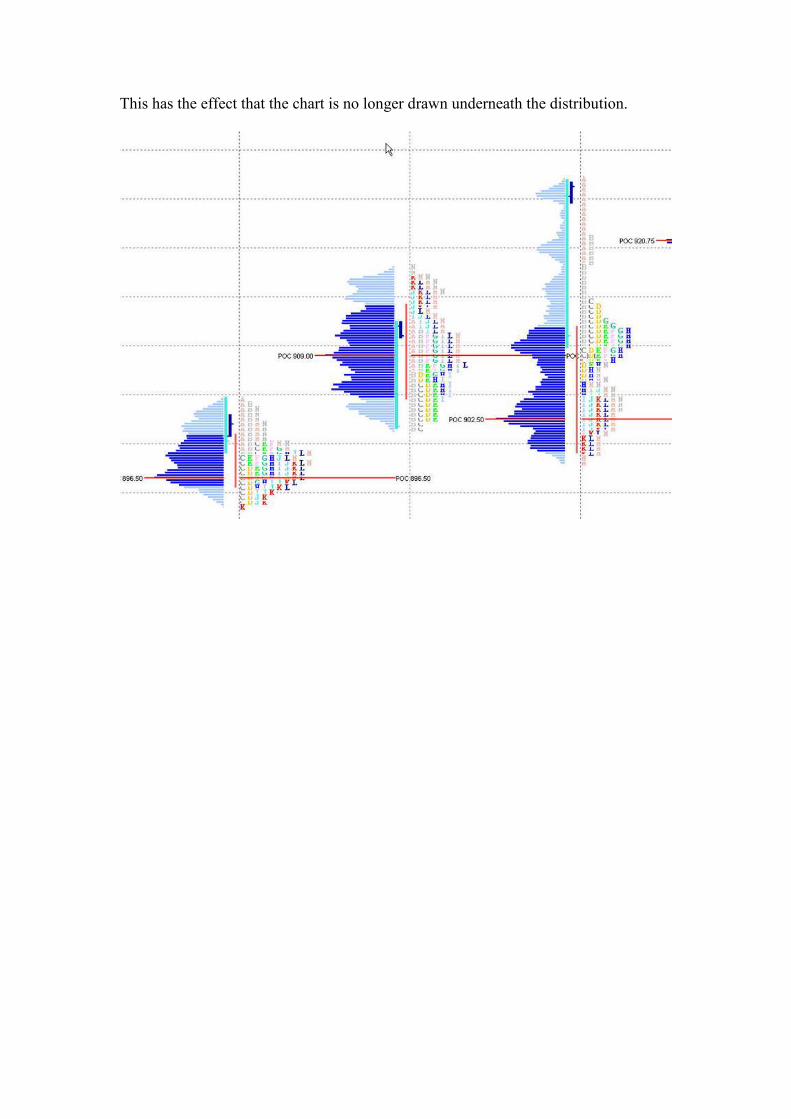
This has the effect that the chart is no longer drawn underneath the distribution.
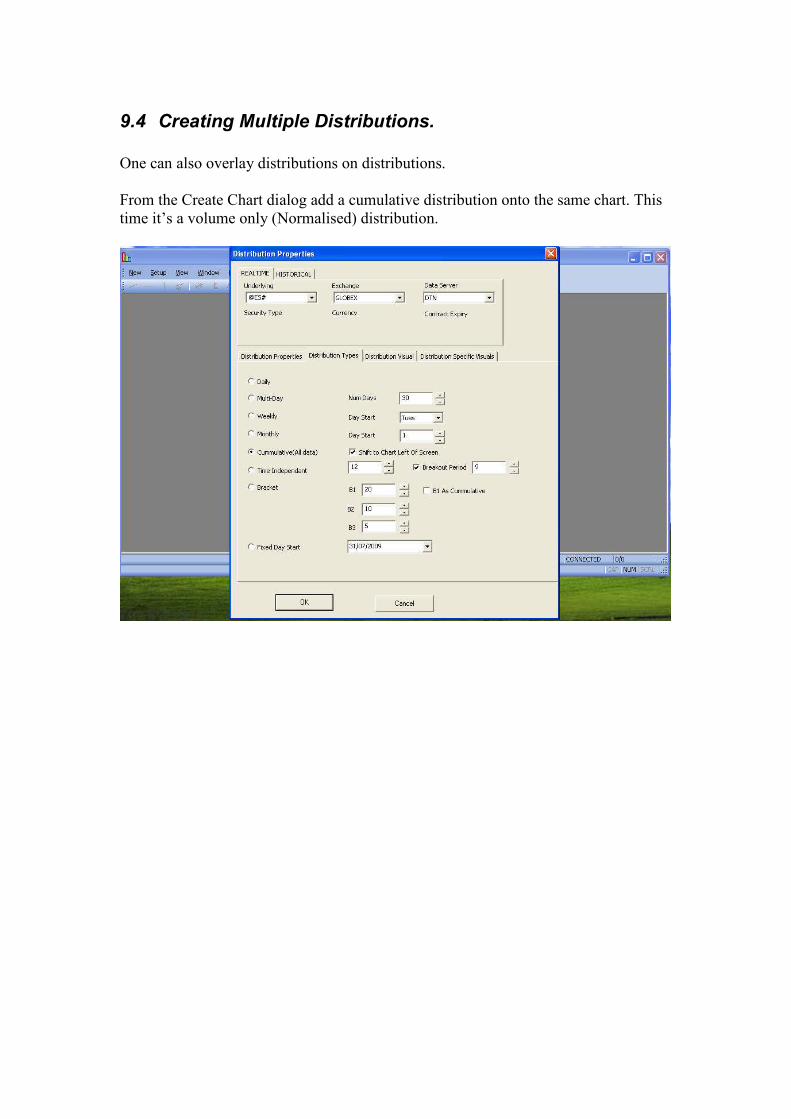
9.4 Creating Multiple Distributions.
One can also overlay distributions on distributions.
From the Create Chart dialog add a cumulative distribution onto the same chart. This
time it’s a volume only (Normalised) distribution.
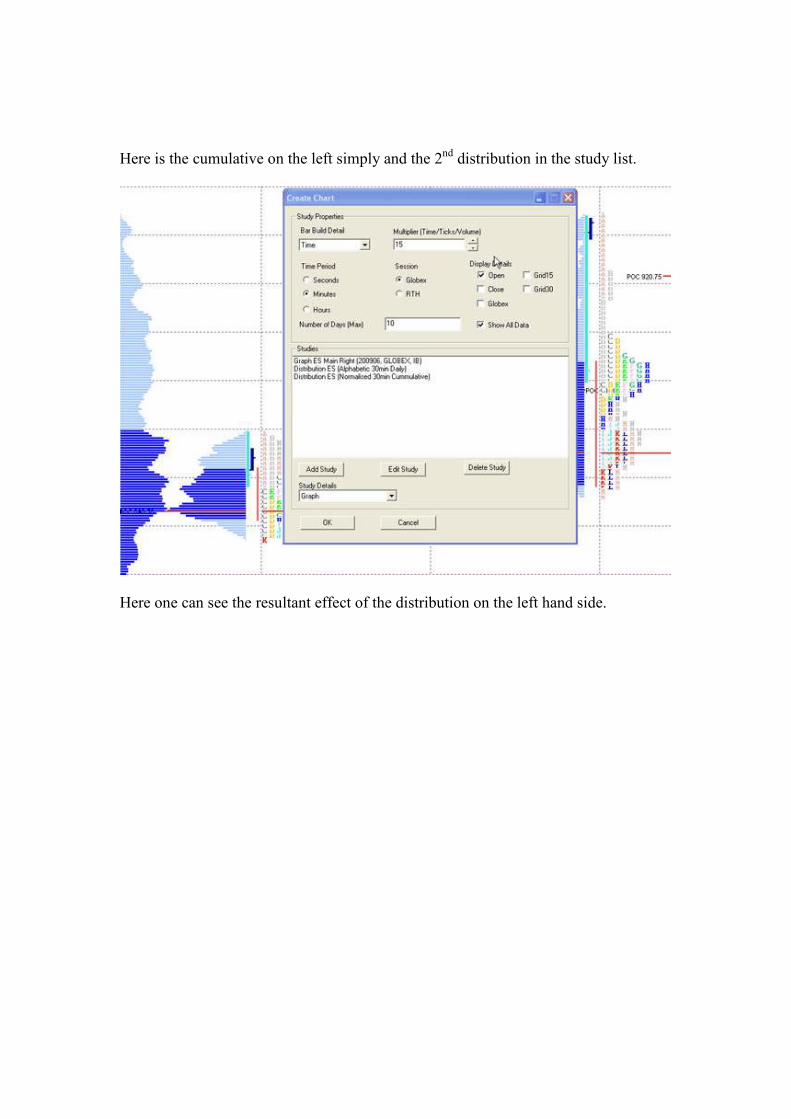
Here is the cumulative on the left simply and the 2nd distribution in the study list.
Here one can see the resultant effect of the distribution on the left hand side.
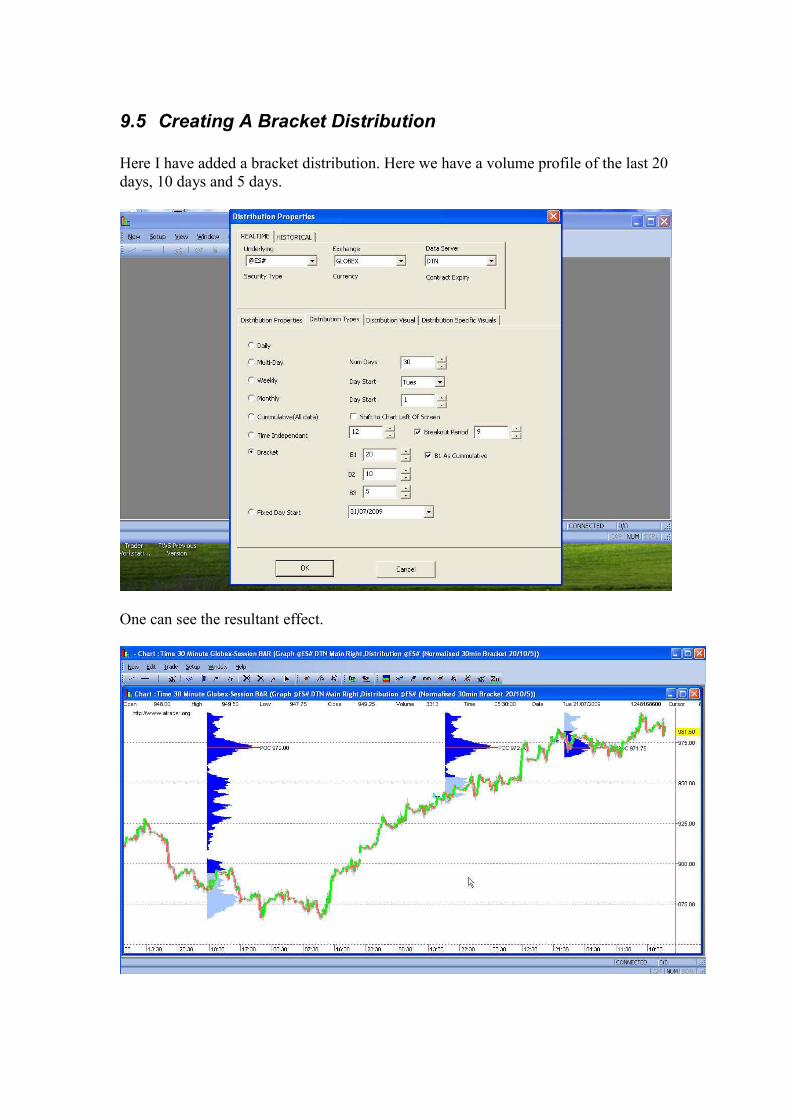
9.5 Creating A Bracket Distribution
Here I have added a bracket distribution. Here we have a volume profile of the last 20
days, 10 days and 5 days.
One can see the resultant effect.
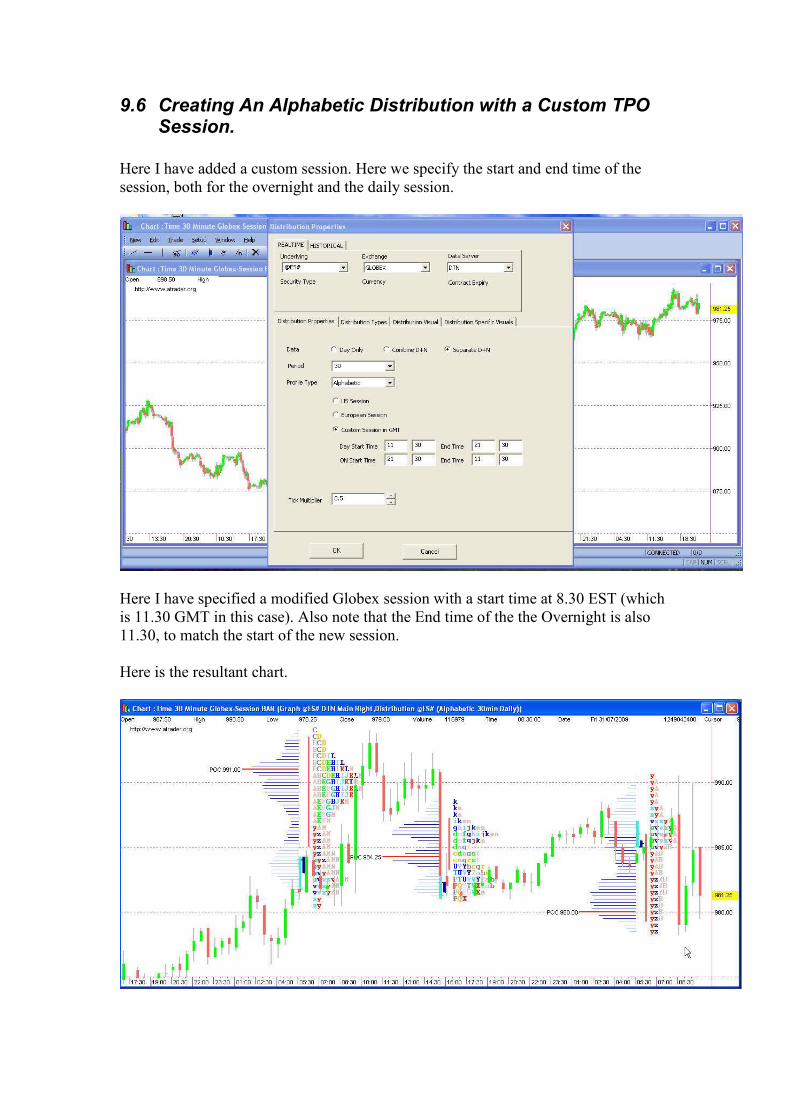
9.6 Creating An Alphabetic Distribution with a Custom TPO Session.
Here I have added a custom session. Here we specify the start and end time of the
session, both for the overnight and the daily session.
Here I have specified a modified Globex session with a start time at 8.30 EST (which
is 11.30 GMT in this case). Also note that the End time of the the Overnight is also
11.30, to match the start of the new session.
Here is the resultant chart.

Note now the alphabetic periods start in x and y now which are the letters for 8.30-9-
00 and 9-9.30 EST.
9.7 Creating A Custom TPO Session on a Fixed Date Distribution with a Custom Block Fill.
Selecting a chart on a date with provide a single chart starting at a specific date.
Note on the distribution properties tab, I have specified the TimeVA type. This draws
the TPOs in a different colour for each block.
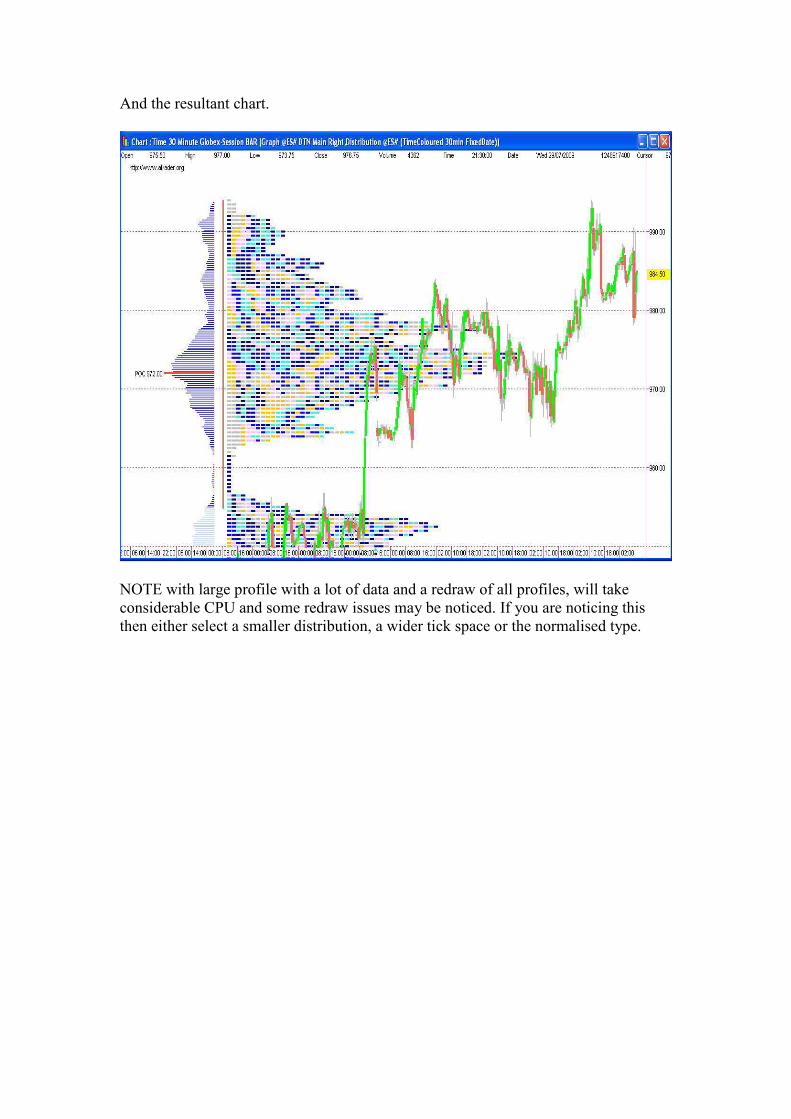
And the resultant chart.
NOTE with large profile with a lot of data and a redraw of all profiles, will take
considerable CPU and some redraw issues may be noticed. If you are noticing this
then either select a smaller distribution, a wider tick space or the normalised type.
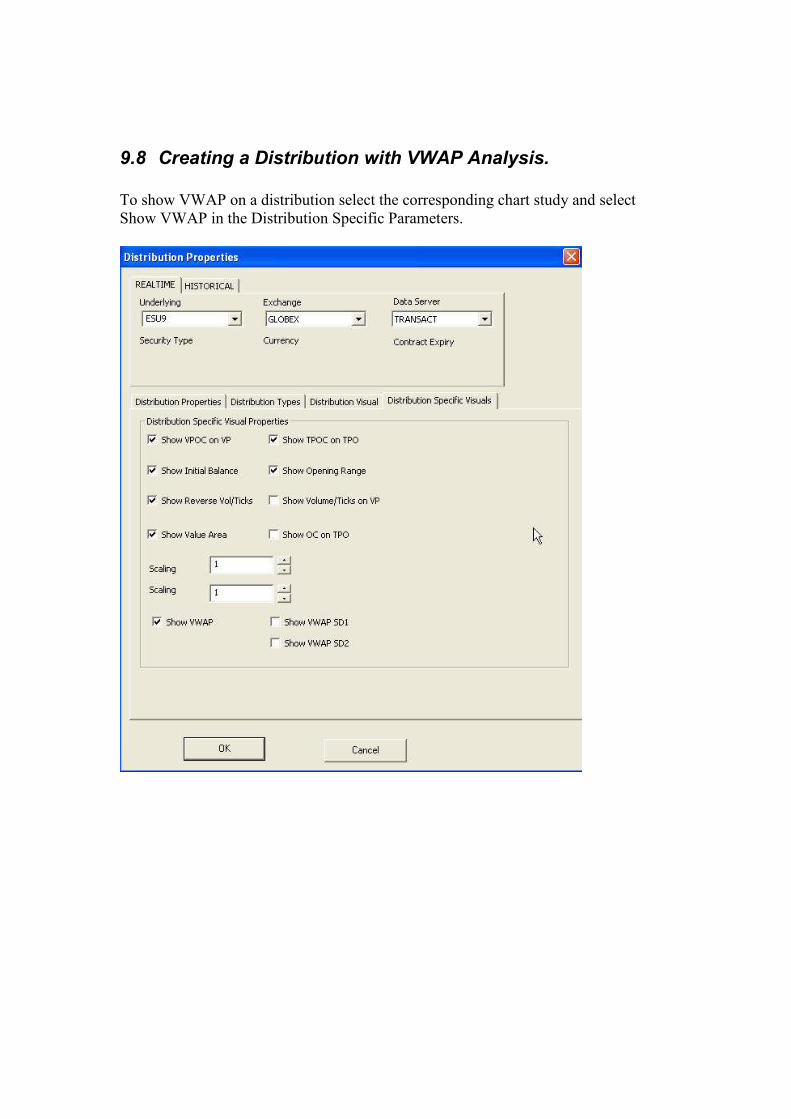
9.8 Creating a Distribution with VWAP Analysis.
To show VWAP on a distribution select the corresponding chart study and select
Show VWAP in the Distribution Specific Parameters.
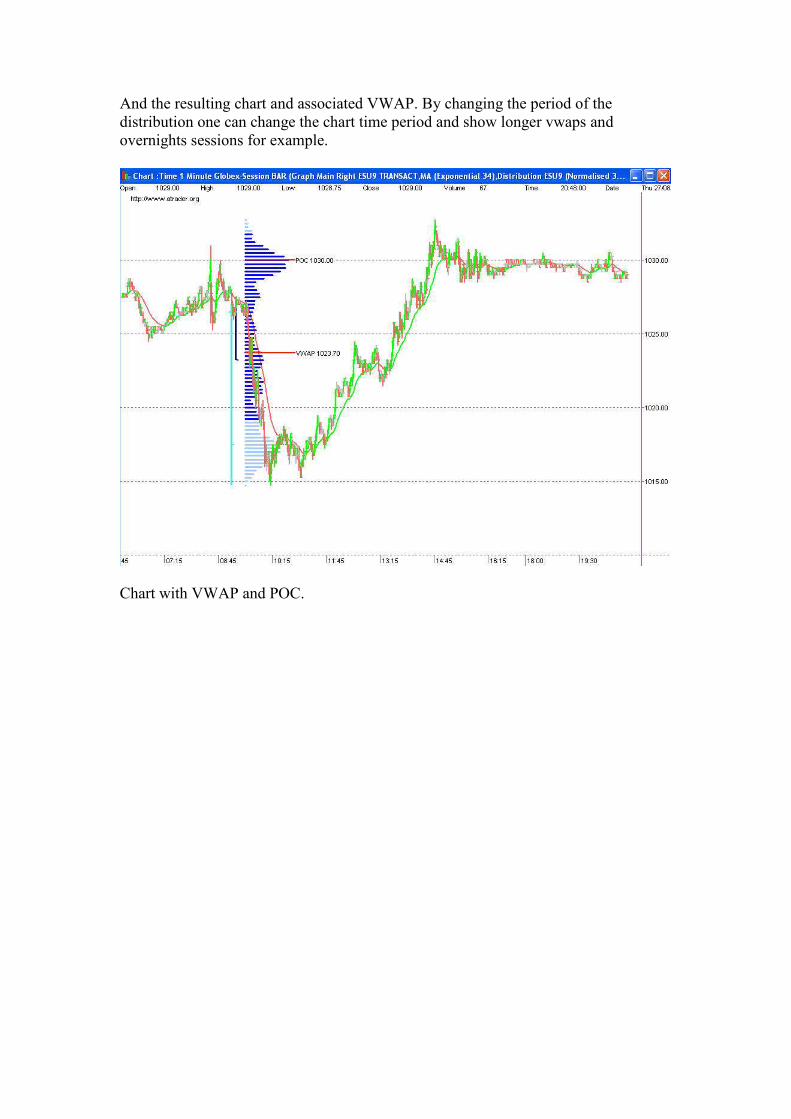
And the resulting chart and associated VWAP. By changing the period of the
distribution one can change the chart time period and show longer vwaps and
overnights sessions for example.
Chart with VWAP and POC.
10 Creating a Volume Delta Chart
Ensure you are using a compatible data provider. Currently the supported vendors are
DTN IQFeed.
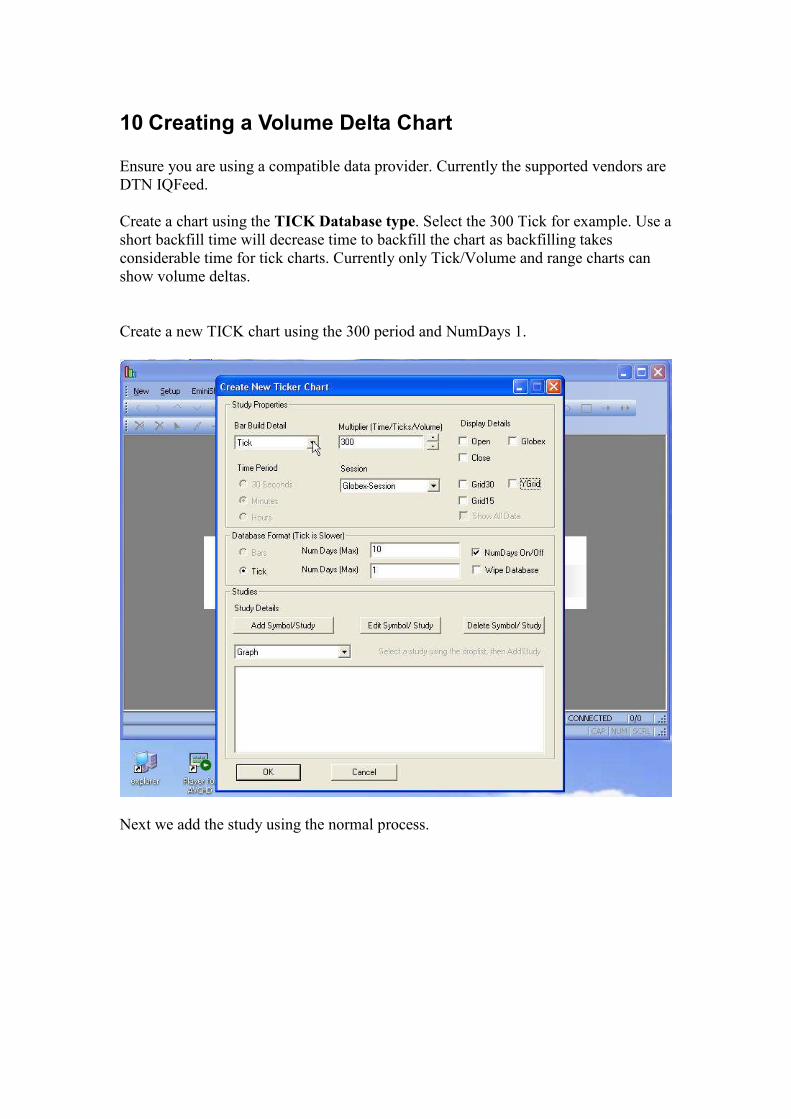
Create a chart using the TICK Database type. Select the 300 Tick for example. Use a
short backfill time will decrease time to backfill the chart as backfilling takes
considerable time for tick charts. Currently only Tick/Volume and range charts can
show volume deltas.
Create a new TICK chart using the 300 period and NumDays 1.
Next we add the study using the normal process.
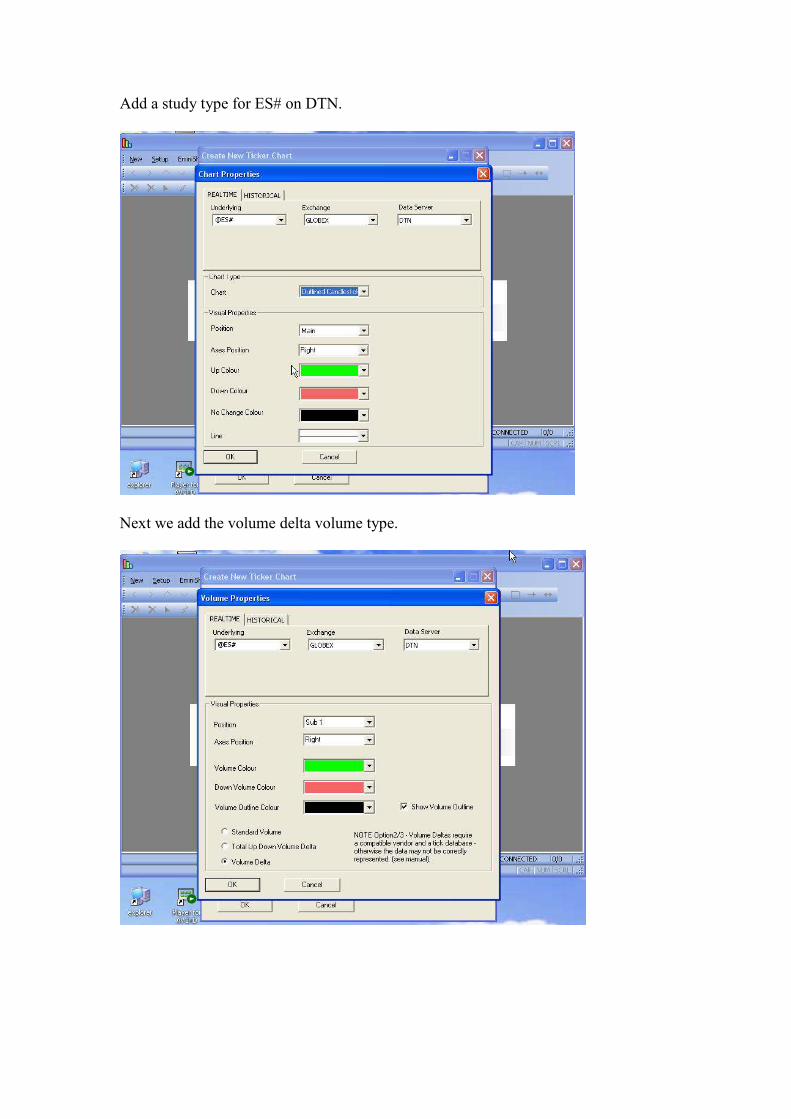
Add a study type for ES# on DTN.
Next we add the volume delta volume type.
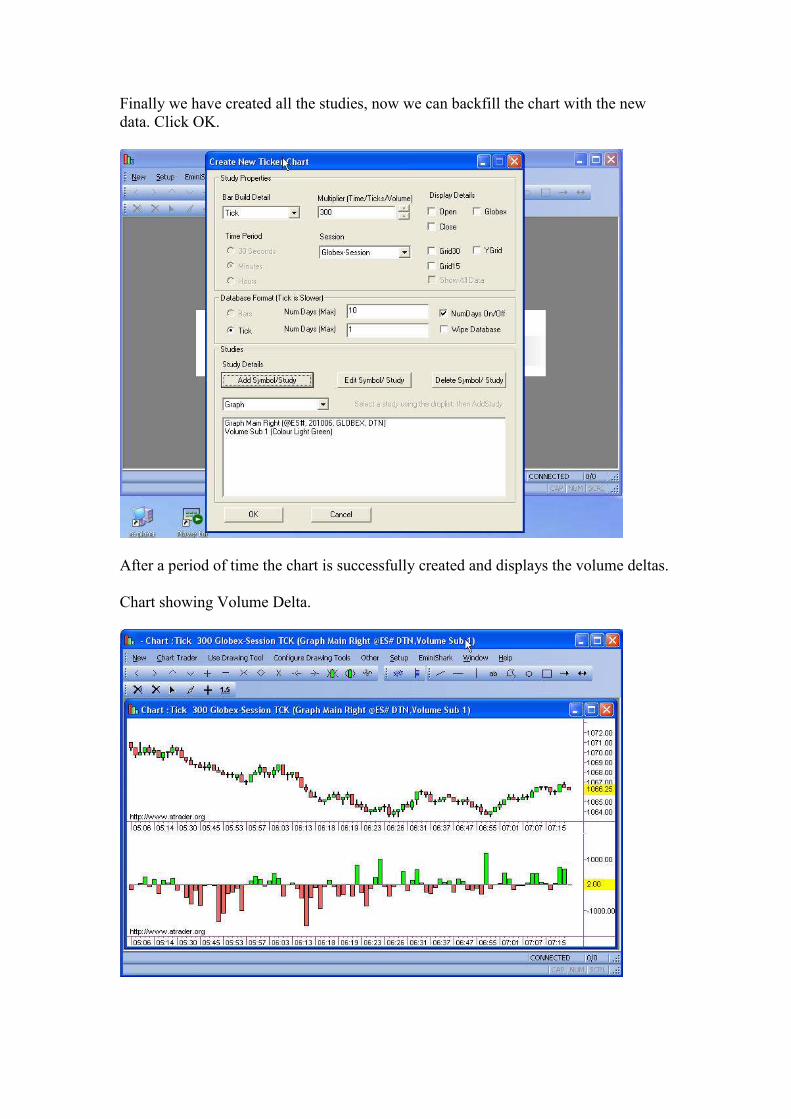
Finally we have created all the studies, now we can backfill the chart with the new
data. Click OK.
After a period of time the chart is successfully created and displays the volume deltas.
Chart showing Volume Delta.
11 Quoteboard
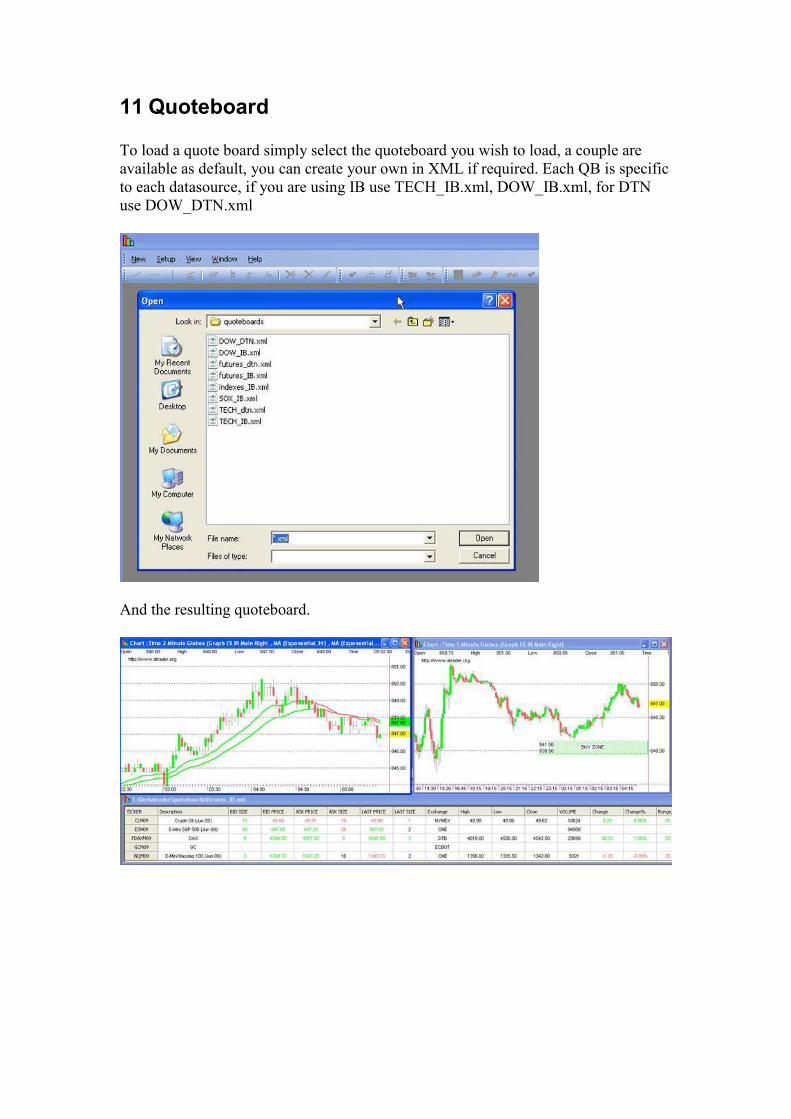
To load a quote board simply select the quoteboard you wish to load, a couple are
available as default, you can create your own in XML if required. Each QB is specific
to each datasource, if you are using IB use TECH_IB.xml, DOW_IB.xml, for DTN
use DOW_DTN.xml
And the resulting quoteboard.
12 Time and Sales.
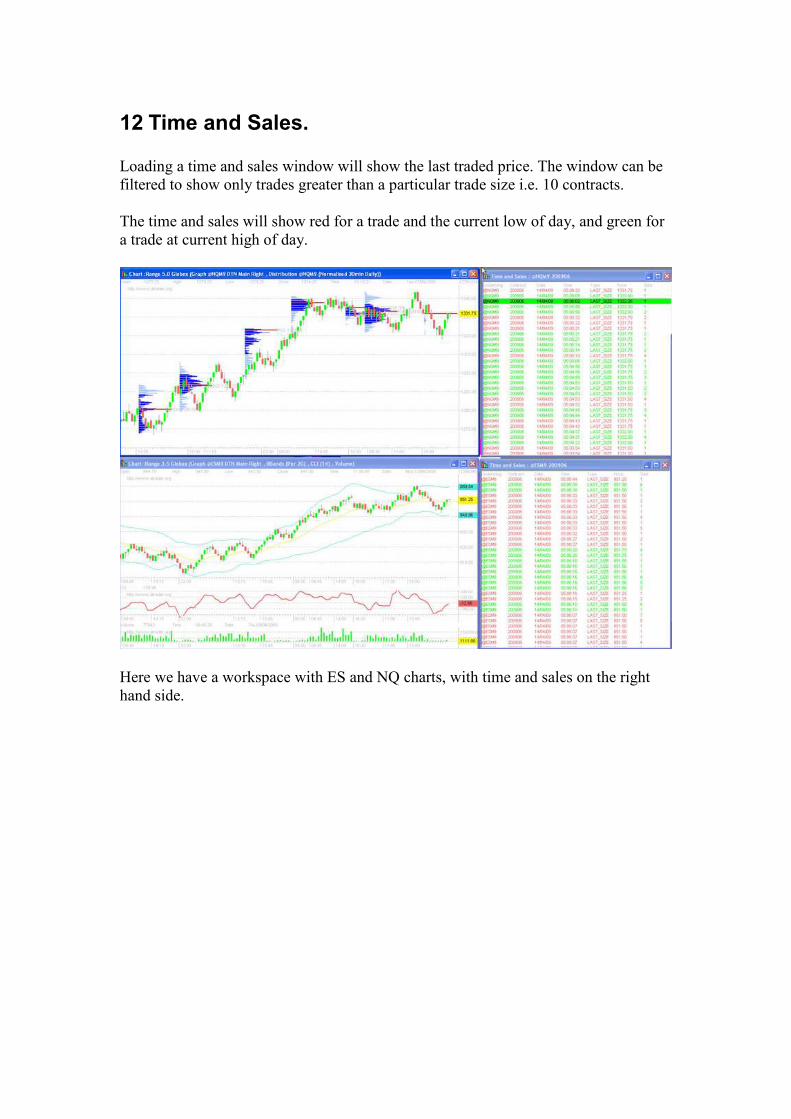
Loading a time and sales window will show the last traded price. The window can be
filtered to show only trades greater than a particular trade size i.e. 10 contracts.
The time and sales will show red for a trade and the current low of day, and green for
a trade at current high of day.
Here we have a workspace with ES and NQ charts, with time and sales on the right
hand side.
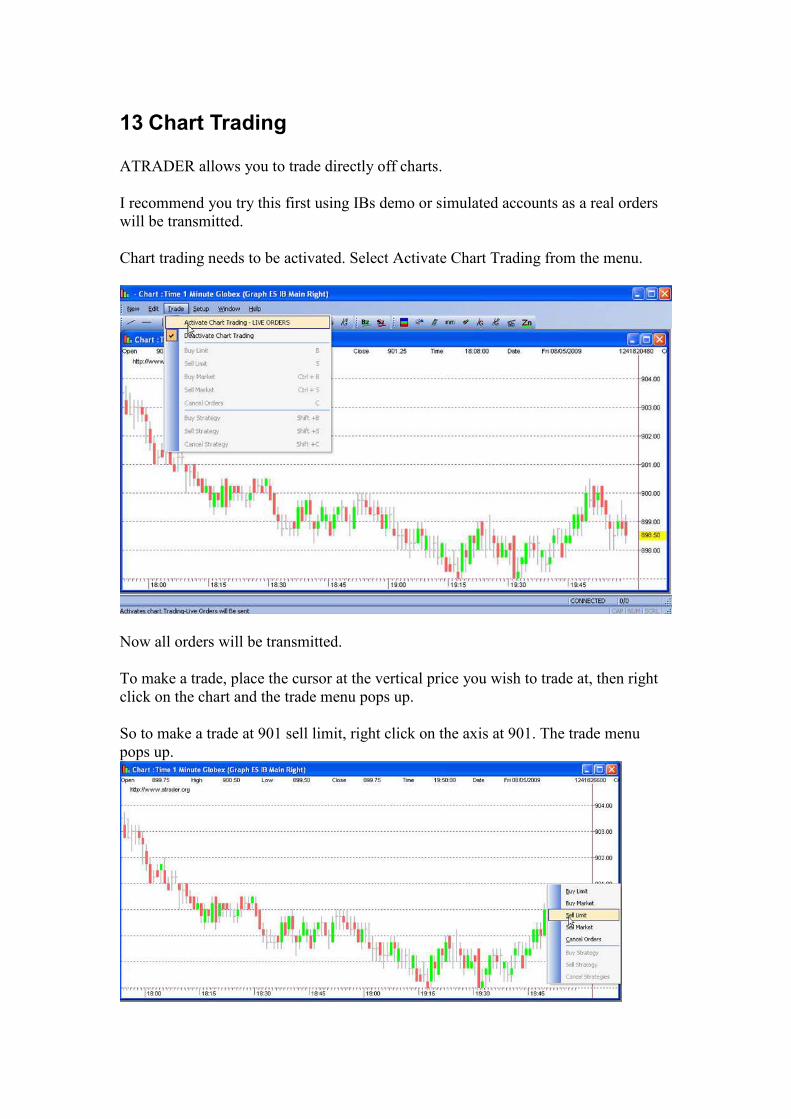
13 Chart Trading
ATRADER allows you to trade directly off charts.
I recommend you try this first using IBs demo or simulated accounts as a real orders
will be transmitted.
Chart trading needs to be activated. Select Activate Chart Trading from the menu.
Now all orders will be transmitted.
To make a trade, place the cursor at the vertical price you wish to trade at, then right
click on the chart and the trade menu pops up.
So to make a trade at 901 sell limit, right click on the axis at 901. The trade menu
pops up.
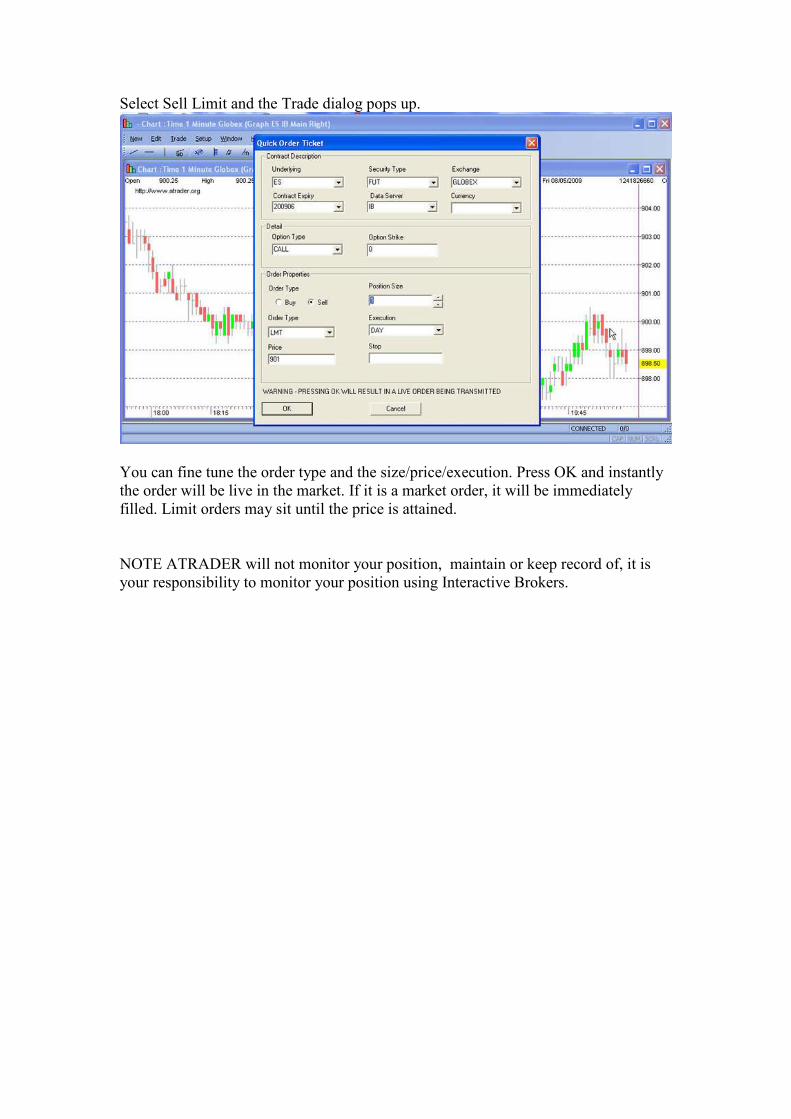
Select Sell Limit and the Trade dialog pops up.
You can fine tune the order type and the size/price/execution. Press OK and instantly
the order will be live in the market. If it is a market order, it will be immediately
filled. Limit orders may sit until the price is attained.
NOTE ATRADER will not monitor your position, maintain or keep record of, it is
your responsibility to monitor your position using Interactive Brokers.
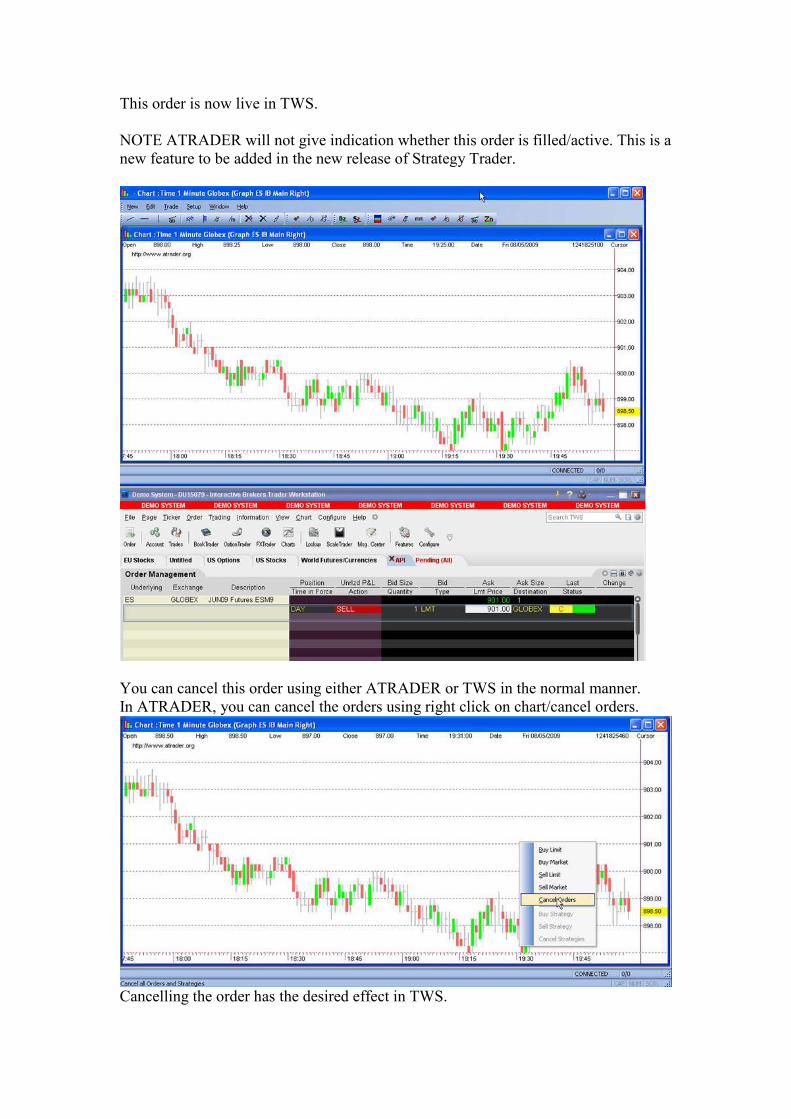
This order is now live in TWS.
NOTE ATRADER will not give indication whether this order is filled/active. This is a
new feature to be added in the new release of Strategy Trader.
You can cancel this order using either ATRADER or TWS in the normal manner.
In ATRADER, you can cancel the orders using right click on chart/cancel orders.
Cancelling the order has the desired effect in TWS.
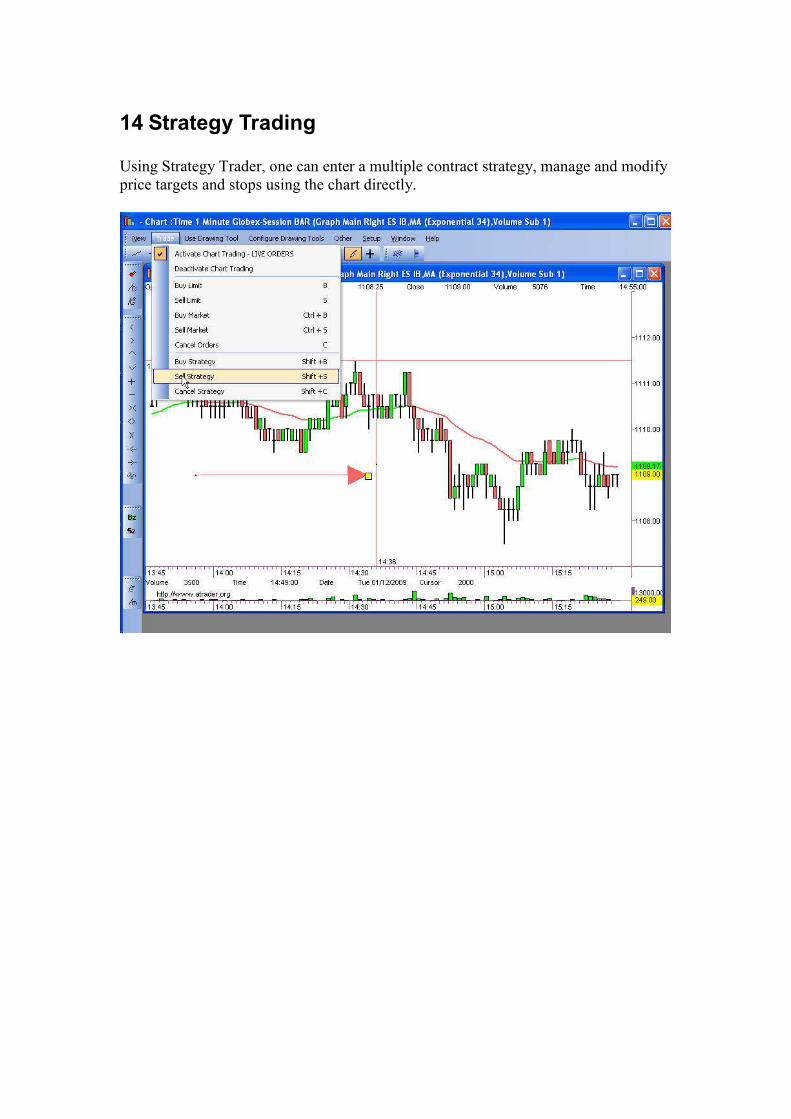
14 Strategy Trading
Using Strategy Trader, one can enter a multiple contract strategy, manage and modify
price targets and stops using the chart directly.
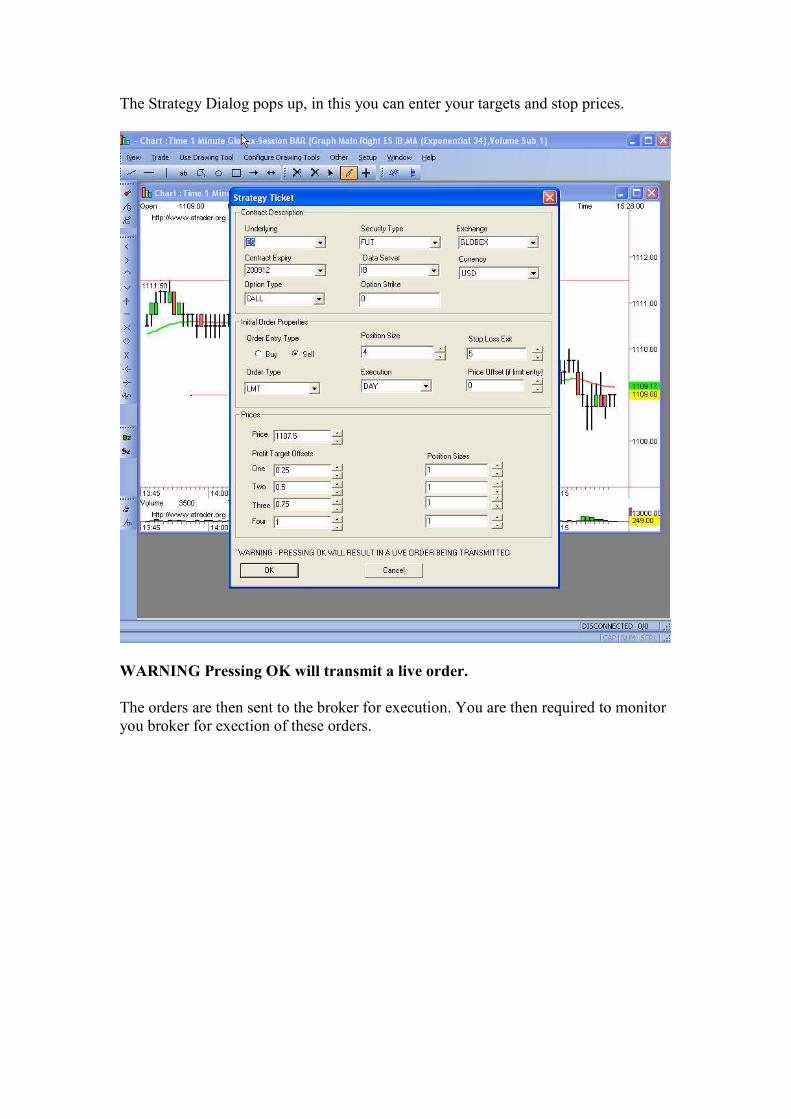
The Strategy Dialog pops up, in this you can enter your targets and stop prices.
WARNING Pressing OK will transmit a live order.
The orders are then sent to the broker for execution. You are then required to monitor
you broker for exection of these orders.
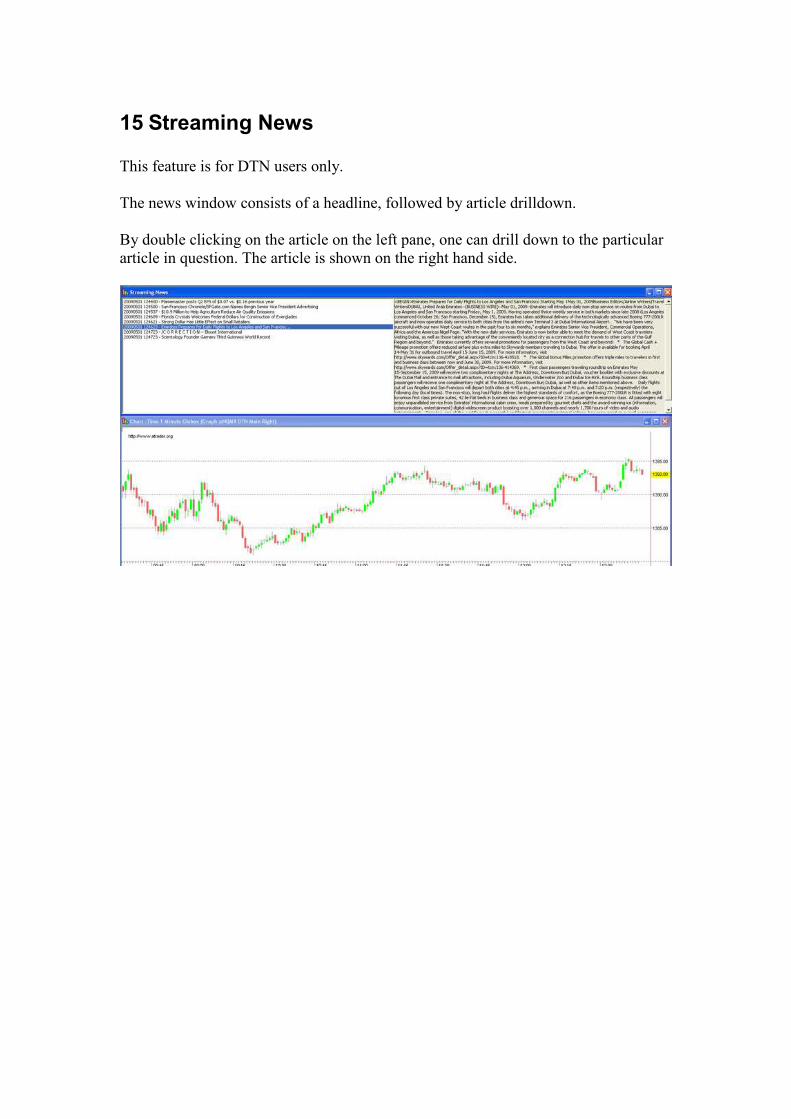
15 Streaming News
This feature is for DTN users only.
The news window consists of a headline, followed by article drilldown.
By double clicking on the article on the left pane, one can drill down to the particular
article in question. The article is shown on the right hand side.
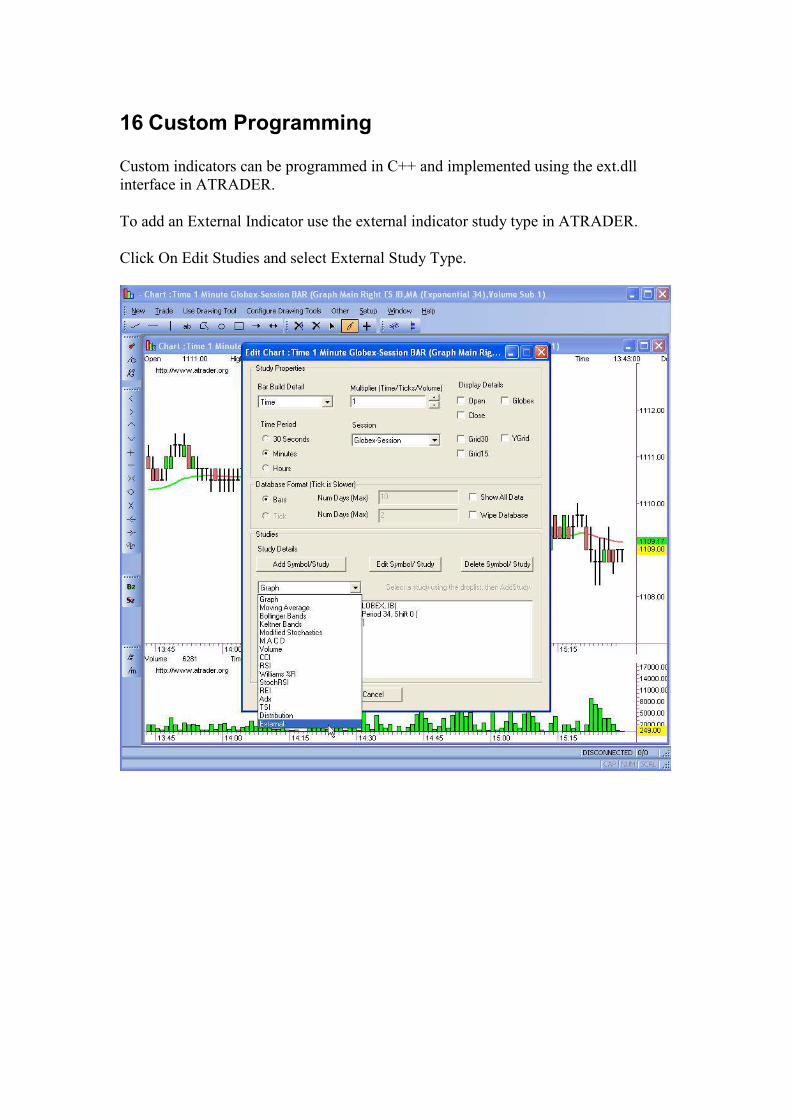
16 Custom Programming
Custom indicators can be programmed in C++ and implemented using the ext.dll
interface in ATRADER.
To add an External Indicator use the external indicator study type in ATRADER.
Click On Edit Studies and select External Study Type.
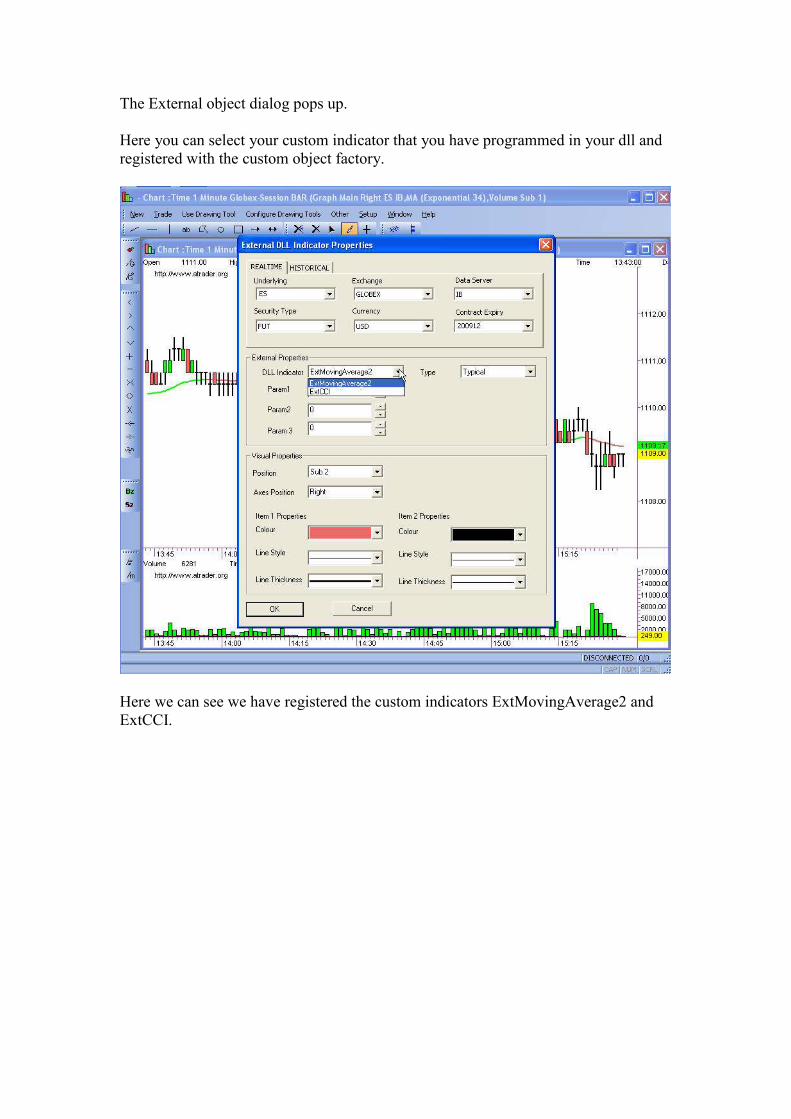
The External object dialog pops up.
Here you can select your custom indicator that you have programmed in your dll and
registered with the custom object factory.
Here we can see we have registered the custom indicators ExtMovingAverage2 and
ExtCCI.
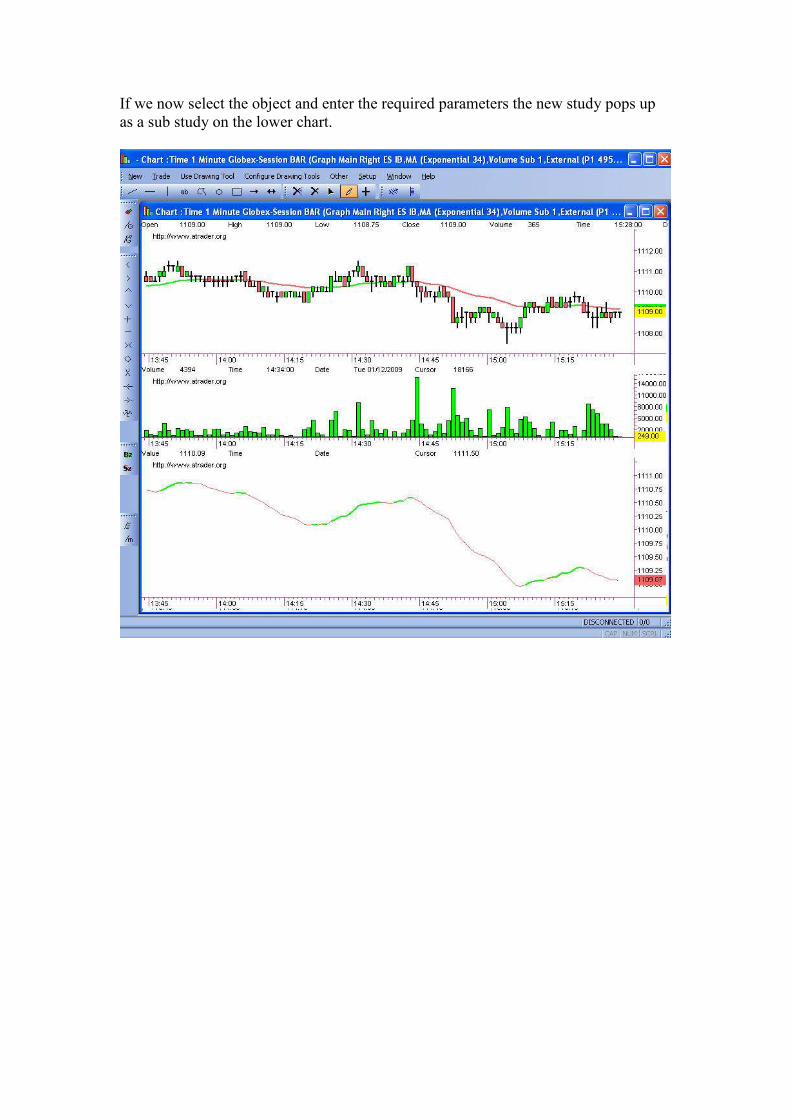
If we now select the object and enter the required parameters the new study pops up
as a sub study on the lower chart.
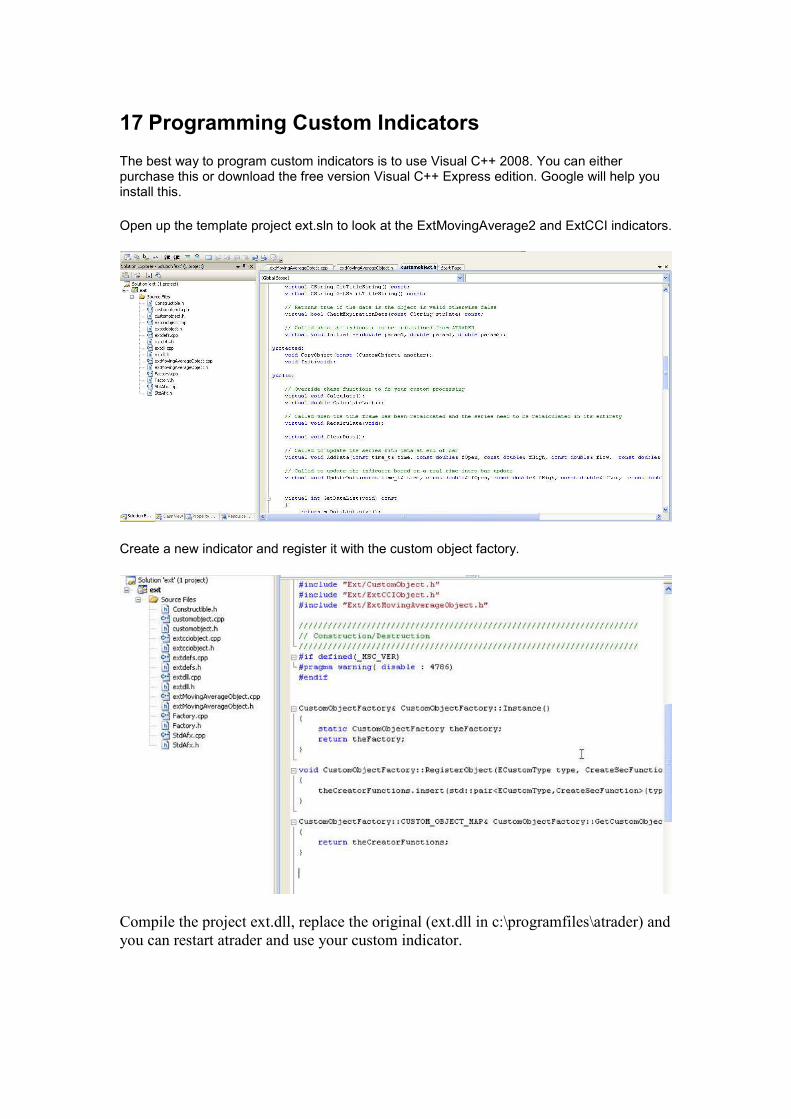
17 Programming Custom Indicators
The best way to program custom indicators is to use Visual C++ 2008. You can either purchase this or download the free version Visual C++ Express edition. Google will help you install this.
Open up the template project ext.sln to look at the ExtMovingAverage2 and ExtCCI indicators.
Create a new indicator and register it with the custom object factory.
Compile the project ext.dll, replace the original (ext.dll in c:\programfiles\atrader) and
you can restart atrader and use your custom indicator.

18 Sessions
ATRADER has a concept of a session. After close examination of data and charts it is surprising how many datafeeds and ISV do not provide correct data onto their charts, a pretty basic requirement.
Most provide incomplete or inaacurate data when trading activity is low overnight, or incorrect during the closed period.
Please check you current chart provider as you will find that nearly ALL providers don’t provide accurate charts with sessions. The only one that does is CQG at the moment to my knowledge, and ATRADER of course.
The key benefit or correct sessions is that charts are accurate and consistent with professional terminals. Trendlines and indicators are accurate.
ATRADER works on the following guidelines and rules.
If no data exists within the bar ie no trades and the bar is within context of a session, ATRADER will create a empty bar with zero volume with a price of the last close. If the last close is not defined ie first bar of the data series, it will move forward until the close is defined. This is only the case for the very first bar of the complete series. If the data is undefined at the start of the day, due to a gap, then the last close will be used and a bar will still be provided.
This is correct for historical backfill and real time streaming updates. During overnight periods and quiet activity the bar will always be created at the top of the minute if no trading activity occurs.
Bars will not be displayed for out of session times.
These can be selected using the Session Dropdown in the Create chart box. A separate database entry is created for each type session, that is a new file is created for each type of session data that is created.

18.1 Using a Session
Sessions are selected using the session selection dropdown box on Create Chart
dialog.
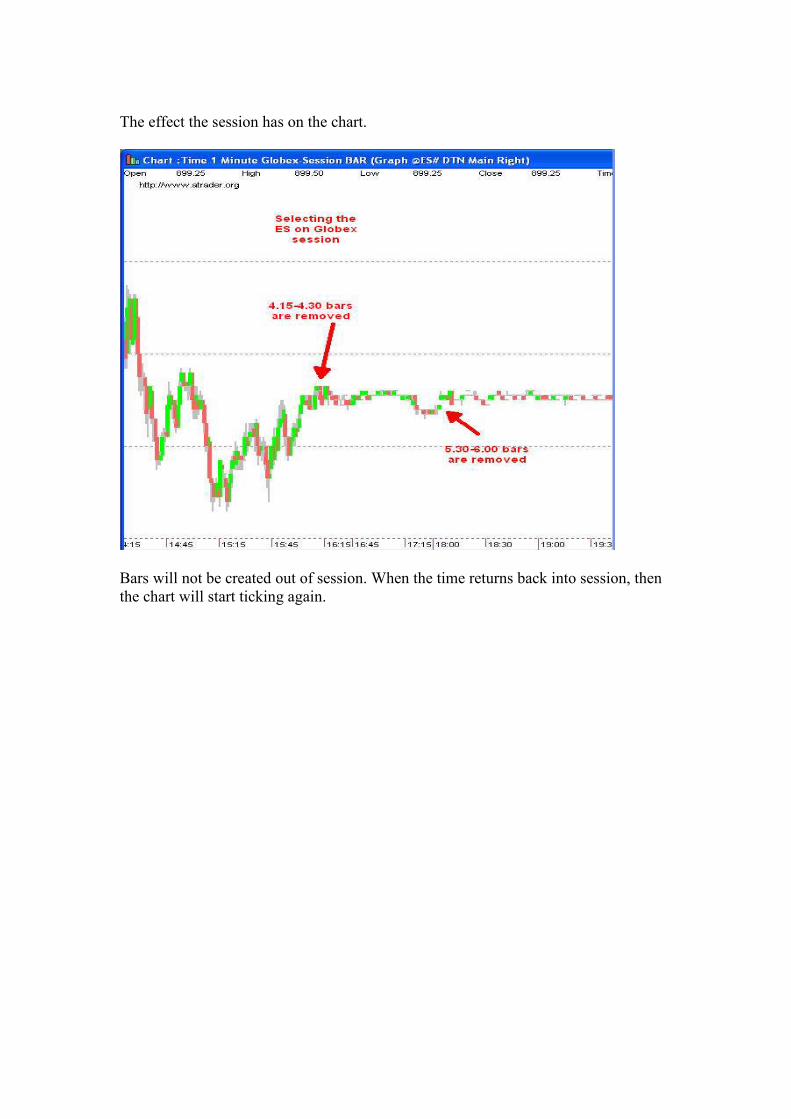
The effect the session has on the chart.
Bars will not be created out of session. When the time returns back into session, then
the chart will start ticking again.
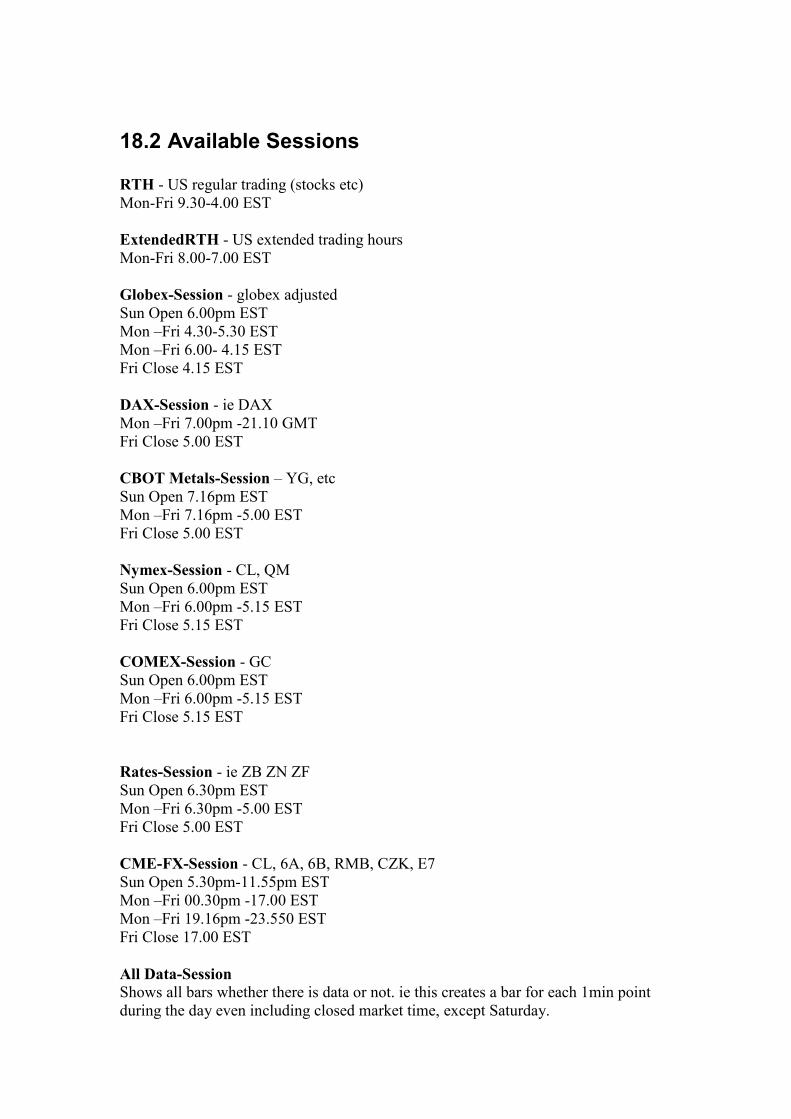
18.2 Available Sessions
RTH - US regular trading (stocks etc)
Mon-Fri 9.30-4.00 EST
ExtendedRTH - US extended trading hours
Mon-Fri 8.00-7.00 EST
Globex-Session - globex adjusted
Sun Open 6.00pm EST
Mon –Fri 4.30-5.30 EST
Mon –Fri 6.00- 4.15 EST
Fri Close 4.15 EST
DAX-Session - ie DAX
Mon –Fri 7.00pm -21.10 GMT
Fri Close 5.00 EST
CBOT Metals-Session – YG, etc
Sun Open 7.16pm EST
Mon –Fri 7.16pm -5.00 EST
Fri Close 5.00 EST
Nymex-Session - CL, QM
Sun Open 6.00pm EST
Mon –Fri 6.00pm -5.15 EST
Fri Close 5.15 EST
COMEX-Session - GC
Sun Open 6.00pm EST
Mon –Fri 6.00pm -5.15 EST
Fri Close 5.15 EST
Rates-Session - ie ZB ZN ZF
Sun Open 6.30pm EST
Mon –Fri 6.30pm -5.00 EST
Fri Close 5.00 EST
CME-FX-Session - CL, 6A, 6B, RMB, CZK, E7
Sun Open 5.30pm-11.55pm EST
Mon –Fri 00.30pm -17.00 EST
Mon –Fri 19.16pm -23.550 EST
Fri Close 17.00 EST
All Data-Session
Shows all bars whether there is data or not. ie this creates a bar for each 1min point
during the day even including closed market time, except Saturday.
See
https://www.mbtrading.com/f/futuretradinghours.pdf
For more details.
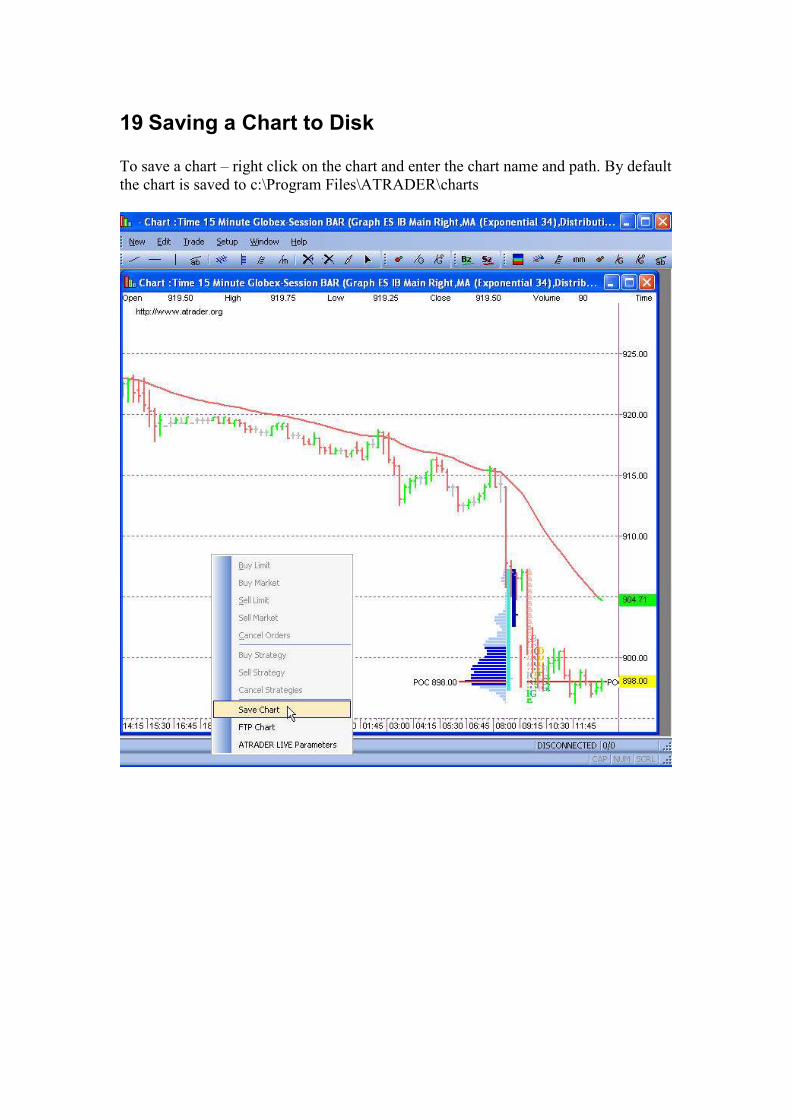
19 Saving a Chart to Disk
To save a chart – right click on the chart and enter the chart name and path. By default
the chart is saved to c:\Program Files\ATRADER\charts
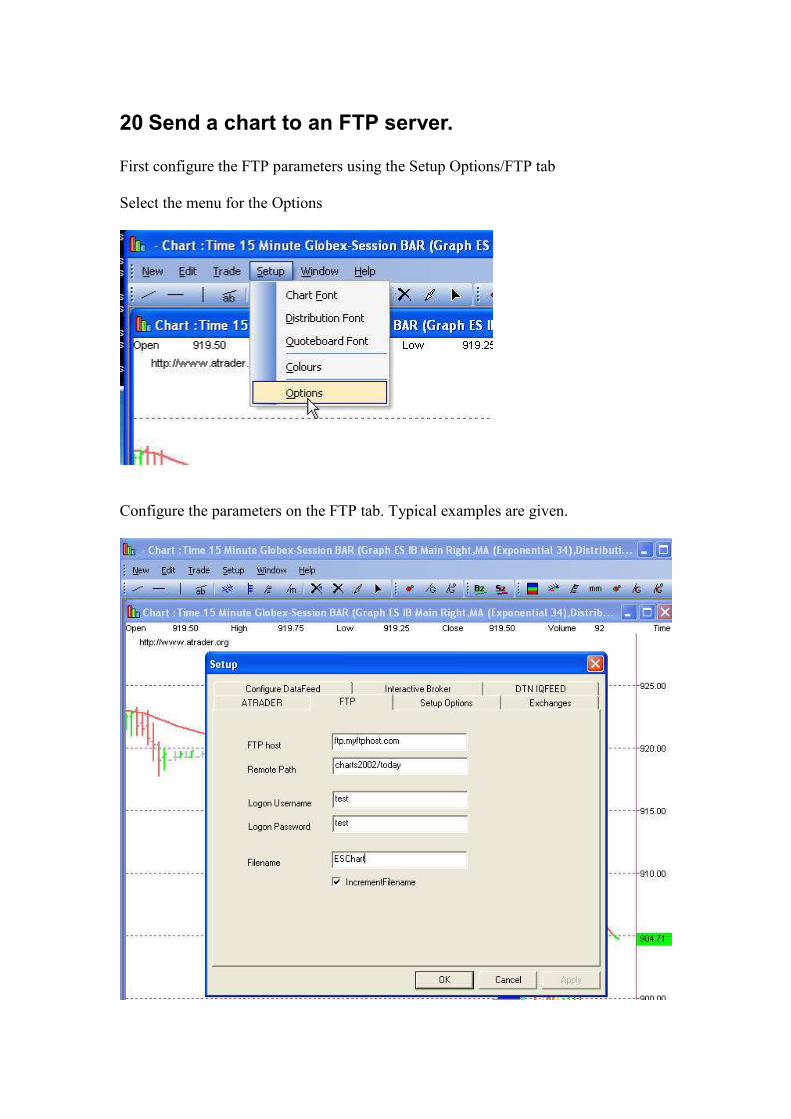
20 Send a chart to an FTP server.
First configure the FTP parameters using the Setup Options/FTP tab
Select the menu for the Options
Configure the parameters on the FTP tab. Typical examples are given.
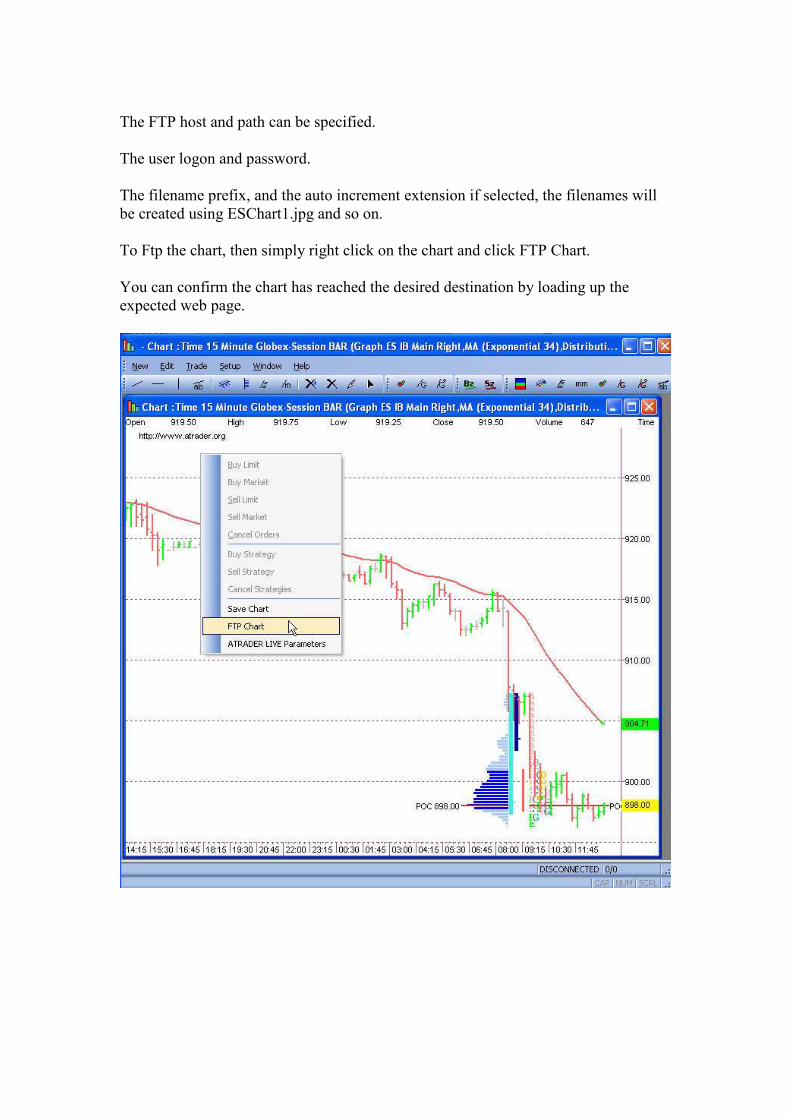
The FTP host and path can be specified.
The user logon and password.
The filename prefix, and the auto increment extension if selected, the filenames will
be created using ESChart1.jpg and so on.
To Ftp the chart, then simply right click on the chart and click FTP Chart.
You can confirm the chart has reached the desired destination by loading up the
expected web page.
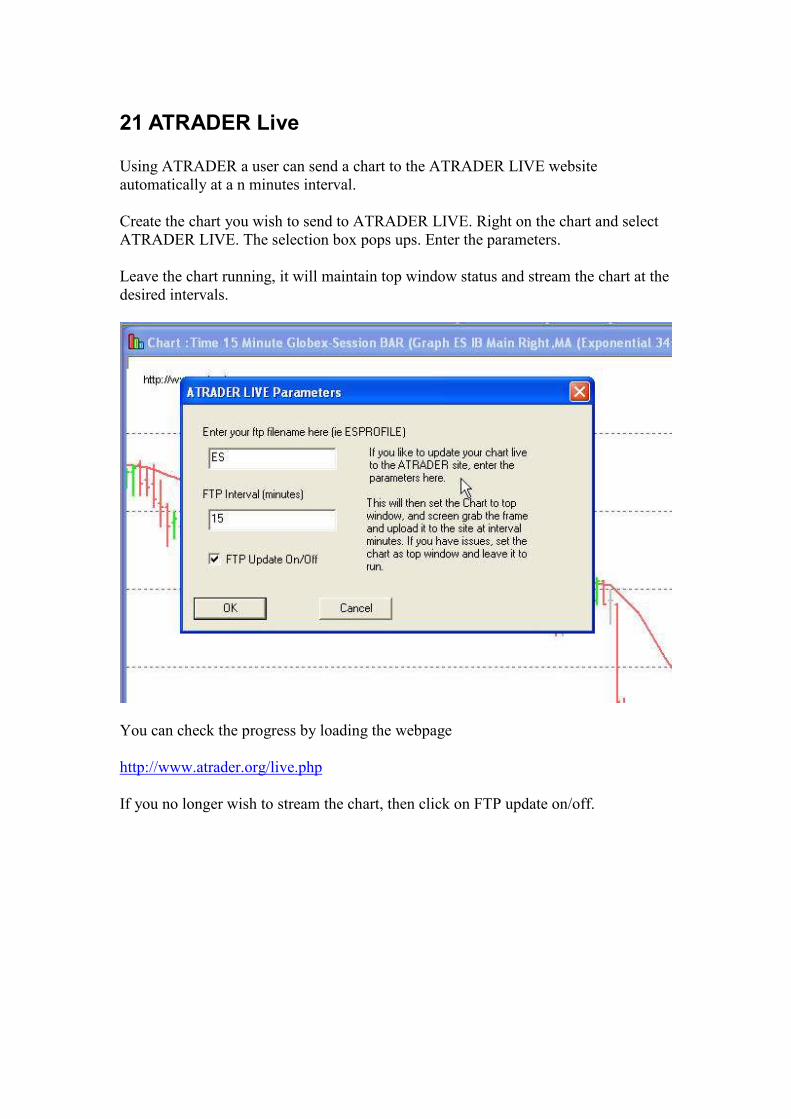
21 ATRADER Live
Using ATRADER a user can send a chart to the ATRADER LIVE website
automatically at a n minutes interval.
Create the chart you wish to send to ATRADER LIVE. Right on the chart and select
ATRADER LIVE. The selection box pops ups. Enter the parameters.
Leave the chart running, it will maintain top window status and stream the chart at the
desired intervals.
You can check the progress by loading the webpage
http://www.atrader.org/live.php
If you no longer wish to stream the chart, then click on FTP update on/off.
22 FAQ And Problems
22.1 Cleaning out your archive.
Sometimes your data archive may get corrupted for whatever reason. If this happens
its often a good idea to clean out you C:\Program Files\Atrader\data\historical\bar and
delete all your bar files, or clean individual files, if you know which are which.
This will force ATRADER to re-download all the data. In this case the charts will get
recreated from new downloaded data.
If you find a bad tick then this can be pinpointed using the cursor, the time recorded
and the tick deleted from the corresponding .bar file.
22.2 Saving a workspace.
Saving a Workspace using New/Save Workspace, should result in the creation of a
file, C:\Program Files\Atrader\dat\tradersettings.dat.
If you notice loading problems, crashes or inconsistent behaviour on start up, this file
could have been corrupted. If this is the case, the please delete this file and recreate
you workspace.
22.3 Crash Reports.
If ATRADER crashes it creates a dump report. This is extremely helpful in tracking
down this issue as it creates a minidump which can be loaded into the bug tracker and
the exact crash line pinpointed. What could take hours of debugging usually takes
seconds.
If you ever get a crash please look for the crash report, zip it up and email it with a
comment to [email protected].
ATRADER creates a directory
C:\Program Files\Atrader\crashreports
within this directory, each crash is identifed by the time by creating a subdirectory
05_06_09_19_51_35 ie day_month_year_hour_min_sec. ATRADER will also pop up
a dialog box which will tell you which directory has been created.
The contents of this is what you want to send to support.
In your email, it would also be helpful to indicate what you were doing just before the
crash (if anything).