Embed Size (px)
Citation preview

This presentation is provided by AllianceBernstein L.P. Bernstein Global Wealth Management is a unit of AllianceBernstein L.P. This presentation booklet has been provided to you for use in a private and confidential meeting to discuss a potential or existing investment advisory relationship. This presentation is not an advertisement and is not intended for public use or distribution beyond our private meeting. Bernstein does not provide tax, legal or accounting advice. In considering this material, you should discuss your individual circumstances with professionals in those areas before making any decisions.
The ATRA-MathEstate Planning After the American Taxpayer Relief Act of 2012
National Association of Estate Planners & CouncilsRobert G. Alexander Webinar Series
April 9, 2014
Your speaker:Thomas J. Pauloski, J.D.
National Managing Director—Wealth Management GroupChicago, Illinois
The ATRA-MathBernstein.com 1
Bernstein does not provide tax, legal, or accounting advice. In considering the
information contained in this presentation, you should independently verify all
conclusions before implementing any strategy on your own behalf or on behalf of
your client.
The ATRA-MathBernstein.com
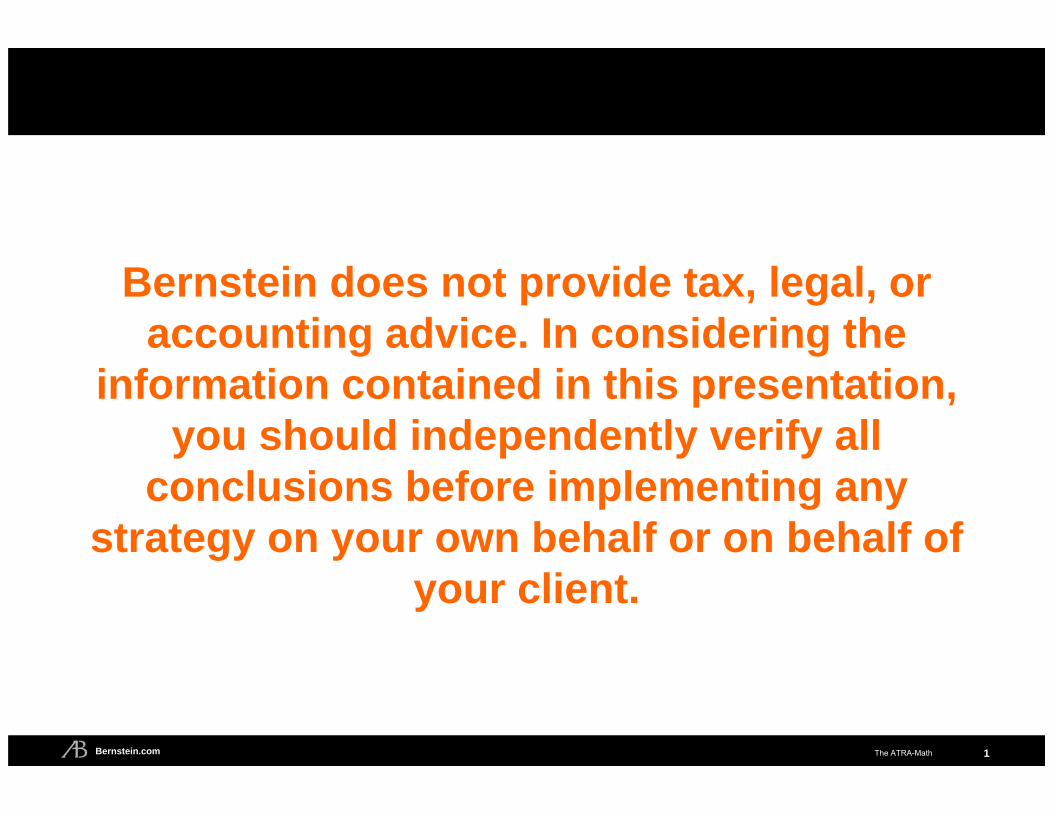
Federal Wealth Transfer and Income Taxes: Then and Now
2
*The top income tax rates in 2013 include the 3.8% Medicare surtax on net investment income. The top ordinary income/short-term gain rate and qualified dividend/long-term gain rate in 2013 is 39.6% and 20%, respectively.Source: Internal Revenue Service (IRS) and AllianceBernstein
2001 2013
$5.25 Mil.
$675,000
2001 2013
15.0%23.8%
35.0%43.4%
2003 2013
55%40%
Applicable Exclusion Amount
Transfer Tax Rate
Income Tax Rates*
Long-Term Capital Gain/Qualified Dividend
Short-Term Capital Gain/Ordinary Income

The ATRA-MathBernstein.com 3
FloridaNo Income Tax,
No State Death Tax
CaliforniaHigh Income Tax,
No State Death Tax
New York CityHigh Income Tax,State Death Tax
40.0%
23.8%
49.6%
37.1%
52%
CapitalGain Tax
EstateTax
*Based on Health Care and Education Reconciliation Act of 2010 and the American Taxpayer Relief Act of 2012. Rates represent Bernstein’s estimate of the top marginal tax, federal and state income, capital gains and estate tax brackets. Blended rates assume the taxpayers in New York City and California are in AMT. Bernstein is not a legal, tax or estate advisor. Investors should consult these professionals as appropriate before making any decisions. Numbers may not sum due to rounding. Source: IRS and AllianceBernstein
State/Local
Medicare
Federal
Blended Rate*
WashingtonNo Income Tax,State Death Tax
40.0%
23.8%
36.5%
CapitalGain Tax
EstateTax
CapitalGain Tax
EstateTax
CapitalGain Tax
EstateTax
“Gap” Between Estate and Capital Gain Tax Rates Varies by State
2.9%
13.1%
16.2%
28.2%
The ATRA-MathBernstein.com 4
Washington
Oregon
ArizonaNew Mexico
Texas
Hawaii
Oklahoma
KansasColorado
UtahNevada
California
Idaho
Montana North Dakota
South Dakota
Nebraska
Minnesota
Iowa
Missouri
Arkansas
Mississippi
Alabama
Louisiana
Florida
Georgia
Tennessee
Wisconsin
Illinois Indiana Ohio
Michigan
Kentucky
New Jersey
New York
Rhode Island
Massachusetts
Maine
Wyoming
Pennsylvania
Virginia
West Virginia
Delaware
Maryland
Vermont
SouthCarolina
North Carolina
Alaska
Connecticut
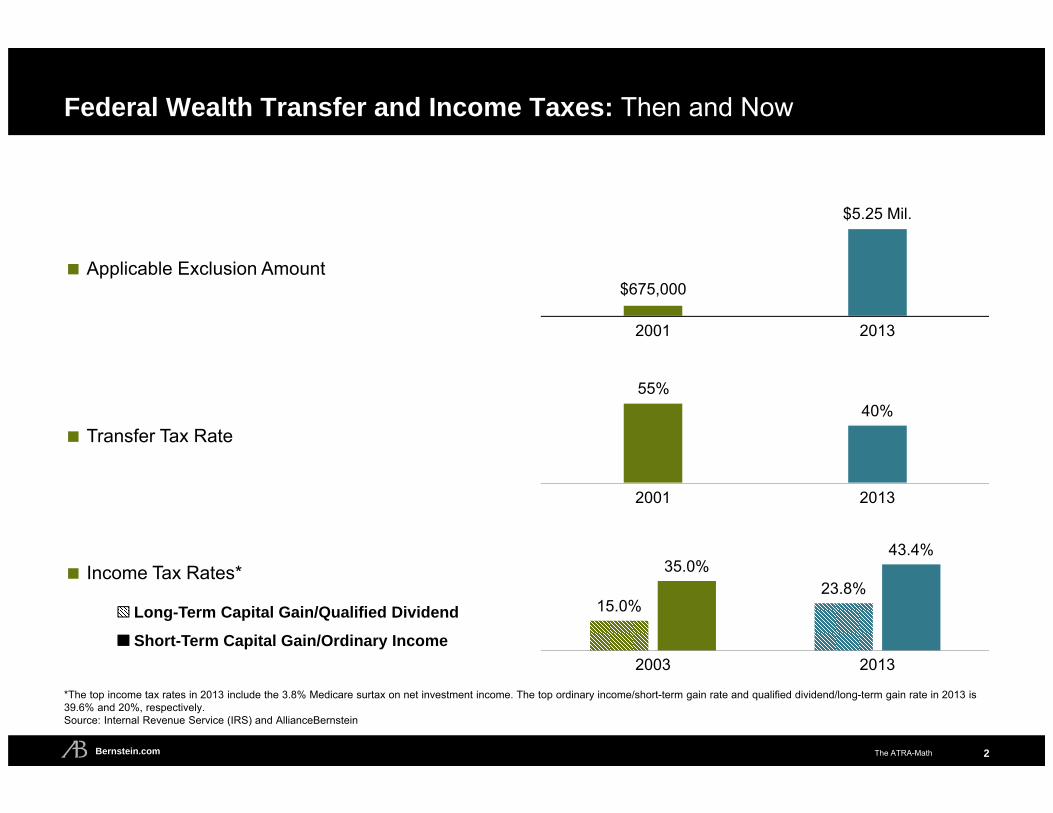
Small Gap (<10%)
Average Gap (10%–15%)
Large Gap (>15%)
State Estate Tax and/or Inheritance Tax
*As of July 31, 2013. See Notes on State Income Taxes and State Death Taxes in the Appendix for further details. Bernstein does not provide tax, legal or accounting advice. In considering this material, you should discuss your individual circumstances with professionals in those areas before making any decisions.
New Hampshire
“Gap Map:” Estate and Capital Gain Tax Rate Differentials by State*
The ATRA-MathBernstein.com
5
10
15
20
2018 2023 2028 2033 2038
5
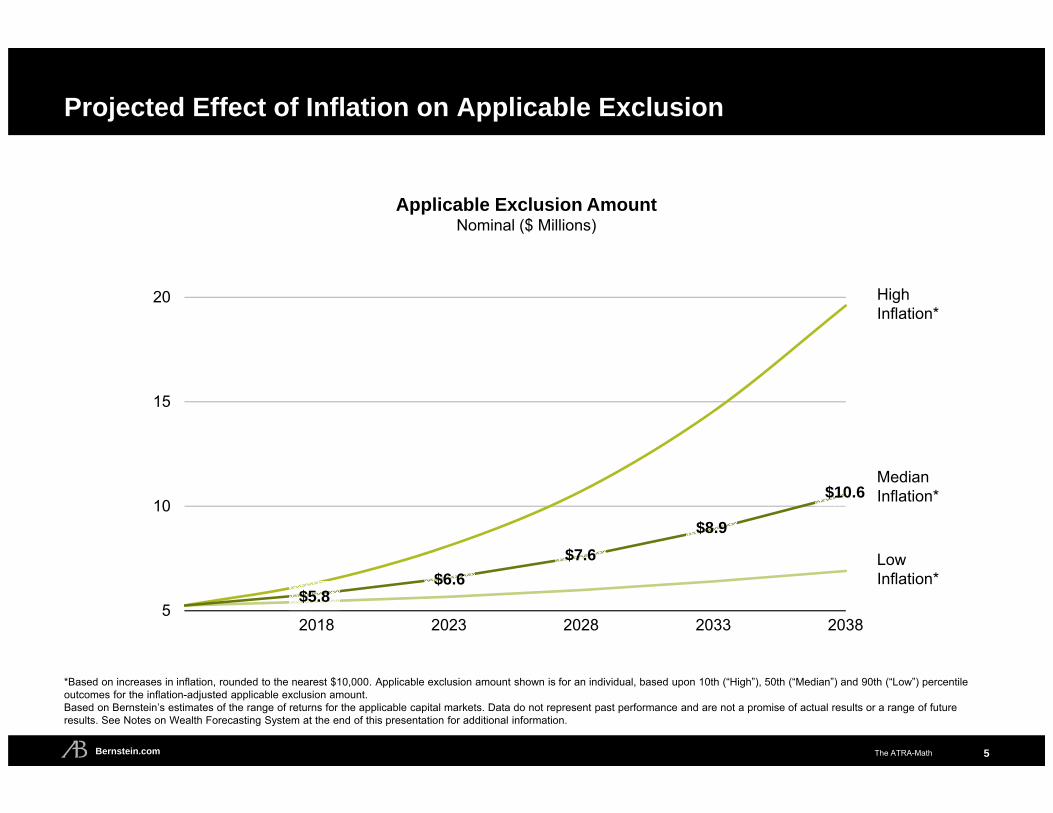
*Based on increases in inflation, rounded to the nearest $10,000. Applicable exclusion amount shown is for an individual, based upon 10th (“High”), 50th (“Median”) and 90th (“Low”) percentile outcomes for the inflation-adjusted applicable exclusion amount.Based on Bernstein’s estimates of the range of returns for the applicable capital markets. Data do not represent past performance and are not a promise of actual results or a range of future results. See Notes on Wealth Forecasting System at the end of this presentation for additional information.
Applicable Exclusion Amount Nominal ($ Millions)
Low Inflation*
HighInflation*
Projected Effect of Inflation on Applicable Exclusion
Median Inflation*
$5.8$6.6
$7.6$8.9
$10.6
The ATRA-MathBernstein.com
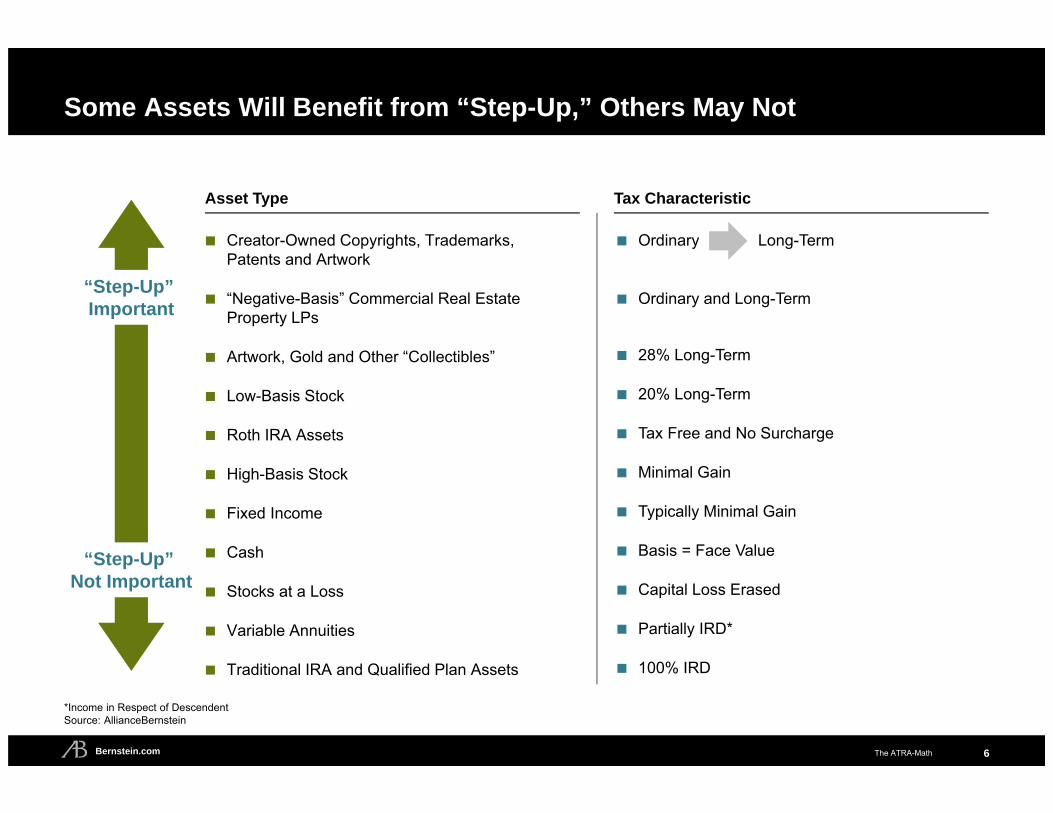
Ordinary Long-Term
Ordinary and Long-Term
28% Long-Term
20% Long-Term
Tax Free and No Surcharge
Minimal Gain
Typically Minimal Gain
Basis = Face Value
Capital Loss Erased
Partially IRD*
100% IRD
Creator-Owned Copyrights, Trademarks, Patents and Artwork
“Negative-Basis” Commercial Real Estate Property LPs
Artwork, Gold and Other “Collectibles”
Low-Basis Stock
Roth IRA Assets
High-Basis Stock
Fixed Income
Cash
Stocks at a Loss
Variable Annuities
Traditional IRA and Qualified Plan Assets
6
“Step-Up” Important
“Step-Up” Not Important
*Income in Respect of DescendentSource: AllianceBernstein
Asset Type
Some Assets Will Benefit from “Step-Up,” Others May Not
Tax Characteristic

The ATRA-MathBernstein.com
Available applicableexclusion amount
Tax domicile
Time horizon
Tax basis Asset allocation
Spending
Tax domicile
Marginal capitalgain tax rate
Donor Donee
No Fewer than Eight Variables May Affect ATRA-Math Calculus
7
Do you normally discuss these issues with your clients?
Source: AllianceBernstein
The ATRA-MathBernstein.com
Part I Lifetime Transfers
8
The ATRA-MathBernstein.com
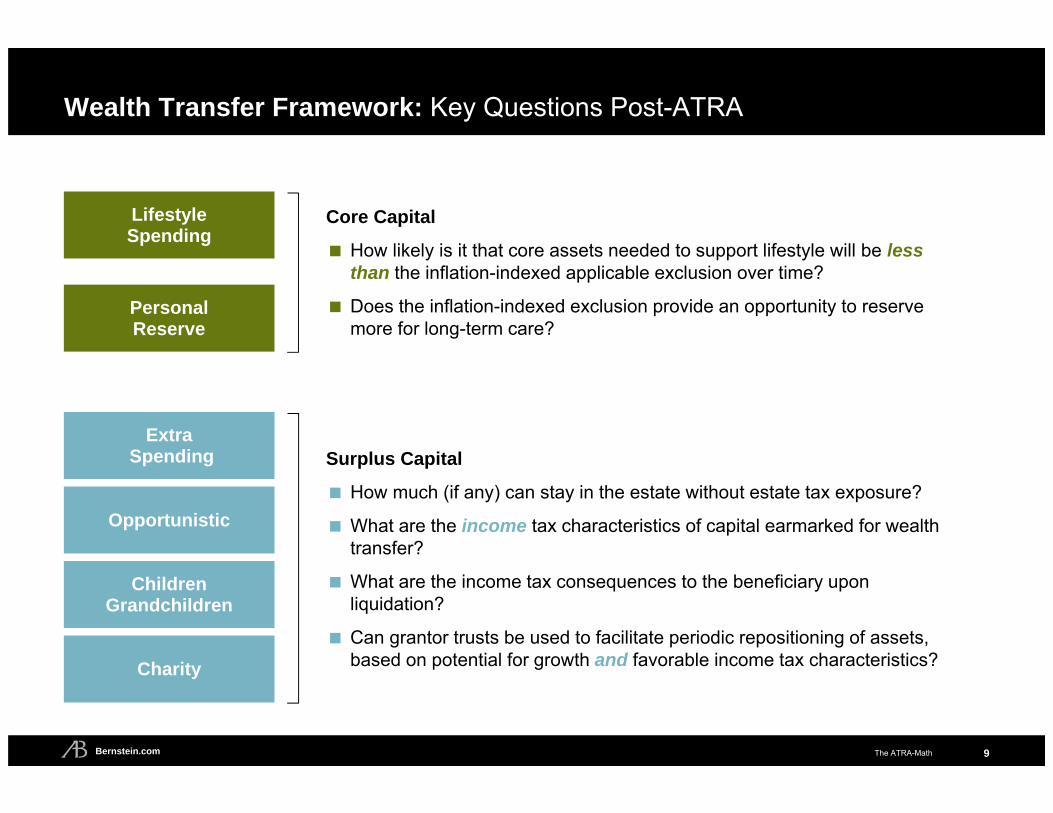
Wealth Transfer Framework: Key Questions Post-ATRA
LifestyleSpending
ExtraSpending
PersonalReserve
Opportunistic
ChildrenGrandchildren
Charity
Core Capital
How likely is it that core assets needed to support lifestyle will be less than the inflation-indexed applicable exclusion over time?
Does the inflation-indexed exclusion provide an opportunity to reserve more for long-term care?
Surplus Capital
How much (if any) can stay in the estate without estate tax exposure?
What are the income tax characteristics of capital earmarked for wealth transfer?
What are the income tax consequences to the beneficiary upon liquidation?
Can grantor trusts be used to facilitate periodic repositioning of assets, based on potential for growth and favorable income tax characteristics?
9
The ATRA-MathBernstein.com
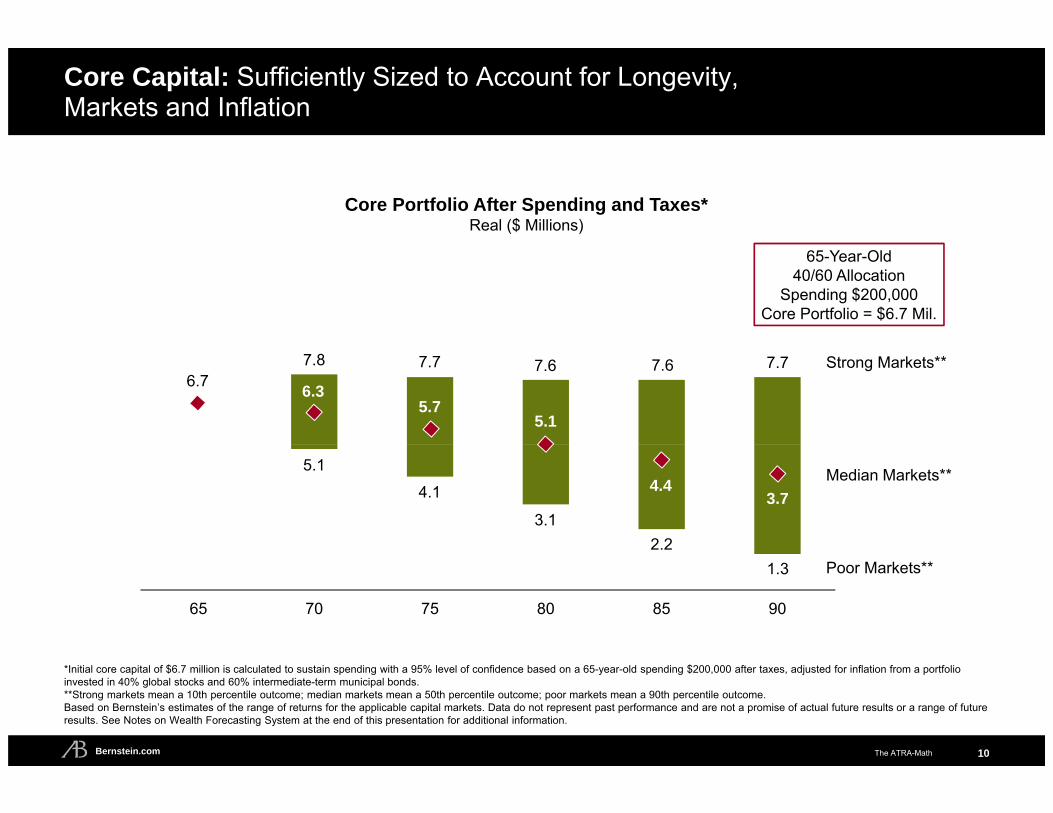
65 70 75 80 85 90
*Initial core capital of $6.7 million is calculated to sustain spending with a 95% level of confidence based on a 65-year-old spending $200,000 after taxes, adjusted for inflation from a portfolio invested in 40% global stocks and 60% intermediate-term municipal bonds. **Strong markets mean a 10th percentile outcome; median markets mean a 50th percentile outcome; poor markets mean a 90th percentile outcome. Based on Bernstein’s estimates of the range of returns for the applicable capital markets. Data do not represent past performance and are not a promise of actual future results or a range of future results. See Notes on Wealth Forecasting System at the end of this presentation for additional information.
Core Portfolio After Spending and Taxes*Real ($ Millions)
65-Year-Old40/60 Allocation
Spending $200,000Core Portfolio = $6.7 Mil.
Strong Markets**
Poor Markets**
Median Markets**
Core Capital: Sufficiently Sized to Account for Longevity, Markets and Inflation
10
5.1
6.77.8 7.7 7.6 7.6 7.7
4.1
3.12.2
1.3
6.35.7
5.1
4.43.7
The ATRA-MathBernstein.com
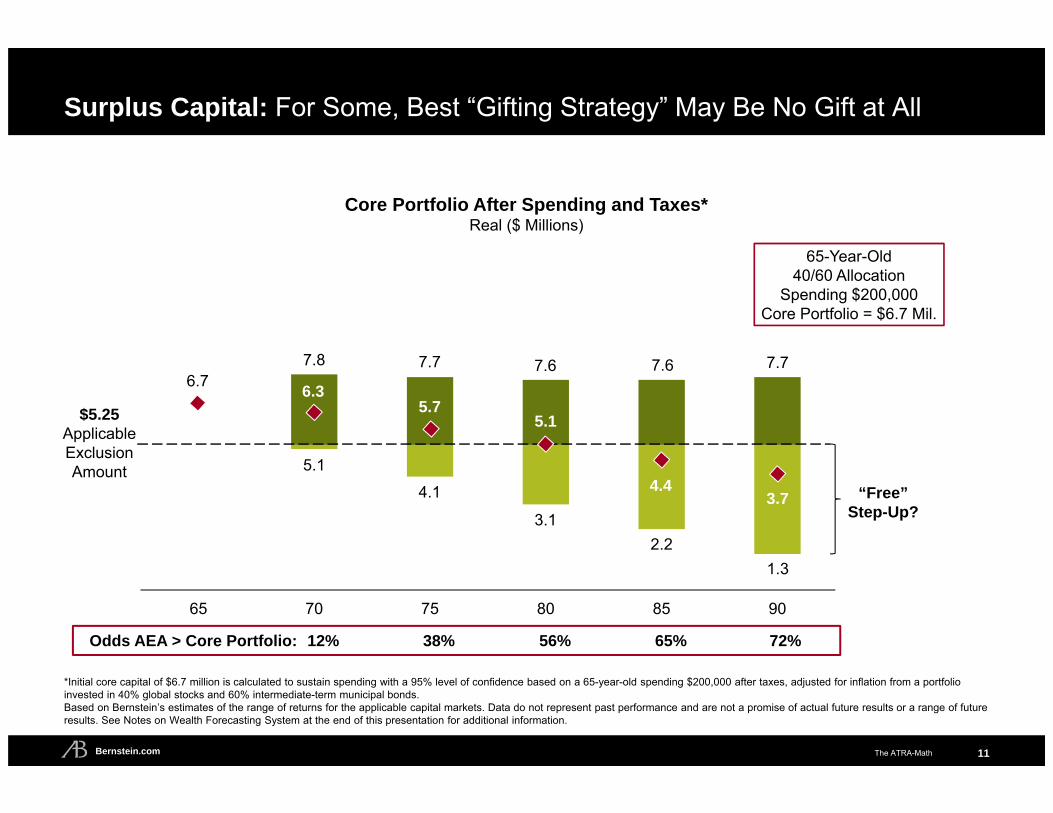
65 70 75 80 85 90
65-Year-Old40/60 Allocation
Spending $200,000Core Portfolio = $6.7 Mil.
5.1
6.77.8 7.7 7.6 7.6 7.7
4.1
3.12.2
1.3
6.35.7
5.1
4.43.7
Core Portfolio After Spending and Taxes*Real ($ Millions)
11
12% 38% 56% 65% 72%
Surplus Capital: For Some, Best “Gifting Strategy” May Be No Gift at All
*Initial core capital of $6.7 million is calculated to sustain spending with a 95% level of confidence based on a 65-year-old spending $200,000 after taxes, adjusted for inflation from a portfolio invested in 40% global stocks and 60% intermediate-term municipal bonds. Based on Bernstein’s estimates of the range of returns for the applicable capital markets. Data do not represent past performance and are not a promise of actual future results or a range of future results. See Notes on Wealth Forecasting System at the end of this presentation for additional information.
$5.25ApplicableExclusionAmount
Odds AEA > Core Portfolio:
“Free” Step-Up?

The ATRA-MathBernstein.com
Case Study Relationship Between Spending and Estate Tax
12
The ATRA-MathBernstein.com
Spending and Estate Tax Case Study Assumptions
Married couple with a $20 million liquid estate and no prior gifts
Spending $875,000 annually (indexed for inflation)
20-year planning horizon
Assets invested 60% in stocks, 40% in bonds*
Considerable estate tax exposure today…
…but given their spending requirements (and lack of surplus capital) a sizable gift may jeopardize their financial security if future market and inflation conditions are hostile
13
*“Stocks” mean globally diversified stocks; “bonds” mean intermediate-term municipal bonds. “Globally diversified” means 21% US value stocks, 21% US growth stocks, 21% US diversified stocks, 7% US small- and mid-cap stocks, 22.5% developed international stocks, and 7.5% emerging market stocks. See Notes on Wealth Forecasting System at the end of this presentation for additional information.Source: AllianceBernstein
Key planning question: Can they reduce their estate tax exposure over time without jeopardizing their lifestyle?

The ATRA-MathBernstein.com
95% 93%
83%
64%
No Gift Gift $1 Mil. Gift $3 Mil. Gift $5 Mil.
14
Surplus Capital: Not Much to Work With
Probability of Meeting Spending PlanYear 20*
*Defined as portfolio value of at least $1 in Year 20; based on Bernstein’s estimates of the range of returns for the applicable capital markets over the next 20 years assuming 60% global stocks and 40% intermediate-term municipal bonds. Data do not represent past performance and are not a promise of actual future results or a range of future results.See Notes on Wealth Forecasting System at the end of this presentation for additional information.
The ATRA-MathBernstein.com 15
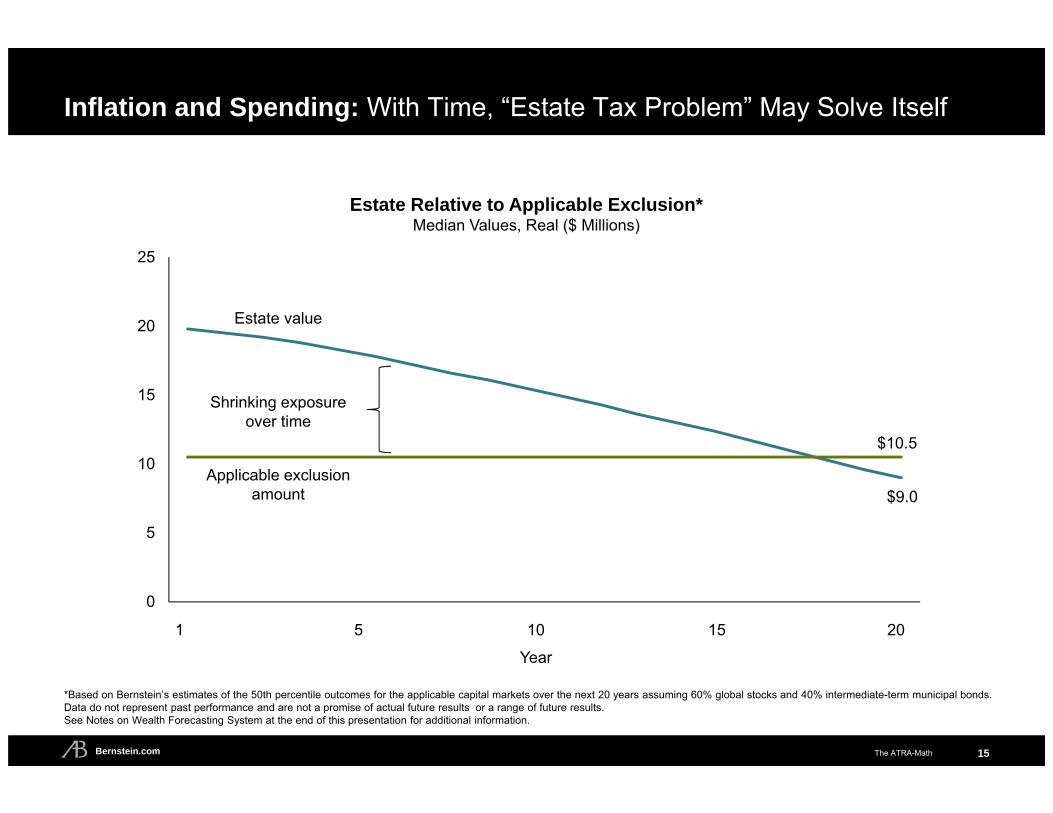
$9.0
$10.5
0
5
10
15
20
25
Estate value
Applicable exclusion amount
Estate Relative to Applicable Exclusion*Median Values, Real ($ Millions)
Shrinking exposure over time
1 10 20
Year
Inflation and Spending: With Time, “Estate Tax Problem” May Solve Itself
*Based on Bernstein’s estimates of the 50th percentile outcomes for the applicable capital markets over the next 20 years assuming 60% global stocks and 40% intermediate-term municipal bonds. Data do not represent past performance and are not a promise of actual future results or a range of future results.See Notes on Wealth Forecasting System at the end of this presentation for additional information.
5 15
The ATRA-MathBernstein.com
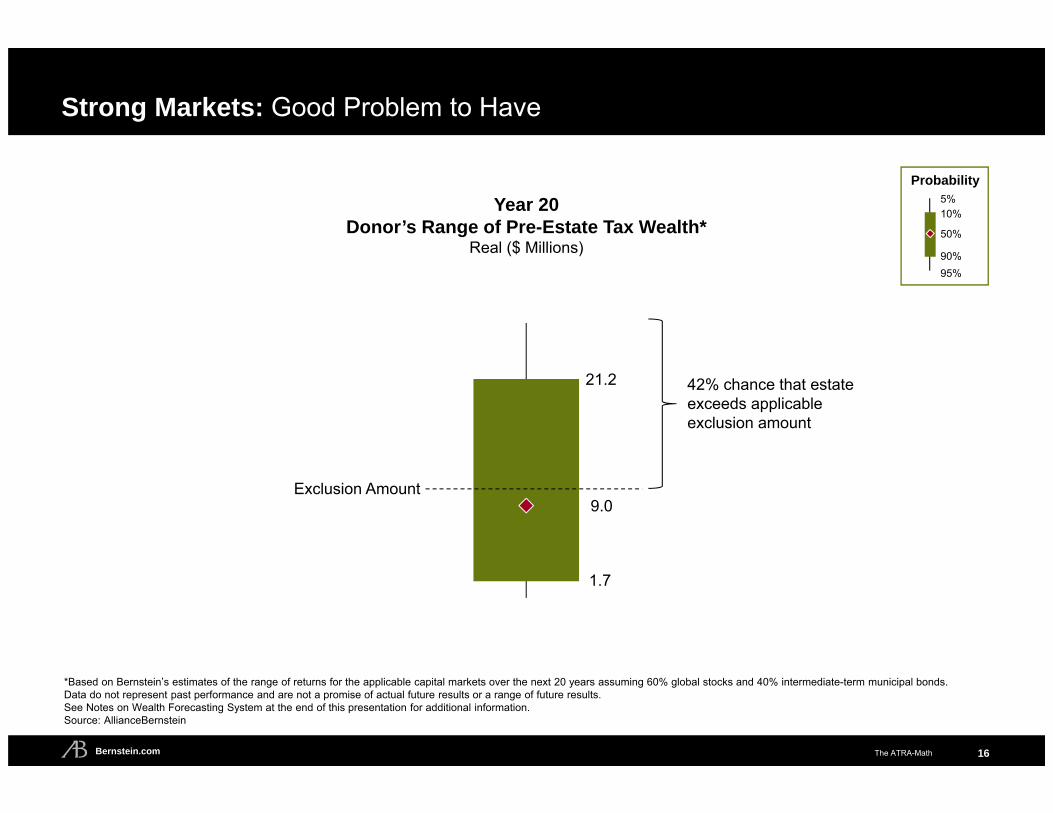
21.2
1.7
9.0
16
*Based on Bernstein’s estimates of the range of returns for the applicable capital markets over the next 20 years assuming 60% global stocks and 40% intermediate-term municipal bonds. Data do not represent past performance and are not a promise of actual future results or a range of future results.See Notes on Wealth Forecasting System at the end of this presentation for additional information.Source: AllianceBernstein
Year 20Donor’s Range of Pre-Estate Tax Wealth*
Real ($ Millions)
Strong Markets: Good Problem to Have
Exclusion Amount
42% chance that estate exceeds applicable exclusion amount
5%10%
50%
90%95%
Probability
The ATRA-MathBernstein.com
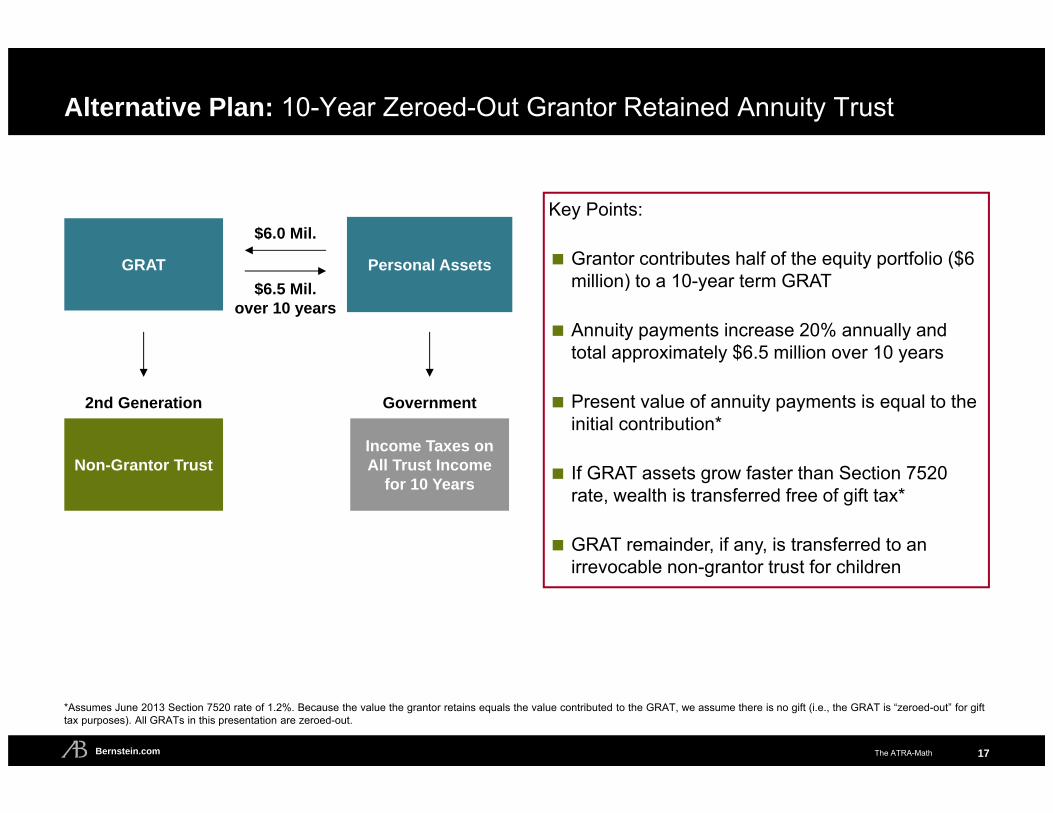
Alternative Plan: 10-Year Zeroed-Out Grantor Retained Annuity Trust
GRAT Personal Assets
2nd Generation
Non-Grantor Trust
Government
Income Taxes on All Trust Income
for 10 Years
*Assumes June 2013 Section 7520 rate of 1.2%. Because the value the grantor retains equals the value contributed to the GRAT, we assume there is no gift (i.e., the GRAT is “zeroed-out” for gift tax purposes). All GRATs in this presentation are zeroed-out.
$6.5 Mil.over 10 years
$6.0 Mil.Key Points:
Grantor contributes half of the equity portfolio ($6 million) to a 10-year term GRAT
Annuity payments increase 20% annually and total approximately $6.5 million over 10 years
Present value of annuity payments is equal to the initial contribution*
If GRAT assets grow faster than Section 7520 rate, wealth is transferred free of gift tax*
GRAT remainder, if any, is transferred to an irrevocable non-grantor trust for children
17
The ATRA-MathBernstein.com 18
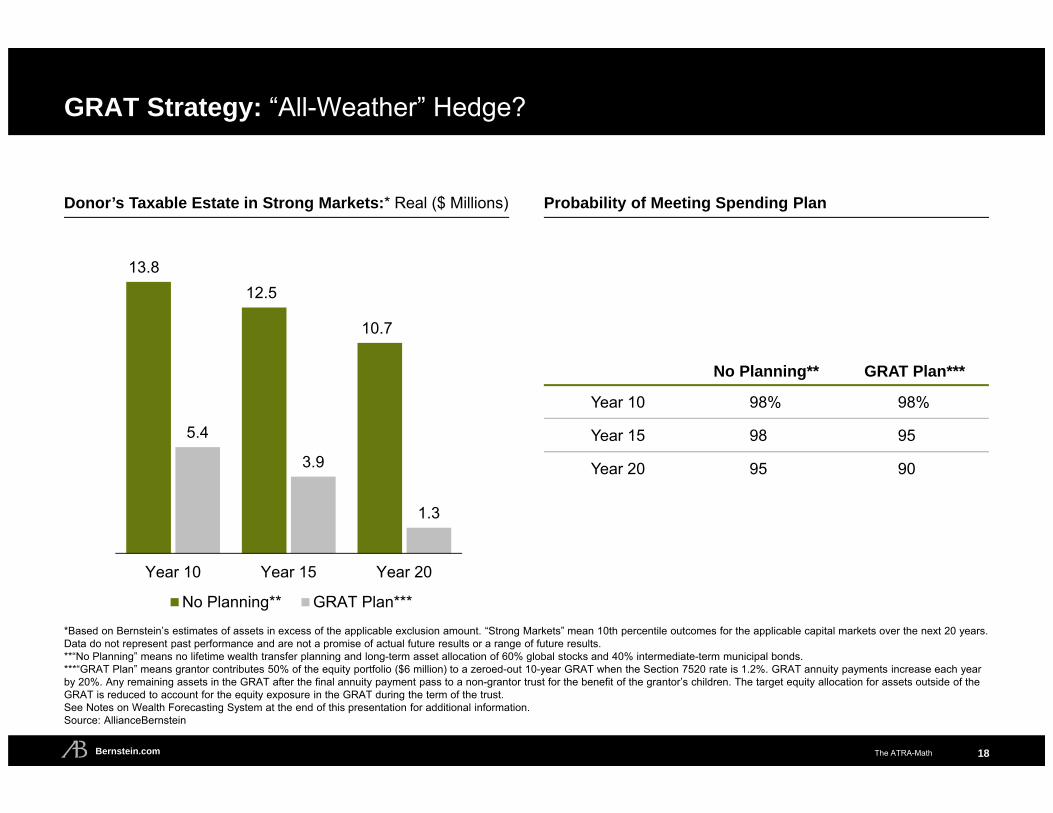
13.812.5
10.7
5.4
3.9
1.3
Year 10 Year 15 Year 20
No Planning** GRAT Plan***
Donor’s Taxable Estate in Strong Markets:* Real ($ Millions) Probability of Meeting Spending Plan
GRAT Strategy: “All-Weather” Hedge?
No Planning** GRAT Plan***
Year 10 98% 98%
Year 15 98 95
Year 20 95 90
*Based on Bernstein’s estimates of assets in excess of the applicable exclusion amount. “Strong Markets” mean 10th percentile outcomes for the applicable capital markets over the next 20 years. Data do not represent past performance and are not a promise of actual future results or a range of future results. **“No Planning” means no lifetime wealth transfer planning and long-term asset allocation of 60% global stocks and 40% intermediate-term municipal bonds.***“GRAT Plan” means grantor contributes 50% of the equity portfolio ($6 million) to a zeroed-out 10-year GRAT when the Section 7520 rate is 1.2%. GRAT annuity payments increase each year by 20%. Any remaining assets in the GRAT after the final annuity payment pass to a non-grantor trust for the benefit of the grantor’s children. The target equity allocation for assets outside of the GRAT is reduced to account for the equity exposure in the GRAT during the term of the trust. See Notes on Wealth Forecasting System at the end of this presentation for additional information.Source: AllianceBernstein
The ATRA-MathBernstein.com 19
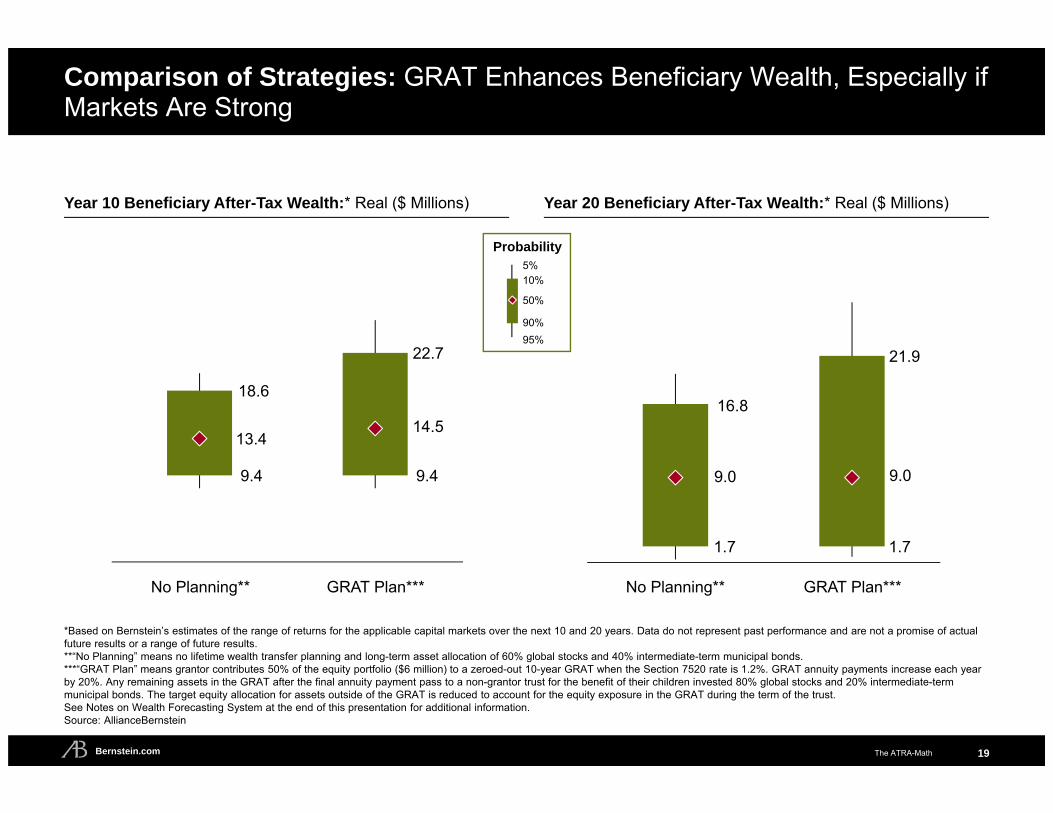
Year 10 Beneficiary After-Tax Wealth:* Real ($ Millions)
18.6
22.7
9.4 9.4
13.414.5
Year 20 Beneficiary After-Tax Wealth:* Real ($ Millions)
16.8
21.9
1.7 1.7
9.0 9.0
Comparison of Strategies: GRAT Enhances Beneficiary Wealth, Especially if Markets Are Strong
*Based on Bernstein’s estimates of the range of returns for the applicable capital markets over the next 10 and 20 years. Data do not represent past performance and are not a promise of actual future results or a range of future results. **“No Planning” means no lifetime wealth transfer planning and long-term asset allocation of 60% global stocks and 40% intermediate-term municipal bonds.***“GRAT Plan” means grantor contributes 50% of the equity portfolio ($6 million) to a zeroed-out 10-year GRAT when the Section 7520 rate is 1.2%. GRAT annuity payments increase each year by 20%. Any remaining assets in the GRAT after the final annuity payment pass to a non-grantor trust for the benefit of their children invested 80% global stocks and 20% intermediate-term municipal bonds. The target equity allocation for assets outside of the GRAT is reduced to account for the equity exposure in the GRAT during the term of the trust. See Notes on Wealth Forecasting System at the end of this presentation for additional information.Source: AllianceBernstein
No Planning** GRAT Plan*** No Planning** GRAT Plan***
5%10%
50%
90%95%
Probability

The ATRA-MathBernstein.com 20
Case StudyGift of Low-Basis Asset
The ATRA-MathBernstein.com
Gift vs. Step-Up Case Study Assumptions
Potential donor, a widow age 65, with $6.25 million liquid estate
$2 million of highly appreciated ABC stock
Remaining assets invested 60% in stocks, 40% in bonds*
Considering a gift to her child of the ABC stock… but concerned about a potential loss of step-up
21
Key research question: How does the state of domicile assumptions affect the likely outcome?
*“Stocks” mean globally diversified stocks; “bonds” mean intermediate-term municipal bonds. “Globally diversified” means 21% US value stocks, 21% US growth stocks, 21% US diversified stocks, 7% US small- and mid-cap stocks, 22.5% developed international stocks and 7.5% emerging market stocks. Spending is assumed to be offset by pension income; therefore, no spending has been modeled in this study. See Notes on Wealth Forecasting System at the end of this presentation for additional information.Source: AllianceBernstein
The ATRA-MathBernstein.com
4
6
8
10
12
14
1 3 5 7 9 11 13 15 17 19
Years Until Death
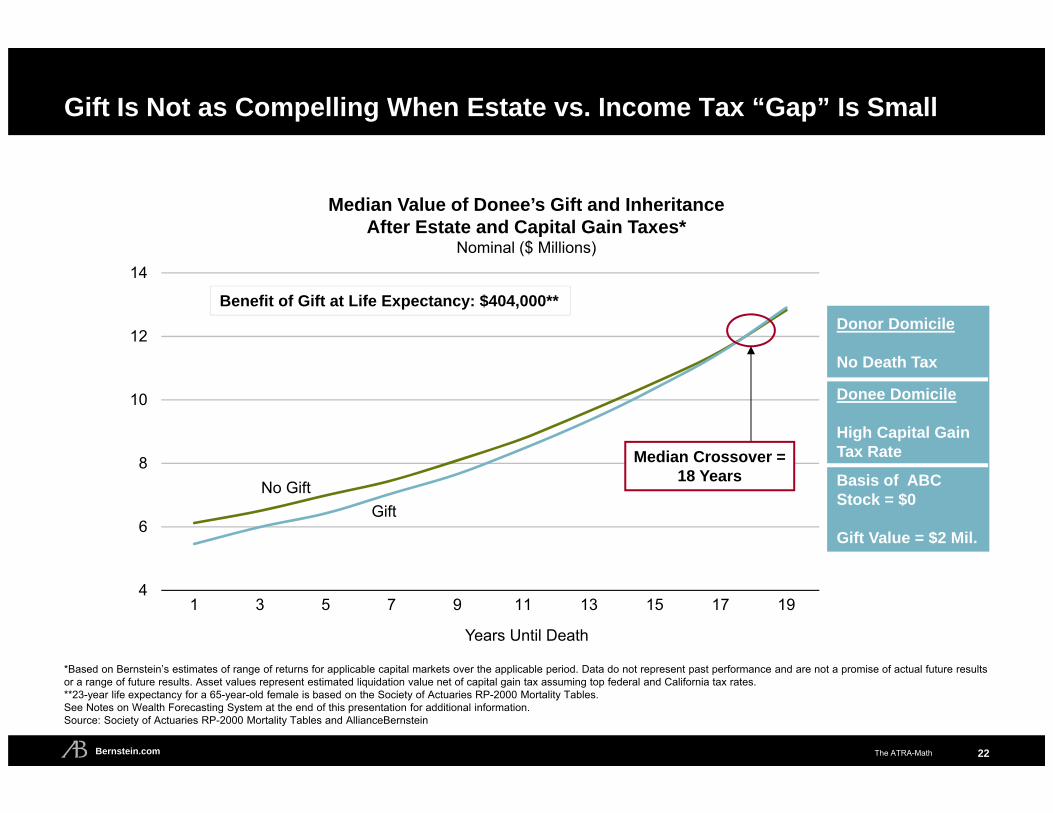
Gift Is Not as Compelling When Estate vs. Income Tax “Gap” Is Small
22
Median Value of Donee’s Gift and InheritanceAfter Estate and Capital Gain Taxes*
Nominal ($ Millions)
Benefit of Gift at Life Expectancy: $404,000**
Median Crossover = 18 Years
Donor Domicile
No Death Tax
Donee Domicile
High Capital Gain Tax Rate
Basis of ABCStock = $0
Gift Value = $2 Mil.Gift
No Gift
*Based on Bernstein’s estimates of range of returns for applicable capital markets over the applicable period. Data do not represent past performance and are not a promise of actual future results or a range of future results. Asset values represent estimated liquidation value net of capital gain tax assuming top federal and California tax rates.**23-year life expectancy for a 65-year-old female is based on the Society of Actuaries RP-2000 Mortality Tables.See Notes on Wealth Forecasting System at the end of this presentation for additional information.Source: Society of Actuaries RP-2000 Mortality Tables and AllianceBernstein
The ATRA-MathBernstein.com
4
6
8
10
12
14
1 3 5 7 9 11 13 15 17 19
Years Until Death
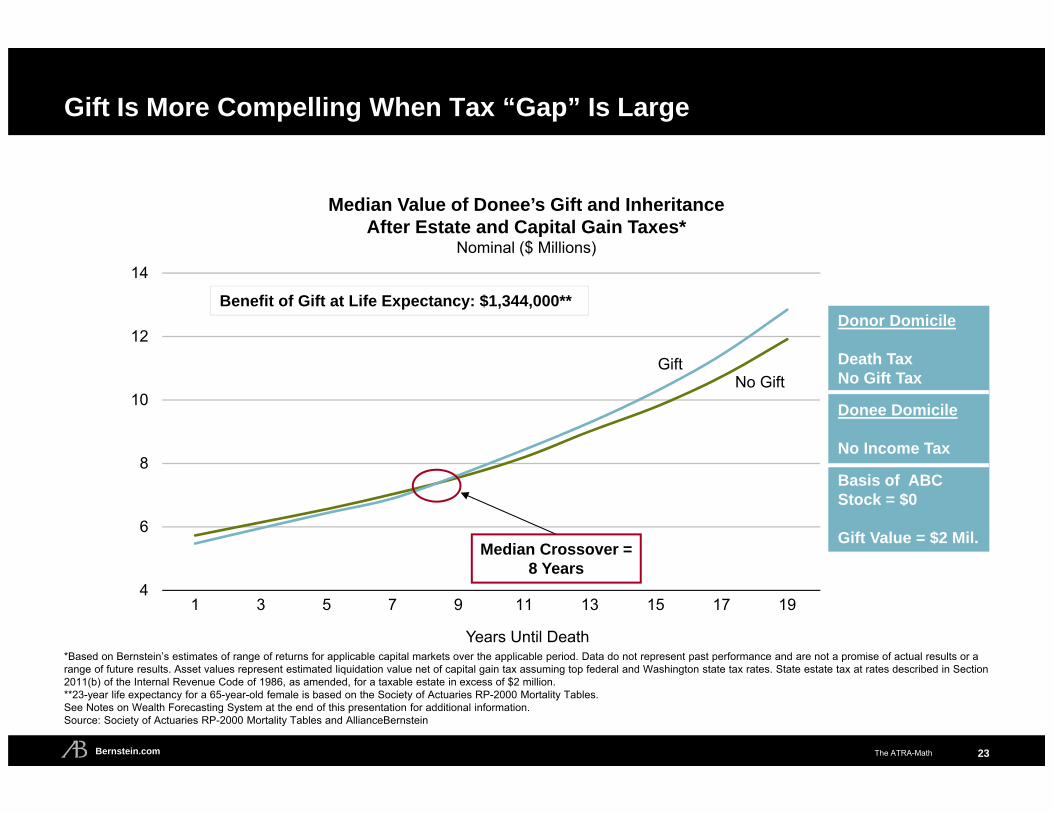
Gift Is More Compelling When Tax “Gap” Is Large
23
Median Value of Donee’s Gift and InheritanceAfter Estate and Capital Gain Taxes*
Nominal ($ Millions)
Donor Domicile
Death TaxNo Gift Tax
Donee Domicile
No Income Tax
Basis of ABCStock = $0
Gift Value = $2 Mil.
*Based on Bernstein’s estimates of range of returns for applicable capital markets over the applicable period. Data do not represent past performance and are not a promise of actual results or a range of future results. Asset values represent estimated liquidation value net of capital gain tax assuming top federal and Washington state tax rates. State estate tax at rates described in Section 2011(b) of the Internal Revenue Code of 1986, as amended, for a taxable estate in excess of $2 million.**23-year life expectancy for a 65-year-old female is based on the Society of Actuaries RP-2000 Mortality Tables. See Notes on Wealth Forecasting System at the end of this presentation for additional information.Source: Society of Actuaries RP-2000 Mortality Tables and AllianceBernstein
GiftNo Gift
Median Crossover = 8 Years
Benefit of Gift at Life Expectancy: $1,344,000**
The ATRA-MathBernstein.com
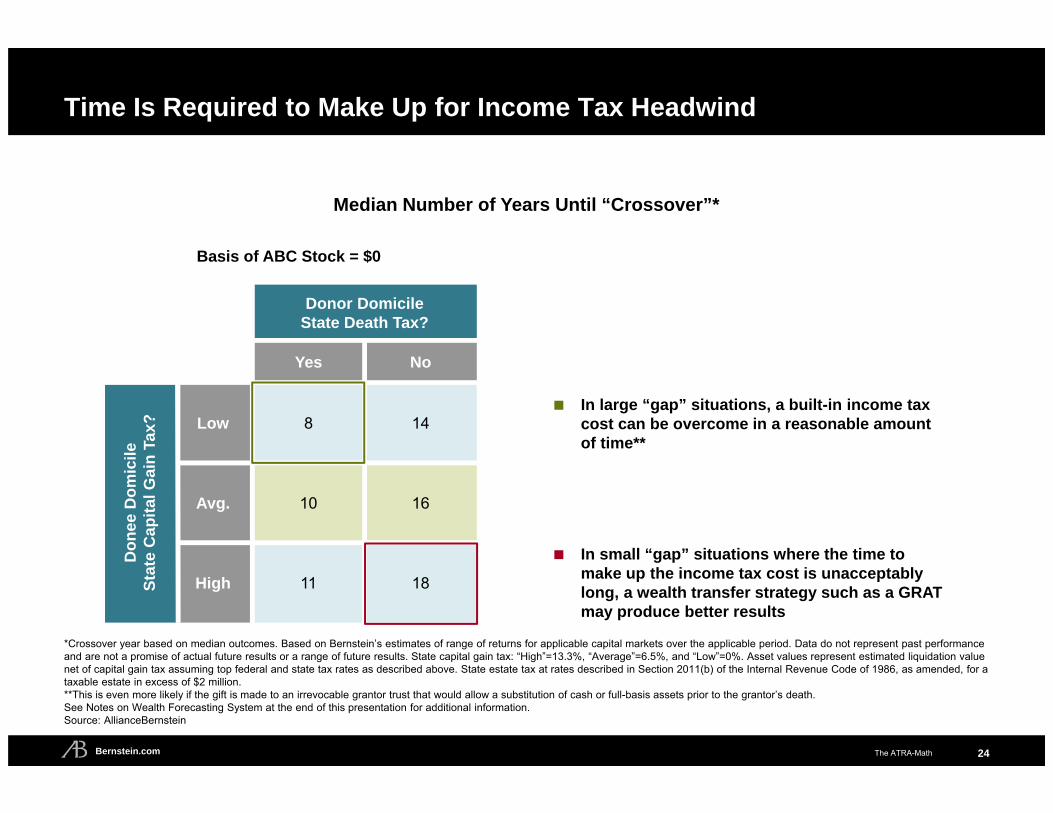
Time Is Required to Make Up for Income Tax Headwind
24
Median Number of Years Until “Crossover”*
Donor DomicileState Death Tax?
Yes No
Don
eeD
omic
ileSt
ate
Cap
ital G
ain
Tax? Low 8 14
Avg. 10 16
High 11 18
Basis of ABC Stock = $0
In large “gap” situations, a built-in income tax cost can be overcome in a reasonable amount of time**
In small “gap” situations where the time to make up the income tax cost is unacceptably long, a wealth transfer strategy such as a GRAT may produce better results
*Crossover year based on median outcomes. Based on Bernstein’s estimates of range of returns for applicable capital markets over the applicable period. Data do not represent past performance and are not a promise of actual future results or a range of future results. State capital gain tax: “High”=13.3%, “Average”=6.5%, and “Low”=0%. Asset values represent estimated liquidation value net of capital gain tax assuming top federal and state tax rates as described above. State estate tax at rates described in Section 2011(b) of the Internal Revenue Code of 1986, as amended, for a taxable estate in excess of $2 million. **This is even more likely if the gift is made to an irrevocable grantor trust that would allow a substitution of cash or full-basis assets prior to the grantor’s death.See Notes on Wealth Forecasting System at the end of this presentation for additional information.Source: AllianceBernstein
The ATRA-MathBernstein.com
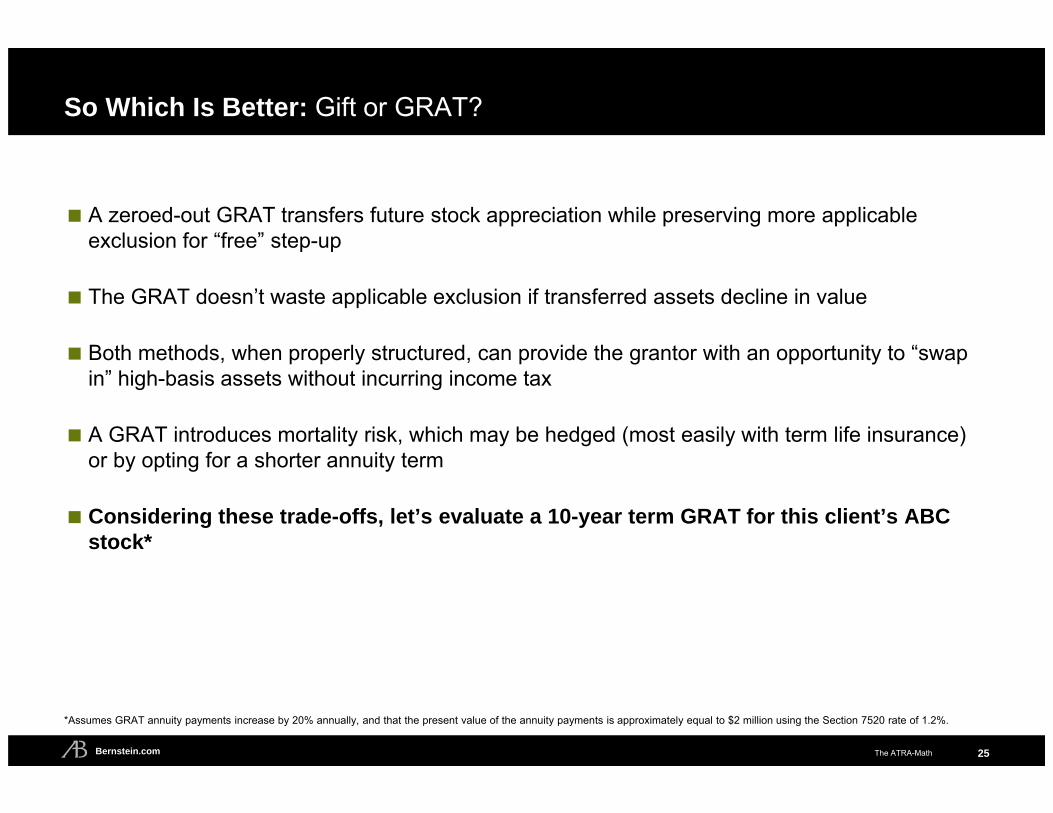
So Which Is Better: Gift or GRAT?
A zeroed-out GRAT transfers future stock appreciation while preserving more applicable exclusion for “free” step-up
The GRAT doesn’t waste applicable exclusion if transferred assets decline in value
Both methods, when properly structured, can provide the grantor with an opportunity to “swap in” high-basis assets without incurring income tax
A GRAT introduces mortality risk, which may be hedged (most easily with term life insurance) or by opting for a shorter annuity term
Considering these trade-offs, let’s evaluate a 10-year term GRAT for this client’s ABC stock*
25
*Assumes GRAT annuity payments increase by 20% annually, and that the present value of the annuity payments is approximately equal to $2 million using the Section 7520 rate of 1.2%.
The ATRA-MathBernstein.com
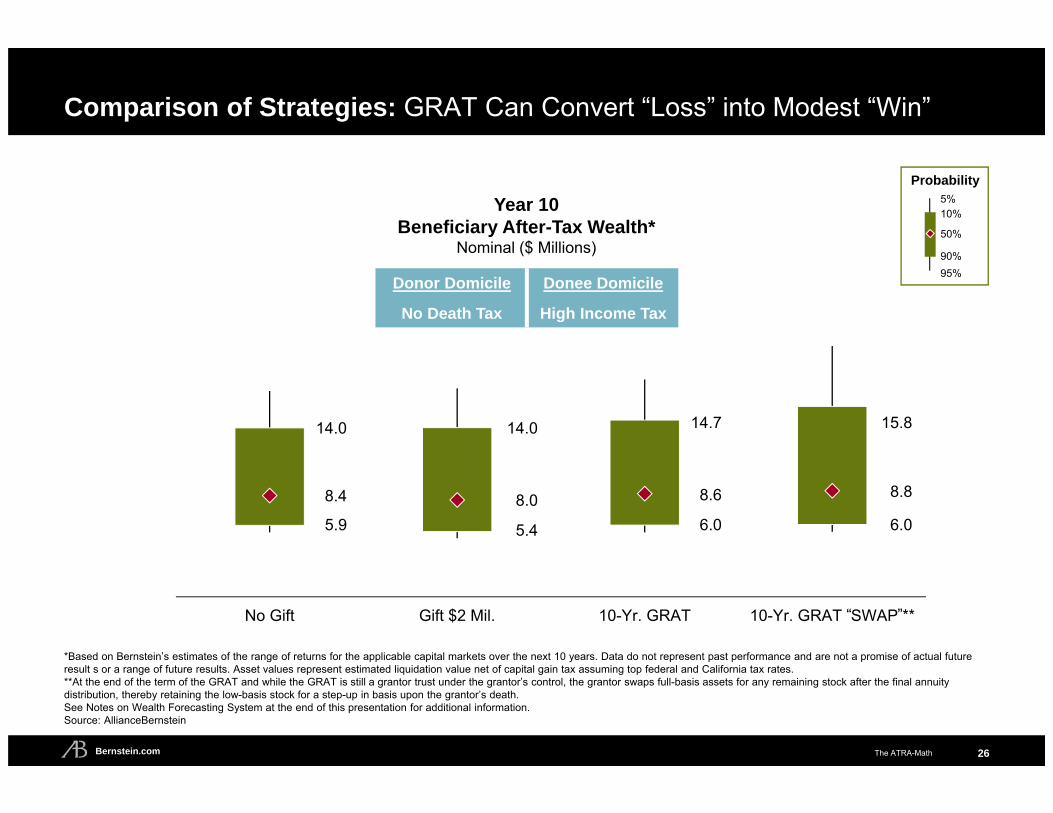
Comparison of Strategies: GRAT Can Convert “Loss” into Modest “Win”
26
Year 10Beneficiary After-Tax Wealth*
Nominal ($ Millions)
*Based on Bernstein’s estimates of the range of returns for the applicable capital markets over the next 10 years. Data do not represent past performance and are not a promise of actual future result s or a range of future results. Asset values represent estimated liquidation value net of capital gain tax assuming top federal and California tax rates.**At the end of the term of the GRAT and while the GRAT is still a grantor trust under the grantor’s control, the grantor swaps full-basis assets for any remaining stock after the final annuity distribution, thereby retaining the low-basis stock for a step-up in basis upon the grantor’s death. See Notes on Wealth Forecasting System at the end of this presentation for additional information.Source: AllianceBernstein
8.4
5.98.0
5.4
8.6
6.0
8.8
6.0
No Gift Gift $2 Mil. 10-Yr. GRAT 10-Yr. GRAT SWAP **“ ”
Donor Domicile
No Death Tax
Donee Domicile
High Income Tax
14.0 14.0 14.7 15.8
5%10%
50%
90%95%
Probability
The ATRA-MathBernstein.com
ATRA-Math: Lifetime Planning Observations
Inflation-indexing of the applicable exclusion amount means that a client’s spending is an important factor in assessing whether estate tax will be owed—and how much will be owed
It’s not enough simply to determine how much a client can give away during life or keep; whatthe client gives away or keeps may be just as important
In some cases it may be preferable to transfer only future appreciation and preserve as much of the applicable exclusion as possible Zeroed-out GRATs may be an attractive strategy to a broader range of clients
Selling assets on an installment basis, especially to an existing irrevocable (“intentionally defective”) grantor trust, may be even better than a zeroed-out GRAT—especially for a family with multi-generational wealth transfer goals
Income tax planning has increased in relative importance; be sure to ascertain: Client’s adjusted basis
Beneficiary’s tax domicile
Beneficiary’s marginal tax bracket
Use irrevocable grantor trusts—for as long as Congress allows—to facilitate periodic repositioning of assets
27

The ATRA-MathBernstein.com 28
Part IIPortability
The ATRA-MathBernstein.com
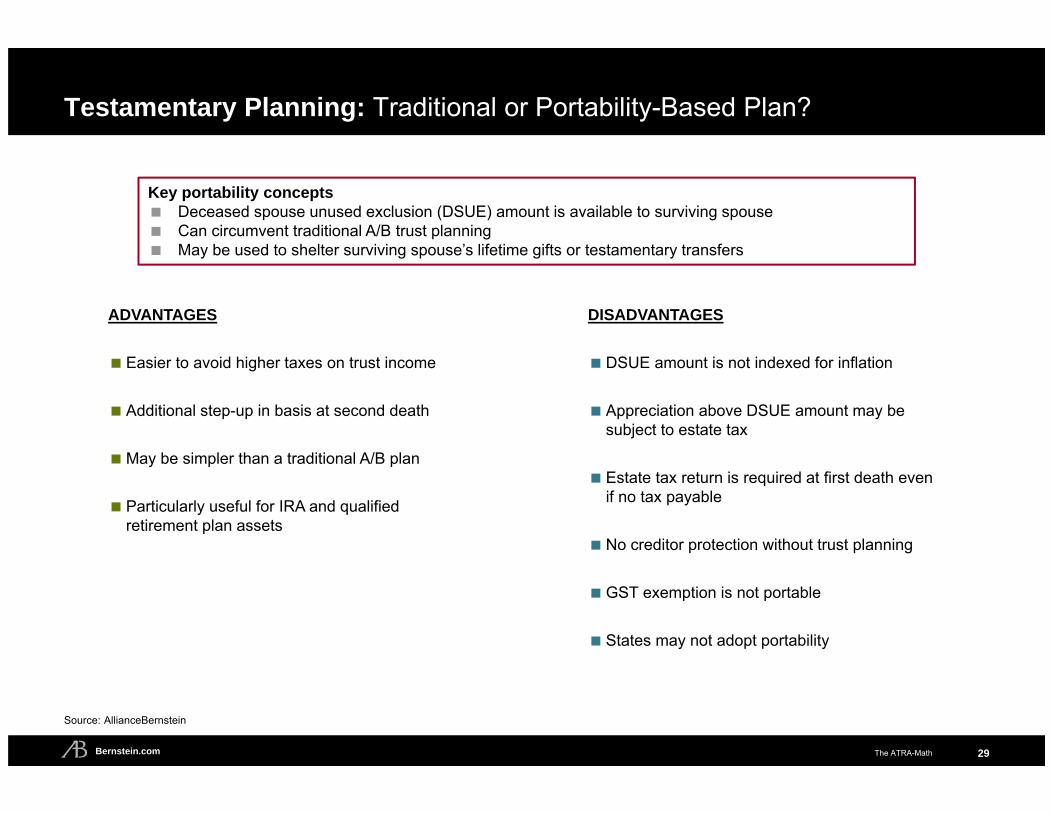
Testamentary Planning: Traditional or Portability-Based Plan?
29
ADVANTAGES
Easier to avoid higher taxes on trust income
Additional step-up in basis at second death
May be simpler than a traditional A/B plan
Particularly useful for IRA and qualified retirement plan assets
DISADVANTAGES
DSUE amount is not indexed for inflation
Appreciation above DSUE amount may be subject to estate tax
Estate tax return is required at first death even if no tax payable
No creditor protection without trust planning
GST exemption is not portable
States may not adopt portability
Key portability concepts Deceased spouse unused exclusion (DSUE) amount is available to surviving spouse Can circumvent traditional A/B trust planning May be used to shelter surviving spouse’s lifetime gifts or testamentary transfers
Source: AllianceBernstein
The ATRA-MathBernstein.com
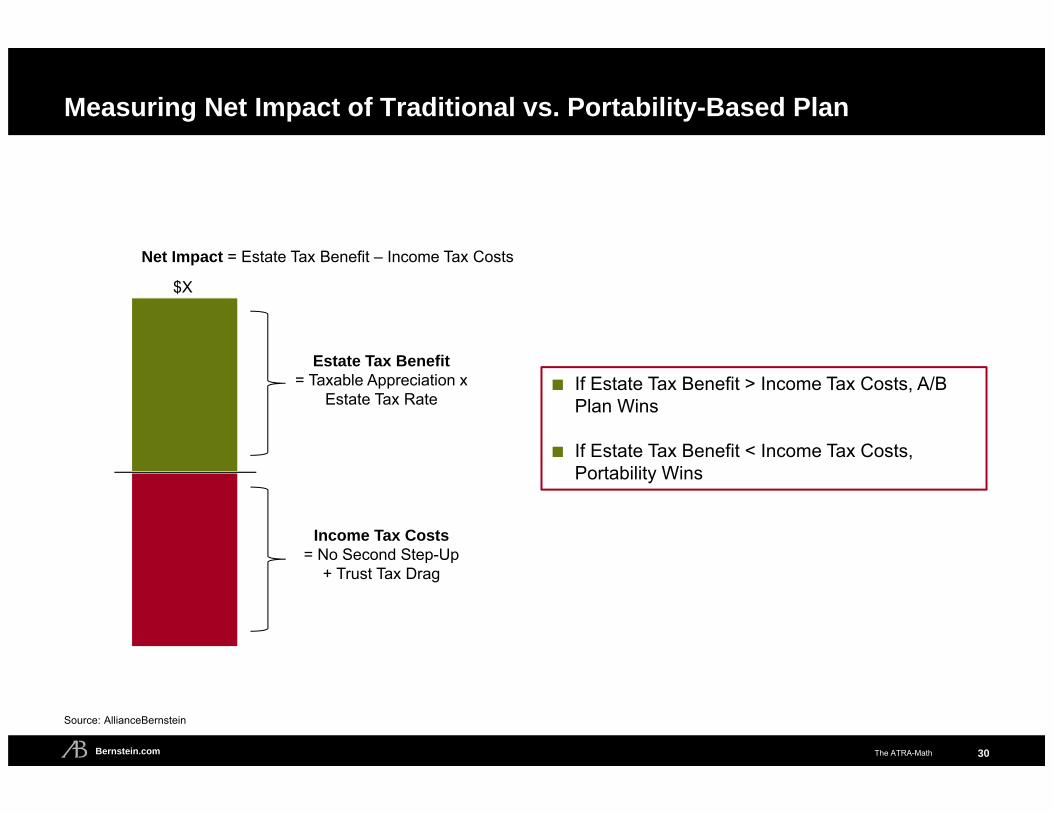
Measuring Net Impact of Traditional vs. Portability-Based Plan
30
■ If Estate Tax Benefit > Income Tax Costs, A/B Plan Wins
■ If Estate Tax Benefit < Income Tax Costs, Portability Wins
Net Impact = Estate Tax Benefit – Income Tax Costs
Estate Tax Benefit = Taxable Appreciation x
Estate Tax Rate
Income Tax Costs= No Second Step-Up
+ Trust Tax Drag
$X
Source: AllianceBernstein

The ATRA-MathBernstein.com
Larger Tax Difference Between Individuals and Trusts Post-ATRA
31
Income Type Tax Rate Adjusted Gross Income Threshold
Single Filer Trust
Short-Term Gains and Ordinary Income 39.6% $400,000 $11,950
Long-Term Gains and Qualified Dividends 20.0% $400,000 $11,950
Medicare Surtax on Net Investment Income 3.8% $200,000 $11,950
15.0
21.0
22.7 23.7
15
20
25
$100,000 $1,000,000
Per
cent
Effective Federal Income Tax Rate*Long-Term Capital Gain Income
Single Filer
Trust
*Effective federal income tax rate is computed assuming the only source of income is the long-term capital gain amount indicated on the x-axis.Source: IRS and AllianceBernstein
The ATRA-MathBernstein.com 32
Case StudyPortability vs. Traditional A/B Plan
The ATRA-MathBernstein.com
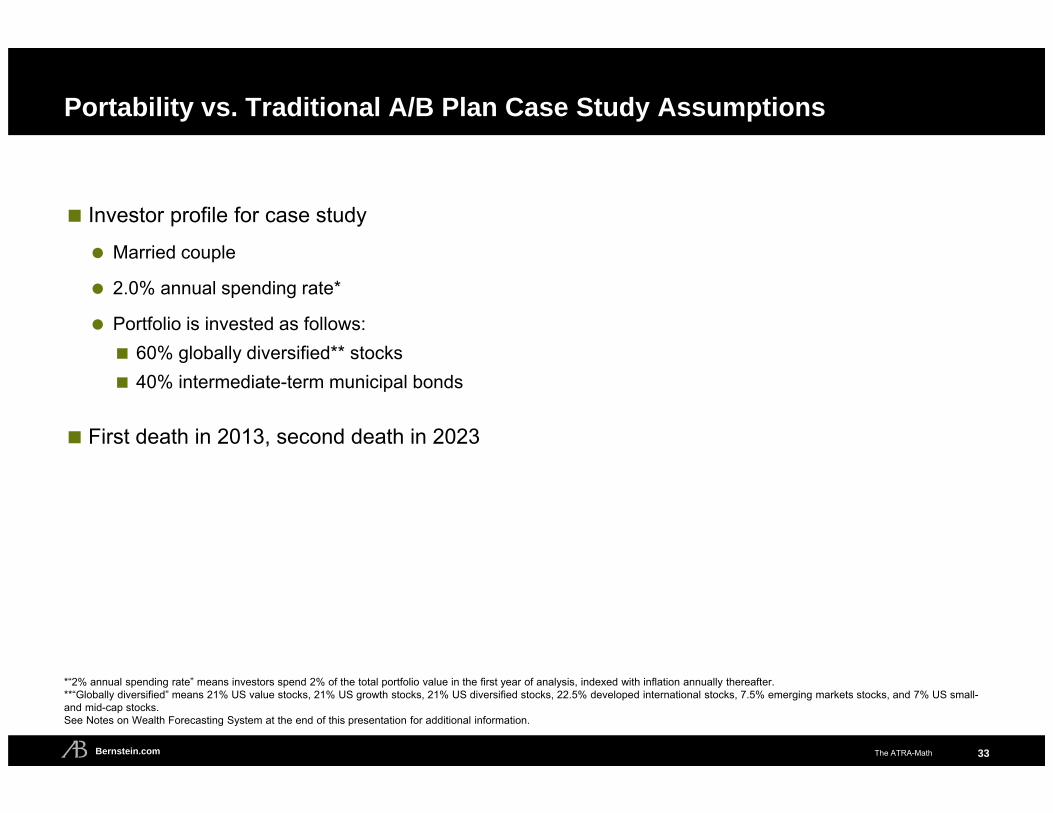
Portability vs. Traditional A/B Plan Case Study Assumptions
Investor profile for case study
Married couple
2.0% annual spending rate*
Portfolio is invested as follows: 60% globally diversified** stocks 40% intermediate-term municipal bonds
First death in 2013, second death in 2023
33
*“2% annual spending rate” means investors spend 2% of the total portfolio value in the first year of analysis, indexed with inflation annually thereafter.**“Globally diversified” means 21% US value stocks, 21% US growth stocks, 21% US diversified stocks, 22.5% developed international stocks, 7.5% emerging markets stocks, and 7% US small-and mid-cap stocks.See Notes on Wealth Forecasting System at the end of this presentation for additional information.

The ATRA-MathBernstein.com
Portability Case Study Scenarios
Scenarios tested*
Rely on portability (i.e., no credit shelter trust at first death) or
Fund credit shelter trust at first death with lesser of $5.25 million or One-half of combined estate**
34
*Each scenario assumes a 6.5% state income tax rate and no state estate tax rate.**Portability deemed elected for any unused applicable exclusion of first spouse to die.Source: AllianceBernstein
The ATRA-MathBernstein.com
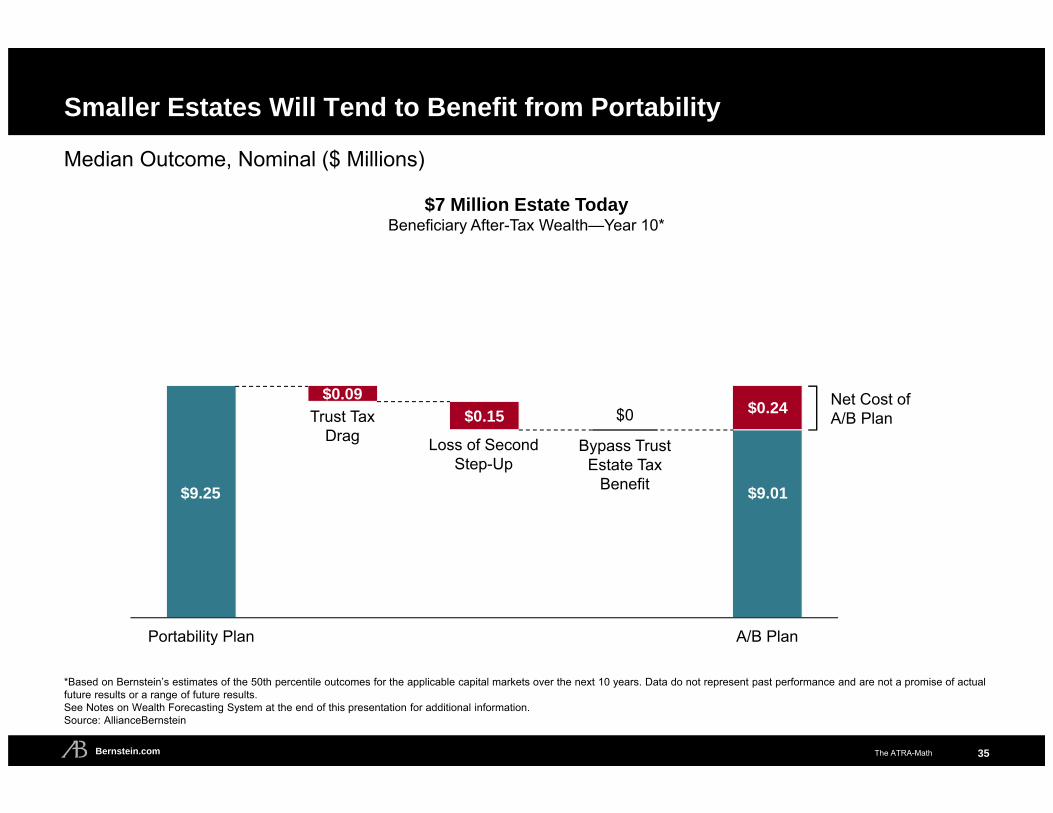
Portability Plan A/B Plan
Smaller Estates Will Tend to Benefit from Portability
35
Loss of Second Step-Up
Trust Tax Drag
Net Cost ofA/B Plan$0
Bypass Trust Estate Tax
Benefit
$7 Million Estate TodayBeneficiary After-Tax Wealth—Year 10*
$0.09$0.15
$9.25 $9.01
$0.24
*Based on Bernstein’s estimates of the 50th percentile outcomes for the applicable capital markets over the next 10 years. Data do not represent past performance and are not a promise of actual future results or a range of future results.See Notes on Wealth Forecasting System at the end of this presentation for additional information.Source: AllianceBernstein
Median Outcome, Nominal ($ Millions)
The ATRA-MathBernstein.com
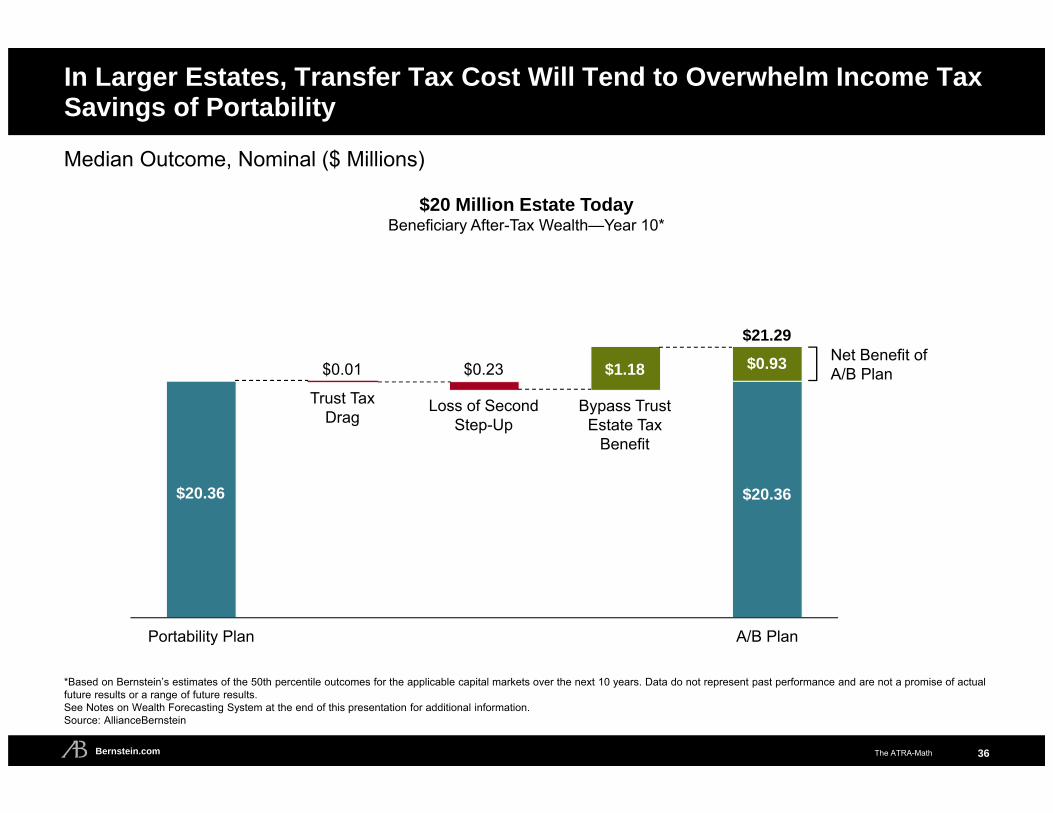
In Larger Estates, Transfer Tax Cost Will Tend to Overwhelm Income Tax Savings of Portability
36
$20 Million Estate TodayBeneficiary After-Tax Wealth—Year 10*
Portability Plan A/B Plan
Net Benefit ofA/B Plan
$20.36
$0.01
Loss of Second Step-Up
Trust Tax Drag
Bypass Trust Estate Tax
Benefit
$0.23 $1.18 $0.93
$21.29
*Based on Bernstein’s estimates of the 50th percentile outcomes for the applicable capital markets over the next 10 years. Data do not represent past performance and are not a promise of actual future results or a range of future results.See Notes on Wealth Forecasting System at the end of this presentation for additional information.Source: AllianceBernstein
$20.36
Median Outcome, Nominal ($ Millions)
The ATRA-MathBernstein.com
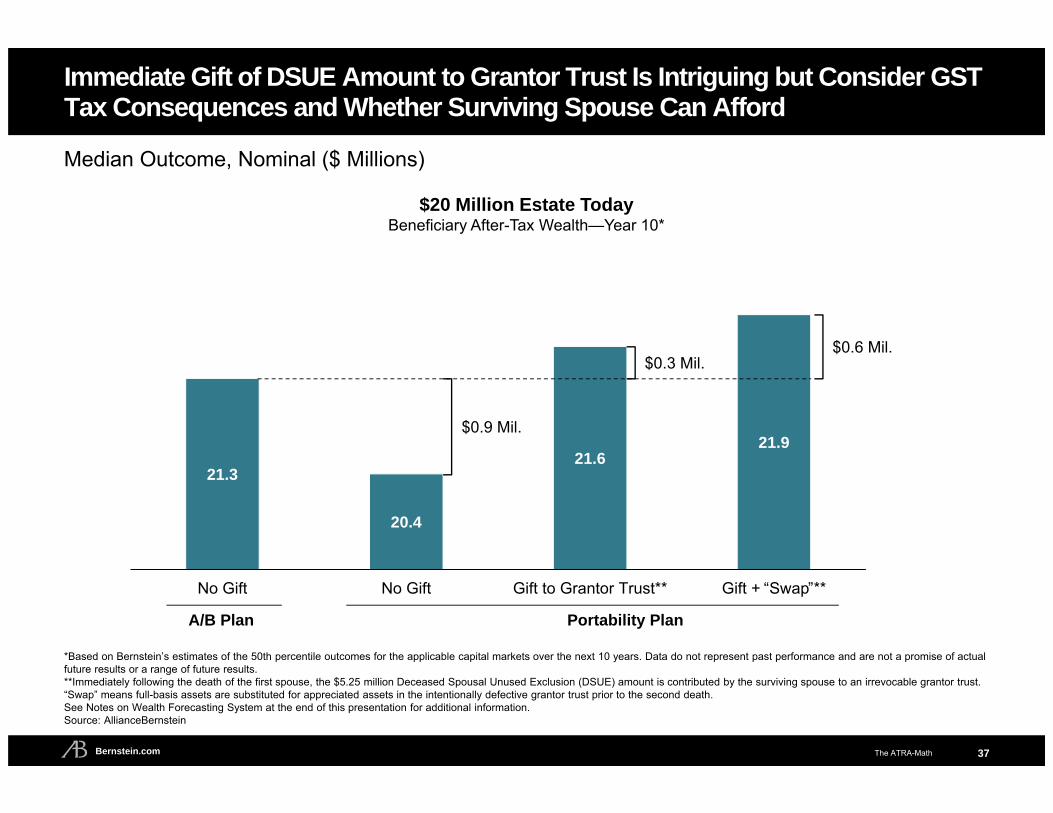
21.3
20.4
21.621.9
No Gift No Gift Gift to Grantor Trust** Gift + Swap **“ ”
37
$20 Million Estate TodayBeneficiary After-Tax Wealth—Year 10*
Median Outcome, Nominal ($ Millions)
*Based on Bernstein’s estimates of the 50th percentile outcomes for the applicable capital markets over the next 10 years. Data do not represent past performance and are not a promise of actual future results or a range of future results.**Immediately following the death of the first spouse, the $5.25 million Deceased Spousal Unused Exclusion (DSUE) amount is contributed by the surviving spouse to an irrevocable grantor trust. “Swap” means full-basis assets are substituted for appreciated assets in the intentionally defective grantor trust prior to the second death.See Notes on Wealth Forecasting System at the end of this presentation for additional information.Source: AllianceBernstein
$0.9 Mil.
$0.3 Mil.$0.6 Mil.
Portability PlanA/B Plan
Immediate Gift of DSUE Amount to Grantor Trust Is Intriguing but Consider GST Tax Consequences and Whether Surviving Spouse Can Afford
The ATRA-MathBernstein.com
ATRA-Math: Portability Observations
The permanence of portability now requires planners to consider whether or not the income tax advantages of a portability-based plan could outweigh the potential estate and GST tax benefits of a traditional A/B plan
Due to the multitude of ever-changing variables (including state tax law considerations), testamentary plans that provide flexibility to opt into or out of portability is strongly recommended
Quantifying the income and estate tax implications of various planning alternatives, both now and shortly after the death of the first spouse to die, may be one of the most important services an investment or estate planning professional can render
38

The ATRA-MathBernstein.com
Appendix
39
The ATRA-MathBernstein.com
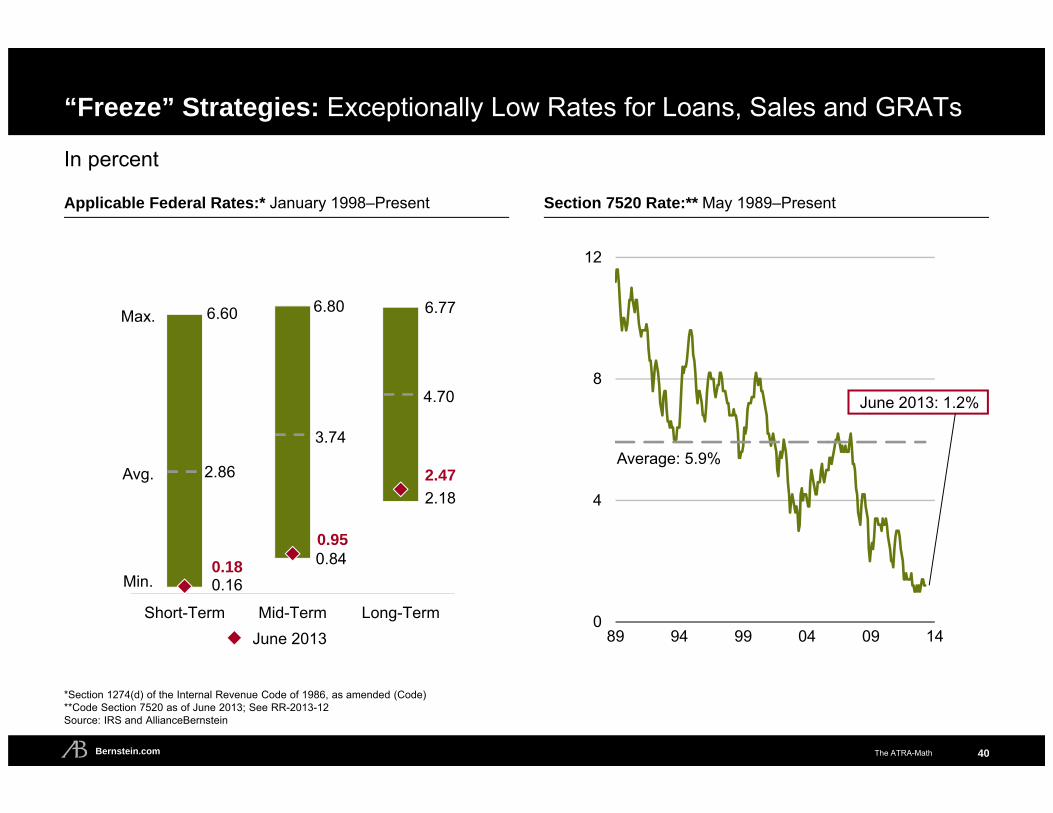
6.60 6.80 6.77
2.86
3.74
4.70
0.180.95
2.47
0.160.84
2.18
Short-Term Mid-Term Long-Term 0
4
8
12
89 94 99 04 09 14
“Freeze” Strategies: Exceptionally Low Rates for Loans, Sales and GRATs
40
In percent
Applicable Federal Rates:* January 1998–Present Section 7520 Rate:** May 1989–Present
June 2013: 1.2%
Average: 5.9%
*Section 1274(d) of the Internal Revenue Code of 1986, as amended (Code)**Code Section 7520 as of June 2013; See RR-2013-12Source: IRS and AllianceBernstein
June 2013
Min.
Max.
Avg.
The ATRA-MathBernstein.com
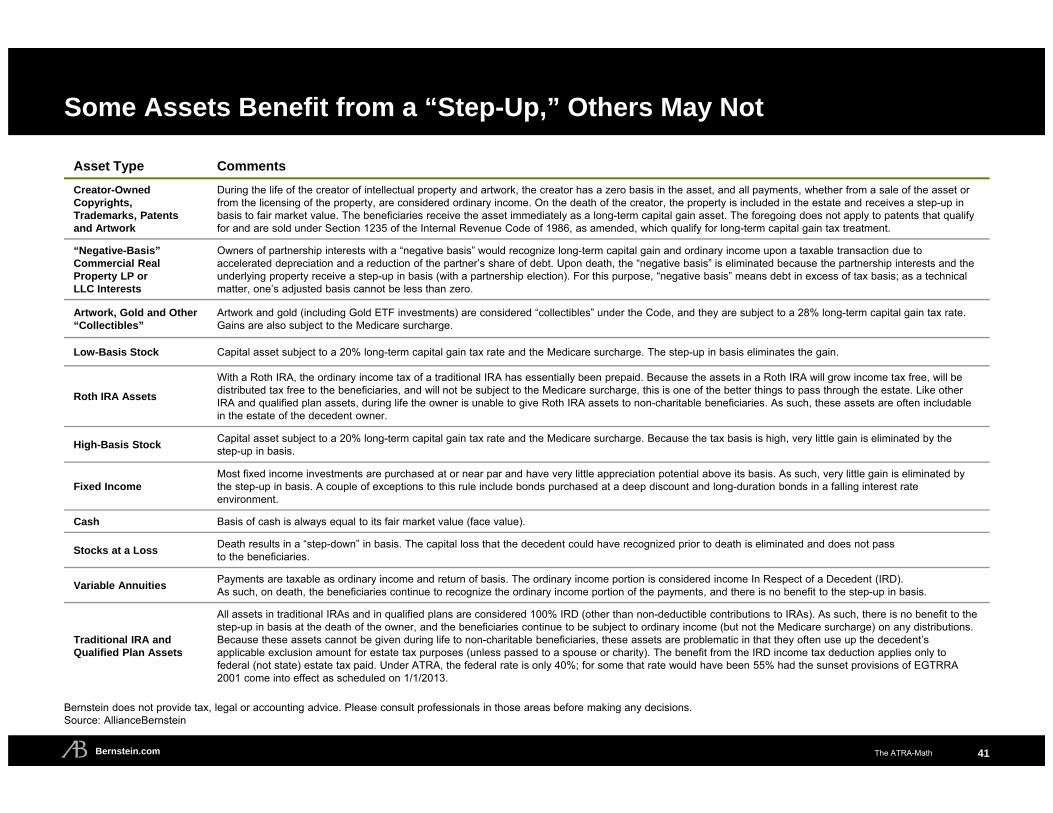
Some Assets Benefit from a “Step-Up,” Others May Not
41
Asset Type CommentsCreator-OwnedCopyrights, Trademarks, Patentsand Artwork
During the life of the creator of intellectual property and artwork, the creator has a zero basis in the asset, and all payments, whether from a sale of the asset or from the licensing of the property, are considered ordinary income. On the death of the creator, the property is included in the estate and receives a step-up in basis to fair market value. The beneficiaries receive the asset immediately as a long-term capital gain asset. The foregoing does not apply to patents that qualify for and are sold under Section 1235 of the Internal Revenue Code of 1986, as amended, which qualify for long-term capital gain tax treatment.
“Negative-Basis” Commercial Real Property LP or LLC Interests
Owners of partnership interests with a “negative basis” would recognize long-term capital gain and ordinary income upon a taxable transaction due to accelerated depreciation and a reduction of the partner’s share of debt. Upon death, the “negative basis” is eliminated because the partnership interests and the underlying property receive a step-up in basis (with a partnership election). For this purpose, “negative basis” means debt in excess of tax basis; as a technical matter, one’s adjusted basis cannot be less than zero.
Artwork, Gold and Other “Collectibles”
Artwork and gold (including Gold ETF investments) are considered “collectibles” under the Code, and they are subject to a 28% long-term capital gain tax rate. Gains are also subject to the Medicare surcharge.
Low-Basis Stock Capital asset subject to a 20% long-term capital gain tax rate and the Medicare surcharge. The step-up in basis eliminates the gain.
Roth IRA Assets
With a Roth IRA, the ordinary income tax of a traditional IRA has essentially been prepaid. Because the assets in a Roth IRA will grow income tax free, will be distributed tax free to the beneficiaries, and will not be subject to the Medicare surcharge, this is one of the better things to pass through the estate. Like other IRA and qualified plan assets, during life the owner is unable to give Roth IRA assets to non-charitable beneficiaries. As such, these assets are often includable in the estate of the decedent owner.
High-Basis Stock Capital asset subject to a 20% long-term capital gain tax rate and the Medicare surcharge. Because the tax basis is high, very little gain is eliminated by the step-up in basis.
Fixed IncomeMost fixed income investments are purchased at or near par and have very little appreciation potential above its basis. As such, very little gain is eliminated by the step-up in basis. A couple of exceptions to this rule include bonds purchased at a deep discount and long-duration bonds in a falling interest rate environment.
Cash Basis of cash is always equal to its fair market value (face value).
Stocks at a Loss Death results in a “step-down” in basis. The capital loss that the decedent could have recognized prior to death is eliminated and does not pass to the beneficiaries.
Variable Annuities Payments are taxable as ordinary income and return of basis. The ordinary income portion is considered income In Respect of a Decedent (IRD). As such, on death, the beneficiaries continue to recognize the ordinary income portion of the payments, and there is no benefit to the step-up in basis.
Traditional IRA and Qualified Plan Assets
All assets in traditional IRAs and in qualified plans are considered 100% IRD (other than non-deductible contributions to IRAs). As such, there is no benefit to the step-up in basis at the death of the owner, and the beneficiaries continue to be subject to ordinary income (but not the Medicare surcharge) on any distributions. Because these assets cannot be given during life to non-charitable beneficiaries, these assets are problematic in that they often use up the decedent’s applicable exclusion amount for estate tax purposes (unless passed to a spouse or charity). The benefit from the IRD income tax deduction applies only to federal (not state) estate tax paid. Under ATRA, the federal rate is only 40%; for some that rate would have been 55% had the sunset provisions of EGTRRA 2001 come into effect as scheduled on 1/1/2013.
Bernstein does not provide tax, legal or accounting advice. Please consult professionals in those areas before making any decisions.Source: AllianceBernstein
The ATRA-MathBernstein.com
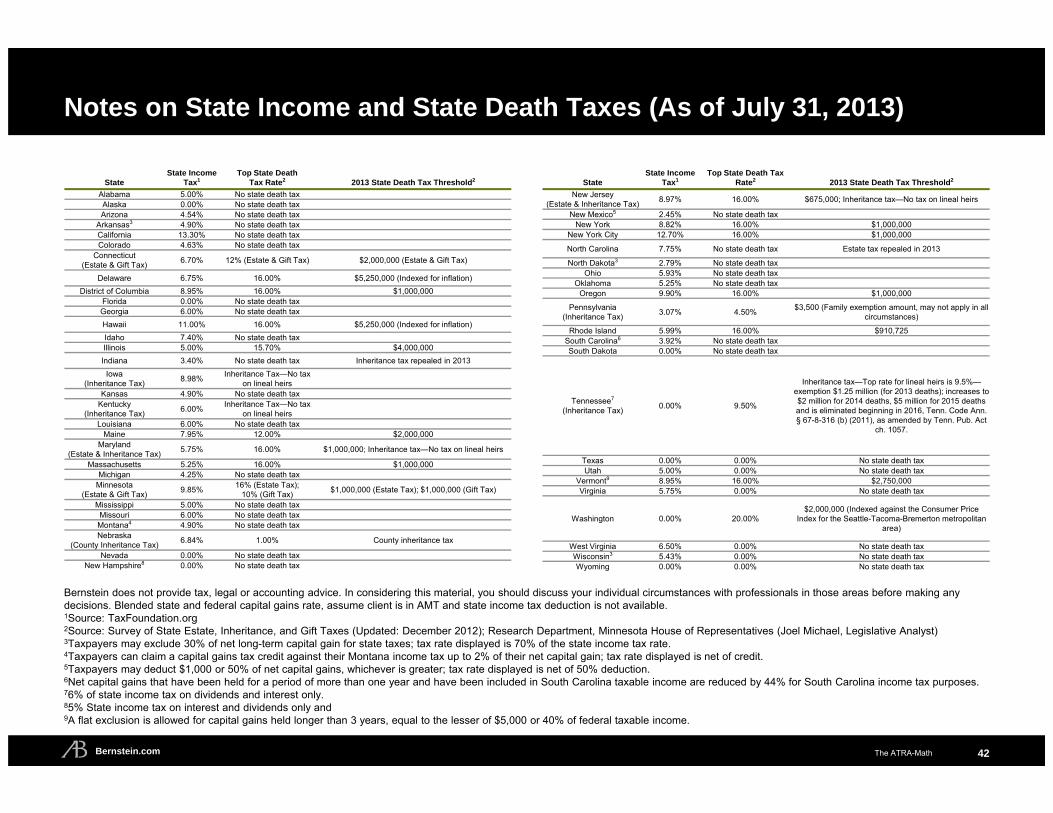
Notes on State Income and State Death Taxes (As of July 31, 2013)
42
StateState Income
Tax1Top State Death
Tax Rate2 2013 State Death Tax Threshold2
Alabama 5.00% No state death taxAlaska 0.00% No state death taxArizona 4.54% No state death tax
Arkansas3 4.90% No state death taxCalifornia 13.30% No state death taxColorado 4.63% No state death tax
Connecticut(Estate & Gift Tax) 6.70% 12% (Estate & Gift Tax) $2,000,000 (Estate & Gift Tax)
Delaware 6.75% 16.00% $5,250,000 (Indexed for inflation)District of Columbia 8.95% 16.00% $1,000,000
Florida 0.00% No state death taxGeorgia 6.00% No state death taxHawaii 11.00% 16.00% $5,250,000 (Indexed for inflation)Idaho 7.40% No state death taxIllinois 5.00% 15.70% $4,000,000Indiana 3.40% No state death tax Inheritance tax repealed in 2013
Iowa(Inheritance Tax) 8.98% Inheritance Tax—No tax
on lineal heirsKansas 4.90% No state death tax
Kentucky(Inheritance Tax) 6.00% Inheritance Tax—No tax
on lineal heirsLouisiana 6.00% No state death tax
Maine 7.95% 12.00% $2,000,000Maryland
(Estate & Inheritance Tax) 5.75% 16.00% $1,000,000; Inheritance tax—No tax on lineal heirs
Massachusetts 5.25% 16.00% $1,000,000Michigan 4.25% No state death tax
Minnesota(Estate & Gift Tax) 9.85% 16% (Estate Tax);
10% (Gift Tax) $1,000,000 (Estate Tax); $1,000,000 (Gift Tax)
Mississippi 5.00% No state death taxMissouri 6.00% No state death tax
Montana4 4.90% No state death taxNebraska
(County Inheritance Tax) 6.84% 1.00% County inheritance tax
Nevada 0.00% No state death taxNew Hampshire8 0.00% No state death tax
Bernstein does not provide tax, legal or accounting advice. In considering this material, you should discuss your individual circumstances with professionals in those areas before making any decisions. Blended state and federal capital gains rate, assume client is in AMT and state income tax deduction is not available.1Source: TaxFoundation.org2Source: Survey of State Estate, Inheritance, and Gift Taxes (Updated: December 2012); Research Department, Minnesota House of Representatives (Joel Michael, Legislative Analyst)3Taxpayers may exclude 30% of net long-term capital gain for state taxes; tax rate displayed is 70% of the state income tax rate.4Taxpayers can claim a capital gains tax credit against their Montana income tax up to 2% of their net capital gain; tax rate displayed is net of credit.5Taxpayers may deduct $1,000 or 50% of net capital gains, whichever is greater; tax rate displayed is net of 50% deduction.6Net capital gains that have been held for a period of more than one year and have been included in South Carolina taxable income are reduced by 44% for South Carolina income tax purposes.76% of state income tax on dividends and interest only.85% State income tax on interest and dividends only and9A flat exclusion is allowed for capital gains held longer than 3 years, equal to the lesser of $5,000 or 40% of federal taxable income.
StateState Income
Tax1Top State Death Tax
Rate2 2013 State Death Tax Threshold2
New Jersey(Estate & Inheritance Tax) 8.97% 16.00% $675,000; Inheritance tax—No tax on lineal heirs
New Mexico5 2.45% No state death taxNew York 8.82% 16.00% $1,000,000
New York City 12.70% 16.00% $1,000,000
North Carolina 7.75% No state death tax Estate tax repealed in 2013
North Dakota3 2.79% No state death taxOhio 5.93% No state death tax
Oklahoma 5.25% No state death taxOregon 9.90% 16.00% $1,000,000
Pennsylvania(Inheritance Tax) 3.07% 4.50% $3,500 (Family exemption amount, may not apply in all
circumstances)
Rhode Island 5.99% 16.00% $910,725South Carolina6 3.92% No state death taxSouth Dakota 0.00% No state death tax
Tennessee7
(Inheritance Tax) 0.00% 9.50%
Inheritance tax—Top rate for lineal heirs is 9.5%—exemption $1.25 million (for 2013 deaths); increases to $2 million for 2014 deaths, $5 million for 2015 deaths and is eliminated beginning in 2016, Tenn. Code Ann. § 67-8-316 (b) (2011), as amended by Tenn. Pub. Act
ch. 1057.
Texas 0.00% 0.00% No state death taxUtah 5.00% 0.00% No state death tax
Vermont9 8.95% 16.00% $2,750,000Virginia 5.75% 0.00% No state death tax
Washington 0.00% 20.00%$2,000,000 (Indexed against the Consumer Price
Index for the Seattle-Tacoma-Bremerton metropolitan area)
West Virginia 6.50% 0.00% No state death taxWisconsin3 5.43% 0.00% No state death taxWyoming 0.00% 0.00% No state death tax

The ATRA-MathBernstein.com
Notes on Wealth Forecasting System
43
1. Purpose and Description of Wealth Forecasting System
Bernstein’s Wealth Forecasting SystemSM is designed to assist investors in making long-term investment decisions regarding their allocation of investments among categories of financial assets. Our new planning tool consists of a four-step process: (1) Client Profile Input: the client’s asset allocation, income, expenses, cash withdrawals, tax rate, risk-tolerance level, goals and other factors; (2) Client Scenarios: in effect, questions the client would like our guidance on, which may touch on issues such as when to retire, what his/her cash-flow stream is likely to be, whether his/her portfolio can beat inflation long term and how different asset allocations might impact his/her long-term security; (3) The Capital Markets Engine: Our proprietary model, which uses our research and historical data to create a vast range of market returns, takes into account the linkages within and among the capital markets, as well as their unpredictability; and finally (4) A Probability Distribution of Outcomes: Based on the assets invested pursuant to the stated asset allocation, 90% of the estimated ranges of returns and asset values the client could expect to experience are represented within the range established by the 5th and 95th percentiles on “box and whiskers” graphs. However, outcomes outside this range are expected to occur 10% of the time; thus, the range does not establish the boundaries for all outcomes. Expected market returns on bonds are derived by taking into account yield and other criteria. An important assumption is that stocks will, over time, outperform long bonds by a reasonable amount, although this is in no way a certainty. Moreover, actual future results may not meet Bernstein’s estimates of the range of market returns, as these results are subject to a variety of economic, market and other variables. Accordingly, the analysis should not be construed as a promise of actual future results, the actual range of future results or the actual probability that these results will be realized.
2. Rebalancing
Another important planning assumption is how the asset allocation varies over time. We attempt to model how the portfolio would actually be managed. Cash flows and cash generated from portfolio turnover are used to maintain the selected asset allocation between cash, bonds, stocks, REITs and hedge funds over the period of the analysis. Where this is not sufficient, an optimization program is run to trade off the mismatch between the actual allocation and targets against the cost of trading to rebalance. In general, the portfolio allocation will be maintained reasonably close to its target. In addition, in later years, there may be contention between the total relationship’s allocation and those of the separate portfolios. For example, suppose an investor (in the top marginal federal tax bracket) begins with an asset mix consisting entirely of municipal bonds in his/her personal portfolio and entirely of stocks in his/her retirement portfolio. If personal assets are spent, the mix between stocks and bonds will be pulled away from targets. We put primary weight on maintaining the overall allocation near target, which may result in an allocation to taxable bonds in the retirement portfolio as the personal assets decrease in value relative to the retirement portfolio’s value.
3. Expenses and Spending Plans (Withdrawals)
All results are generally shown after applicable taxes and after anticipated withdrawals and/or additions, unless otherwise noted. Liquidations may result in realized gains or losses that will have capital gains tax implications.

The ATRA-MathBernstein.com
Notes on Wealth Forecasting System
44
4. Modeled Asset Classes
The following assets or indexes were used in this analysis to represent the various model classes:
Asset Class Modeled As… Annual Turnover RateIntermediate-Term Diversified Municipal Bonds AA-rated diversified municipal bonds with seven-year maturity 30%US Diversified S&P 500 Index 15US Value Stocks S&P/Barra Value Index 15US Growth Stocks S&P/Barra Growth Index 15Developed International Stocks MSCI EAFE Unhedged 15Emerging Markets Stocks MSCI Emerging Markets Index 20US SMID Russell 2000 15
5. Volatility
Volatility is a measure of dispersion of expected returns around the average. The greater the volatility, the more likely it is that returns in any one period will be substantially above or below the expected result. The volatility for each asset class used in this analysis is listed on the Capital Markets Projections page at the end of these Notes. In general, two-thirds of the returns will be within one standard deviation. For example, assuming that stocks are expected to return 8.0% on a compounded basis and the volatility of returns on stocks is 17.0%, in any one year it is likely that two-thirds of the projected returns will be between (8.9)% and 28.0%. With intermediate government bonds, if the expected compound return is assumed to be 5.0% and the volatility is assumed to be 6.0%, two-thirds of the outcomes will typically be between (1.1)% and 11.5%. Bernstein’s forecast of volatility is based on historical data and incorporates Bernstein’s judgment that the volatility of fixed income assets is different for different time periods.
6. Technical Assumptions
Bernstein’s Wealth Forecasting System is based on a number of technical assumptions regarding the future behavior of financial markets. Bernstein’s Capital Markets Engine is the module responsible for creating simulations of returns in the capital markets. Except as otherwise noted, these simulations are based on inputs that summarize the current condition of the capital markets as of March 31, 2013. Therefore, the first 12-month period of simulated returns represents the period from April 1, 2013, through March 31, 2014, and not necessarily the calendar year of 2013. A description of these technical assumptions is available upon request.

The ATRA-MathBernstein.com
Notes on Wealth Forecasting System
45
7. Tax ImplicationsBefore making any asset allocation decisions, an investor should review with his/her tax advisor the tax liabilities incurred by the different investment alternatives presented herein, including any capital gains that would be incurred as a result of liquidating all or part of his/her portfolio, retirement-plan distributions, investments in municipal or taxable bonds, etc. Bernstein does not provide tax, legal or accounting advice. In considering this material, you should discuss your individual circumstances with professionals in those areas before making any decisions.
8. Income Tax Rates
Bernstein’s Wealth Forecasting System has used various assumptions for the income tax rates of investors in the case studies that constitute this analysis. See the assumptions in each case study (including footnotes) for details. Contact Bernstein for additional information.The Federal Income Tax Rate is Bernstein’s estimate of either the top marginal federal income tax rate or an “average” rate calculated based upon the marginal-rate schedule. The Federal Capital Gains Tax Rate is the lesser of the top marginal federal income tax rate or the current cap on capital gains for an individual or corporation, as applicable. Federal tax rates are blended with applicable state tax rates by including, among other things, federal deductions for state income and capital gains taxes. The State Tax Rate generally is Bernstein’s estimate of the top marginal state income tax rate, if applicable.
The Wealth Forecasting System uses the following top marginal federal tax rates unless otherwise stated: For 2013 and beyond, the maximum federal ordinary income tax rate is 43.4% and the maximum federal capital gain and qualified dividend tax rate is 23.8%.
9. Estate Transfer and Taxation
The Wealth Forecasting System models the transfer of assets to children, more remote descendants, and charities, taking into account applicable wealth transfer taxes. If the analysis concerns a grantor and his or her spouse, the System assumes that only the first to die owns assets in his or her individual name and that no assets are owned jointly. It is further assumed that the couple’s estate plan provides that an amount equal to the largest amount that can pass free of Federal estate tax by reason of the federal unified credit against estate taxes (or, if desired, the largest amount that can pass without state death tax, if less) passes to a trust for the benefit of the surviving spouse and/or descendants of the first-to-die, or directly to one or more of those descendants. It is further assumed that the balance of the first-to-die’s individually owned assets passes outright to the surviving spouse and that such transfer qualifies for the federal estate tax marital deduction. Any state death taxes payable at the death of the first-to-die after 2010 are assumed to be paid from the assets otherwise passing to the surviving spouse. To the extent that this assumption results in an increase in state death taxes under any state’s law, this increase is ignored. In addition, it is assumed that the surviving spouse “rolls over” into an IRA in his or her own name any assets in any retirement accounts (e.g., an IRA) owned by the first to die, and that the surviving spouse withdraws each year at least the minimum required distribution (“MRD”), if any, from that IRA. At the survivor’s death, all applicable wealth transfer taxes are paid, taking into account any deductions to which the survivor’s estate may be entitled for gifts to charity and/or (after 2010) the payment of state death taxes. The balance of the survivor’s individually-owned assets passes to descendants and/or charities and/or trusts for their benefit. The survivor’s retirement accounts (if any) pass to descendants and/or charities. To the extent that a retirement account passes to more than one individual beneficiary, it is assumed that separate accounts are established for each beneficiary and that each takes at least the MRD each year from the account. In all cases, it is assumed that all expenses are paid from an individual’s taxable accounts rather than his or her retirement accounts to the maximum extent possible.
The ATRA-MathBernstein.com
Notes on Wealth Forecasting System
46
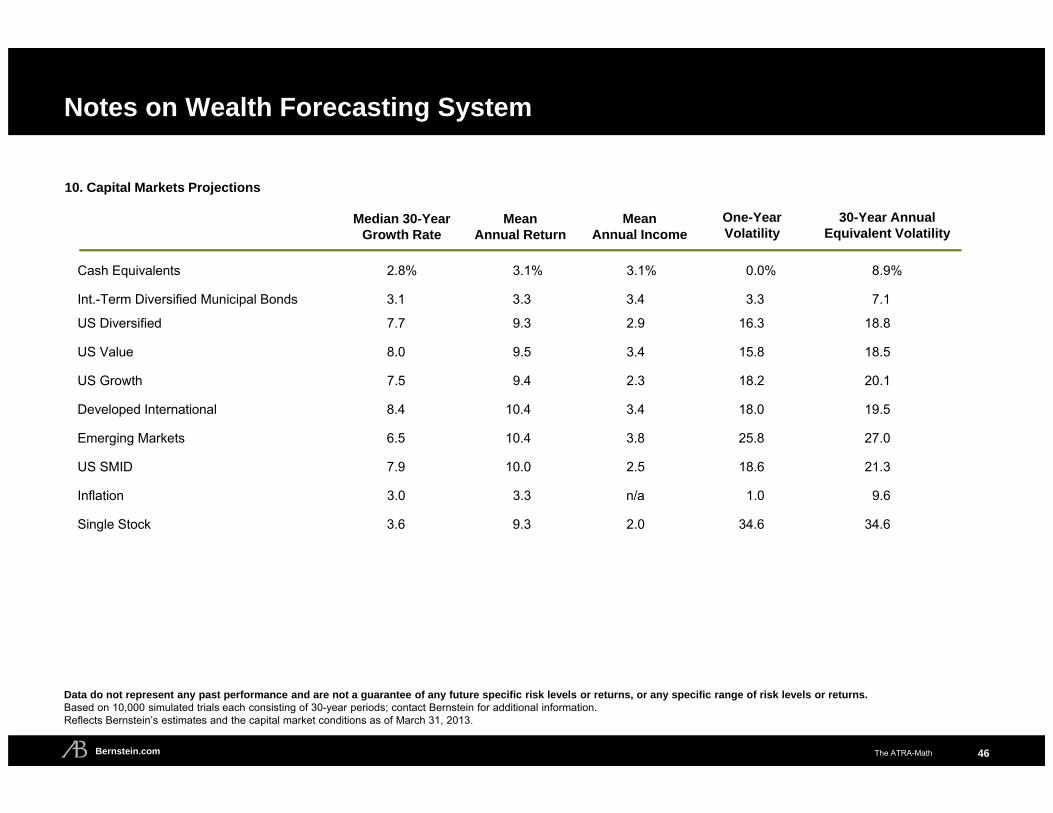
10. Capital Markets Projections
Cash Equivalents 2.8% 3.1% 3.1% 0.0% 8.9%
Int.-Term Diversified Municipal Bonds 3.1 3.3 3.4 3.3 7.1
US Diversified 7.7 9.3 2.9 16.3 18.8
US Value 8.0 9.5 3.4 15.8 18.5
US Growth 7.5 9.4 2.3 18.2 20.1
Developed International 8.4 10.4 3.4 18.0 19.5
Emerging Markets 6.5 10.4 3.8 25.8 27.0
US SMID 7.9 10.0 2.5 18.6 21.3
Inflation 3.0 3.3 n/a 1.0 9.6
Single Stock 3.6 9.3 2.0 34.6 34.6
One-Year Volatility
30-Year Annual Equivalent Volatility
Median 30-YearGrowth Rate
MeanAnnual Return
Mean Annual Income
Data do not represent any past performance and are not a guarantee of any future specific risk levels or returns, or any specific range of risk levels or returns.Based on 10,000 simulated trials each consisting of 30-year periods; contact Bernstein for additional information.Reflects Bernstein’s estimates and the capital market conditions as of March 31, 2013.


![[Webinar] Nuxeo platform 5.8 webinar](https://img.pdfslide.us/doc/110x75/54b539094a79594f358b4675/webinar-nuxeo-platform-58-webinar.jpg)