Embed Size (px)
Citation preview
A
asFaspOVwP
K
1
aEfeterbltaeB(i
0d
Available online at www.sciencedirect.com
Colloids and Surfaces B: Biointerfaces 62 (2008) 188–198
ATR-FTIR study of lipopolysaccharides at mineral surfaces
Sanjai J. Parikh a, Jon Chorover b,∗a Department of Plant and Soil Sciences, University of Delaware, Newark, DE 19716, United States
b Department of Soil, Water and Environmental Science, The University of Arizona, Tucson, AZ 85721, United States
Received 7 September 2007; received in revised form 27 September 2007; accepted 1 October 2007Available online 5 October 2007
bstract
Lipopolysaccharides (LPS) are ubiquitous in natural aqueous systems because of bacterial cell turnover and lysis. LPS sorption and conformationt the mineral/water interface are strongly influenced by both solution and surface chemistry. In this study, the interaction of LPS with variousurfaces (ZnSe, GeO2, �-Fe2O3, �-Al2O3) that vary in surface charge and hydrophobicity was investigated using attenuated total reflectanceourier transform infrared (ATR-FTIR) spectroscopy. The presence of Ca2+ (versus Na+) in LPS solutions resulted in aggregate reorientationnd increased sorptive retention. ATR-FTIR spectra of Na-LPS systems are consistent with reduced surface affinity and are similar to those ofolution phase LPS. Ca-LPS spectra reveal hydrophobic interactions of the lipid A region at the ZnSe internal reflection element (IRE). However,H-dependent charge controls Ca-LPS sorption to hydrophilic surfaces (GeO2, �-Fe2O3, and �-Al2O3), where bonding occurs principally via
-antigen functional groups. As a result of accumulation at the solid–liquid interface, spectra of Ca-LPS represent primarily surface-bound LPS.ariable-angle ATR-FTIR spectra of Ca-LPS systems show depth-dependent trends that occur at the spatial scale of LPS aggregates, consistentith the formation of vesicular structures.ublished by Elsevier B.V.LtrPiliscbimas
eywords: LPS; ATR-FTIR spectroscopy; Depth profiling; Endotoxins
. Introduction
Bacterial adhesion to surfaces is a complex function of the fullrray of macromolecules resident on the cell surface (e.g., LPS,PS, teichoic acids, surface proteins, flagella), substratum sur-
ace chemistry (e.g., hydrophobicity, surface charge), aqueousnvironmental conditions (e.g., pH, ionic strength), and the dis-ribution and composition of conditioning films. No single factorxerts full control, and therefore deconvolution of various factorsequires a model systems approach. In the case of Gram negativeacteria, the surface interaction of free- and membrane-boundipopolysaccharides (LPS) certainly represents one of the impor-ant molecular-level controls over bacterial adhesion [1–4]. LPSre amphiphilic molecules with a hydrophobic lipid A regionmbedded in the outer membrane of Gram negative bacteria [5].
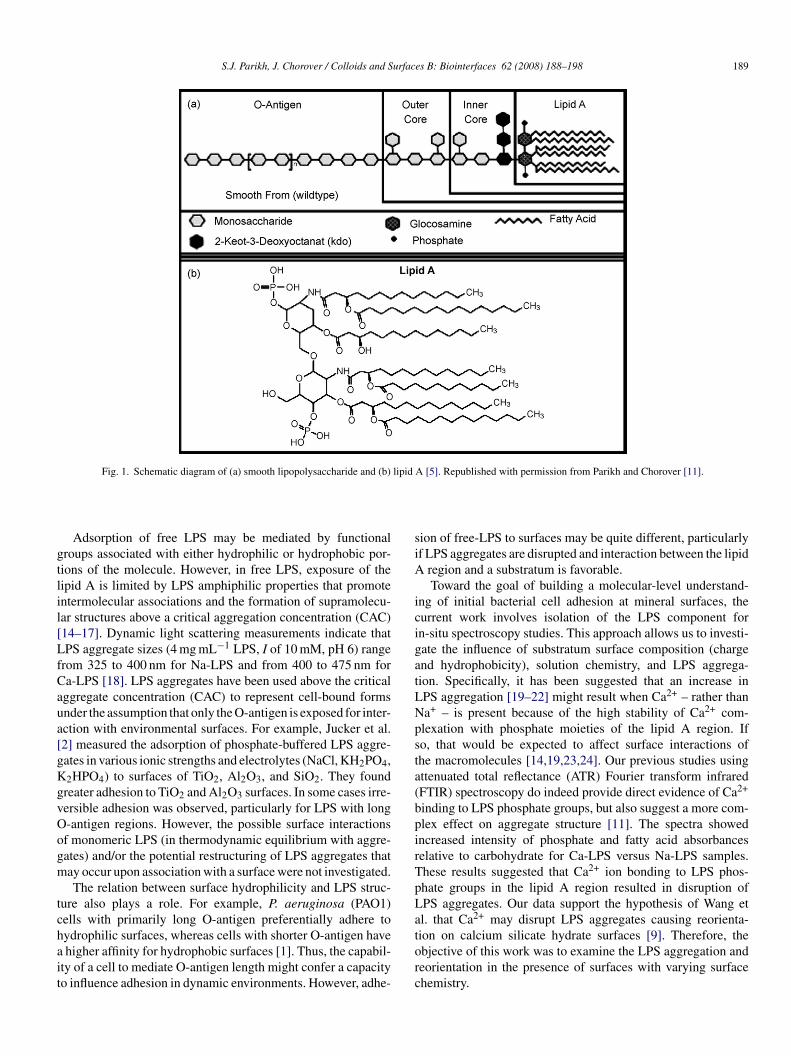
eyond the lipid A is a “core sugar” region, and the O-antigenFig. 1). The portion of the molecule comprising the O-antigens present in “smooth” LPS, whereas it is absent from “rough”
∗ Corresponding author. Tel.: +1 520 626 5635; fax: +1 520 621 1647.E-mail address: [email protected] (J. Chorover).
o[[Pml(
927-7765/$ – see front matter. Published by Elsevier B.V.oi:10.1016/j.colsurfb.2007.10.002
PS. The O-antigen is hydrophilic and extends outward fromhe intact cell into aqueous solution. It is composed of 20–70epeating units of three to five sugars [5]. Some bacteria, such asseudomonas aeruginosa, possess LPS with O-antigens extend-
ng up to 40 nm from the cell surface [6]. Since cell turnover andysis results in the presence of both “cell-bound” and “free” LPSn natural aquatic systems [7], LPS may promote bacterial adhe-ion by sorption of either free LPS molecules to surfaces duringonditioning film formation, or through cell adhesion mediatedy membrane bound LPS [1,3]. It has been suggested that dur-ng cell adhesion to negatively charged surfaces, the O-antigen
ay extend beyond the electrostatic energy barrier and becomedsorbed in a secondary minimum in close proximity to theurface [3].
Adhesion of both rough and smooth LPS has been observed toccur on metal oxides [2,8], crystalline calcium silicate hydrate9,10], ZnSe [11], GeO2, positively charged lipids and polymers12], and to bovine lung and tracheal tissue samples [13]. LPS of
. aeruginosa ser 10 LPS (in ultrapure water) was found to bondore strongly to positively charged (aminopropyltriethoxysi-ane polymers) than to hydrophilic (GeO2) or hydrophobicdipalmitoylphosphatidic acid monolayer) surfaces [12].
S.J. Parikh, J. Chorover / Colloids and Surfaces B: Biointerfaces 62 (2008) 188–198 189
lipid
gtlil[LfCaua[gKgvOogm
tchait
siA
icigatLNpsta(bpirTpLa
Fig. 1. Schematic diagram of (a) smooth lipopolysaccharide and (b)
Adsorption of free LPS may be mediated by functionalroups associated with either hydrophilic or hydrophobic por-ions of the molecule. However, in free LPS, exposure of theipid A is limited by LPS amphiphilic properties that promotentermolecular associations and the formation of supramolecu-ar structures above a critical aggregation concentration (CAC)14–17]. Dynamic light scattering measurements indicate thatPS aggregate sizes (4 mg mL−1 LPS, I of 10 mM, pH 6) range
rom 325 to 400 nm for Na-LPS and from 400 to 475 nm fora-LPS [18]. LPS aggregates have been used above the criticalggregate concentration (CAC) to represent cell-bound formsnder the assumption that only the O-antigen is exposed for inter-ction with environmental surfaces. For example, Jucker et al.2] measured the adsorption of phosphate-buffered LPS aggre-ates in various ionic strengths and electrolytes (NaCl, KH2PO4,2HPO4) to surfaces of TiO2, Al2O3, and SiO2. They foundreater adhesion to TiO2 and Al2O3 surfaces. In some cases irre-ersible adhesion was observed, particularly for LPS with long-antigen regions. However, the possible surface interactionsf monomeric LPS (in thermodynamic equilibrium with aggre-ates) and/or the potential restructuring of LPS aggregates thatay occur upon association with a surface were not investigated.The relation between surface hydrophilicity and LPS struc-
ure also plays a role. For example, P. aeruginosa (PAO1)ells with primarily long O-antigen preferentially adhere to
ydrophilic surfaces, whereas cells with shorter O-antigen havehigher affinity for hydrophobic surfaces [1]. Thus, the capabil-ty of a cell to mediate O-antigen length might confer a capacityo influence adhesion in dynamic environments. However, adhe-
torc
A [5]. Republished with permission from Parikh and Chorover [11].
ion of free-LPS to surfaces may be quite different, particularlyf LPS aggregates are disrupted and interaction between the lipid
region and a substratum is favorable.Toward the goal of building a molecular-level understand-
ng of initial bacterial cell adhesion at mineral surfaces, theurrent work involves isolation of the LPS component forn-situ spectroscopy studies. This approach allows us to investi-ate the influence of substratum surface composition (chargend hydrophobicity), solution chemistry, and LPS aggrega-ion. Specifically, it has been suggested that an increase inPS aggregation [19–22] might result when Ca2+ – rather thana+ – is present because of the high stability of Ca2+ com-lexation with phosphate moieties of the lipid A region. Ifo, that would be expected to affect surface interactions ofhe macromolecules [14,19,23,24]. Our previous studies usingttenuated total reflectance (ATR) Fourier transform infraredFTIR) spectroscopy do indeed provide direct evidence of Ca2+
inding to LPS phosphate groups, but also suggest a more com-lex effect on aggregate structure [11]. The spectra showedncreased intensity of phosphate and fatty acid absorbanceselative to carbohydrate for Ca-LPS versus Na-LPS samples.hese results suggested that Ca2+ ion bonding to LPS phos-hate groups in the lipid A region resulted in disruption ofPS aggregates. Our data support the hypothesis of Wang etl. that Ca2+ may disrupt LPS aggregates causing reorienta-
ion on calcium silicate hydrate surfaces [9]. Therefore, thebjective of this work was to examine the LPS aggregation andeorientation in the presence of surfaces with varying surfacehemistry.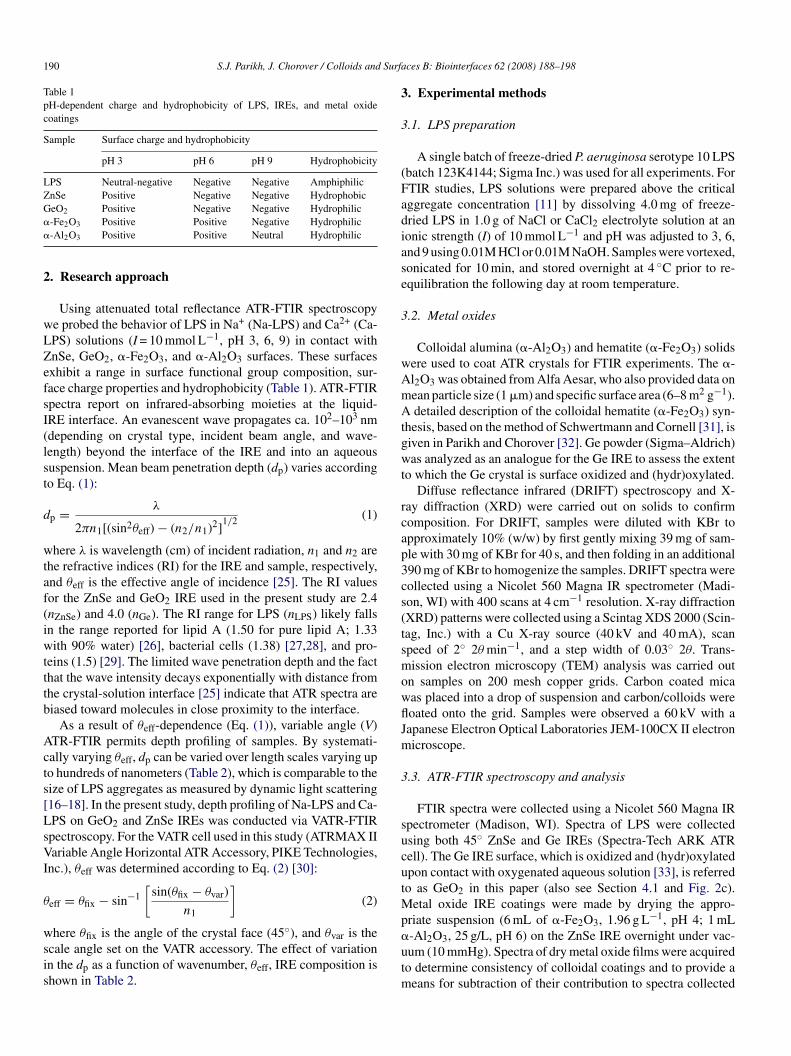
190 S.J. Parikh, J. Chorover / Colloids and Surfa
Table 1pH-dependent charge and hydrophobicity of LPS, IREs, and metal oxidecoatings
Sample Surface charge and hydrophobicity
pH 3 pH 6 pH 9 Hydrophobicity
LPS Neutral-negative Negative Negative AmphiphilicZnSe Positive Negative Negative HydrophobicG�
�
2
wLZefsI(lst
d
wtaf(iwtttb
Acts[LsVI
θ
wsis
3
3
(Fadiase
3
wAmAtgwt
rcap3cs(tsmowflJm
3
sucutMp
eO2 Positive Negative Negative Hydrophilic-Fe2O3 Positive Positive Negative Hydrophilic-Al2O3 Positive Positive Neutral Hydrophilic
. Research approach
Using attenuated total reflectance ATR-FTIR spectroscopye probed the behavior of LPS in Na+ (Na-LPS) and Ca2+ (Ca-PS) solutions (I = 10 mmol L−1, pH 3, 6, 9) in contact withnSe, GeO2, �-Fe2O3, and �-Al2O3 surfaces. These surfacesxhibit a range in surface functional group composition, sur-ace charge properties and hydrophobicity (Table 1). ATR-FTIRpectra report on infrared-absorbing moieties at the liquid-RE interface. An evanescent wave propagates ca. 102–103 nmdepending on crystal type, incident beam angle, and wave-ength) beyond the interface of the IRE and into an aqueoususpension. Mean beam penetration depth (dp) varies accordingo Eq. (1):
p = λ
2πn1[(sin2θeff) − (n2/n1)2]1/2 (1)
here λ is wavelength (cm) of incident radiation, n1 and n2 arehe refractive indices (RI) for the IRE and sample, respectively,nd θeff is the effective angle of incidence [25]. The RI valuesor the ZnSe and GeO2 IRE used in the present study are 2.4nZnSe) and 4.0 (nGe). The RI range for LPS (nLPS) likely fallsn the range reported for lipid A (1.50 for pure lipid A; 1.33ith 90% water) [26], bacterial cells (1.38) [27,28], and pro-
eins (1.5) [29]. The limited wave penetration depth and the facthat the wave intensity decays exponentially with distance fromhe crystal-solution interface [25] indicate that ATR spectra areiased toward molecules in close proximity to the interface.
As a result of θeff-dependence (Eq. (1)), variable angle (V)TR-FTIR permits depth profiling of samples. By systemati-ally varying θeff, dp can be varied over length scales varying upo hundreds of nanometers (Table 2), which is comparable to theize of LPS aggregates as measured by dynamic light scattering16–18]. In the present study, depth profiling of Na-LPS and Ca-PS on GeO2 and ZnSe IREs was conducted via VATR-FTIRpectroscopy. For the VATR cell used in this study (ATRMAX IIariable Angle Horizontal ATR Accessory, PIKE Technologies,
nc.), θeff was determined according to Eq. (2) [30]:
eff = θfix − sin−1[
sin(θfix − θvar)
n1
](2)
here θfix is the angle of the crystal face (45◦), and θvar is thecale angle set on the VATR accessory. The effect of variationn the dp as a function of wavenumber, θeff, IRE composition ishown in Table 2.
�utm
ces B: Biointerfaces 62 (2008) 188–198
. Experimental methods
.1. LPS preparation
A single batch of freeze-dried P. aeruginosa serotype 10 LPSbatch 123K4144; Sigma Inc.) was used for all experiments. ForTIR studies, LPS solutions were prepared above the criticalggregate concentration [11] by dissolving 4.0 mg of freeze-ried LPS in 1.0 g of NaCl or CaCl2 electrolyte solution at anonic strength (I) of 10 mmol L−1 and pH was adjusted to 3, 6,nd 9 using 0.01M HCl or 0.01M NaOH. Samples were vortexed,onicated for 10 min, and stored overnight at 4 ◦C prior to re-quilibration the following day at room temperature.
.2. Metal oxides
Colloidal alumina (�-Al2O3) and hematite (�-Fe2O3) solidsere used to coat ATR crystals for FTIR experiments. The �-l2O3 was obtained from Alfa Aesar, who also provided data onean particle size (1 �m) and specific surface area (6–8 m2 g−1).detailed description of the colloidal hematite (�-Fe2O3) syn-
hesis, based on the method of Schwertmann and Cornell [31], isiven in Parikh and Chorover [32]. Ge powder (Sigma–Aldrich)as analyzed as an analogue for the Ge IRE to assess the extent
o which the Ge crystal is surface oxidized and (hydr)oxylated.Diffuse reflectance infrared (DRIFT) spectroscopy and X-
ay diffraction (XRD) were carried out on solids to confirmomposition. For DRIFT, samples were diluted with KBr topproximately 10% (w/w) by first gently mixing 39 mg of sam-le with 30 mg of KBr for 40 s, and then folding in an additional90 mg of KBr to homogenize the samples. DRIFT spectra wereollected using a Nicolet 560 Magna IR spectrometer (Madi-on, WI) with 400 scans at 4 cm−1 resolution. X-ray diffractionXRD) patterns were collected using a Scintag XDS 2000 (Scin-ag, Inc.) with a Cu X-ray source (40 kV and 40 mA), scanpeed of 2◦ 2θ min−1, and a step width of 0.03◦ 2θ. Trans-ission electron microscopy (TEM) analysis was carried out
n samples on 200 mesh copper grids. Carbon coated micaas placed into a drop of suspension and carbon/colloids wereoated onto the grid. Samples were observed a 60 kV with aapanese Electron Optical Laboratories JEM-100CX II electronicroscope.
.3. ATR-FTIR spectroscopy and analysis
FTIR spectra were collected using a Nicolet 560 Magna IRpectrometer (Madison, WI). Spectra of LPS were collectedsing both 45◦ ZnSe and Ge IREs (Spectra-Tech ARK ATRell). The Ge IRE surface, which is oxidized and (hydr)oxylatedpon contact with oxygenated aqueous solution [33], is referredo as GeO2 in this paper (also see Section 4.1 and Fig. 2c).
etal oxide IRE coatings were made by drying the appro-riate suspension (6 mL of �-Fe2O3, 1.96 g L−1, pH 4; 1 mL
-Al2O3, 25 g/L, pH 6) on the ZnSe IRE overnight under vac-um (10 mmHg). Spectra of dry metal oxide films were acquiredo determine consistency of colloidal coatings and to provide aeans for subtraction of their contribution to spectra collected
S.J. Parikh, J. Chorover / Colloids and Surfaces B: Biointerfaces 62 (2008) 188–198 191
Table 2Depth of penetration at wavenumbers pertinent to LPS samples for ATR-FTIR with ZnSe (refractive index = 2.4) and GeO2 (refractive index = 4.0) IRE
Scale angle (◦) ZnSe GeO2
Effectiveangle (◦)
Depth of penetration (nm)a forselected wavenumbers (cm−1)
Effective angle (◦) Depth of penetration (nm)a forselected wavenumbers (cm−1)
2920 1240 1060 2920 1240 1060
30 38.8 911 2145 2509 41.3 242 570 66737 42.9 622 1466 1715 43.0 232 545 63845 45.0 552 1299 1520 45.0 221 520 60852 47.1 502 1183 1384 46.8 212 500 5856
ples,
ssos0t
Igst4darla(p
F�
4
4
SosfcfihstA
0 51.2 432 1017 1189
a The refractive index of LPS was assumed to be close to that of bacterial sam
ubsequently. For experiments utilizing the ARK ATR acces-ory, a 1 mL aliquot of LPS solution (4 mg mL−1) was depositedn the appropriate IRE and oxide-coated IRE for each of theolution chemistries discussed above. Spectra were collected at, 15, 30, 60, and 120 min after introduction of LPS solution intohe ATR cell.
VATR-FTIR measurements were made using an ATRMAXI Variable Angle Horizontal ATR Accessory (PIKE Technolo-ies, Inc.) with a 45◦ ZnSe or Ge IRE. Spectra were acquired atcale angles of 30◦, 37◦, 45◦, 52◦, and 60◦, and as a function ofime (0, 15, 30, 45, 60, 90, and 120 min) after sample (0.6 mL ofmg mL−1 LPS, 10 mM, pH 6 in both NaCl and CaCl2) intro-uction. All FTIR spectra presented are averages of 400 scanst a 4 cm−1 resolution (collection time: 495 s) using the cor-esponding LPS-free electrolyte solution as background. Peak
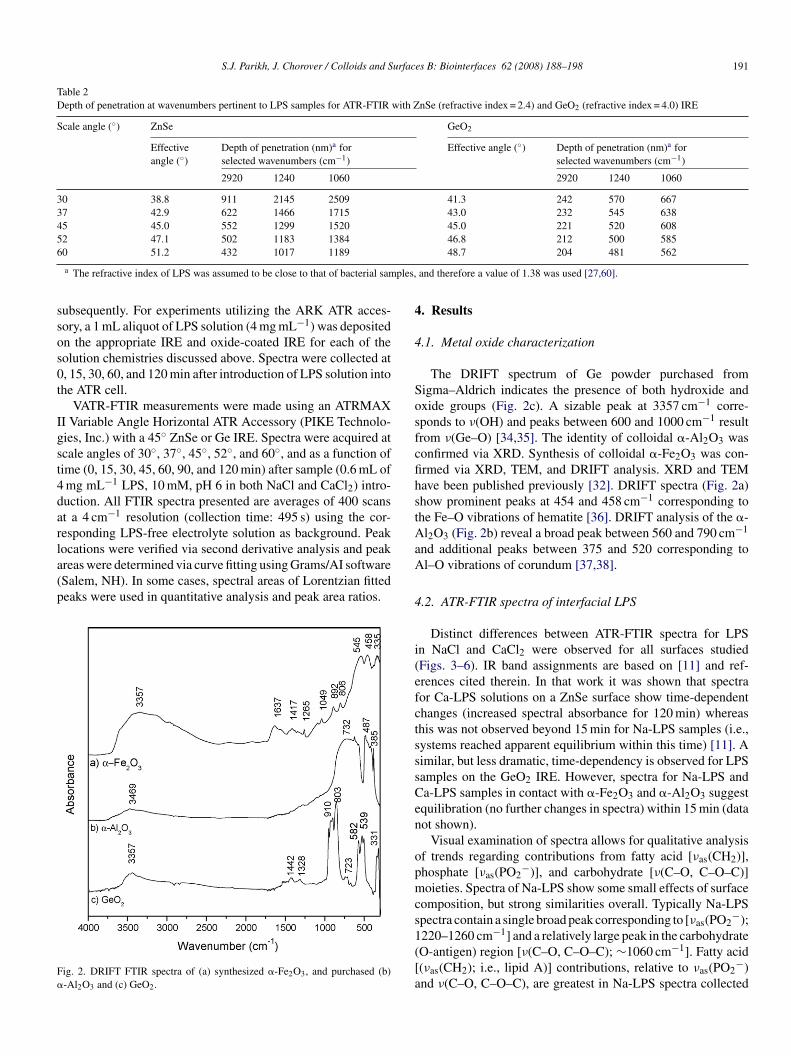
ocations were verified via second derivative analysis and peakreas were determined via curve fitting using Grams/AI softwareSalem, NH). In some cases, spectral areas of Lorentzian fittedeaks were used in quantitative analysis and peak area ratios.ig. 2. DRIFT FTIR spectra of (a) synthesized �-Fe2O3, and purchased (b)-Al2O3 and (c) GeO2.
aA
4
i(efctsssCen
opmcs1([a
48.7 204 481 562
and therefore a value of 1.38 was used [27,60].
. Results
.1. Metal oxide characterization
The DRIFT spectrum of Ge powder purchased fromigma–Aldrich indicates the presence of both hydroxide andxide groups (Fig. 2c). A sizable peak at 3357 cm−1 corre-ponds to ν(OH) and peaks between 600 and 1000 cm−1 resultrom ν(Ge–O) [34,35]. The identity of colloidal �-Al2O3 wasonfirmed via XRD. Synthesis of colloidal �-Fe2O3 was con-rmed via XRD, TEM, and DRIFT analysis. XRD and TEMave been published previously [32]. DRIFT spectra (Fig. 2a)how prominent peaks at 454 and 458 cm−1 corresponding tohe Fe–O vibrations of hematite [36]. DRIFT analysis of the �-l2O3 (Fig. 2b) reveal a broad peak between 560 and 790 cm−1
nd additional peaks between 375 and 520 corresponding tol–O vibrations of corundum [37,38].
.2. ATR-FTIR spectra of interfacial LPS
Distinct differences between ATR-FTIR spectra for LPSn NaCl and CaCl2 were observed for all surfaces studiedFigs. 3–6). IR band assignments are based on [11] and ref-rences cited therein. In that work it was shown that spectraor Ca-LPS solutions on a ZnSe surface show time-dependenthanges (increased spectral absorbance for 120 min) whereashis was not observed beyond 15 min for Na-LPS samples (i.e.,ystems reached apparent equilibrium within this time) [11]. Aimilar, but less dramatic, time-dependency is observed for LPSamples on the GeO2 IRE. However, spectra for Na-LPS anda-LPS samples in contact with �-Fe2O3 and �-Al2O3 suggestquilibration (no further changes in spectra) within 15 min (dataot shown).
Visual examination of spectra allows for qualitative analysisf trends regarding contributions from fatty acid [νas(CH2)],hosphate [νas(PO2
−)], and carbohydrate [ν(C–O, C–O–C)]oieties. Spectra of Na-LPS show some small effects of surface
omposition, but strong similarities overall. Typically Na-LPSpectra contain a single broad peak corresponding to [νas(PO2
−);
220–1260 cm−1] and a relatively large peak in the carbohydrateO-antigen) region [ν(C–O, C–O–C); ∼1060 cm−1]. Fatty acid(νas(CH2); i.e., lipid A)] contributions, relative to νas(PO2−)nd ν(C–O, C–O–C), are greatest in Na-LPS spectra collected
192 S.J. Parikh, J. Chorover / Colloids and Surfa
Fi
obi
cssIiiraZZp∼pt
a
vaLiL(oasti
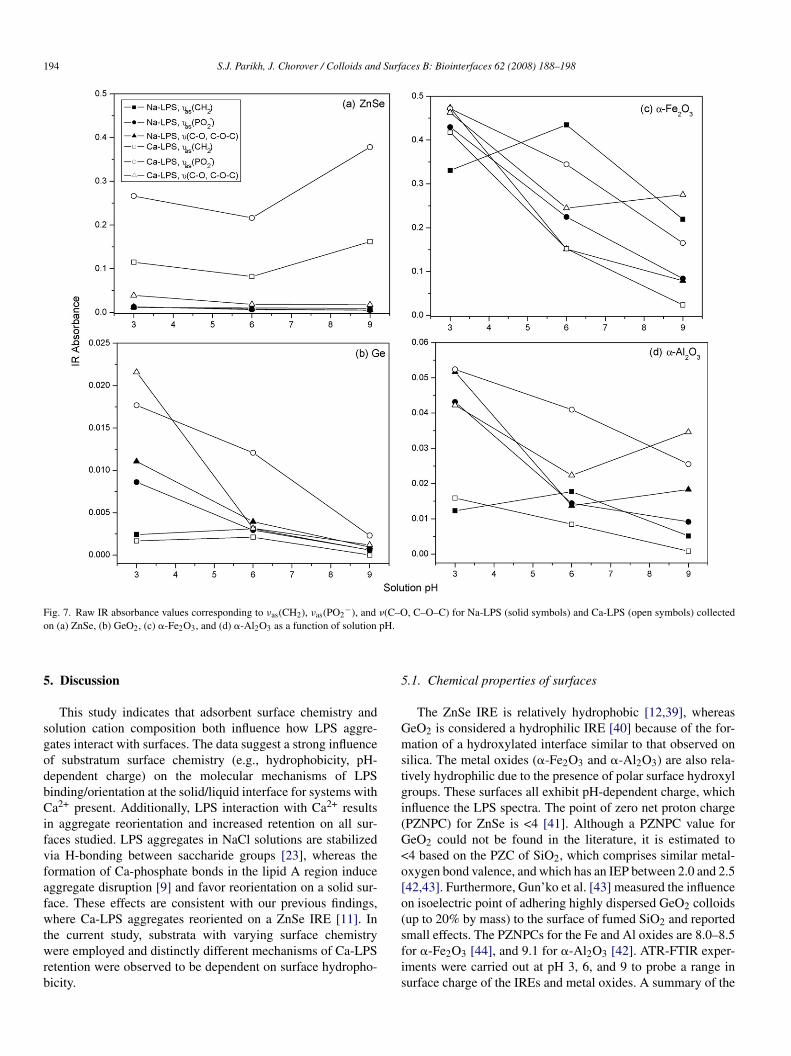
2oimportant to note that the Y-axis scales are not the same foreach part of Fig. 6. The greatest absorbance values correspondto low pH samples of Ca-LPS on ZnSe (Fig. 7a) and LPS (Naand Ca) on �-Fe2O3.
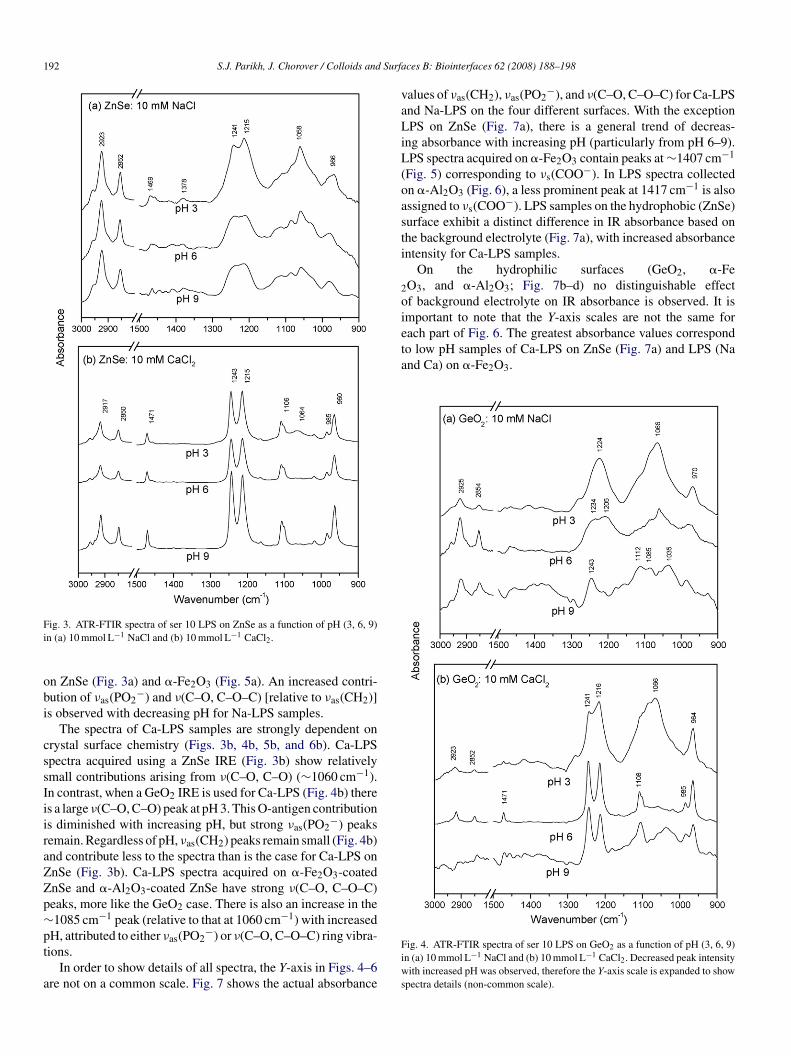
ig. 3. ATR-FTIR spectra of ser 10 LPS on ZnSe as a function of pH (3, 6, 9)n (a) 10 mmol L−1 NaCl and (b) 10 mmol L−1 CaCl2.
n ZnSe (Fig. 3a) and �-Fe2O3 (Fig. 5a). An increased contri-ution of νas(PO2
−) and ν(C–O, C–O–C) [relative to νas(CH2)]s observed with decreasing pH for Na-LPS samples.
The spectra of Ca-LPS samples are strongly dependent onrystal surface chemistry (Figs. 3b, 4b, 5b, and 6b). Ca-LPSpectra acquired using a ZnSe IRE (Fig. 3b) show relativelymall contributions arising from ν(C–O, C–O) (∼1060 cm−1).n contrast, when a GeO2 IRE is used for Ca-LPS (Fig. 4b) theres a large ν(C–O, C–O) peak at pH 3. This O-antigen contributions diminished with increasing pH, but strong νas(PO2
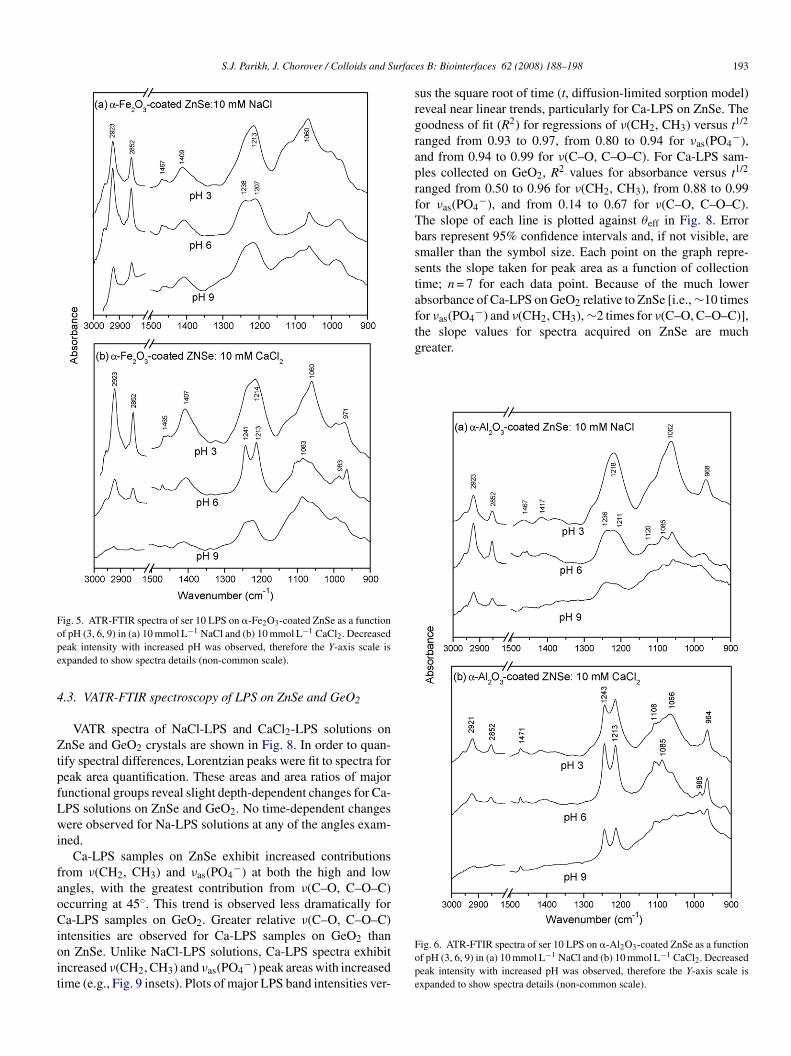
−) peaksemain. Regardless of pH, νas(CH2) peaks remain small (Fig. 4b)nd contribute less to the spectra than is the case for Ca-LPS onnSe (Fig. 3b). Ca-LPS spectra acquired on �-Fe2O3-coatednSe and �-Al2O3-coated ZnSe have strong ν(C–O, C–O–C)eaks, more like the GeO2 case. There is also an increase in the1085 cm−1 peak (relative to that at 1060 cm−1) with increased
H, attributed to either ν (PO −) or ν(C–O, C–O–C) ring vibra-
as 2ions.In order to show details of all spectra, the Y-axis in Figs. 4–6re not on a common scale. Fig. 7 shows the actual absorbance
Fiws
ces B: Biointerfaces 62 (2008) 188–198
alues of νas(CH2), νas(PO2−), and ν(C–O, C–O–C) for Ca-LPS
nd Na-LPS on the four different surfaces. With the exceptionPS on ZnSe (Fig. 7a), there is a general trend of decreas-
ng absorbance with increasing pH (particularly from pH 6–9).PS spectra acquired on �-Fe2O3 contain peaks at ∼1407 cm−1
Fig. 5) corresponding to νs(COO−). In LPS spectra collectedn �-Al2O3 (Fig. 6), a less prominent peak at 1417 cm−1 is alsossigned to νs(COO−). LPS samples on the hydrophobic (ZnSe)urface exhibit a distinct difference in IR absorbance based onhe background electrolyte (Fig. 7a), with increased absorbancentensity for Ca-LPS samples.
On the hydrophilic surfaces (GeO2, �-FeO3, and �-Al2O3; Fig. 7b–d) no distinguishable effectf background electrolyte on IR absorbance is observed. It is
ig. 4. ATR-FTIR spectra of ser 10 LPS on GeO2 as a function of pH (3, 6, 9)n (a) 10 mmol L−1 NaCl and (b) 10 mmol L−1 CaCl2. Decreased peak intensityith increased pH was observed, therefore the Y-axis scale is expanded to show
pectra details (non-common scale).
S.J. Parikh, J. Chorover / Colloids and Surfac
Fig. 5. ATR-FTIR spectra of ser 10 LPS on �-Fe2O3-coated ZnSe as a functionope
4
ZtpfLwi
faoCioit
srgraprfTbsstafthe slope values for spectra acquired on ZnSe are muchgreater.
f pH (3, 6, 9) in (a) 10 mmol L−1 NaCl and (b) 10 mmol L−1 CaCl2. Decreasedeak intensity with increased pH was observed, therefore the Y-axis scale isxpanded to show spectra details (non-common scale).
.3. VATR-FTIR spectroscopy of LPS on ZnSe and GeO2
VATR spectra of NaCl-LPS and CaCl2-LPS solutions onnSe and GeO2 crystals are shown in Fig. 8. In order to quan-
ify spectral differences, Lorentzian peaks were fit to spectra foreak area quantification. These areas and area ratios of majorunctional groups reveal slight depth-dependent changes for Ca-PS solutions on ZnSe and GeO2. No time-dependent changesere observed for Na-LPS solutions at any of the angles exam-
ned.Ca-LPS samples on ZnSe exhibit increased contributions
rom ν(CH2, CH3) and νas(PO4−) at both the high and low
ngles, with the greatest contribution from ν(C–O, C–O–C)ccurring at 45◦. This trend is observed less dramatically fora-LPS samples on GeO2. Greater relative ν(C–O, C–O–C)
ntensities are observed for Ca-LPS samples on GeO2 thann ZnSe. Unlike NaCl-LPS solutions, Ca-LPS spectra exhibitncreased ν(CH2, CH3) and νas(PO4
−) peak areas with increasedime (e.g., Fig. 9 insets). Plots of major LPS band intensities ver-
Fope
es B: Biointerfaces 62 (2008) 188–198 193
us the square root of time (t, diffusion-limited sorption model)eveal near linear trends, particularly for Ca-LPS on ZnSe. Theoodness of fit (R2) for regressions of ν(CH2, CH3) versus t1/2
anged from 0.93 to 0.97, from 0.80 to 0.94 for νas(PO4−),
nd from 0.94 to 0.99 for ν(C–O, C–O–C). For Ca-LPS sam-les collected on GeO2, R2 values for absorbance versus t1/2
anged from 0.50 to 0.96 for ν(CH2, CH3), from 0.88 to 0.99or νas(PO4
−), and from 0.14 to 0.67 for ν(C–O, C–O–C).he slope of each line is plotted against θeff in Fig. 8. Errorars represent 95% confidence intervals and, if not visible, aremaller than the symbol size. Each point on the graph repre-ents the slope taken for peak area as a function of collectionime; n = 7 for each data point. Because of the much lowerbsorbance of Ca-LPS on GeO2 relative to ZnSe [i.e., ∼10 timesor νas(PO4
−) and ν(CH2, CH3), ∼2 times for ν(C–O, C–O–C)],
ig. 6. ATR-FTIR spectra of ser 10 LPS on �-Al2O3-coated ZnSe as a functionf pH (3, 6, 9) in (a) 10 mmol L−1 NaCl and (b) 10 mmol L−1 CaCl2. Decreasedeak intensity with increased pH was observed, therefore the Y-axis scale isxpanded to show spectra details (non-common scale).
194 S.J. Parikh, J. Chorover / Colloids and Surfaces B: Biointerfaces 62 (2008) 188–198
F − �(C–Oo pH.
5
sgodbCifvfafwtwrb
5
Gmstgi(G<o[o(
ig. 7. Raw IR absorbance values corresponding to νas(CH2), νas(PO2 ), andn (a) ZnSe, (b) GeO2, (c) �-Fe2O3, and (d) �-Al2O3 as a function of solution
. Discussion
This study indicates that adsorbent surface chemistry andolution cation composition both influence how LPS aggre-ates interact with surfaces. The data suggest a strong influencef substratum surface chemistry (e.g., hydrophobicity, pH-ependent charge) on the molecular mechanisms of LPSinding/orientation at the solid/liquid interface for systems witha2+ present. Additionally, LPS interaction with Ca2+ results
n aggregate reorientation and increased retention on all sur-aces studied. LPS aggregates in NaCl solutions are stabilizedia H-bonding between saccharide groups [23], whereas theormation of Ca-phosphate bonds in the lipid A region induceggregate disruption [9] and favor reorientation on a solid sur-ace. These effects are consistent with our previous findings,here Ca-LPS aggregates reoriented on a ZnSe IRE [11]. In
he current study, substrata with varying surface chemistryere employed and distinctly different mechanisms of Ca-LPS
etention were observed to be dependent on surface hydropho-icity.
sfis
, C–O–C) for Na-LPS (solid symbols) and Ca-LPS (open symbols) collected
.1. Chemical properties of surfaces
The ZnSe IRE is relatively hydrophobic [12,39], whereaseO2 is considered a hydrophilic IRE [40] because of the for-ation of a hydroxylated interface similar to that observed on
ilica. The metal oxides (�-Fe2O3 and �-Al2O3) are also rela-ively hydrophilic due to the presence of polar surface hydroxylroups. These surfaces all exhibit pH-dependent charge, whichnfluence the LPS spectra. The point of zero net proton chargePZNPC) for ZnSe is <4 [41]. Although a PZNPC value foreO2 could not be found in the literature, it is estimated to4 based on the PZC of SiO2, which comprises similar metal-xygen bond valence, and which has an IEP between 2.0 and 2.542,43]. Furthermore, Gun’ko et al. [43] measured the influencen isoelectric point of adhering highly dispersed GeO2 colloidsup to 20% by mass) to the surface of fumed SiO2 and reported
mall effects. The PZNPCs for the Fe and Al oxides are 8.0–8.5or �-Fe2O3 [44], and 9.1 for �-Al2O3 [42]. ATR-FTIR exper-ments were carried out at pH 3, 6, and 9 to probe a range inurface charge of the IREs and metal oxides. A summary of the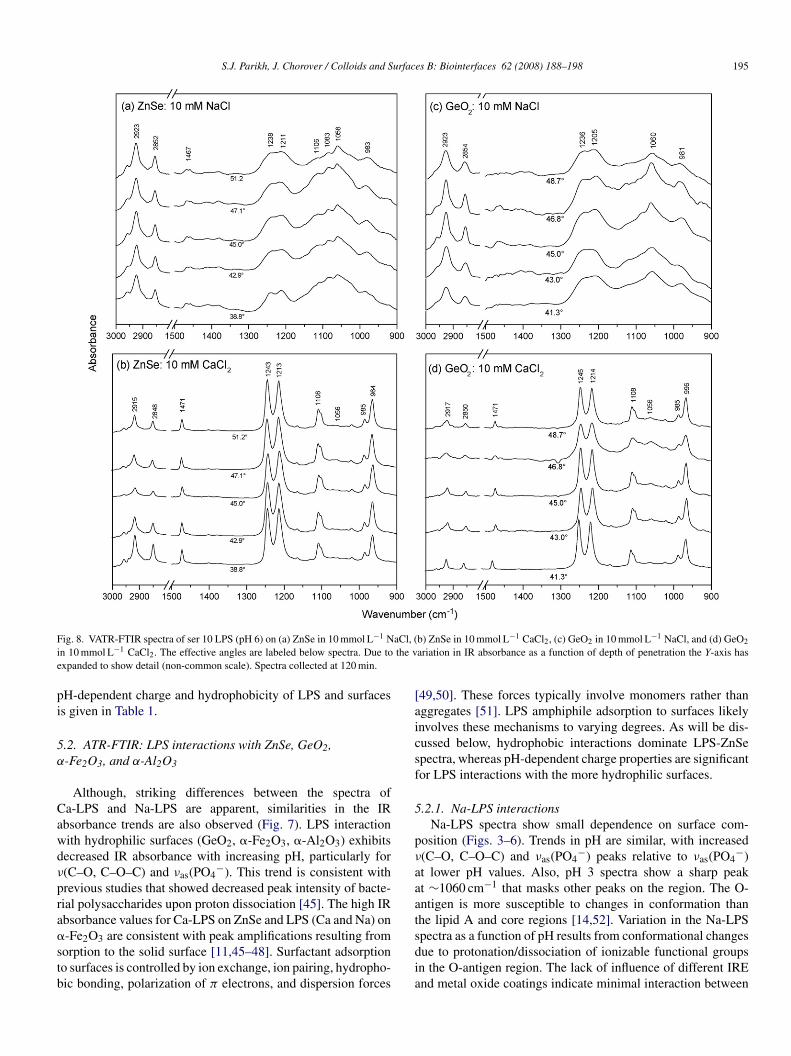
S.J. Parikh, J. Chorover / Colloids and Surfaces B: Biointerfaces 62 (2008) 188–198 195
F aCl, (i the ve
pi
5α
Cawdν
pra�stb
[aicsf
5
pν
aaat
ig. 8. VATR-FTIR spectra of ser 10 LPS (pH 6) on (a) ZnSe in 10 mmol L−1 Nn 10 mmol L−1 CaCl2. The effective angles are labeled below spectra. Due toxpanded to show detail (non-common scale). Spectra collected at 120 min.
H-dependent charge and hydrophobicity of LPS and surfacess given in Table 1.
.2. ATR-FTIR: LPS interactions with ZnSe, GeO2,-Fe2O3, and α-Al2O3
Although, striking differences between the spectra ofa-LPS and Na-LPS are apparent, similarities in the IRbsorbance trends are also observed (Fig. 7). LPS interactionith hydrophilic surfaces (GeO2, �-Fe2O3, �-Al2O3) exhibitsecreased IR absorbance with increasing pH, particularly for(C–O, C–O–C) and νas(PO4
−). This trend is consistent withrevious studies that showed decreased peak intensity of bacte-ial polysaccharides upon proton dissociation [45]. The high IRbsorbance values for Ca-LPS on ZnSe and LPS (Ca and Na) on
-Fe2O3 are consistent with peak amplifications resulting fromorption to the solid surface [11,45–48]. Surfactant adsorptiono surfaces is controlled by ion exchange, ion pairing, hydropho-ic bonding, polarization of π electrons, and dispersion forcessdia
b) ZnSe in 10 mmol L−1 CaCl2, (c) GeO2 in 10 mmol L−1 NaCl, and (d) GeO2
ariation in IR absorbance as a function of depth of penetration the Y-axis has
49,50]. These forces typically involve monomers rather thanggregates [51]. LPS amphiphile adsorption to surfaces likelynvolves these mechanisms to varying degrees. As will be dis-ussed below, hydrophobic interactions dominate LPS-ZnSepectra, whereas pH-dependent charge properties are significantor LPS interactions with the more hydrophilic surfaces.
.2.1. Na-LPS interactionsNa-LPS spectra show small dependence on surface com-
osition (Figs. 3–6). Trends in pH are similar, with increased(C–O, C–O–C) and νas(PO4
−) peaks relative to νas(PO4−)
t lower pH values. Also, pH 3 spectra show a sharp peakt ∼1060 cm−1 that masks other peaks on the region. The O-ntigen is more susceptible to changes in conformation thanhe lipid A and core regions [14,52]. Variation in the Na-LPS
pectra as a function of pH results from conformational changesue to protonation/dissociation of ionizable functional groupsn the O-antigen region. The lack of influence of different IREnd metal oxide coatings indicate minimal interaction between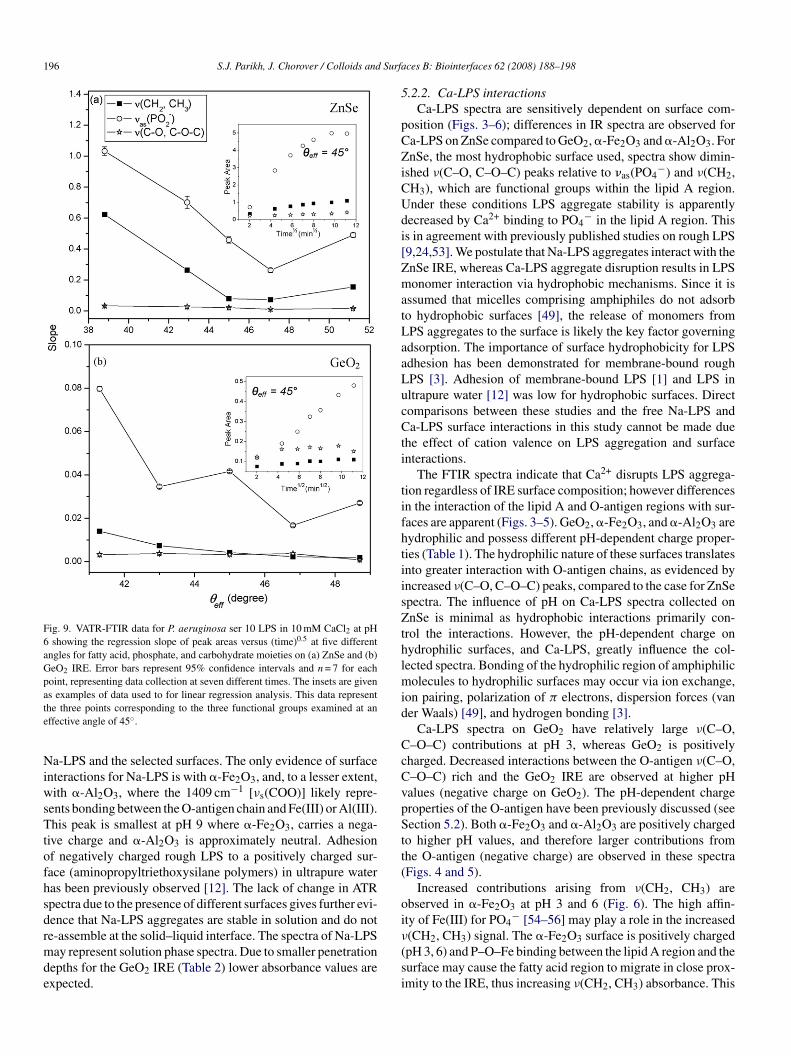
196 S.J. Parikh, J. Chorover / Colloids and Surfa
Fig. 9. VATR-FTIR data for P. aeruginosa ser 10 LPS in 10 mM CaCl2 at pH6 showing the regression slope of peak areas versus (time)0.5 at five differentangles for fatty acid, phosphate, and carbohydrate moieties on (a) ZnSe and (b)GeO2 IRE. Error bars represent 95% confidence intervals and n = 7 for eachpoint, representing data collection at seven different times. The insets are givenate
NiwsTtofhsdrmde
5
pCZiCUdi[ZmatLaaLucCti
tifhtiisZthlmid
CcCvpStt(
oi
s examples of data used to for linear regression analysis. This data representhe three points corresponding to the three functional groups examined at anffective angle of 45◦.
a-LPS and the selected surfaces. The only evidence of surfacenteractions for Na-LPS is with �-Fe2O3, and, to a lesser extent,ith �-Al2O3, where the 1409 cm−1 [νs(COO)] likely repre-
ents bonding between the O-antigen chain and Fe(III) or Al(III).his peak is smallest at pH 9 where �-Fe2O3, carries a nega-
ive charge and �-Al2O3 is approximately neutral. Adhesionf negatively charged rough LPS to a positively charged sur-ace (aminopropyltriethoxysilane polymers) in ultrapure wateras been previously observed [12]. The lack of change in ATRpectra due to the presence of different surfaces gives further evi-ence that Na-LPS aggregates are stable in solution and do not
e-assemble at the solid–liquid interface. The spectra of Na-LPSay represent solution phase spectra. Due to smaller penetrationepths for the GeO2 IRE (Table 2) lower absorbance values arexpected.
ν
(si
ces B: Biointerfaces 62 (2008) 188–198
.2.2. Ca-LPS interactionsCa-LPS spectra are sensitively dependent on surface com-
osition (Figs. 3–6); differences in IR spectra are observed fora-LPS on ZnSe compared to GeO2, �-Fe2O3 and �-Al2O3. FornSe, the most hydrophobic surface used, spectra show dimin-
shed ν(C–O, C–O–C) peaks relative to �as(PO4−) and ν(CH2,
H3), which are functional groups within the lipid A region.nder these conditions LPS aggregate stability is apparentlyecreased by Ca2+ binding to PO4
− in the lipid A region. Thiss in agreement with previously published studies on rough LPS9,24,53]. We postulate that Na-LPS aggregates interact with thenSe IRE, whereas Ca-LPS aggregate disruption results in LPSonomer interaction via hydrophobic mechanisms. Since it is
ssumed that micelles comprising amphiphiles do not adsorbo hydrophobic surfaces [49], the release of monomers fromPS aggregates to the surface is likely the key factor governingdsorption. The importance of surface hydrophobicity for LPSdhesion has been demonstrated for membrane-bound roughPS [3]. Adhesion of membrane-bound LPS [1] and LPS inltrapure water [12] was low for hydrophobic surfaces. Directomparisons between these studies and the free Na-LPS anda-LPS surface interactions in this study cannot be made due
he effect of cation valence on LPS aggregation and surfacenteractions.
The FTIR spectra indicate that Ca2+ disrupts LPS aggrega-ion regardless of IRE surface composition; however differencesn the interaction of the lipid A and O-antigen regions with sur-aces are apparent (Figs. 3–5). GeO2, �-Fe2O3, and �-Al2O3 areydrophilic and possess different pH-dependent charge proper-ies (Table 1). The hydrophilic nature of these surfaces translatesnto greater interaction with O-antigen chains, as evidenced byncreased ν(C–O, C–O–C) peaks, compared to the case for ZnSepectra. The influence of pH on Ca-LPS spectra collected onnSe is minimal as hydrophobic interactions primarily con-
rol the interactions. However, the pH-dependent charge onydrophilic surfaces, and Ca-LPS, greatly influence the col-ected spectra. Bonding of the hydrophilic region of amphiphilic
olecules to hydrophilic surfaces may occur via ion exchange,on pairing, polarization of π electrons, dispersion forces (vaner Waals) [49], and hydrogen bonding [3].
Ca-LPS spectra on GeO2 have relatively large ν(C–O,–O–C) contributions at pH 3, whereas GeO2 is positivelyharged. Decreased interactions between the O-antigen ν(C–O,–O–C) rich and the GeO2 IRE are observed at higher pHalues (negative charge on GeO2). The pH-dependent chargeroperties of the O-antigen have been previously discussed (seeection 5.2). Both �-Fe2O3 and �-Al2O3 are positively charged
o higher pH values, and therefore larger contributions fromhe O-antigen (negative charge) are observed in these spectraFigs. 4 and 5).
Increased contributions arising from ν(CH2, CH3) arebserved in �-Fe2O3 at pH 3 and 6 (Fig. 6). The high affin-ty of Fe(III) for PO4
− [54–56] may play a role in the increased
(CH2, CH3) signal. The �-Fe2O3 surface is positively chargedpH 3, 6) and P–O–Fe binding between the lipid A region and theurface may cause the fatty acid region to migrate in close prox-mity to the IRE, thus increasing ν(CH2, CH3) absorbance. This
urfac
i(
5
taLwffs[ν
osidstsacrdaG
ffsdaALLolhtrwmwadob
6
iabG
fscwceCfotsfmsl
A
d
R
[
[[
[
[
[
[
[
[
S.J. Parikh, J. Chorover / Colloids and S
s observed to a much smaller degree for Ca-LPS on �-Al2O3Fig. 5).
.3. VATR spectra of Na-LPS and Ca-LPS
Systematic probing of the aqueous solution at various dis-ances from the IRE permits evaluation of LPS functional grouprrangement at the solid/liquid interface. Reorientation of Ca-PS results in a depth-dependent arrangement at this interface,hereas Na-LPS spectra are unchanged as function of distance
rom the IRE. The sorption of polymeric molecules to sur-aces can be rate-limited by diffusion to the interface or byurface induced transitions of conformation and/or orientation57]. Plots of Ca-LPS peak areas, for ν(CH2, CH3), νas(PO2
−),(C–O, C–O–C) versus the square-root of time for five anglesf IR beam incidence (all conducted as separate experiments)how a near linear increase (R2 near unity, e.g., Fig. 9 insets)ndicating Ca-LPS interactions with ZnSe are consistent withiffusion-limited kinetics [58,59]. The slopes of these regres-ions are plotted against angle of incidence in Fig. 9a. Similarrends are observed for Ca-LPS on GeO2 (Fig. 9b), howeverlopes are much smaller and R2 values show greater variationnd are consistently near unity only for νas(PO2
−). The lack oforrelation indicates Ca-LPS aggregates do not exhibit the sameate-limited behavior upon adsorption to the GeO2 IRE. VATRata are collected at pH 6, where interactions between Ca-LPSnd GeO2 are minimal (Fig. 3) and show PO4
− interactions witheO2 (not observed for Na-LPS).Data for Ca-LPS on ZnSe reveal different slopes for the three
unctional groups (Fig. 9a inset), but have similar trends in θeffor ν(CH2, CH3) and νas(PO2
−). At low angle (high dp), steeplopes for ν(CH2, CH3) and νas(PO2
−) indicate strong time-ependence. Slopes decrease with increasing angle followed byslight increase at shallowest depth measured (θeff = 51.2◦).lthough we cannot determine the precise orientation of Ca-PS at the ZnSe IRE interface, depth-dependent variation inPS structure is apparent. Previous attempts to determine LPSrientation via polarized ATR-FTIR were inconclusive [11],ikely stemming from problems arising from functional groupeterogeneity of large molecules [12]. It is interesting to notehat peak areas corresponding to ν(C–O, C–O–C) of O-antigenemain relatively unchanged, whereas lipid A peak areas varyith penetration depth. This suggests that variation of dp isonitoring different layers of the aggregate structure, each ofhich may have different organization of LPS monomers and
ssociated subunits. Importantly, the length scale over whichepth-dependent changes in IR spectra are significant (hundredsf nanometers) is consistent with the size of aggregates measuredy DLS [18].
. Conclusions
The influence of surface hydrophobicity, charge, and chem-
cal composition on ATR-FTIR spectra of Na-LPS and Ca-LPSt the solid–water interface were investigated. The interfacialehavior of LPS is strongly influenced by the cations present.reater interaction between Ca-LPS (versus NaCl) and sur-[
[[
es B: Biointerfaces 62 (2008) 188–198 197
aces (ZnSe, GeO2, �-Fe2O3, �-Al2O3) was observed. Na-LPSpectra were similar irrespective of surface composition, indi-ating weaker surface interaction and spectra were consistentith solution phase behavior. Ca-LPS interactions with ZnSe are
ontrolled primarily by hydrophobic interactions (lipid A moi-ties), whereas pH-dependent surface charge plays a key role ina-LPS reactions (O-antigen moieties) on more hydrophilic sur-
aces (GeO2, �-Fe2O3, �-Al2O3). Increased interactions werebserved at lower pH values, where surfaces are generally posi-ively charged. VATR-FTIR spectra indicate variation in Ca-LPStructure as a function of distance from ZnSe and GeO2 IRE sur-aces (∼500–2500 nm). However, the specific orientation of LPSolecules could not be determined unambiguously. Na-LPS
pectra exhibit minimal depth-dependent changes, revealingimited surface interactions with GeO2 and ZnSe IREs at pH 6.
cknowledgement
This research was supported by the National Science Foun-ation CRAEMS program (Grant CHE-0089156).
eferences
[1] S.A. Makin, T.J. Beveridge, Microbiol.-UK 142 (1996) 299.[2] B.A. Jucker, H. Harms, A.J.B. Zehnder, Colloids Surf. B: Biointerf. 11
(1998) 33.[3] B.A. Jucker, H. Harms, S.J. Hug, A.J.B. Zehnder, Colloids Surf. B: Bioin-
terf. 9 (1997) 331.[4] I.W. Sutherland, Annu. Rev. Microbiol. 39 (1985) 243.[5] G. Seltmann, O. Holst, The outer membrane of the Gram-negative bacteria
and their components, in: G. Seltmann, O. Holst (Eds.), The Bacterial CellWall, Springer-Verlag, Berlin, Germany, 2002, pp. 31–66.
[6] J.S. Lam, L.L. Graham, J. Lightfoot, T. Dasgupta, T.J. Beveridge, J. Bac-teriol. 174 (1992) 7159.
[7] E.T. Rietschel, T. Kirikae, F.U. Schade, U. Mamat, G. Schmidt, H. Lopp-now, A.J. Ulmer, U. Zahringer, U. Seydel, F. Dipadova, M. Schreier, H.Brade, FAESB J. 8 (1994) 217.
[8] B.A. Jucker, A.J.B. Zehnder, H. Harms, Environ. Sci. Technol. 32 (1998)2909.
[9] Q. Wang, J.P. Zhang, T.R. Smith, W.E. Hurst, T. Sulpizio, Colloids Surf.B: Biointerf. 44 (2005) 110.
10] J.P. Zhang, Q. Wang, T.R. Smith, W.E. Hurst, T. Sulpizio, Biotechnol. Prog.21 (2005) 1220.
11] S.J. Parikh, J. Chorover, Colloids Surf. B: Biointerf. 55 (2007) 241.12] G. Reiter, M. Siam, D. Falkenhagen, W. Gollneritsch, D. Baurecht, U.P.
Fringeli, Langmuir 18 (2002) 5761.13] S.E. Paradis, D. Dubreuil, S. Rioux, M. Gottschalk, M. Jacques, Infect.
Immun. 62 (1994) 3311.14] U. Seydel, H. Labischinski, M. Kastowsky, K. Brandenburg, Immunobiol-
ogy 187 (1993) 191.15] C.A. Aurell, A.O. Wistrom, Biochem. Biophys. Res. Commun. 253 (1998)
119.16] N.C. Santos, A.C. Silva, M. Castanho, J. Martins-Silva, C. Saldanha, Chem-
biochem 4 (2003) 96.17] A. Bergstrand, C. Svanberg, M. Langton, M. Nyden, Colloids Surf. B:
Biointerf. 53 (2006) 9.18] S.J. Parikh, A Spectroscopic Study of Bacterial Polymers Mediating Cell
Adhesion and Mineral Transformations, Department of Soil, Water and
Environmental Science, University of Arizona, Tucson, 2006, p. 270.19] D. Naumann, C. Schultz, A. Sabisch, M. Kastowsky, H. Labischinski, J.Mol. Struct. 214 (1989) 213.
20] M. Schindler, M.J. Osborn, Biochemistry 18 (1979) 4425.21] L.P. Li, R.G. Luo, Biotechnol. Tech. 12 (1998) 119.
1 Surfa
[[
[[[
[[
[[
[
[[[
[
[
[
[
[
[[
[
[
[
[
[[[[[[[
[[[[[[
98 S.J. Parikh, J. Chorover / Colloids and
22] L.P. Li, R.G. Luo, Sep. Sci. Technol. 34 (1999) 1729.23] R.T. Coughlin, A.A. Peterson, A. Haug, H.J. Pownall, E.J. Mcgroarty,
Biochim. Biophys. Acta 821 (1985) 404.24] S. Obst, M. Kastowsky, H. Bradaczek, Biophys. J. 72 (1997) 1031.25] F.M.J. Mirabella, Appl. Specctrosc. Rev. 21 (1985) 45.26] U. Seydel, M. Oikawa, K. Fukase, S. Kusumoto, K. Brandenburg, Eur. J.
Biochem. 267 (2000) 3032.27] M. Jonasz, G. Fournier, D. Stramski, Appl. Opt. 36 (1997) 4214.28] A. Katz, A. Alimova, M. Xu, P. Gottlieb, E. Rudolph, J.C. Steiner, R.R.
Alfano, Opt. Lett. 30 (2005) 589.29] K.K. Chittur, Biomaterials 19 (1998) 357.30] M.R. Pereira, J. Yarwood, J. Polym. Sci. Part B-Polym. Phys. 32 (1994)
1881.31] U. Schwertmann, R.M. Cornell, Iron Oxides in the Laboratory: Preparation
and Characterization, Wiley-VCH, Weinheim, 1991.32] S.J. Parikh, J. Chorover, Langmuir 22 (2006) 8492.33] C. Mui, J.P. Senosiain, C.B. Musgrave, Langmuir 20 (2004) 7604.34] Y.F. Mei, G.G. Siu, X.H. Huang, K.W. Cheah, Z.G. Dong, L. Fang, M.R.
Sheng, X.L. Wu, X.M. Bao, Phys. Lett. A 331 (2004) 248.35] S.M. Abo-Naf, H. Darwish, M.M. El-Desoky, J. Mater. Sci. - Mater. Elec-
tron. 13 (2002) 537.36] U. Schwertmann, R.M. Taylor, Iron oxides, in: A. Klute (Ed.), Methods
of Soil Analysis, Part 1—Physical and Mineralogical Methods, SSSA,Madison, WI, 1989, pp. 379–438.
37] J.A. Gadsen, Infrared Spectra of Minerals and Related Organic Com-
pounds, Butterworths, London, UK, 1975.38] M.N. Danchevskaya, S.N. Torbin, Y.D. Ivakin, G.P. Muravieva, J. Phys.:Condens. Matter 16 (2004) S1187.
39] Y.P. Song, J. Yarwood, J. Tsibouklis, W.J. Feast, J. Cresswell, M.C. Petty,Langmuir 8 (1992) 262.
[
[
ces B: Biointerfaces 62 (2008) 188–198
40] T. Snabe, S.B. Petersen, J. Biotechnol. 95 (2002) 145.41] L.D. Tickanen, M.I. Tejedor-Tejedor, M.A. Anderson, Langmuir 13 (1997)
4829.42] D.L. Sparks, Environmental Soil Chemistry, Academic Press, Inc., San
Diego, CA, 1995.43] V.M. Gun’ko, V.I. Zarko, V.V. Turov, R. Leboda, E. Chibowski, V.V.
Gun’ko, J. Colloid Interface Sci. 205 (1998) 106.44] G. Sposito, The Chemsitry of Soils, Oxford University Press, New York,
1989.45] A. Omoike, J. Chorover, K.D. Kwon, J.D. Kubicki, Langmuir 20 (2004)
11108.46] A. Omoike, J. Chorover, Biomacromolecules 5 (2004) 1219.47] D. Peak, R.G. Ford, D.L. Sparks, J. Colloid Interface Sci. 218 (1999) 289.48] S.J. Hug, J. Colloid Interface Sci. 188 (1997) 415.49] S. Paria, K.C. Khilar, Adv. Colloid Interface Sci. 110 (2004) 75.50] P. Somasundaran, L. Huang, Adv. Colloid Interface Sci. 88 (2000) 179.51] J.C. Griffith, A.E. Alexander, J. Colloid Interface Sci. 25 (1967) 311.52] M. Kastowsky, T. Gutberlet, H. Bradaczek, J. Bacteriol. 174 (1992)
4798.53] R.T. Coughlin, A. Haug, E.J. Mcgroarty, Biochemistry 22 (1983) 2007.54] M.I. Tejedor-Tejedor, M.A. Anderson, Langmuir 6 (1990) 602.55] P. Persson, N. Nilsson, S. Sjoberg, J. Colloid Interface Sci. 177 (1996) 263.56] Y. Arai, D.L. Sparks, J. Colloid Interface Sci. 241 (2001) 317.57] M.A. Brusatori, P.R. van Tassel, J. Colloid Interface Sci. 219 (1999) 333.58] R.S. Kookana, L.A.G. Aylmore, R.G. Gerritse, Soil Sci. 154 (1992) 214.
59] O.H. Jacobsen, P. Moldrup, C. Larsen, L. Konnerup, L.W. Petersen, J.Hydrol. 196 (1997) 185.60] A. Katz, A. Alimova, M. Xu, E. Rudolph, M.K. Shah, H.E. Savage, R.B.
Rosen, S.A. Mccormick, R.R. Alfano, IEEE J. Sel. Top. Quan. El. 9 (2003)277.