Embed Size (px)
Citation preview
ATP Processor
Operation User Guide V2.1.2
For Software V1_14_4 April 2019
A+T Instruments Ltd
Lymington, UK Tel: +44 1590 718182 (24/7) www.AandTinstruments.com

A T P 1 U S E R G U I D E
© A+T 2019 1
Disclaimer
A+T Limited makes no representation or warranties of any kind whatsoever with respect to the contents and specifically disclaims any implied warranties of merchantability or fitness for any particular purpose. A+T Instruments Ltd (A+T) shall not be liable for any errors contained herein or for incidental or consequential damages in connection with the furnishing, performance or use of the hardware, associated software, or this written material. A+T reserves the right to revise this publication from time to time, and to make changes in the content without obligation to notify any person of such revision or changes. A copy of the A+T Conditions of Sale is available on request and includes a declaration of the warranty and limitation of liability which apply to all A+T products and services.
Health and Safety information
Under the terms of European and UK Health and Safety Legislation, A+T Limited is required to classify any hazardous materials in the products it supplies and to provide relevant safety information to users. Any hazardous materials in A+T products are clearly marked with appropriate symbols. Product Safety Data Sheets relating to these materials are available on request.
Trademarks
A+T is a registered trademark within the UK and European Union. B&G is a registered trademark of Navico within the UK, European Union and North America. Expedition is a registered trademark of Tasman Navigation within the UK and European Union.
Conformity.
The ATP Processor and interface cards and displays comply with the CE EMC directive 2004/108/EC and Level 2 of the Radio communications (Electromagnetic Compatibility) standard 2008
A T P 1 U S E R G U I D E
© A+T 2019 2
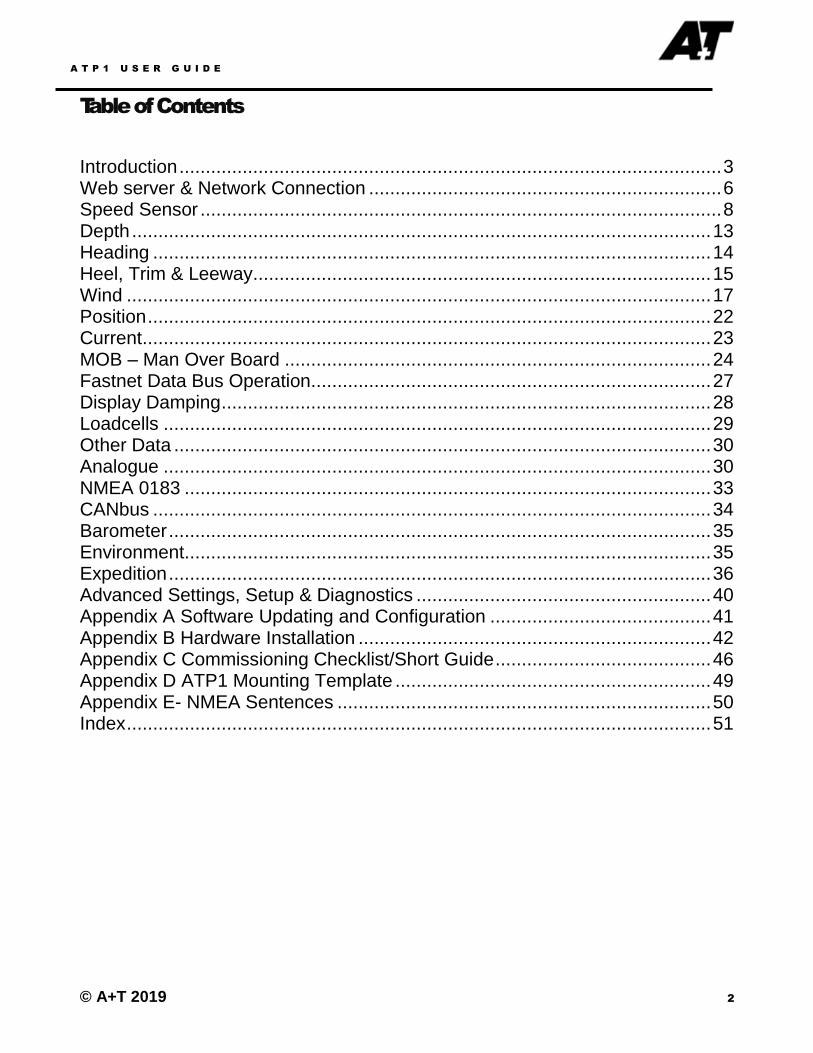
Table of Contents
Introduction ....................................................................................................... 3
Web server & Network Connection ................................................................... 6
Speed Sensor ................................................................................................... 8
Depth .............................................................................................................. 13
Heading .......................................................................................................... 14
Heel, Trim & Leeway ....................................................................................... 15
Wind ............................................................................................................... 17
Position ........................................................................................................... 22
Current ............................................................................................................ 23
MOB – Man Over Board ................................................................................. 24
Fastnet Data Bus Operation ............................................................................ 27
Display Damping ............................................................................................. 28
Loadcells ........................................................................................................ 29
Other Data ...................................................................................................... 30
Analogue ........................................................................................................ 30
NMEA 0183 .................................................................................................... 33
CANbus .......................................................................................................... 34
Barometer ....................................................................................................... 35
Environment.................................................................................................... 35
Expedition ....................................................................................................... 36
Advanced Settings, Setup & Diagnostics ........................................................ 40
Appendix A Software Updating and Configuration .......................................... 41
Appendix B Hardware Installation ................................................................... 42
Appendix C Commissioning Checklist/Short Guide ......................................... 46
Appendix D ATP1 Mounting Template ............................................................ 49
Appendix E- NMEA Sentences ....................................................................... 50
Index ............................................................................................................... 51

A T P 1 U S E R G U I D E
© A+T 2019 3
Introduction
About this Manual
This user guide assumes familiarity with the marine navigation systems and basic PC software tools. . This guide covers the ATP1 Instrument processor and aspects of the webserver interface which is needed to set up the processor, calibrate it and carry out diagnostics. Throughout the generalisation GNSS (Global Navigation Satellite System) is used to refer to GPS, Galileo, GLONASS and the other such positioning systems.
ATP1 Processor
The ATP processor covered in this manual is the core product from A+T and is aimed at racing boats, superyachts and large cruising and classic yachts.
Multi-Fuel connectivity
As many initial users of the ATP are yachts which have an installed base of B&G Fastnet displays, sensors and wiring, the ATP supports these with no change. The ATP therefore has four core databus connections: -
▪ Ethernet network carrying the ATP databus protocol (ATPDB)
This a standalone network which uses its own IP addressing and
protocols. It can also carry power to peripheral devices (but it is not
industry standard POE). It links A+T sensors and displays.
▪ A second general purpose Ethernet network connection.
This is a standard network connection intended to sit on the yacht’s
main network and used to access the ATP web server. If then
connected to a wireless network, then any connected computer or tablet
can access the ATP web server.
▪ Fastnet
This supports existing B&G displays, sensors and wiring including A+T
displays connected to Fastnet.
▪ CANbus

A T P U S E R G U I D E
© A+T 2019 4
An N2K compatible CANbus connector allows N”K and compatible
sensors to provide data to the ATP and allows data from the ATP to
drive displays, chart plotters and other N2K or compatible units..
Typical System
Webserver
Central to the setting up, calibrations and diagnostics of the ATP is the built-in webserver. It can be accessed from a suitably connected PC, MAC or tablet. All likely installations of the ATP will have a dedicated computer, and this is the prime tool for setting up and calibrating the system. Calibration and other system controls from displays are restricted to a few key functions.
Figure 1- Example Superyacht System

A T P U S E R G U I D E
© A+T 2019 5
As well as the ease of use, room for explanation and ‘tool tips’, the other advantage of the webserver is that the user can see much of the calculation going on in the ATP processor and is provided with considerable diagnostic information.
Expedition performance and navigation software
Once configured from the webserver, the ATP is intended to work as a stand-alone system with no connection to either a computer or internet. Attention has been given to producing fast, reliable calculation and output of high quality core data required to sail the yacht. Higher level functions such as start-line, laylines, optimal routing, sail selection and the weather are not included and are left to be provided by dedicated software solutions such as Expedition and displayed using external channels with no practical limit. The ATP has been developed for use specifically with Expedition both to provide these functions and to provide for editing and uploading of performance information. Other software packages may be interfaced over time. The ATP does provide target performance information, even when not connected to a computer, but does not provide for its editing or updating which is done in Expedition. The ATP does not provide data logging. This is left again to Expedition or a connected computer application. A higher specification processor due for launch in 2019 will include very extensive and high data-rate logging capability.
Overview of this user guide
This user guide mainly provides the background and explanation of how the ATP works. Detailed ‘how to’ is not provided as this is generally intuitive from the webserver. Updates are continually produced reflecting feedback and system development. Please visit: - www.AandTinstruments.com/downloads for the latest version of the manual and the ATP software.

A T P U S E R G U I D E
© A+T 2019 6
Webserver & Network Connection
Getting Started
▪ First step is to provide power to the unit. Connect a power source
between the range; 10 – 36 V dc.
▪ Next gain access to the webserver via the ATP Ethernet port. This
can be direct (on older computers or if difficulty then a cross-over
cable or switch should be used) or by connecting the ATP to an
existing network with a DHCP server. If this is required, then ensure
the ethernet is connected both to the ATP and to the DHCP server
before powering up the unit.
IP Addressing
▪ When shipped the ATP has fixed IP address 192.168.1.219
▪ On power up, the ATP waits for 5 seconds to see if a DHCP server
is providing an IP address on the connected network (if there is
one). If no DHCP address is received, then the IP address reverts
to its fixed IP address. This may be changed once initial access to
the webserver is achieved.
▪ To determine the IP address that the ATP has adopted check the
small LCD display in top left corner of ATP cabinet. It can also be
shown on any connected display on the Fastnet bus under
MENU/ATP1/IP ADDR or Channel 254.
Ethernet port wiring
A T P U S E R G U I D E
© A+T 2019 7
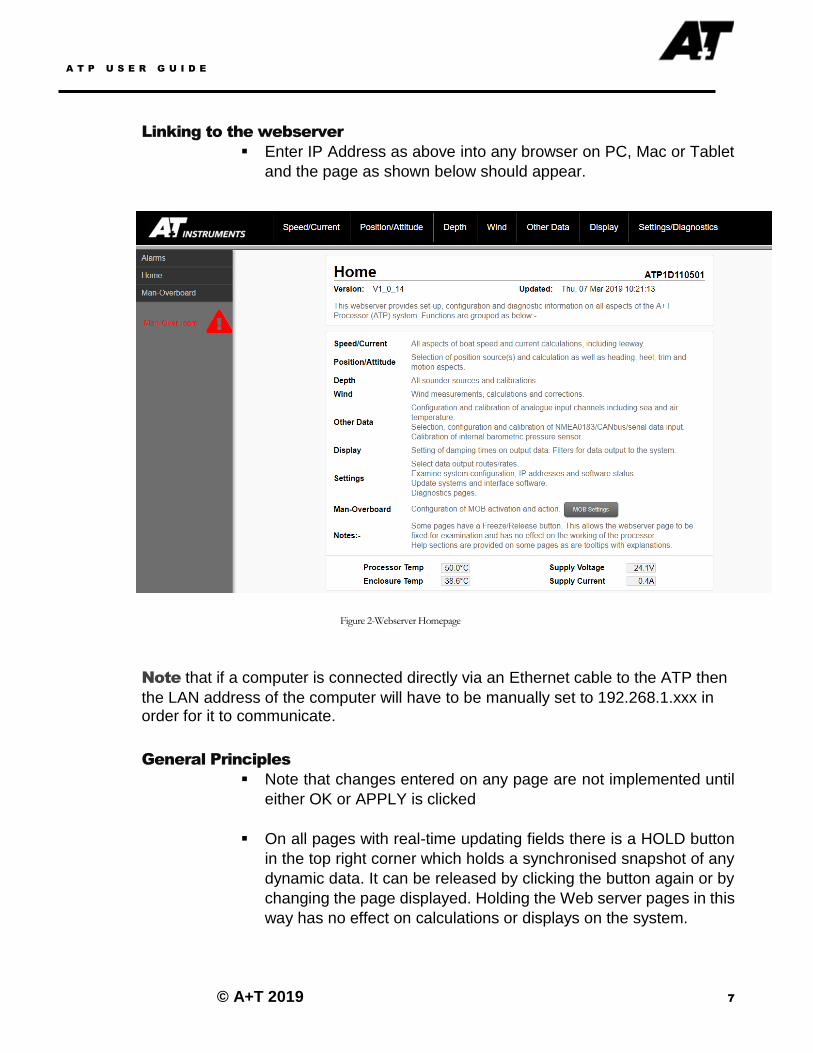
Linking to the webserver
▪ Enter IP Address as above into any browser on PC, Mac or Tablet
and the page as shown below should appear.
Note that if a computer is connected directly via an Ethernet cable to the ATP then
the LAN address of the computer will have to be manually set to 192.268.1.xxx in order for it to communicate.
General Principles
▪ Note that changes entered on any page are not implemented until
either OK or APPLY is clicked
▪ On all pages with real-time updating fields there is a HOLD button
in the top right corner which holds a synchronised snapshot of any
dynamic data. It can be released by clicking the button again or by
changing the page displayed. Holding the Web server pages in this
way has no effect on calculations or displays on the system.
Figure 2-Webserver Homepage
A T P U S E R G U I D E
© A+T 2019 8
Speed Sensor
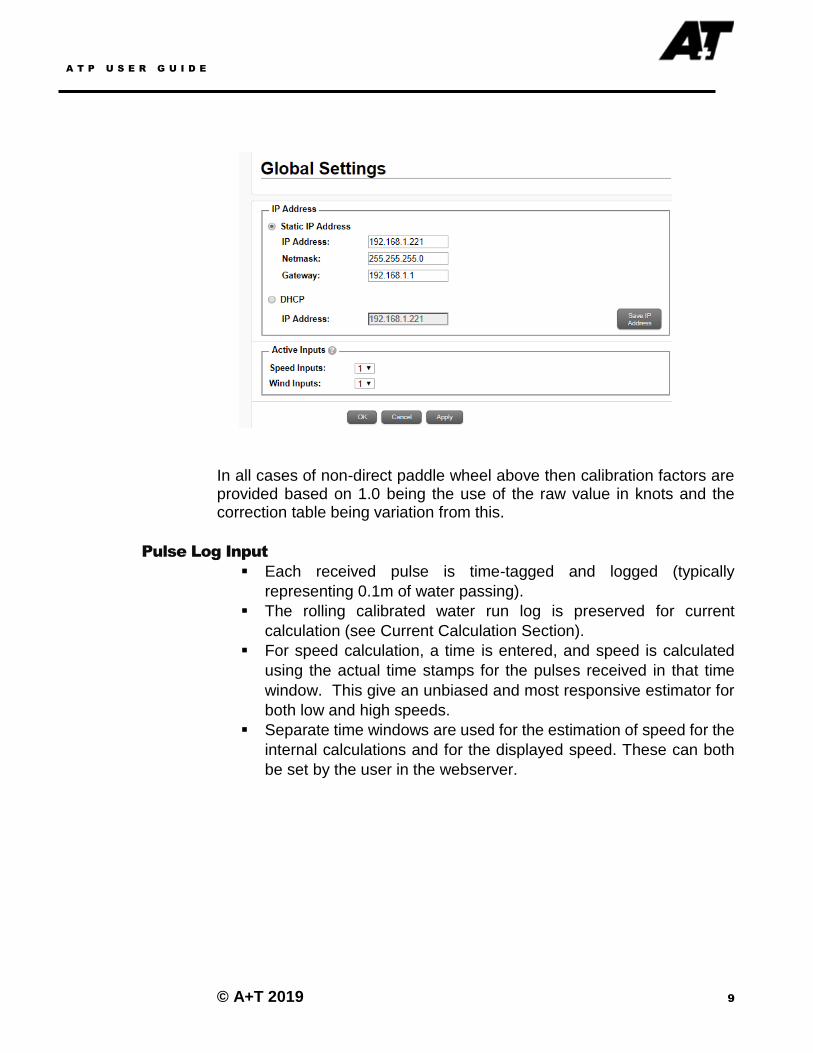
The ATP speed input is primarily oriented around taking the raw pulse input from a pulse type paddle-wheel log. These are still the most reliable all-round speed sensors, despite the drawbacks of fouling, boundary layer effects and aeration. They also have the advantage of directly reading water run distance which is the best input for current calculation. Two such logs (port and starboard) are generally catered for with a changeover switch (COS) so the processor only sees a single pulse train which is switched from side to side. Alternatively two input boards can be used within the processor to achieve the same. This method also allows for a degree of security should one board fail. Calibration is via a single Hz value, typically in the range, 1-6 representing the pulse rate produced from 1 knot of boat speed,. For many users a single calibration value, usually established by motoring over several runs calibrated against GNSS will suffice. The webserver provides a tool for doing this. For more sophisticated applications, the calibration factor may be varied for different speeds and for different heel angles and tacks. This is set up in the webserver under ADVANCED in the speed/log section. Provision for taking speed information from either a doppler log or EM log. These can be interfaced using either NMEA0183 or N2K. One or two ‘smart’ paddle wheel logs may also be used. If there are two then selection criteria of which to use can be chosen as based either on heel or apparent wind angle (AWA). Additional speed and wind inputs can be added in Global Settings.
A T P U S E R G U I D E
© A+T 2019 9
In all cases of non-direct paddle wheel above then calibration factors are provided based on 1.0 being the use of the raw value in knots and the correction table being variation from this.
Pulse Log Input
▪ Each received pulse is time-tagged and logged (typically
representing 0.1m of water passing).
▪ The rolling calibrated water run log is preserved for current
calculation (see Current Calculation Section).
▪ For speed calculation, a time is entered, and speed is calculated
using the actual time stamps for the pulses received in that time
window. This give an unbiased and most responsive estimator for
both low and high speeds.
▪ Separate time windows are used for the estimation of speed for the
internal calculations and for the displayed speed. These can both
be set by the user in the webserver.
A T P U S E R G U I D E
© A+T 2019 10
Use of GNSS SOG for Speed
To access: Speed/Current-Speed- Use GNSS as speed input
While not ideal there are a number of occasions when this is pragmatic: - ▪ When a traditional speed sensor is missing or not working.
A ‘get out of jail’ solution which still gives a wind solution until the
sensor is fixed. Especial care should be taken with lay-lines, wind
direction, wind calibration and many other functions when this is
selected. The wind solution is neither water wind nor ground wind
and odd results are likely in many areas.
▪ For high-speed sailing where the paddle wheel spends significant
time out of the water.
This is a good solution as current is less relevant. .
▪ In areas of little or no current.
Again, using SOG in many cases will be better than a poorly
calibrated speed sensor. .
In all these cases then no current can be estimated and the ATP will force current calculation display and output to zero. The DANGER of setting this is doing so for good reasons as above and then forgetting it is set and crew, location or navigator changing and not realising.
A T P U S E R G U I D E
© A+T 2019 11
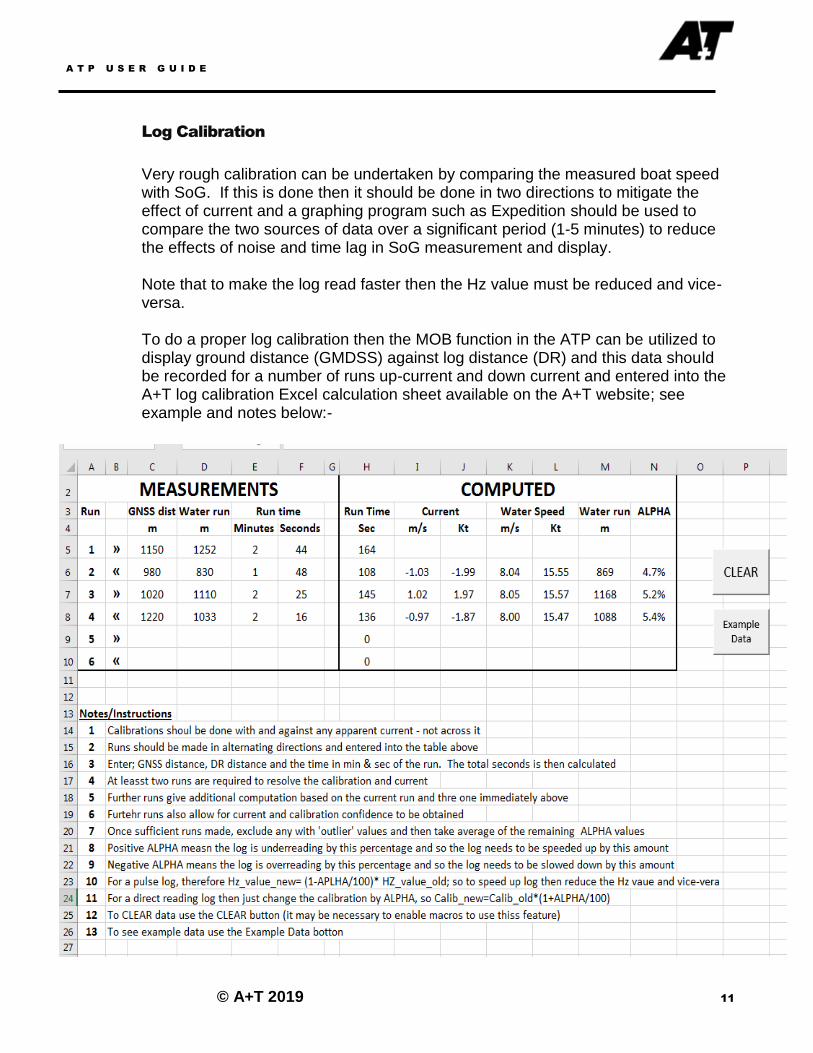
Log Calibration
Very rough calibration can be undertaken by comparing the measured boat speed with SoG. If this is done then it should be done in two directions to mitigate the effect of current and a graphing program such as Expedition should be used to compare the two sources of data over a significant period (1-5 minutes) to reduce the effects of noise and time lag in SoG measurement and display. Note that to make the log read faster then the Hz value must be reduced and vice-versa. To do a proper log calibration then the MOB function in the ATP can be utilized to display ground distance (GMDSS) against log distance (DR) and this data should be recorded for a number of runs up-current and down current and entered into the A+T log calibration Excel calculation sheet available on the A+T website; see example and notes below:-
A T P U S E R G U I D E
© A+T 2019 12
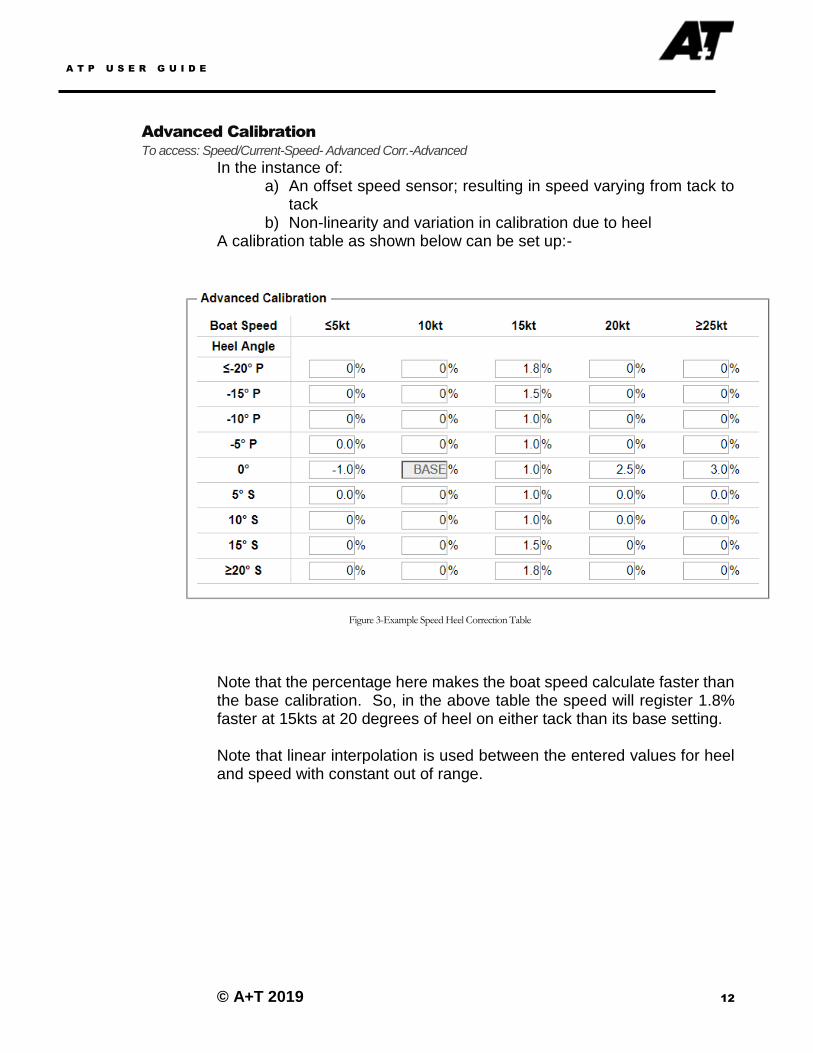
Advanced Calibration
To access: Speed/Current-Speed- Advanced Corr.-Advanced
In the instance of: a) An offset speed sensor; resulting in speed varying from tack to
tack b) Non-linearity and variation in calibration due to heel
A calibration table as shown below can be set up:-
Note that the percentage here makes the boat speed calculate faster than the base calibration. So, in the above table the speed will register 1.8% faster at 15kts at 20 degrees of heel on either tack than its base setting. Note that linear interpolation is used between the entered values for heel and speed with constant out of range.
Figure 3-Example Speed Heel Correction Table

A T P U S E R G U I D E
© A+T 2019 13
Depth
Depth input(s) may come from a variety of sources: - ▪ Internal depth board on the ATP processor
▪ External depth board connected on the A+T ethernet databus. In
both of these cases, Signal, noise and reliability of reading is
available.
▪ One or more NMEA 0183 sensors
▪ The procedure as with much NMEA 0183 interfacing
is: -
▪ Check that depth input can be seen by looking at the
Diagnostics/NMEA0183 page
▪ Select the appropriate input filter in the Other
Data.NMEA01`83/Filter page
▪ Select the chosen input NMEA0183 input channel on
the Depth page
▪ N2K or compatible CANbus depth sensor.
A T P U S E R G U I D E
© A+T 2019 14
Heading
To access: Position/Attitude-Heading
The ATP Processor is set up to manage input of heading in True or Magnetic and to calculate and display derived variables, such as True Wind Direction in either. An internal model is maintained to compute variation based on the position and date (NOAA WMM2015 magnetic variation model) Heading data sources include: -
▪ NMEA0183. This is typically from Gyro compasses or older
standalone magnetic compasses
▪ CANbus, typically modern stand-alone magnetic compasses or
GPS-compass
▪ Fastnet, from a compass previously fitted to a B&G network (such
as Halcyon or Halcyon Gyro Compass with B&G processor) or a
B&G Autopilot with compass connected
The source of the heading required can be set, its origin (T or M) selected and any alignment offset can be applied. Note that depending on selection, additional information will need to be input on the NMEA0183, CANbus or Fastnet webserver pages. It is important that T or M is set the same as compass output. When a Simrad/B&G N2K compass is used then the compass swing can be initiated by manually entering the web-page /bandg.php where a dialogue to do this will then appear. An offset may be added to the raw compass heading to fine-tune the relation between boat axis and sensor or tow accommodate where the compass sensor has to be mounted not-aligned with the boat axis at all.
A T P U S E R G U I D E
© A+T 2019 15
Heel, Trim & Leeway
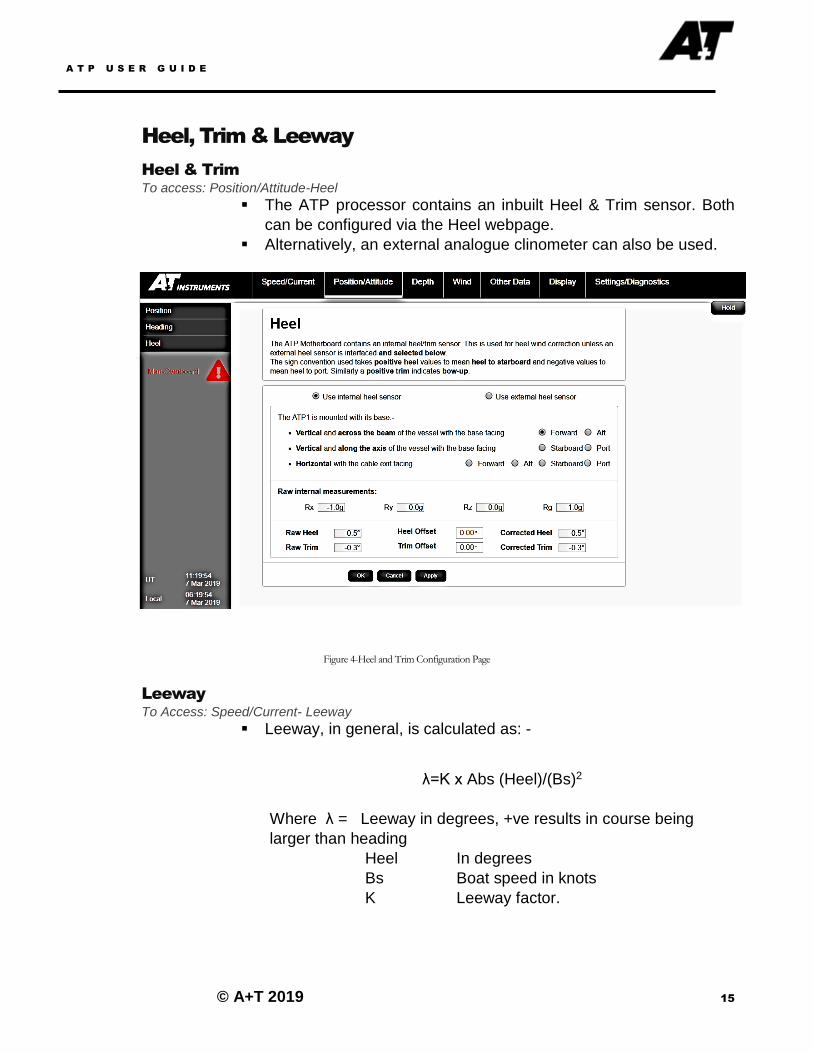
Heel & Trim
To access: Position/Attitude-Heel
▪ The ATP processor contains an inbuilt Heel & Trim sensor. Both
can be configured via the Heel webpage.
▪ Alternatively, an external analogue clinometer can also be used.
Leeway
To Access: Speed/Current- Leeway
▪ Leeway, in general, is calculated as: -
λ=K x Abs (Heel)/(Bs)2
Where λ = Leeway in degrees, +ve results in course being
larger than heading
Heel In degrees
Bs Boat speed in knots
K Leeway factor.
Figure 4-Heel and Trim Configuration Page
A T P U S E R G U I D E
© A+T 2019 16
▪ Typically, K is about 30 for a superyacht, 15 for an efficient
cruiser/racer and near to 10 for a very efficient race yacht (all fixed
keel). Canards, dagger-boards and foils can change this to the
point where leeway can be negative (i.e. yacht climbs to windward
of its heading). A negative value of K can be entered to reflect this.
▪ However, at low boat speeds, this approach can give rise to
spurious estimates of leeway and derived values (including TWA.)
Therefore, the ATP processor modifies the above with a weighting
factor: -
Bs <2.5 kts: W=0 2.5kts <Bs<5 kts: W: linearly increasing from 0 to 1 Bs > 5 kts : W=1
▪ Thus, the above calculations for leeway is used above 5kt and to a
modified extent and speeds down to 2.5 kt. Below this speed, it is
not possible to model leeway based only on speed and heel (apart
from anything else boats may intentionally be heeled to leeward in
light airs) so adopting a zero value for leeway gives a more stable
estimate for wind calculations.

A T P U S E R G U I D E
© A+T 2019 17
Wind
Apparent Wind Speed and Apparent Wind Angle Measurement
The webserver page shows the raw data from the masthead unit. Standard speed calibration for a B&G MHU are 1.04 for the pulse rate and offset. An angle offset for the MHU may be entered to correct fo alignment.
Heel correction should only be used if the heel set-up has been implemented correctly. The corrections applied if selected allow for the geometric correction for the heeled mast sensor.
Figure 5-Wind Calculation Flow Diagram
A T P U S E R G U I D E
© A+T 2019 18
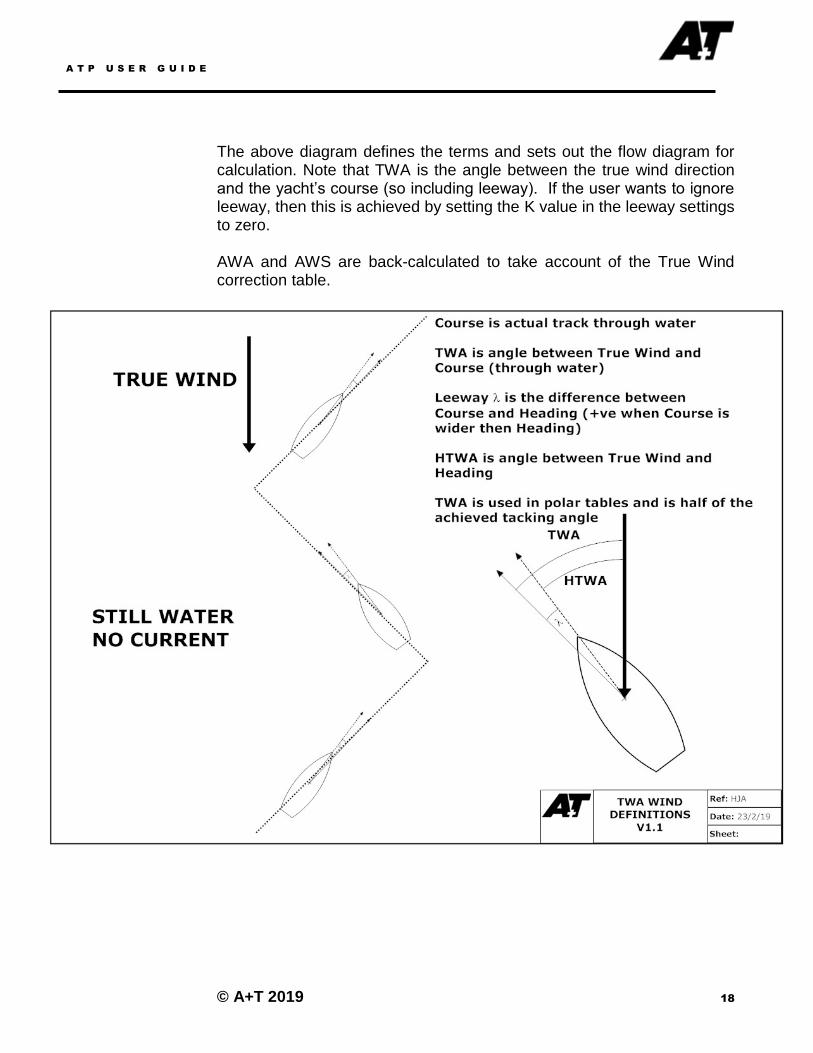
The above diagram defines the terms and sets out the flow diagram for calculation. Note that TWA is the angle between the true wind direction and the yacht’s course (so including leeway). If the user wants to ignore leeway, then this is achieved by setting the K value in the leeway settings to zero. AWA and AWS are back-calculated to take account of the True Wind correction table.
A T P U S E R G U I D E
© A+T 2019 19
Calibration
Wind angle calibration is a process of three phases: -
Phase 1
▪ Make sure that boat speed and heading is properly calibrated.
Unless these are correct and consistent on all headings, speeds
and heel angles, then any further calibrations are based on shaky
foundations at best.
Phase Two
▪ Calibrate MHU offset. A basic setting can be achieved by motoring
dead upwind in the lightest possible breeze and adjusting the MHU
offset on the wind measurement page until this shows zero.
▪ The real test is if the AWA is the same upwind tack to tack with well-
mixed wind and the same trim and boat speed on each side. Once
this is achieved (adjust the MHU) then, the TWA should also be the
same tack to tack.
Phase Three
▪ However, as the sails distort the wind field in the vicinity of the boat
and other factors such as rigging induced mast twist come into play,
the measured apparent wind angle will generally not be that which
would be measured in the absence of these factors. The result is
that the simple geometric calculation of TWA from the measured
apparent wind will be wider or narrower than its actual value.
▪ This manifests itself in the TWD ‘tacking’ from tack to tack. If the
calculated TWA is too wide, then the TWD will lift tack to tack and
if too narrow it will head.
▪ This can be corrected by applying a correction to the measured
apparent wind. However, it is not straightforward to see how much
change in AWA is needed to correct the observed error in TWA.
Instead the ATP, like other high-end performance instrument
systems, allows for the TWA corrections to be entered directly and
the apparent wind corrections are then back-calculated.
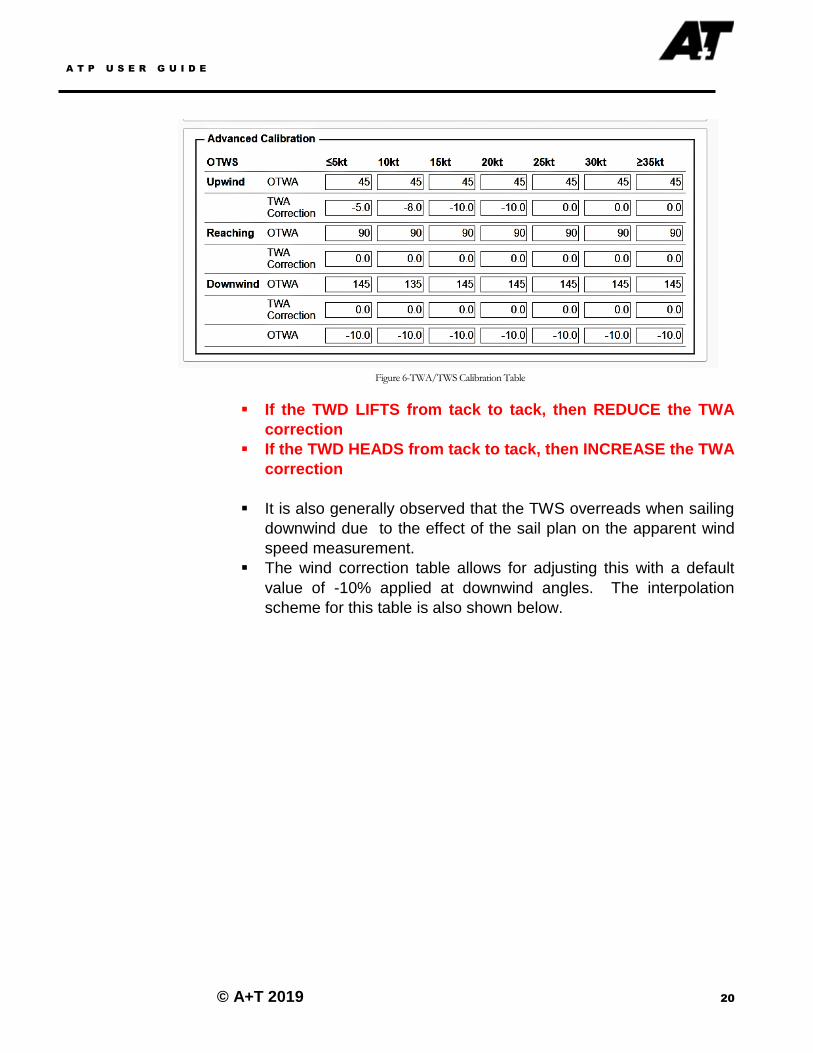
▪ The correction table provides for a range of wind speeds and entries
for upwind, 90 deg reaching and downwind. As the upwind TWA
on a TP52 in 7 knots is very different from that of a Perini, provision
is made for entering the angles that should be considered upwind
and downwind at different wind speed. Note that these are not polar
values, just typical TWAs.
A T P U S E R G U I D E
© A+T 2019 20
▪ If the TWD LIFTS from tack to tack, then REDUCE the TWA
correction
▪ If the TWD HEADS from tack to tack, then INCREASE the TWA
correction
▪ It is also generally observed that the TWS overreads when sailing
downwind due to the effect of the sail plan on the apparent wind
speed measurement.
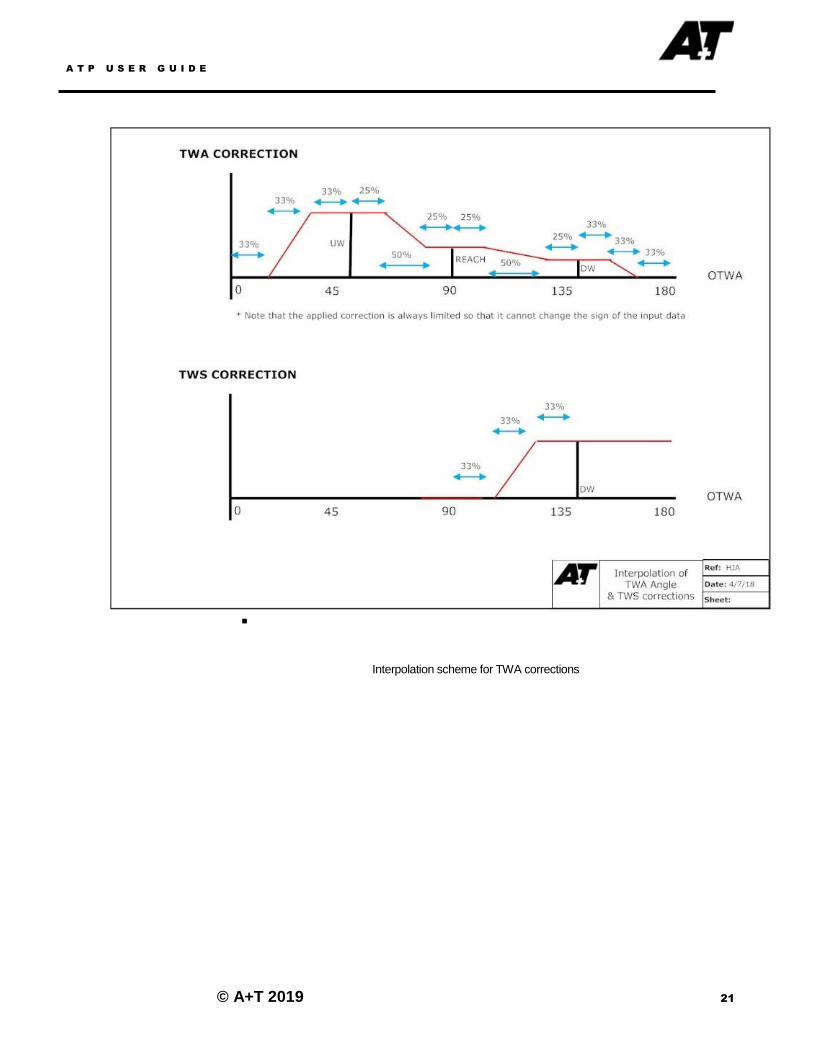
▪ The wind correction table allows for adjusting this with a default
value of -10% applied at downwind angles. The interpolation
scheme for this table is also shown below.
Figure 6-TWA/TWS Calibration Table
A T P U S E R G U I D E
© A+T 2019 21
▪
Interpolation scheme for TWA corrections
A T P U S E R G U I D E
© A+T 2019 22
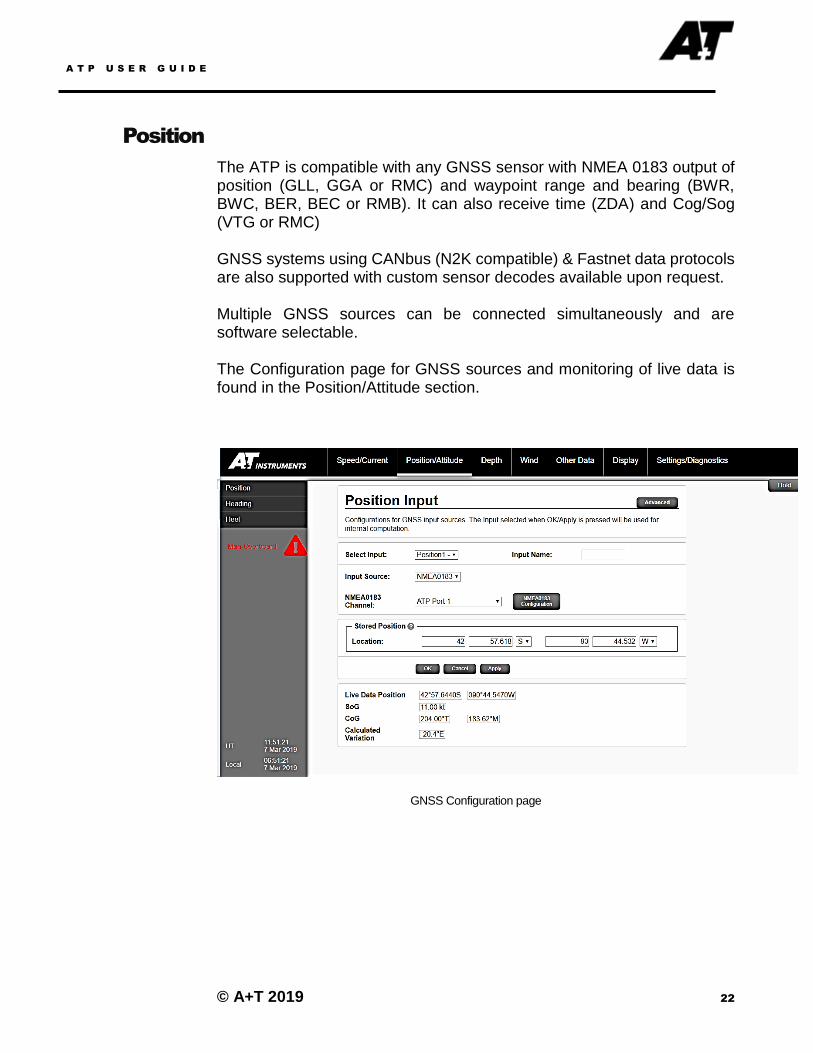
Position
The ATP is compatible with any GNSS sensor with NMEA 0183 output of position (GLL, GGA or RMC) and waypoint range and bearing (BWR, BWC, BER, BEC or RMB). It can also receive time (ZDA) and Cog/Sog (VTG or RMC) GNSS systems using CANbus (N2K compatible) & Fastnet data protocols are also supported with custom sensor decodes available upon request. Multiple GNSS sources can be connected simultaneously and are software selectable. The Configuration page for GNSS sources and monitoring of live data is found in the Position/Attitude section.
GNSS Configuration page
A T P U S E R G U I D E
© A+T 2019 23
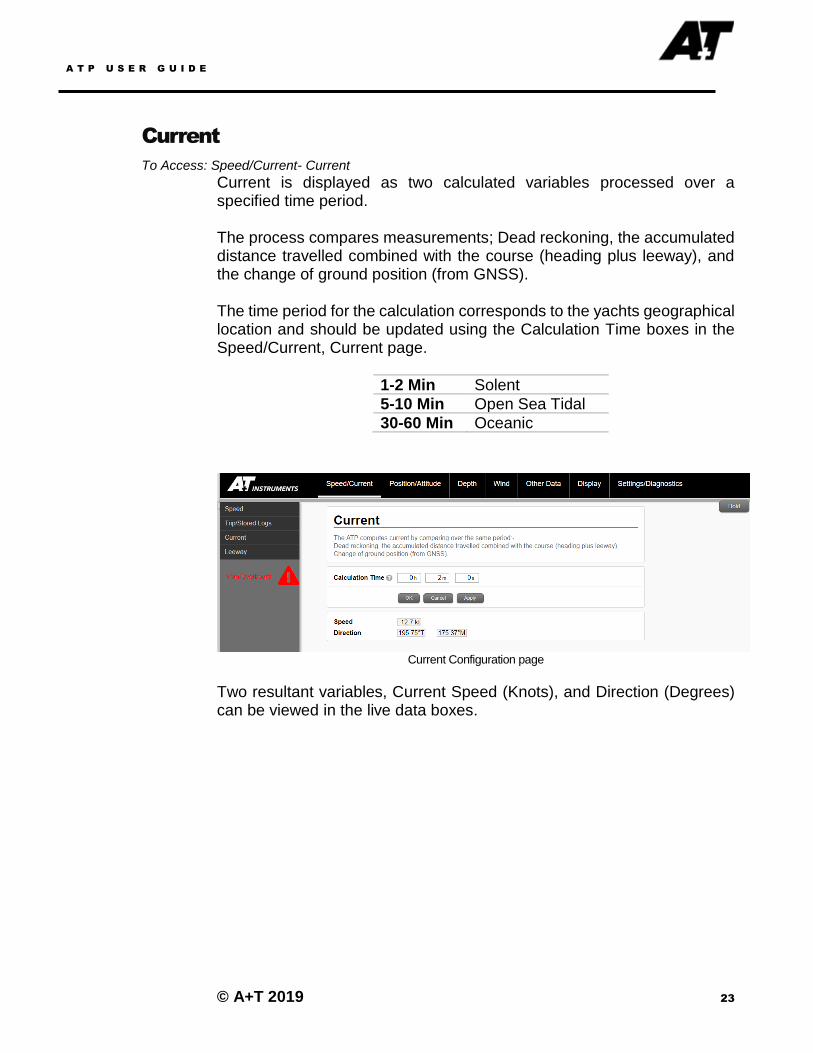
Current
To Access: Speed/Current- Current
Current is displayed as two calculated variables processed over a specified time period. The process compares measurements; Dead reckoning, the accumulated distance travelled combined with the course (heading plus leeway), and the change of ground position (from GNSS). The time period for the calculation corresponds to the yachts geographical location and should be updated using the Calculation Time boxes in the Speed/Current, Current page.
1-2 Min Solent
5-10 Min Open Sea Tidal
30-60 Min Oceanic
Current Configuration page
Two resultant variables, Current Speed (Knots), and Direction (Degrees) can be viewed in the live data boxes.
A T P U S E R G U I D E
© A+T 2019 24
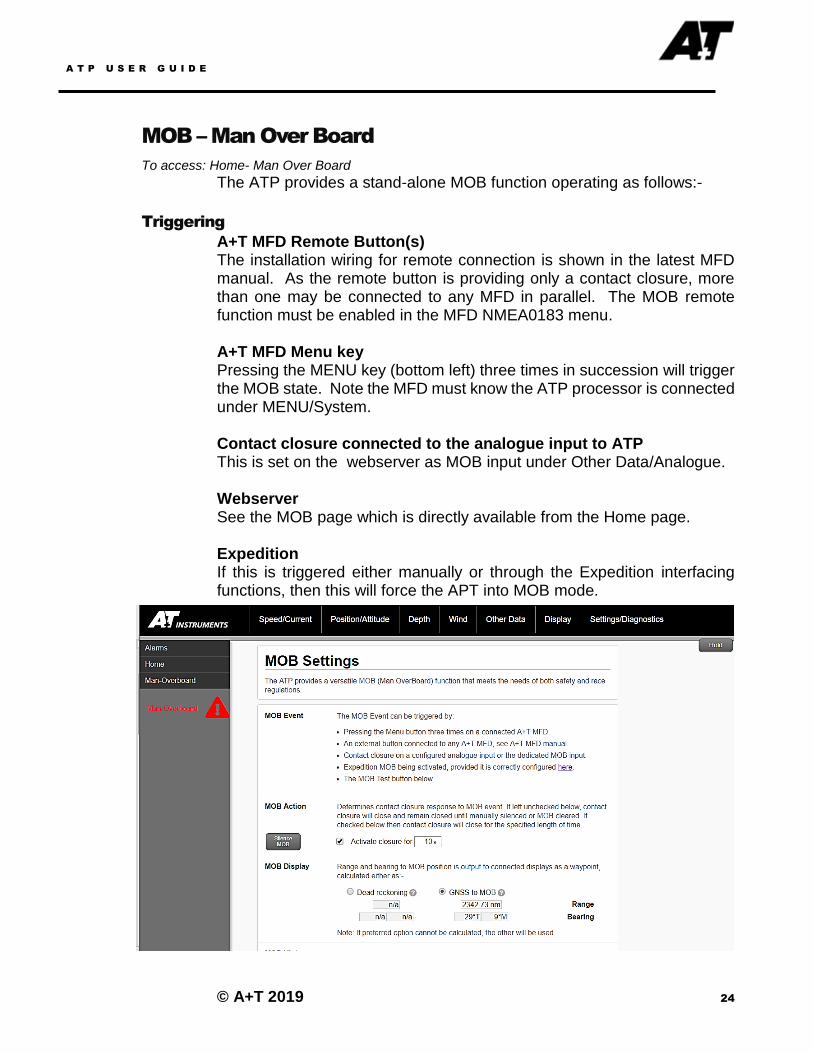
MOB – Man Over Board
To access: Home- Man Over Board
The ATP provides a stand-alone MOB function operating as follows:-
Triggering
A+T MFD Remote Button(s) The installation wiring for remote connection is shown in the latest MFD manual. As the remote button is providing only a contact closure, more than one may be connected to any MFD in parallel. The MOB remote function must be enabled in the MFD NMEA0183 menu. A+T MFD Menu key Pressing the MENU key (bottom left) three times in succession will trigger the MOB state. Note the MFD must know the ATP processor is connected under MENU/System. Contact closure connected to the analogue input to ATP This is set on the webserver as MOB input under Other Data/Analogue. Webserver See the MOB page which is directly available from the Home page. Expedition If this is triggered either manually or through the Expedition interfacing functions, then this will force the APT into MOB mode.
A T P U S E R G U I D E
© A+T 2019 25
Action
On activation, the following are initiated: - The MOB relay on the ATP is closed and remains closed until SILENCED as described below. This can be wired as required to set off alarm(s) or even Jon buoy
Expedition, if running on a connected PC is forced into MOB mode. MOB position, time and source is recorded and available on the webserver page. Displays, if set up, are forced into MOB mode as described below.
Display
Any A+T MFD can be set to an ‘MOB’ mode. Note that B&G displays on mixed mode systems cannot be set to provide this. On MOB activation the display on the this (but not on other displays unless they are also selected as MOB) goes automatically to show range in meters and bearing in selected default display (True/Mag) mode as well as time in mm:ss since MOB activation. If another page is selected on such a display while the MOB is still activated, then the new data will be shown just for 5 sec and then the display will revert to MOB again (this is so MOB information cannot accidentally lost) This information is also available on the webserver MOB page.
Note that any B&G displays on a system will be unaffected and shall continue to show waypoint information as normal (so not MOB)
Calculation
The mode of calculation of range and bearing may be selected in the MOB page of the webserver to be either direct GNSS or Dead Reckoning. In areas of little or no current then the GNSS mode is more certain. If there is substantial current and the log and compass are known to be well calibrated, then the DR mode will compensate substantially for the current. The modes may be changed after the MOB has been triggered without losing the original MOB position.

A T P U S E R G U I D E
© A+T 2019 26
Silencing & Clearing MOB
The MOB alarm may be SILENCED at any A+T MFD (so not just those selected as MOB displays) by pressing MENU twice and then selecting SILENCE. This still leaves the existing MOB position set and the selected displays forced to the MOB range/bearing/time display (so accidental fumbling of keys does not lose the MOB display at selected stations) To clear the whole MOB status then at any MFD press MENU twice and then select CLEAR. Both SILENCE and CLEAR can be set from the webserver page. Clearing the MOB status on Expedition has no effect on the ATP MOB status.
Reactivation of MOB
No new MOB activation can take place until the previous one is cleared as described above. A history of MOB events is available on the webserver MOB page.
A T P U S E R G U I D E
© A+T 2019 27
Fastnet Data Bus Operation
To access: Display- Fastnet
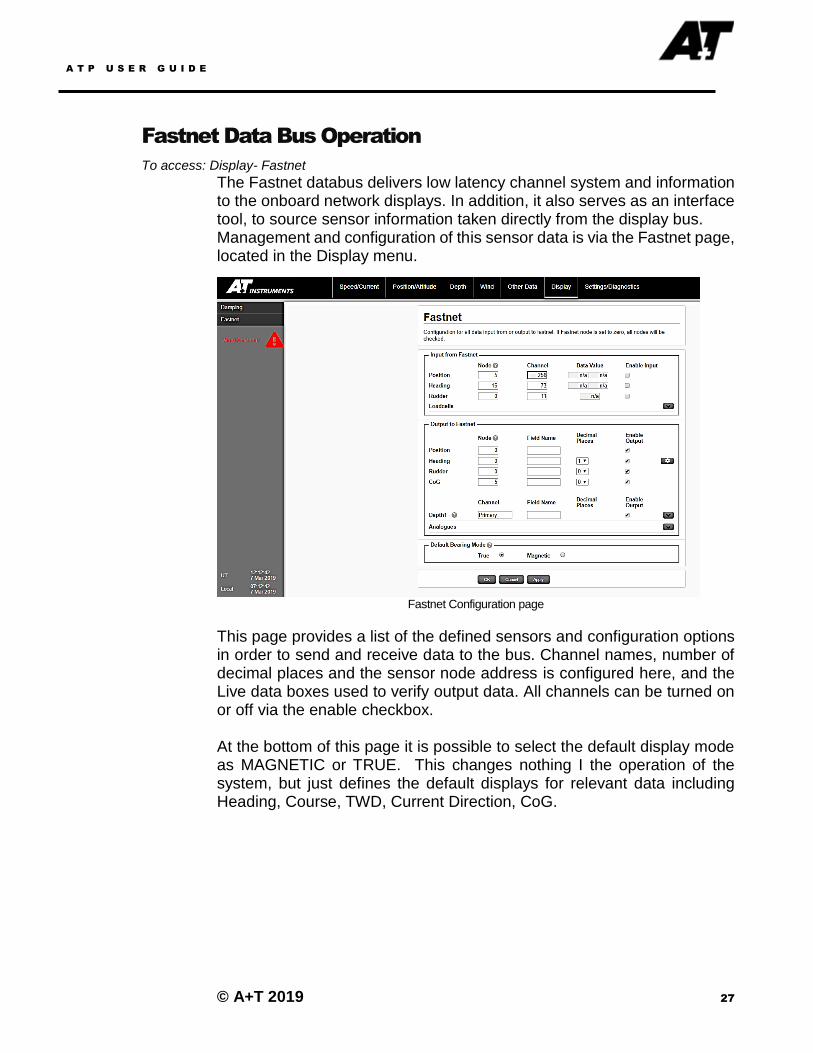
The Fastnet databus delivers low latency channel system and information to the onboard network displays. In addition, it also serves as an interface tool, to source sensor information taken directly from the display bus. Management and configuration of this sensor data is via the Fastnet page, located in the Display menu.
Fastnet Configuration page
This page provides a list of the defined sensors and configuration options in order to send and receive data to the bus. Channel names, number of decimal places and the sensor node address is configured here, and the Live data boxes used to verify output data. All channels can be turned on or off via the enable checkbox. At the bottom of this page it is possible to select the default display mode as MAGNETIC or TRUE. This changes nothing I the operation of the system, but just defines the default displays for relevant data including Heading, Course, TWD, Current Direction, CoG.

A T P U S E R G U I D E
© A+T 2019 28
Display Damping
To access: Display- Damping
The damping ratio or damping factor(s) are parameters used to characterise the frequency response for the channel data shown on the displays. Each parameter affects the displayed data only and does not influence the calculation or calibration value. Under Field are the primary system channels and their respective damping values, shown as time constants in units seconds.
Once the damping time has been updated, you can verify channel data using the live data boxes. There are two data boxes for each channel; one shows the raw channel and the other the corrected damped output value. This can be useful when making multiple display changes and when a display is not clearly visible. The A+T processor uses box car damping, averaging data equally weighted over the selected period.
A T P U S E R G U I D E
© A+T 2019 29
Loadcells
There are three ways that load cell information can be linked into the ATP:-
Analogue 0-5v input
This is produced by a number of loadcell amplifiers including those made by Diverse and Tinley Electronics (DLA1). These can be interfaced using any of the analogue input channels on the ATP.
Fastnet Loadcell amplifier.
B&G for many years produced a loadcell amplifier which connected directly to the Fastnet bus and A+T make replacements for these (DLA2). On the Fastnet Display page it is possible to set up for the ATP to read loadcell data off the Fastnet bus for data logging and output to Expedition.
A+T ATP2 Loadcell amplifier
This connects directly to the ATP Ethernet bus.. .
A T P U S E R G U I D E
© A+T 2019 30
Other Data
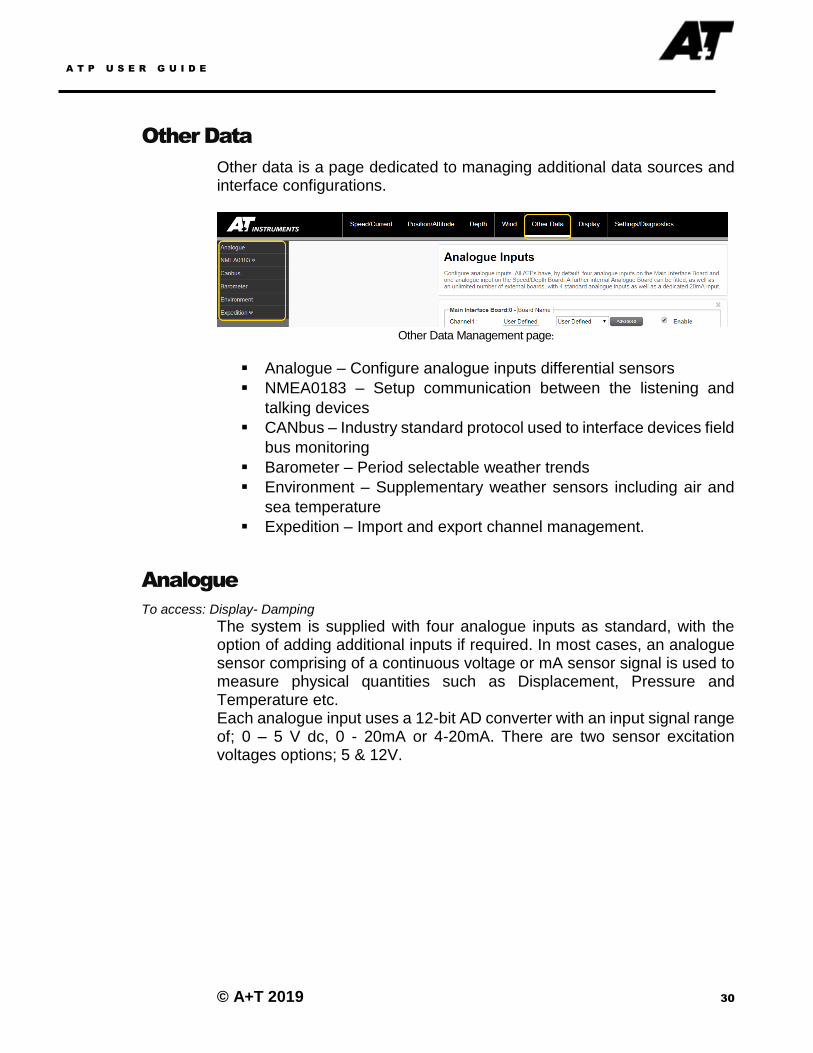
Other data is a page dedicated to managing additional data sources and interface configurations.
Other Data Management page:
▪ Analogue – Configure analogue inputs differential sensors
▪ NMEA0183 – Setup communication between the listening and
talking devices
▪ CANbus – Industry standard protocol used to interface devices field
bus monitoring
▪ Barometer – Period selectable weather trends
▪ Environment – Supplementary weather sensors including air and
sea temperature
▪ Expedition – Import and export channel management.
Analogue
To access: Display- Damping
The system is supplied with four analogue inputs as standard, with the option of adding additional inputs if required. In most cases, an analogue sensor comprising of a continuous voltage or mA sensor signal is used to measure physical quantities such as Displacement, Pressure and Temperature etc. Each analogue input uses a 12-bit AD converter with an input signal range of; 0 – 5 V dc, 0 - 20mA or 4-20mA. There are two sensor excitation voltages options; 5 & 12V.
A T P U S E R G U I D E
© A+T 2019 31
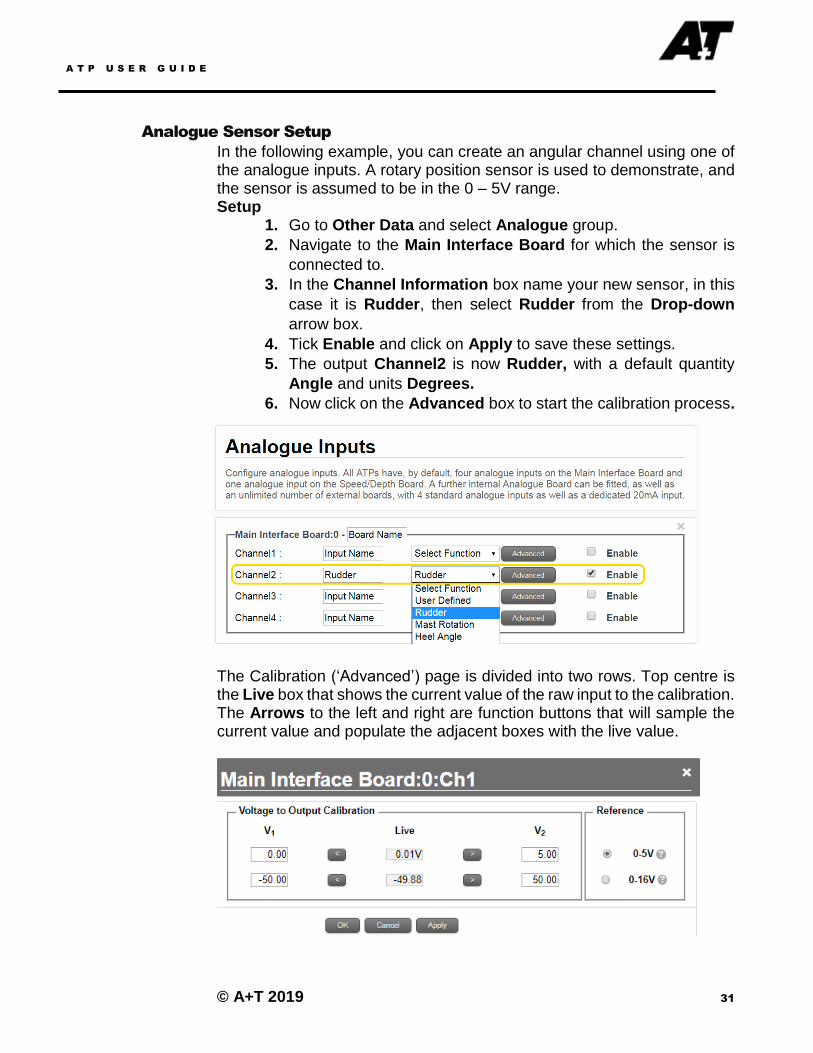
Analogue Sensor Setup
In the following example, you can create an angular channel using one of the analogue inputs. A rotary position sensor is used to demonstrate, and the sensor is assumed to be in the 0 – 5V range. Setup
1. Go to Other Data and select Analogue group.
2. Navigate to the Main Interface Board for which the sensor is
connected to.
3. In the Channel Information box name your new sensor, in this
case it is Rudder, then select Rudder from the Drop-down
arrow box.
4. Tick Enable and click on Apply to save these settings.
5. The output Channel2 is now Rudder, with a default quantity
Angle and units Degrees.
6. Now click on the Advanced box to start the calibration process.
The Calibration (‘Advanced’) page is divided into two rows. Top centre is the Live box that shows the current value of the raw input to the calibration. The Arrows to the left and right are function buttons that will sample the current value and populate the adjacent boxes with the live value.
A T P U S E R G U I D E
© A+T 2019 32
The second row features the actual calibration value and the two known reference positions. The two Arrow function buttons operate identically to the ones above, sampling the current value and populating the adjacent Value boxes with the live value. Reference 0-5V: Ratiometric input reference
In many pressure sensors the electrical output signal depends on the supply voltage. This is a common feature for unamplified sensors and sensors that do not have built-in regulated power supply such as potentiometers and level sensors.
0-16V: Absolute Input Reference
For sensors with built- in regulated power supply, or supplied from a source other than the ATP, where any variation of the supply will have no effect on the sensor output. NOTE: This input reference should still be chosen for 0-5V sensors with built in regulators.
A T P U S E R G U I D E
© A+T 2019 33
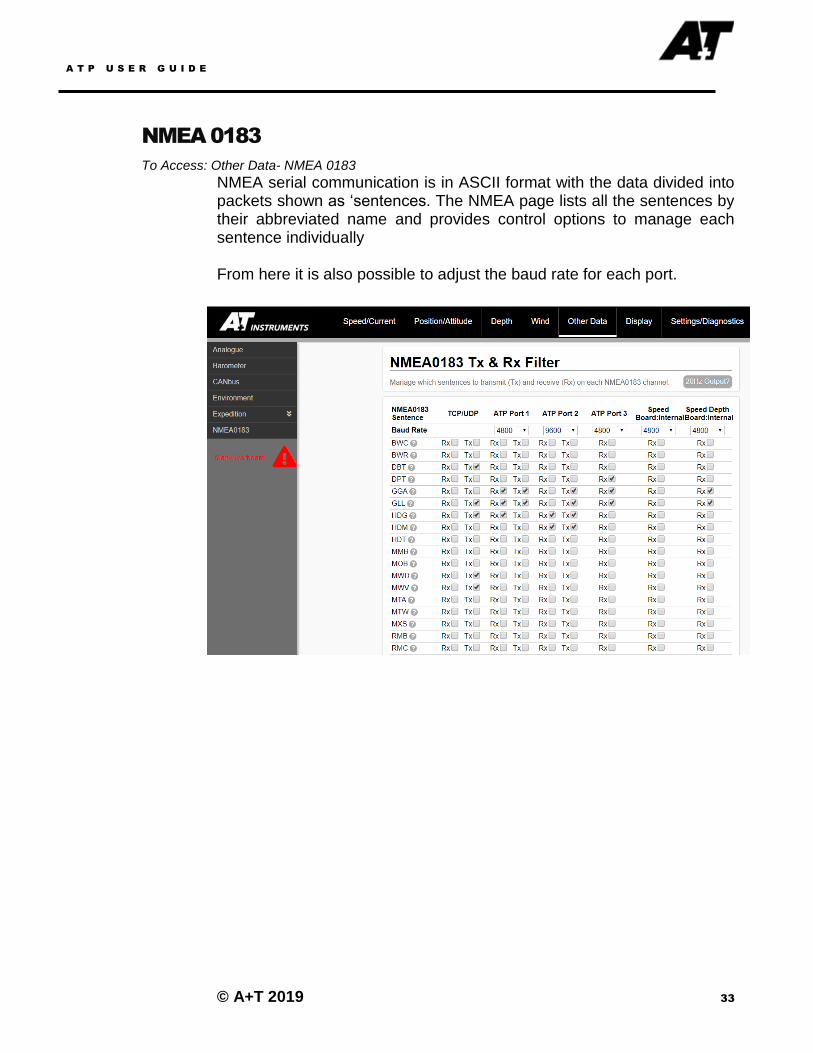
NMEA 0183
To Access: Other Data- NMEA 0183
NMEA serial communication is in ASCII format with the data divided into packets shown as ‘sentences. The NMEA page lists all the sentences by their abbreviated name and provides control options to manage each sentence individually From here it is also possible to adjust the baud rate for each port.
A T P U S E R G U I D E
© A+T 2019 34
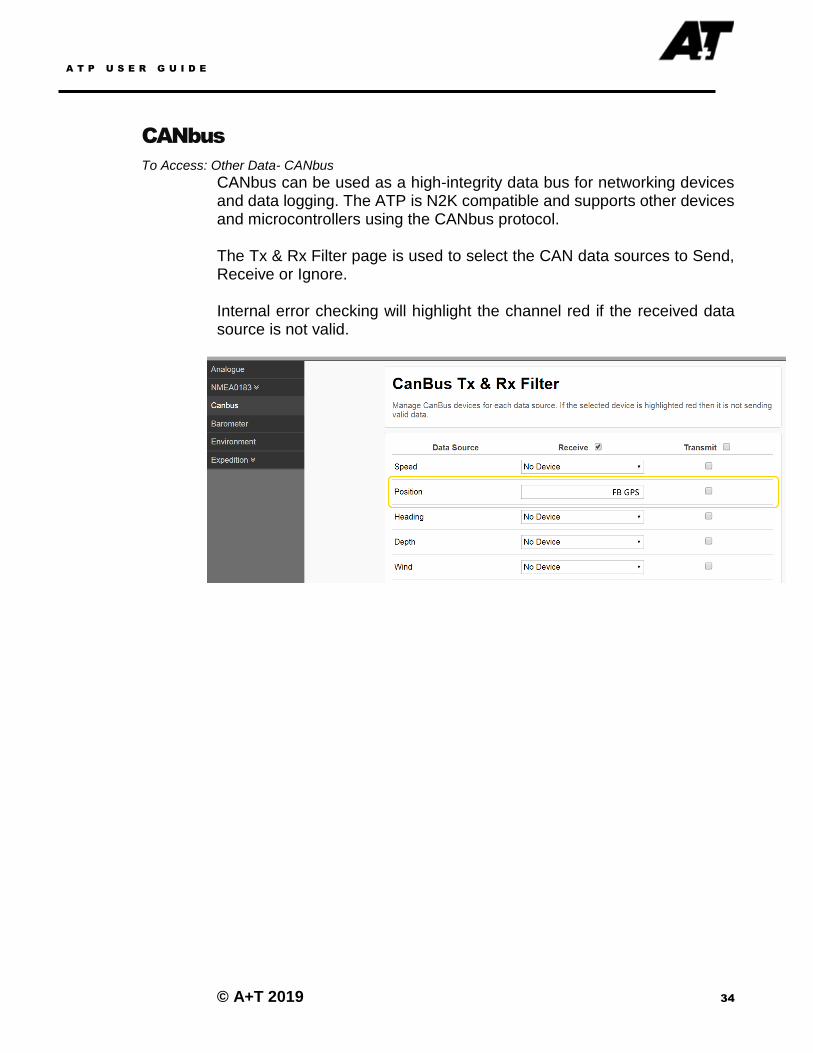
CANbus
To Access: Other Data- CANbus
CANbus can be used as a high-integrity data bus for networking devices and data logging. The ATP is N2K compatible and supports other devices and microcontrollers using the CANbus protocol. The Tx & Rx Filter page is used to select the CAN data sources to Send, Receive or Ignore. Internal error checking will highlight the channel red if the received data source is not valid.

A T P U S E R G U I D E
© A+T 2019 35
Barometer
To Access: Other Data- Barometre
The ATP has an inbuilt Barometric Pressure sensor. Pressure data is displayed in a 2D graph to allow easy tracking of trends in the weather change. The Select Period drop-down box is used to adjust the displayed data range period, from 3 hours to 3 weeks. Corrections are applied using the Offset box located.
Barometer Pressure Monitoring
Environment
Sea & Air Temperature
An air temperature sensor can be connected to any of the analogue input channels and configured and calibrated in the Other Data/Analogue page. Sea temperature is sourced from the speed sensor (paddle wheel type) if fitted.
Air and Sea Temperature Sensors

A T P U S E R G U I D E
© A+T 2019 36
Expedition
Connection
A UDP connection method provides a simple and intuitive interface between Expedition and other third-party software packages. Fast, bi-directional data transmission allows easy access to channel variables, calibrations and custom user channels. The Connection can be direct via ethernet or wireless via a router depending on the network arrangement.
Setup - ATP 1. To Configure the UDP connection for use with expedition, go to;
Settings/Diagnostics > Network I/O.
2. Add a second network connection. 3. Set Connection 1 to UDP Output and Connection 2 to UDP Input. 4. Ensure both the enable and Broadcast checkboxes are ticked:
Note: If unchecked, you can specify the IP address to Send &
Receive UDP data.
5. Enter the IP address for the local connection in the Interface box. 6. Select Expedition as the Format. 7. Enter a valid UDP Port number and choose and a suitable Output
Frequency between 1 and 10 Hz. 8. Click apply or ok to save the configuration.

A T P U S E R G U I D E
© A+T 2019 37
Setup - Expedition
1. To configure Expedition for use with the ATP, click on the drop-down
menu and select Instruments
2. Select Network 0. 3. Select A+T from the dropdown list. 4. Select UDP to IP from the connection’s dropdown list. 5. Enter the ATP IP Address and Port Number. 6. Check Use GNSS Data and Validate Checksum. 7. Click OK.
A T P U S E R G U I D E
© A+T 2019 38
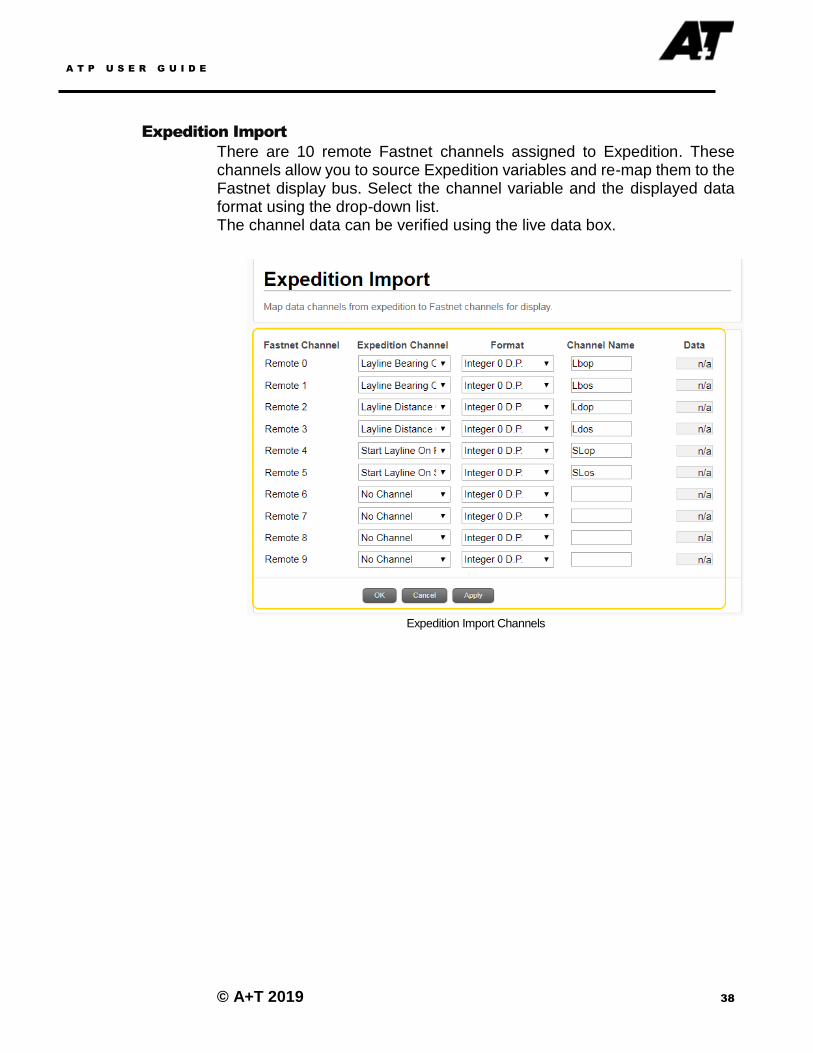
Expedition Import
There are 10 remote Fastnet channels assigned to Expedition. These channels allow you to source Expedition variables and re-map them to the Fastnet display bus. Select the channel variable and the displayed data format using the drop-down list. The channel data can be verified using the live data box.
Expedition Import Channels
A T P U S E R G U I D E
© A+T 2019 39
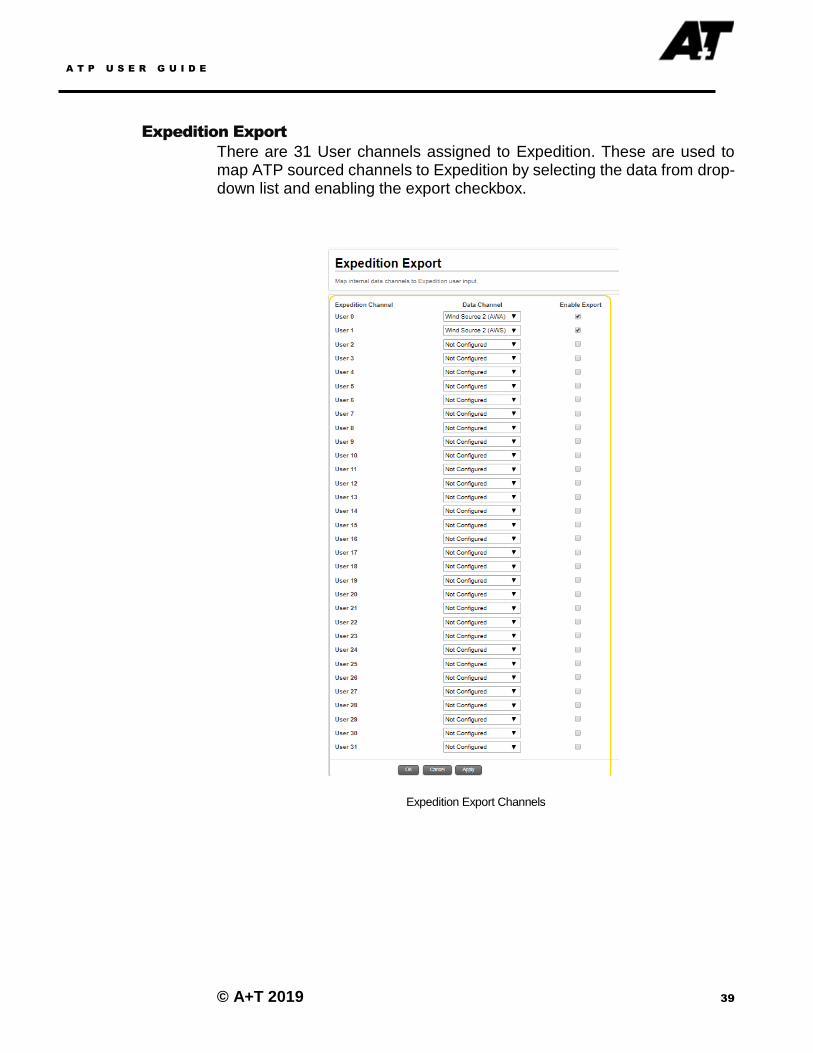
Expedition Export
There are 31 User channels assigned to Expedition. These are used to map ATP sourced channels to Expedition by selecting the data from drop-down list and enabling the export checkbox.
Expedition Export Channels
A T P U S E R G U I D E
© A+T 2019 40
Advanced Settings, Setup & Diagnostics
Processor time settings
To Access: Settings/Diagnostics- System Time
The processor may have UT (& date) set up manually or it may be set to synchronise from an external system such as GNSS. If synchronisation is selected, then: -
a) Ensure that a timing input is enabled (currently NMEA0183
ZDA or N2K)
b) Do not select more than one-time input as enabled or
sources could conflict
To ensure stable synchronisation, the ATP processor uses the following schema: - No synchronisation is undertaken until 1 minute after the later of:-
o Processor startup
o First reception of external timing data
o The synchronisation option is selected
Thereafter, a full minute of valid timing data must be received. Only once this condition is met will the ATP synchronise UT (including date) with the external source and make an entry into the Logs log file (see Settings/Diagnostics) Thereafter the ATP continues to monitor the timing offset and will only re-synchronise its time when both the ‘1 minute’ condition above is met and the processor date has changed from the last time a synchronisation change took place.
Thus, once initial synchronisation has taken place then no change to the time will be made more often than once every 24 hours
If synchronisation is wished to be forced, then this can be accomplished by deselecting and then reselecting the synchronisation tick box and waiting for a minute as above. If synchronisation does not take place, then check that valid timing input is available and selected.
A T P U S E R G U I D E
© A+T 2019 41
Appendix A Software Updating and Configuration
These are both accessed from the Settings/Diagnostics area of the webserver.
A1 Configuration
To Save Config: Go to Settings/Diagnostics- Saved Config. – Config Name Save
The whole configuration which includes input and output settings, calibrations can be saved and reloaded.
It is recommended to do this from time to time during commissioning and again once a final operating state has been reached. The saved configurations are stored internally on the processor. They may also be exported and imported to the host computer. A FACTORY RESET is also available from this area. Naturally, this should be used with caution. All data apart from the IP settings and Overall Log are set back to the state in which the unit was originally shipped.
A2 Software updating
To Update: Go to Settings/Diagnostics- Software Upgrade- Choose Zip File- Upload Software- Upgrade now
The latest software update is available on the A+T website under Downloads. Download and save the ZIP file but do not unzip it. Select the entire ZIP file to be uploaded on the webserver. The upload is almost instantaneous, and the new version should be displayed. The processor restart automatically with the new version; there is no need to power cycle after upload. The configuration settings are preserved during an upgrade but is it still prudent to save the configuration as above before upgrading. An advanced upload is also available here. This is to allow the uploading of firmware to the processor motherboard and other interface boards connected on the internal A+T ethernet. This section should only be used under direct instruction from A+T.
A T P U S E R G U I D E
© A+T 2019 42
Appendix B Hardware Installation
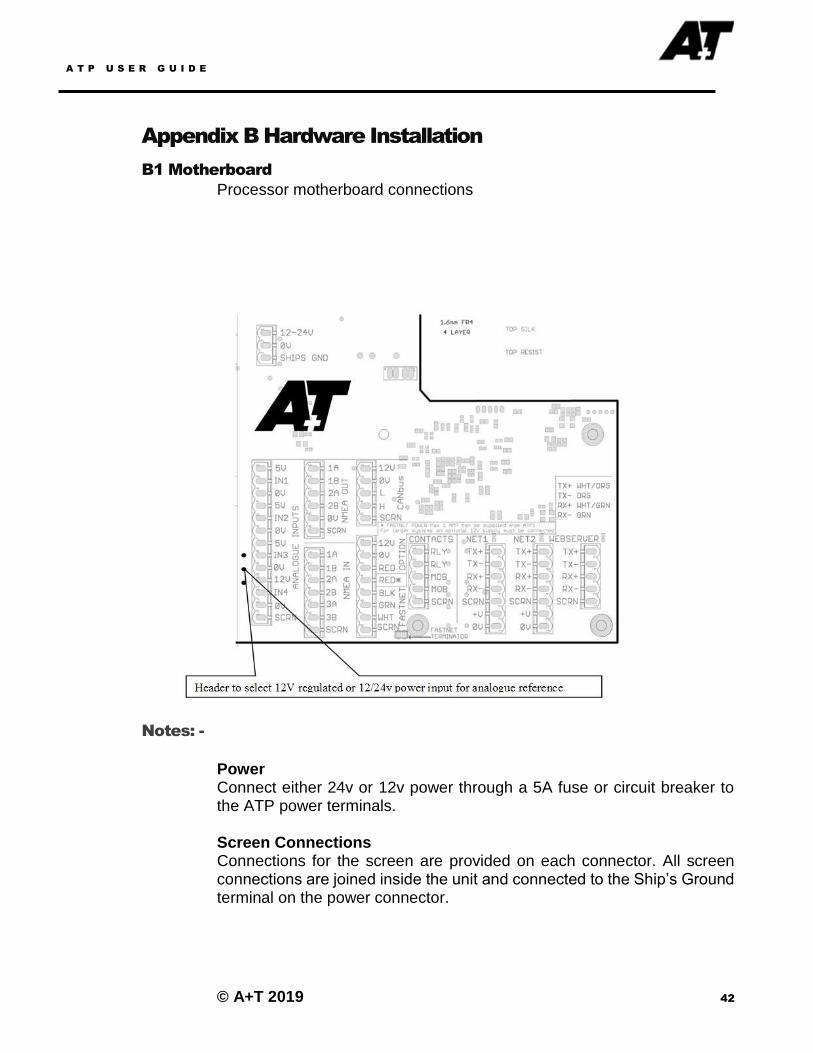
B1 Motherboard
Processor motherboard connections
Notes: -
Power Connect either 24v or 12v power through a 5A fuse or circuit breaker to the ATP power terminals.
Screen Connections Connections for the screen are provided on each connector. All screen connections are joined inside the unit and connected to the Ship’s Ground terminal on the power connector.

A T P U S E R G U I D E
© A+T 2019 43
The ATP Ship’s Ground terminal should either be left disconnected or connected to Ship’s Ground. It should not be connected to the power 0V. Screen connections should not be connected on NMEA0183 inputs. They should be connected on NMEA0183 outputs only.
Fastnet Connection Connect the white, green, black and screen of the Fastnet network cable as marked An in-built 100 Ohm resistor is mounted at the bottom of the Fastnet connector which is active when the header is in place. This should be used when the processor is at one end of the Fastnet Network. Total terminator resistance on the Fastnet Network should be close (+/- 10%) to 50 Ohm. For the red connection then see notes below: - When any B&G displays, sensors, interfaces or other 12V only units are to be connected to the Fastnet network, then this must be supplied with 12V. If only A+T displays and interfaces are used, then 24V may be used. Two options for providing 12V power to Fastnet are available: -
1. For a small system not drawing too much power (up to 1 amp,
typically less than 6 displays) then power may be taken from the
Processor Fastnet connector marked RED*.
FA
ST
N E
T B
US
Header for 100 Ω resistor
Fastnet Connection - Smaller systems (<1A)
A T P U S E R G U I D E
© A+T 2019 44
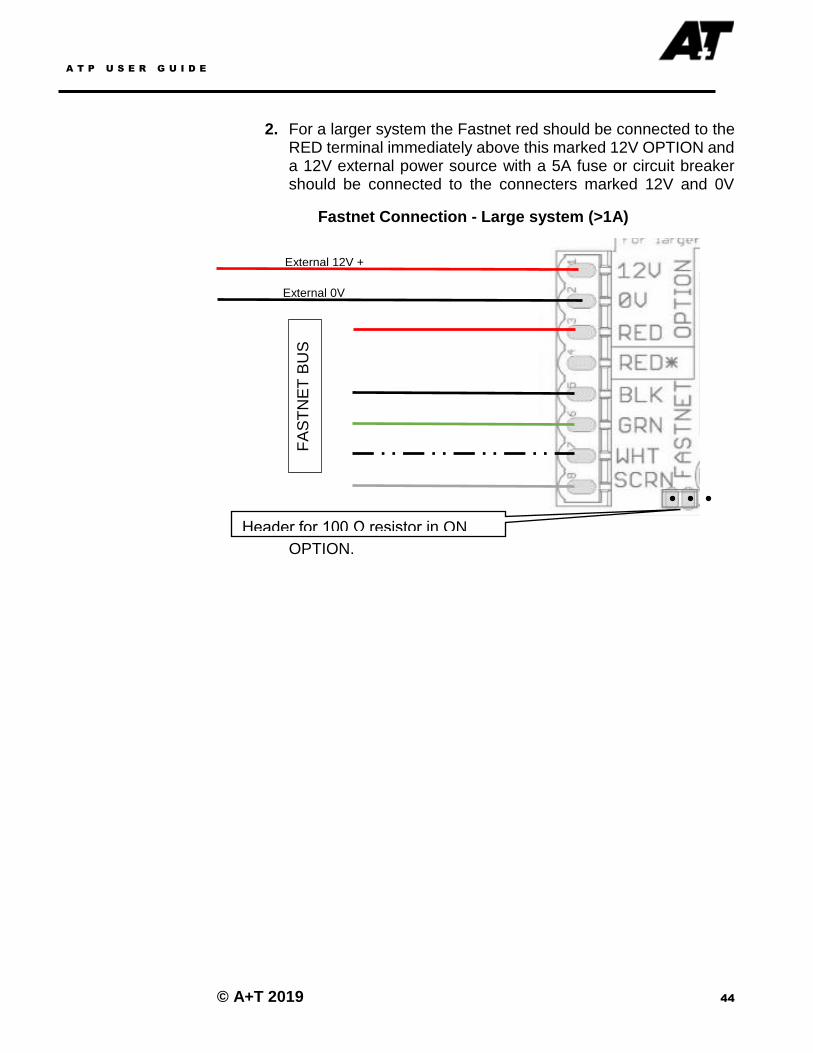
2. For a larger system the Fastnet red should be connected to the RED terminal immediately above this marked 12V OPTION and a 12V external power source with a 5A fuse or circuit breaker should be connected to the connecters marked 12V and 0V
OPTION.
FA
ST
NE
T B
US
External 12V +
External 0V
Header for 100 Ω resistor in ON
Fastnet Connection - Large system (>1A)

A T P U S E R G U I D E
© A+T 2019 45
B2 Wind Board
B3 Speed/Depth/Water Temperature Board
A T P U S E R G U I D E
© A+T 2019 46
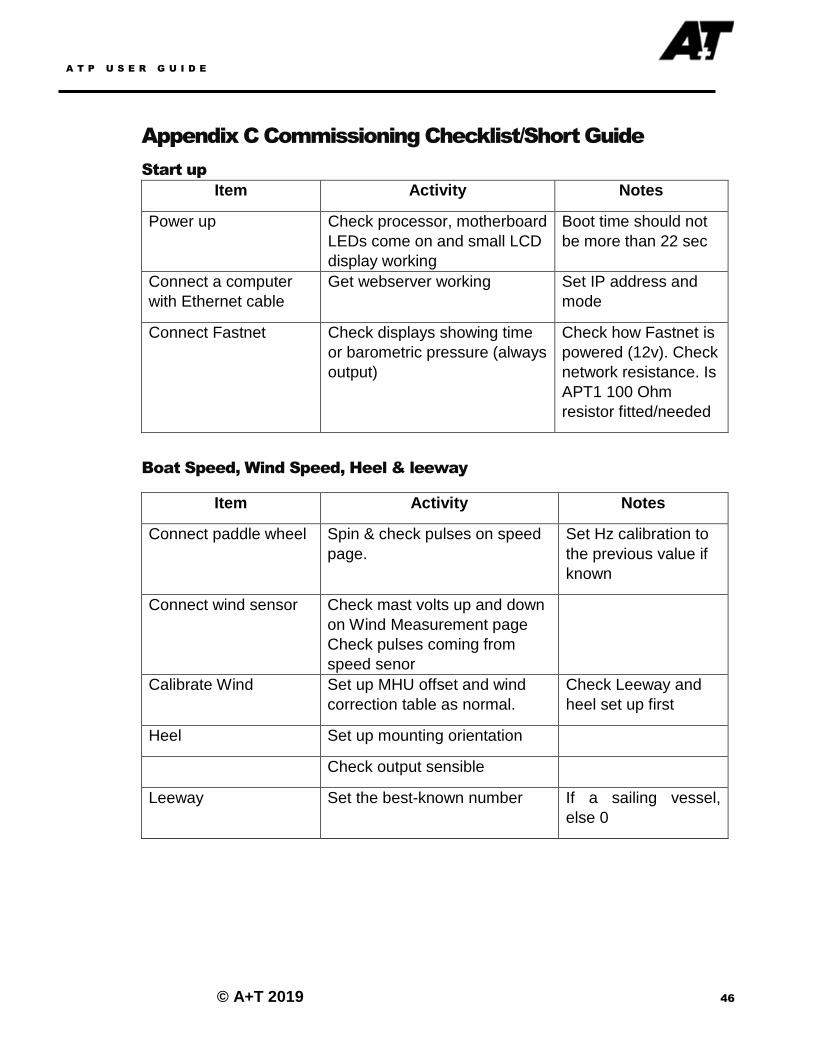
Appendix C Commissioning Checklist/Short Guide
Start up
Item Activity Notes
Power up Check processor, motherboard
LEDs come on and small LCD
display working
Boot time should not
be more than 22 sec
Connect a computer
with Ethernet cable
Get webserver working Set IP address and
mode
Connect Fastnet Check displays showing time
or barometric pressure (always
output)
Check how Fastnet is
powered (12v). Check
network resistance. Is
APT1 100 Ohm
resistor fitted/needed
Boat Speed, Wind Speed, Heel & leeway
Item Activity Notes
Connect paddle wheel Spin & check pulses on speed
page.
Set Hz calibration to
the previous value if
known
Connect wind sensor Check mast volts up and down
on Wind Measurement page
Check pulses coming from
speed senor
Calibrate Wind Set up MHU offset and wind
correction table as normal.
Check Leeway and
heel set up first
Heel Set up mounting orientation
Check output sensible
Leeway Set the best-known number If a sailing vessel,
else 0
A T P U S E R G U I D E
© A+T 2019 47
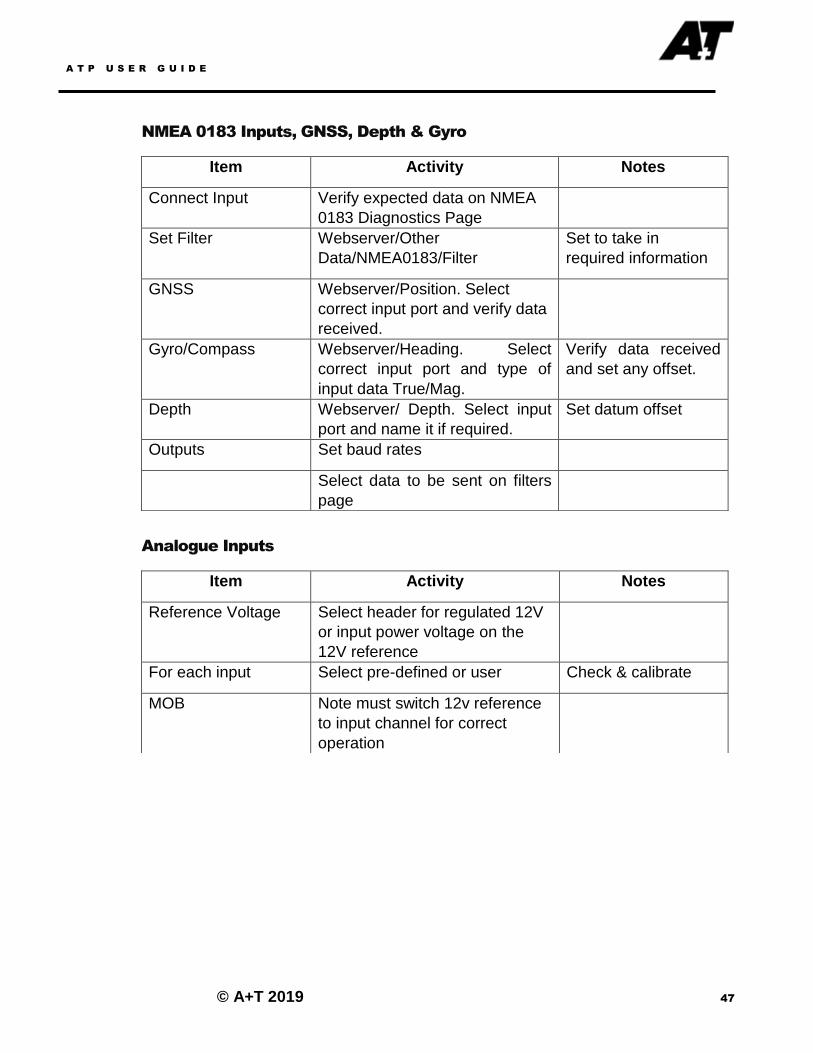
NMEA 0183 Inputs, GNSS, Depth & Gyro
Analogue Inputs
Item Activity Notes
Connect Input Verify expected data on NMEA
0183 Diagnostics Page
Set Filter Webserver/Other
Data/NMEA0183/Filter
Set to take in
required information
GNSS Webserver/Position. Select
correct input port and verify data
received.
Gyro/Compass Webserver/Heading. Select
correct input port and type of
input data True/Mag.
Verify data received
and set any offset.
Depth Webserver/ Depth. Select input
port and name it if required.
Set datum offset
Outputs Set baud rates
Select data to be sent on filters
page
Item Activity Notes
Reference Voltage Select header for regulated 12V
or input power voltage on the
12V reference
For each input Select pre-defined or user Check & calibrate
MOB Note must switch 12v reference
to input channel for correct
operation
A T P U S E R G U I D E
© A+T 2019 48
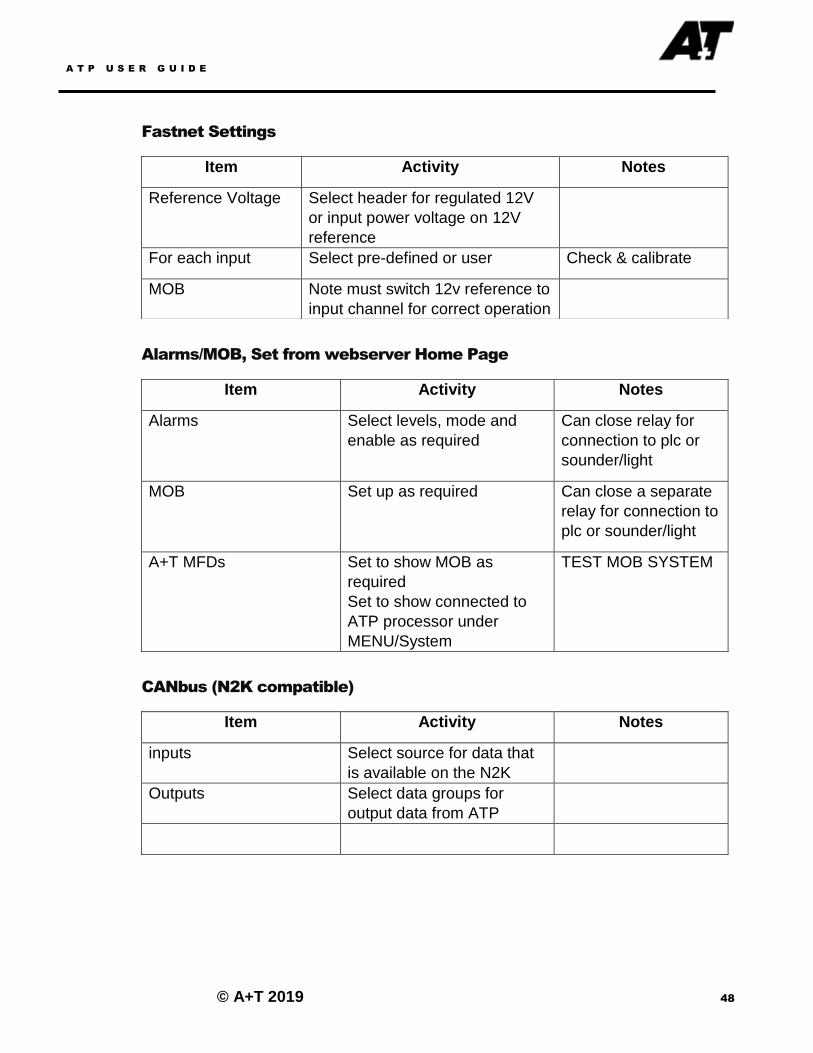
Fastnet Settings
Alarms/MOB, Set from webserver Home Page
CANbus (N2K compatible)
Item Activity Notes
Reference Voltage Select header for regulated 12V
or input power voltage on 12V
reference
For each input Select pre-defined or user Check & calibrate
MOB Note must switch 12v reference to
input channel for correct operation
Item Activity Notes
Alarms Select levels, mode and
enable as required
Can close relay for
connection to plc or
sounder/light
MOB Set up as required Can close a separate
relay for connection to
plc or sounder/light
A+T MFDs Set to show MOB as
required
Set to show connected to
ATP processor under
MENU/System
TEST MOB SYSTEM
Item Activity Notes
inputs Select source for data that
is available on the N2K
Outputs Select data groups for
output data from ATP
A T P U S E R G U I D E
© A+T 2019 49
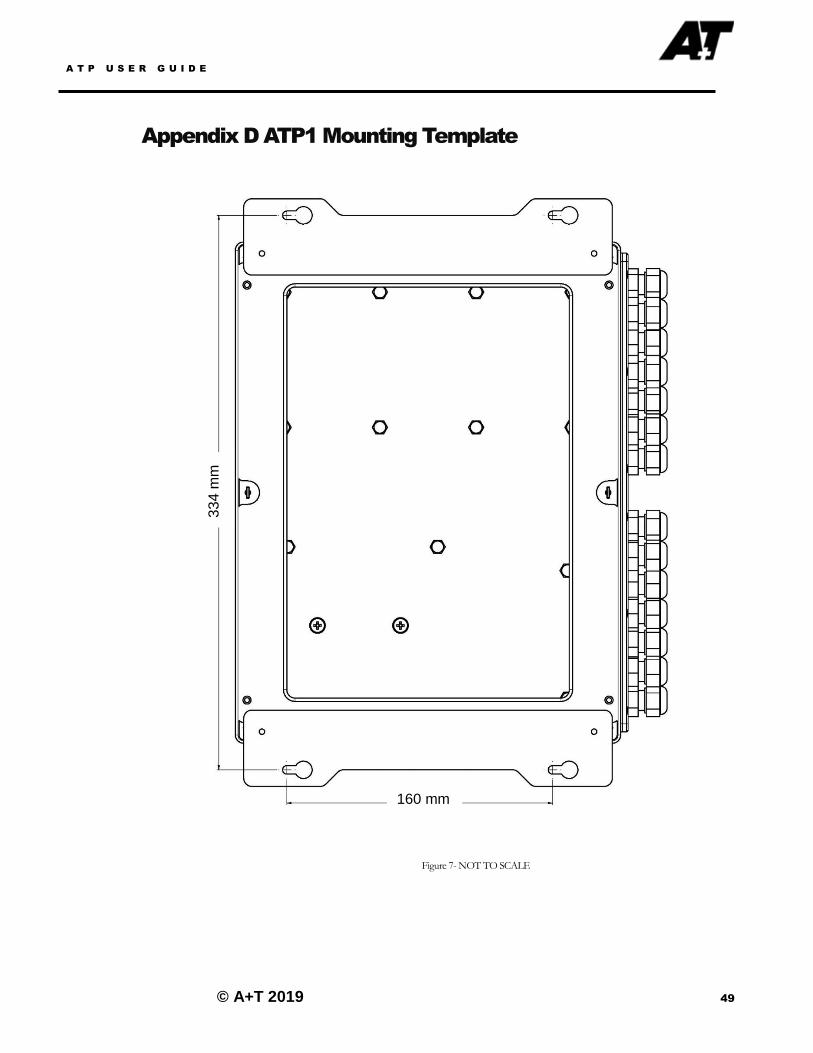
Appendix D ATP1 Mounting Template
Figure 7- NOT TO SCALE
334
mm
160 mm

A T P U S E R G U I D E
© A+T 2019 50
Appendix E- NMEA Sentences
BWC Bearing and Distance to Waypoint (GC)
BWR Bearing and Distance to Waypoint (RL)
DBT Depth Below Transducer
DPT Depth of Water
GGA Global Positioning Fix Data
GLL Geographic Position Latitude/Longitude
HDG Heading- Deviation & Variation
HDM Heading- Magnetic
HDT Heading – True
MMB Barometric Pressure
MOB MOB Active Sentence
MWD True Wind Direction and Speed
MWV True / Apparent Wind Angle and Speed
MTA Air Temperature (Legacy)
MTW Water Temperature (Legacy)
MXS MaxSea Proprietary MOB Sentence
RMB Recommended Minimum Sentence B
RMC Recommended Minimum Sentence C
ROT Rate of Turn (Deg/min)
RSA Rudder Sensor Angle
RTE Route List
VDR Current Rate and Direction
VHW Water Speed and Heading
VLW Distance Travelled through Water
VPW Speed- parallel to wind (VMG)
VTG Track made good- ground speed (COG/ SOG)
VWR Relative Wind Speed and Angle (Legacy)
VWT True wind speed and angle (legacy)
WPL Waypoint List
XDR-A Transducer Measurement
XDR-B Transducer Measurement (Legacy B&G format)
XTE Cross Track Error
ZDA Time and Date

A T P U S E R G U I D E
© A+T 2019 51
Index
A
A1 · 40 A2 · 40 About · 3 About this Manual · 3 Addressing · 6 Advanced · 12, 30, 39 Alarms/MOB, Set from Web server Home Page
· 47 Analogue · 24, 29, 30, 34, 46 Analogue Inputs · 46 Angle · 17, 30 Apparent · 17 Appendix A · 40 Appendix B · 41 Appendix D ATP1 Mounting Template · 48 ATP · 3, 4, 5, 6, 8, 14, 15, 16, 19, 21, 23, 24, 25,
26, 34, 35, 36, 38, 39, 41, 42, 47 AWA · 9, 18, 19
B
B1 · 41, 44 B3 · 44 Barometer · 29, 34 Bluetooth · 24, 28 Boat Speed · 45 Boat Speed, Wind Speed, Heel & leeway · 45
C
Calculation · 9, 22, 25 Calibration · 4, 8, 12, 13, 19, 30 CAN Bus · 13, 21, 29, 33 Checklist · 45 Configuration · 21, 22, 27, 40 Connection · 6, 35, 42 Contents · 2 correction · 9, 17, 18, 19, 20, 45 Current · 9, 22, 27, 28, 29
D
Damping · 28, 29
DANGER · 11 Depth · 13, 46 Diagnostics · 13, 35, 39, 40 Display · 24, 25, 27, 28
E
Environment · 29, 34 Ethernet · 3, 6, 7, 45 Expedition · 5, 23, 24, 25, 26, 29, 35, 36, 37, 38 external power source · 43
F
Fastnet · 3, 4, 6, 14, 21, 27, 37, 42, 43, 45, 47 Fastnet Settings · 47
G
General Principles · 8 Getting Started · 6 GPS · 11, 14, 21, 22, 23, 25, 39, 46
H
Heading · 14 Heel · 15, 17, 45
I
Inputs · 46 Introduction · 3 IP · 3, 6, 7, 35, 36, 40, 45
L
Leeway · 15, 45 Loadcells · 28 Log · 9, 40

A T P U S E R G U I D E
© A+T 2019 52
M
MOB · 23, 24, 25, 26, 46, 47
Multi-Fuel · 3
Multi-Fuel connectivity · 3
N
NMEA · 13, 21, 23, 32, 46 NMEA 0183 · 46 NMEA 0183 Inputs, GPS, Depth & Gyro · 46
O
Other Data · 13, 24, 29, 30, 34
P
Phase · 19 Position · 21 Power · 41, 45 Pulse · 9
R
Reactivation · 26
Reference Voltage · 46
S
Screen Connections · 41 Sea · 34 Sensor · 8, 13, 30 Set up MHU · 45 Settings · 35, 39 should not be connected · 42 Software · 40 SOG · 11 Speed · 8, 11, 12, 13, 17, 22, 28, 44, 45 Speed/Depth · 28, 44 Start up · 45
T
Temperature · 29, 34, 44 Trim · 15 TWA · 18, 19, 20 TWD · 19, 20
W
Web server · 4, 5, 6, 7, 8, 9, 24, 47 Wind · 14, 17, 18, 44, 45 Wind Board · 44