Embed Size (px)
Citation preview
ATP Bioluminescence Real time objective measurement of
cleaning and hygiene
Background
• Continued emergence of Superbugs
• Accusations of dirty hospital & media attention
• Focus on environmental and hand hygiene
• Need for objective measurement
• Proof of service delivery
• Cost reduction
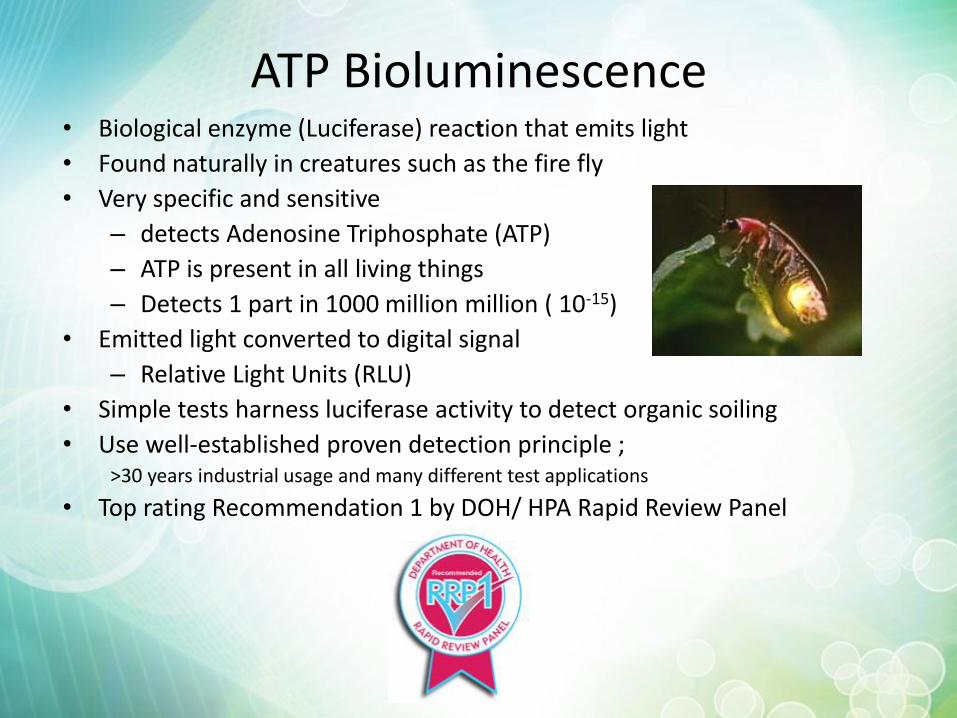
ATP Bioluminescence • Biological enzyme (Luciferase) reaction that emits light
• Found naturally in creatures such as the fire fly
• Very specific and sensitive
– detects Adenosine Triphosphate (ATP)
– ATP is present in all living things
– Detects 1 part in 1000 million million ( 10-15)
• Emitted light converted to digital signal
– Relative Light Units (RLU)
• Simple tests harness luciferase activity to detect organic soiling
• Use well-established proven detection principle ; >30 years industrial usage and many different test applications
• Top rating Recommendation 1 by DOH/ HPA Rapid Review Panel
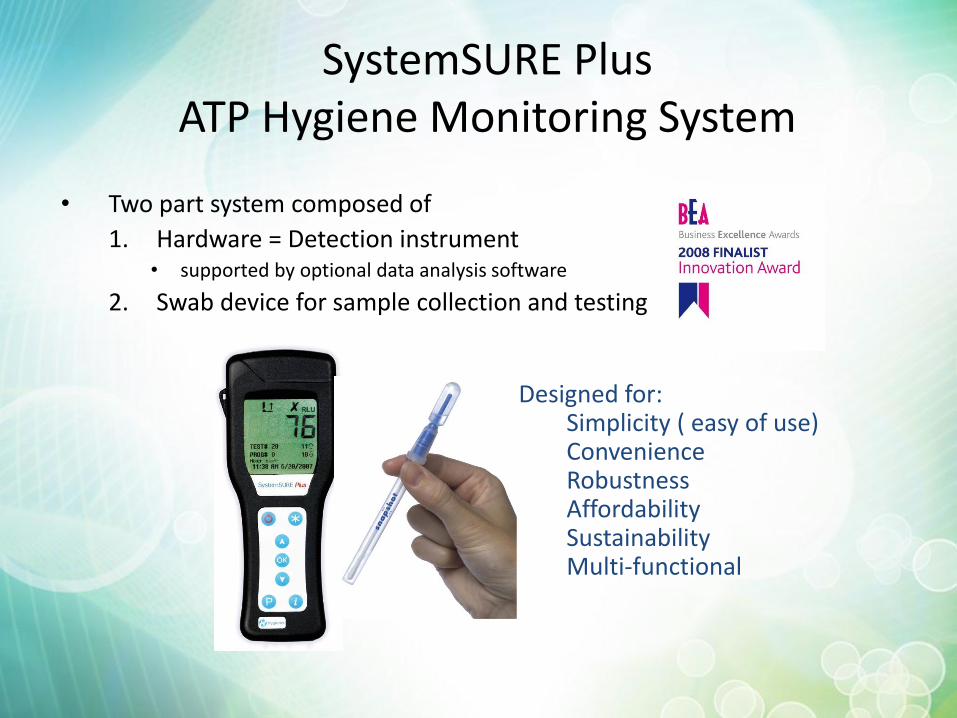
SystemSURE Plus ATP Hygiene Monitoring System
• Two part system composed of
1. Hardware = Detection instrument • supported by optional data analysis software
2. Swab device for sample collection and testing
Designed for: Simplicity ( easy of use) Convenience Robustness Affordability Sustainability Multi-functional
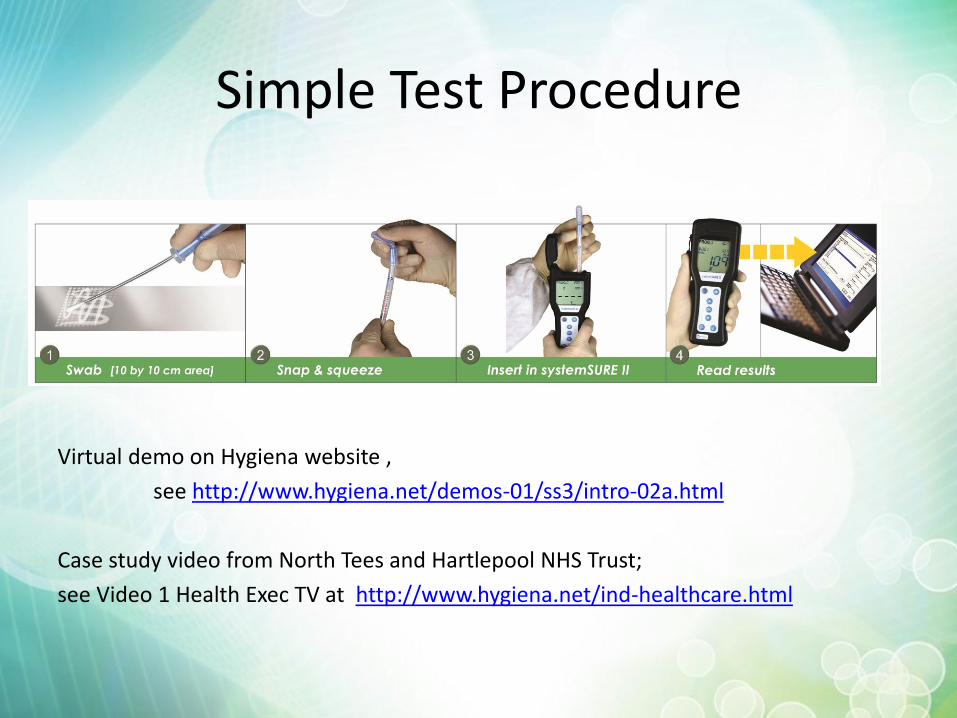
Simple Test Procedure
Virtual demo on Hygiena website ,
see http://www.hygiena.net/demos-01/ss3/intro-02a.html
Case study video from North Tees and Hartlepool NHS Trust;
see Video 1 Health Exec TV at http://www.hygiena.net/ind-healthcare.html
Hygiena SystemSURE Plus
SystemSURE ATP Hygiene Monitoring provides a solution by; • Simple and easy to use by anyone , anywhere, any time • Providing instant objective quantifiable data
– Permits immediate corrective action • Identify hot spots and potential risk • Optimises cleaning processes • Demonstrates and reinforces Best Practice • Provide real data for Quality monitoring ,
– evidence of due diligence, – value for money
• Supports training and awareness • Enables team building through more effective direct communication • Restores pride, ownership and commitment • Encourages behaviour change
Clean it …… Prove It!
Many Applications • Hospitals and Primary care
– Hotel Services, Modern Matrons, Nursing Staff, Ward Managers shows cleaning has been effective
– Quality Audit – monitor alongside existing visual audit specifications. – Deep Clean – Trouble shoot – Identify areas where cleaning is required – Low and high patient care environments – Equipment libraries – Community equipment
• Sterile services – Washer disinfectors and monitoring endoscope water
• Catering • Water quality e.g. cooling tower to manage Legionella hazards • Ambulances and police vehicle cleaning • Care homes
• Used in support of quality / design improvements – Cleaning practices
• Microfibre ; Steam cleaning – Demonstrate benefit of disposable curtains – Furniture design (wall mounted legless chairs)
Limitations of ATP testing
• Standard reagent format (luciferase) – Detects ATP from all sources; very rapid and sensitive
– Cannot differentiate between different sources of ATP
– Special test procedures required to detect bacteria against high background ATP from organic samples ( 24 – 48 hour test results)
• Clean liquid samples e.g. water – Do not contain organic ATP; most ATP is microbial
– Can detect bacteria in water samples
• New Bioluminogenic technology is specific for specific bacteria (MicroSnap) – Coliform, E. coli, MRSA, ESBL, Listeria
Cleaning is keystone to IP&C
• Cleaning is a fundamental principle that provides the foundation and keystone that binds the elements of IP&C together.
• Effective cleaning makes sense; – producing a safe, pleasant environment for patients and clinicians. – Maintaining a good environment reinforces and encourages good
safe practices.
• It also makes financial sense; – each infection costs £4k-£10k – cost benefit analysis of >£56,000 per ward per annum (Rampling
2001)
• However cleaning is often treated as a burdensome on-cost , considered low skilled and given little attention or respect.
What the literature says! Hayden et al (2006) CID:42; 1552 - 1560
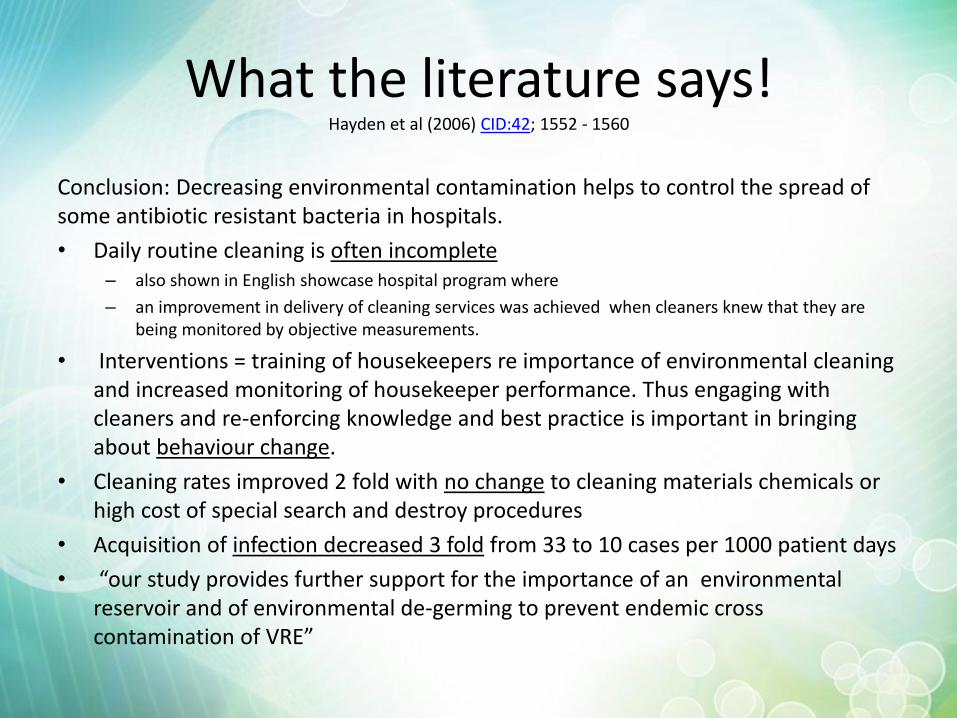
Conclusion: Decreasing environmental contamination helps to control the spread of some antibiotic resistant bacteria in hospitals.
• Daily routine cleaning is often incomplete – also shown in English showcase hospital program where
– an improvement in delivery of cleaning services was achieved when cleaners knew that they are being monitored by objective measurements.
• Interventions = training of housekeepers re importance of environmental cleaning and increased monitoring of housekeeper performance. Thus engaging with cleaners and re-enforcing knowledge and best practice is important in bringing about behaviour change.
• Cleaning rates improved 2 fold with no change to cleaning materials chemicals or high cost of special search and destroy procedures
• Acquisition of infection decreased 3 fold from 33 to 10 cases per 1000 patient days
• “our study provides further support for the importance of an environmental reservoir and of environmental de-germing to prevent endemic cross contamination of VRE”
What the literature says! Hayden et al (2006) CID:42; 1552 - 1560
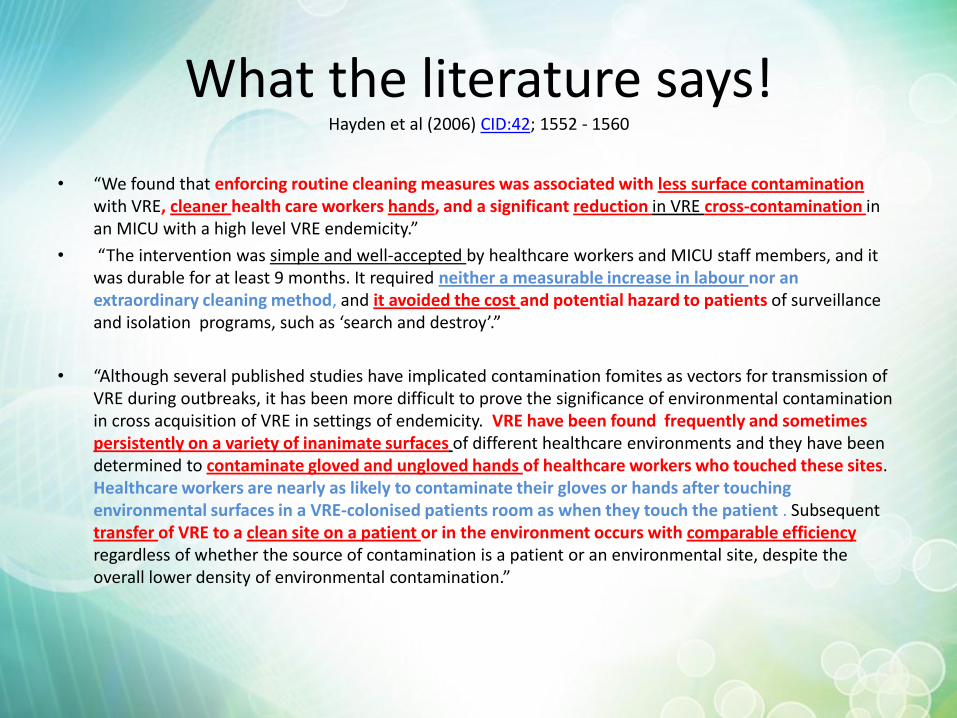
• “We found that enforcing routine cleaning measures was associated with less surface contamination with VRE, cleaner health care workers hands, and a significant reduction in VRE cross-contamination in an MICU with a high level VRE endemicity.”
• “The intervention was simple and well-accepted by healthcare workers and MICU staff members, and it was durable for at least 9 months. It required neither a measurable increase in labour nor an extraordinary cleaning method, and it avoided the cost and potential hazard to patients of surveillance and isolation programs, such as ‘search and destroy’.”
• “Although several published studies have implicated contamination fomites as vectors for transmission of VRE during outbreaks, it has been more difficult to prove the significance of environmental contamination in cross acquisition of VRE in settings of endemicity. VRE have been found frequently and sometimes persistently on a variety of inanimate surfaces of different healthcare environments and they have been determined to contaminate gloved and ungloved hands of healthcare workers who touched these sites. Healthcare workers are nearly as likely to contaminate their gloves or hands after touching environmental surfaces in a VRE-colonised patients room as when they touch the patient . Subsequent transfer of VRE to a clean site on a patient or in the environment occurs with comparable efficiency regardless of whether the source of contamination is a patient or an environmental site, despite the overall lower density of environmental contamination.”
Cleaning
• Cleaning is frequently taken for granted
• Cleaning is not easy
• Delivery of effective cleaning services requires time, resources, education and training and supported by • Defined responsibilities
• Defined schedules
• Defined training and records
• Provide evidence it was done
• If it is not written down, then… it’s a rumour, and it never happened !
• 70% of cleaning cost is labour so getting it Right First Time is very important in delivering a safe, cost effective service to ensure value for money
Measurement and Control
• There can be no control without measurement.
• Results from measurements provide evidence and a basis for continuous improvement
• Measurements need to appropriate for the task and give objective results
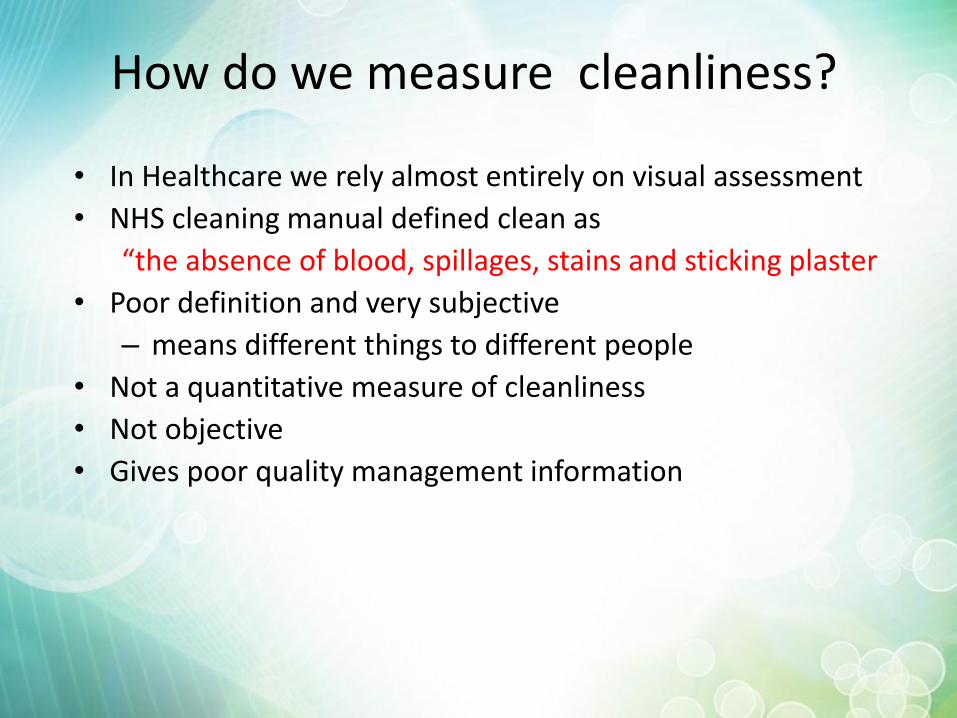
How do we measure cleanliness?
• In Healthcare we rely almost entirely on visual assessment
• NHS cleaning manual defined clean as
“the absence of blood, spillages, stains and sticking plaster
• Poor definition and very subjective
– means different things to different people
• Not a quantitative measure of cleanliness
• Not objective
• Gives poor quality management information
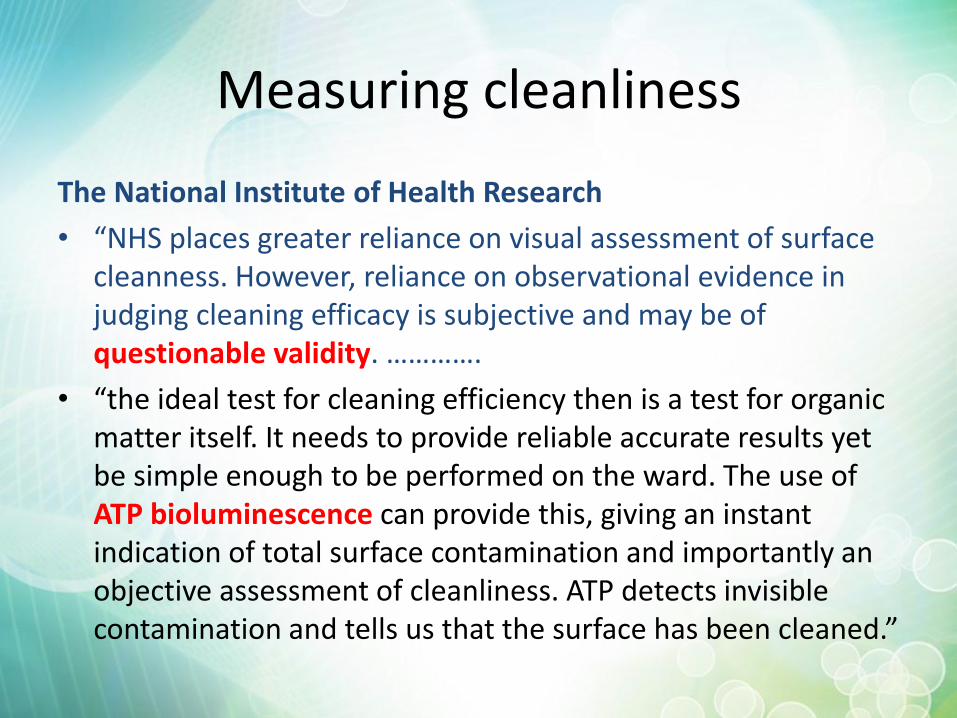
Measuring cleanliness
The National Institute of Health Research
• “NHS places greater reliance on visual assessment of surface cleanness. However, reliance on observational evidence in judging cleaning efficacy is subjective and may be of questionable validity. ………….
• “the ideal test for cleaning efficiency then is a test for organic matter itself. It needs to provide reliable accurate results yet be simple enough to be performed on the ward. The use of ATP bioluminescence can provide this, giving an instant indication of total surface contamination and importantly an objective assessment of cleanliness. ATP detects invisible contamination and tells us that the surface has been cleaned.”
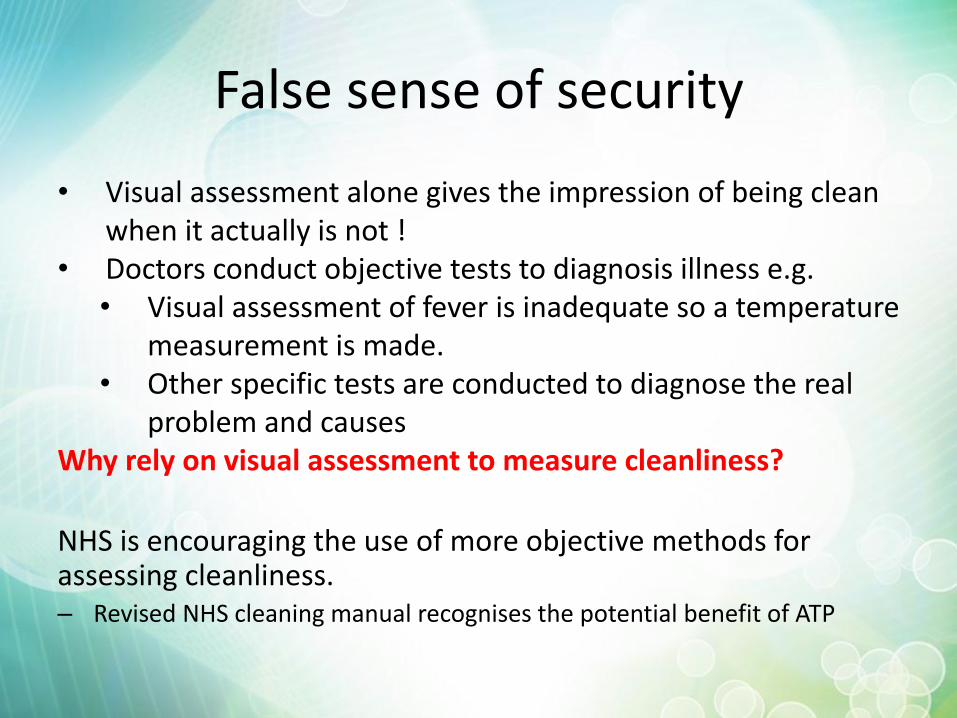
False sense of security
• Visual assessment alone gives the impression of being clean when it actually is not !
• Doctors conduct objective tests to diagnosis illness e.g. • Visual assessment of fever is inadequate so a temperature
measurement is made. • Other specific tests are conducted to diagnose the real
problem and causes Why rely on visual assessment to measure cleanliness?
NHS is encouraging the use of more objective methods for assessing cleanliness. – Revised NHS cleaning manual recognises the potential benefit of ATP
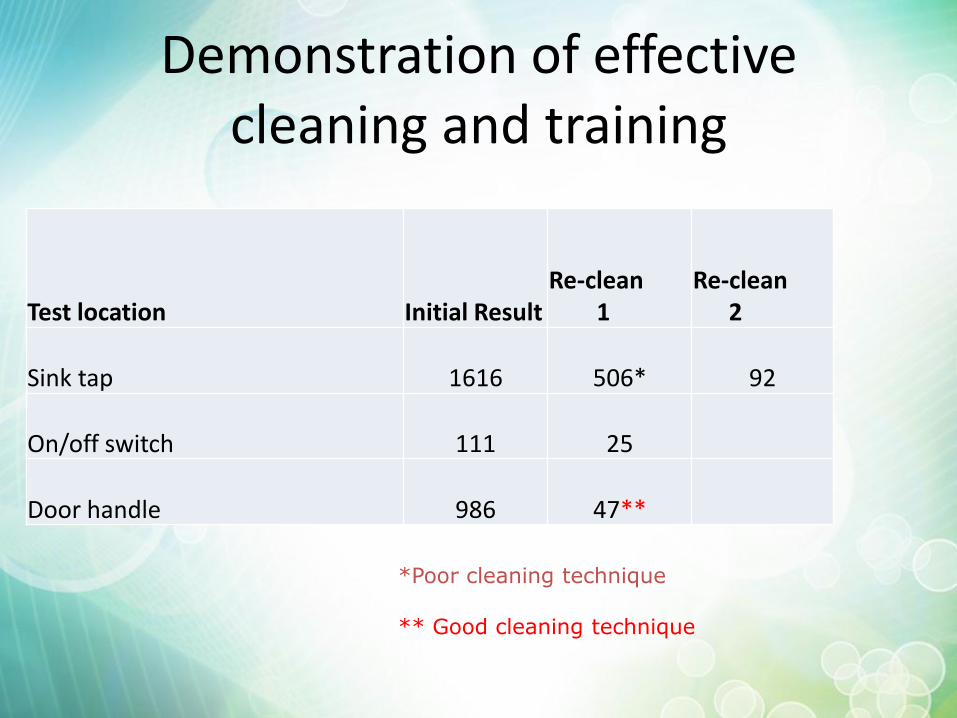
Demonstration of effective cleaning and training
Test location Initial Result Re-clean 1
Re-clean 2
Sink tap 1616 506* 92
On/off switch 111 25
Door handle 986 47**
*Poor cleaning technique ** Good cleaning technique
Washer disinfector
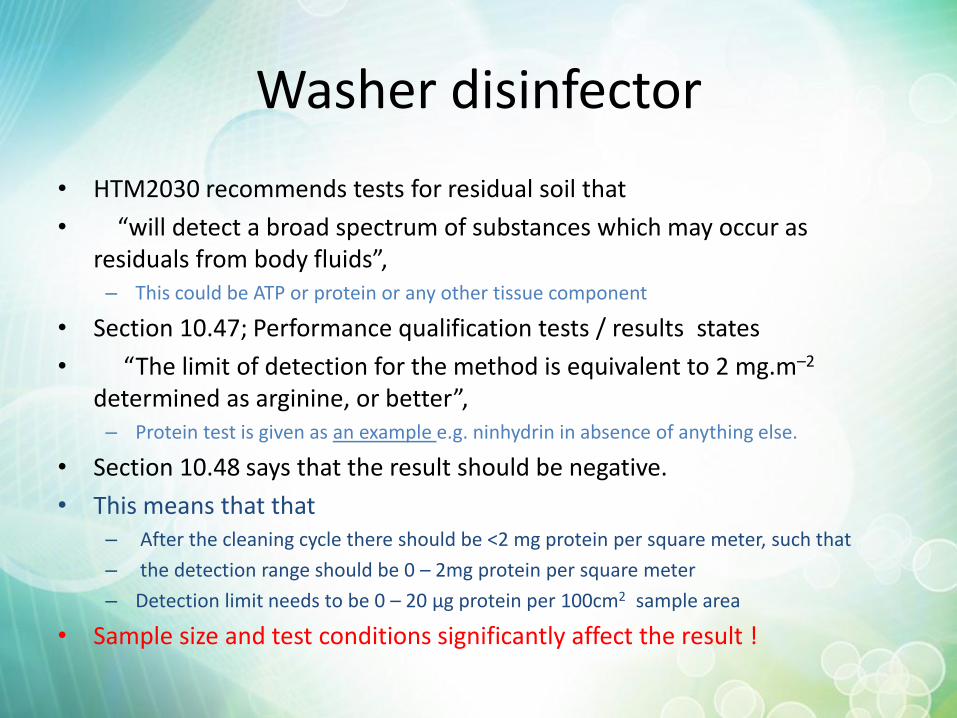
• HTM2030 recommends tests for residual soil that
• “will detect a broad spectrum of substances which may occur as residuals from body fluids”, – This could be ATP or protein or any other tissue component
• Section 10.47; Performance qualification tests / results states
• “The limit of detection for the method is equivalent to 2 mg.m–2 determined as arginine, or better”, – Protein test is given as an example e.g. ninhydrin in absence of anything else.
• Section 10.48 says that the result should be negative.
• This means that that – After the cleaning cycle there should be <2 mg protein per square meter, such that
– the detection range should be 0 – 2mg protein per square meter
– Detection limit needs to be 0 – 20 µg protein per 100cm2 sample area
• Sample size and test conditions significantly affect the result !
Comparison of 3 methods
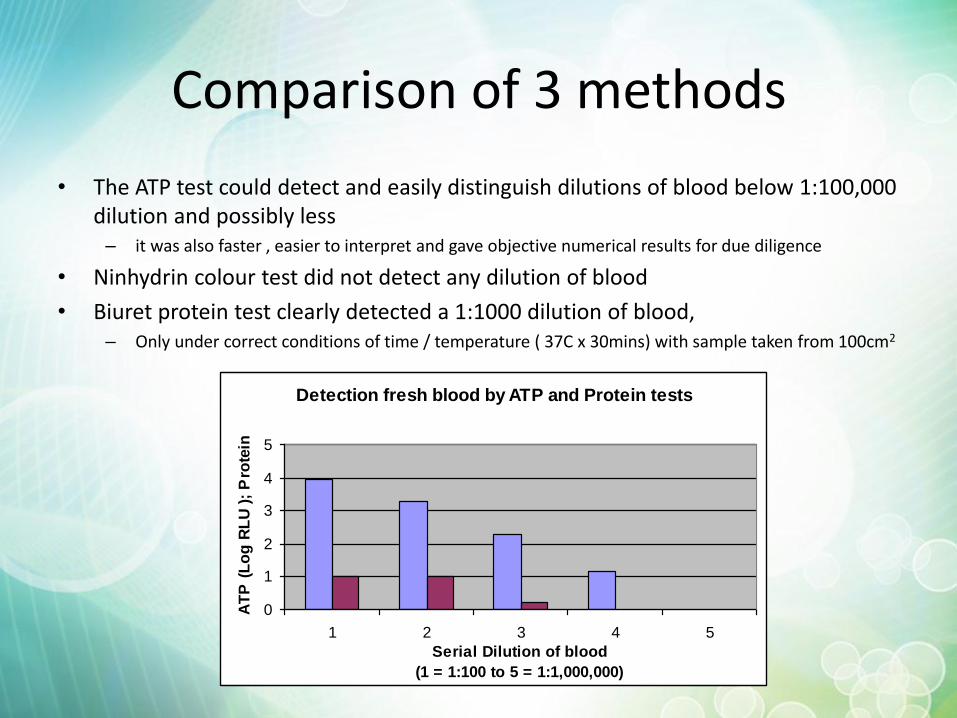
• The ATP test could detect and easily distinguish dilutions of blood below 1:100,000 dilution and possibly less – it was also faster , easier to interpret and gave objective numerical results for due diligence
• Ninhydrin colour test did not detect any dilution of blood
• Biuret protein test clearly detected a 1:1000 dilution of blood, – Only under correct conditions of time / temperature ( 37C x 30mins) with sample taken from 100cm2
Detection fresh blood by ATP and Protein tests
0
1
2
3
4
5
1 2 3 4 5
Serial Dilution of blood
(1 = 1:100 to 5 = 1:1,000,000)
AT
P (
Lo
g R
LU
);
Pro
tein
Direct water test
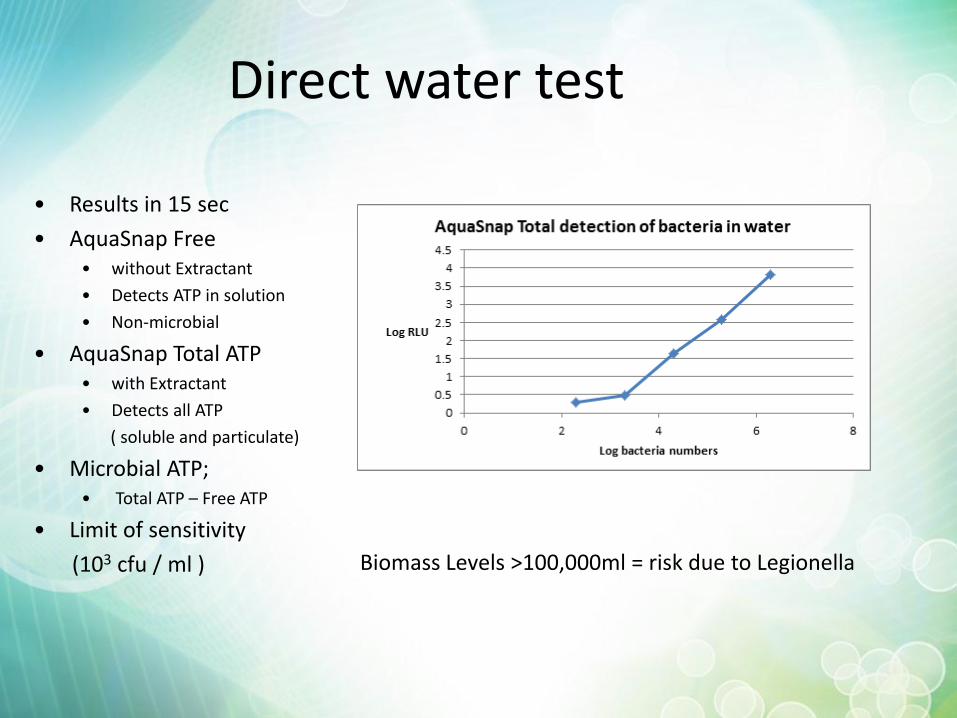
• Results in 15 sec
• AquaSnap Free • without Extractant
• Detects ATP in solution
• Non-microbial
• AquaSnap Total ATP • with Extractant
• Detects all ATP
( soluble and particulate)
• Microbial ATP; • Total ATP – Free ATP
• Limit of sensitivity
(103 cfu / ml )
Biomass Levels >100,000ml = risk due to Legionella
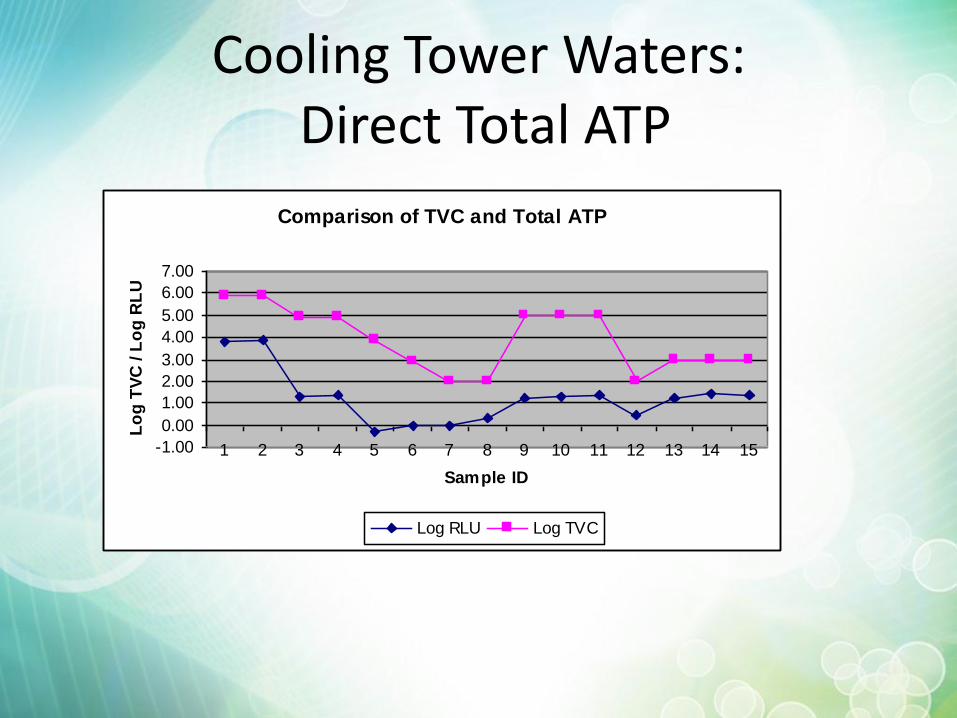
Cooling Tower Waters: Direct Total ATP
Comparison of TVC and Total ATP
-1.00
0.00
1.00
2.00
3.00
4.00
5.00
6.00
7.00
1 2 3 4 5 6 7 8 9 10 11 12 13 14 15
Sample ID
Lo
g T
VC
/ L
og
RL
U
Log RLU Log TVC
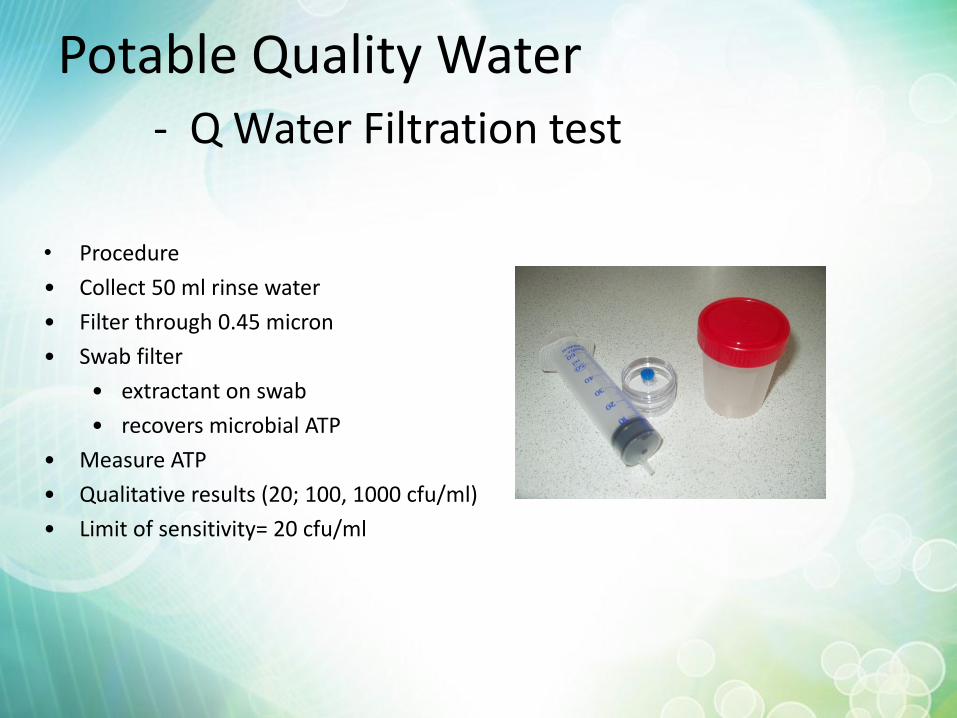
Potable Quality Water - Q Water Filtration test
• Procedure
• Collect 50 ml rinse water
• Filter through 0.45 micron
• Swab filter
• extractant on swab
• recovers microbial ATP
• Measure ATP
• Qualitative results (20; 100, 1000 cfu/ml)
• Limit of sensitivity= 20 cfu/ml
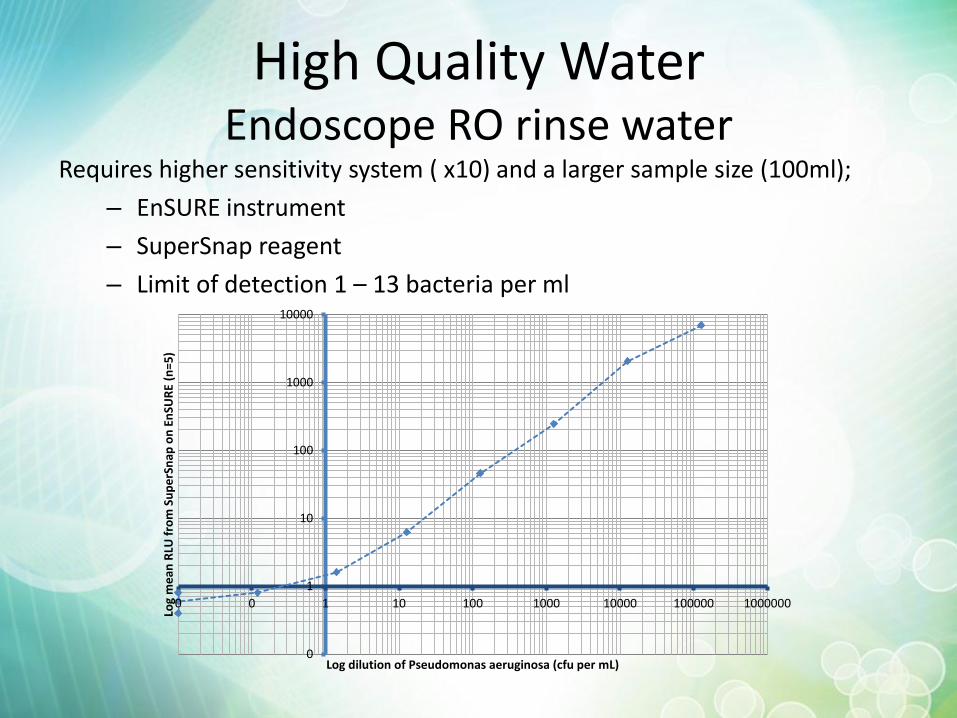
High Quality Water Endoscope RO rinse water
Requires higher sensitivity system ( x10) and a larger sample size (100ml);
– EnSURE instrument
– SuperSnap reagent
– Limit of detection 1 – 13 bacteria per ml
0
1
10
100
1000
10000
0 0 1 10 100 1000 10000 100000 1000000
Log
me
an R
LU f
rom
Su
pe
rSn
ap o
n E
nSU
RE
(n=5
)
Log dilution of Pseudomonas aeruginosa (cfu per mL)
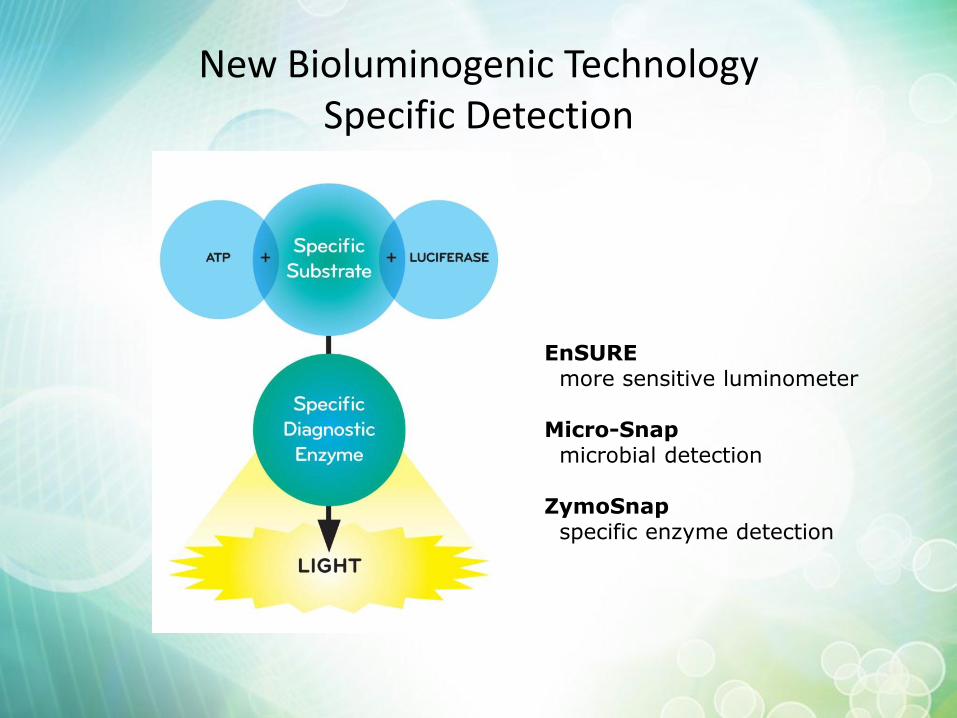
New Bioluminogenic Technology Specific Detection
EnSURE more sensitive luminometer Micro-Snap microbial detection ZymoSnap specific enzyme detection
Micro-Snap Applications
• Surface swabs
• Raw material and finished product
• Solids , liquids and filterable products.
• Food & beverage; dairy; cosmetics & pharma and water.
• Indicator and pathogenic bacteria coliforms, E . Coli
• Total counts
• Other substrates enable other specific organism detection e.g.
– MRSA
– ESBL
– Listeria monocytogenes
– Legionella (possible ?)
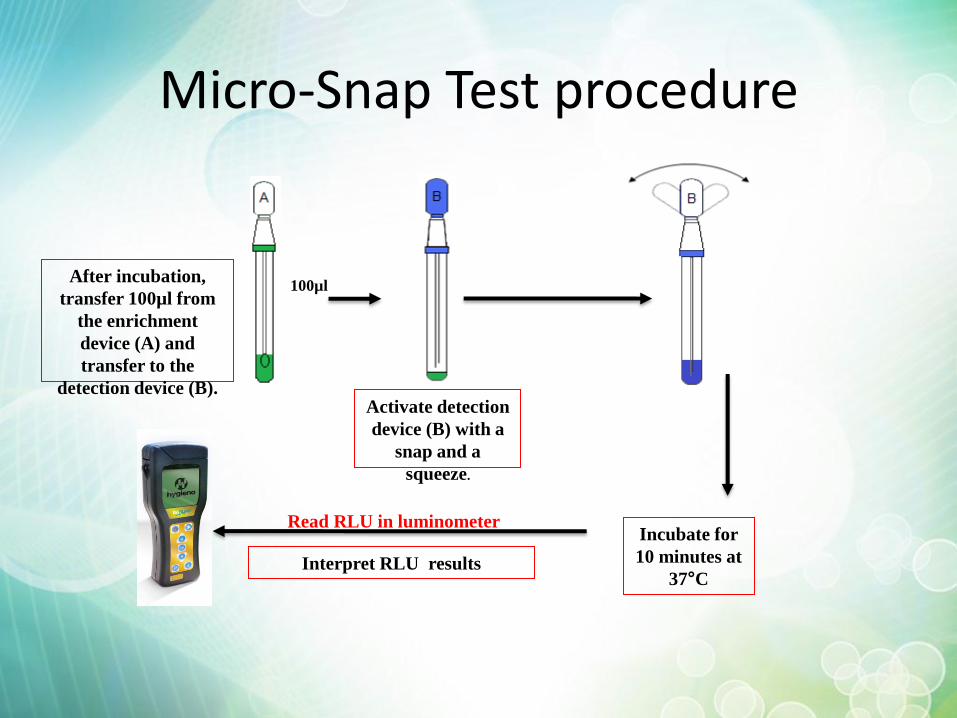
Micro-Snap Test procedure
After incubation,
transfer 100µl from
the enrichment
device (A) and
transfer to the
detection device (B).
Interpret RLU results
Read RLU in luminometer
100µl
Activate detection
device (B) with a
snap and a
squeeze.
Incubate for
10 minutes at
37°C
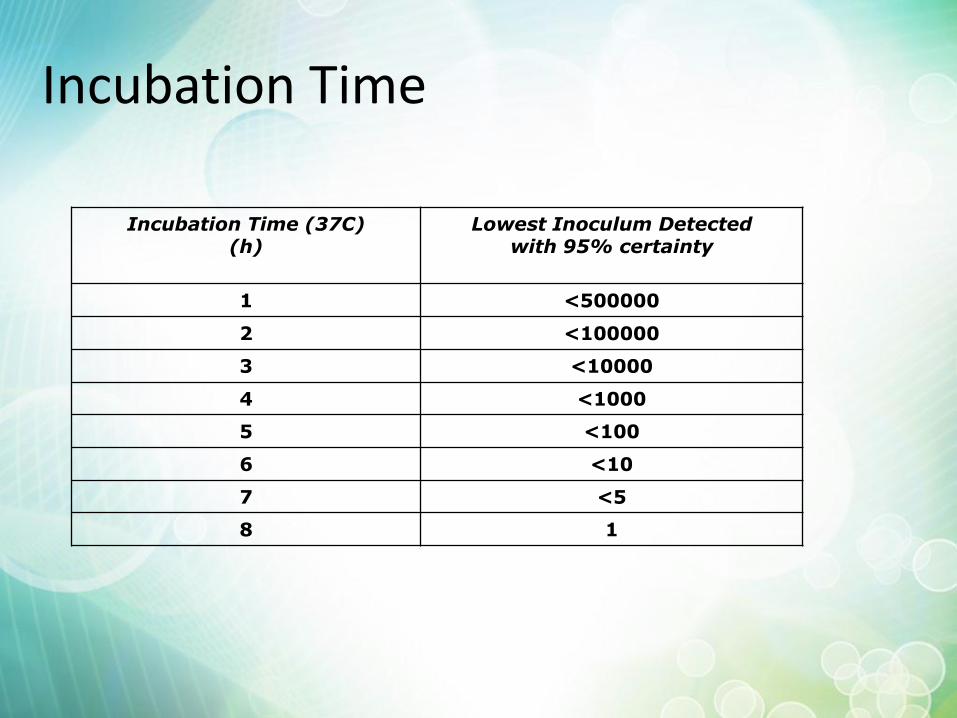
Incubation Time
Incubation Time (37C) (h)
Lowest Inoculum Detected with 95% certainty
1 <500000
2 <100000
3 <10000
4 <1000
5 <100
6 <10
7 <5
8 1
Summary
• ATP bioluminescence provides a rapid objective detection systems • simple convenient and easy-to-use • enables you to ‘see the invisible’ • Well proven technology • Many applications
• Cleaning is a key part of infection prevention and control • Effective cleaning maintains a safe patient environment and reduces costs • Visual assessment methods of cleaning are subjective and of questionable value • Correct use of rapid testing in sterile services improves efficiency, gives
meaningful results and reduces costs • Better management information enables better targeting and focussing of
resources to provide more control that drives an improvement in cleaning standards, compliance, patient care and cost reduction.