Embed Size (px)
Citation preview

Factor Mean Scores Trend - 2014 to 2016 - Years 5-6
Classroom Behaviour
Connectedness to Peers
Student Safety
Region
State
Mean Factor Score
1 = Strongly Disagree
5 = Strongly Agree
Student Distress
Student Morale
Region
State
Mean Factor Score
1 = Not At All
7 = All The Time
Mean Factor Score
1 = Strongly Disagree
5 = Strongly Agree
Learning Confidence
School Connectedness
Stimulating Learning
Student Motivation
Teacher Effectiveness
Teacher Empathy
Region
State
Factor Mean Scores Trend - Detail - 2014 to 2016 - Years 5-6
Mean Factor Score
School Region State
Parent Order Factor Factor Name 2014 2015 2016 2014 2015 2016 2014 2015 2016
Student Relationships
Classroom Behaviour 3.88 3.97 3.64 3.39 3.36 3.30 3.40 3.38 3.36
Connectedness to Peers 4.45 4.41 4.42 4.34 4.31 4.31 4.34 4.32 4.31
Student Safety 4.56 4.46 4.33 4.42 4.36 4.34 4.40 4.35 4.35
WellbeingStudent Distress 6.20 6.15 6.00 5.93 5.93 5.90 5.94 5.95 5.91
Student Morale 6.14 6.13 5.88 5.74 5.71 5.68 5.75 5.73 5.69
Teaching and Learning
Learning Confidence 4.36 4.45 4.49 4.14 4.13 4.14 4.14 4.15 4.13
School Connectedness 4.43 4.51 4.30 4.40 4.37 4.35 4.39 4.39 4.36
Stimulating Learning 4.40 4.43 4.32 4.15 4.10 4.08 4.16 4.14 4.09
Student Motivation 4.64 4.70 4.74 4.58 4.55 4.55 4.58 4.56 4.55
Teacher Effectiveness 4.48 4.47 4.47 4.45 4.40 4.37 4.44 4.41 4.38
Teacher Empathy 4.45 4.49 4.39 4.46 4.41 4.40 4.45 4.43 4.41
Printed on: 4/11/2016 9:11:20 AM Page 1 of 14
Attitudes to School - Summary Report - 2016The Lakes South Morang P-9 School (8846)

Factor Percentiles relative to all Victorian Pri/Sec school - 2016 - Years 5-6
Enrolment and Participation by year level and Gender - 2016 - Years 5-6
Percentile
2014 2015 2016
Parent Factor Name Factor Name
Student Relationships
Classroom Behaviour 75.1 80.2 66.6
Connectedness to Peers 70.4 67.1 68.5
Student Safety 66.9 60.6 41.7
WellbeingStudent Distress 74.3 69.3 58.0
Student Morale 84.1 83.5 66.5
Teaching and Learning
Learning Confidence 82.5 89.6 91.1
School Connectedness 53.3 65.4 38.2
Stimulating Learning 76.0 80.2 72.9
Student Motivation 63.7 78.4 86.0
Teacher Effectiveness 56.2 56.8 58.8
Teacher Empathy 48.1 58.4 42.4
Factor Percentiles relative to all Victorian Pri/Sec schools - Detail - 2014 to 2016 - Years 5-6
Enrolment Count Participation Count Participation Rate
Year Level All Female Male Unknown All Female Male Unknown All Female Male Unknown
Year 5 91 41 50
Year 6 95 46 49
Factor Mean Scores by Gender - 2016 - Years 5-6
Printed on: 4/11/2016 9:11:20 AM Page 2 of 14
Attitudes to School - Summary Report - 2016The Lakes South Morang P-9 School (8846)

Classroom Behaviour
Connectedness to Peers
Student Safety
Region
State
Mean Factor Score
1 = Strongly Disagree
5 = Strongly Agree
Student Distress
Student Morale
Region
State
Mean Factor Score
1 = Not At All
7 = All The Time
Learning Confidence
School Connectedness
Stimulating Learning
Student Motivation
Teacher Effectiveness
Teacher Empathy
Region
State
Mean Factor Score
1 = Strongly Disagree
5 = Strongly Agree
Mean Score
School Region State
Parent Order Factor Factor Name All Female Male Unk All Female Male Unk All Female Male Unk
Student Relationships
Classroom Behaviour 3.64 3.66 3.62 3.30 3.26 3.34 3.41 3.36 3.33 3.39 3.49
Connectedness to Peers 4.42 4.39 4.44 4.31 4.33 4.29 3.81 4.31 4.34 4.28 3.98
Student Safety 4.33 4.21 4.42 4.34 4.36 4.31 4.24 4.35 4.39 4.32 4.19
WellbeingStudent Distress 6.00 5.85 6.13 5.90 5.95 5.85 5.51 5.91 5.98 5.84 5.77
Student Morale 5.88 5.71 6.02 5.68 5.76 5.60 5.24 5.69 5.79 5.60 5.48
Teaching and Learning
Learning Confidence 4.49 4.50 4.47 4.14 4.24 4.05 3.72 4.13 4.23 4.04 4.01
School Connectedness 4.30 4.22 4.38 4.35 4.43 4.28 4.18 4.36 4.44 4.28 4.39
Stimulating Learning 4.32 4.34 4.31 4.08 4.14 4.02 4.08 4.09 4.18 4.02 4.15
Student Motivation 4.74 4.80 4.70 4.55 4.66 4.45 4.39 4.55 4.66 4.44 4.38
Teacher Effectiveness 4.47 4.46 4.47 4.37 4.40 4.35 4.20 4.38 4.42 4.35 4.41
Teacher Empathy 4.39 4.38 4.41 4.40 4.44 4.36 4.20 4.41 4.46 4.36 4.42
Factor Mean Scores by Gender - Detail - 2016 - Years 5-6
Printed on: 4/11/2016 9:11:21 AM Page 3 of 14
Attitudes to School - Summary Report - 2016The Lakes South Morang P-9 School (8846)

Classroom Behaviour
Connectedness to Peers
Student Safety
Factor Percentiles by Gender - 2016 - Years 5-6
Student Distress
Student Morale
Printed on: 4/11/2016 9:11:22 AM Page 4 of 14
Attitudes to School - Summary Report - 2016The Lakes South Morang P-9 School (8846)

Learning Confidence
School Connectedness
Stimulating Learning
Student Motivation
Teacher Effectiveness
Teacher Empathy
Factor Percentiles by Gender - Detail - 2016 - Years 5-6
Percentile
Parent Factor Name Factor Name All Female Male
Student Relationships
Classroom Behaviour 66.6 69.1 64.1
Connectedness to Peers 68.5 57.1 73.8
Student Safety 41.7 26.3 58.0
WellbeingStudent Distress 58.0 37.1 74.0
Student Morale 66.5 42.6 80.8
Teaching and Learning
Learning Confidence 91.1 86.3 92.3
School Connectedness 38.2 19.0 58.1
Stimulating Learning 72.9 67.2 76.9
Student Motivation 86.0 78.3 86.9
Teacher Effectiveness 58.8 52.8 64.1
Teacher Empathy 42.4 32.8 53.1
Printed on: 4/11/2016 9:11:23 AM Page 5 of 14
Attitudes to School - Summary Report - 2016The Lakes South Morang P-9 School (8846)
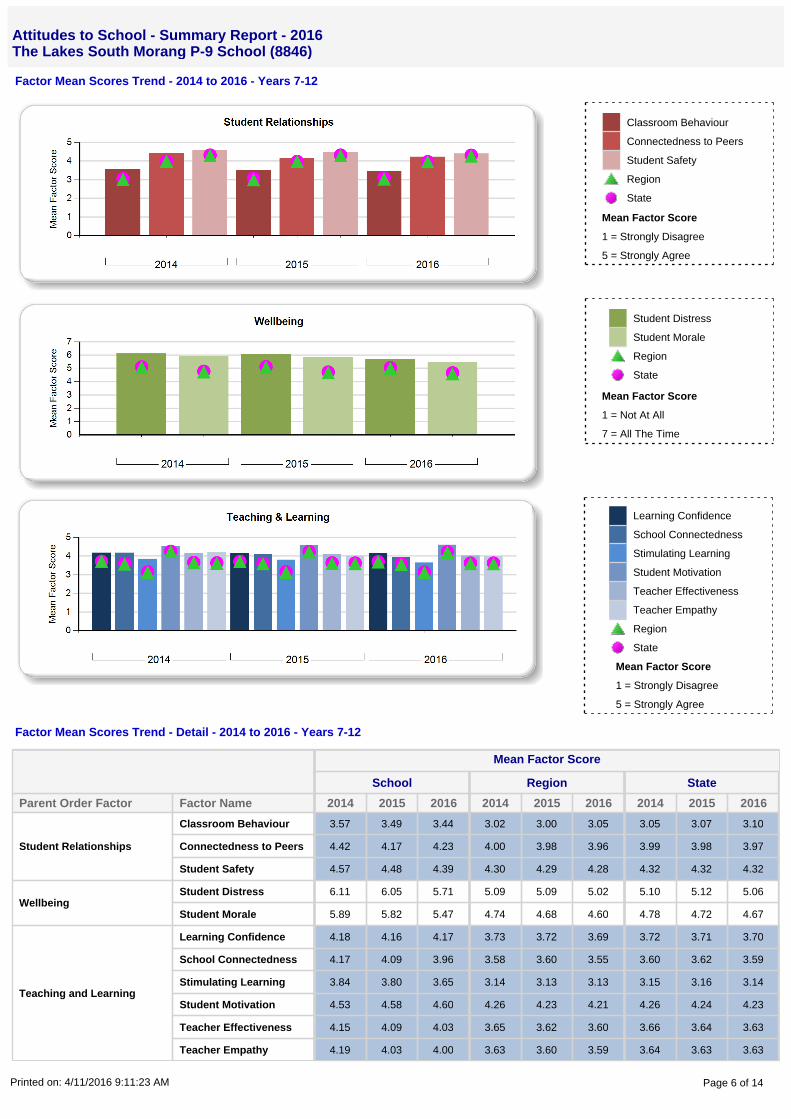
Factor Mean Scores Trend - 2014 to 2016 - Years 7-12
Classroom Behaviour
Connectedness to Peers
Student Safety
Region
State
Mean Factor Score
1 = Strongly Disagree
5 = Strongly Agree
Student Distress
Student Morale
Region
State
Mean Factor Score
1 = Not At All
7 = All The Time
Mean Factor Score
1 = Strongly Disagree
5 = Strongly Agree
Learning Confidence
School Connectedness
Stimulating Learning
Student Motivation
Teacher Effectiveness
Teacher Empathy
Region
State
Factor Mean Scores Trend - Detail - 2014 to 2016 - Years 7-12
Mean Factor Score
School Region State
Parent Order Factor Factor Name 2014 2015 2016 2014 2015 2016 2014 2015 2016
Student Relationships
Classroom Behaviour 3.57 3.49 3.44 3.02 3.00 3.05 3.05 3.07 3.10
Connectedness to Peers 4.42 4.17 4.23 4.00 3.98 3.96 3.99 3.98 3.97
Student Safety 4.57 4.48 4.39 4.30 4.29 4.28 4.32 4.32 4.32
WellbeingStudent Distress 6.11 6.05 5.71 5.09 5.09 5.02 5.10 5.12 5.06
Student Morale 5.89 5.82 5.47 4.74 4.68 4.60 4.78 4.72 4.67
Teaching and Learning
Learning Confidence 4.18 4.16 4.17 3.73 3.72 3.69 3.72 3.71 3.70
School Connectedness 4.17 4.09 3.96 3.58 3.60 3.55 3.60 3.62 3.59
Stimulating Learning 3.84 3.80 3.65 3.14 3.13 3.13 3.15 3.16 3.14
Student Motivation 4.53 4.58 4.60 4.26 4.23 4.21 4.26 4.24 4.23
Teacher Effectiveness 4.15 4.09 4.03 3.65 3.62 3.60 3.66 3.64 3.63
Teacher Empathy 4.19 4.03 4.00 3.63 3.60 3.59 3.64 3.63 3.63
Printed on: 4/11/2016 9:11:23 AM Page 6 of 14
Attitudes to School - Summary Report - 2016The Lakes South Morang P-9 School (8846)

Factor Percentiles relative to all Victorian Pri/Sec school - 2016 - Years 7-12
Enrolment and Participation by year level and Gender - 2016 - Years 7-12
Percentile
2014 2015 2016
Parent Factor Name Factor Name
Student Relationships
Classroom Behaviour 93.6 88.7 87.1
Connectedness to Peers 99.0 92.3 96.8
Student Safety 92.0 80.7 71.4
WellbeingStudent Distress 98.4 98.1 96.8
Student Morale 99.4 99.7 98.4
Teaching and Learning
Learning Confidence 99.4 99.7 99.7
School Connectedness 98.4 95.5 94.9
Stimulating Learning 98.1 96.5 95.2
Student Motivation 98.1 98.4 99.4
Teacher Effectiveness 96.5 93.9 95.2
Teacher Empathy 97.1 92.3 94.5
Factor Percentiles relative to all Victorian Pri/Sec schools - Detail - 2014 to 2016 - Years 7-12
Enrolment Count Participation Count Participation Rate
Year Level All Female Male Unknown All Female Male Unknown All Female Male Unknown
Year 7 112 52 60
Year 8 56 32 24
Year 9 63 34 28 1
Year 10
Year 11
Year 12
Factor Mean Scores by Gender - 2016 - Years 7-12
Printed on: 4/11/2016 9:11:24 AM Page 7 of 14
Attitudes to School - Summary Report - 2016The Lakes South Morang P-9 School (8846)

Classroom Behaviour
Connectedness to Peers
Student Safety
Region
State
Mean Factor Score
1 = Strongly Disagree
5 = Strongly Agree
Student Distress
Student Morale
Region
State
Mean Factor Score
1 = Not At All
7 = All The Time
Learning Confidence
School Connectedness
Stimulating Learning
Student Motivation
Teacher Effectiveness
Teacher Empathy
Region
State
Mean Factor Score
1 = Strongly Disagree
5 = Strongly Agree
Mean Score
School Region State
Parent Order Factor Factor Name All Female Male Unk All Female Male Unk All Female Male Unk
Student Relationships
Classroom Behaviour 3.44 3.33 3.57 1.33 3.05 3.00 3.09 3.27 3.10 3.06 3.14 3.19
Connectedness to Peers 4.23 4.20 4.25 4.75 3.96 3.98 3.95 3.63 3.97 3.98 3.96 3.72
Student Safety 4.39 4.37 4.42 4.40 4.28 4.32 4.24 4.06 4.32 4.36 4.28 4.03
WellbeingStudent Distress 5.71 5.53 5.88 6.33 5.02 4.89 5.15 4.69 5.06 4.93 5.18 4.63
Student Morale 5.47 5.32 5.61 6.40 4.60 4.52 4.69 4.40 4.67 4.60 4.74 4.29
Teaching and Learning
Learning Confidence 4.17 4.17 4.16 4.25 3.69 3.72 3.67 3.51 3.70 3.73 3.67 3.45
School Connectedness 3.96 3.90 4.01 4.40 3.55 3.54 3.57 3.42 3.59 3.58 3.60 3.33
Stimulating Learning 3.65 3.57 3.74 4.50 3.13 3.14 3.13 3.11 3.14 3.15 3.14 3.00
Student Motivation 4.60 4.66 4.53 5.00 4.21 4.34 4.08 3.93 4.23 4.35 4.11 3.93
Teacher Effectiveness 4.03 3.98 4.06 5.00 3.60 3.59 3.61 3.47 3.63 3.62 3.64 3.42
Teacher Empathy 4.00 3.97 4.04 4.86 3.59 3.60 3.59 3.48 3.63 3.63 3.62 3.40
Factor Mean Scores by Gender - Detail - 2016 - Years 7-12
Printed on: 4/11/2016 9:11:25 AM Page 8 of 14
Attitudes to School - Summary Report - 2016The Lakes South Morang P-9 School (8846)

Classroom Behaviour
Connectedness to Peers
Student Safety
Factor Percentiles by Gender - 2016 - Years 7-12
Student Distress
Student Morale
Printed on: 4/11/2016 9:11:26 AM Page 9 of 14
Attitudes to School - Summary Report - 2016The Lakes South Morang P-9 School (8846)
Learning Confidence
School Connectedness
Stimulating Learning
Student Motivation
Teacher Effectiveness
Teacher Empathy
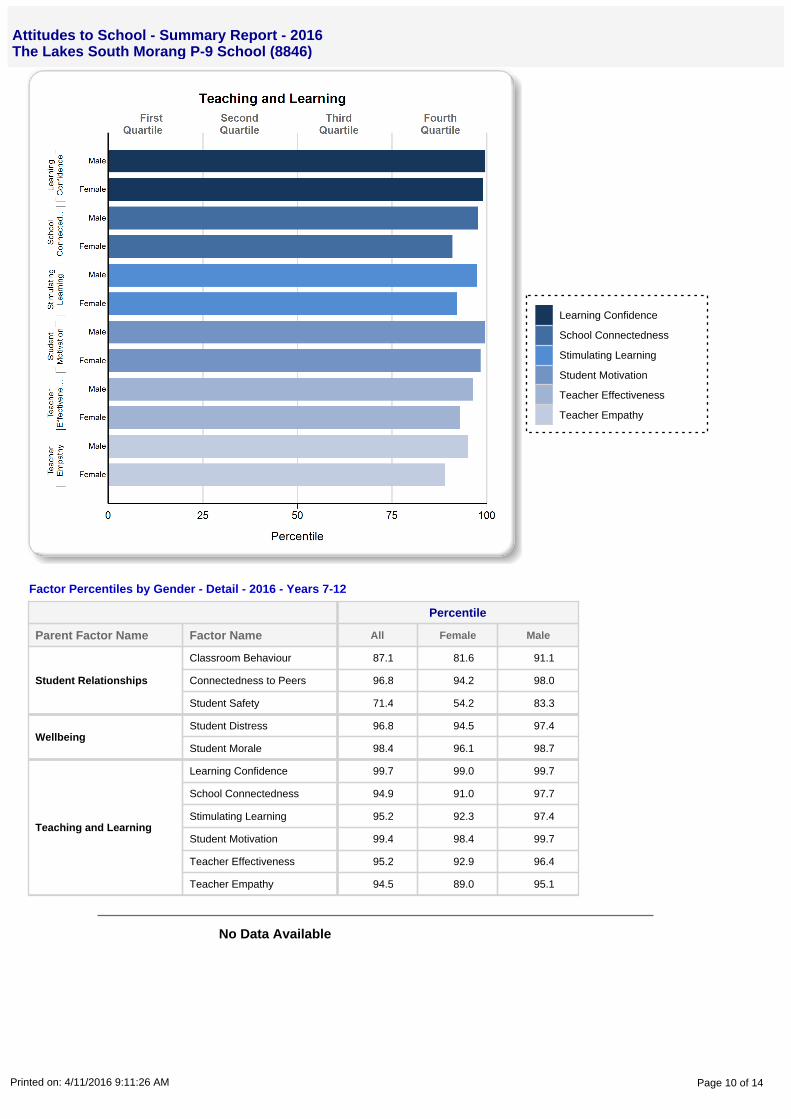
Factor Percentiles by Gender - Detail - 2016 - Years 7-12
Percentile
Parent Factor Name Factor Name All Female Male
Student Relationships
Classroom Behaviour 87.1 81.6 91.1
Connectedness to Peers 96.8 94.2 98.0
Student Safety 71.4 54.2 83.3
WellbeingStudent Distress 96.8 94.5 97.4
Student Morale 98.4 96.1 98.7
Teaching and Learning
Learning Confidence 99.7 99.0 99.7
School Connectedness 94.9 91.0 97.7
Stimulating Learning 95.2 92.3 97.4
Student Motivation 99.4 98.4 99.7
Teacher Effectiveness 95.2 92.9 96.4
Teacher Empathy 94.5 89.0 95.1
No Data Available
Printed on: 4/11/2016 9:11:26 AM Page 10 of 14
Attitudes to School - Summary Report - 2016The Lakes South Morang P-9 School (8846)

2016 Year 12Cohort
2016 Year 11Cohort
2016 Year 10Cohort
2016 Year 9Cohort
Yr 12 Yr 11 Yr 10 Yr 11 Yr 10 Yr 9 Yr 10 Yr 9 Yr 8 Yr 9 Yr 8 Yr 7
School
Student Relationships
Classroom Behaviour 3.76 3.64 3.78 2.86 3.11 3.27
Connectedness to Peers 4.55 4.06 4.33 4.24 4.17 4.42
Student Safety 4.76 4.37 4.55 4.39 4.52 4.46
WellbeingStudent Distress 6.13 6.00 5.97 5.50 5.92 6.23
Student Morale 5.80 5.75 5.84 5.36 5.61 5.99
Teaching and Learning
Learning Confidence 4.19 4.12 4.14 4.10 4.11 4.20
School Connectedness 4.30 3.94 3.97 4.01 4.04 4.28
Stimulating Learning 4.13 3.63 3.67 3.59 3.65 3.83
Student Motivation 4.58 4.62 4.48 4.67 4.56 4.53
Teacher Effectiveness 4.15 3.89 3.99 3.99 4.05 4.29
Teacher Empathy 4.37 3.93 4.13 3.93 3.86 4.13
Region
Student Relationships
Classroom Behaviour 3.31 3.15 2.99 3.21 2.97 2.93 2.98 2.86 2.82 2.95 2.84 2.93
Connectedness to Peers 3.94 3.90 3.91 3.90 3.91 3.95 3.87 3.93 4.04 3.91 4.01 4.20
Student Safety 4.37 4.32 4.24 4.31 4.27 4.26 4.24 4.22 4.22 4.24 4.23 4.34
WellbeingStudent Distress 4.66 4.82 4.91 4.75 4.92 5.05 4.84 5.05 5.29 4.95 5.29 5.62
Student Morale 4.37 4.42 4.55 4.33 4.48 4.63 4.40 4.60 4.90 4.50 4.82 5.29
Teaching and Learning
Learning Confidence 3.63 3.65 3.66 3.61 3.65 3.66 3.62 3.66 3.76 3.64 3.74 3.92
School Connectedness 3.45 3.46 3.39 3.40 3.41 3.43 3.37 3.46 3.62 3.42 3.63 4.03
Stimulating Learning 3.25 3.10 2.95 3.11 2.97 2.94 2.94 2.91 3.11 2.89 3.06 3.50
Student Motivation 4.12 4.16 4.18 4.12 4.17 4.23 4.15 4.20 4.31 4.18 4.27 4.44
Teacher Effectiveness 3.65 3.53 3.43 3.53 3.44 3.48 3.41 3.43 3.67 3.42 3.60 4.02
Teacher Empathy 3.65 3.51 3.40 3.52 3.42 3.45 3.39 3.41 3.64 3.41 3.57 4.00
State
Student Relationships
Classroom Behaviour 3.41 3.25 3.05 3.28 3.08 2.99 3.10 2.99 2.83 3.02 2.86 2.95
Connectedness to Peers 3.95 3.90 3.91 3.89 3.91 3.95 3.88 3.94 4.01 3.92 3.99 4.17
Student Safety 4.43 4.37 4.29 4.37 4.31 4.28 4.30 4.28 4.23 4.26 4.22 4.33
WellbeingStudent Distress 4.72 4.84 4.93 4.75 4.96 5.07 4.89 5.09 5.29 5.01 5.29 5.62
Student Morale 4.44 4.47 4.59 4.38 4.54 4.68 4.49 4.65 4.91 4.58 4.84 5.30
Teaching and Learning
Learning Confidence 3.64 3.63 3.65 3.60 3.64 3.65 3.63 3.67 3.75 3.65 3.74 3.90
School Connectedness 3.49 3.46 3.43 3.41 3.46 3.47 3.43 3.52 3.63 3.48 3.65 4.04
Stimulating Learning 3.23 3.10 2.98 3.09 3.00 2.97 2.98 3.00 3.11 2.97 3.10 3.51
Student Motivation 4.15 4.16 4.18 4.14 4.19 4.24 4.16 4.22 4.30 4.20 4.27 4.43
Teacher Effectiveness 3.66 3.53 3.47 3.53 3.47 3.52 3.46 3.52 3.66 3.49 3.63 4.01
Teacher Empathy 3.69 3.53 3.44 3.53 3.45 3.48 3.45 3.49 3.63 3.48 3.60 4.00
Factor Mean Score Cohort Comparison
Printed on: 4/11/2016 9:11:27 AM Page 11 of 14
Attitudes to School - Summary Report - 2016The Lakes South Morang P-9 School (8846)

2016 Year 8Cohort
2016 Year 7Cohort
2016 Year 6Cohort
Yr 8 Yr 7 Yr 6 Yr 7 Yr 6 Yr 5 Yr 6 Yr 5
School
Student Relationships
Classroom Behaviour 3.50 3.66 3.73 3.73 4.02 4.01 3.65 3.93
Connectedness to Peers 4.32 4.27 4.50 4.18 4.35 4.42 4.38 4.47
Student Safety 4.50 4.55 4.58 4.34 4.43 4.53 4.33 4.49
WellbeingStudent Distress 5.75 6.19 6.30 5.80 6.02 6.11 5.86 6.26
Student Morale 5.36 6.07 6.05 5.58 6.05 6.21 5.74 6.19
Teaching and Learning
Learning Confidence 4.01 4.25 4.30 4.28 4.49 4.41 4.46 4.42
School Connectedness 3.83 4.29 4.34 3.99 4.46 4.52 4.20 4.56
Stimulating Learning 3.33 4.10 4.27 3.86 4.42 4.52 4.27 4.44
Student Motivation 4.53 4.56 4.56 4.59 4.72 4.71 4.74 4.68
Teacher Effectiveness 3.75 4.31 4.40 4.18 4.51 4.55 4.41 4.43
Teacher Empathy 3.84 4.26 4.34 4.13 4.47 4.54 4.37 4.51
Region
Student Relationships
Classroom Behaviour 2.84 2.91 3.45 3.00 3.41 3.33 3.33 3.30
Connectedness to Peers 3.98 4.18 4.37 4.18 4.34 4.32 4.34 4.28
Student Safety 4.18 4.32 4.47 4.33 4.42 4.36 4.40 4.30
WellbeingStudent Distress 5.20 5.62 6.00 5.61 5.99 5.86 5.95 5.87
Student Morale 4.74 5.26 5.77 5.21 5.74 5.71 5.68 5.68
Teaching and Learning
Learning Confidence 3.70 3.91 4.17 3.93 4.16 4.11 4.17 4.09
School Connectedness 3.58 4.06 4.40 4.03 4.37 4.39 4.34 4.38
Stimulating Learning 3.06 3.50 4.11 3.49 4.05 4.18 4.04 4.14
Student Motivation 4.24 4.42 4.60 4.41 4.57 4.55 4.57 4.53
Teacher Effectiveness 3.57 4.00 4.44 3.98 4.39 4.46 4.35 4.41
Teacher Empathy 3.57 3.99 4.44 3.99 4.39 4.48 4.37 4.42
State
Student Relationships
Classroom Behaviour 2.87 2.95 3.46 2.99 3.45 3.33 3.41 3.31
Connectedness to Peers 3.98 4.16 4.37 4.16 4.35 4.31 4.33 4.29
Student Safety 4.22 4.33 4.47 4.33 4.42 4.34 4.41 4.29
WellbeingStudent Distress 5.23 5.63 6.01 5.62 6.01 5.88 5.96 5.89
Student Morale 4.79 5.26 5.78 5.24 5.76 5.72 5.71 5.70
Teaching and Learning
Learning Confidence 3.72 3.90 4.17 3.92 4.18 4.11 4.16 4.11
School Connectedness 3.61 4.06 4.39 4.04 4.39 4.39 4.35 4.38
Stimulating Learning 3.07 3.51 4.13 3.50 4.11 4.18 4.06 4.16
Student Motivation 4.26 4.42 4.61 4.41 4.59 4.56 4.57 4.54
Teacher Effectiveness 3.60 3.99 4.43 3.98 4.40 4.45 4.37 4.42
Teacher Empathy 3.59 3.99 4.44 3.99 4.42 4.46 4.39 4.44
Factor Mean Score Cohort Comparison (continued)
Printed on: 4/11/2016 9:11:27 AM Page 12 of 14
Attitudes to School - Summary Report - 2016The Lakes South Morang P-9 School (8846)

Year 5 Year 6 Years 5-6
Parent Factor Name Factor Name 10th
ptile25thptile
50thptile
75thptile
90thptile
10thptile
25thptile
50thptile
75thptile
90thptile
10thptile
25thptile
50thptile
75thptile
90thptile
Student Relationships
Classroom Behaviour 2.5 2.9 3.3 3.8 4.3 2.6 3.0 3.4 3.9 4.4 2.6 2.9 3.3 3.8 4.3
Connectedness to Peers 3.9 4.1 4.3 4.5 4.6 4.0 4.2 4.3 4.5 4.7 4.0 4.2 4.3 4.5 4.6
Student Safety 3.8 4.1 4.3 4.6 4.8 4.0 4.2 4.5 4.7 4.8 4.0 4.2 4.4 4.6 4.8
WellbeingStudent Distress 5.3 5.6 5.9 6.2 6.4 5.4 5.7 6.0 6.3 6.5 5.4 5.7 5.9 6.2 6.4
Student Morale 5.1 5.4 5.7 6.0 6.3 5.1 5.4 5.7 6.0 6.3 5.1 5.4 5.7 6.0 6.2
Teaching and Learning
Learning Confidence 3.7 3.9 4.1 4.3 4.5 3.8 4.0 4.1 4.3 4.5 3.8 4.0 4.1 4.3 4.5
School Connectedness 4.0 4.2 4.4 4.6 4.8 3.9 4.2 4.4 4.6 4.8 4.0 4.2 4.4 4.6 4.7
Stimulating Learning 3.7 3.9 4.1 4.4 4.6 3.5 3.8 4.1 4.3 4.6 3.6 3.9 4.1 4.3 4.6
Student Motivation 4.2 4.4 4.5 4.7 4.8 4.3 4.4 4.6 4.7 4.8 4.3 4.4 4.5 4.7 4.8
Teacher Effectiveness 4.1 4.2 4.4 4.6 4.7 4.0 4.2 4.4 4.6 4.8 4.0 4.2 4.4 4.6 4.7
Teacher Empathy 4.1 4.3 4.5 4.6 4.8 4.0 4.2 4.4 4.6 4.8 4.1 4.3 4.4 4.6 4.8
Distribution of School Means - all Victorian Schools - 2016
Year 7 Year 8 Year 9
Parent Factor Name Factor Name 10th
ptile25thptile
50thptile
75thptile
90thptile
10thptile
25thptile
50thptile
75thptile
90thptile
10thptile
25thptile
50thptile
75thptile
90thptile
Student Relationships
Classroom Behaviour 2.5 2.7 2.9 3.2 3.5 2.4 2.6 2.8 3.1 3.4 2.6 2.7 2.9 3.2 3.5
Connectedness to Peers 3.9 4.0 4.1 4.2 4.3 3.7 3.9 4.0 4.1 4.2 3.7 3.8 3.9 4.0 4.2
Student Safety 3.9 4.1 4.3 4.5 4.6 3.9 4.1 4.2 4.4 4.5 4.0 4.1 4.3 4.4 4.6
WellbeingStudent Distress 5.2 5.4 5.6 5.8 5.9 4.9 5.1 5.2 5.4 5.6 4.7 4.8 5.0 5.3 5.6
Student Morale 4.8 5.1 5.2 5.4 5.6 4.4 4.6 4.8 4.9 5.2 4.2 4.4 4.6 4.9 5.1
Teaching and Learning
Learning Confidence 3.7 3.8 3.9 4.0 4.1 3.4 3.6 3.7 3.8 3.9 3.4 3.5 3.6 3.8 3.9
School Connectedness 3.7 3.9 4.0 4.2 4.3 3.2 3.4 3.6 3.8 4.0 3.1 3.3 3.5 3.7 3.9
Stimulating Learning 3.2 3.3 3.5 3.7 3.8 2.8 2.9 3.1 3.3 3.5 2.7 2.8 3.0 3.2 3.5
Student Motivation 4.1 4.3 4.4 4.5 4.6 3.9 4.1 4.2 4.3 4.5 3.9 4.1 4.2 4.3 4.4
Teacher Effectiveness 3.7 3.9 4.0 4.1 4.2 3.3 3.5 3.6 3.8 3.9 3.2 3.3 3.5 3.7 4.0
Teacher Empathy 3.7 3.9 4.0 4.1 4.2 3.3 3.4 3.6 3.8 4.0 3.2 3.3 3.5 3.7 4.0
Year 10 Year 11 Year 12
Parent Factor Name Factor Name 10th
ptile25thptile
50thptile
75thptile
90thptile
10thptile
25thptile
50thptile
75thptile
90thptile
10thptile
25thptile
50thptile
75thptile
90thptile
Student Relationships
Classroom Behaviour 2.7 2.8 3.0 3.3 3.6 2.8 3.0 3.2 3.5 3.9 3.0 3.2 3.4 3.7 4.0
Connectedness to Peers 3.6 3.7 3.9 4.0 4.1 3.7 3.8 3.9 4.0 4.1 3.7 3.8 4.0 4.1 4.2
Student Safety 4.0 4.1 4.3 4.4 4.6 4.1 4.2 4.4 4.5 4.7 4.2 4.3 4.5 4.6 4.7
WellbeingStudent Distress 4.5 4.7 4.9 5.1 5.4 4.4 4.5 4.8 5.0 5.3 4.4 4.5 4.7 5.0 5.3
Student Morale 4.0 4.3 4.5 4.7 5.0 4.0 4.2 4.4 4.6 4.9 4.1 4.2 4.4 4.7 5.0
Teaching and Learning
Learning Confidence 3.4 3.5 3.6 3.7 3.8 3.4 3.5 3.6 3.7 3.8 3.5 3.5 3.6 3.8 3.9
School Connectedness 3.0 3.2 3.4 3.6 3.8 3.0 3.2 3.4 3.6 3.8 3.1 3.3 3.5 3.7 3.9
Stimulating Learning 2.6 2.8 3.0 3.2 3.4 2.8 2.9 3.1 3.3 3.5 2.9 3.1 3.2 3.4 3.6
Student Motivation 3.9 4.0 4.1 4.3 4.3 3.8 4.0 4.1 4.2 4.4 3.9 4.0 4.1 4.3 4.3
Teacher Effectiveness 3.2 3.3 3.4 3.6 3.8 3.3 3.4 3.5 3.7 3.9 3.3 3.5 3.7 3.8 4.1
Teacher Empathy 3.1 3.3 3.4 3.6 3.9 3.2 3.4 3.6 3.7 4.0 3.4 3.5 3.7 3.9 4.1
Printed on: 4/11/2016 9:11:27 AM Page 13 of 14
Attitudes to School - Summary Report - 2016The Lakes South Morang P-9 School (8846)

Years 7-12
Parent Factor Name Factor Name 10th
ptile25thptile
50thptile
75thptile
90thptile
Student Relationships
Classroom Behaviour 2.7 2.8 3.1 3.3 3.5
Connectedness to Peers 3.8 3.9 4.0 4.0 4.1
Student Safety 4.1 4.2 4.3 4.4 4.5
WellbeingStudent Distress 4.8 4.9 5.1 5.2 5.4
Student Morale 4.4 4.5 4.7 4.9 5.1
Teaching and Learning
Learning Confidence 3.5 3.6 3.7 3.8 3.9
School Connectedness 3.3 3.4 3.6 3.7 3.9
Stimulating Learning 2.9 3.0 3.1 3.3 3.5
Student Motivation 4.0 4.1 4.2 4.3 4.4
Teacher Effectiveness 3.4 3.5 3.6 3.8 3.9
Teacher Empathy 3.4 3.5 3.6 3.8 3.9
Printed on: 4/11/2016 9:11:27 AM Page 14 of 14
Attitudes to School - Summary Report - 2016The Lakes South Morang P-9 School (8846)