Embed Size (px)
Citation preview

ATOMISTIC INVESTIGATION OF THE STRUCTURAL, TRANSPORT, AND MECHANICAL
PROPERTIES OF Cu-Zr METALLIC GLASSES
By
Mohit Kumar
A thesis submitted in conformity with the requirements for the degree of Master of Applied Science
Department of Mechanical and Industrial Engineering University of Toronto
© Copyright by Mohit Kumar 2016

ii
Atomistic Investigation of the Structural, Transport, and Mechanical Properties of Cu-Zr Metallic Glasses
Mohit Kumar
Master of Applied Science
Department of Mechanical and Industrial Engineering
University of Toronto
2016
Abstract
The unique set of mechanical and magnetic properties possessed by metallic glasses (MGs) has
attracted a lot of recent scientific and technological interest. The development of new metallic
glass alloys with improved manufacturability, enhanced properties and higher ductility relies on
the fundamental understanding of the interconnections between their atomic structure, glass
forming ability (GFA), transport properties, and elastic and plastic deformation mechanisms. This
thesis is focused on finding these atomic structure-property relationships in Cu-Zr MGs using
molecular dynamics (MD) simulations. In the first study described herein, MD simulations of the
rapid solidification process over Cu-Zr compositional domain were conducted to explore inter-
dependencies of atomic transport and fragility, elasticity and structural ordering, and GFA. The
second study investigated the atomic origins of serration events, which is the characteristic plastic
deformation behaviour in BMGs. The combined results of this work suggest that GFA and ductility
of metallic glasses could be compositionally tuned.

iii
To my grandparents

iv
Acknowledgments
With profound gratitude, I would like to extend my heartfelt thanks to my supervisors Dr. Chandra
Veer Singh, Dr. Steven J. Thorpe and Dr. Donald W. Kirk for their guidance, training and
continuous support throughout my graduate studies. The work presented here would not have been
possible without their encouragement, mentorship and active involvement in my research. I would
also like to thank Dr. Kamran Behdinan for taking out time and participating as a member on my
thesis committee. My sincere thanks are also due towards the industrial partner Gedex Inc. and in
particular to Dr. Kieran Carrol, Dr. Barry French, Dr. Donald McTavish, for their feedback and
support throughout the duration of this project.
I am grateful to the Department of Mechanical and Industrial Engineering, Natural Sciences and
Engineering Research Council of Canada (NSERC), and industrial partner Gedex Inc. for
providing funding for this research. I would also like to thank Compute Canada for providing
computational resources on the GPC supercomputer at the SciNet HPC Consortium for carrying
out this research.
Further thanks are due to Sina Sedighi, who initiated the research on modelling and simulations of
metallic glasses in our research group and whose active involvement and feedback has guided me
throughout this work. I would also like to take this opportunity to thank Thomas Berton for his
helpful discussions on MD and LAMMPS, Matthew Daly, Mireille Ghoussoub, other members of
Computational Materials Engineering (CME) Lab and Kanika Madan for providing technical and
emotional support.
Last but not the least, I am forever grateful to my mom and dad for their unconditional love and
support.

v
Table of Contents
Acknowledgments.......................................................................................................................... iv
Table of Contents .............................................................................................................................v
List of Tables ............................................................................................................................... viii
List of Figures ................................................................................................................................ ix
List of Acronyms and Symbols ................................................................................................... xiii
List of Appendices .........................................................................................................................xv
1. Introduction ...............................................................................................................................1
1.1. Background ..........................................................................................................................1
1.1.1. Formation of Metallic Glasses .................................................................................1
1.1.2. Atomic Structure of Metallic Glasses ......................................................................4
1.1.3. Mechanical Properties and Deformation Mechanisms ............................................7
1.2. Thesis Motivation ..............................................................................................................10
1.3. Thesis Objectives ...............................................................................................................12
1.4. Thesis Organization ...........................................................................................................13
2. Computational Methodology .................................................................................................14
2.1. Molecular Dynamics ..........................................................................................................14
2.1.1. Interatomic Potential ..............................................................................................15
2.2. Model Generation ..............................................................................................................16
2.3. Property Extraction and Calculation Methodology ...........................................................18
2.3.1. Atomic Transport and Kinetic Properties ..............................................................18
2.3.2. Thermodynamic and Bulk Stiffness Properties .....................................................19
2.3.3. Structural Properties...............................................................................................20
2.3.3.1. Partial Radial Distribution Function (PRDF) ..........................................20
2.3.3.2. Structure Factor .......................................................................................20
2.3.3.3. Voronoi Analysis .....................................................................................21

vi
2.3.3.4. Least Square Local Atomic Strain ...........................................................22
3. Emergent Properties and Connections to Glass Forming Ability in the Cu-Zr System ..23
3.1. Literature Review...............................................................................................................24
3.2. Computational Methodology and Simulation Details ........................................................26
3.3. Results and Discussion ......................................................................................................27
3.3.1. Transport and Kinetic Properties ...........................................................................27
3.3.2. Bulk Stiffness and Physical Properties ..................................................................34
3.3.3. Structural Analysis .................................................................................................38
3.4. Summary ............................................................................................................................45
4. Investigating Atomic Origins of Serration Events for Cu-Zr Metallic Glass System.......46
4.1. Literature Review...............................................................................................................46
4.2. Simulation Methodology ...................................................................................................49
4.3. Results and Discussion ......................................................................................................51
4.3.1. Overall stress-strain response and structural origins of serration events ...............53
4.3.2. Evolution of serration behavior with applied strain ...............................................61
4.3.3. Effect of operating temperature .............................................................................63
4.3.4. Effect of strain rate.................................................................................................66
4.3.5. Compositional dependence of serration behavior ..................................................68
4.4. Summary ............................................................................................................................71
5. Conclusions and Future Work ...............................................................................................72
5.1. Summary and Overall Contribution ...................................................................................72
5.1.1. Emergent Properties and Connections to Glass Forming Ability ..........................73
5.1.2. Investigating atomic level structural origins of Serration Events ..........................74
5.1.3. Development of the BMG component for vibrational testing for Gedex Inc. .......74
5.2. Future Work .......................................................................................................................75
5.2.1. β-relaxations and energy barriers for cluster transitions ........................................76

vii
5.2.2. Fracture of BMGs ..................................................................................................77
Bibliography ..................................................................................................................................79

viii
List of Tables
Table 4.1: Summary of calculation of 𝜼 𝒊𝑴𝒊𝒔𝒆𝒔 for analyzed serration events ................................ 57
Table 4.2: Summary of analysis of events AB, DE and FG ......................................................... 57

ix
List of Figures
Figure 1.1: Schematic of specific volume vs temperature representing cooling rate dependence of
a typical melt’s volume at constant pressure. (adapted from [3]) ................................................... 2
Figure 1.2: Progress in critical casting thickness of BMG in the past 5 decades (from [7]) .......... 4
Figure 1.3: Fraction of dominant Cu-centered Voronoi polyhedra for various Cu-Zr compositions
and their representative cluster shapes, taken from [13]................................................................. 6
Figure 1.4: Strength and elastic limit of metallic glasses as compared to other engineering
materials, from [7] .......................................................................................................................... 7
Figure 1.5: Comparison of elastic limit and Young’s modulus of 1507 materials from [9]........... 8
Figure 1.6: Simplistic depiction of STZ activation, taken from [26].............................................. 9
Figure 2.1: Flowchart of basic MD algorithm .............................................................................. 15
Figure 2.2: Schematic representation of simulation process for glass formation, from [3] .......... 17
Figure 2.3: (a) Schematic of a 3D Voronoi tessellation of an atomic structure. (b) Voronoi
Cell/Polyhedra around atom A. (c) Voronoi Polyhedra around atom A (yellow) with nearest
neighbor atoms shown (blue) ........................................................................................................ 22
Figure 3.1: Evolution of density change and critical casting diameter over Cu-Zr compositional
domain, adapted from [45] ............................................................................................................ 24
Figure 3.2: Angell fragility parameter, m estimated from VFT fits to viscosity data. ................. 28
Figure 3.3: Strength parameter, D*, calculated from VFT fits to viscosity data .......................... 29
Figure 3.4: D* parameter calculated from VFT fits to diffusivity data. ...................................... 30
Figure 3.5: Ratio of diffusive to viscous strength, D* parameter ................................................. 31
Figure 3.6: Ratio of viscous to diffusive divergence temperature, T0 .......................................... 31

x
Figure 3.7: Density of CuZr amorphous and respective equilibrium intermetallic phases.
(intermetallic phase data taken from Du et. al [53]) ..................................................................... 33
Figure 3.8: Fractional density differences between crystalline and respective amorphous phases at
0K (intermetallic phase data taken from Du et. al [53]). .............................................................. 33
Figure 3.9: Fractional density differences between crystalline and respective amorphous phases at
0K (intermetallic phase data taken from Du et. al [53]). .............................................................. 35
Figure 3.10: Evolution of atomic bulk modulus at (a) 1.0Tg and (b) 1.2Tg ................................. 36
Figure 3.11: Evolution of bulk and shear Moduli of CuZr intermetallic phases (Cu, Cu5Zr,
Cu51Zr14, Cu8Zr3, Cu2Zr, Cu10Zr7, CuZr, Cu5Zr8, CuZr2, Zr) reproduced from Du et. al [53])........ 37
Figure 3.12: Evolution of fraction of full icosahedra <0,0,12,0> motif at 1.2Tg over Cu-Zr
compositional domain. .................................................................................................................. 39
Figure 3.13: Evolution of fraction of <0,0,12,4> Kasper Polyhedra at 1.2Tg over Cu-Zr
compositional domain. .................................................................................................................. 39
Figure 3.14: Evolution of fraction of Kasper BCC <0,6,0,8> polyhedra at 0.4Tg over Cu-Zr
compositional domain. .................................................................................................................. 40
Figure 3.15: The difference between mean coordination numbers for zirconium and copper atoms
(<CNZr>-<CNCu>) at Tg for various Cu-Zr compositions. ........................................................... 41
Figure 3.16: The mean atomic volume ratios of Zirconium and Copper atoms < CNZr>/<CNCu >
at Tg for various Cu-Zr compositions ........................................................................................... 42
Figure 3.17: Pair correlation functions for various Cu-Zr compositions at 0.4Tg ....................... 44
Figure 4.1: Stress-time profiles of a BMG sample in compression, depicting cycles of stress drop
and gain, taken from [68] .............................................................................................................. 47
Figure 4.2: Typical atomistic configuration of a simulated sample. (a) Atomic Structure of Cu64Zr36
MG sample (b) Left hand side view of a typical sample configuration (c) Front view of a typical
sample configuration ..................................................................................................................... 50
xi
Figure 4.3: (a). Calculated structure factor for various samples of Cu-Zr compositions at 300K (b).
Structure factor evolution during quenching for a simulated Cu64Zr36 MG composition plotted at
various temperatures. .................................................................................................................... 52
Figure 4.4: (a). Stress Strain response of Cu64Zr36 MG sample and single crystal Copper at 107s-
1strain rate and 300K. (b)-(c): Representative stress drop and accumulation cycles. ................... 53
Figure 4.5: Atomic configuration snapshots corresponding to instants A to H. ........................... 55
Figure 4.6: (a): The atomic distribution of ηiMises calculated between instants prior to and after a
stress change event. (b)-(c): Atomic configuration snapshots of (b) Event AB and (c) Event FG
showing atoms with ηiMises > 0.15. ............................................................................................. 58
Figure 4.7: Fraction of six major Cu-centered Voronoi polyhedra and geometrically unfavoured
motifs (GUMs) describing the short range order of Cu64Zr36 MG sample. .................................. 60
Figure 4.8: The statistics of serration events with respect to overall sample strain...................... 62
Figure 4.9: Evolution of six major Cu-centred Voronoi polyhedra and geometrically unfavoured
motifs (GUMs) during deformation of Cu64Zr36 MG sample ....................................................... 63
Figure 4.10: Stress-strain response of Cu64Zr36 MG sample at 107 s-1 strain rate and varied
temperatures. (b) Evolution of counts of serration events during the deformation of Cu64Zr36 MG
sample at varied temperatures. (c) Evolution of mean and standard deviation of magnitude of stress
change at different temperatures. .................................................................................................. 64
Figure 4.11: (a). Decay of the population of full icosahedra (FI) clusters during the deformation of
Cu64Zr36 sample at varied temperatures. (b). Growth of the population of geometrically unfavoured
motifs (GUMs) during the deformation of Cu64Zr36 sample at varied temperatures. ................... 65
Figure 4.12: (a) Stress-strain response of Cu64Zr36 MG sample at 300K and variable strain rate
rates. (b). Variation of mean Δσ with respect to strain rate. ......................................................... 67
Figure 4.13: (a) Stress-strain response of four different compositions of Cu-Zr MG at 300K and
107 s-1 strain rate. (b) Trend of counts of serration events in different Cu-Zr compositions. (c) Trend
of mean and standard deviation of magnitude of Δσ in different Cu-Zr compositions. ............... 69

xii
Figure 4.14: The population of geometrically unfavoured motifs (GUMs) and full icosahedra (FI)
clusters in the undeformed samples of various Cu-Zr compositions. ........................................... 70
Figure 5.1: Snapshots of atomic configurations at corresponding strains. ................................... 78

xiii
List of Acronyms and Symbols
Acronym Description MG Metallic glass
BMG Bulk metallic glass
GFA Glass forming ability
MD Molecular dynamics
NVE Constant particle number, volume, and energy
NVT Constant particle number, volume, and temperature
NPT Constant particle number, pressure, and temperature
SRO Short range order
MRO Medium range order
STZs Shear transformation zones
CN Coordination number
PRDF Partial radial distribution function
ISRO Icosahedral short range order
FI Full icosahedra
DFT Density functional theory
GUMs Geometrically unfavorable motifs
RMSD Root mean square displacement
Symbol Units [SI] Description kB J K-1 Boltzmann constant
h J s Plank’s constant
β J-1 Thermodynamic beta (inverse temperature)
σE J2 Energy variance under thermodynamic fluctuations
Cv J T-1 Constant volume heat capacity
Cp J T-1 Constant pressure heat capacity
αT m3 T-1 Isothermal expansion coefficient
BT Pa Bulk modulus
N - Number of atoms
V m3 Volume
T K Temperature
P Pa Pressure
r m 3N-dimensional atomic coordinates
p kg m s-1 3N-dimensional atomic momenta
v m s-1 3-dimensional atomic velocity
ω Hz Spectral frequency
F N 3-dimensional atomic force
m Kg Atomic mass
Tm K Melting point
Tl K Liquidus temperature
Tg K Glass transition temperature
TMC K Mode coupling temperature
m - Kinetic fragility parameter
D* - VFT strength parameter
xiv
T0 K VFT divergence temperature
η Pa s Viscosity
D m2 s-1 Atomic diffusivity
τ s Relaxation time
Pαβ Pa m-3 Symmetrized traceless virial stress tensor
σαβ Pa m-3 Virial stress tensor
gαβ(r) - Partial radial distribution function
q m-1 Wave-vector
S(q) - Structure factor
(Δμ)Tg J mol-1 Liquid-crystal partial-molar free energy difference at Tg
𝑉𝑖𝑗(𝑟𝑖𝑗) J EAM pair-interaction potential
Fi(ρi) J EAM embedding energy
𝜂𝑖𝑀𝑖𝑠𝑒𝑠 - Local atomic strain
τy Pa Shear yield stress
τ0 Pa Shear stress under zero stress normal to shear
displacement
σn Pa Stress normal to shear displacement

xv
List of Appendices
Appendix A: Development of the BMG component for vibrational testing for Gedex Inc. …... 85
Appendix B: Python script for calculating fraction of Voronoi polyhedra from multiple cfg dump
files. …………………………...……………………………………………………...………… 95
1
Chapter 1
1. Introduction
1.1. Background
Metallic glasses (MGs) are amorphous alloys that do not possess long range ordered arrangement
of atoms as their crystalline counterparts do. Such a disordered array is obtained when the high
temperature melt is quenched at an ultra-high cooling rate, leaving no time for the atoms to settle
into a periodic structure. Rather, the atoms freeze in a supercooled liquid state giving rise to a
unique glass-like atomic structure with randomly packed clusters of atoms. This random atomic
arrangement is devoid of the crystalline line defects such as dislocations and grain boundaries, and
is the reason that most metallic glasses usually exhibit high strength, high young’s modulus, high
elastic strain limits, and high resistance to corrosion and wear. The first reported metallic glass
was an alloy, Au75Si25, produced at Caltech by Klement et al. in 1960 [1], but with dimensions
limited to ~10 microns, as governed by the high cooling rate requirement of ~106 K/s. The early
research on bulk metallic glasses (BMGs) was focussed on finding new alloy compositions that
can be formed into amorphous structures at lower critical cooling rates, thereby facilitating
production of components with larger dimensions. As of today, bulk metallic glasses of
multicomponent alloys are being processed with few centimetres in dimension at a cooling rate as
low as 1 K/s [2]. These bulk metallic glasses present tremendous prospects to be used as structural
components with applications in magnetic cores, golf clubs and biological implants, and other
applications that exploit their large strength & elastic strain limits.
1.1.1. Formation of Metallic Glasses
In general, when a liquid melt is cooled to below its melting point, the atoms settle down into the
lowest energy and thermodynamically favorable crystalline state. But when the melt is cooled
down at very high quench rates, there is no time for such atomic rearrangements to take place and
the liquid freezes into a non-equilibrium solid state bypassing crystal formation. This process can
2
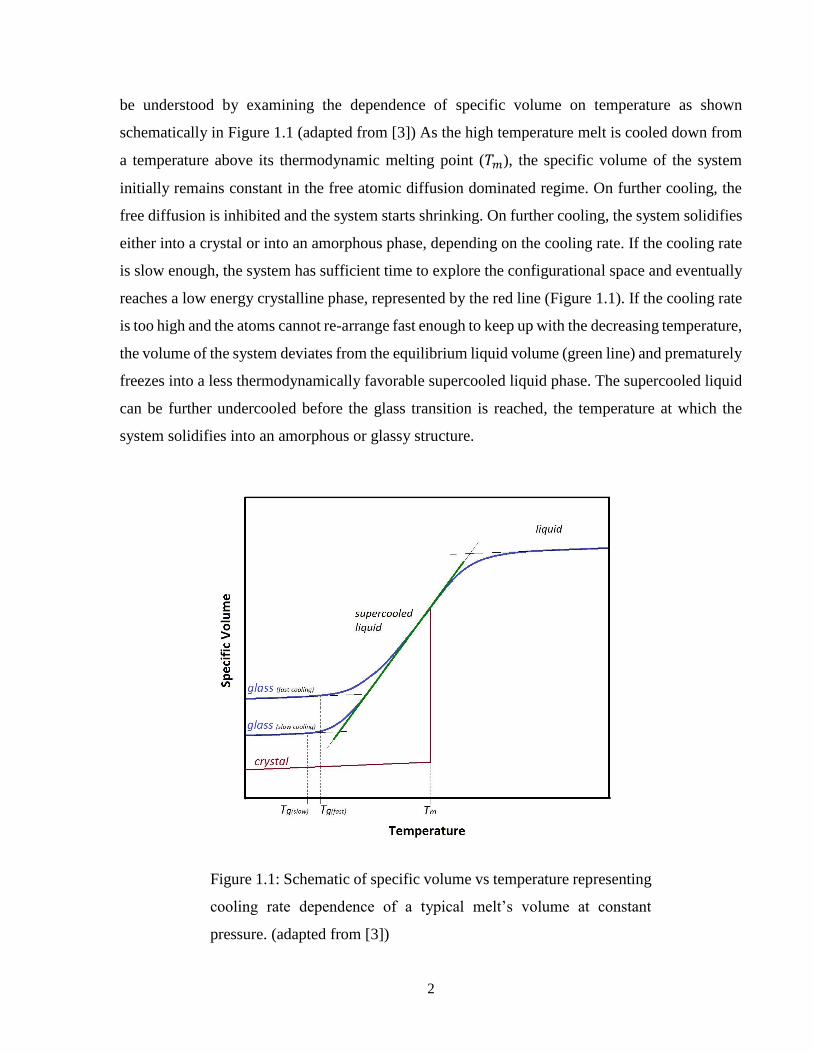
be understood by examining the dependence of specific volume on temperature as shown
schematically in Figure 1.1 (adapted from [3]) As the high temperature melt is cooled down from
a temperature above its thermodynamic melting point (𝑇𝑚), the specific volume of the system
initially remains constant in the free atomic diffusion dominated regime. On further cooling, the
free diffusion is inhibited and the system starts shrinking. On further cooling, the system solidifies
either into a crystal or into an amorphous phase, depending on the cooling rate. If the cooling rate
is slow enough, the system has sufficient time to explore the configurational space and eventually
reaches a low energy crystalline phase, represented by the red line (Figure 1.1). If the cooling rate
is too high and the atoms cannot re-arrange fast enough to keep up with the decreasing temperature,
the volume of the system deviates from the equilibrium liquid volume (green line) and prematurely
freezes into a less thermodynamically favorable supercooled liquid phase. The supercooled liquid
can be further undercooled before the glass transition is reached, the temperature at which the
system solidifies into an amorphous or glassy structure.
Figure 1.1: Schematic of specific volume vs temperature representing
cooling rate dependence of a typical melt’s volume at constant
pressure. (adapted from [3])

3
The process of glass formation can also be understood as a competition between internal structural
relaxation via atomic diffusion and the observable timescale of temperature drop as governed by
the rate at which the system is quenched. With a decrease in temperature, the dynamics of the
system slowdown which can be expressed in terms of an increase in the viscosity (η). This increase
in viscosity dampens the atomic diffusion responsible for structural relaxation and the temperature
at which the structural relaxation times become comparable to the experimental timescales is
known as glass transition temperature (𝑇𝑔). Conventionally, it is defined as the temperature at
which the viscosity value equals 1012 Pa-s [4], which is the standard rheological definition of glass
transition. This condition will be met more quickly for a system that is cooled at a higher quench
rate. Therefore, the more rapidly quenched systems have a higher glass transition temperature as
depicted in figure 1.1.
The structural relaxation times vary for different alloy compositions and so does their requirement
of critical cooling rate to suppress crystallization and form metallic glasses. The discovery of new
compositions with good glass forming ability (GFA), i.e. their ability to form fully amorphous
structures at low critical cooling rates, has been the most active area of research in this field.
Moreover, the prediction of glass formation, the connection of GFA with thermodynamic, kinetic
and structural properties of melt domain and underlying equilibrium crystalline phases has been at
the heart of research on metallic glasses ever since the synthesis of first amorphous alloy in 1960.
Among the well-known criteria for identifying and predicting good glass forming systems are
Inoue’s empirical rules [5]. Alloys comprising multiple component species, usually four or more,
tend to form good glasses since with increased complexity and larger lattice constant of the crystal
unit cell, forming an ordered structure over long range gives no energetic advantage over the
periodic interactions [6, 7]. The systems with atomic radius mismatch greater than 12% between
the constituent elements show higher packing efficiency in liquid states and thus make good glass
formers via the ‘confusion principle’. The atomic size mismatch is also of structural importance in
metallic glasses as certain size ratios are preferred by metallic glasses for forming clustered
structures with distinct solute and solvent atoms [8]. The systems with negative heat of mixing
between the constituents also make good glass formers as the increase in the energy barrier at the
liquid-solid interface inhibits atomic diffusion and suppresses the crystal nucleation rate. The alloy
compositions close to deep eutectics have good GFA due to the ease of supercooling.
Understanding the factors promoting slow crystallization and decreased critical cooling rate has

4
permitted significant advancements in the fabrication of bulk metallic glass components with
higher critical casting thickness over the last few decades. Figure 1.2 summarizes the progress in
critical casting thickness of successfully cast fully amorphous alloys, taken from [7].
Despite these advancements, the understanding of the fundamental science behind predicting and
tuning glass forming ability is still inexact. The general applicability of the identified predictive
GFA indicators is still poor and a concise understanding of compositional tuning of GFA is yet to
be established.
1.1.2. Atomic Structure of Metallic Glasses
The structure of every metallic glass is unique and establishing a common understanding across
different compositionally based glasses is a long standing challenge in the field of metallic glass
research. Metallic glasses have no long range translational or orientation atomic order, however,
the presence of a significant short range chemical order (CSRO) as well as medium range order
Figure 1.2: Progress in critical casting thickness of BMG in the past 5 decades (from [7])

5
(MRO) to some extent has been predicted by some theoretical studies [9-13], supported by some
experimental investigations [14, 15]. The first theoretical model to describe the structure of MGs
was put forward by Bernal [16] based on the dense atomic packing of hard spheres in the respective
atomic size ratios. Although it reasonably described the structure of glasses with comparable
atomic radii of the constituents, it failed to capture the structure of multicomponent MGs with
significant differences in atomic radii of the comprising elements. One of the seminal works is of
Miracle [8], who proposed a new model describing the structure comprised of interpenetrating
icosahedral clusters arising from the fact that the structure of the resultant glass should closely
resemble the structure of its supercooled liquid state, as proposed by Frank [17]. The presence of
a high fraction of icosahedral clusters in some MGs has been confirmed by recent simulations and
experiments, however, large numbers of other dominant atomic clusters have also been found.
Current understanding of the structure of MGs is based on the work of Sheng et al. [10], which
concludes that MGs are made of a variety of atomic clusters having different coordination numbers
varying around an average value. Based on the atomic size ratio, some of these clusters are locally
preferred and have high packing density and resist atomic diffusion thereby promoting glass
formation. Voronoi polyhedra [18] are widely used and accepted to describe these local atomic
clusters and their corresponding coordination numbers in metallic glasses as discussed in detail in
chapter 2.
In the Cu-Zr metallic glass system in this work, the Voronoi polyhedra with five-edged faces are
dominant cluster types. The dominant cluster type changes with a change in the average
coordination number as the atomic percent of Cu varies from Zr rich to Cu rich compositions. The
packing around Cu has been found to be more regular and the fraction dominant Cu-centered
clusters approaches 80%, and also the changes in the fraction of these clusters with respect to
composition and quench rate is much more significant as compared to changes in dominant Zr-
centered clusters [12]. Thus, the structure of Cu-Zr MGs has been examined from the perspective
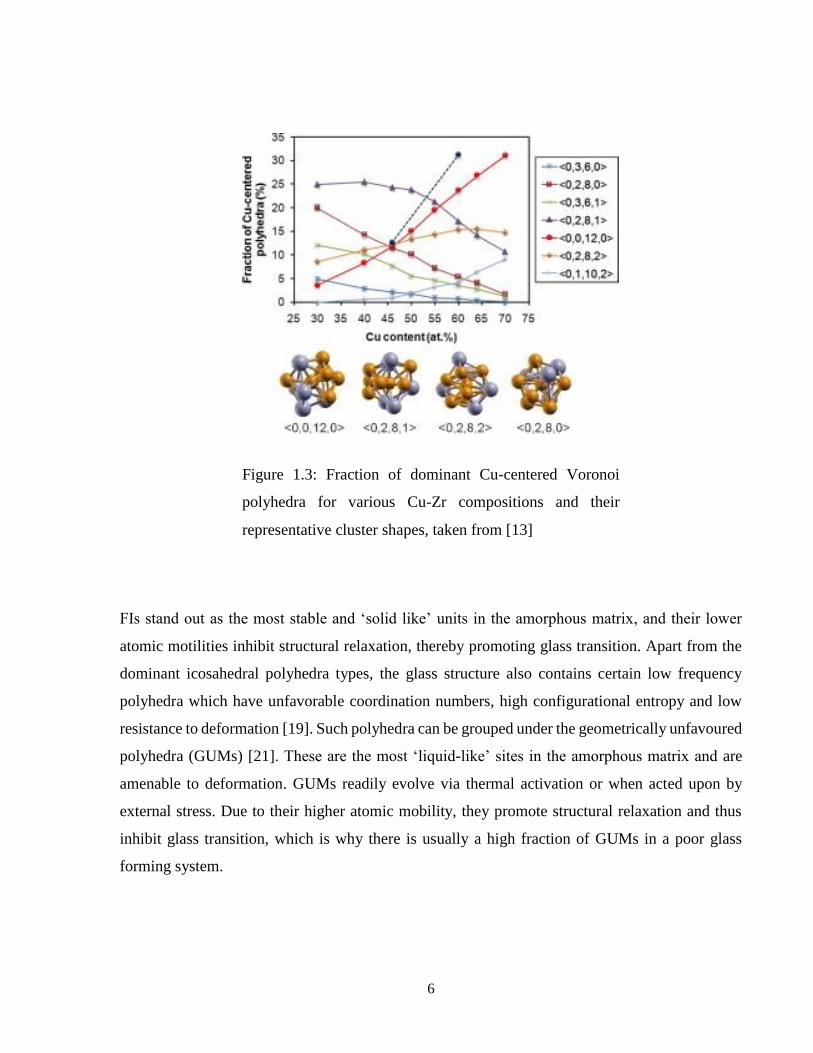
of Cu-centered clusters in various simulations and experimental studies [10-14,18]. Figure 1.5
from [12] depicts the fraction of dominant Voronoi cluster types for various Cu-Zr compositions.
Among all the dominant cluster types, the <0,0,12,0> or Full Icosahedra (FI) has the most preferred
atomic arrangement with high packing density, low configurational entropy, and high resistance
to deformation and atomic diffusion. [13, 19, 20]. Also, a high fraction of FI in the structure has
been found to correlate with good glass forming compositions.
6
FIs stand out as the most stable and ‘solid like’ units in the amorphous matrix, and their lower
atomic motilities inhibit structural relaxation, thereby promoting glass transition. Apart from the
dominant icosahedral polyhedra types, the glass structure also contains certain low frequency
polyhedra which have unfavorable coordination numbers, high configurational entropy and low
resistance to deformation [19]. Such polyhedra can be grouped under the geometrically unfavoured
polyhedra (GUMs) [21]. These are the most ‘liquid-like’ sites in the amorphous matrix and are
amenable to deformation. GUMs readily evolve via thermal activation or when acted upon by
external stress. Due to their higher atomic mobility, they promote structural relaxation and thus
inhibit glass transition, which is why there is usually a high fraction of GUMs in a poor glass
forming system.
Figure 1.3: Fraction of dominant Cu-centered Voronoi
polyhedra for various Cu-Zr compositions and their
representative cluster shapes, taken from [13]
7
1.1.3. Mechanical Properties and Deformation Mechanisms
Conventional metals or alloys solidify into their lowest energy equilibrium phase in a crystalline
lattice with a well-defined and ordered arrangement of atoms. Most metallic alloys are
polycrystalline, that means they are made up of crystalline grains of varied shapes, sizes and
orientations. The boundaries between these grains can serve as inherent weak spots in the material
and can act as the nucleation sites for dislocations and cracks, thereby reducing the actual strength
of the bulk material well below the theoretical maximum strength that a single crystal may possess.
In contrast, metallic glasses solidify as a randomly ordered densely packed supercooled liquid
devoid of such crystalline line and planar defects. The dislocation type displacement of atoms is
hindered in the densely packed amorphous structure, thereby enhancing the elasticity. As a result,
the MGs possess high strength, close to the theoretical maximum, high toughness, high elastic
stain limit and high Young’s modulus [22]. Corrosion and wear can also start at the grain
boundaries of polycrystalline materials and the absence of grain boundaries results in MGs
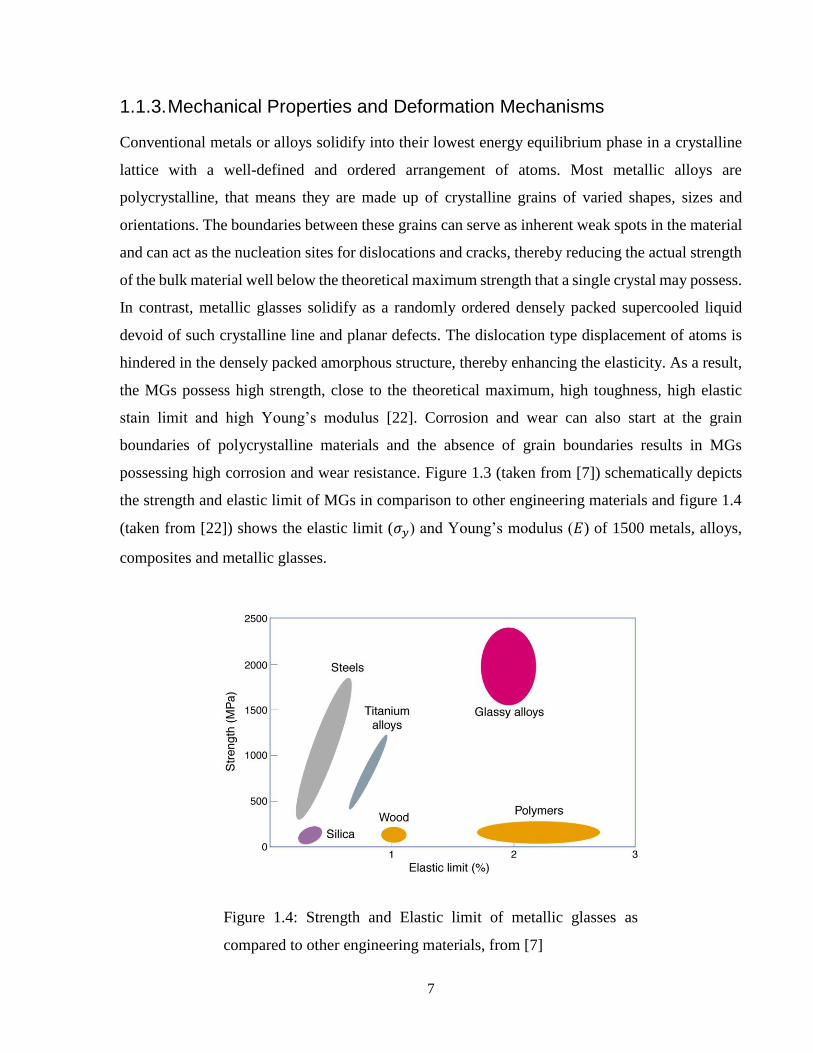
possessing high corrosion and wear resistance. Figure 1.3 (taken from [7]) schematically depicts
the strength and elastic limit of MGs in comparison to other engineering materials and figure 1.4
(taken from [22]) shows the elastic limit (𝜎𝑦) and Young’s modulus (𝐸) of 1500 metals, alloys,
composites and metallic glasses.
Figure 1.4: Strength and Elastic limit of metallic glasses as
compared to other engineering materials, from [7]

8
Despite having many desirable material properties, one limitation that is inhibiting the widespread
use of MGs as structural materials is their very poor plastic strain limits. MGs are typically brittle
at room temperature and exhibit poor fracture toughness and fatigue resistance. A large number of
studies are currently directed towards increasing their ductility or toughness. A clear understanding
of atomic level phenomenon linked to toughness and ductility is required. The deformations
mechanisms in crystalline materials are well established, however, because of their disordered
atomic arrangements, the underlying mechanisms of elastic and plastic deformation in metallic
glasses are not fully resolved yet and have attracted a large number of scientific studies over the
past 20 years. One of the characteristic plastic deformation mechanism is investigated in this work
(Chapter 4) in conjunction with the underlying short range structural origins.
The common deformation mechanisms of crystalline materials involving dislocation motion do
not apply to metallic glasses. Current understanding of bulk metallic glass failure is largely limited
Figure 1.5: Comparison of elastic limit and Young’s modulus of 1507 materials from [9].

9
to two atomic scale mechanisms: the deformation induced dilation or free volume regions through
atomic rearrangements [23], and the cooperative shearing of atoms via activation of shear
transformation zones resulting in an auto-catalytic cascade of shear bands [24]. Under the context
of free volume theory, the total volume of metallic glasses can be separated into two regions: dense
atomic clusters exhibiting short range order, and free volume regions in between with loosely
packed atoms due to packing frustrations [25]. At room temperature, bulk metallic glasses have
been shown to predominately fail according to the deformation of highly localized shear
transformation zones (with fracture resulting from sudden propagation into shear bands), however,
at higher temperatures and under quasi-static/static, tensile-tensile and compression-compression
cyclic loading, deformation is visco-elastic in nature. It is postulated that the greater mobility of
loosely-held free volume zone atoms give rise to enhanced viscoelasticity. In the elastic regime,
atomic clusters deform elastically, while free-volume regions behave like supercooled liquids.
Since these loosely bound atoms exhibit less coupling to the surrounding matrix, inelastic atomic
rearrangements in these regions are possible without resulting in significant structural change in
the surrounding matrix. These considerations make free-volume regions an important factor when
considering structural instabilities caused by either temperature or applied stresses [25].
Current theories regarding the low temperature and spontaneous deformation of amorphous
materials view the shear transformation zone (STZs) to be the fundamental unit of plasticity. The
shear transformation zone consists of a small cluster of randomly packed atoms that spontaneously
and cooperatively reorganize under an applied shear stress. Generally, these shear transformation
zones are thought to activate near free volume regions
through an applied shear stress of sufficient magnitude
[25]. Eventually, stress concentration as a result of the
localized distortion of the surrounding material
(pushing apart of surrounding atoms along activation
paths) triggers an auto-catalytic formation of large
planar shear bands [26].
Interestingly, in contrast to crystalline/ordered metals which exhibit symmetric yield criteria
(Tresca and von Mises predict equal yield stresses in both tension and compression), metallic
glasses display asymmetric yield behavior, with yields in tension being lower than compression.
Through molecular dynamics simulations, it has been shown that this asymmetric yield criteria is
Figure 1.6: Simplistic depiction of STZ
activation, taken from [26]

10
directly related to the dependency of shear transformation zone activation energies on the applied
normal stress [26]. Simulations have also used this notion to adequately explain the Mohr-
Coulomb criteria in BMGs, which depends on the applied shear, 𝜏𝑦, as well as the applied stress
normal to the shear displacement, σ𝑛.
𝝉𝒚 = 𝝉𝟎 − 𝛂𝛔𝒏 (1. 1)
where 𝜏𝑦 is the effective shear yield stress, 𝜏0 is the shear yield under zero stress normal to the
shear displacement, and α is a system specific coefficient that controls the strength of the normal
stress effect [26, 27].
By extending the models of Spaepen and Argon [23,24] along with the cooperative shearing model
of Johnson and Samwer [28], Falk and Langer [29] developed a dynamic model of shear
transformation zones that states that plastic deformation in MGs is caused by multiple shear events
and yielding occurs when a critical fraction of STZs leads to global instability. It is widely accepted
that plastic deformation occurs in MGs when critical numbers of STZs combine to form a major
shear band, however, the sites at which STZs nucleate and how one shear transformation event
leads to formation of a major shear band is still not fully resolved.
1.2. Thesis Motivation
Gedex Inc., the industry partner funding and supporting this project is currently in the process of
building a next generation Airborne Gravity Gradiometer (AAG) which can potentially
revolutionize t mining and mineral exploration techniques. The superior mechanical and magnetic
properties including low loss coefficient exhibited by BMGs at room temperatures has attracted
particular interest from them, as they are looking to replace the current pivot-flexure part of an
Orthogonal Quadrupole Responder (OQR) with a BMG component. The objective of this thesis is
the development of theoretical and simulation models that can predict the glass forming ability,
test the mechanical and vibrational properties, and eventually aid in developing a BMG component
suited for this application.

11
Since the atomic structure and kinetics of glass formation is unique for each glass forming system,
establishing a general understanding and prediction of glass forming ability has been very difficult.
The current predictive indicators of GFA lack robustness as to their general applicability and are
often limited to a particular alloy system or sometimes only within a particular compositional
domain. The ability of a system to form a fully amorphous structure is highly sensitive to the
atomic composition as deviations of even 1 atomic percent in the constituents forming the glass
may dramatically affect the glass forming ability. The fine compositional sensitivity, in
conjunction with the vast compositional spaces inherent to multi-component amorphous alloys,
make the experimental tuning and optimization of material properties a very taxing process. With
the advent of large supercomputing facilities and efficient molecular dynamics (MD) techniques,
computational materials engineering and discovery has become an important supplement to
experimental exploration. In particular, the calculation of liquid, supercooled, and glassy phase
properties over vast temperature and compositional domains is currently feasible utilizing MD
simulations. The investigation of kinetic, thermodynamic and structural properties in melt and
supercooled domain may reveal their interdependencies and can be used for compositional tuning
of GFA.
Serrated flow, a characteristic plastic deformation behaviour, enhances plasticity of a BMG sample
and its fundamental understanding is vital in order to formulate new approaches for designing
future BMG materials with superior ductility. Despite the overwhelming interest and extensive
experimental investigation, a comprehensive treatment of the atomistic mechanism of serration
events and effect of various parameters on serration behaviour from a simulation perspective is yet
to be undertaken. The underlying mechanisms behind serration events are not fully resolved. For
instance, it is not fully clear which atoms participate in plastic slips that lead to stress drops. Also,
the details of atomic rearrangements needed to cause such stress drop and burst events have not
been investigated so far. Furthermore, what parameters control the size of the slip avalanche and
magnitude of the stress drop and how? Such questions still remain and need to be addressed.
Notably, the processes transpiring at the atomic scale such as shuffling of atoms into a STZs or
slipping of a group of atoms occur at short time and length scales and thus are difficult to
experimentally study but are now within the reach of molecular dynamics (MD) investigation,
which can yield atomistic details of the underlying phenomena.

12
1.3. Thesis Objectives
In order to formulate new design strategies for developing future BMGs with improved glass
forming ability and enhanced ductility, it is imperative to understand the fundamentals of GFA
and plastic deformation mechanisms. To this end, the objectives of this thesis are as follows:
1. Investigate emergent properties and connections to glass forming ability in Cu-Zr alloy
system:
Calculation of kinetic, thermodynamic and structural properties in melt and
supercooled domain over broad Cu-Zr compositional space using molecular
dynamics simulations.
Explore connections and interdependencies between calculated properties and glass
forming ability.
Investigate the efficacy of key predictive GFA indicators and explore new GFA
indicators applicable to Cu-Zr alloy system.
2. Investigate plastic deformation mechanisms in Cu-Zr metallic glasses:
Uncover the atomic level structural changes responsible for stress drop and rise
events observed during BMG deformation, the behavior known as serrations
events.
Evaluate the effect of main operating parameters such as strain, strain-rate and
operating temperature on the serration behaviour.
Investigate serration behavior of various Cu-Zr compositions and its connections
to compositional tuning of ductility.
3. Aid in the development of the BMG component for vibrational testing for Gedex:
Iterative finite element modeling and vibrational analysis.

13
1.4. Thesis Organization
The background and basic literature of bulk metallic glasses is covered in Chapter 1. Specifically,
the fundamental theory of glass formation, the structure of metallic glasses, and mechanical
properties and deformation mechanisms have been explained along-with the past and current
advancements in the literature; and specific objectives for this thesis are outlined as above. Chapter
2 describes the computational methodology used in this work, along with simulation details and
approaches used for calculation of various properties. Chapter 3 begins with a literature review
on the key GFA indicators currently in use and provides a detailed analysis of atomic transport
properties, bulk stiffness and elasticity, and short range and medium range structural properties in
supercooled domain. This chapter focuses on exploring interdependencies of these properties
with those in the melt domain and their connections to glass forming ability for the Cu-Zr
compositional space. The applicability of some existing GFA indicators is also tested and some
new GFA indicators are advocated. Similarly, Chapter 4 begins with the current literature on
serration behavior followed by a comprehensive investigation of this phenomenon during plastic
deformation of Cu-Zr metallic glass systems. The atomic level structural origins of serrated flow
are uncovered and the effect of various parameters on serration behavior is investigated. Chapter
5 presents a summary of the overall contributions of the work and outlines the avenues for future
research.

14
Chapter 2
2. Computational Methodology
2.1. Molecular Dynamics
Molecular Dynamics (MD) is a computer simulation tool to study the dynamic evolution of an
ensemble of interacting atoms by integrating the Newtonian equation of motion of each atom. The
interactions between the atoms are described by interatomic potentials. MD follows the laws of
classical mechanics. For a system of N atoms, the force acting on each atom is given by:
𝑭𝒊(𝒓𝒊⃗⃗ ⃗) = 𝒎𝒊𝒂𝒊⃗⃗ ⃗ (2. 1)
where, 𝐹𝑖 is the force acting on ith atom due to its interactions with other atoms, 𝑚𝑖 is the atomic
mass and 𝑎𝑖⃗⃗ ⃗ = 𝑑2
𝑟𝑖⃗⃗⃗⃗
𝑑𝑡2 is the acceleration of the atom.
In its simplistic form, the basic MD algorithm works by first initializing a system of atoms with a
given set of atomic positons 𝑟𝑖 and momenta 𝑝𝑖. The interatomic force is then calculated by taking
the gradient of interatomic potential, 𝑉(𝑟𝑖⃗⃗ )
𝑭𝒊(𝒓𝒊⃗⃗ ⃗) = −𝛁𝒊𝑽(𝒓𝒊⃗⃗ ⃗) (2. 2)
that leads to:
𝒎𝒊
𝒅𝟐𝒓𝒊
𝒅𝒕𝟐= −𝛁𝒊𝑽(𝒓𝒊⃗⃗ ⃗) (2. 3)
By integrating equation 2.3 over a short interval of time δt, new atomic positions and momenta are
obtained, which can be plugged back into equation 2.2 for another iteration. The algorithm thus
numerically calculates the trajectories of all atoms in 6N-dimentional space (3N positions and 3N
momenta) [30]. The atomic forces are assumed to be constant for one integration time-step. The
integration time-step is carefully chosen to capture the shortest time-scale phenomenon of

15
relevance in the study. The desired properties of interest are calculated from the atomic trajectories
by averaging over all the atoms in the system and over time of the simulation according to a
particular statistical ensemble. A flowchart illustrating a general algorithm of MD is presented in
figure 2.1.
The molecular dynamics simulations carried out in this work were conducted by using the Large-
scale Atomic/Molecular Massively Parallel Simulator (LAMMPS) [31]. It is available as an open
source software. LAMMPS can run on parallel processors on large computer clusters by using
spatial decomposition of the simulation domain, thereby enabling MD simulations of multi-million
atom systems.
2.1.1. Interatomic Potential
Interatomic potential describes the interaction between atoms of a system in terms of potential
energy as a function of atomic positions. It is the most important input in a MD calculation and
the results are as good or as bad as the accuracy of data describing the interatomic potential. The
choice of interatomic potential depends on a number of factors such as the type of system under
Figure 2.1: Flowchart of basic MD algorithm

16
study – metallic/non-metallic, the properties to be calculated, the loads and boundary conditions
etc. In this study, Embedded Atom Method (EAM) interatomic potentials developed by Mendelev
[32] are used to simulate the Cu-Zr binary alloys. EAM potentials are empirically derived by first
principle methods and they describe the interatomic interactions for metallic systems with better
accuracy than pair potentials. The columbic interactions between atoms in metallic systems are
considered long-range extending up-to 8-12 atoms and thus many-atom effects need to be included
to accurately describe the atomic interactions. To capture the electronic effects, embedded atom
method considers the electron density at a given site as one of the parameters [33]. Accordingly,
the mathematical form of the total potential energy in EAM potential is expressed as:
𝑽𝑬𝑨𝑴 =𝟏
𝟐∑𝑽𝒊𝒋(𝒓𝒊𝒋)
𝒊≠𝒋
+ ∑𝑭𝒊(𝝆𝒊)
𝒊
(2. 4)
The first term represents the sum of all atom-atom unique pair interactions in the system, where
𝑽𝒊𝒋(𝒓𝒊𝒋) is the pair interaction potential between atom i and atom j, expressed as a function of the
separation between them, (𝒓𝒊𝒋), without any double counting (hence divide by 2). The second
term, 𝑭𝒊(𝝆𝒊) is the embedding energy function. The electron density at site i, and is given by the
linear superposition of valence electron clouds from all other atoms by [33]:
𝝆𝒊 = 𝟏
𝟐∑ 𝝆𝒋(𝒓𝒊𝒋)
𝒋(≠𝒊)
(2. 5)
The total potential energy is thus calculated as a sum of pair potential energies and the embedding
energies calculated from the electron densities at various sites, per equation 2.5. The potential used
in this work has been well validated [32, 34] for simulating the structure and mechanical properties
of Cu-Zr amorphous alloys, which justifies its selection.
2.2. Model Generation
The generation of metallic glass samples was conducted by simulating the experimental process
of glass formation through melting and quenching, using an automated tool developed by Sedighi
[3]. A schematic overview of the process is represented in figure 2.2, taken from [3].

17
Since a Cu-Zr intermetallic forms an alternating Cu/Zr centered BCC structure, atoms are
randomly filled in a simulation box according to a BCC crystal lattice in the required atomic ratios
stipulated by the desired Cu-Zr composition. The simulation box is initially relaxed at 300K and
brought down to the minimum energy state. The relaxation stage is followed by heating the system
from 300K to a temperature well above the melting point of the composition of interest, usually
2100K-2300K. The high temperature melt is relaxed to ensure proper mixing and equilibration
and elimination of any associated crystalline history. The standard thermodynamic observables
such as specific volume and per atom potential energy are closely monitored throughout the melt
and relaxation stage. Afterwards, the system is rapidly quenched in stages of quench and hold in
25K steps, down to a temperature as low as 1K. NPT Nose-Hoover temperature and pressure
controls were enforced to maintain the zero pressure isobaric condition throughout the quench
process. The average linear cooling rate was maintained at least 0.1K/picosecond for samples
prepare in both the studies. The property extraction was conducted by carrying out additional runs
by using NPT/NVT and NVE ensembles, as required. The particular details regarding the number
of atoms, duration of relaxation and duration of quench and hold processes are presented in
individual studies in Chapter 3 and 4.
Figure 2.2: Schematic representation of simulation process for metallic glass formation, from [3]

18
2.3. Property Extraction and Calculation Methodology
2.3.1. Atomic Transport and Kinetic Properties
The calculation of atomic diffusivities and shear viscosities were performed by using equilibrium
Green-Kubo methods over the temperature range of 1.2 − 1.8𝑇𝑔. The atomic diffusivities are
directly related to the velocity autocorrelation function as [3, 35]:
𝑫 = 𝟏
𝟑 ∫ < 𝒗(𝒕 + 𝒕′). 𝒗(𝒕) > 𝒅𝒕′
∞
𝟎
(2. 6)
Where, D is the atomic diffusivity, v is the velocity vector of each atom, t is the initial of reference
time and t+t’ is the final time at which velocity autocorrelation function decays to zero.
The velocity power spectral density, as a function of frequency, 𝝎, can be expressed as:
𝑷(𝝎) = ∫ < 𝒗(𝒕 + 𝒕′). 𝒗(𝒕) > 𝒆−𝟐𝒊𝝅(𝝎) 𝒅𝒕′∞
−∞
(2. 7)
For 𝜔 = 0, the zero frequency power spectral density becomes:
𝑷(𝟎) = ∫ < 𝒗(𝒕 + 𝒕′). 𝒗(𝒕) > 𝒆−𝟐𝒊𝝅(𝟎) 𝒅𝒕′∞
−∞
= 2 ∫ < 𝑣(𝑡 + 𝑡′). 𝑣(𝑡) > 𝑑𝑡′∞
0
= 2𝐷
⇒ 𝑫 =𝑷(𝟎)
𝟐 (2. 8)
where 𝑃(0) is the zero frequency velocity power spectral density. The convergence in the
diffusivities was obtained by an initial relaxation run of 0.4 ns, followed by a velocity sampling
run of 65 ps under NVT conditions.
Viscosity (𝜂) is calculated by calculating the stress autocorrelation functions < 𝑃𝛼𝛽(𝑡)𝑃𝛼𝛽(0) >
and then using the direct relation [36]:

19
𝜼 = 𝑽
𝒌𝑩𝑻 ∫ ∑ < 𝑷𝜶𝜷(𝒕)𝑷𝜶𝜷(𝟎) > 𝒅𝒕
𝜶𝜷
∞
𝟎
(2. 9)
Where, V and T are the system volume and temperature respectively, kB is the Boltzmann’s
constant and 𝑃𝛼𝛽 is the symmetrized traceless portion of the stress tensor 𝜎𝛼𝛽, expressed as [37]:
𝑷𝜶,𝜷 = 𝟏
𝟐 (𝝈𝜶𝜷 + 𝝈𝜷𝜶) −
𝟏
𝟑 𝜹𝜶𝜷 (∑ 𝝈𝒚𝒚
𝒚) (2. 10)
and the subscript denotes the tensor element. Simulations were carried out ranging from 2 ns – 5
ns using a 2 fs time-step with sampling times at least 50 times greater than the relaxation times to
obtain sufficient convergence of stress autocorrelation functions.
The strength parameter 𝐷∗ was calculated by fitting viscosity data to the standard VFT form:
𝜼(𝑻) = 𝜼𝟎𝐞𝐱𝐩(𝑫∗𝑻𝟎
(𝑻 − 𝑻𝟎)) (2. 11)
where 𝜂0 is the high temperature viscosity limit and 𝑇0 is the divergent temperature. The strength
parameter is a common fragility metric with larger 𝐷∗ indicative of higher strength glasses. The
inverse of 𝐷∗ serves as a quantitative metric for the melt fragility and strongly correlates with the
Angell kinetic fragility parameter, 𝑚, expressed as:
𝒎 = (𝝏𝒍𝒐𝒈𝟏𝟎𝜼(𝑻)
𝝏(𝑻𝒈/𝑻))
𝑻= 𝑻𝒈
= 𝑻𝒈𝑫
∗𝑻𝟎
𝐥𝐨𝐠 (𝟏𝟎)
𝟏
(𝑻𝒈 − 𝑻𝟎)𝟐 (2. 12)
2.3.2. Thermodynamic and Bulk Stiffness Properties
The 2PT method of Lin, Blanco and Goddard [35, 38] is used to calculate entropies, free energies
and other thermodynamic properties. The phase equilibrium condition of the Gibbs free energy
𝜇𝑙(𝑇𝑚) = 𝜇𝑐(𝑇𝑚) was used to calculate the melting points (𝑇𝑚). Glass transition temperatures
(𝑇𝑔) were estimated by the common intersection point of polynomial fits to low temperature and
high temperature enthalpy data [34, 39].

20
Bulk moduli were calculated utilizing isothermal-isobaric (NPT) simulation data under the
standard fluctuations approach, expressed as:
𝜷𝑻 = 𝑩𝑻−𝟏 = −
𝟏
𝑽(𝝏𝑽
𝝏𝑻)𝑻
= 𝟏
𝒌𝑩𝑻 < 𝜹𝑽𝟐 >𝑵𝑷𝑻
< 𝑽 >𝑵𝑷𝑻 (2. 13)
Where βT is the thermodynamic beta or the inverse of bulk modulus (BT), V and T are the system
volume and temperature respectively, kB is the Boltzmann’s constant and the brackets denote the
ensemble average under NPT (constant particle number, pressure and temperature).
2.3.3. Structural Properties
2.3.3.1. Partial Radial Distribution Function (PRDF)
Partial radial distribution function (PRDF) describes the variation of density as a function of
distance from a reference particle (atom). It represents the probability of finding atoms as a
function of distance r from an average center atom. The element specific PRDF is expressed as:
𝒈𝜶𝜷(𝒓) = 𝑵
𝟒𝝅𝒓𝟐𝝆𝑵𝜶𝑵𝜷 ∑∑𝜹(𝒓 − |𝒓𝒊𝒋⃗⃗ ⃗⃗ |)
𝑵
𝒋=𝟏
𝑵
𝒊=𝟏
(2. 14)
where, 𝜌 is the number density of atoms, N is the total number of atoms in the system, 𝑁𝛼/𝛽is the
number of atoms of each type and |𝑟𝑖𝑗⃗⃗ ⃗| is the separation between atom i and j. Standard binning
techniques with bin sizes of 0.1A were used to calculate the PRDF.
2.3.3.2. Structure Factor
The structure factor was calculated from PRDF, as the PRDF is related to the partial structure
factors in the reciprocal space via Fourier transformation, according to [12]:
𝑺𝜶𝜷(𝒒) − 𝟏 = 𝟒𝝅𝝆
𝒒∫ 𝒓[𝒈𝜶𝜷(𝒓) − 𝟏] 𝐬𝐢𝐧(𝒒𝒓)𝒅𝒓
∞
𝒐
(2. 15)

21
Where q is the variable in reciprocal space. The total structure factor is given by the summation of
all partials, as [12]:
𝑺(𝒒) = ∑∑𝒄𝜶𝒄𝜷𝒇𝜶𝒇𝜷
(∑ 𝒄𝜶𝒇𝜶𝜶 )𝟐𝑺𝜶𝜷(𝒒)
𝜷𝜶
(2. 16)
where 𝑐𝛼/𝛽 are the molar fractions of the components and 𝑓𝛼/𝛽 are the atomic scattering factors.
2.3.3.3. Voronoi Analysis
Voronoi analysis is used in this work to analyze the short range order, atomic structure and
coordination number analysis of Cu-Zr metallic glasses. Voronoi tessellation (also known as a
Voronoi diagram, Voronoi decomposition, Voronoi partition, or a Dirichlet tessellation) is a
method of partitioning space into regions about a set of points in space. Each region surrounding
a point consists of the set of all coordinates closer to that point than any other neighbouring points.
In 3-d, these regions form Voronoi polyhedra which can be indexed by a respective Voronoi Index,
< 𝑛𝑜 , 𝑛1, 𝑛2, 𝑛3, 𝑛4, 𝑛5, 𝑛6, … >, where 𝑛𝑖 denotes the number of faces with i edges. Since a face
can have a minimum of 3 edges in 3-D, 𝑛𝑜 , 𝑛1, 𝑛2 are trivially zero. Faces in the conventional
Voronoi tessellation scheme are thus composed of the intersection of perpendicular bisecting
planes, forming the boundaries between neighbouring Voronoi polyhedra. In the case of atomic
mixtures of different radii, a slightly modified scheme known as Radical Voronoi Tessellation is
required to account for the inherent size differences. Instead of forming polyhedral faces simply
through the perpendicular bisectors positioned in between neighbouring atomic centers, radical
Voronoi tessellation scales the position of the faces based on the ratios of atomic radii. An example
of a 3-d radical Voronoi tessellation is shown in Figure 2.3, taken from [12].

22
2.3.3.4. Least Square Local Atomic Strain
In order to visualize, monitor and quantify the deformation process, the local atomic strain was
calculated in this work. The local atomic strain, 𝜂𝑖𝑀𝑖𝑠𝑒𝑠 [40] is the measure of inelastic deformation
and a widely used metric to visualize shear transformations and shear bands in metallic glasses.
𝜂𝑖𝑀𝑖𝑠𝑒𝑠 outputs the atomic strain for a current atomic configuration under analysis, with respect to
a reference atomic configuration. The Lagrangian strain matrix is calculated from a local
transformation matrix, 𝐽𝑖 , as:
𝜼𝒊 =𝟏
𝟐(𝑱𝒊𝑱𝒊
𝑻 − 𝑰) (2. 17)
Where, 𝜼𝒊 is the Lagrangian strain matrix we seek and I is the identity matrix. The local shear
invariant of atom i is then computed as [40]:
𝜼𝒊𝑴𝒊𝒔𝒆𝒔 = √𝜼𝒚𝒛
𝟐 + 𝜼𝒙𝒛𝟐 + 𝜼𝒙𝒚
𝟐 + (𝜼𝒚𝒚 − 𝜼𝒛𝒛)
𝟐+ (𝜼𝒙𝒙 − 𝜼𝒛𝒛)𝟐 + (𝜼𝒙𝒙 − 𝜼𝒛𝒛)𝟐
𝟔 (2. 18)
Figure 2.3: (a) Schematic of a 3D Voronoi tessellation of an atomic structure.
(b) Voronoi Cell/Polyhedra around atom A. (c) Voronoi Polyhedra around
atom A (yellow) with nearest neighbor atoms shown (blue)
23
Chapter 3
3. Emergent Properties and Connections to Glass Forming Ability in the Cu-Zr System
The development of new metallic glass alloys with improved manufacturability and enhanced
properties relies on the fundamental understanding of glass forming ability (GFA) and various
factors affecting it. The zirconium-copper based multicomponent alloys usually exhibit high glass
forming ability, which has made the binary Cu-Zr metallic glass system a premier subject of
experimental and theoretical analysis. Despite the extensive investigation, a robust method
capable of optimizing properties based on the initial alloy composition has yet to be determined.
The absence of detailed knowledge regarding equilibrium/metastable phase diagrams and
associated crystal nucleation/growth pathways in complex alloy systems makes the direct
prediction and optimization of critical cooling rates very challenging. Currently, GFA prediction
and optimization rely on semi-empirical correlations between glass forming ability and a limited
set of disordered phase (liquid and glassy) system properties and parameters. In this chapter, the
fundamental connections between glass forming ability and a host of emergent properties in the
melt domain are demonstrated. The emergent collective dynamics and structural re-ordering
observed upon supercooling a liquid melt were found to govern the physical properties of the
resultant metallic glass. Molecular dynamics simulations of the rapid solidification process in
CuxZr100-x (x=35, 40, 45, 50, 52.5, 55, 57.5, 60, 65, 70, 75, 80, and 85 atomic percent) were
conducted, allowing for a detailed study of the evolution of atomic transport properties, elasticity
and stiffness properties, and chemi-topological order in the Cu-Zr alloy system. The relationships
between the nature and emergence of elasticity and structural rigidity in the deeply undercooled
domain with atomic & viscous transport properties in the high temperature liquid melt are revealed.
The physical properties and short-range order of the deeply undercooled melt displayed strong
signatures of the underlying equilibrium phases. BCC short-range ordering in the disordered phase
had significant influence on atomic transport that corresponded directly with trends in the extent
of dynamic decoupling observed in the supercooled domain. Chemical short-range ordering as
determined by the mean coordination deviation between zirconium and copper atoms were found

24
to be a robust new indicator of glass forming ability. Moreover, the mean atomic volume ratios of
zirconium and copper atoms was found to strongly reflect underlying fragility and transport
property trends. The results of this work demonstrate the underlying inter-dependencies of atomic
transport and fragility, emergent elasticity and structural ordering, and glass forming ability.
3.1. Literature Review
The unique set of mechanical and magnetic properties possessed by amorphous alloys has attracted
a lot of scientific and technological interest during the last few decades. The investigation of key
parameters affecting glass forming ability, as reflected in the structural, thermodynamic and
kinetic properties of liquid melt and supercooled domain, has been the focus of recent research.
How these key factors can be controlled for the compositional tuning of bulk metallic glasses
(BMGs) is being actively researched [41-44]. The definitive work in this area is that of Li et al
[45], who investigated the evolution of percentage of density change upon crystallization over Cu-
Zr compositional domain and demonstrated there is a direct correspondence between density
change and critical casting diameter of the resulting glass. High GFA compositions (Cu64Zr36,
Cu56Zr44 and Cu50Zr50) exhibited minimal density change and this parameter was adopted as a key
GFA indicator, see figure 3.1 adapted from [45].
Figure 3.1: Evolution of density change and critical casting diameter over Cu-Zr compositional
domain, adapted from [45]

25
Low atomic mobility and high viscosity near the glass transition temperature have been identified
as the precursors of a good GFA system. Consistent with this, a strong correlation between melt
fragilities and GFA was revealed by Russew et al [46] by experimental investigation of
dependence of melt fragility on Cu-Zr alloy composition. Low melt fragility coincided with high
GFA composition of Cu64Zr36. Icosahedral Short Range Ordering (ISRO) has also been identified
to play a key role in slowing the liquid state dynamics and stabilizing the supercooled melts. Due
to the higher atomic mobility constraints on the constituent atoms in icosahedra motifs, they are
the most ‘solid-like’ isolated units in the amorphous matrix. Icosahedral coordination in the Full
Icosahedra (FI) and other distorted icosahedra motifs results in highly efficient packing structures
[3], and it has been shown recently [47, 48] icosahedra motifs form large chains of interconnecting
polyhedra, extending well beyond the first nearest neighbors, resulting in slower liquid state
dynamics. High GFA compositions usually exhibit a high fraction of icosahedra ordering and poor
GFA compositions have been found to have high fractions of GUMs.
These correlations serve to quantify key thermodynamic and kinetic factors that govern
crystallization kinetics. Of particular significance for GFA prediction is the separation of liquid
melts into the "fragile" and "strong" categories based on the Angell scaling criteria of viscosities
and relaxation times near the glass transition [49]. Strong melt systems usually demonstrate good
GFA. Such correlations reflect the dependency of both GFA and atomic transport on the
underlying potential energy landscape. A topological (continuous) phase transition is found to
occur in the potential energy landscape at the Mode Coupling temperature, TMC (often lying
somewhere between the Tg and TM of many liquid melts) [50]. A broad array of universal
phenomena occurs near the mode coupling temperature, including the emergence of bulk rigidity,
elasticity, cooperative flow and dynamics, the vanishing of accessible free volume, and dynamic
decoupling8-10. In addition, correlations between melting points (and thus the reduced glass
transition temperature 𝑇𝑟𝑔 = 𝑇𝑔/𝑇𝑚), mode-coupling temperatures, and the temperature onset
of icosahedral and polytetrahedral ordering are found in many glass forming systems10-12.
Advances in GFA prediction and compositional tuning will advance the understanding of
interdependencies and connections that exist between underlying emergent properties in the
supercooled domain.

26
In this work, the evolution of atomic transport properties, bulk stiffness and elasticity, and chemi-
topological ordering along the quench domain are investigated in detail across the broad
compositional space of 35%−85% copper in the binary Cu-Zr alloy system. Connections between
the nature and emergence of elasticity and structural rigidity in the deeply undercooled domain
with atomic and viscous transport properties in the high temperature liquid melt are explored.
Specifically, the interdependencies between chemical ordering and the presence of key short range
topological structures in the deeply undercooled domains and transport properties in the high
temperature melt are investigated. The influence of BCC short range ordering in the disordered
phase on the atomic transport properties and its correlations with dynamic decoupling in the
supercooled domain are outlined. Also, the difference in mean coordination numbers and mean
atomic volume ratios of zirconium and copper atoms are calculated as a measure of chemical short
range ordering and the rationale as an indicator of GFA is presented. The combined results of this
work aid in the deconvolution of underlying interdependencies between atomic transport and
fragility, emergent elasticity and structural ordering, and glass forming ability.
3.2. Computational Methodology and Simulation Details
Metallic glass samples for CuxZr100 − x (x=35, 40, 45, 50, 52.5, 55, 57.5, 60, 65, 70, 75, 80, and 85
atomic %) were prepared using molecular dynamics via the LAMMPS [31] software package. The
inter-atomic interactions were described using the Cu-Zr many-body embedded atom method
(EAM) interatomic potentials developed by Mendelev [32]. The randomly ordered system of 5832
atoms at 300K were first melted to 2200K over a duration of 1 ns. The systems were subsequently
relaxed over 4 ns to allow proper equilibration of liquid melt. This was followed by rapid cooling,
using 25 K quench (0.2 ns) and hold (0.3 ns) stages, corresponding to an average linear cooling
rate of 50 K/ns. The quenching process was regulated by using NPT Nose-Hoover temperature
and pressure controls under 2 fs integration time-steps to apply zero pressure isobaric conditions.
The systems were subsequently relaxed at temperatures of interest to extract relevant data. The
transport, bulk physical and structural properties were calculated by analysis of the collected
simulation data externally in PYTHON [35].
The free volume content was investigated through the calculation of fractional density differences
between the respective phases, (𝜌𝑐 − 𝜌𝑙𝑖𝑞)/𝜌𝑐 , using volumetric data of the crystalline and
amorphous phases. The assessment of the viscous fragility parameter 𝑚, as well as the diffusive

27
and viscous strength parameters 𝐷∗, both of which are common GFA indicators, was done by
sampling viscous and diffusive transport properties along the quenching process. The atomic level
short-range chemical and topological ordering were assessed through radical Voronoi tessellation,
which describes the packing of atoms in terms of coordination number and corresponding
coordination polyhedra[10], over the quench domain. In order to delineate the inherent structure-
property relationship, the evolution of underlying bulk stiffness properties was also investigated.
Glass transition temperatures (𝑇𝑔) were estimated by the common intersection point of polynomial
fits to low temperature and high temperature enthalpy data [34, 35, 51]. Bulk moduli were
calculated utilizing isothermal-isobaric (NPT) simulation data under the standard fluctuations
approach, expressed in equation 2.13.
The calculation of atomic diffusivities and shear viscosities were performed by using equilibrium
Green-Kubo methods (equation 2.6-2.10) over the temperature range of 1.2 − 1.8𝑇𝑔, the details of
which is provided in Property Extraction and Calculation Methodology section.
The structural properties were investigated by analyzing the partial radial distribution function
(PRDF) (equation 2.14) and short-range ordering through the radical Voronoi tessellation.
Standard binning techniques were used to calculate PRDF (𝑔𝛼𝛽). The results were averaged over
32ps in order to improve statistics. Voronoi tessellation decomposes nearest neighbour geometry
into a polyhedra centered around each atomic site. Voronoi tessellation is conducted through the
Voro++ package [52]. System snapshots are taken every 512 time-steps over a sampling duration
of 65ps allowing for improved cluster statistics.
3.3. Results and Discussion
3.3.1. Transport and Kinetic Properties
Viscosity data was calculated in 25K temperature intervals over a temperature range of
1.2 − 1.8𝑇𝑔 and was fitted to the standard VFT form as expressed in equation (2.11).

28
The Angell kinetic fragility parameter was determined according to equation (2.12) for the entire
compositional range studied. It was estimated by interpolating viscosities down to a rheological
glass transition temperature identified by the condition 𝜂(𝑇𝑔) = 2 × 10³𝑃𝑎. 𝑠. Note, the standard
experimental rheological condition is 𝜂(𝑇𝑔) = 1012𝑃𝑎. 𝑠 For details on the rationale for using this
rheological glass transition temperature, see Sedighi et al [35]. The compositional dependencies
of the Angell fragility parameter, 𝑚, and the viscous strength parameter, 𝐷∗, are presented in figure
3.2 and 3.3 below.
Figure 3.2: Angell fragility parameter, 𝒎 estimated from VFT
fits to viscosity data.

29
It is clear from Figures 3.2 and 3.3 that both kinetic parameters vary with composition. The
strength parameter (𝐷∗) has a maximum and the Angell kinetic fragility parameter (𝑚) has a
minimum at about Cu50Zr50, Cu55Zr45 and Cu65Zr35 - reflective of their high glass forming ability.
While the additional peaks/minimum present about other compositions such as Cu40Zr60 illustrate
that strength parameter/melt fragility and atomic transport properties only constitute one of many
influencing factors governing glass forming ability, however, the identification of the top three
GFA compositions (Cu64Zr36, Cu56Zr44 and Cu50Zr50) through the analysis of bulk transport
properties alone is significant. Surprisingly, the Cu50Zr50 system appears substantially less fragile
relative to Cu65Zr35 based on viscous transport property calculations, while the experimental glass
forming ability of the two systems is fairly similar (critical thicknesses of glass formation
determined by Li et al [45] are about 1.15mm, 1.00, and 1.15mm for Cu64Zr36, Cu56Zr44 and
Cu50Zr50 respectively).
For a more complete picture of transport properties, atomic diffusivities were calculated over the
temperature domains as discussed above. At temperatures well above respective mode coupling
temperatures, diffusive and viscous transport properties are expected to be coupled in accordance
with the Stokes-Einstein relation:
Figure 3.3: Strength parameter, 𝑫∗, calculated from VFT fits to
viscosity data

30
𝜼(𝑻) ∝𝑻
𝑫(𝑻) (3. 1)
The calculated diffusivities were fitted to the modified VFT form presented below:
𝑻
𝑫(𝑻)= 𝑨𝒆𝒙𝒑(
𝑫∗𝑻𝟎
(𝑻 − 𝑻𝟎)) (3. 2)
The strength parameter, 𝐷∗, and the divergent temperature, 𝑇0 , extracted from the modified VFT
fit [equation 3.2] are termed as diffusive 𝐷∗and 𝑇0 parameters respectively. Provided dynamics
follow the Stokes-Einstein relation, calculated diffusive 𝐷∗ and 𝑇0 parameters should be identical
to viscous 𝐷∗ and 𝑇0 parameters extracted from viscous VFT fits [equation (2.11)]. The diffusive
strength parameter, 𝐷∗ is presented in figure 3.4. Dynamic decoupling occurred near the onset of
cooperative motion in the deeply undercooled domain and lead to a more abrupt kinetic motion
slowdown in bulk viscous transport properties. This leads to larger viscous 𝐷∗ parameters (lower
perceived fragility), and lower viscous divergence temperatures 𝑇0. The ratio of viscous and
diffusive 𝐷∗ and 𝑇0 parameters are presented in the figures 3.5 and 3.6 as a metric for the extent
of dynamic decoupling.
Figure 3.4: D* parameter calculated from VFT fits to diffusivity data.

31
Figure 3.5: Ratio of diffusive to viscous strength, D* parameter
Figure 3.6: Ratio of viscous to diffusive divergence temperature, T0

32
Examination of the cross-compositional results of the diffusive strength parameter presented in
figure 3.4 showed all compositional peaks identified (including those of Cu40Zr60, Cu55Zr45,
Cu65Zr35, and the minor peak about Cu75Zr25) are consistent with those identified through viscous
strength parameter analysis figure 3.3, with the exception of Cu50Zr50. This low value of diffusive
strength parameter for Cu50Zr50, or in other words, high diffusivity in the melt doamin could be
tied to its the short range atomic order. The development of icosahedra clusters and their
interconnecting networks is argued as the reason for stifled diffusivities in high GFA compositions.
Consistent with these notions, high fraction of full icosahedra clusters is present in Cu55Zr45 and
Cu65Zr35, as evident from Figure 3.12(a), whereas this fraction is reatively lower for Cu50Zr50.
Moreover, the full icosahedra is not even the dominant cluster type in this compositin near Tg [3].
Accordingly, from figures 3.5 and 3.6, Cu50Zr50 is found to exhibit the least deviation between
viscous and diffusive 𝐷∗ and 𝑇0 parameters among all compositions sampled, indicating high
coupling and the presence of highly homogenous dynamics at the atomic level. In contrast,
Cu55Zr45 and Cu65Zr35 are found to exhibit signatures of highly decoupled and heterogeneous
dynamics on the atomic level. These findings suggest that extent of dynamic decoupling lacks the
ability to fully explain the mechanism underlying the high GFA of the Cu50Zr50.
Since there is a strong link between disordered phase free volume content, melt fragility, and glass
forming ability, the amorphous and crystal phase densities were calculated. The amorphous phase
density results (linearly extrapolated down to 0K) obtained in this work and equilibrium crystal
phase density values calculated by Du et. al [53] through ground state DFT simulations of Cu-Zr
intermetallics (Cu, Cu5Zr, Cu51Zr14, Cu8Zr3, Cu2Zr, Cu10Zr7, CuZr, Cu5Zr8, CuZr2, Zr), are presented
in figure 3.7. The calculated density values of the amorphous phases of Cu50Zr50, Cu65Zr35 and
Cu80Zr20 compositions seem to lie very close to the corresponding crystal phase density values.

33
Figure 3.7: Density of CuZr amorphous and respective equilibrium
intermetallic phases. (intermetallic phase data taken from Du et. al [53])
Figure 3.8: Fractional density differences between crystalline and
respective amorphous phases at 0K (intermetallic phase data taken from
Du et. al [53]).

34
To further illustrate this, fractional density differences between crystalline and amorphous phase,
(𝜌𝑐 − 𝜌𝑎)/𝜌𝑎, for all compositions sampled were evaluated and plotted in figure 3.8. In fractional
density difference figure 3.8, clear peaks are evident at Cu50Zr50, Cu65Zr35 and Cu80Zr20
compositions, indicating small density differences between their respective amorphous and
crystalline phases. The similarity of the densities of the two phases suggests that optimal packing
efficiency and low free volume is present in the melt and amorphous phases. The peaks identified
at Cu50Zr50, Cu56.5Zr43.5 and Cu65Zr35 compositions are in good agreement with those
experimentally determined over a compositional domain of 35%−70% Cu by Li et al [45]. They
reported peaks at Cu63.1Zr36.9, Cu56.6Zr43.4 and Cu50.6Zr49.4. and composition. Apart from these
known high GFA compositions, there is also a clear peak present about Cu80Zr20, which is not a
good glass former. Thus the correlation between the amorphous-crystal density difference, melt
fragility, and GFA is not universally true as often claimed. Such correlations seem to work only
within the confines of limited compositional domains and the fractional density change upon
crystallization may not be adopted as a perfect GFA indicator.
3.3.2. Bulk Stiffness and Physical Properties
The bulk moduli 𝐵 = −𝑉 (𝑑𝑃
𝑑𝑉)𝑇
calculated over the temperature range of 0.4 − 1.4𝑇𝑔 for each
composition are presented in figure 3.9. As evident from the figure, the trend of bulk modulus in
amorphous domain (at 0.4 Tg) mimics the trend in icosahedra short range ordering, as presented in
Figure 3.12 (a). To reiterate, icosahedra clusters form the most ‘solid-like’ regions in the
amorphous matrix and contribute to high bulk stifness and rigidity. In the melt domain,
1.0 − 1.3𝑇𝑔, the bulk modulii still follow the trends in icosahedra clusters, however, the incease
in bulk modulii with increase in Cu content is not as rapid and the slope continously decreases
with increase in temperature. . This temperature domain coincides with a peak in second order
thermodynamic properties (heat capacities and thermal expansion coefficients), dynamic
decoupling and mode coupling temperatures, and the emergence of bulk elasticity. Interestingly,
while the Cu50Zr50 composition shows a local peak in bulk modulus near 𝑇𝑔, the other two high
GFA compositions, Cu55Zr45 and Cu65Zr35, show local minima. The same pattern of opposing
behaviour was observed in the diffusive fragilities (figure 3.4) and the extent of dynamic
decoupling (figures 3.5 and 3.6). This suggests that the bulk physical propeties are influenced by
the extent of dynamic decoupling observed on aprroach to the glass transition temperature.

35
The compositional trends for stiffness and elastic properties were investigated using Voronoi
volume time-series data to calculate the atomic level bulk modulus analog. The standard
fluctuations method was used for the calculation of bulk moduli, expressed in equation (2.13). By
using individual atom volume statistics for Cu and Zr atoms, mean atomic volumes and volume
variances were calculated. This allowed the calculation of atomic level bulk modulus analog. The
results of this analysis for 𝑇𝑔 and 1.2𝑇𝑔 are presented below in figure 3.10.
Figure 3.9: Evolution of Bulk Moduli on approach to glass
transition for various Cu-Zr compositions.

36
As seen in Figure 3.10 the compositional trends of atomic bulk moduli at Tg and 1.2 Tg are
consistent with standard bulk moduli trends as in figure 3.9, with a local peak at Cu50Zr50 and local
minimums at Cu55Zr45 and Cu65Zr35.compositions. Another aspect of these results is the presence
of apparent (second order) discontinuities at certain compositions separating otherwise continuous
compositional domains. Interestingly, the compositional trends and locations of said
Figure 3.10: Evolution of Atomic bulk modulus at (a) 1.0Tg and
(b) 1.2Tg for Cu-Zr atomic species
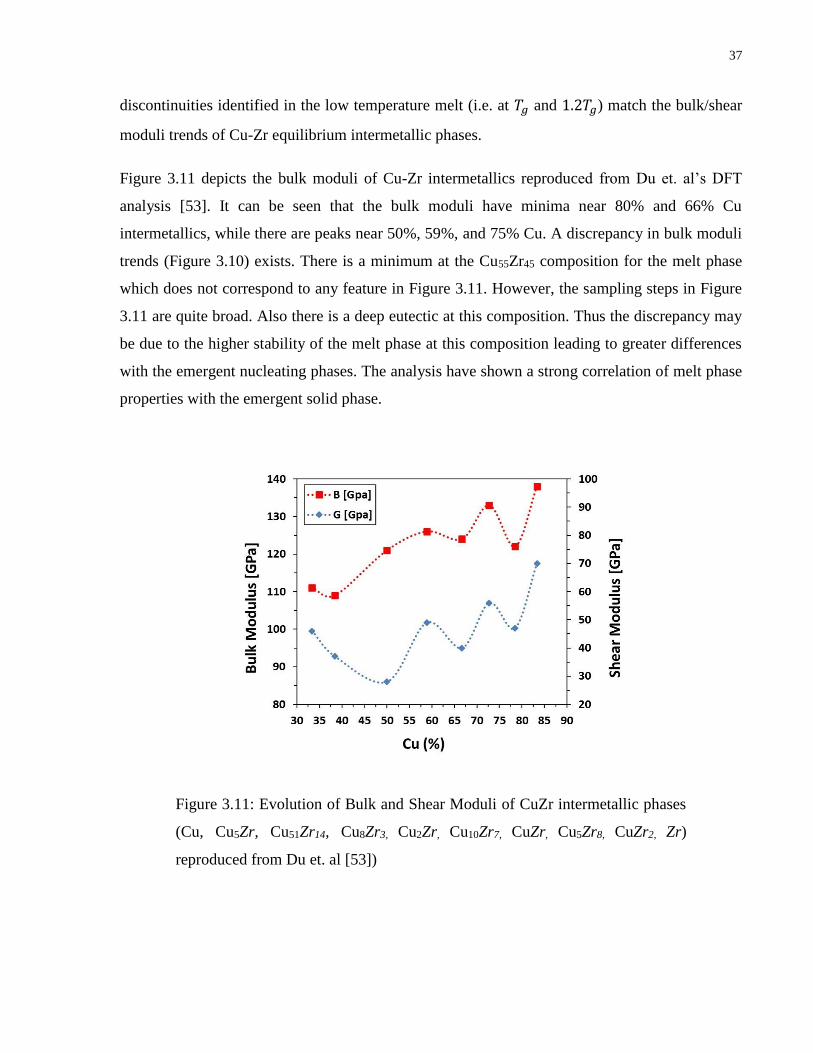
37
discontinuities identified in the low temperature melt (i.e. at 𝑇𝑔 and 1.2𝑇𝑔) match the bulk/shear
moduli trends of Cu-Zr equilibrium intermetallic phases.
Figure 3.11 depicts the bulk moduli of Cu-Zr intermetallics reproduced from Du et. al’s DFT
analysis [53]. It can be seen that the bulk moduli have minima near 80% and 66% Cu
intermetallics, while there are peaks near 50%, 59%, and 75% Cu. A discrepancy in bulk moduli
trends (Figure 3.10) exists. There is a minimum at the Cu55Zr45 composition for the melt phase
which does not correspond to any feature in Figure 3.11. However, the sampling steps in Figure
3.11 are quite broad. Also there is a deep eutectic at this composition. Thus the discrepancy may
be due to the higher stability of the melt phase at this composition leading to greater differences
with the emergent nucleating phases. The analysis have shown a strong correlation of melt phase
properties with the emergent solid phase.
Figure 3.11: Evolution of Bulk and Shear Moduli of CuZr intermetallic phases
(Cu, Cu5Zr, Cu51Zr14, Cu8Zr3, Cu2Zr, Cu10Zr7, CuZr, Cu5Zr8, CuZr2, Zr)
reproduced from Du et. al [53])

38
3.3.3. Structural Analysis
Owing to their greater topological and energetic stability as isolated units, as well as their general
inability of forming long-range periodic structures, a high concentration of full icosahedra is often
argued to be a crucial ingredient in the glass formation [3]. Medium-range connectivity of
icosahedral clusters has been strongly linked with the emergence of structural bulk rigidity. Also,
there is a general exponential dependence of structural relaxation times with medium-range
connectivity of icosahedral clusters in Cu-Zr metallic liquids [48]. More generally, the perfect
icosahedra (<0,0,12,0>) is one of many topologically close-packed Kasper polyhedra which
collectively exhibit high atomic packing efficiencies and fractions of 5-edged faces. These
polyhedra are key structural units that inhibit crystallization and favour glass transiiton, which is
the reason that they are present in high fractions in many good GFA melts. The compositional
dependencies of these associated cluster types were thus analyzed, with results for icosahedral
content in the low temperature melt (1.2𝑇𝑔) are presented in figure 3.12(a). As evident from the
figure, there is a general increase in the fraction of full icosahedra with increase in Cu content and
high fractions are present at the three good GFA compositions Cu50Zr50, Cu55Zr45 and Cu65Zr35.
However, this distribution peaks at Cu75Zr25, which is not a good glass former. With increase in
Cu content the average coordination number around Cu atoms increaes towards 12, which is why
there is a prefential formation of full icosahedra clusters for compositions between 40% Cu and
85% Cu, however, it does not direcly coordinate with glass formaing ability of these compositions.
This suggests that high fraction of full icosahedra is although a necessary prerequisite to good
GFA, but not a only sufficient condition. ( This relationship is supported by the observation of
similar compositional trends for the fraction of CN=16 Kasper polyhedra (<0,0,12,4>) presented
in figure 3.13. Similar to the full icosahedra, the kasper CN=16 polyhedra is the most prefered
close pack arrangement around Zr atoms. Compositional trends of Cu-centred icosahedra at 1.2𝑇𝑔
also follow the trends of bulk moduli identified in figure 3.9, further linking the development of
short and intermediate range icosahedral ordering to the emergence of elasticity in the deeply
undercooled domain.

39
Figure 3.12: Evolution of fraction of Full Icosahedra <0,0,12,0>
motif at 1.2Tg over Cu-Zr compositional domain.
Figure 3.13: Evolution of fraction of <0,0,12,4> Kasper
Polyhedra at 1.2Tg over Cu-Zr compositional domain.

40
Since BCC structures tend to be the first nucleating phase in rapid cooling processes [54, 55],
compositional trends in the trace fraction of the <0,6,0,8> (BCC Voronoi polyhedra) cluster type
were further investigated. Figure 3.14 shows the Fraction of Kasper BCC <0,6,0,8> polyhedra at
0.4𝑇𝑔 for various Cu-Zr compositions. The data show that there are peaks at 50, 60, and 75% Cu
These appear close to the intermetallic compositions located at 50% Cu (CuZr), 58.8% Cu
(Cu10Zr7), and 78.5% Cu (Cu51Zr14). Additionally, compositional trends show striking correlations
with the extent of dynamic decoupling as evidenced by comparison with the ratio of viscous and
diffusive 𝑇0 values (figure 2(c)) or the ratio diffusive and viscous 𝐷∗ values (figure 2(b)). These
correlations support the hypothesis that the structure and nature of underlying crystalline phases
have significant influences on a range of properties in the disordered phase, including elastic and
transport properties in the melt domain.
The low degree of BCC short-range order identified at the Cu55Zr45 and Cu65Zr35 compositions are
consistent with their identification as high GFA alloys. While the observation of high BCC short-
range order at the Cu50Zr50 composition appears contrary. The B2/CsCl structured CuZr
intermetallic at an identical composition corresponds to an alternating Cu/Zr centred BCC lattice.
Figure 3.14: Evolution of fraction of Kasper BCC <0,6,0,8>
polyhedra at 𝟎. 𝟒𝑻𝒈 over Cu-Zr compositional domain.

41
Thus it is reasonable that higher BCC short-range order would be detected in the glassy Cu50Zr50.
Indeed, this provides more evidence for the strong influence the underlying equilibrium crystalline
phases have on disordered phase properties.
The results from Voronoi tessellations were used to investigate compositional short-range ordering
over the broad compositional domain under analysis. Atomic volumes and coordination numbers
at each time-step were tracked, allowing for the calculation of a range of composition dependent
statistics. The difference between mean coordination numbers for zirconium and copper atoms at
𝑇𝑔 is presented in figure 3.15. Clear peaks are evident near the three high GFA compositions,
Cu50Zr50, Cu55Zr45 and Cu65Zr35.
These results support the hypothesis that increased compositional short-range ordering
corresponds to high GFA. In particular, greater coordination differences between smaller and
larger elemental components suggests more size-dependent preferential ordering in the disordered
state, with smaller species filling "gaps" or "interstitials" between the larger species. The greater
Figure 3.15: The difference between mean coordination
numbers for zirconium and copper atoms (<𝑪𝑵𝒁𝒓>−<𝑪𝑵𝑪𝒖>)
at 𝑻𝒈 for various Cu-Zr compositions.

42
compositional deviations at these select compositions should correspond to higher atomic packing
efficiencies and relative densities compared to underlying crystalline phases. In addition to Zr and
Cu coordination deviations at Tg, mean atomic volume ratios of zirconium and copper atoms at Tg
were also found to correlate with the diffusive fragility. Figure 3.16 shows the mean atomic volume
ratios of zirconium and copper atoms at Tg as a function of composition. Comparing volume ratios
(Figure 3.16) with diffusive strength parameter 𝐷∗ (Fig. 3.4), nearly identical compositional trends
are evident. These striking correlations illustrate the strong connection between atomic transport
properties and chemi-topological ordering at the atomic level.
The smaller volume ratio present in the Cu50Zr50 disordered phase may reflect the higher extent of
BCC ordering previously discovered. Considering that Cu and Zr atoms in the associated
CsCl/BCC crystalline phase occupy identical (alternating) lattice configurations, atomic volume
ratios are expected to be minimal at this composition. The smaller relative volume difference
evident between Cu and Zr atoms may play a key part in leading to more homogenous dynamics,
Figure 3.16: The mean atomic volume ratios of Zirconium and
Copper atoms (< 𝑽𝒁𝒓 >
< 𝑽𝑪𝒖 >⁄ ) at 𝑻𝒈 for various Cu-Zr
compositions
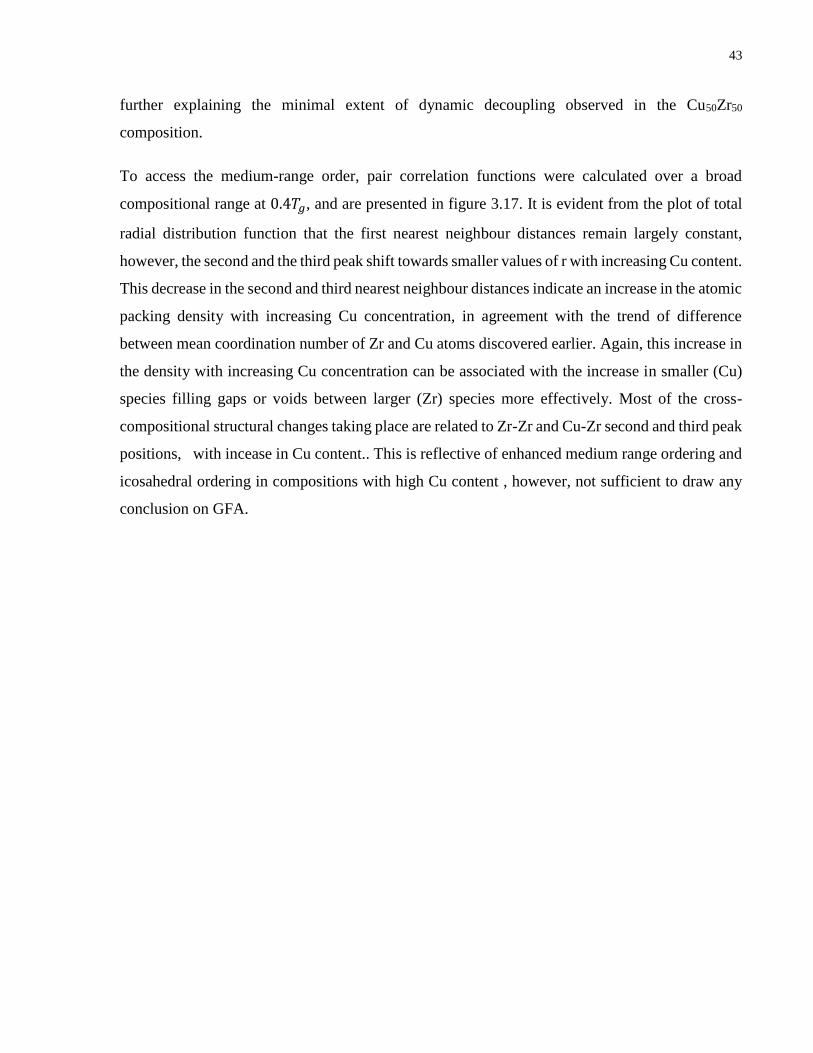
43
further explaining the minimal extent of dynamic decoupling observed in the Cu50Zr50
composition.
To access the medium-range order, pair correlation functions were calculated over a broad
compositional range at 0.4𝑇𝑔, and are presented in figure 3.17. It is evident from the plot of total
radial distribution function that the first nearest neighbour distances remain largely constant,
however, the second and the third peak shift towards smaller values of r with increasing Cu content.
This decrease in the second and third nearest neighbour distances indicate an increase in the atomic
packing density with increasing Cu concentration, in agreement with the trend of difference
between mean coordination number of Zr and Cu atoms discovered earlier. Again, this increase in
the density with increasing Cu concentration can be associated with the increase in smaller (Cu)
species filling gaps or voids between larger (Zr) species more effectively. Most of the cross-
compositional structural changes taking place are related to Zr-Zr and Cu-Zr second and third peak
positions, with incease in Cu content.. This is reflective of enhanced medium range ordering and
icosahedral ordering in compositions with high Cu content , however, not sufficient to draw any
conclusion on GFA.
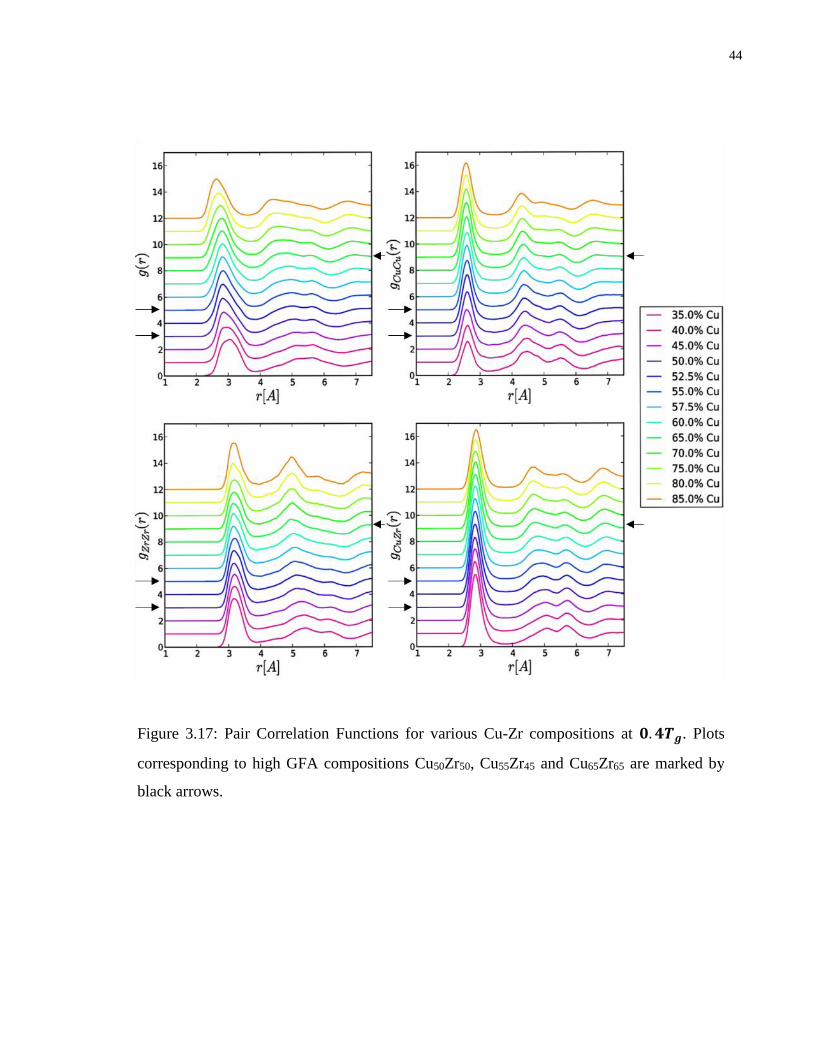
44
Figure 3.17: Pair Correlation Functions for various Cu-Zr compositions at 𝟎. 𝟒𝑻𝒈. Plots
corresponding to high GFA compositions Cu50Zr50, Cu55Zr45 and Cu65Zr65 are marked by
black arrows.

45
3.4. Summary
To summarize, in this chapter molecular dynamics calculations of atomic transport properties, bulk
(and atomic level) stiffness properties, and short-range structural and ordering properties of binary
Cu-Zr liquid melts and glasses were conducted over a broad compositional domain. The three
highest GFA compositions Cu50Zr50, Cu55Zr45 and Cu65Zr35 were found to have low viscous melt
fragilities, and a high extent of compositional short-range ordering as evidenced by large mean
coordination deviations between Zr and Cu atoms. Dynamic decoupling (determined by the ratio
of diffusive and viscous VFT strength parameters and divergence temperatures) was found to be
minimal for the Cu50Zr50 composition, while being high for the other two high GFA compositions.
Similar discrepancies were identified between the three high GFA compositions and low
temperature melt bulk moduli. Interestingly, strong signatures of underlying intermetallic phases
were present upon comparison of bulk moduli results with those of the nearest intermetallics.
Disordered phase properties were found to vary continuously over piece-wise continuous domains,
with apparent second order discontinuities roughly corresponding to the locations of underlying
intermetallic phases. Investigating the influence of crystalline order on these emergent properties,
the fraction of BCC <0,6,0,8> polyhedra frozen into the glass was found to perfectly mirror the
extent of dynamic decoupling present. Similarly, the ratio of Zr and Cu atomic volumes was found
to mirror compositional trends observed in the diffusive strength/fragility parameter 𝐷∗.
Combined, these results reinforce the deep connection between glass forming ability and a range
of emergent properties in the undercooled domain.
46
Chapter 4
4. Investigating Atomic Origins of Serration Events for Cu-Zr Metallic Glass System
Plastic deformation of metallic glasses proceeds through sudden stress drops and rises termed
serration or avalanche events. While experimental studies have suggested that this occurs by stick-
slip behavior of weak spots, the atomistic structural origins underlying this phenomenon have
remained unclear. In this chapter, the deformation mechanisms underpinning serrated flow in Cu-
Zr metallic glasses are comprehensively investigated using molecular dynamics simulations. It is
uncovered that this behavior is essentially dictated by the short range structural order as defined
by the relative population of full icosahedra and geometrically unfavourable motifs (GUMs). The
co-slipping of atoms belonging to GUMs causes stress drops whose magnitude is directly
correlated to the number of atoms involved in the slip. Continued loading leads to the breakdown
of full icosahedra into GUMs, causing severe serration behaviour during late stages of
deformation. More severe and frequent stress drops were observed at higher temperatures and
lower strain rates, indicating a thermally activated nature of this phenomenon. The compositions
with lower Cu content showed enhanced serrated flow, suggesting that ductility can be
compositionally tuned. The statistical analysis of stress drops exhibited remarkable agreement with
previous experimental findings. Insights gained from this study would assist in designing new
metallic glasses with superior ductility.
4.1. Literature Review
In contrast to the conventional metals and alloys possessing a crystalline atomic structure
characterised by short and long range order, amorphous solids such as bulk metallic glasses have
a random atomic structure with no long-range structural order but short range chemical ordering
[56]. This disordered structure provides them with a unique set of mechanical, chemical and
physical properties for which they have received a great deal of scientific and technological
attention [6, 7, 57-59]. Due to the absence of crystalline defects such as dislocations and grain

47
boundaries in the amorphous structure, most BMGs exhibit high strengths, high elastic limits, and
good wear and corrosion resistance at room temperature as compared to conventional metals,
alloys, and other engineering materials. Despite having many desirable attributes, one property
that is inhibiting their widespread use in structural applications is their sudden brittle failure.
Metallic glasses are considered as brittle or quasi-brittle materials as they often fracture
catastrophically under tensile loads due to highly localized, heterogeneous deformation via the
formation of shear bands[27, 58]. A substantial amount of research effort has been directed
towards increasing their ductility at room temperature [60-63].
Shear Transformation Zones (STZs) are the carriers of plastic deformation at the atomic level in
metallic glasses [24] and shear localization evolves from these STZs into thin bands of strain-
weakened material. The propagation of one of these shear bands eventually penetrates the entire
sample leading to failure. In a particular range of temperature and applied strain rate [64-67], shear
bands show stick–slip behavior with alternating phases of stress drops and accumulations. One
such drop and burst cycle is known as a serration event, see figure 4.1 from [68].
Figure 4.1: Stress-time profiles of a BMG sample in
compression, depicting cycles of stress drop and gain,
taken from [68]

48
The inhomogeneous serrated plastic flow uncovered in one of the first experimental studies
indicated the modification of atomic structure during straining [69], which was subsequently
corroborated in various studies [64, 66-68, 70]. Nano-indentation experiments on BMG samples
have also exhibited serrated plastic flow and serration amplitudes were found to increase with a
decrease in indentation rates [71-74]. More recently Antonaglia et al [68, 75] have concluded that
BMGs deform via slip avalanches of coupled weak spots present in the glass matrix. They have
reported that serrations exhibit a scaling behavior, i.e. a cumulative size distribution that follows a
power law. Thurnheer et al. [67, 76] investigated the role of composition in a ternary Cu-Zr-Al
alloy on shear band dynamics. The compressions tests were performed on pre-notched samples to
artificially control the dominant deformation behaviour. Li et al [77] have reported a linear relation
between the logarithm of strain rates and mean stress drops.
The inhomogeneous deformation of a BMG results in formation of one major shear band leading
to abrupt failure. In contrast, the homogeneous deformation behaviour, characterised by serration
events, results in shear transformations taking place throughout the amorphous matrix, which
delays the formation of the critical shear band, thereby enhancing the plastic strain limit. Thus in
order to design new BMGs with enhanced ductility, a fundamental understanding of serration
events is vital. Despite the overwhelming interest and extensive experimental investigation, a
comprehensive treatment of the atomistic mechanism of serration events and the effect of various
parameters on serration behaviour from a simulation perspective is yet to be undertaken. The
underlying mechanisms behind serration events are not fully resolved. For instance, it is not fully
clear which atoms participate in plastic slips that lead to stress drops. Also, the details of atomic
rearrangements needed to cause such stress drop and burst events have not been investigated so
far. Furthermore, what parameters control the size of the slip avalanche and magnitude of the stress
drop and how? Such questions still remain and need to be addressed.
Notably, the processes transpiring at the atomic scale such as shuffling of atoms into a STZs or
slipping of a group of atoms occur at short time and length scales and thus are difficult to
experimentally study but are now within the reach of molecular dynamics (MD) investigations that
can yield atomistic details of the underlying phenomena. Hence, here we use MD simulations to
uncover the relationship between serration events on the stress-strain curve and their
corresponding atomic level structural changes. This is the first such MD study which undertakes a
comprehensive investigation of serration behaviour during uniaxial tensile deformation of Cu-Zr

49
metallic glasses. The uniaxial tensile loading employed in the simulations is uniform and does not
generate any artificial defect site for nucleation of shear localization which could otherwise result
in homogeneous flow; thereby allowing us to study more realistic deformation behaviour. A
relatively slow MD strain rate of 107 s-1 was used to deform the samples and investigate
inhomogeneous deformation (see Figure S1 in Supplementary Information for model details).
Simulations were carried out over a range of strain rates, temperatures, and compositions of Cu-
Zr alloy and a detailed analysis is presented on the effect of these parameters on serration
behaviour. The applicability of relevant existing experimentally established empirical models is
also tested.
4.2. Simulation Methodology
MD simulations were carried out using the LAMMPS package [31]. Many-body embedded atom
method (EAM) interatomic potential developed by Mendelev [32] for Cu-Zr were used to describe
atomic interactions. MG samples with CuxZr100-x (x = 35, 50, 56 and 64) were generated by first
populating a box of ~13000 atoms with Cu and Zr atoms in the required atomic fractions according
to a B2 structured supercell. The simulation box was first relaxed at 300K with 3-D periodic
boundaries under zero pressure barostatic condition and then heated from 300K to 2100K over a
duration of 1 ns. This was followed by a relaxation stage of 2 ns to ensure that the high temperature
liquid melt is properly equilibrated. Next, the samples were rapidly quenched at a cooling rate of
0.1K ps-1 to a final temperature of 25K through a series of quench and hold stages. The temperature
was brought down in steps of 25K; cooled for 0.1 ns and then relaxed for 0.15 ns at that
temperature. NPT Nose-Hoover temperature and pressure controls with 1 fs time-step were used
to enforce zero pressure isobaric conditions throughout the quenching process. The quenched
samples were further relaxed in NVT ensemble for 0.2 ns and atomic positions, velocities, and
energies were sampled for particular temperatures. The data collected from MD simulations was
post-processed to obtain various structural, thermodynamic and kinetic properties. The calculated
properties such as radial distribution function, structural factor, melting point, glass transition
temperature etc. were compared to the existing experimental and simulation data from literature
for establishing the physical and chemical validity of the sample under study. MG samples with
final dimensions of 12.6 (X) x 3.7 (Y) x 4.3 (Z) nm3 were loaded in uniaxial tensile deformation
mode, with a constant strain rate of 1.0 x 10⁷ /s applied along the X-direction. Figure 4.2 shows

50
the 3-dimensional left hand side and front view of a typical sample configuration used for
mechanical testing simulations with arrows depicting the uniaxial loading in X-direction.
Figure 4.2: Typical atomistic configuration of a simulated sample. (a) Atomic Structure of
Cu64Zr36 MG sample showing dense atomic packing of 13000 atoms obtained by relax-melt-
quench procedure through MD. (b) Left hand side view of a typical sample configuration used
for mechanical testing simulations depicting system size along periodic Z direction. (c) Front
view of a typical sample depicting sample size along periodic X and Y direction. Uniaxial
tensile loading was carried out, as depicted by arrows, along the X direction to deform the
samples.
51
4.3. Results and Discussion
In order to verify the BMG samples prepared by MD, the structure factor was calculated for various
compositions and compared with experimentally obtained structure factor. Figure 4.3(a) depicts
the structure factor calculated from the data collected through simulations for four different Cu-Zr
compositions. Clearly, the computed structural factors exhibited remarkable agreement with the
experimental values obtained from previous XRD observations [78], including the shape,
magnitude and the peak locations. Figure 4.3(b) shows the evolution of the structure factor at
different temperatures during quenching of a Cu64Zr36 sample. The location of the first peak, q1,
remains fairly constant up-to the glass transition temperature Tg ~ 760K whereas the height of the
first peak, S(q1), decreases with increasing temperature, as expected. After Tg, at the next
temperature investigated (1300K), there is a significant decrease in the location (q1) as well as
height S(q1) of the first peak. The liquid state of the sample above Tg is reflected by this diffused
shape of the curve.

52
Figure 4.3: (a). Calculated structure factor for various samples of Cu-Zr compositions at 300K (b).
Structure factor evolution during quenching for a simulated Cu64Zr36 MG composition plotted at
various temperatures. The structure factors of the simulated Cu-Zr MGs exhibited remarkable
agreement with structure factors obtained experimentally via XRD. [78]

53
4.3.1. Overall stress-strain response and structural origins of serration
events
Figure 4.4(a) represents the stress-strain curve of the Cu64Zr36 MG sample loaded in uniaxial
tension along the x-direction. As expected the curve is linear in the initial elastic deformation
regime up to ~3.2% strain, beyond which the system enters into an inelastic deformation regime.
On further straining the system, plastic deformation proceeded with repeating cycles of stress drop
and accumulation, or serration events. For the purpose of comparison, a uniaxial tensile
deformation test was also performed on a crystalline copper sample with the exact same sample
geometry, strain rate and temperature conditions. It is evident from its stress-strain response,
represented in Figure 4.4(a), the stress increases smoothly up to the yield point and plastic
deformation is characterised with significant strain hardening until the point of failure when the
stress drops suddenly and there are no repeated cycles of stress drops or accumulations.
Figure 4.4: (a). Stress Strain response of Cu64Zr36 MG sample and single crystal Copper at 107/s
strain rate and 300K. (b)-(c): Representative stress drop and accumulation cycles.

54
The deformation mechanism of crystalline alloys is dominated by dislocations and there is little to
no serrated flow. This comparison confirmed that the serration events observed in the amorphous
sample deformation were not artifacts of the simulations, but a phenomenon unique to the nature
of BMG’s plastic deformation as reported in previous experimental reports [75-77].
In order to uncover the processes happening at the atomic level corresponding to these serration
events on stress-strain curves, we used atomistic visualization and analysis packages: atomeye and
ovito [79, 80]. The local atomic shear strain, 𝜂𝑖𝑀𝑖𝑠𝑒𝑠 [40] was calculated to quantify and monitor the
deformation process. The local shear invariant of an atom, a measure of its atomistic local strain
between a reference state and present state, is given by equation 2.16. 𝜂𝑖𝑀𝑖𝑠𝑒𝑠is a widely used metric
for inhomogeneous deformation in atomistic simulations [19, 81].
During the initial stages of deformation, the distribution of 𝜂𝑖𝑀𝑖𝑠𝑒𝑠was uniform throughout the
sample with a value close to zero, indicating there is little inelastic movement of atoms and the
system is in the elastic regime. When the system entered the inelastic regime (ϵ ~3.2%), some spots
with 𝜂𝑖𝑀𝑖𝑠𝑒𝑠 relatively greater that the bulk sample started to appear at random locations in the
sample. These spots were locations of STZs. As the deformation proceeded, more and more STZs
started to appear in groups or clusters (coalesced STZs) in the sample. This coalescing of STZs,
with higher 𝜂𝑖𝑀𝑖𝑠𝑒𝑠 values indicated grouped slipping of these atoms/clusters. By tracking the
simulation time-step of coalescing STZs with the corresponding noted value on the stress-strain
curve, we determined that each grouped slipping of atoms/clusters mapped directly to a stress-drop
event. The next task was to distinguish these groups of atoms from those in the bulk sample and
to characterize said groups. For further investigation, we focussed our analysis on select
representative serration events – stress drop event AB, stress accumulation event DE and stress
drop event of relatively greater magnitude, FG, as shown in Figure 4.4(b)-(c) with their
corresponding stress change magnitudes. Figure 4.5 denotes the atomistic configuration snapshots
of the sample corresponding to points A, B, C, D, E, F, G and H. Atoms are colored according to
their least square local atomic strain (𝜂𝑖𝑀𝑖𝑠𝑒𝑠). As the stress drops from point A to B, coalescing of
STZs into bands of shear localization along with generation of new STZs was evident in the
corresponding snapshot B. Now, when stress accumulated from B to C, these bands became defuse
and no new STZs appeared in the sample. Again, when the stress drops from C to D, coalescing
of STZs into shear bands can be see. With the subsequent gain in stress up-to instant E, these shear
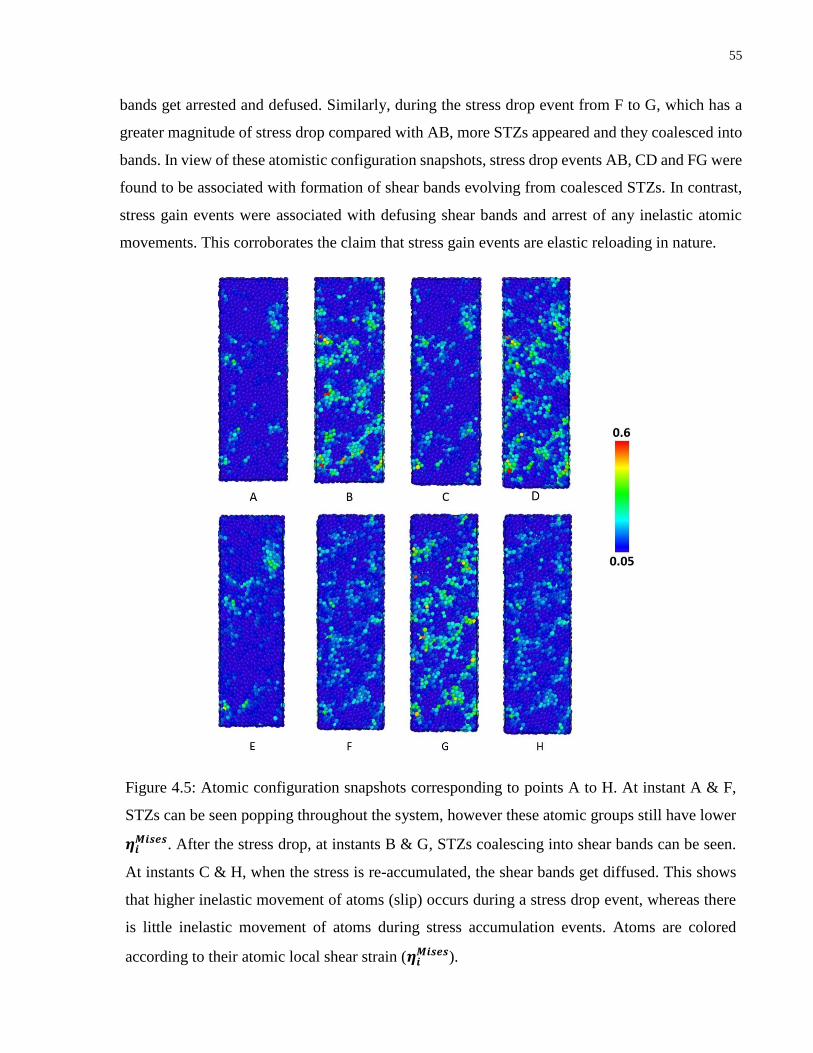
55
bands get arrested and defused. Similarly, during the stress drop event from F to G, which has a
greater magnitude of stress drop compared with AB, more STZs appeared and they coalesced into
bands. In view of these atomistic configuration snapshots, stress drop events AB, CD and FG were
found to be associated with formation of shear bands evolving from coalesced STZs. In contrast,
stress gain events were associated with defusing shear bands and arrest of any inelastic atomic
movements. This corroborates the claim that stress gain events are elastic reloading in nature.
Figure 4.5: Atomic configuration snapshots corresponding to points A to H. At instant A & F,
STZs can be seen popping throughout the system, however these atomic groups still have lower
𝜼𝒊𝑴𝒊𝒔𝒆𝒔. After the stress drop, at instants B & G, STZs coalescing into shear bands can be seen.
At instants C & H, when the stress is re-accumulated, the shear bands get diffused. This shows
that higher inelastic movement of atoms (slip) occurs during a stress drop event, whereas there
is little inelastic movement of atoms during stress accumulation events. Atoms are colored
according to their atomic local shear strain (𝜼𝒊𝑴𝒊𝒔𝒆𝒔).

56
Also, the magnitude of 𝜂𝑖𝑀𝑖𝑠𝑒𝑠 has increased indicating that a larger inelastic atomic movement had
taken place. Again, as the stress increased up to point H, these bands diffuse and no new STZ
formation or increase in 𝜂𝑖𝑀𝑖𝑠𝑒𝑠 was observed. From the observations above, it can be noted that
stress drop events occurred due to coupled slipping of several weak spots, or coalescing of several
STZs resulting in the nucleation of a shear band. Such shear bands have also been termed as
embryonic shear bands [40]. These embryonic shear bands propagate leading to a stress drop event,
but are eventually arrested. In bulk BMG samples, usually one of the embryonic shear band
develops into a major shear band that eventually runs across the sample localizing all plastic
deformation into itself leading to fracture. In contrast, a stress accumulation event shows no or
little plastic deformation (lower values of 𝜂𝑖𝑀𝑖𝑠𝑒𝑠), indicative of an elastic reloading of the sample.
In some studies, it was found that the slopes of stress accumulation events are parallel to each other
and equal to the Young’s modulus [62], further supporting the assertion of elastic reloading.
To further understand the mechanism of atomic transitions in individual serration events, we
calculated 𝜂𝑖𝑀𝑖𝑠𝑒𝑠 between atomic states at the start and end of stress-change events. The atomic
local shear invariant, ηiMises, is a measure of plastic deformation at atomic level for an atomic
configuration with respect to a reference configuration. To quantify the local atomic movements
undergoing in each serration event, we calculated ηiMises between the atomic configurations before
and after a serration event. For example, for a stress-drop event AB, ηiMises was calculated by
taking the atomic state at B as the current configuration and the atomic state at A as its reference
configuration. Similarly, for a stress accumulation event DE, atomic state at D was taken as
reference configuration and atomic state at E as the current configuration. The summary of
ηiMises calculation for the analyzed serration events is presented in Table 1.

57
Table 4.1: Summary of calculation of 𝜼𝒊𝑴𝒊𝒔𝒆𝒔 for analyzed serration events
Event Stress Change
Magnitude (MPa)
Maximum
𝜼𝒊𝑴𝒊𝒔𝒆𝒔
Number of atoms with
𝜼𝒊𝑴𝒊𝒔𝒆𝒔 > 𝟎. 𝟏𝟓
Stress
Accumulation
Events
1 36 0.14 0
2 50 0.12 0
3(DE) 67.5 0.15 0
4 88 0.13 0
5 105 0.15 0
Stress Drop
Events
6 32 0.17 26
7 47 0.18 29
8(AB) 60 0.24 41
9 85 0.22 58
10 110 0.35 87
11(FG) 135 0.35 110
12 150 0.33 139
The 𝜂𝑖𝑀𝑖𝑠𝑒𝑠 distribution for stress accumulation events (1 to 5) finishes up to 0.15 and a clear
correlation between the stress drop magnitude and number of atoms with 𝜂𝑖𝑀𝑖𝑠𝑒𝑠 > 0.15 can be
seen for stress drop events (6 to 12), with the events with greater stress drop magnitudes have
higher number of atoms accommodating plastic slips. The summary of ηiMises calculation for the
three serration events under analysis i.e. AB, DE and FG is presented in Table 4.2.
Table 4.2: Summary of analysis of events AB, DE and FG
Serration Event AB DE FG
Stress Change Magnitude (MPa)
Max 𝜂𝑖𝑀𝑖𝑠𝑒𝑠
Number of atoms involved in the slip
60
0.24
41
67.5
0.15
0
135
0.35
110

58
The distribution of 𝜂𝑖𝑀𝑖𝑠𝑒𝑠 for the three events is presented in Figure 4.6(a). The distribution is
narrow for stress accumulation event DE(black) and ends at 𝜂𝑖𝑀𝑖𝑠𝑒𝑠 = 0.15, whereas it is broader
for stress drop events AB(blue) and FG(red), extending up-to 0.24 and 0.35 respectively. This
diffused shape indicates that more local inhomogeneous atomic movements/slips have taken place.
Figure 4.6: (a): The atomic distribution of 𝜼𝒊𝑴𝒊𝒔𝒆𝒔 calculated between instants prior to and after
a stress changes event. (b)-(c): Atomic configuration snapshots of (b) Event AB and (c) Event
FG showing atoms with 𝜼𝒊𝑴𝒊𝒔𝒆𝒔 > 𝟎. 𝟏𝟓. Atoms are present in groups/clusters (circled). Event
FG [Figure (c)], has more such groups than event AB [Figure (b)], corresponding to the larger
stress drop magnitude. Atoms are colored according to their atomic local shear strain (𝜼𝒊𝑴𝒊𝒔𝒆𝒔).

59
Event FG has the larger stress drop (135 MPa) compared to that of AB (60 MPa) and the maximum
value of 𝜂𝑖𝑀𝑖𝑠𝑒𝑠 for the atoms in event FG is greater than the atoms in AB. More interestingly, the
number of atoms involved in plastic slipping is also greater for FG than AB. Here, the number of
atoms involved represents all atoms which have 𝜂𝑖𝑀𝑖𝑠𝑒𝑠 > 0.15. This signifies that the magnitude
of a stress drop event directly corresponds to the number of atoms involved in the slip avalanche.
Furthermore, from the atomic configuration snapshots, Figure 4.6(b)-(c), showing the atoms above
𝜂𝑖𝑀𝑖𝑠𝑒𝑠 > 0.15 for stress-drop event AB and FG, it is evident that atoms involved in the slips are
present in groups/clusters (circled). Again, event FG has more such groups than AB, since it is an
event of larger stress drop and involving more atoms in the slip avalanche.
These atoms/groups of atoms were then mapped to their corresponding Voronoi polyhedral type.
The Voronoi tessellation method is widely used to describe short range order and packing of atoms
in amorphous structures in terms of atomic coordination number and types of coordination
polyhedra [10]. The nearest neighbour geometry is decomposed into a polyhedra centred around
each atomic site. Voro++ package [52] was used to perform Voronoi tessellations. System
snapshots are taken every 256 time-steps over a sampling duration of 32 ps allowing for improved
cluster statistics. Figure 4.7 represents the fraction (%) of six major Cu-centred Voronoi polyhedra
and geometrically unfavoured motifs (GUMs) describing the short range order of a Cu64Zr36 MG
sample. As discussed earlier, the packing around Cu has been found to be more regular and the
fraction dominant Cu-centered clusters approach up to 80% of the total number of clusters. Since
the changes in the fraction of these clusters w.r.t composition and quench rate is much more
significant as compared to changes in dominant Zr-centered clusters [12], the structure of Cu-Zr
MGs has been examined from the perspective of Cu-centered clusters in various simulations and
experimental studies [10-14,18]. All the polyhedra with less than 1% of the population have been
grouped under the umbrella of geometrically unfavourable motifs (GUMs) [21]. GUMs are
essentially low population polyhedra which have unfavourable coordination numbers, lower
symmetry, and higher configurational entropy. These are clusters of atoms that are more flexible
and amenable to rearrangement upon the application of stress. Such polyhedra readily undergo
shear transitions.

60
The one to one mapping of some of the groups of atoms to their corresponding Voronoi polyhedra
revealed that at instant A, i.e. just before the stress drop, these atoms were present in polyhedra
with Voronoi index Cu <0,3,6,2>, Zr <0,3,6,8> and Cu <0,4,6,3>. After the slip avalanche i.e. at
instant B these polyhedra have evolved into Cu <1,2,5,3>, Zr <3,7,6,1> and Cu <0,2,6,5>
respectively. Similarly, for event FG, at instant F, some of the groups of atoms were present in
polyhedra with Voronoi index Cu <0,4,4,3>, Cu <0,0,12,2>, Cu <0,1,10,3>, Zr <0,2,8,8> and Zr
<2,9,4,1> and after the slip avalanche (i.e. at instant E) these polyhedra have evolved into Cu
Figure 4.7: Fraction of six major Cu-centered Voronoi polyhedra and geometrically
unfavoured motifs (GUM) describing the short range order of Cu64Zr36 MG sample.
Atomic configuration of each Voronoi polyhedra type is as shown with bigger
atoms (green) representing Zr and smaller atoms (bronze) representing Cu
respectively. The bonds are drawn to help better visualization of nearest neighbor
atom and cluster shapes.

61
<2,2,4,3>, Cu <0,1,10,4>, Cu <0,3,6,5>, Zr <0,1,10,7> and Zr <0,4,4,8> respectively. It is worth
noting that most of the Voronoi polyhedra that are accommodating the inelastic movement in the
slip avalanche and are readily evolving belong to the category of geometrically unfavourable
motifs (GUMs), which represent the ‘liquid-like structural units in the amorphous structure. In
short, such polyhedra easily undergo shear transformations (STs) and thus make up the ‘weak
spots’ in the material matrix. Hence, it can be deduced that stress-drop events transpire due to
coupled slipping of several geometrically unfavourable polyhedra acting as weak spots in the
sample, and the greater the number of such weak spots involved in the slip, the greater the
magnitude of the stress drop. The plastic deformation proceeded by nucleation, propagation and
arrest of these slip avalanches leading to serrated flow. However, the atomic level mechanism that
causes the arrest of these slip avalanches needs further investigation.
4.3.2. Evolution of serration behavior with applied strain
It has been reported in previous experimental studies [62, 70] that the magnitude of stress drops
increased with an increase in applied strain. To understand the fundamental atomistic mechanism
responsible for this behavior, we performed a statistical analysis of stress drops with respect to
overall sample strain. The results are given in Figure 4.8. For this analysis, only stress changes
above 20 MPa were considered to avoid the natural noise in the data. From figure 4.8, it is clear
that both the number of serration events and magnitude of average stress change (Δσ̅) follow an
increasing trend with an increase in applied strain magnitude. This implies that during the late
stages of deformation more serration events are taking place and with larger magnitudes, indicating
that shear transformations are more localized. This phenomenon can be explained with the help of
Figure 4.9, which depicts the evolution of major polyhedra in the bulk sample with overall sample
strain. As the deformation proceeds, the frequency of all the polyhedra types remain almost
constant up to ~ 3.2% strain, after which the frequency of <0,0,12,0> or full icosahedral (FI) motif
start declining and the frequency of GUMs start rising, whereas there is no significant change in
the frequencies of all other major polyhedra. It is well known that the FI motifs are most stable
geometrical units in metallic glasses and are most resistant to shear transformations. They form
the structural backbone of the amorphous sample and all other motifs are interconnected in FI
matrix. Thus, the FI network needs to break down in order to accommodate any plastic deformation

62
[19]. FI motifs started breaking down into GUMs as the deformation proceeded in the plastic
regime. The increase in the GUMs population resulted in an increase of fertile sites for STZs. Since
the coalescing and coupled slipping of STZs resulted in serration events, the increase in the GUMs
population together with a decrease in the FI population resulted in an increase in the number of
serration events. Also, it is energetically favourable to re-activate an existing shear band than to
nucleate a new one. At increased strain magnitudes, it is more probable that slipping is taking place
in an existing shear band leading to more localization of strain, which can be asserted as a reason
of the increase in mean stress drop per event (Δσ̅).
Figure 4.8: The statistics of serration events with respect to overall
sample strain. The number of serration events as well as the mean stress
drop per event increase with increase in the overall sample strain.

63
Figure 4.9: Evolution of six major Cu-centered Voronoi polyhedra and geometrically unfavoured
motifs (GUM) during deformation of Cu64Zr36 MG sample
4.3.3. Effect of operating temperature
For studying the effect of temperature on the serration behaviour, uniaxial deformation simulations
were carried out on a Cu64Zr36 sample over the temperature range from 25K to 500K. The resultant
stress-strain responses are presented in Figure 4.10, which shows that the number of serration
events consistently increase with temperature. This can be further quantified by calculating the
number of serration events and the mean and standard deviation of the amplitude of stress changes
for each temperature, as depicted in Figure 4.10(b)-(c). Again, for keeping the natural noise of the
data out, only events with Δσ > 20 MPa were considered in the analysis. From Figure 4.10(b)-(c),
a clear trend of an increase in the number of serration events as well as an increase in the mean
and standard deviation of the Δσ with increasing temperature is evident.

64
Figure 4.10: Stress-strain response of Cu64Zr36 MG sample at 107 s-1 strain rate and varied
temperatures. The curves become more and more serrated with increase in temperature. (b)
Evolution of counts of serration events during the deformation of Cu64Zr36 MG sample at varied
temperatures. (c) Evolution of mean and standard deviation of magnitude of stress change at
different temperatures.
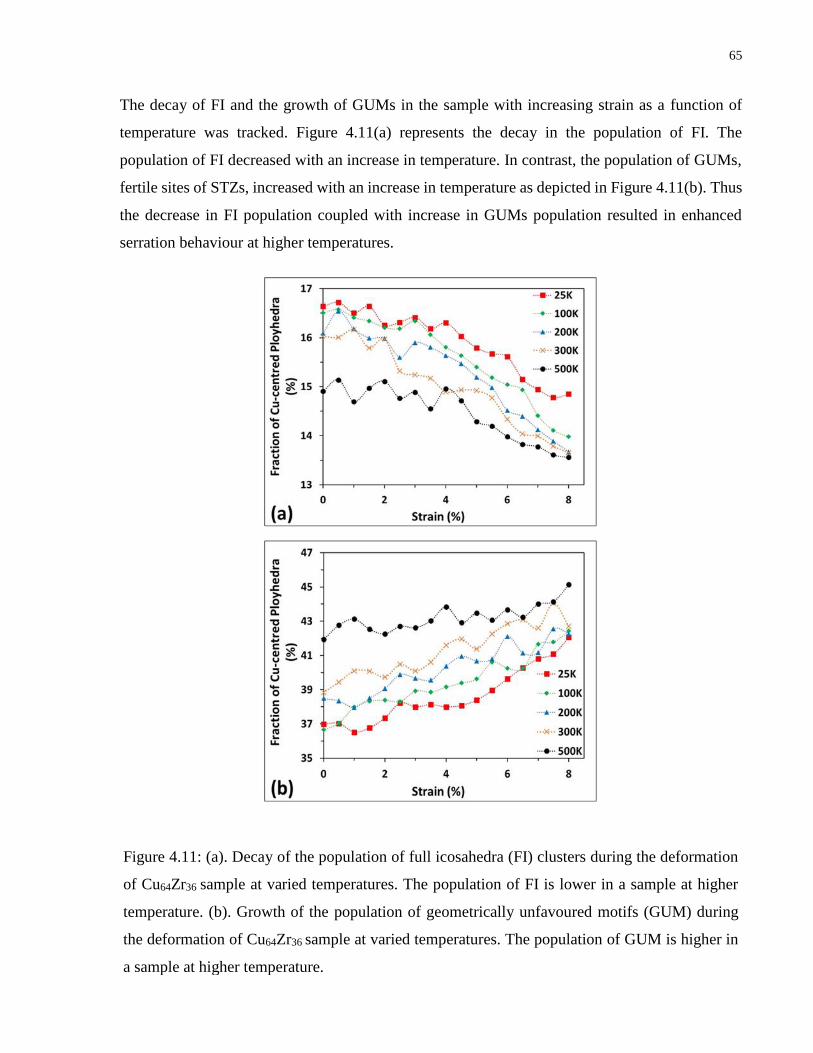
65
The decay of FI and the growth of GUMs in the sample with increasing strain as a function of
temperature was tracked. Figure 4.11(a) represents the decay in the population of FI. The
population of FI decreased with an increase in temperature. In contrast, the population of GUMs,
fertile sites of STZs, increased with an increase in temperature as depicted in Figure 4.11(b). Thus
the decrease in FI population coupled with increase in GUMs population resulted in enhanced
serration behaviour at higher temperatures.
Figure 4.11: (a). Decay of the population of full icosahedra (FI) clusters during the deformation
of Cu64Zr36 sample at varied temperatures. The population of FI is lower in a sample at higher
temperature. (b). Growth of the population of geometrically unfavoured motifs (GUM) during
the deformation of Cu64Zr36 sample at varied temperatures. The population of GUM is higher in
a sample at higher temperature.

66
This agrees with the experimental findings, wherein a decreasing trend in serration events and
serration amplitude with decreasing temperature, with a clear changeover from serrated to non-
serrated flow was reported at a particular transition temperature TT [67, 70, 76]. The transition
temperature is dependent on both the applied strain rate and composition of the sample. It is well
known that shear transformations (STs) are thermally activated processes. At a particular strain
rate, and at higher temperatures, more thermal energy is present in the system. This additional
thermal driving stress adds to the athermal driving stress supplied from loading and causes more
and more STZs in the sample. These STZs coalesce and participate in slip avalanches leading to
enhanced serrated flow. Hence we observe more serration events with an increased amplitude of
Δσ. Also, at higher temperatures, the system has higher entropy and more randomness, which
explains the increase in the standard deviation of Δσ as the fluctuation in the amplitude of Δσ
increased due to increased system randomness.
4.3.4. Effect of strain rate
Uniaxial tensile deformation tests were performed on a Cu64Zr36 sample at room temperature
(300K) and varied strain rates ranging from 109 s-1 – 5x10⁶ s-1, for investigating the effect of strain
rate on serration events. The resultant stress-strain responses are presented in Figure 4.12(a). The
plastic deformation became more serrated as the applied strain rate is decreased. This can be
quantified by a plot of the mean magnitude of stress drop with respect to the log of strain rate, as
shown in Figure 4.12(b). As evident from figure 4.12(b), the mean Δ𝜎 increases linearly with a
logarithmic strain rate following the model: Δσ̅̅̅̅ = 𝐴 − 𝐵𝑙𝑜𝑔(𝜀̇) reported recently based on
experimental observations [77]. The calculated value of B = 15.51 agrees well with the
experimentally calculated value B = 10.5 and the accuracy of fit is R=0.96. This trend also agrees
very well with experimental observation by Antonaglia et al and Dalla Torre et al where similar
trends were observed [68, 70]. Deceasing the strain rate slows the system dynamics, which in turn
provides more time for the atoms in the sample to move inelastically, allowing for more structural
dilation. Structural breakdown results in an increase in the population of GUMs and a concomitant
decrease in shear resistant FIs, thus leading to an increase in serration events. The slow system
dynamics also allow shear bands to propagate for a longer duration before they are arrested. This
increases localization into one shear band is reflected in the increase in amplitude of Δσ.

67
Figure 4.12: (a) Stress-strain response of Cu64Zr36 MG sample at 300K and variable strain rate
rates. The maximum strength of the sample decreases with a decrease in strain rate. Also, the
curves become more and more serrated with a decrease in strain rate. (b). Variation of mean
Δσ with respect to strain rate. Five separate simulations were performed at each strain rate to
capture the stochasticity by varying the random velocity seed.

68
When the change in temperature is coupled with a change in strain rate, the flow behaviour can be
explained based on the atomistic phenomena of thermal activation of STZs and structural dilation
in the sample. [16,26]. At low strain rates, the athermal driving stress is low. However, slower
dynamics allows more time for structural dilation to take place. Moreover, an increase in
temperature increases the thermal activation of STZs. Hence low applied strain rates and high
temperatures favour thermal activation of shear bands and breakdown of the structure into GUMs
leading to highly serrated flow. In contrast, a high applied strain rate quickens the system
dynamics, thereby not allowing enough time for structural dilation to take place. Also, at low
temperatures there is little thermal activation. Thus, low temperatures and high strain rates favour
non-serrated flow.
4.3.5. Compositional dependence of serration behavior
Cu64Zr36 is known to have one of the best glass forming abilities among Cu-Zr bulk metallic glass
compositions and is structurally amongst the most stable. Cu50Zr50 and Cu56Zr44 are also good glass
formers with moderate structural stability while Cu35Zr65 is a poor glass former and has the least
structural stability. This is reflected in their critical casting diameters- Cu64Zr36 (2 mm); Cu50Zr50
(1.14 mm); Cu56Zr44 (1.02 mm) and <1 mm for Cu35Zr65 [45, 82]. In order to cover the whole
spectrum of Cu-Zr compositions these four representative compositions were chosen for further
analysis. Figure 4.13(a) represents the uniaxial tensile deformation response of the four Cu-Zr
compositions at room temperature (300K). As expected, Cu64Zr36 has the highest strength and
Young’s modulus among all compositions. The strength and Young’s modulus show a declining
trend with decreasing Cu content. The serration behaviour follows the same trend as the stress-
strain curves appear more and more serrated with decreasing Cu content. A statistical analysis was
performed to calculate counts of serration events and the mean and standard deviation of the
amplitude of stress change as shown in Figure 4.13(b)-(c). It is evident that both the number of
serration events and the magnitude & standard deviation of the amplitude of stress change show
an increasing trend with decreasing Cu content.

69
Figure 4.13: (a) Stress-strain response of four different compositions of Cu-Zr MG at 300K and
107 s-1 strain rate. Cu64Zr36 sample has the greatest maximum strength and highest Young’s
modulus among all compositions. (b) Trend of counts of serration events in different Cu-Zr
compositions. (c) Trend of mean and standard deviation of magnitude of stress change in different
Cu-Zr compositions.
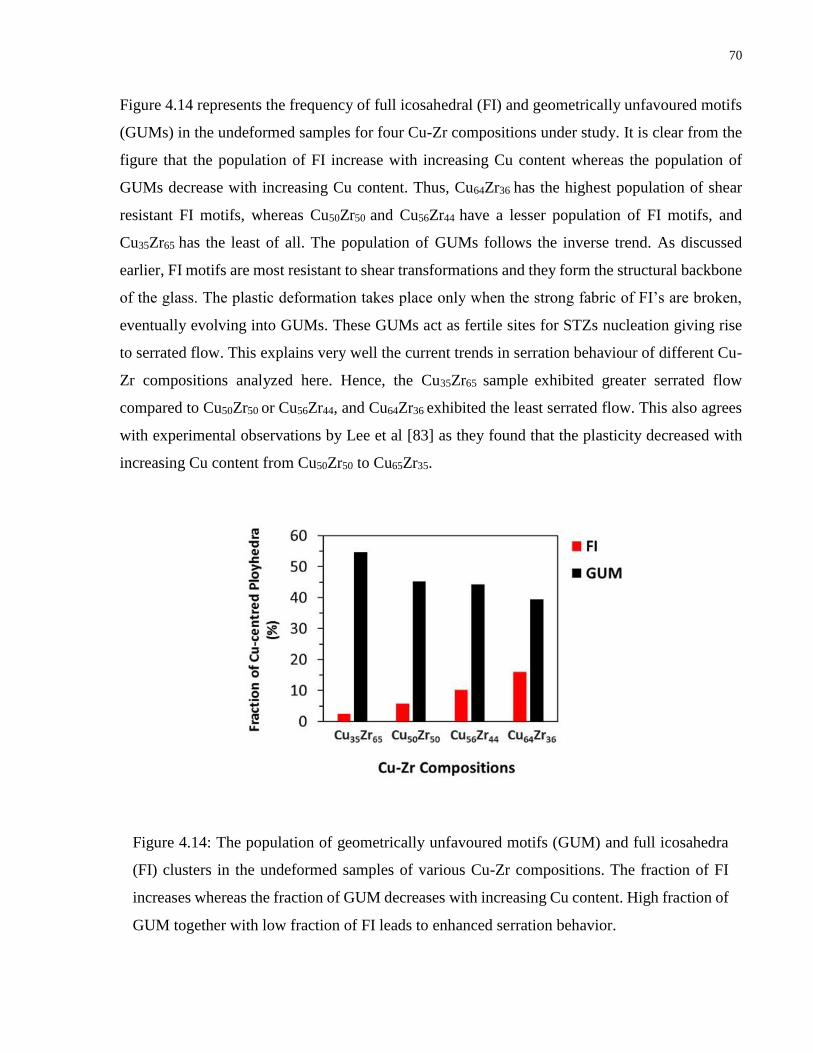
70
Figure 4.14 represents the frequency of full icosahedral (FI) and geometrically unfavoured motifs
(GUMs) in the undeformed samples for four Cu-Zr compositions under study. It is clear from the
figure that the population of FI increase with increasing Cu content whereas the population of
GUMs decrease with increasing Cu content. Thus, Cu64Zr36 has the highest population of shear
resistant FI motifs, whereas Cu50Zr50 and Cu56Zr44 have a lesser population of FI motifs, and
Cu35Zr65 has the least of all. The population of GUMs follows the inverse trend. As discussed
earlier, FI motifs are most resistant to shear transformations and they form the structural backbone
of the glass. The plastic deformation takes place only when the strong fabric of FI’s are broken,
eventually evolving into GUMs. These GUMs act as fertile sites for STZs nucleation giving rise
to serrated flow. This explains very well the current trends in serration behaviour of different Cu-
Zr compositions analyzed here. Hence, the Cu35Zr65 sample exhibited greater serrated flow
compared to Cu50Zr50 or Cu56Zr44, and Cu64Zr36 exhibited the least serrated flow. This also agrees
with experimental observations by Lee et al [83] as they found that the plasticity decreased with
increasing Cu content from Cu50Zr50 to Cu65Zr35.
Figure 4.14: The population of geometrically unfavoured motifs (GUM) and full icosahedra
(FI) clusters in the undeformed samples of various Cu-Zr compositions. The fraction of FI
increases whereas the fraction of GUM decreases with increasing Cu content. High fraction of
GUM together with low fraction of FI leads to enhanced serration behavior.

71
4.4. Summary
In summary, we studied the atomic origins of serration behavior in BMGs in this chapter. The MG
samples with CuxZr100-x (x = 35, 50, 56 and 64) compositions were prepared by relax-melt-quench
procedure and by employing uniaxial tensile deformation, stress-strain curves with profuse
discernable serration events were obtained. The underlying short range structural origins of
serration events were uncovered. The analysis revealed that stress drop events occurred due to
coupled slipping of several atoms present in specific groups/clusters. By one to one mapping of
these atoms to their corresponding Voronoi polyhedra we found that most of these groups belong
to the class of geometrically unfavoured motifs (GUMs) acting as ‘weak spots’ in the amorphous
matrix. In contrast, the stress accumulation events showed little plastic deformation as no new
STZs were visible in the sample as the system moved from a low stress state to a high stress state.
There is an increase in the number and magnitude of stress drop events during the late stages of
deformation due to the breakdown and evolution of full icosahedral motifs into GUMs. The
serration behaviour was found to become more prominent with increasing operating temperature
due to the increase in GUMs population, fertile sites for STZs, together with a decrease in shear
resistant FIs. Slower system dynamics at low strain rates allowed more time for atoms to participate
in coupled slipping, thereby giving rise to enhanced serration behaviour at lower strain rates. Also,
a linear relationship model between the mean Δσ and the logarithm of strain rate exhibited a good
fit. Finally, the trend of decrease in FI population and increase in GUMs population with
decreasing Cu content in the Cu-Zr MG compositions was found to correlate with serration
behavior becoming more prominent in low Cu content compositions. The observations obtained
from this analysis have a broader applicability for understanding the serration behavior and the
effect of various influencing parameters on the serrated flow of bulk metallic glasses, in general.
72
Chapter 5
5. Conclusions and Future Work
5.1. Summary and Overall Contribution
The challenge for developing new BMG alloys to be used as structural materials is twofold. First,
to advance the current understanding of glass forming ability and factors affecting it, and to
rigorously test the applicability of current predictive GFA indicators and search for more robust
indicators. Utilizing this knowledge, the ultimate goal is to find novel alloy compositions with
superior glass forming abilities, which can push the critical casting diameters higher and cooling
rate requirements lower. Second, to devise new design approaches to arrest the sudden brittle
failure and enhance the ductility of BMG to make a case for their use as structural materials. In an
attempt to address the first challenge, the first study described in this thesis explored the
fundamental connections between a host of emergent properties and glass forming ability.
Molecular Dynamics based atomistic simulations were performed to model the quenching and
glass forming process for CuxZr100-x (x=35, 40, 45, 50, 52.5, 55, 57.5, 60, 65, 70, 75, 80, and 85
atomic percent) compositions, and the kinetic, thermodynamic and structural properties in melt as
well as supercooled domain were computed. A MD based property extraction, analysis and high
GFA composition search tool was developed, which revealed the strong influence of underlying
equilibrium crystalline phases and properties of the melt phase on the elastic, bulk physical and
transport properties of resulting amorphous phase, and also successfully predicted the three high
GFA compositions for Cu-Zr binary metallic glass system. This tool can be potentially extended
for GFA predictions in general transition metal and metalloid based metallic glasses provided the
accurate interatomic potentials are available.
To address the second challenge, the fundamental deformation mechanisms need to be de-
convoluted and underlying science needs to be well established. Homogenous deformation, or the
serrated flow, delays the formation of the critical shear band in a BMG and thus enhance its
plasticity. Although, this phenomenon has been extensively studied experimentally, the atomic

73
level mechanism of serration events in not fully resolved. The structural changes occurring at the
atomic scale are difficult to examine through experiments, but can be studied in detail by molecular
dynamics simulations. Hence, mechanical deformation test simulations in uniaxial tensile direction
were performed in the second study and the serration behavior was comprehensively investigated.
Finite element (FE) based modal analysis was also conducted in this work to model the geometry
and simulate the fundamental frequencies of resonance to assist the experimental team in
development of the said test piece. (see Appendix A)
From the two atomistic studies and modal analysis of the test geometry, the following main
contributions and implications of the work, relevant to the advancement of current understandings,
may be drawn:
5.1.1. Emergent Properties and Connections to Glass Forming Ability
Liquid-crystal fractional density difference is accepted as a single most effective GFA
indicator. However, its miss-identification of Cu80Zr20 as a high GFA composition reveals
that its correlation with GFA may not be universally true as often claimed and seems to
work only in a limited compositional domain.
The bulk physical properties, atomic transport properties and short range ordering in the
amorphous phase displayed strong signatures of the underlying equilibrium phases.
Low crystal fraction in the amorphous phase is usually associated with high GFA
compositions. However, the good GFA composition of Cu50Zr50 exhibited high fraction of
BCC <0,6,0,8> polyhedra. Although seems contrary to the general understanding, the high
crystal fraction in Cu50Zr50 represents the strong influence of the underlying equilibrium
crystalline phase (BCC structure) on the amorphous phase.
Chemical short range ordering, as determined by the mean coordination number deviation
between zirconium and copper atoms was found to be a robust new indicator of GFA as it
successfully identified the three high GFA compositions Cu64Zr36, Cu56Zr44 and Cu50Zr50
in the binary Cu-Zr metallic glass system.

74
5.1.2. Atomic level structural origins of Serration Events
Serration behavior of a composition is essentially determined by its short range structural
order, specifically, by the relative population of full icosahedra (FI) motifs and
geometrically unfavorable motifs (GUMs).
GUMs act as the ‘weak spots’ in the amorphous matrix and co-slipping of atoms belonging
to GUMs causes stress drop events. The magnitude of such stress drops is correlates with
the number of atoms involved in the slip.
Serration behavior becomes severe during late stages of deformation due to the continuous
breakdown of shear resistant FI motif into ‘weak’ GUMs.
Enhanced serration behavior at high temperatures and low strain rates indicates that this is
a thermally activated phenomenon.
Compositions with high fraction of FI motifs and low fraction of GUMs show less severe
serrated flow, and thus are more brittle than the compositions with low fraction of FI and
high fraction of GUMs, which exhibit more severe serration behavior. Thus, the ductility
of BMGs may be compositionally tuned.
5.1.3. Development of the BMG component for vibrational testing for Gedex
Inc.
With iterative modeling and modal analysis, the required geometry and dimensions of the
test piece were determined for which the resonant frequency of the symmetric mode lies
within 1KHz range, as stipulated by Gedex Inc.
Sensitivity analysis of the resonant frequencies revealed that the frequencies remain within
the desired range for up-to 20% change in the elastic modulus and dimensional
inconsistency. However, dimensional inconsistency may result in large losses at the
clamped end.
The BMG component for vibrational testing was cast and machined in the predicted
geometry and successfully delivered to Gedex Inc.

75
5.2. Future Work
The glass forming ability of a composition is highly sensitive to the particular atomic percentages
of the constituent elements and even a change of 1 atomic percent may adversely affect the GFA
of the composition in question. This was also found in this study, especially looking at the trends
in fractional density differences (figure 3.2), where only Cu56.5Zr43.5 exhibited a peak in the
distribution in comparison to the nearby compositions. However, extreme care must be exercised
around such local minimums and maximums. One can never be sure the exact location of these
saddle points without carrying out calculations very close to such compositions. Therefore, ideally
for a GFA search tool, the composition step should be as low as possible to ensure all such saddle
points are captured before drawing any conclusions on the efficacy of a certain predictive indicator.
However, we are limited by the computational resources needed to calculate all the properties with
a very low compositional step. A potential way forward is to first use a broad compositional step,
that can capture the trends in bulk properties and determine saddle points, followed by a refinement
of these saddle points by using very small composition steps near such minimums and maximums.
The two studies conducted in this work have both highlighted the influence of short range order
on glass formation, mechanical properties and ductility of metallic glasses. The type of Voronoi
polyhedra the atoms belong to govern the atomic mobilities and diffusion rates, which in turn
directly influence the glass transition dynamics. Hence, a potential way forward to further the
science of GFA prediction could be the modification of common GFA indictors to also account
for local atomic packing and discovering new GFA predictive indicators tied to short range
ordering. Also, a steep rise in the population of icosahedra clusters is found near the glass transition
of high GFA melts, suggesting a preferential cluster transition from the geometrically unfavoured
motifs towards polyhedra with CN=12 around copper atom. Thus, the ease of glass formation
could be indirectly governed by such cluster transitions, their transition pathways and the
associated energy barriers. Similarly, the investigation of serration behavior has revealed that the
ductility of a metallic glass is governed by its short range atomic structure as determined by the
relative population of full icosahedra and geometrically unfavoured motifs. Voronoi polyhedra
continuously evolve and transform into one type or another, either due to internal thermal
activation or due to external applied stress. It is thus, imperative to further our understanding on
such transitions so that the properties of a metallic glass can be tuned in a controlled manner. The
co-sipping of several GUM clusters resulted in formation of an embryonic shear bands (ESB) and

76
a corresponding stress drop event. However, it is not still resolved why some of these ESBs get
arrested/diffused while one of them leads to the formation of a major critical shear band eventually
leading to failure. Thus, the factors causing the arrest or propagation of ESBs is worth investigating
in future.
In the long term, the two main future avenues of research explored in conjunction with this work
are:
5.2.1. Atomistic understanding of β-relaxations and associated activation
free energy barriers for cluster transitions
β-relaxation, or the secondary relaxation, is the principle relaxation mode below the glass transition
temperature and is widely acknowledged to govern the physical and mechanical properties of
metallic glasses [84-86]. β-relaxations are associated with highly frequent and rapid localized
atomic rearrangements/cluster rearrangements. Although the effects of these rearrangements are
localized, this phenomenon has been attributed as a precursor to glass transition [87] as well as
shear transformations in metallic glasses [88]. Thus, in order to further the current understanding
of GFA and deformation mechanisms, it is imperative to study the underlying mechanisms of β-
relaxations. While it is known that this is a thermally activated phenomenon, energetics of this
process has not been investigated at finite temperature. Specifically, the preferred transition
pathways of the clusters and energy barriers associated with such transitions have not been
calculated. MD simulations in conjunction with Metadynamics [89], a finite temperature energy
sampling technique may be used to uncover the relative stabilities of different clusters/Voronoi
polyhedra, the cluster transition mechanisms and calculate the activation energies associated with
such transitions.
Initial simulations have revealed that icosahedral clusters possess a wide range of activation
energies (up-to 2eV) indicating their superior stability. In contrast, consistently lower activation
energies, with a 0.6eV difference in mean activation energy compared to Full Icosahedra
<0,0,12,0> clusters at 300k, were found for <0 4 4 4>, <1 3 4 3 1>, <1 3 4 4 1> clusters which
belong to the group of GUMs. Moreover, the stable cluster types were found to quickly revert back
to their initial structure, while the atoms in GUM clusters were easily displayed to higher RMSD
values.

77
Further investigation and analysis needs to be conducted to ensure the reproducibility of these
preliminary results. Also, the activation energies and some cluster transition pathways are expected
to change when the system is under loading, which needs more rigorous and through investigation.
5.2.2. Fracture of BMGs
Fracture is the most common way by which materials fail and understanding the fracture behavior
of a material is crucial for materials to be used in structural applications. Until recently, the study
of fracture mechanisms and crack behavior in BMG has only received little attention [90]. The
current understanding of the atomic scale mechanisms on fracture stems from the work of Murali
et al [91] who studied the crack behavior of a brittle (FeP) and a ductile glass (CuZr) through MD
simulations and concluded that crack propagates in the brittle glass via nanoscale void nucleation
and coalescence events at the crack tip, whereas crack tip blunting is observed in ductile glasses
due to extensive shear banding. The fracture behavior across the compositional domains have not
been studied until now and it is worthwhile to investigate how macroscopic cracks propagate in
different compositions of a MG system. Such an understanding may lead to advances in our
knowledge on compositional tuning of strength and ductility of BMGs.
Initial MD simulations were performed on the fracture behavior of three compositions of Cu-Zr
bulk metallic glasses viz. Cu35Zr65, Cu56Zr44 and Cu64Zr36. Counter-intuitive to the general
understanding that increasing the Cu concentration in a Cu-Zr binary metallic glasses decreases
the ductility, it was found that Cu56Zr44 had the highest ductility amongst the three compositions.
Atomistic snapshots revealed that the Cu56Zr44 sample dissipated energy via two distinct major
shear bands (see figure 5.1), while only one major shear band developed in Cu35Zr65 and Cu64Zr36,
which explained the difference in ductility.
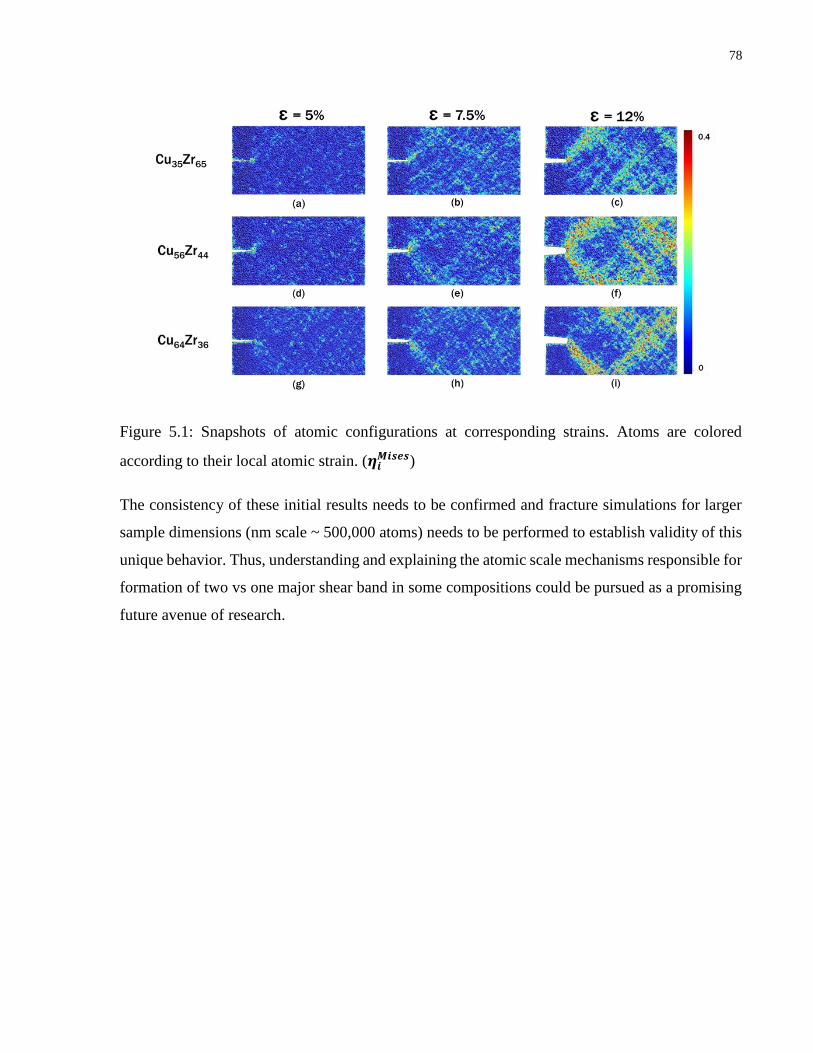
78
Figure 5.1: Snapshots of atomic configurations at corresponding strains. Atoms are colored
according to their local atomic strain. (𝜼𝒊𝑴𝒊𝒔𝒆𝒔)
The consistency of these initial results needs to be confirmed and fracture simulations for larger
sample dimensions (nm scale ~ 500,000 atoms) needs to be performed to establish validity of this
unique behavior. Thus, understanding and explaining the atomic scale mechanisms responsible for
formation of two vs one major shear band in some compositions could be pursued as a promising
future avenue of research.

79
Bibliography
1. Klement, W., R.H. Willens, and P. Duwez, Non-Crystalline Structure in Solidified Gold-
Silicon Alloys. Nature, 1960. 187(4740): p. 869-870.
2. Inoue, A., T. Zhang, and T. Masumoto, Glass-Forming Ability of Alloys. Journal of Non-
Crystalline Solids, 1993. 156: p. 473-480.
3. Sedighi, S., Atomistic Modelling and Prediction of Glass Forming Ability in Bulk
Metallic Glasses. 2015.
4. Spaepen, F. and D. Turnbull, Metallic Glasses. Annual Review of Physical Chemistry,
1984. 35: p. 241-263.
5. Inoue, A., Stabilization of metallic supercooled liquid and bulk amorphous alloys. Acta
Materialia, 2000. 48(1): p. 279-306.
6. Wang, W.H., C. Dong, and C.H. Shek, Bulk metallic glasses. Materials Science &
Engineering R-Reports, 2004. 44(2-3): p. 45-89.
7. Telford, M., The case for bulk metallic glass. Materials Today, 2004. 7(3): p. 36-43.
8. Miracle, D.B., A structural model for metallic glasses. Nature materials, 2004. 3(10): p.
697-702.
9. Miracle, D., The efficient cluster packing model–an atomic structural model for metallic
glasses. Acta materialia, 2006. 54(16): p. 4317-4336.
10. Sheng, H., et al., Atomic packing and short-to-medium-range order in metallic glasses.
Nature, 2006. 439(7075): p. 419-425.
11. Li, M., et al., Structural heterogeneity and medium-range order in ZrxCu100-x metallic
glasses. Physical Review B, 2009. 80(18).
12. Cheng, Y.Q. and E. Ma, Atomic-level structure and structure-property relationship in
metallic glasses. Progress in Materials Science, 2011. 56(4): p. 379-473.
13. Cheng, Y.Q., E. Ma, and H.W. Sheng, Atomic Level Structure in Multicomponent Bulk
Metallic Glass. Physical Review Letters, 2009. 102(24).
14. Hirata, A., et al., Direct observation of local atomic order in a metallic glass. Nature
Materials, 2011. 10(1): p. 28-33.
15. Luo, W.K., et al., Icosahedral short-range order in amorphous alloys. Physical Review
Letters, 2004. 92(14).
16. Bernal, J.D., Geometrical Approach to the Structure of Liquids. Nature, 1959. 183(4655):
p. 141-147.
80
17. Frank, F.C., Supercooling of Liquids. Proceedings of the Royal Society of London Series
a-Mathematical and Physical Sciences, 1952. 215(1120): p. 43-46.
18. Brostow, W., J.P. Dussault, and B.L. Fox, Construction of Voronoi Polyhedra. Journal of
Computational Physics, 1978. 29(1): p. 81-92.
19. Cao, A., Y. Cheng, and E. Ma, Structural processes that initiate shear localization in
metallic glass. Acta Materialia, 2009. 57(17): p. 5146-5155.
20. Ritter, Y., Molecular Dynamics Simulations of Structure-Property Relationships in Cu-Zr
Metallic Glasses. 2012.
21. Ding, J., et al., Soft spots and their structural signature in a metallic glass. Proceedings
of the National Academy of Sciences, 2014. 111(39): p. 14052-14056.
22. Ashby, M.F. and A.L. Greer, Metallic glasses as structural materials. Scripta Materialia,
2006. 54(3): p. 321-326.
23. Spaepen, F., Microscopic Mechanism for Steady-State Inhomogeneous Flow in Metallic
Glasses. Acta Metallurgica, 1977. 25(4): p. 407-415.
24. Argon, A.S., Plastic-Deformation in Metallic Glasses. Acta Metallurgica, 1979. 27(1): p.
47-58.
25. Chen, M.W., Mechanical behavior of metallic glasses: Microscopic understanding of
strength and ductility. Annual Review of Materials Research, 2008. 38: p. 445-469.
26. Schuh, C.A. and A.C. Lund, Atomistic basis for the plastic yield criterion of metallic
glass. Nature materials, 2003. 2(7): p. 449-452.
27. Lund, A. and C. Schuh, The Mohr–Coulomb criterion from unit shear processes in
metallic glass. Intermetallics, 2004. 12(10): p. 1159-1165.
28. Johnson, W.L. and K. Samwer, A universal criterion for plastic yielding of metallic
glasses with a (T/T-g)(2/3) temperature dependence. Physical Review Letters, 2005.
95(19).
29. Falk, M.L. and J.S. Langer, Dynamics of viscoplastic deformation in amorphous solids.
Physical Review E, 1998. 57(6): p. 7192-7205.
30. Ercolessi, F., A molecular dynamics primer. Spring college in computational physics,
ICTP, Trieste, 1997. 19.
31. Plimpton, S., Fast parallel algorithms for short-range molecular dynamics. Journal of
computational physics, 1995. 117(1): p. 1-19.
32. Mendelev, M., et al., Development of suitable interatomic potentials for simulation of
liquid and amorphous Cu–Zr alloys. Philosophical Magazine, 2009. 89(11): p. 967-987.
33. Lee, J.G., Computational materials science: an introduction. 2011: Crc Press.

81
34. Mendelev, M., et al., Molecular dynamics simulation of diffusion in supercooled Cu–Zr
alloys. Philosophical Magazine, 2009. 89(2): p. 109-126.
35. Sedighi, S., et al., Investigating the atomic level influencing factors of glass forming
ability in NiAl and CuZr metallic glasses. The Journal of chemical physics, 2015.
143(11): p. 114509.
36. Chen, T., B. Smit, and A.T. Bell, Are pressure fluctuation-based equilibrium methods
really worse than nonequilibrium methods for calculating viscosities? The Journal of
chemical physics, 2009. 131(EPFL-ARTICLE-200674): p. 246101-2.
37. Daivis, P.J. and D.J. Evans, Comparison of Constant-Pressure and Constant Volume
Nonequilibrium Simulations of Sheared Model Decane. Journal of Chemical Physics,
1994. 100(1): p. 541-547.
38. Lin, S.T., M. Blanco, and W.A. Goddard, The two-phase model for calculating
thermodynamic properties of liquids from molecular dynamics: Validation for the phase
diagram of Lennard-Jones fluids. Journal of Chemical Physics, 2003. 119(22): p. 11792-
11805.
39. Zhang, Y., N. Mattern, and J. Eckert, Atomic structure and transport properties of
Cu50Zr45Al5 metallic liquids and glasses: molecular dynamics simulations. Journal of
Applied Physics, 2011. 110(9): p. 093506.
40. Shimizu, F., S. Ogata, and J. Li, Theory of shear banding in metallic glasses and
molecular dynamics calculations. Materials transactions, 2007. 48(11): p. 2923-2927.
41. Ghosh, G., First-principles calculations of structural energetics of Cu–TM (TM= Ti, Zr,
Hf) intermetallics. Acta materialia, 2007. 55(10): p. 3347-3374.
42. Mukherjee, S., et al., Viscosity and specific volume of bulk metallic glass-forming alloys
and their correlation with glass forming ability. Acta Materialia, 2004. 52(12): p. 3689-
3695.
43. Yu, H.B., et al., Chemical influence on beta-relaxations and the formation of molecule-
like metallic glasses. Nature Communications, 2013. 4.
44. Kang, D.H., et al., Interfacial Free Energy Controlling Glass-Forming Ability of Cu-Zr
Alloys. Scientific Reports, 2014. 4.
45. Li, Y., et al., Matching glass-forming ability with the density of the amorphous phase.
science, 2008. 322(5909): p. 1816-1819.
46. Russew, K., et al. Thermal behavior and melt fragility number of Cu100-x Zrx glassy
alloys in terms of crystallization and viscous flow. in Journal of Physics: Conference
Series. 2009. IOP Publishing.
47. Kelton, K.F., Crystal Nucleation in Supercooled Liquid Metals. Int. J. Microgravity Sci.
Appl. Vol, 2013. 30(1): p. 11-18.

82
48. Wu, Z., et al., Correlation between structural relaxation and connectivity of icosahedral
clusters in CuZr metallic glass-forming liquids. Physical Review B, 2013. 88(5): p.
054202.
49. Angell, C.A., et al., Relaxation in glassforming liquids and amorphous solids. Journal of
Applied Physics, 2000. 88(6): p. 3113-3157.
50. Grigera, T., et al., Phonon interpretation of the ‘boson peak’in supercooled liquids.
Nature, 2003. 422(6929): p. 289-292.
51. Zhang, Y., N. Mattern, and J. Eckert, Atomic structure and transport properties of
Cu50Zr45Al5 metallic liquids and glasses: Molecular dynamics simulations. Journal of
Applied Physics, 2011. 110(9).
52. Rycroft, C., Voro++: A three-dimensional Voronoi cell library in C++. Lawrence
Berkeley National Laboratory, 2009.
53. Du, J., et al., Phase stability, elastic and electronic properties of Cu–Zr binary system
intermetallic compounds: A first-principles study. Journal of Alloys and Compounds,
2014. 588: p. 96-102.
54. Pan, S.-P., et al., Crystallization pathways of liquid-bcc transition for a model iron by fast
quenching. Scientific reports, 2015. 5.
55. Alexander, S. and J. McTague, Should all crystals be bcc? Landau theory of
solidification and crystal nucleation. Physical Review Letters, 1978. 41(10): p. 702.
56. Johnson, W.L., Bulk glass-forming metallic alloys: Science and technology. MRS
bulletin, 1999. 24(10): p. 42-56.
57. Löffler, J.F., Bulk metallic glasses. Intermetallics, 2003. 11(6): p. 529-540.
58. Schuh, C.A., T.C. Hufnagel, and U. Ramamurty, Mechanical behavior of amorphous
alloys. Acta Materialia, 2007. 55(12): p. 4067-4109.
59. Trexler, M.M. and N.N. Thadhani, Mechanical properties of bulk metallic glasses.
Progress in Materials Science, 2010. 55(8): p. 759-839.
60. Fan, C. and A. Inoue, Ductility of bulk nanocrystalline composites and metallic glasses at
room temperature. Applied Physics Letters, 2000. 77: p. 46.
61. Liu, Y.H., et al., Super plastic bulk metallic glasses at room temperature. science, 2007.
315(5817): p. 1385-1388.
62. Li, H., P.K. Liaw, and H. Choo, On the serrated behavior during plastic deformation of a
Zr-based bulk metallic glass. Materials transactions, 2007. 48(11): p. 2919-2922.
63. Zhang, Y., W. Wang, and A. Greer, Making metallic glasses plastic by control of
residual stress. Nature materials, 2006. 5(11): p. 857-860.

83
64. Dubach, A., F.H. Dalla Torre, and J.F. Löffler, Constitutive model for inhomogeneous
flow in bulk metallic glasses. Acta Materialia, 2009. 57(3): p. 881-892.
65. Sun, B., et al., Origin of intermittent plastic flow and instability of shear band sliding in
bulk metallic glasses. Physical review letters, 2013. 110(22): p. 225501.
66. Klaumünzer, D., R. Maaß, and J.F. Löffler, Stick-slip dynamics and recent insights into
shear banding in metallic glasses. Journal of Materials Research, 2011. 26(12): p. 1453-
1463.
67. Thurnheer, P., et al., Dynamic properties of major shear bands in Zr–Cu–Al bulk metallic
glasses. Acta Materialia, 2015. 96: p. 428-436.
68. Antonaglia, J., et al., Tuned critical avalanche scaling in bulk metallic glasses. Scientific
reports, 2014. 4: p. 4382.
69. Pampillo, C. and H. Chen, Comprehensive plastic deformation of a bulk metallic glass.
Materials Science and Engineering, 1974. 13(2): p. 181-188.
70. Dalla Torre, F.H., et al., Temperature, strain and strain rate dependence of serrated flow
in bulk metallic glasses. Materials transactions, 2007. 48(7): p. 1774-1780.
71. Golovin, Y.I., et al., Serrated plastic flow during nanoindentation of a bulk metallic
glass. Scripta materialia, 2001. 45(8): p. 947-952.
72. Schuh, C. and T. Nieh, A nanoindentation study of serrated flow in bulk metallic glasses.
Acta Materialia, 2003. 51(1): p. 87-99.
73. Schuh, C.A., A.C. Lund, and T. Nieh, New regime of homogeneous flow in the
deformation map of metallic glasses: elevated temperature nanoindentation experiments
and mechanistic modeling. Acta Materialia, 2004. 52(20): p. 5879-5891.
74. Moser, B., J. Löffler, and J. Michler, Discrete deformation in amorphous metals: an in
situ SEM indentation study. Philosophical Magazine, 2006. 86(33-35): p. 5715-5728.
75. Antonaglia, J., et al., Bulk metallic glasses deform via slip avalanches. Physical review
letters, 2014. 112(15): p. 155501.
76. Thurnheer, P., et al., Compositional dependence of shear-band dynamics in the Zr–Cu–Al
bulk metallic glass system. Applied Physics Letters, 2014. 104(10): p. 101910.
77. Li, J., Z. Wang, and J. Qiao, Power-law scaling between mean stress drops and strain
rates in bulk metallic glasses. Materials & Design, 2016. 99: p. 427-432.
78. Mattern, N., et al., Short-range order of Cu–Zr metallic glasses. Journal of Alloys and
Compounds, 2009. 485(1): p. 163-169.
79. Li, J., AtomEye: an efficient atomistic configuration viewer. Modelling and Simulation in
Materials Science and Engineering, 2003. 11(2): p. 173.
84
80. Stukowski, A., Visualization and analysis of atomistic simulation data with OVITO–the
Open Visualization Tool. Modelling and Simulation in Materials Science and
Engineering, 2009. 18(1): p. 015012.
81. Wang, X., et al., Atomic picture of elastic deformation in a metallic glass. Scientific
reports, 2015. 5.
82. Xu, D., et al., Bulk metallic glass formation in binary Cu-rich alloy series–Cu 100− x Zr
x (x= 34, 36, 38.2, 40 at.%) and mechanical properties of bulk Cu 64 Zr 36 glass. Acta
Materialia, 2004. 52(9): p. 2621-2624.
83. Lee, J.-C., et al., Origin of the plasticity in bulk amorphous alloys. Journal of Materials
Research, 2007. 22(11): p. 3087-3097.
84. Yu, H.B., et al., Tensile Plasticity in Metallic Glasses with Pronounced beta Relaxations.
Physical Review Letters, 2012. 108(1).
85. Yu, H.B., et al., Correlation between beta Relaxation and Self-Diffusion of the Smallest
Constituting Atoms in Metallic Glasses. Physical Review Letters, 2012. 109(9).
86. Liu, W.D., H.H. Ruan, and L.C. Zhang, Atomic rearrangements in metallic glass: Their
nucleation and self-organization. Acta Materialia, 2013. 61(16): p. 6050-6060.
87. Capaccioli, S., et al., Many-Body Nature of Relaxation Processes in Glass-Forming
Systems. Journal of Physical Chemistry Letters, 2012. 3(6): p. 735-743.
88. Yu, H.B., et al., Relating activation of shear transformation zones to beta relaxations in
metallic glasses. Physical Review B, 2010. 81(22).
89. Laio, A. and F.L. Gervasio, Metadynamics: a method to simulate rare events and
reconstruct the free energy in biophysics, chemistry and material science. Reports on
Progress in Physics, 2008. 71(12).
90. Sun, B.A. and W.H. Wang, The fracture of bulk metallic glasses. Progress in Materials
Science, 2015. 74: p. 211-307.
91. Murali, P., et al., Atomic Scale Fluctuations Govern Brittle Fracture and Cavitation
Behavior in Metallic Glasses. Physical Review Letters, 2011. 107(21).

85
Appendix A
A. Development of a BMG Component for vibrational testing for Gedex Inc.
The conventional methods of discovering mineral deposits are time-consuming, cost intensive and
have poor success of exploration. Gedex Inc. has developed a state of the art Airborne Gravity
Gradiometer (AAG) to be used for mineral exploring by an aerial survey of the land mass. AAG
detects the presence of deposits beneath the surface of the Earth by sensing the small changes in
the gravitational field arising from the difference in subsurface density near the location of
deposits. The current design of AAG uses a Niobium based pivot-flexure component in the
Orthogonal Quadrupole Responder (OQR). In order to meet the desired material property
requirements for this application, the Nb pivot component has to be maintained at cryogenic
temperatures. The liquid helium circulating system, necessary to maintain the low temperatures,
adds complexity and bulkiness to the system, and also adds noise to the data. Thus, Gedex Inc. is
currently investigating alternative materials that possess the desired mechanical properties at room
temperature. The superior mechanical and magnetic properties exhibited by BMGs at room
temperature make them a suitable candidate to be used in this application. Replacing Nb based
component with a BMG based component will simplify the system by eliminating the liquid
helium circulating system thereby enhancing the performance of AAG. Table A.1 compares the
properties of Nb at 20K, BMGs at room temperature and critical material properties for the pivot
component, adapted from [1].
Table A.1: Comparison of key material properties, adapted from [1]
Material Property Nb at 20K BMGs at RT Criteria
Young’s Modulus (GPa) 125 146 ≥ 90
Elastic Limit (MPa) 1150 2420 ≥ 1150
Ultimate Tensile Strength (MPa) 1175 2500 ≥ 1800
Maximum Elastic Deflection (%) 1.2 2.7 ≥ 1.8
Loss Coefficient / Internal Friction (Q-1) 9E-09 1E-07 ≤ 10-6
Linear Coefficient of Thermal Expansion
(m/m/°C)
2.0E-07 8.0E-06 ~2.0E-07
Fatigue Limit (MPa) 75 at RT 1100 >75

86
The experimental team at the University of Toronto has identified a BMG composition -
Zr56Ni20Al15Cu5Nb4 with properties in the required range and successfully produced a fully
amorphous sample by arc melting and suction casting, completing one of the objectives of this
project. Electrochemical Micromachining (ECMM) and Abrasive Water Jet Machining (AWJM)
were also identified and tested as viable sectioning/patterning techniques for the produced alloy.
The Zr56Ni20Al15Cu5Nb4 sample were produced as 3mm dia. cylindrical rods of ~30mm in length,
as shown in figure A.1(a). After removing the head, the remaining length of the produced rod is
~25mm (figure A.1(b)).
Another deliverable of the project was to fabricate a test piece of the candidate BMG composition
in a geometry suitable to carry out vibrational testing by Gedex Inc. The objective of this work
was to perform numerical finite element analysis to optimize the geometry of the test piece. Based
on early inputs from Gedex Inc., a conventional tuning fork geometry was ideally preferred. In
order to machine the 3mm dia. rods into a geometry resembling a tuning fork, it was decided to
cut a 0.5mm wide and ~15mm long groove through the sample, as shown in Figure A.2. The
geometry was modelled in ANSYS Design Modeler and the vibrational analysis simulations were
performed using the Modal Analysis module of ANSYS 16.1 [2]. The sample was clamped (fixed
boundary condition) at the base as shown in figure A.2.
Figure A.1 (a) As cast sample. (b) Sample with
head removed

87
As obtained from the finite element solution, the
frequencies corresponding to the first four modes of
vibration are tabulated in table A.2. A mesh size
convergence analysis was also performed to determine
the finest mesh size for which the results converged.
Table A.2: First 4 mode frequencies
Mode Frequency
(KHz)
1 2.463
2 2.713
3 3.899
4 5.683
The mode shapes corresponding to these frequencies
are presented in figure A.3 below.
Figure A.3: Mode shapes corresponding to first four natural frequencies for initial test piece model.
Figure A.2: Initial model of the test piece
geometry.

88
The two vibrating prongs can be approximated as two cantilever beams in transverse vibration
mode. From the Euler-Bernoulli beam theory, the frequency of a tuning fork in free vibration is
given by:
𝒇 =𝟏. 𝟖𝟕𝟓𝟐
𝟐𝝅𝒍𝟐√
𝑬𝑰
𝝆𝑨 (A. 1)
Where, E is the young’s modulus of fork material; I is the moment of inertia of the prong cross
section; ρ is the material density; A is the area of cross section of the prong; l is the length of the
prongs and 1.875 is the smallest positive solution of cos(x)cosh(x) = −1
The cross section of the prong is a sector of a circle in this
case. Area of cross section for a sector of circle is given by,
A = 𝑟2
2(𝜃 − 𝑠𝑖𝑛𝜃)
And, second moment of area about x is given by:
𝐼𝑥 =𝑟4
8(𝜃 − 𝑠𝑖𝑛𝜃 + 2𝑠𝑖𝑛𝜃𝑠𝑖𝑛2
𝜃
2)
The second moment of area about the centroidal axis passing through C, can be calculated using
the parallel axis theorem:
𝐼𝑐 = 𝐼𝑥 − 𝐴𝐶𝑦2, where Cy, is given by 𝐶𝑦 =
4𝑟
3(
𝑠𝑖𝑛3𝜃
2
𝜃−𝑠𝑖𝑛𝜃)
For the candidate composition, E=90 GPa and density, ρ = 6.6 g/cm3;
From the geometry, l=15mm; A= 2.79 mm2 and Ic = 0.2056 mm4
Substituting values in equation A.1,
𝒇 =𝟏. 𝟖𝟕𝟓𝟐
𝟐𝝅(𝟎. 𝟎𝟏𝟓)𝟐√
𝟗𝟎 × 𝟏𝟎𝟗 × 𝟎. 𝟐𝟎𝟓𝟔 × 𝟏𝟎−𝟏𝟐
𝟔𝟔𝟎𝟎 × 𝟐. 𝟕𝟗 × 𝟏𝟎−𝟔= 𝟐𝟒𝟗𝟐. 𝟖𝟔 𝑯𝒛 = 𝟐. 𝟒𝟗𝟐 𝑲𝑯𝒛

89
The analytically calculated value of frequency of first mode is 2.492 KHz. It is very close to the
numerically calculated value of 2.463 KHz by ANSYS (% error = 1.2%). The analytical solution
considers no energy loss in damping, which is not the case for a realisitc vibrating system. This
explains the reason for the numerically calculated value of frequency by FEA simulation being
lower than the analytically calculated value.
However, the first mode frequency was still higher than the ideal range desired by Gedex Inc. as
about 1 KHz. Also, the for vibrational property analysis, only the symmetric mode of vibration
(mode 2 here) is of interest in experiments. The opposite movement of the two vibrating prongs in
the symmetric mode results in lowest movement at the base. Thus, when the base is clamped in
the experimental setup, the energy losses at the clamp are minimized.
In the next design iteration, the geometry needed to be further modified in order to lower the
frequency of symmetric mode of vibration as close to 1 KHz or lower. From equation A.1,
𝒇 ∝𝟏
𝒍𝟐√
𝑰
𝑨
If the cross section is approximated to be rectangular with sides b & h, the relation can be reduced
to
𝒇 ∝𝟏
𝒍𝟐√
𝒃𝒉𝟑
𝟏𝟐×
𝟏
𝒃 × 𝒉
⇒ 𝒇 ∝𝟏
𝒍𝟐× 𝒉 (A. 2)
From equation A.2, it is evident that the frequency is directly proportional to the side of the
vibrating prong and inversely proportional to the square of its length. Thus to lower frequency, the
side needs to be reduced and the length needs to be increased. Following that, three variations of
the geometry were modelled and analyzed, as shown in figure A.4.
a. With increased groove width to 1mm.
b. With increased length of prong to 20mm.
c. With increased groove width to 1 mm and increased prong length to 20 mm.

90
Figure A.4: Sample geometries modelled by varying groove width and prong length
The frequencies of the first symmetric mode of vibration
corresponding to these geometries are shown in table A.3.
Table A.3: Frequencies of symmetric mode
Sample Frequency of
symmetric mode
(KHz)
a 2.099
b 1.633
c 1.311
Sample c, with increased groove width and length of the prong was found to be resonating in the
symmetric mode at a frequency of 1.311 KHz, lowest compared to all other samples. Based on this
analysis, this design was proposed to Gedex Inc. Also, to test the viability of this material to be
machined within the dimensional tolerances, an interim specimen was fabricated, as shown in
figure A.5.
Figure A.5: Top view and
elevation of the interim specimen

91
Upon further discussion on the FE analysis and the interim sample design with Gedex Inc., the
outer faces of the vibrating prongs also needed to be machined into rectangular cross sections to
interface with their vibrational testing facility that utilizes a capacitor based exciting mechanism
that works best with rectangular faces. In the subsequent design iteration, the outer faces were
modelled to be rectangular. The edges were also filleted to minimize stress concentrations. The
final geometry is as shown in figure A.6.
Figure A.6: Top view and elevation of the final sample geometry
The symmetric mode frequency and mode shape corresponding to the final sample geometry is
shown in figure A.7
Figure A.7: Symmetric mode shape and frequency of the final sample

92
The Young’s modulus of the selected BMG composition varies between 85-95 GPa depending
upon the atomic percentages of the constituent elements. Since the exact value of the Young’s
modulus of the material was not known, the sensitivity of the frequency of symmetric mode was
analyzed with respect to Young’s modulus. The symmetric mode frequencies were calculated by
varying the Young’s modulus and the results are presented in table A.4.
Table A.4: Frequencies of symmetric mode
Young’s Modulus Frequency of symmetric
mode (KHz)
% change
80 GPa 0.835 15.4%
85 GPa 0.908 8%
90 GPa 0.987 -
95 GPa 1.062 7.6%
Although the frequencies are generally sensitive to the changes in the stiffness properties of the
material, the frequencies of the first symmetric mode are still within the 1 KHz range, and slight
variation in Young’s modulus should not be of concern.
An important aspect to be considered during vibrational testing is the energy loss and damping
from the clamped end. When the prongs of the sample vibrate, the base vibrates up and down. For
symmetric mode of vibration, the movement of the base is minimal. The base can be thus clamped
with minimum energy losses and damping of the vibrations. Ideally, the prongs should be exactly
identical, and any inconsistency may result in larger movement of the base causing larger damping.
To test the sensitivity of the movement of the base with respect to any dimensional dissimilarity,
samples with varying dimensional inconsistencies were analyzed and the total displacement at the
base was recorded. The results are presented in table A.5.

93
Table A.5: Frequencies of symmetric mode
Dimensional
Inconsistency
Total Displacement at
the base % change
0% 1.085 mm -
5% 6.128 mm 400%
10% 12.256 mm 1030%
20% 24.884 mm 2193%
From the analysis, it is clear that the total displacement at the base is highly sensitive to any
inconsistency in the dimensions of the two prongs. High dimensional accuracy is required in the
fabrication process to minimize any losses and damping while vibrational testing of the specimen.
The final specimen was cast and machined based on the geometry in figure A.6 and supplied to
Gedex Inc., completing the project deliverable. The top view and elevation of the final specimen
are shown in figure A.8.
Figure A.8: Top view and elevation of the final test piece delivered to Gedex Inc.

94
References
1. S. J. Thorpe, P. Borges, S. Shankar, Y. Li, X. Zeng, D. Cheung, K. A. Carroll and B.
French, "Application of Glassy Metals to Airborne Gravity Gradiometry," Ontario
Centres of Excellence.
2. ANSYS® Academic Research, Release 16.1

95
Appendix B
B. Python script for calculation of fraction of Voronoi polyhedra from multiple cfg dump files
This script calculates the fractions of Voronoi polyhedra from a cfg dump file output from
LAMMPS. It can process multiple cfg dump files simultaneously and it calculates the fractions of
Voronoi polyhedra corresponding to each cfg file and prints the output in a csv file. Two csv files
are generated with each containing fractions of Voronoi polyhedra with Cu and Zr as center atoms
respectively. In order to calculate evolution of Voronoi polyhedra as a function of overall sample
strain, one can dump cfg files from LAMMPS at each strain step to be analyzed and save all the
cfg files in one directory. This script can be then run on that directory to calculate polyhedra
fractions corresponding to each file. This script is compatible with Python 3.4 language standard
[1]. It runs on Ovito’s [2] python interpreter – OVITOS (the scripting terminal available with
Ovito) and is an extension of Voronoi indices calculation code available on Ovito’s website.
Script ‘voro_evolution.py’:
1. # Import OVITO modules. 2. from ovito.io import * 3. from ovito.modifiers import * 4. 5. # Import NumPy module. 6. import numpy 7. import csv 8. import sys 9. import os 10. 11. # Load a simulation snapshot of a Cu-Zr metallic glass. 12. 13. def row_histogram(a): 14. ca = numpy.ascontiguousarray(a).view([('', a.dtype)] * a.shape[1]) 15. unique, indices, inverse = numpy.unique(ca, return_index=True, return_inverse=True)
16. counts = numpy.bincount(inverse) 17. sort_indices = numpy.argsort(counts)[::-1] 18. return (a[indices[sort_indices]], counts[sort_indices]) 19. 20. for root, dirs, files in os.walk("directory_path", topdown=False): 21. file_name_map = {} 22. file_indexes = [] 23. files = [int((f.split("_")[-1]).split(".")[0]) for f in files] 24. files = sorted(files, key=int) 25. 26. voro_ind_1_dict = {} 27. voro_ind_2_dict = {}

96
28. 29. node = None 30. 31. for name in files: 32. #print("At file: %s" % (name)) 33. sys.stdout.flush() 34. file_name = os.path.join(root, "tensile_" + str(name) + ".cfg") 35. if node: 36. node.source.load(file_name) 37. else: 38. node = import_file(file_name) 39. 40. # Set atomic radii (required for polydisperse Voronoi tessellation). 41. atypes = node.source.particle_properties.particle_type.type_list 42. atypes[0].radius = 1.28 # Cu atomic radius (atom type 1 in input file) 43. atypes[1].radius = 1.60 # Zr atomic radius (atom type 2 in input file) 44. 45. # Set up the Voronoi analysis modifier. 46. voro = VoronoiAnalysisModifier( 47. compute_indices = True, 48. use_radii = True, 49. edge_count = 6, # Length after which Voronoi index vectors are truncated 50. edge_threshold = 0 51. ) 52. node.modifiers.append(voro) 53. 54. # Let OVITO compute the results. 55. node.compute() 56. 57. # Make sure we did not lose information due to truncated Voronoi index vectors.
58. #if voro.max_face_order > voro.edge_count: 59. # "but computed Voronoi indices are truncated after {1} entries. " 60. # "You should consider increasing the 'edge_count' parameter to {0}." 61. # .format(voro.max_face_order, voro.edge_count)) 62. # Note that it would be possible to automatically increase the 'edge_count'
63. # print("Warning: Maximum face order in Voronoi tessellation is {0}, " 64. # parameter to 'max_face_order' here and recompute the Voronoi tessellation
: 65. # voro.edge_count = voro.max_face_order 66. # node.compute() 67. 68. # Access computed Voronoi indices as NumPy array. 69. # This is an (N)x(edge_count) array. 70. voro_indices = node.output.particle_properties['Voronoi Index'].array 71. particle_type = node.output.particle_properties['Particle Type'].array 72. particle_type = particle_type.reshape(particle_type.shape[0], 1) 73. 74. voro_indices_1, voro_indices_2 = [], [] 75. for i in range(voro_indices.shape[0]): 76. if particle_type[i] == 1: 77. voro_indices_1.append(voro_indices[i]) 78. elif particle_type[i] == 2: 79. voro_indices_2.append(voro_indices[i]) 80. 81. voro_indices_1 = numpy.array(voro_indices_1) 82. voro_indices_2 = numpy.array(voro_indices_2) 83. 84. # This helper function takes a two-dimensional array and computes a frequency 85. # histogram of the data rows using some NumPy magic. 86. # It returns two arrays (of equal length):

97
87. # 1. The list of unique data rows from the input array 88. # 2. The number of occurences of each unique row 89. # Both arrays are sorted in descending order such that the most frequent rows 90. # are listed first. 91. 92. # Compute frequency histogram. 93. unique_indices_1, counts_1 = row_histogram(voro_indices_1) 94. unique_indices_2, counts_2 = row_histogram(voro_indices_2) 95. unique_indices_1 = [str(idx) for idx in unique_indices_1] 96. unique_indices_2 = [str(idx) for idx in unique_indices_2] 97. counts_1 = counts_1.tolist() 98. counts_2 = counts_2.tolist() 99. 100. counts_1_percentage = [str(round((100.0 *float(c) / len(voro_indices_1))
, 3)) for c in counts_1] 101. counts_2_percentage = [str(round((100.0 *float(c) / len(voro_indices_2))
, 3)) for c in counts_2] 102. 103. for i in range(len(unique_indices_1)): 104. if unique_indices_1[i] not in voro_ind_1_dict: 105. voro_ind_1_dict[unique_indices_1[i]] = {} 106. voro_ind_1_dict[unique_indices_1[i]][name] = counts_1_percentage[i]
107. 108. for i in range(len(unique_indices_2)): 109. if unique_indices_2[i] not in voro_ind_2_dict: 110. voro_ind_2_dict[unique_indices_2[i]] = {} 111. voro_ind_2_dict[unique_indices_2[i]][name] = counts_2_percentage[i]
112. 113. root = "csv_output_directory_path" 114. with open(root + "voro_1.csv", "w", newline="\n") as csvfile: 115. csvwriter = csv.writer(csvfile, delimiter=",") 116. csvwriter.writerow(["voro_idx"] + files) 117. for idx in voro_ind_1_dict: 118. curr_summary = [idx] 119. for name in files: 120. if name in voro_ind_1_dict[idx]: 121. curr_summary.append(str(voro_ind_1_dict[idx][name])) 122. else: 123. curr_summary.append(str(0)) 124. csvwriter.writerow(curr_summary) 125. 126. 127. with open(root + "voro_2.csv", "w", newline="\n") as csvfile: 128. csvwriter = csv.writer(csvfile, delimiter=",") 129. csvwriter.writerow(["voro_idx"] + files) 130. for idx in voro_ind_2_dict: 131. curr_summary = [idx] 132. for name in files: 133. if name in voro_ind_2_dict[idx]: 134. curr_summary.append(str(voro_ind_2_dict[idx][name])) 135. else: 136. curr_summary.append(str(0)) 137. csvwriter.writerow(curr_summary)
This script can be executed from a bash shell by the command: ./ovitos voro_evolution.py

98
A sample output for Cu-centered Voronoi polyhedra calculation for 10 cfg files in a csv file is as
below:
Figure B.1: A sample output snapshot for Voronoi polyhedra fraction calculation for 10 .cfg files
voro_idx cfg 1 cfg 2 cfg 3 cfg 4 cfg 5 cfg 6 cfg 7 cfg 8 cfg 9 cfg 10
[0 0 0 2 8 2] 13.949 14.276 14.48 13.732 14.222 14.698 14.004 13.419 14.507 14.181
[0 0 0 3 6 4] 10.493 9.758 9.771 9.894 9.962 9.731 9.513 9.608 9.091 9.349
[ 0 0 0 0 12 0] 10.193 10.329 10.044 10.397 10.016 9.717 9.581 9.676 9.445 9.404
[0 0 0 3 6 3] 8.478 8.56 8.615 8.764 8.71 8.587 8.764 8.56 9.05 8.642
[0 0 0 2 8 1] 8.234 8.097 8.152 8.547 8.492 8.356 8.397 8.193 8.193 7.921
[ 0 0 0 1 10 2] 4.124 4.369 4.246 4.6 4.559 4.137 4.328 4.069 4.219 4.314
[0 0 0 4 4 4] 3.77 3.756 3.606 3.688 3.688 3.851 3.62 3.198 3.538 3.375
[0 0 1 2 6 2] 2.749 2.599 2.667 2.749 2.368 2.123 2.627 2.545 2.735 2.695
[0 0 1 2 6 3] 2.15 1.824 2.082 2.109 2.109 2.041 2.096 2.314 2.109 2.246
[0 0 1 3 4 4] 1.878 1.973 1.878 1.66 1.674 1.497 1.783 1.619 1.756 1.851
[0 0 1 2 5 4] 1.783 2.001 2.177 2.055 1.932 2.041 2.055 2.273 2.041 1.919
[0 0 0 4 4 3] 1.742 2.001 1.647 1.824 1.946 2.177 2.055 1.905 2.354 1.892
[0 0 0 4 4 5] 1.674 1.783 2.001 1.837 1.81 1.892 1.66 1.851 2.014 1.81
[0 0 0 3 6 2] 1.66 1.728 1.606 1.415 1.837 1.96 1.633 1.905 1.66 1.892
[0 0 1 3 5 2] 1.579 1.143 1.279 1.347 1.143 1.443 1.402 1.443 1.306 1.388
[0 0 0 2 8 3] 1.538 1.769 1.579 1.606 1.511 1.511 1.511 1.66 1.892 1.443
[0 0 0 2 8 0] 1.143 1.184 1.007 1.13 1.198 1.116 1.266 1.089 1.062 1.007
[0 0 1 3 4 3] 1.102 1.252 0.953 1.116 1.32 1.402 0.898 1.361 1.184 1.266
[0 0 0 3 6 1] 0.912 0.857 0.857 0.993 0.789 0.98 0.817 0.912 0.871 0.98
[0 0 1 2 5 3] 0.857 0.817 1.252 0.844 0.912 1.184 1.034 0.939 1.143 0.912
[0 0 0 4 4 6] 0.789 0.817 0.98 0.749 0.626 0.857 0.735 0.857 0.749 0.68
[0 0 0 5 2 6] 0.749 0.803 0.776 0.708 0.789 0.653 0.667 0.667 0.585 0.735
[0 0 1 0 9 3] 0.735 0.735 0.939 0.667 0.694 0.844 0.721 0.953 0.599 0.694
[0 0 0 5 2 5] 0.626 0.599 0.517 0.504 0.517 0.531 0.585 0.612 0.68 0.912
[0 0 1 2 5 5] 0.612 0.898 0.735 0.776 0.667 0.735 0.776 0.817 0.531 0.817
[0 0 0 3 6 5] 0.612 0.68 0.612 0.721 0.626 0.708 0.749 0.612 0.708 0.64
[0 0 2 2 4 2] 0.599 0.381 0.49 0.476 0.354 0.422 0.367 0.367 0.327 0.49
[0 0 1 4 2 4] 0.585 0.544 0.667 0.762 0.572 0.708 0.626 0.694 0.531 0.64
[0 0 0 2 8 4] 0.544 0.762 0.626 0.762 0.68 0.667 0.653 0.721 0.694 0.762
[0 0 0 5 3 4] 0.531 0.463 0.435 0.367 0.313 0.381 0.299 0.34 0.408 0.367
[0 0 2 2 4 3] 0.517 0.49 0.463 0.612 0.476 0.558 0.626 0.558 0.572 0.504
[0 0 1 3 3 4] 0.476 0.517 0.354 0.585 0.422 0.313 0.612 0.476 0.49 0.422
[0 0 1 4 3 4] 0.476 0.354 0.313 0.395 0.381 0.449 0.354 0.286 0.327 0.463
[0 0 1 3 5 3] 0.476 0.313 0.395 0.395 0.408 0.422 0.408 0.449 0.558 0.367
[0 0 1 3 4 5] 0.463 0.395 0.381 0.408 0.572 0.585 0.558 0.68 0.476 0.653
[0 0 1 4 3 3] 0.435 0.422 0.327 0.449 0.463 0.408 0.449 0.476 0.435 0.504
[0 0 0 3 7 2] 0.422 0.599 0.476 0.395 0.449 0.395 0.517 0.463 0.504 0.504
[0 0 1 4 2 5] 0.408 0.381 0.435 0.395 0.381 0.504 0.381 0.449 0.408 0.544
[0 0 1 1 9 0] 0.408 0.395 0.327 0.299 0.476 0.313 0.408 0.408 0.367 0.449
[0 0 1 3 5 1] 0.381 0.299 0.313 0.286 0.367 0.449 0.463 0.218 0.354 0.422
[0 0 2 3 3 3] 0.367 0.299 0.408 0.327 0.395 0.15 0.395 0.422 0.299 0.395
[0 0 1 1 7 2] 0.327 0.204 0.204 0.204 0.191 0.109 0.299 0.231 0.204 0.218
[0 0 1 2 6 1] 0.286 0.395 0.544 0.327 0.558 0.327 0.327 0.408 0.367 0.449
[0 0 1 1 8 1] 0.286 0.272 0.286 0.286 0.259 0.272 0.272 0.34 0.259 0.299
[0 0 1 2 7 2] 0.286 0.327 0.191 0.231 0.218 0.136 0.327 0.231 0.286 0.286
[0 0 0 4 5 3] 0.272 0.34 0.34 0.299 0.313 0.259 0.313 0.327 0.272 0.299
[0 0 0 4 5 4] 0.259 0.245 0.299 0.34 0.354 0.286 0.245 0.34 0.259 0.313
[0 0 2 2 4 4] 0.218 0.163 0.204 0.204 0.218 0.177 0.163 0.245 0.136 0.231
[0 0 1 5 1 4] 0.191 0.191 0.231 0.259 0.095 0.136 0.177 0.231 0.259 0.191
[0 0 2 2 3 3] 0.191 0.041 0.082 0.068 0.136 0.068 0.068 0.041 0.095 0.095
[0 0 2 2 3 5] 0.177 0.122 0.15 0.191 0.177 0.109 0.245 0.231 0.136 0.204
[0 0 1 1 8 3] 0.163 0.136 0.231 0.163 0.299 0.204 0.218 0.177 0.272 0.272

99
References
1. Python Software Foundation. Python Language Reference, version 3.4. Available at
http://www.python.org
2. Stukowski, A., Visualization and analysis of atomistic simulation data with OVITO–the
Open Visualization Tool. Modelling and Simulation in Materials Science and Engineering,
2009. 18(1): p. 015012