Embed Size (px)
Citation preview
Atomic Spectroscopy
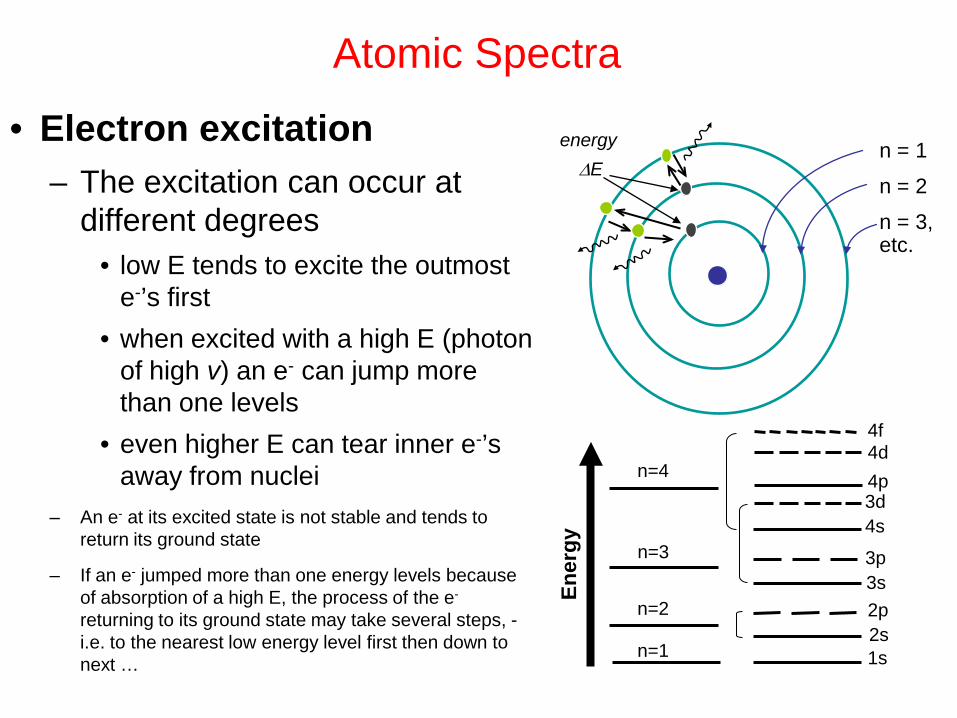
• Electron excitation – The excitation can occur at
different degrees • low E tends to excite the outmost
e-’s first • when excited with a high E (photon
of high v) an e- can jump more than one levels
• even higher E can tear inner e-’s away from nuclei
– An e- at its excited state is not stable and tends to return its ground state
– If an e- jumped more than one energy levels because of absorption of a high E, the process of the e- returning to its ground state may take several steps, - i.e. to the nearest low energy level first then down to next …
Atomic Spectra
Ener
gy
n=1
n=2
n=3
n=4
1s 2s 2p 3s 3p
4s 3d 4p 4d 4f
n = 1
n = 2
n = 3, etc.
energy ∆E
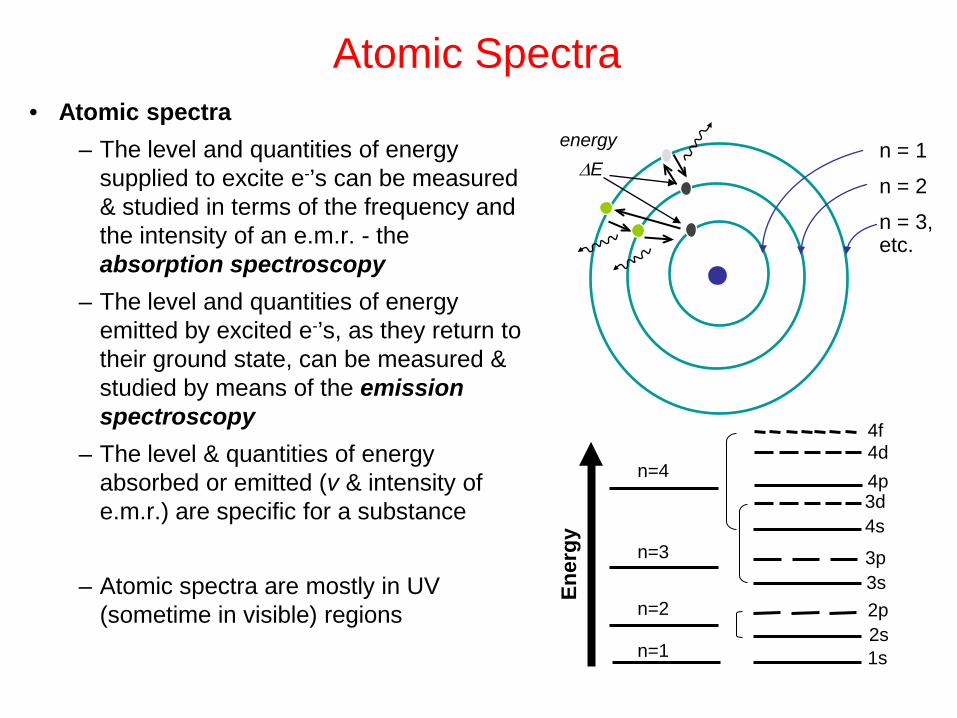
• Atomic spectra – The level and quantities of energy
supplied to excite e-’s can be measured & studied in terms of the frequency and the intensity of an e.m.r. - the absorption spectroscopy
– The level and quantities of energy emitted by excited e-’s, as they return to their ground state, can be measured & studied by means of the emission spectroscopy
– The level & quantities of energy absorbed or emitted (v & intensity of e.m.r.) are specific for a substance
– Atomic spectra are mostly in UV
(sometime in visible) regions
Ener
gy
n=1
n=2
n=3
n=4
1s 2s 2p 3s 3p
4s 3d 4p 4d 4f
n = 1
n = 2
n = 3, etc.
energy ∆E
Atomic Spectra
Atomic spectroscopy
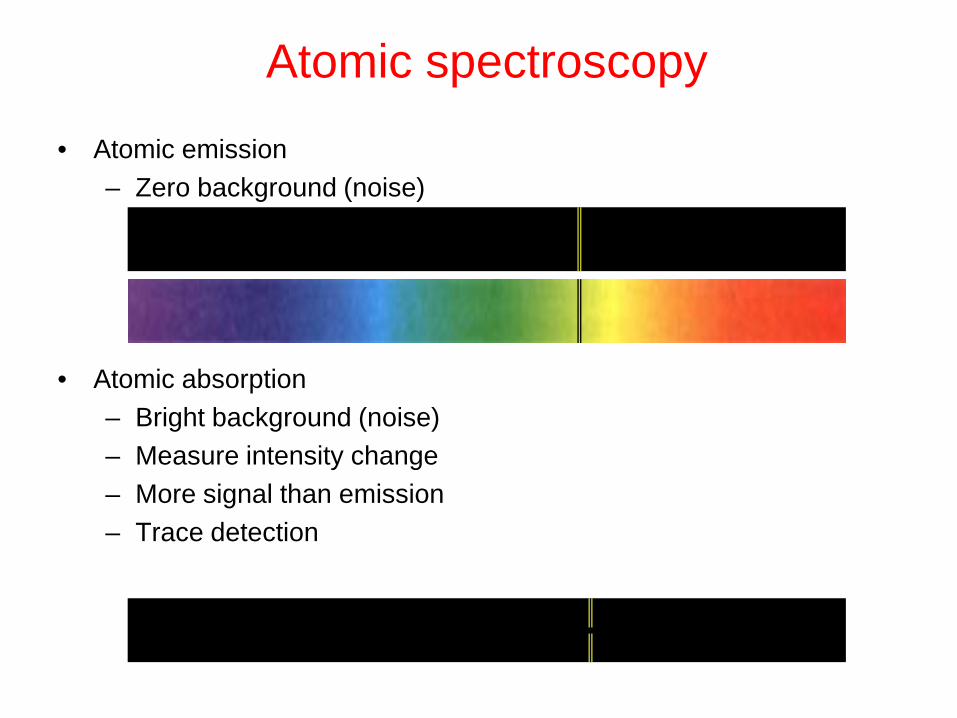
• Atomic emission – Zero background (noise)
• Atomic absorption – Bright background (noise) – Measure intensity change – More signal than emission – Trace detection
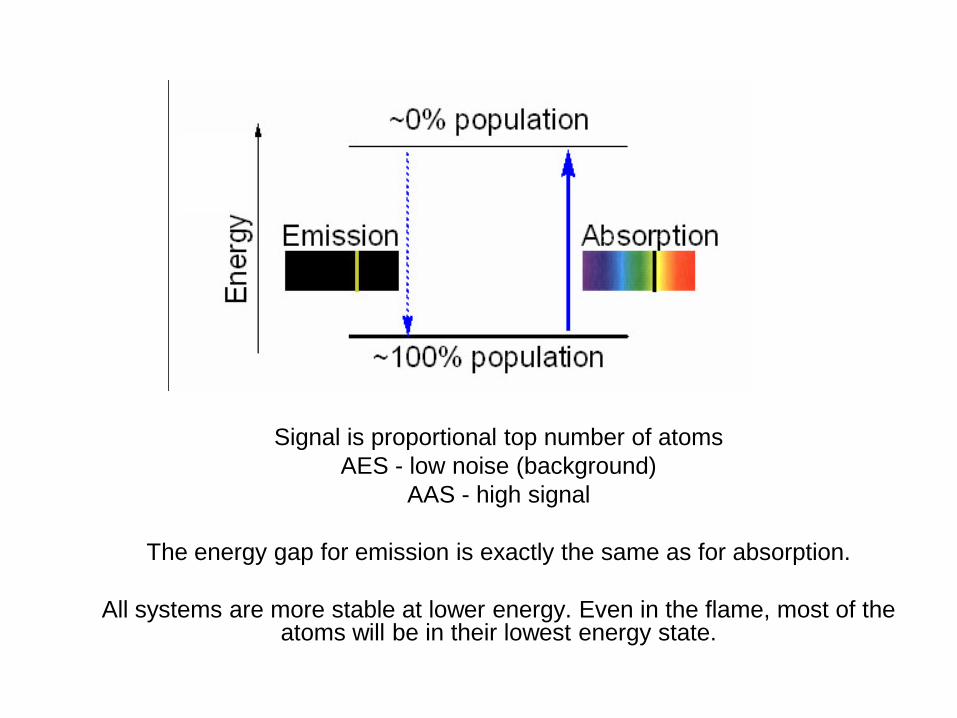
Signal is proportional top number of atoms AES - low noise (background)
AAS - high signal
The energy gap for emission is exactly the same as for absorption.
All systems are more stable at lower energy. Even in the flame, most of the atoms will be in their lowest energy state.
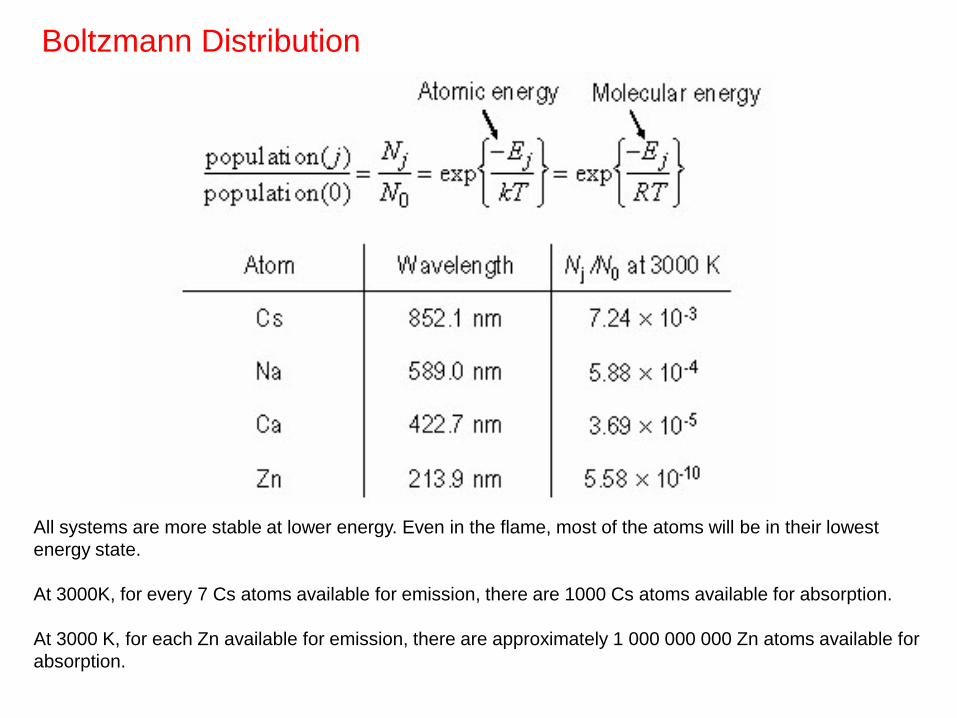
Boltzmann Distribution
All systems are more stable at lower energy. Even in the flame, most of the atoms will be in their lowest energy state. At 3000K, for every 7 Cs atoms available for emission, there are 1000 Cs atoms available for absorption. At 3000 K, for each Zn available for emission, there are approximately 1 000 000 000 Zn atoms available for absorption.
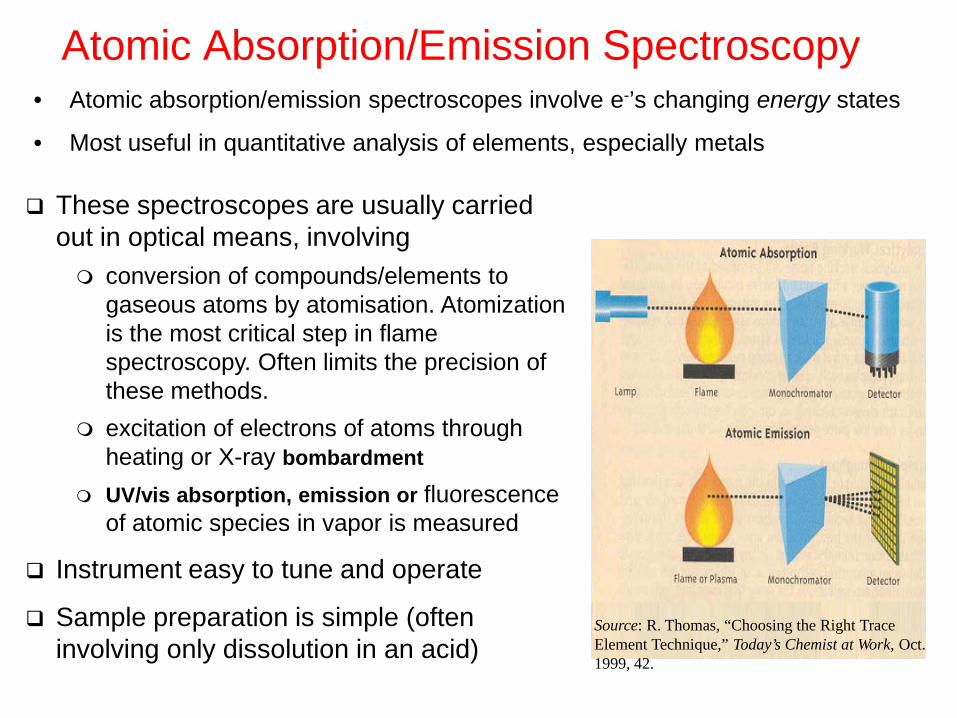
Source: R. Thomas, “Choosing the Right Trace Element Technique,” Today’s Chemist at Work, Oct. 1999, 42.
Atomic Absorption/Emission Spectroscopy • Atomic absorption/emission spectroscopes involve e-’s changing energy states
• Most useful in quantitative analysis of elements, especially metals
These spectroscopes are usually carried out in optical means, involving conversion of compounds/elements to
gaseous atoms by atomisation. Atomization is the most critical step in flame spectroscopy. Often limits the precision of these methods.
excitation of electrons of atoms through heating or X-ray bombardment
UV/vis absorption, emission or fluorescence of atomic species in vapor is measured
Instrument easy to tune and operate
Sample preparation is simple (often involving only dissolution in an acid)
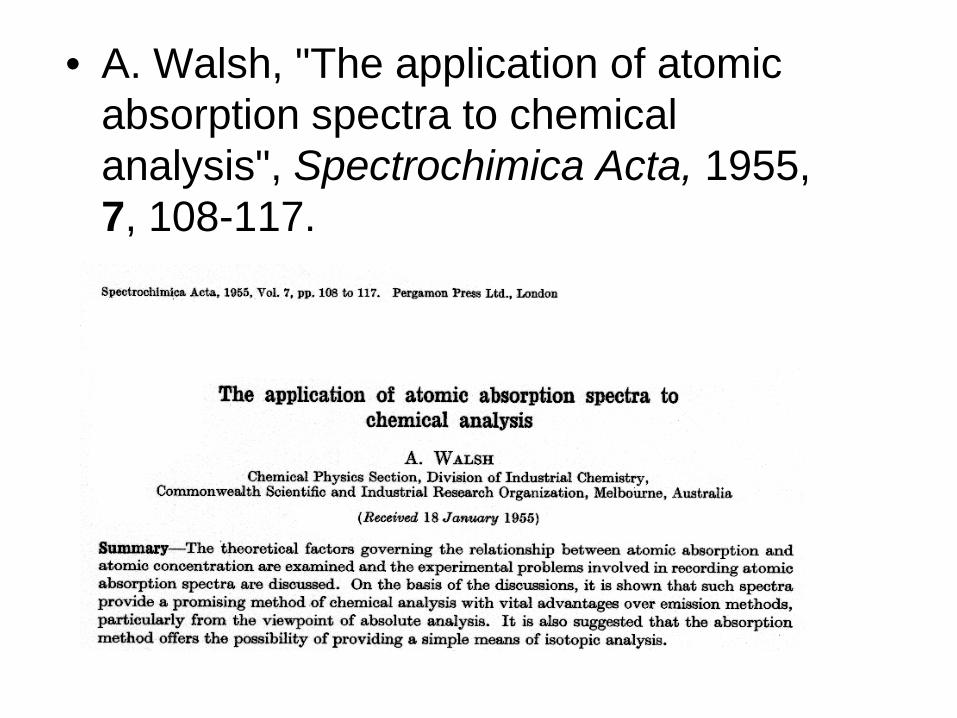
• A. Walsh, "The application of atomic absorption spectra to chemical analysis", Spectrochimica Acta, 1955, 7, 108-117.
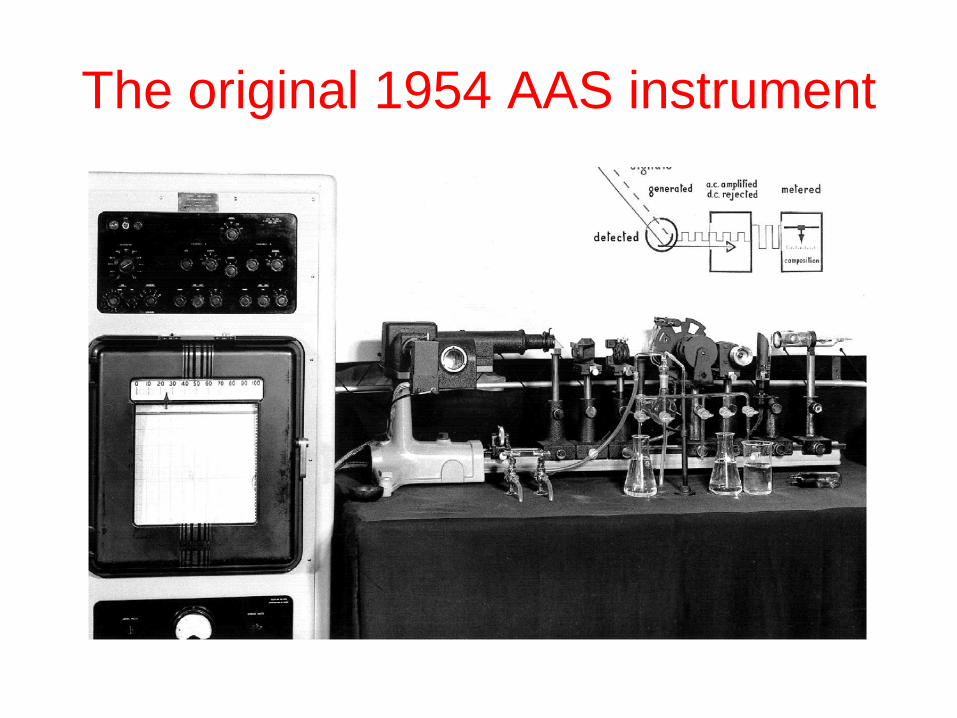
The original 1954 AAS instrument
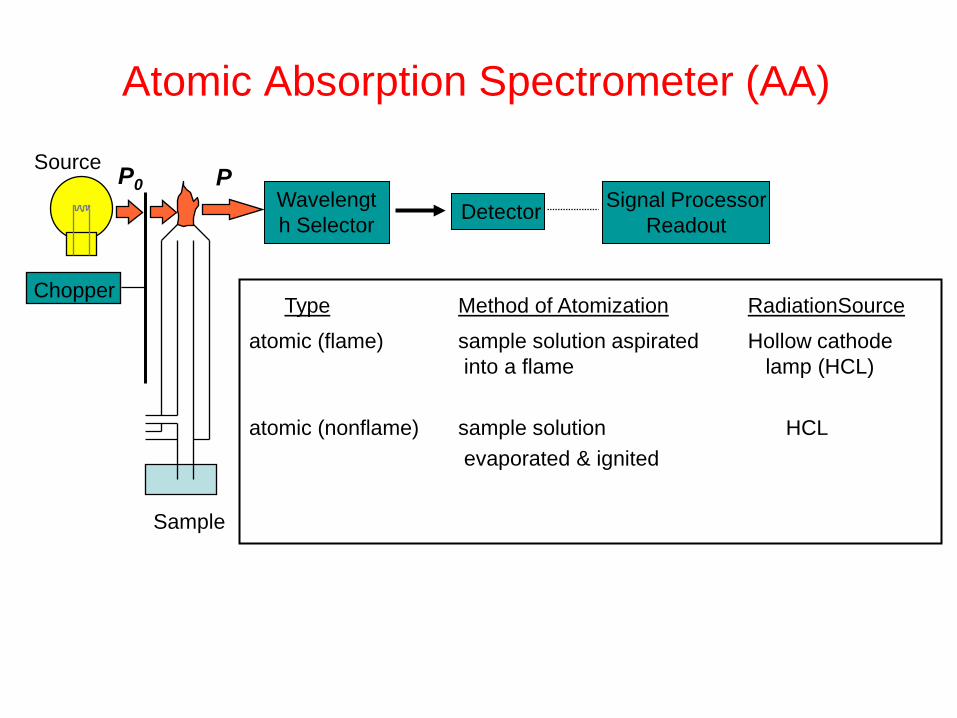
Atomic Absorption Spectrometer (AA)
Source
Sample
P P0
Chopper
Wavelength Selector Detector Signal Processor
Readout
Type Method of Atomization RadiationSource
atomic (flame) sample solution aspirated Hollow cathode into a flame lamp (HCL) atomic (nonflame) sample solution HCL evaporated & ignited
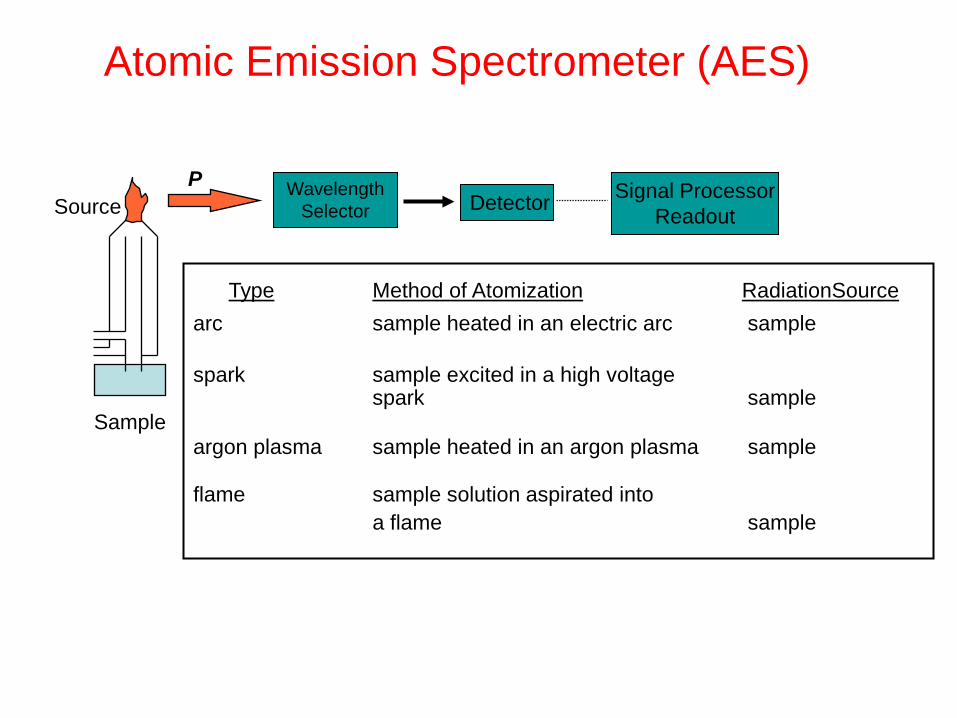
Atomic Emission Spectrometer (AES)
Source
Sample
P Wavelength Selector Detector Signal Processor
Readout
Type Method of Atomization RadiationSource arc sample heated in an electric arc sample spark sample excited in a high voltage spark sample argon plasma sample heated in an argon plasma sample flame sample solution aspirated into a flame sample
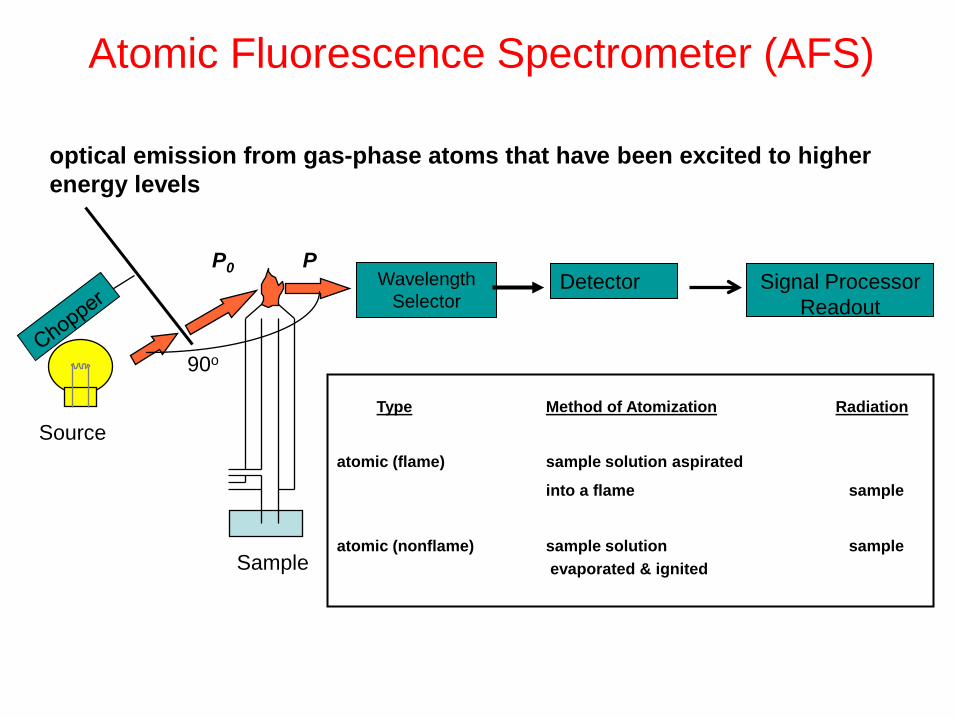
Atomic Fluorescence Spectrometer (AFS)
Source
Sample
P P0
90o
Wavelength Selector
Detector Signal Processor Readout
Type Method of Atomization Radiation
atomic (flame) sample solution aspirated
into a flame sample
atomic (nonflame) sample solution sample evaporated & ignited
optical emission from gas-phase atoms that have been excited to higher energy levels
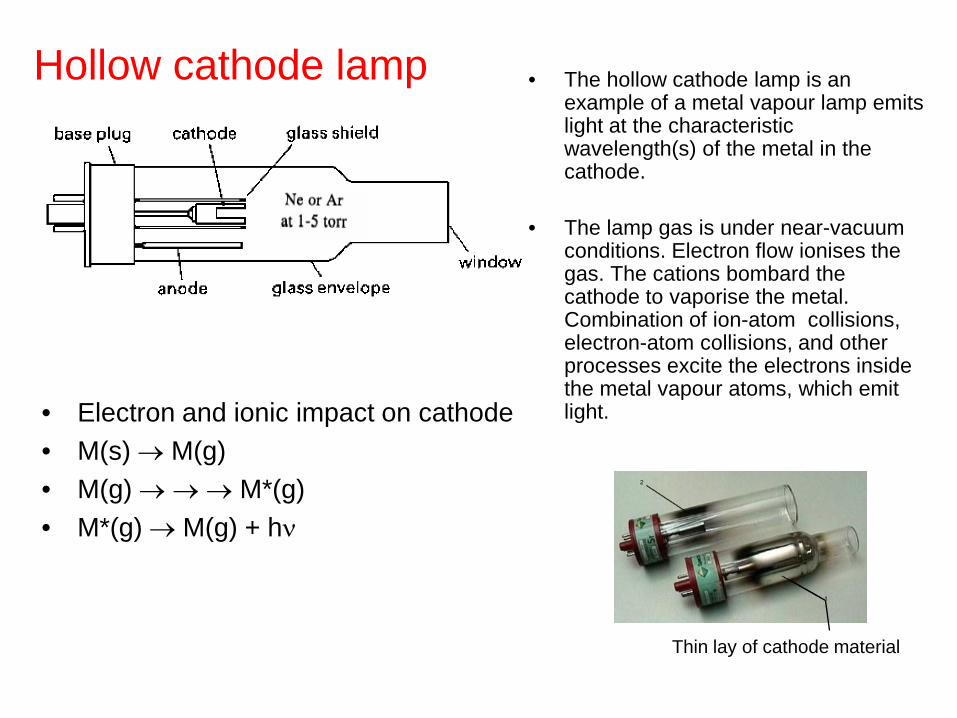
• Electron and ionic impact on cathode • M(s) → M(g) • M(g) → → → M*(g) • M*(g) → M(g) + hν
Hollow cathode lamp
Thin lay of cathode material
• The hollow cathode lamp is an example of a metal vapour lamp emits light at the characteristic wavelength(s) of the metal in the cathode.
• The lamp gas is under near-vacuum conditions. Electron flow ionises the gas. The cations bombard the cathode to vaporise the metal. Combination of ion-atom collisions, electron-atom collisions, and other processes excite the electrons inside the metal vapour atoms, which emit light.
Types of Atomizers Flame Electrothermal Special Glow Discharge Hydride Generation Cold-Vapor
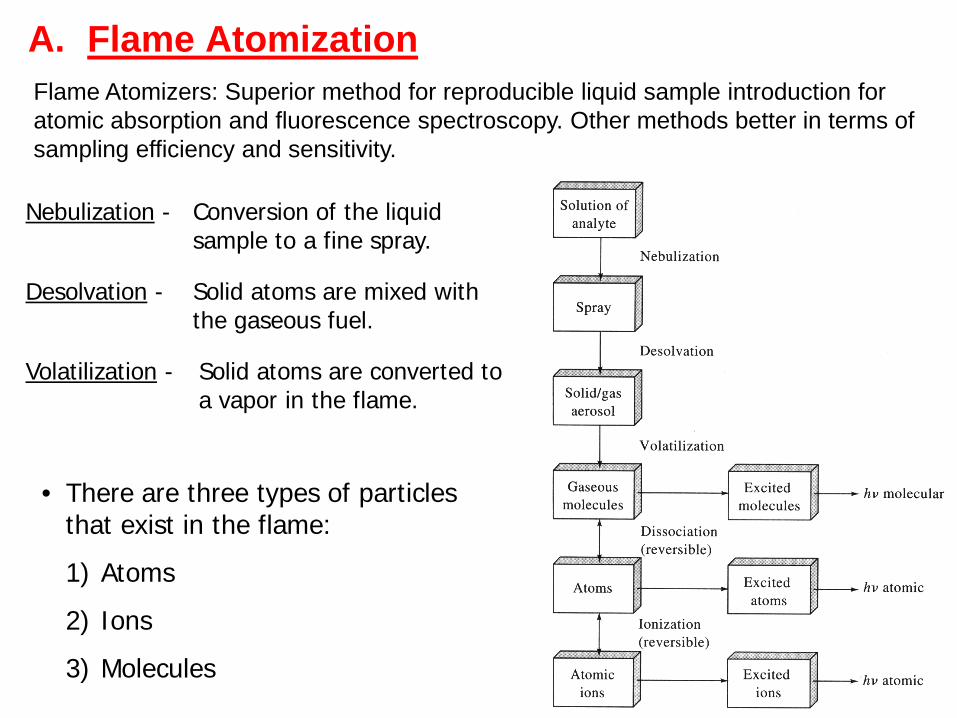
A. Flame Atomization
Nebulization - Conversion of the liquid sample to a fine spray.
Desolvation - Solid atoms are mixed with the gaseous fuel.
Volatilization - Solid atoms are converted to a vapor in the flame.
• There are three types of particles that exist in the flame:
1) Atoms
2) Ions
3) Molecules
Flame Atomizers: Superior method for reproducible liquid sample introduction for atomic absorption and fluorescence spectroscopy. Other methods better in terms of sampling efficiency and sensitivity.
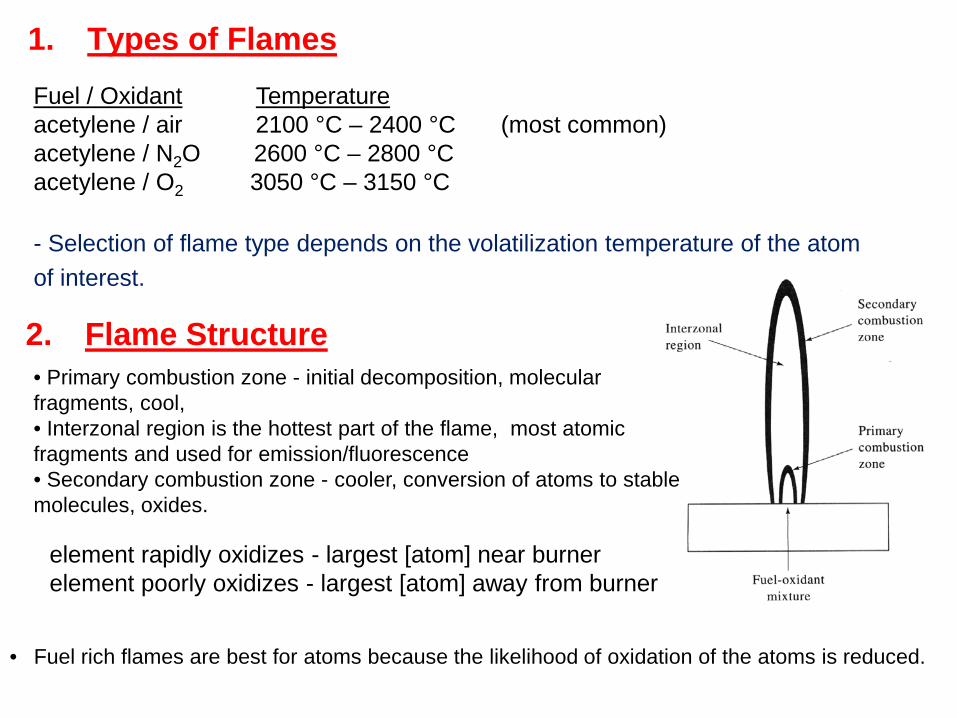
1. Types of Flames Fuel / Oxidant Temperature acetylene / air 2100 °C – 2400 °C (most common) acetylene / N2O 2600 °C – 2800 °C acetylene / O2 3050 °C – 3150 °C
- Selection of flame type depends on the volatilization temperature of the atom of interest.
2. Flame Structure
• Fuel rich flames are best for atoms because the likelihood of oxidation of the atoms is reduced.
• Primary combustion zone - initial decomposition, molecular fragments, cool, • Interzonal region is the hottest part of the flame, most atomic fragments and used for emission/fluorescence • Secondary combustion zone - cooler, conversion of atoms to stable molecules, oxides.
element rapidly oxidizes - largest [atom] near burner element poorly oxidizes - largest [atom] away from burner
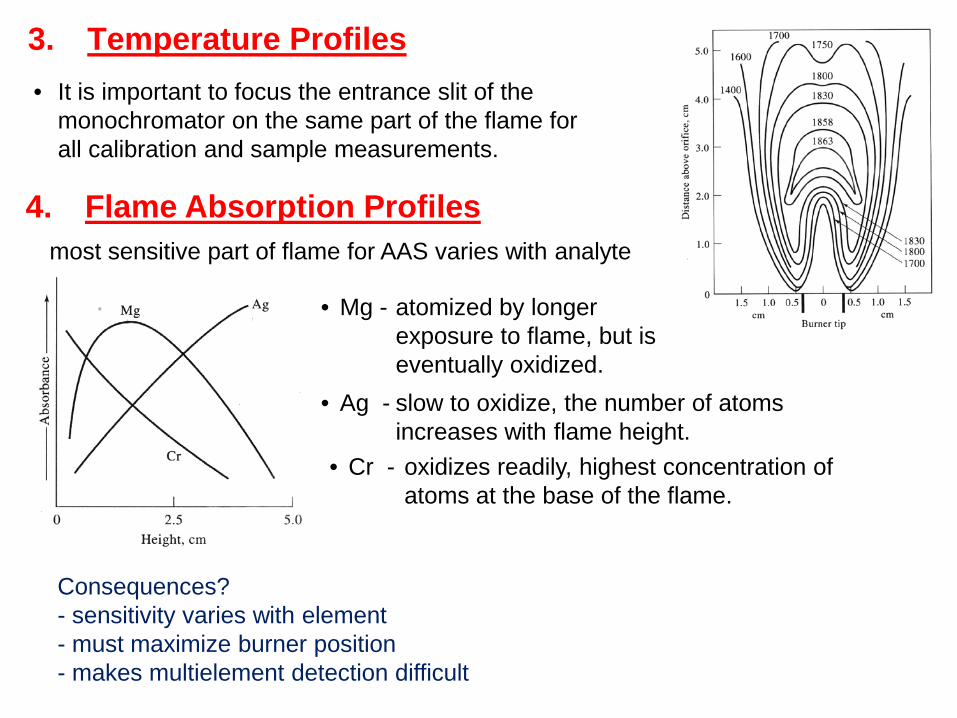
3. Temperature Profiles • It is important to focus the entrance slit of the
monochromator on the same part of the flame for all calibration and sample measurements.
4. Flame Absorption Profiles
• Mg - atomized by longer exposure to flame, but is eventually oxidized.
• Ag - slow to oxidize, the number of atoms increases with flame height.
• Cr - oxidizes readily, highest concentration of atoms at the base of the flame.
most sensitive part of flame for AAS varies with analyte
Consequences? - sensitivity varies with element - must maximize burner position - makes multielement detection difficult
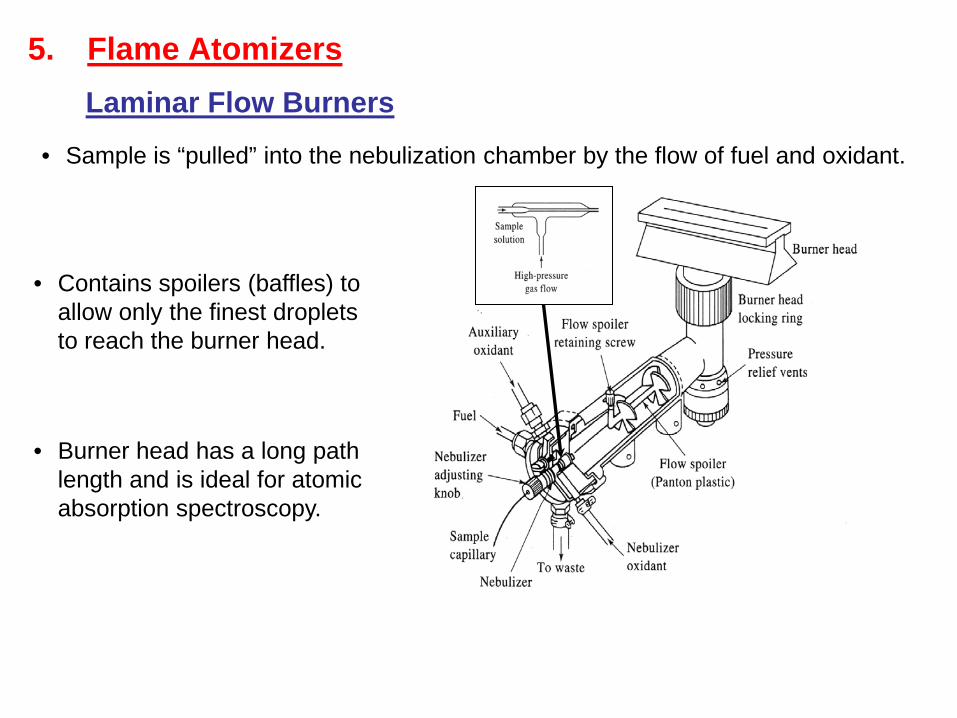
5. Flame Atomizers
• Sample is “pulled” into the nebulization chamber by the flow of fuel and oxidant.
Laminar Flow Burners
• Contains spoilers (baffles) to allow only the finest droplets to reach the burner head.
• Burner head has a long path length and is ideal for atomic absorption spectroscopy.
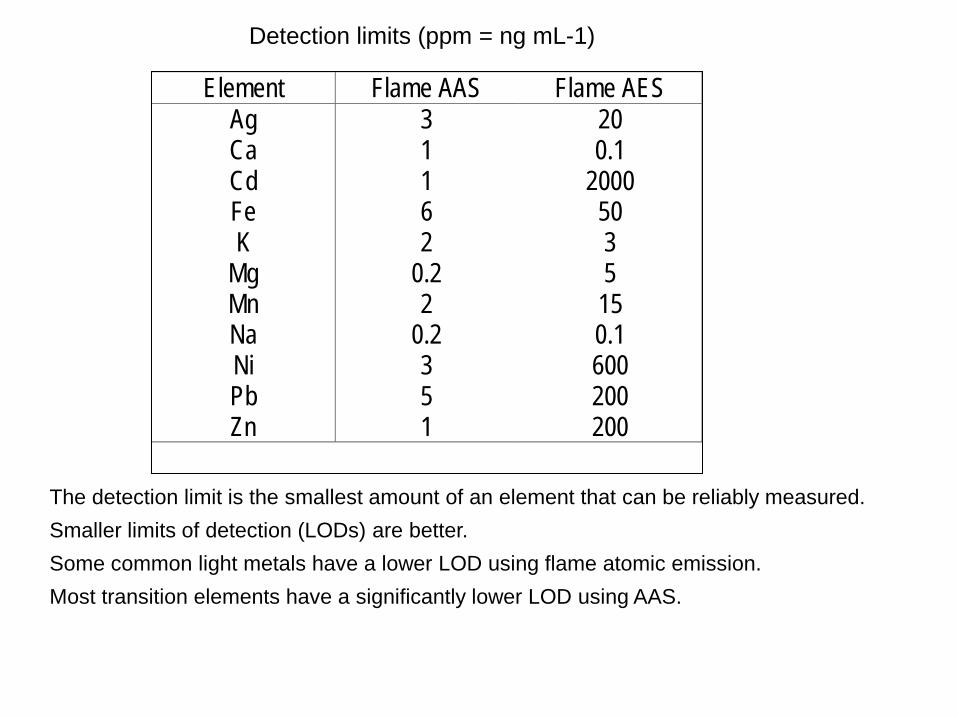
Detection limits (ppm = ng mL-1)
Element Flame AAS Flame AESAg 3 20Ca 1 0.1Cd 1 2000Fe 6 50K 2 3
Mg 0.2 5Mn 2 15Na 0.2 0.1Ni 3 600Pb 5 200Zn 1 200
The detection limit is the smallest amount of an element that can be reliably measured. Smaller limits of detection (LODs) are better. Some common light metals have a lower LOD using flame atomic emission. Most transition elements have a significantly lower LOD using AAS.
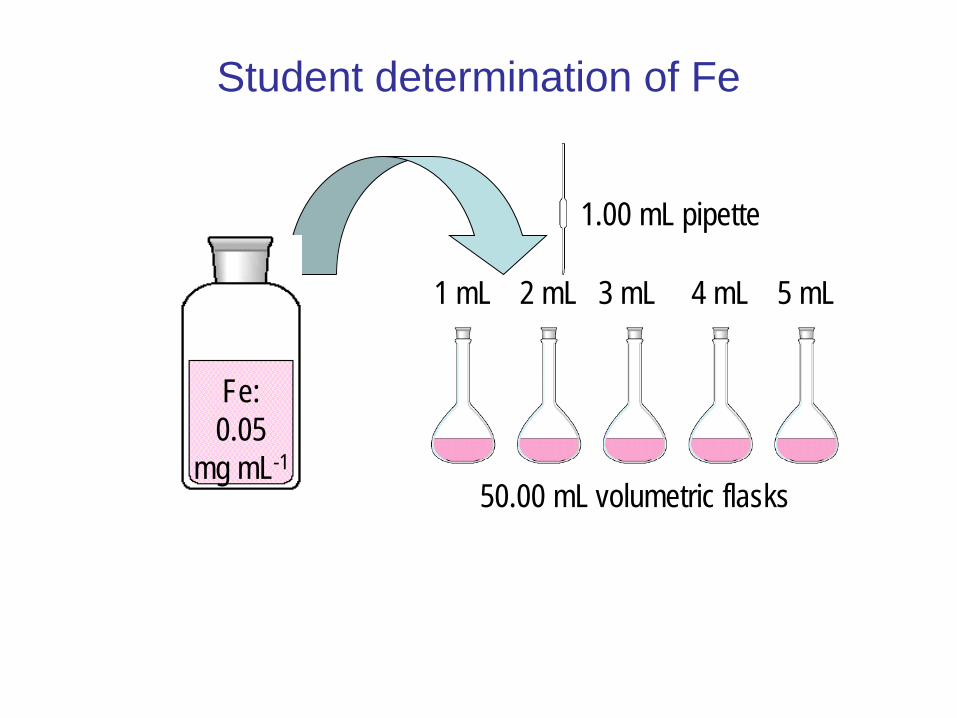
Student determination of Fe
Fe: 0.05
mg mL-1
50.00 mL volumetric flasks
1.00 mL pipette
2 mL 1 mL 3 mL 4 mL 5 mL
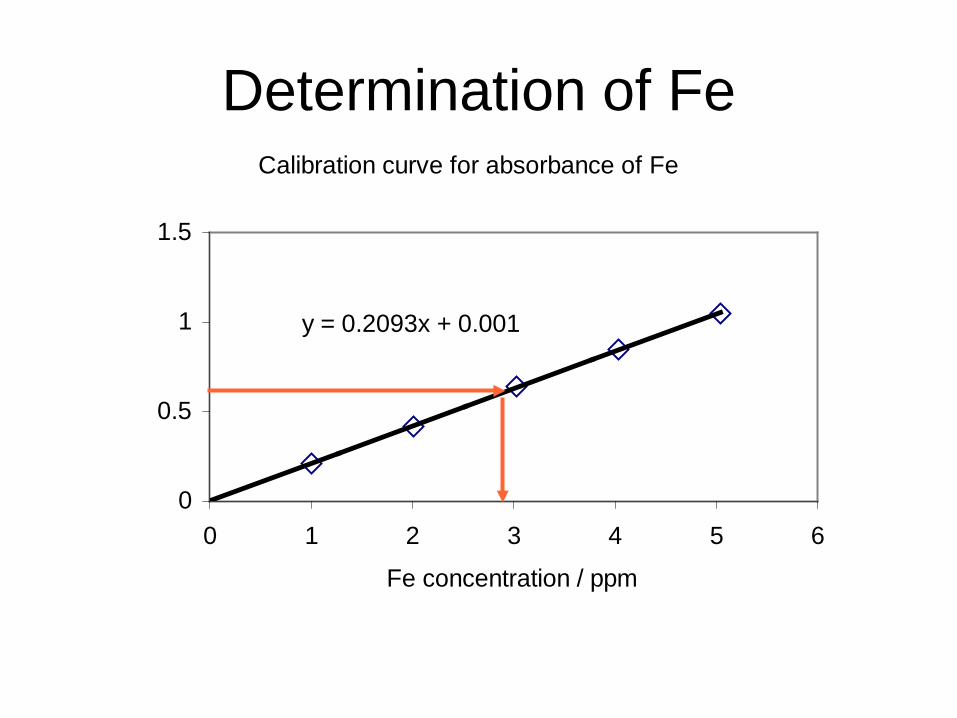
Determination of Fe Calibration curve for absorbance of Fe
y = 0.2093x + 0.001
0
0.5
1
1.5
0 1 2 3 4 5 6
Fe concentration / ppm
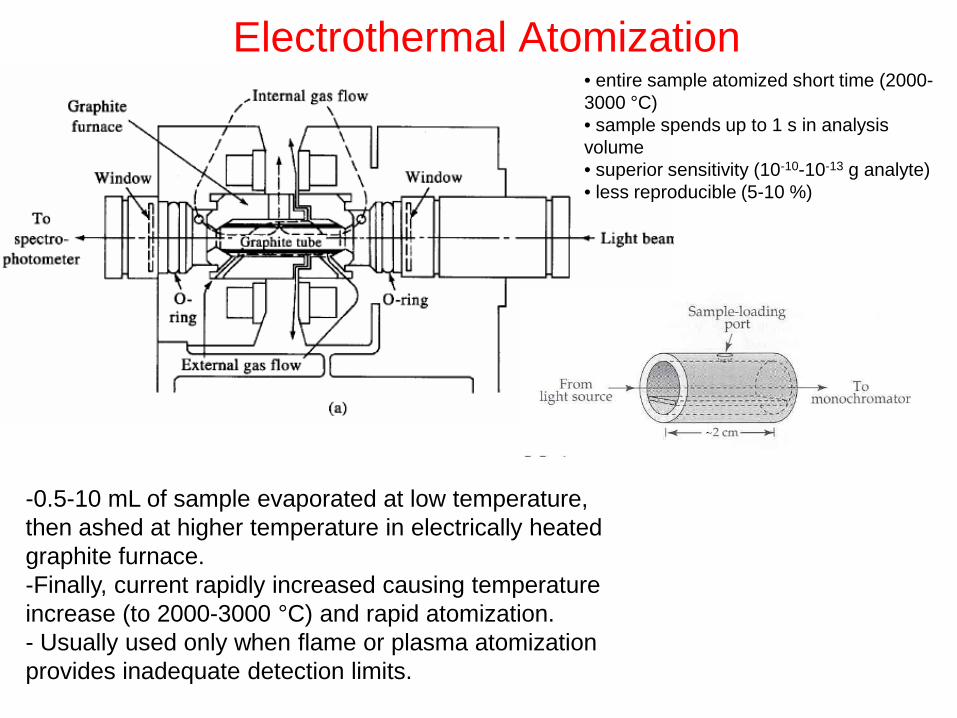
Electrothermal Atomization
-0.5-10 mL of sample evaporated at low temperature, then ashed at higher temperature in electrically heated graphite furnace. -Finally, current rapidly increased causing temperature increase (to 2000-3000 °C) and rapid atomization. - Usually used only when flame or plasma atomization provides inadequate detection limits.
• entire sample atomized short time (2000-3000 °C) • sample spends up to 1 s in analysis volume • superior sensitivity (10-10-10-13 g analyte) • less reproducible (5-10 %)
Atomic Emission Spectroscopy (AES, OES)
Introduction: • Atomic emission spectroscopy (AES or OES) uses quantitative
measurement of the optical emission from excited atoms to determine analyte concentration.
• Analyte atoms in solution are aspirated into the excitation region where they are desolvated, vaporized, and atomized by a flame, discharge, or plasma.
• These high-temperature atomization sources provide sufficient energy to promote the atoms into high energy levels.
• The atoms decay back to lower levels by emitting light. Since the transitions are between distinct atomic energy levels, the emission lines in the spectra are narrow.
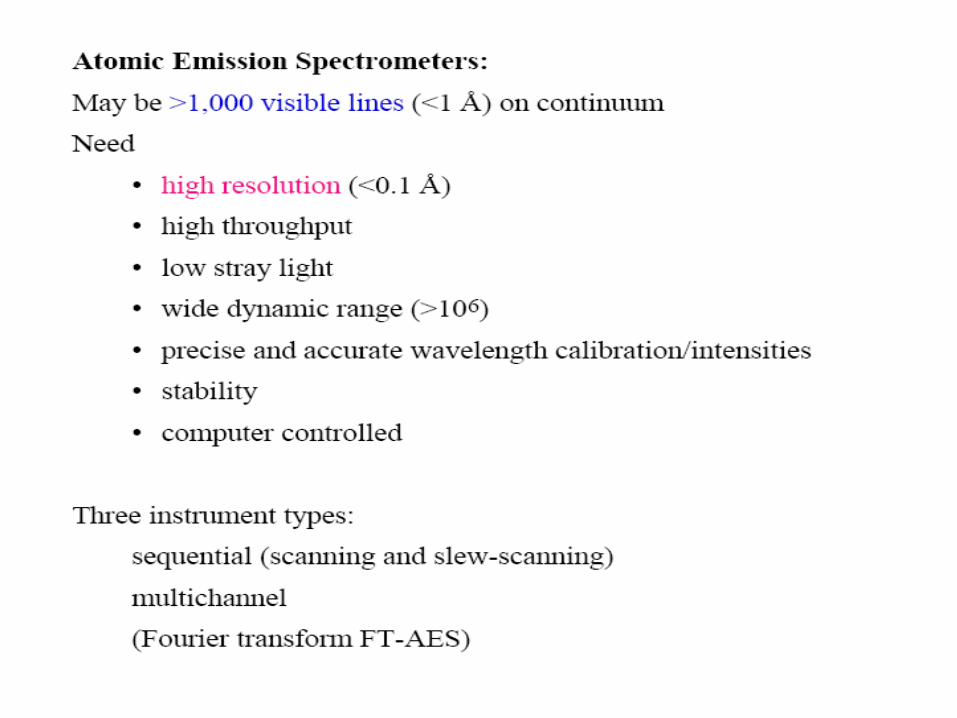
• The spectra of multi-elemental samples can be very congested, and spectral separation of nearby atomic transitions requires a high-resolution spectrometer.
• Since all atoms in a sample are excited simultaneously, they can be detected simultaneously, and is the major advantage of AES compared to atomic-absorption (AA) spectroscopy.
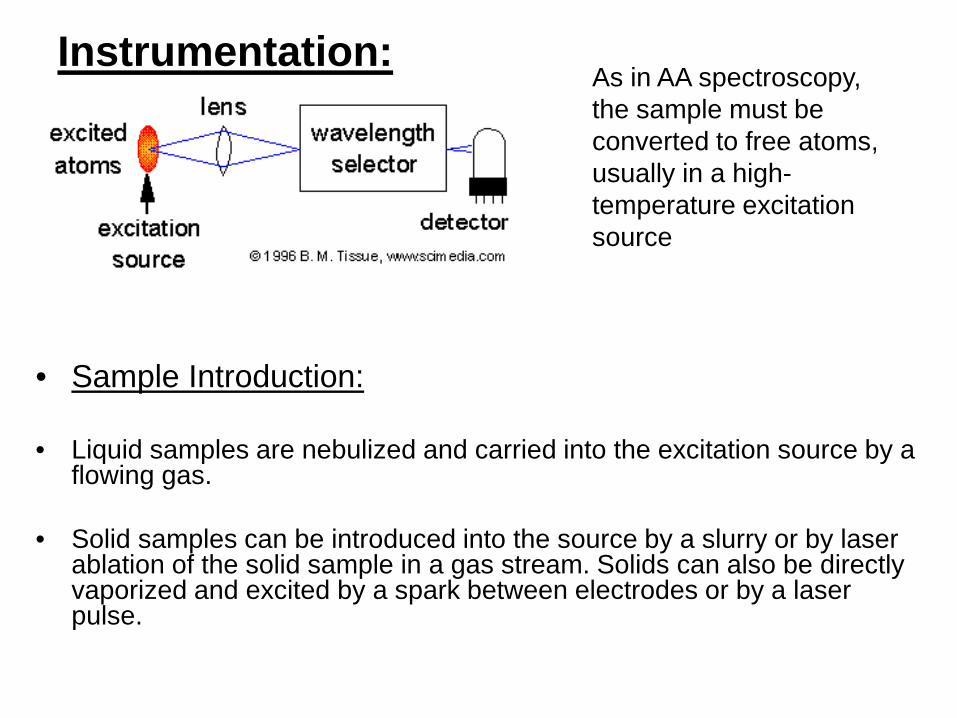
Instrumentation:
• Sample Introduction:
• Liquid samples are nebulized and carried into the excitation source by a flowing gas.
• Solid samples can be introduced into the source by a slurry or by laser ablation of the solid sample in a gas stream. Solids can also be directly vaporized and excited by a spark between electrodes or by a laser pulse.
As in AA spectroscopy, the sample must be converted to free atoms, usually in a high-temperature excitation source
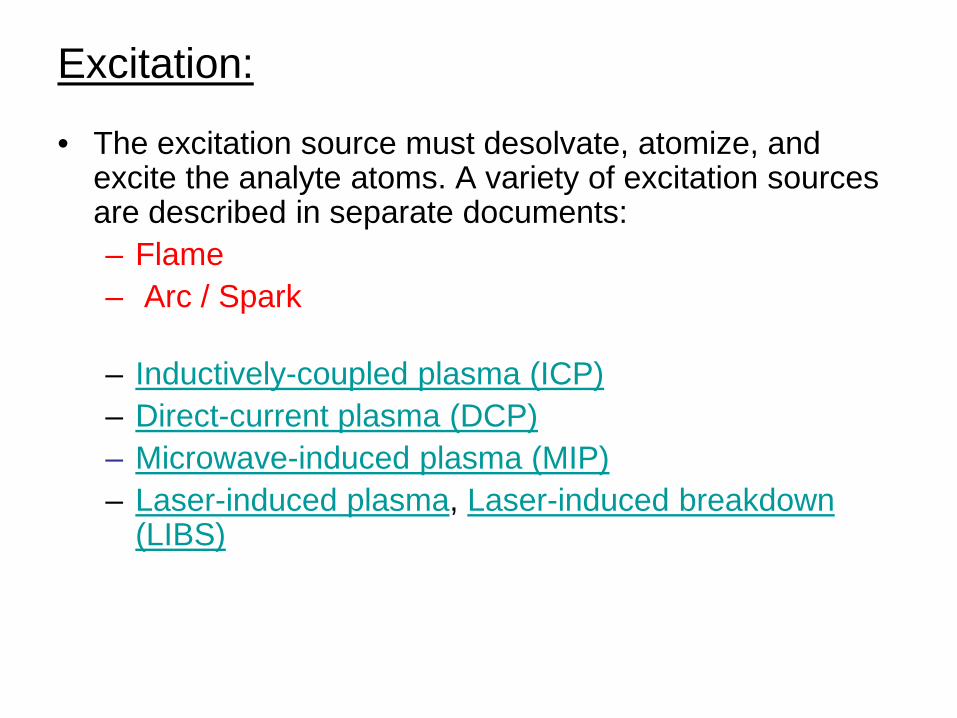
Excitation:
• The excitation source must desolvate, atomize, and excite the analyte atoms. A variety of excitation sources are described in separate documents: – Flame – Arc / Spark – Inductively-coupled plasma (ICP) – Direct-current plasma (DCP) – Microwave-induced plasma (MIP) – Laser-induced plasma, Laser-induced breakdown
(LIBS)
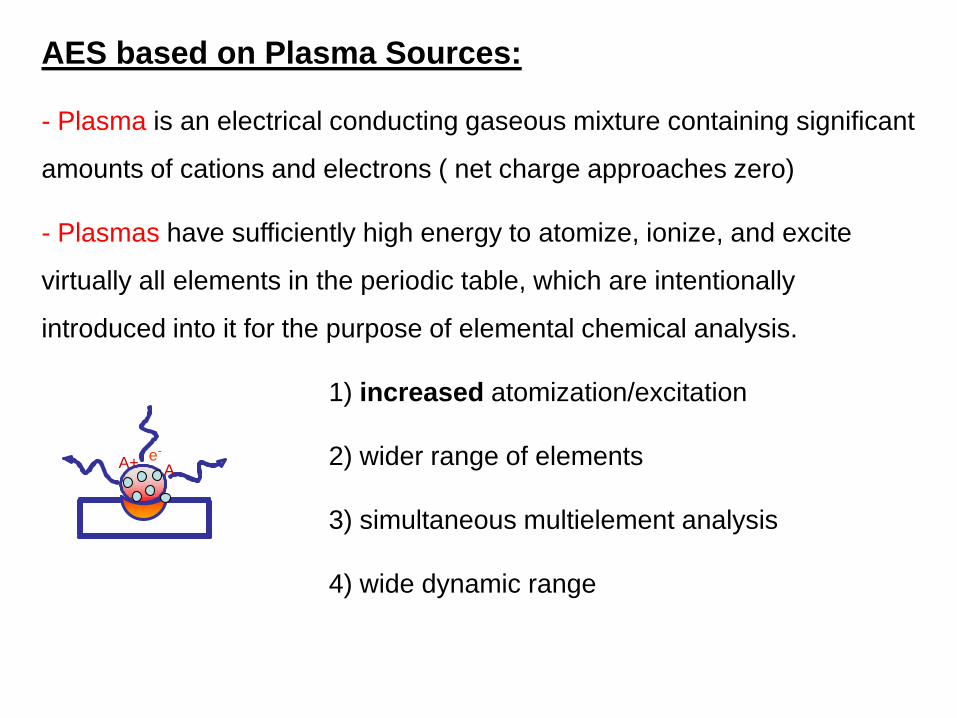
AES based on Plasma Sources:
- Plasma is an electrical conducting gaseous mixture containing significant
amounts of cations and electrons ( net charge approaches zero)
- Plasmas have sufficiently high energy to atomize, ionize, and excite
virtually all elements in the periodic table, which are intentionally
introduced into it for the purpose of elemental chemical analysis.
1) increased atomization/excitation
2) wider range of elements
3) simultaneous multielement analysis
4) wide dynamic range
A+ A e-
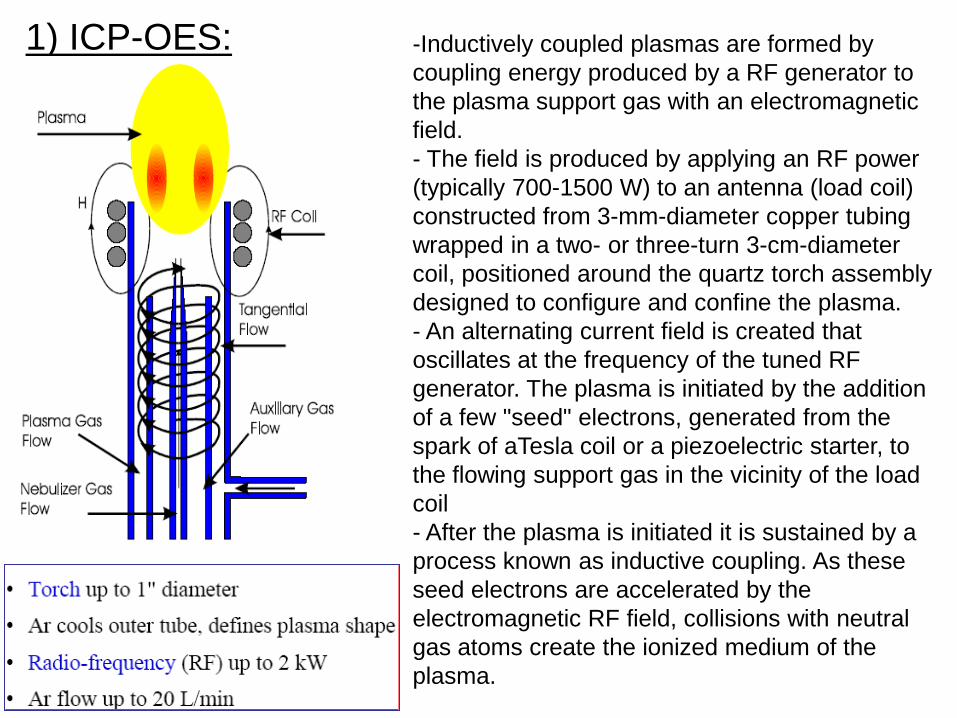
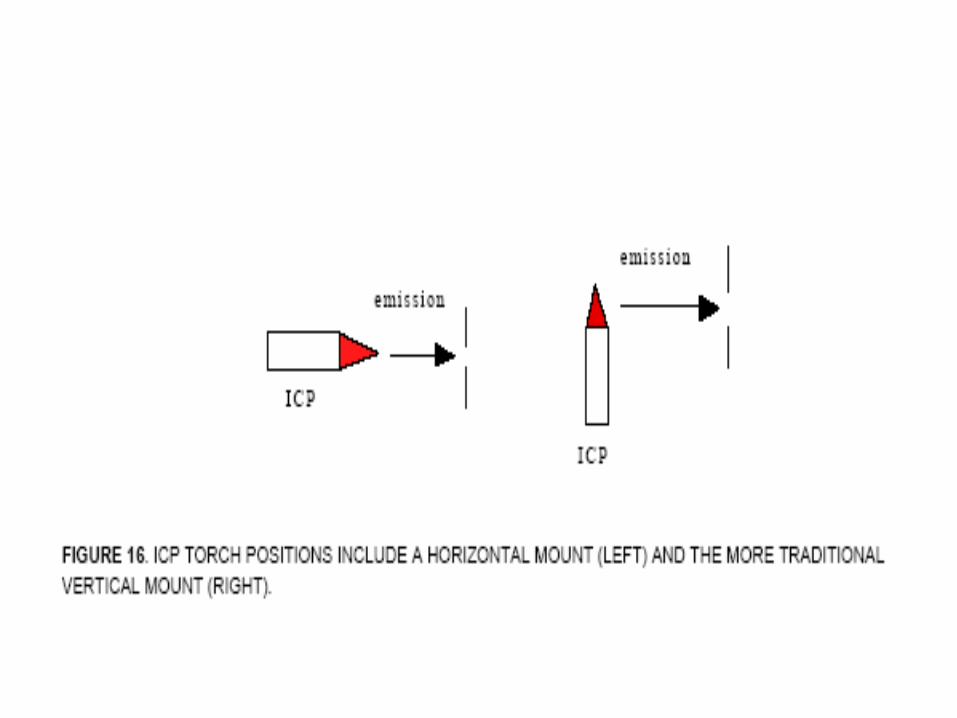
1) ICP-OES: -Inductively coupled plasmas are formed by coupling energy produced by a RF generator to the plasma support gas with an electromagnetic field. - The field is produced by applying an RF power (typically 700-1500 W) to an antenna (load coil) constructed from 3-mm-diameter copper tubing wrapped in a two- or three-turn 3-cm-diameter coil, positioned around the quartz torch assembly designed to configure and confine the plasma. - An alternating current field is created that oscillates at the frequency of the tuned RF generator. The plasma is initiated by the addition of a few "seed" electrons, generated from the spark of aTesla coil or a piezoelectric starter, to the flowing support gas in the vicinity of the load coil - After the plasma is initiated it is sustained by a process known as inductive coupling. As these seed electrons are accelerated by the electromagnetic RF field, collisions with neutral gas atoms create the ionized medium of the plasma.
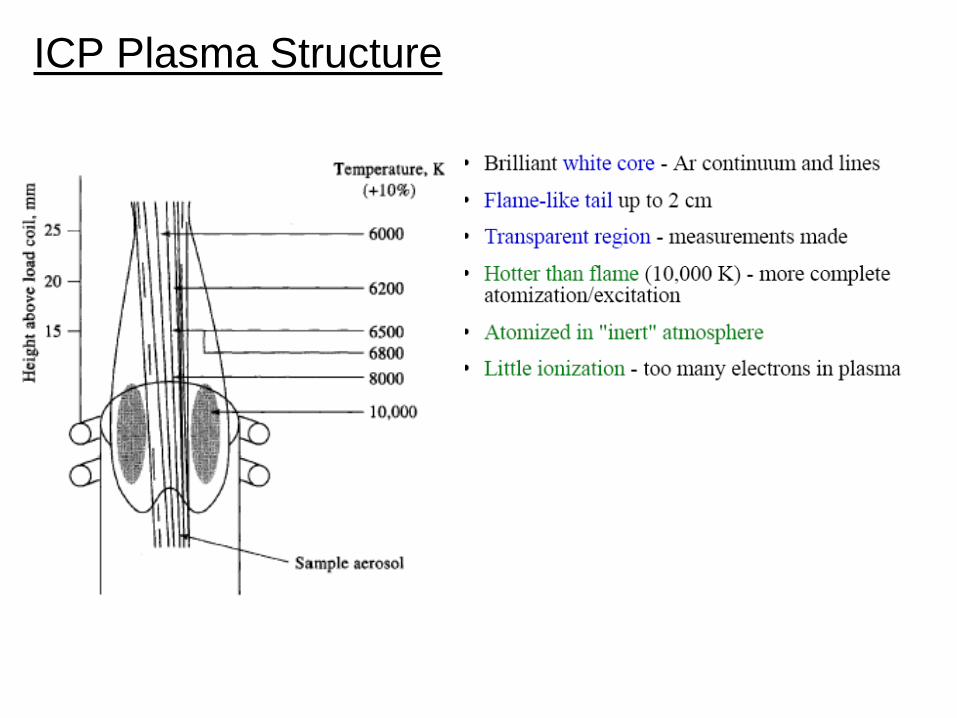
ICP Plasma Structure
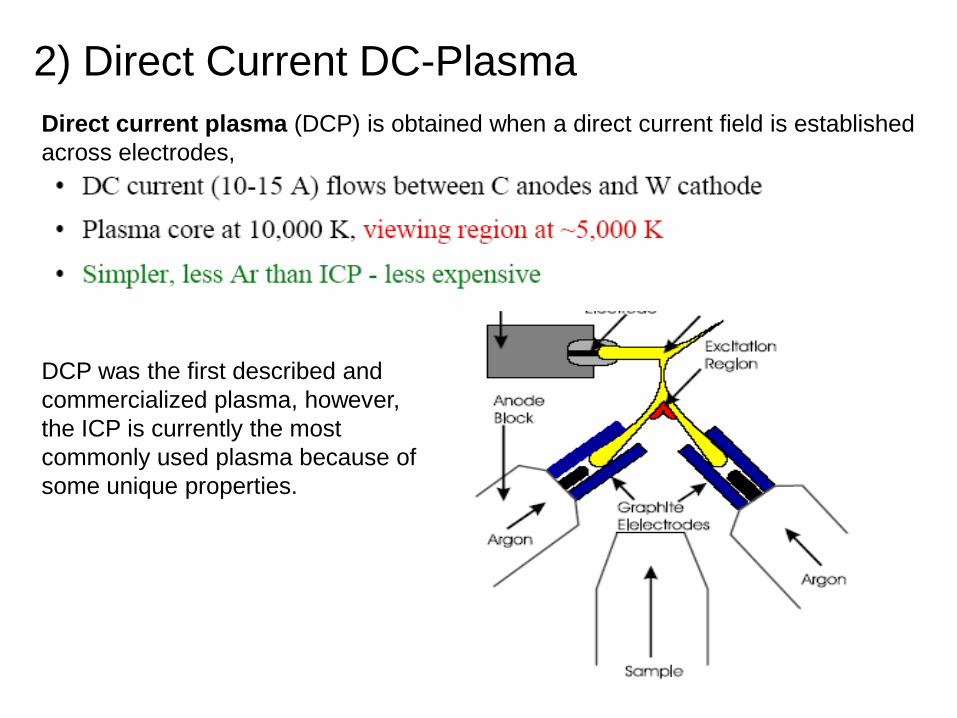
2) Direct Current DC-Plasma Direct current plasma (DCP) is obtained when a direct current field is established across electrodes,
DCP was the first described and commercialized plasma, however, the ICP is currently the most commonly used plasma because of some unique properties.
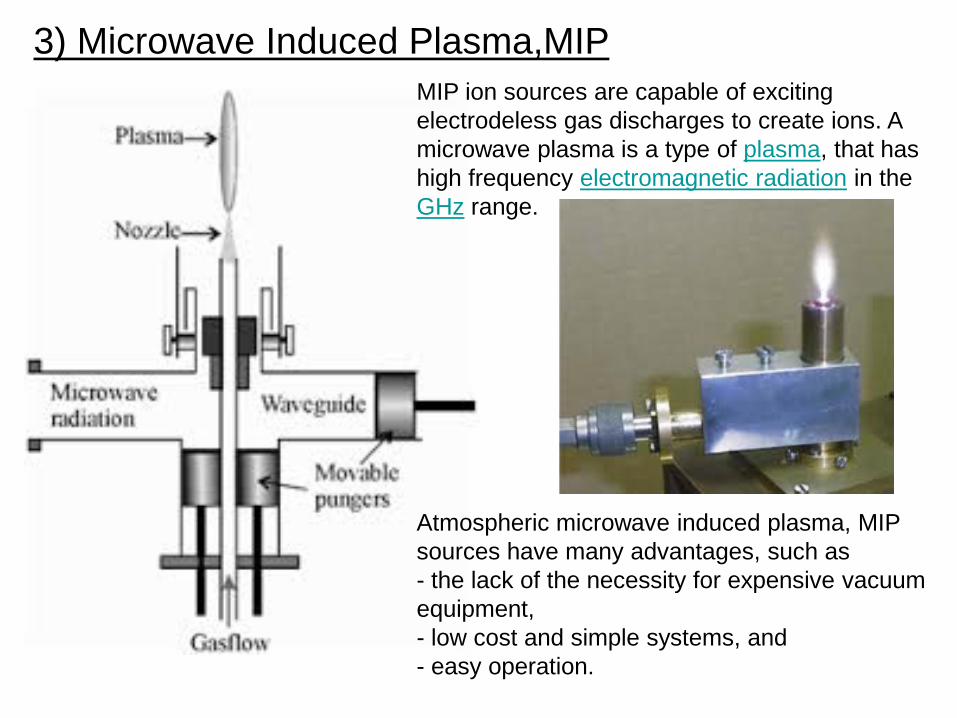
3) Microwave Induced Plasma,MIP
Atmospheric microwave induced plasma, MIP sources have many advantages, such as - the lack of the necessity for expensive vacuum equipment, - low cost and simple systems, and - easy operation.
MIP ion sources are capable of exciting electrodeless gas discharges to create ions. A microwave plasma is a type of plasma, that has high frequency electromagnetic radiation in the GHz range.
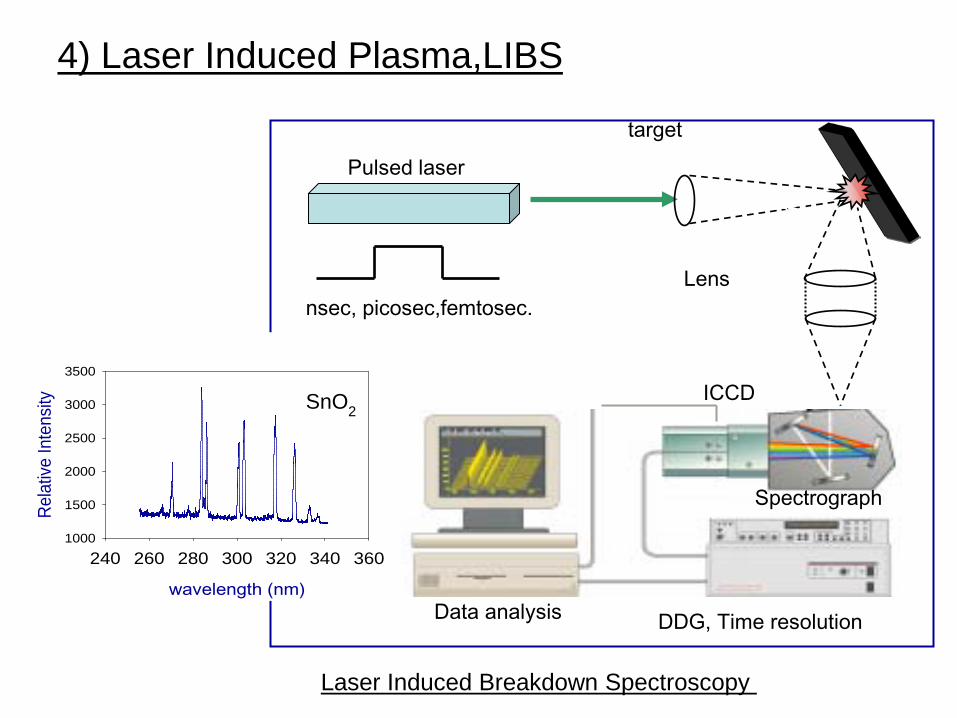
4) Laser Induced Plasma,LIBS
target
nsec, picosec,femtosec.
DDG, Time resolution
Lens
Pulsed laser
ICCD
Spectrograph
Data analysis wavelength (nm)
240 260 280 300 320 340 360
Rela
tive
Inte
nsity
1000
1500
2000
2500
3000
3500
SnO2
Si Si
Laser Induced Breakdown Spectroscopy
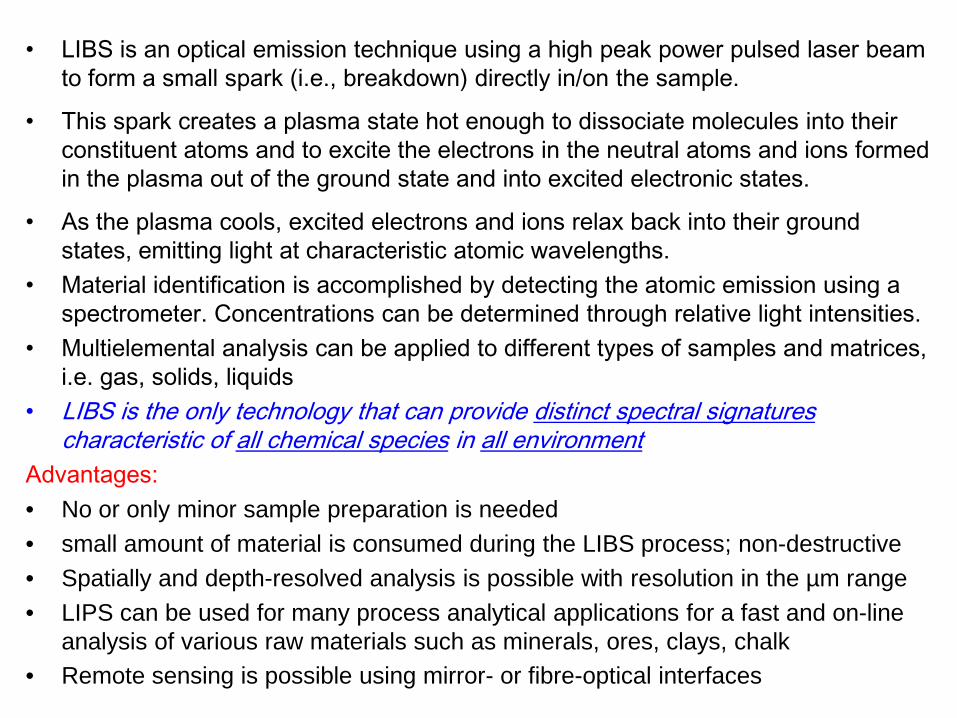
• LIBS is an optical emission technique using a high peak power pulsed laser beam to form a small spark (i.e., breakdown) directly in/on the sample.
• This spark creates a plasma state hot enough to dissociate molecules into their constituent atoms and to excite the electrons in the neutral atoms and ions formed in the plasma out of the ground state and into excited electronic states.
• As the plasma cools, excited electrons and ions relax back into their ground states, emitting light at characteristic atomic wavelengths.
• Material identification is accomplished by detecting the atomic emission using a spectrometer. Concentrations can be determined through relative light intensities.
• Multielemental analysis can be applied to different types of samples and matrices, i.e. gas, solids, liquids
• LIBS is the only technology that can provide distinct spectral signatures characteristic of all chemical species in all environment
Advantages: • No or only minor sample preparation is needed • small amount of material is consumed during the LIBS process; non-destructive • Spatially and depth-resolved analysis is possible with resolution in the µm range • LIPS can be used for many process analytical applications for a fast and on-line
analysis of various raw materials such as minerals, ores, clays, chalk • Remote sensing is possible using mirror- or fibre-optical interfaces
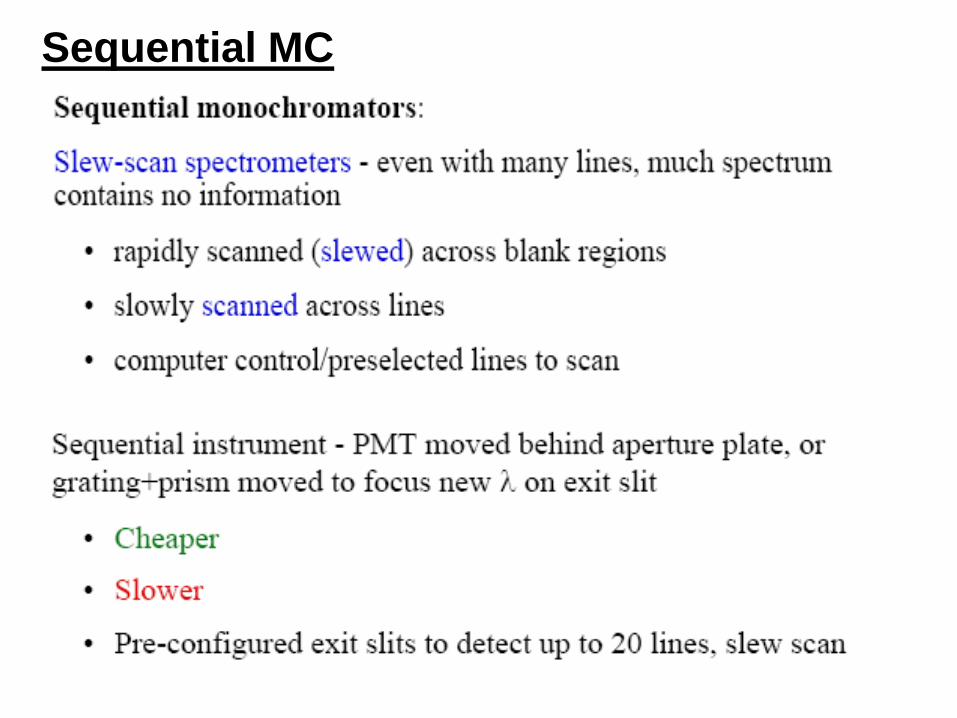
Sequential MC
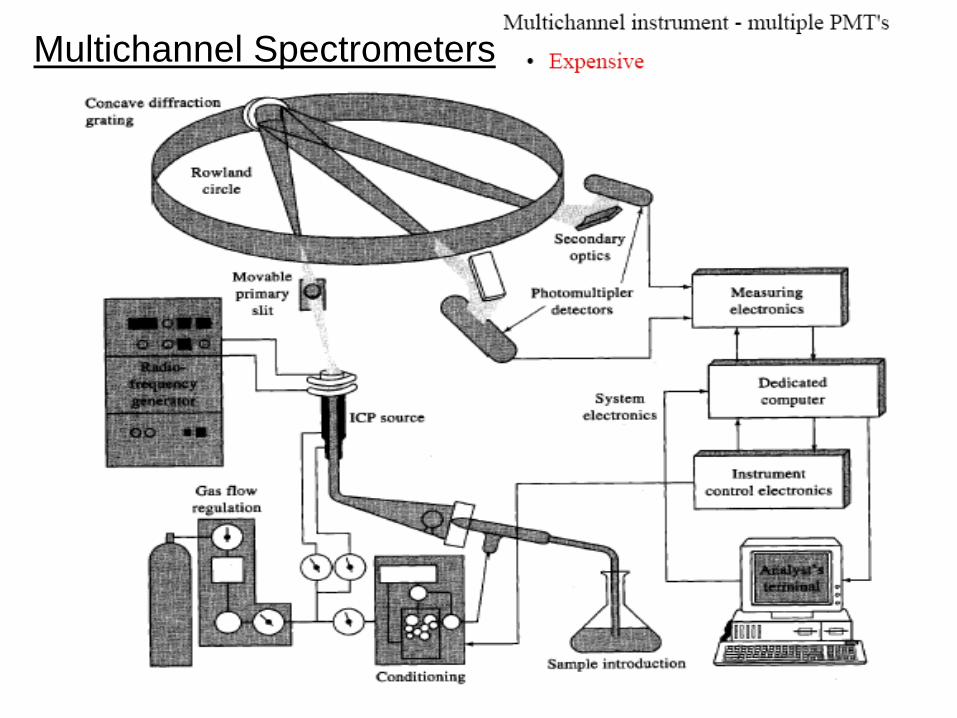
Multichannel Spectrometers
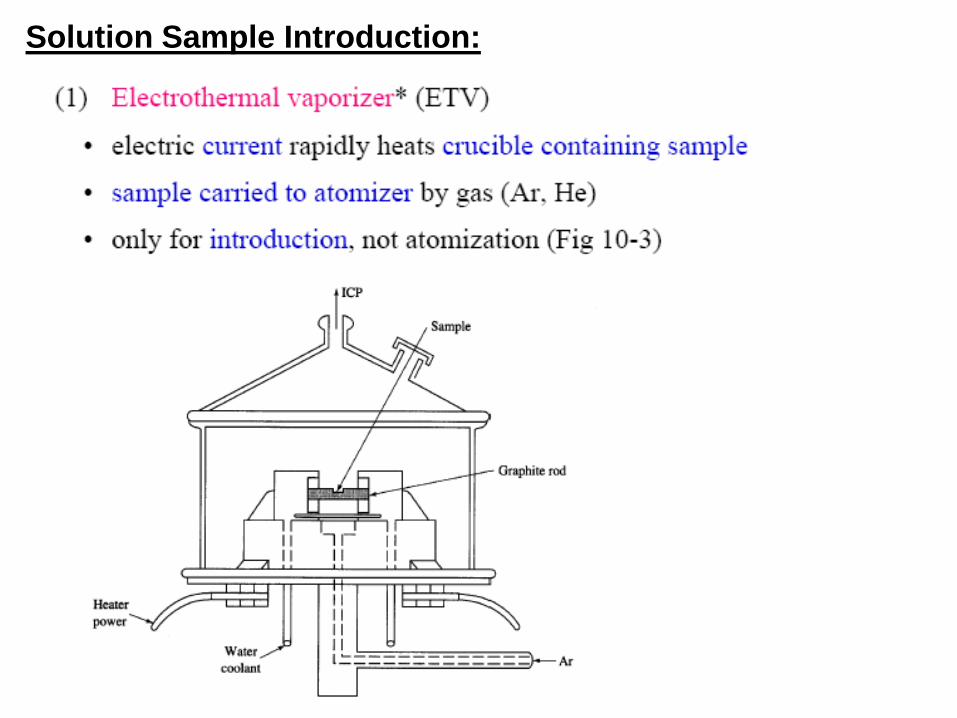
Solution Sample Introduction:
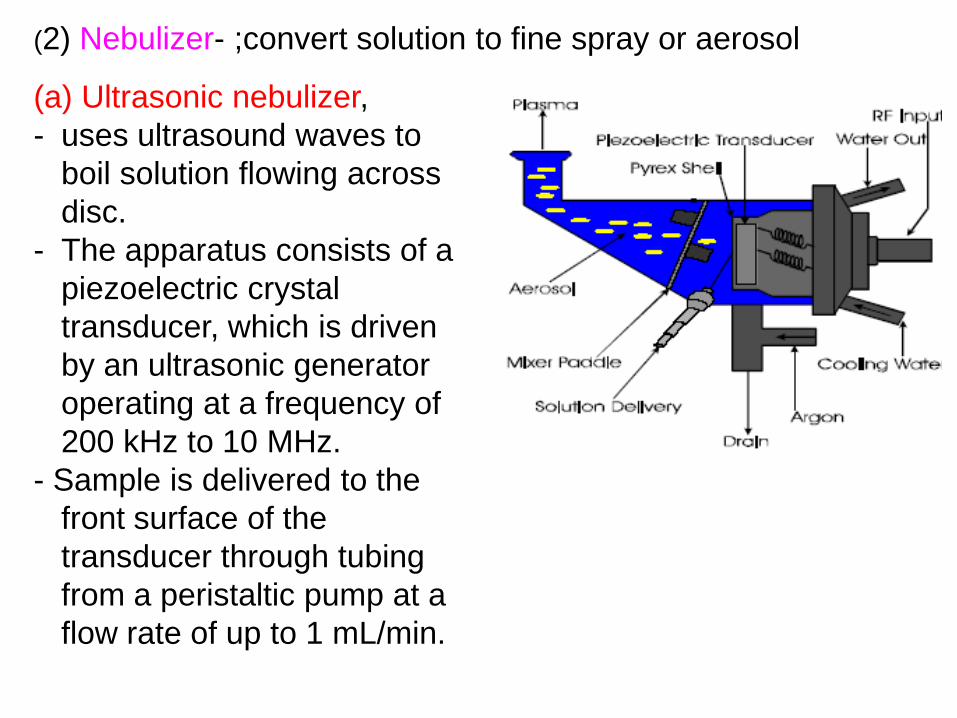
(2) Nebulizer- ;convert solution to fine spray or aerosol
(a) Ultrasonic nebulizer, - uses ultrasound waves to
boil solution flowing across disc.
- The apparatus consists of a piezoelectric crystal transducer, which is driven by an ultrasonic generator operating at a frequency of 200 kHz to 10 MHz.
- Sample is delivered to the front surface of the transducer through tubing from a peristaltic pump at a flow rate of up to 1 mL/min.
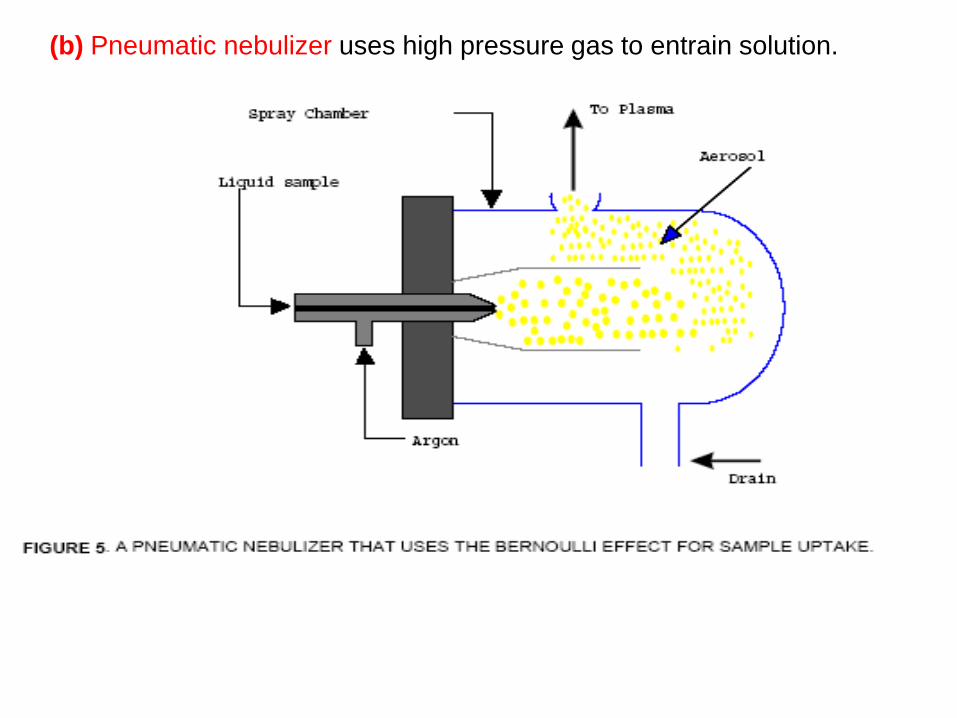
(b) Pneumatic nebulizer uses high pressure gas to entrain solution.
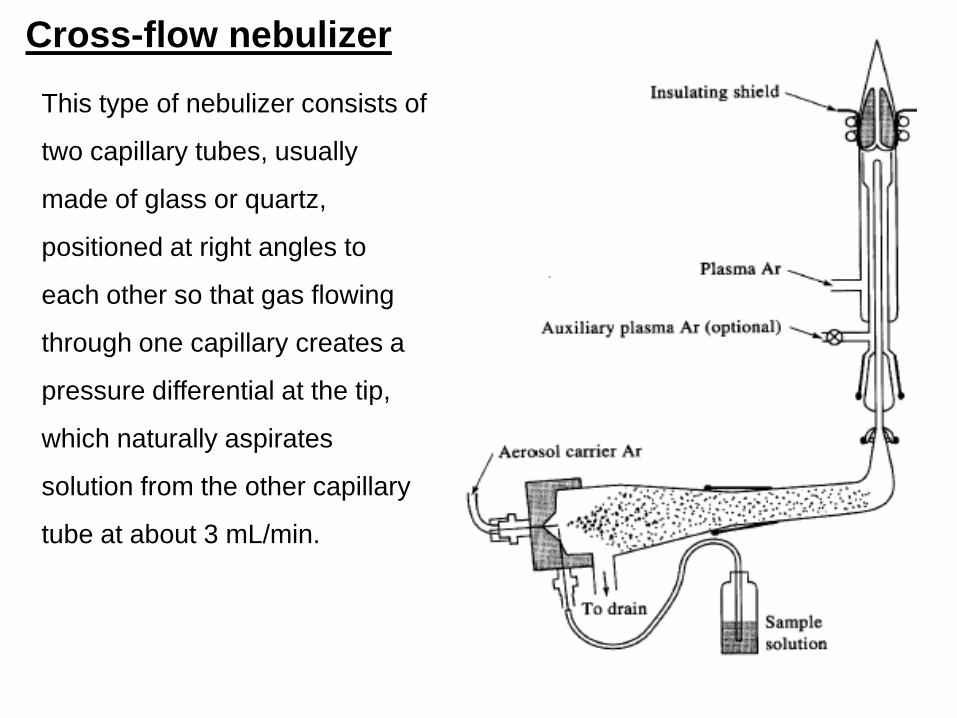
Cross-flow nebulizer
This type of nebulizer consists of
two capillary tubes, usually
made of glass or quartz,
positioned at right angles to
each other so that gas flowing
through one capillary creates a
pressure differential at the tip,
which naturally aspirates
solution from the other capillary
tube at about 3 mL/min.
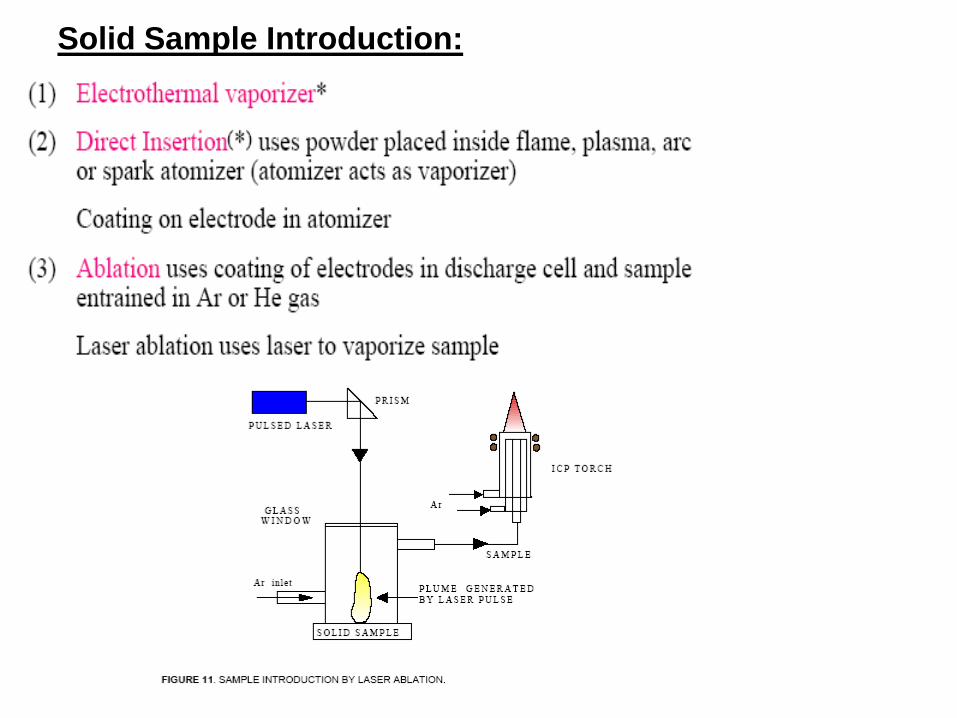
Solid Sample Introduction:
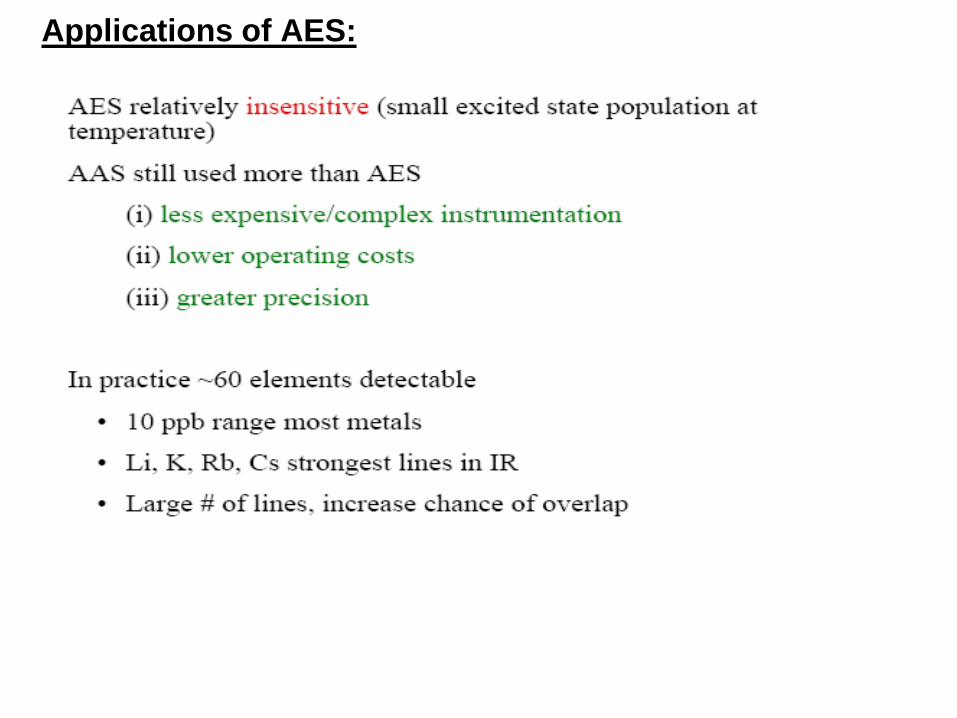
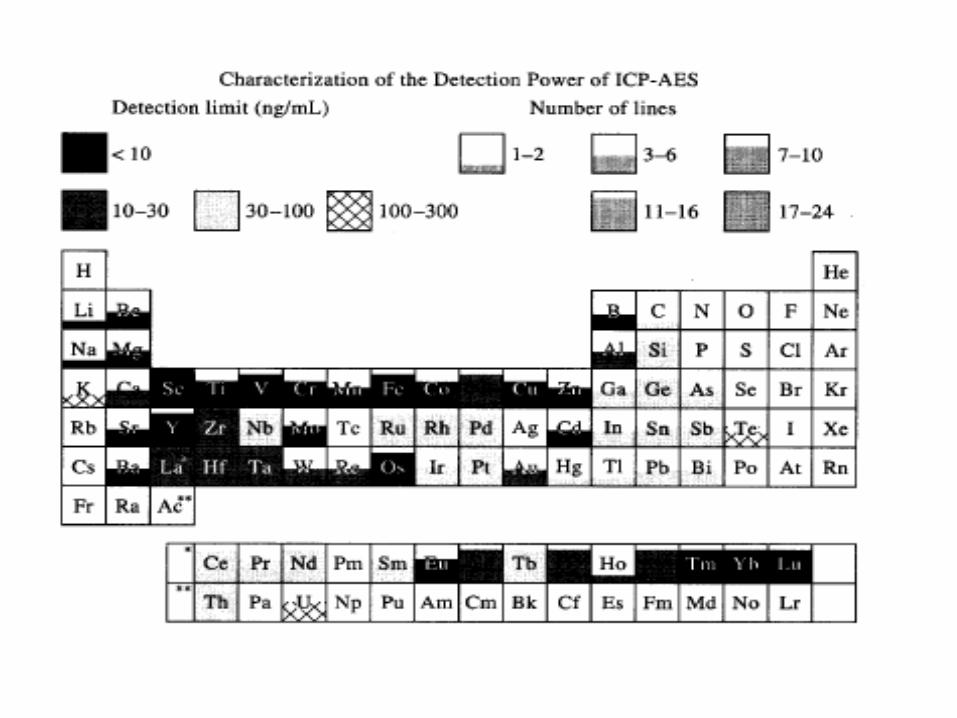
Applications of AES:
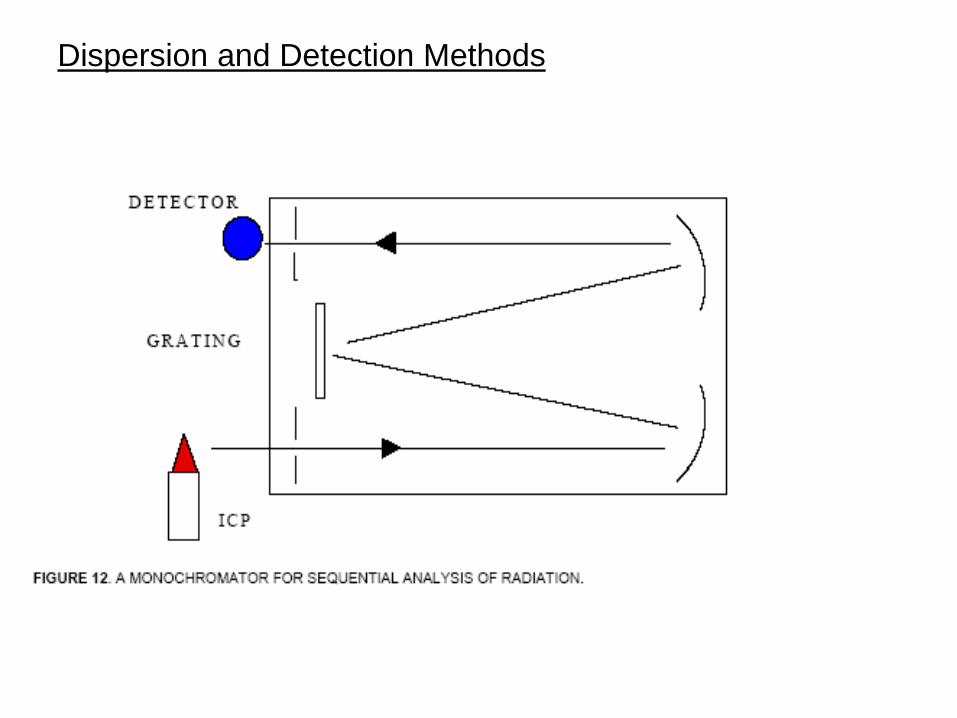
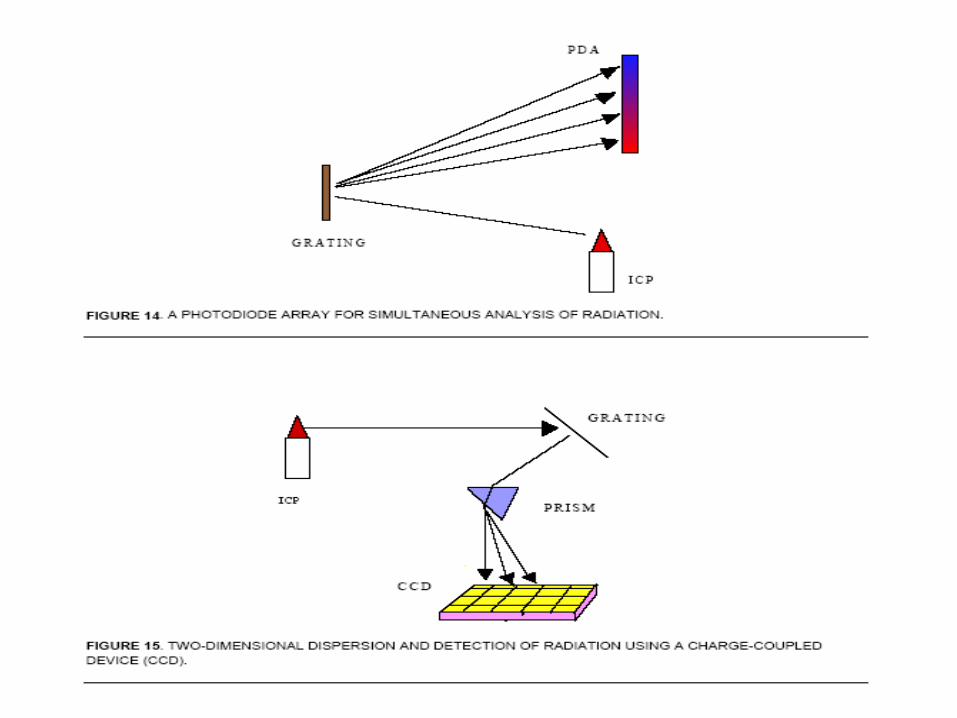
Dispersion and Detection Methods
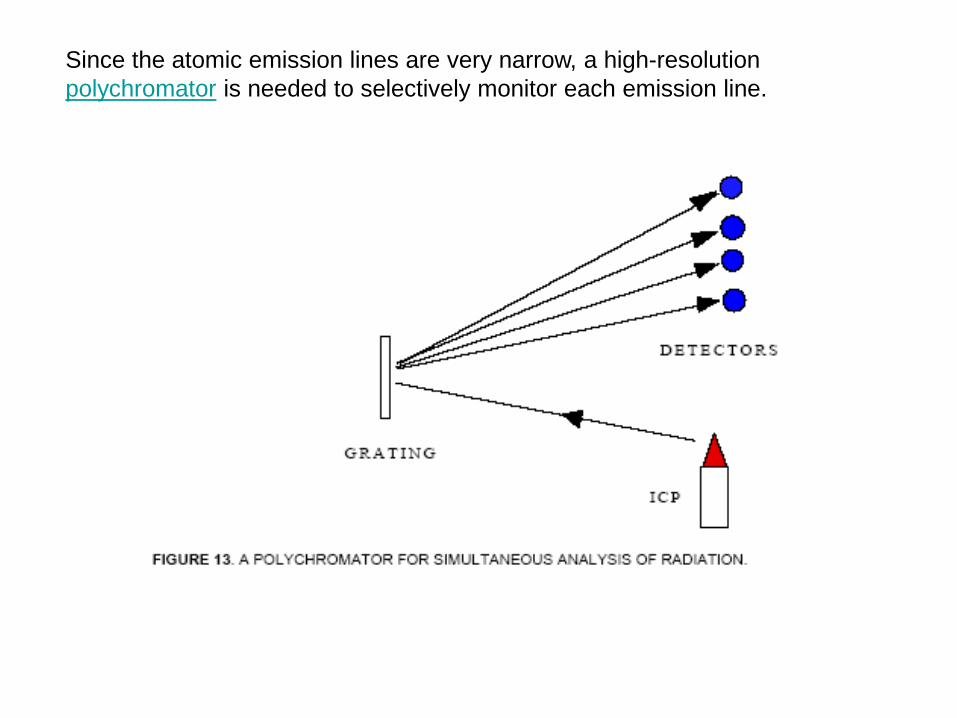
Since the atomic emission lines are very narrow, a high-resolution polychromator is needed to selectively monitor each emission line.