Embed Size (px)
Citation preview
Thin Solid Films 542 (2013) 100–107
Contents lists available at SciVerse ScienceDirect
Thin Solid Films
j ourna l homepage: www.e lsev ie r .com/ locate / ts f
Atomic layer deposition of TiO2 from TiCl4 and O3
Lauri Aarik a,⁎, Tõnis Arroval a, Raul Rammula a, Hugo Mändar a, Väino Sammelselg a,b, Jaan Aarik a
a University of Tartu, Institute of Physics, Riia 142, 51014 Tartu, Estoniab University of Tartu, Institute of Chemistry, Ravila 14A, 50411 Tartu, Estonia
⁎ Corresponding author. Tel.: +372 7374673.E-mail address: [email protected] (L. Aarik).
0040-6090/$ – see front matter © 2013 Elsevier B.V. Allhttp://dx.doi.org/10.1016/j.tsf.2013.06.074
a b s t r a c t
a r t i c l e i n f oArticle history:Received 31 December 2012Received in revised form 18 June 2013Accepted 20 June 2013Available online 1 July 2013
Keywords:Atomic layer depositionTitanium dioxideCrystallizationSurface morpholgyOzooneTitanium chloride
Atomic layer deposition (ALD) of thin films from TiCl4 and O3 on Si(100) substrates was investigated. Thegrowth of TiO2 was obtained at substrate temperatures of 225–600 °C from these hydrogen-free precursors.Formation of anatase phase in the films was observed at 250–600 °C. In addition, the rutile phase wasrevealed in thicker films deposited at 600 °C. Compared to the well studied TiCl4–H2O ALD process theTiCl4–O3 process allowed higher growth rate at 275–600 °C. In addition, relatively low surface roughness wasobtained for thicker (N50 nm) films of the anatase structure deposited from TiCl4 and O3 at 350–400 °C. There-fore TiCl4 and O3 appeared to be a good precursor combination for ALD of TiO2, particularly for applications thatrequire low concentration of hydrogen contamination.
© 2013 Elsevier B.V. All rights reserved.
1. Introduction
Studies performed during last few decades have demonstratedthat, due to high chemical stability, photocatalytic activity, refractiveindex and dielectric constant, titanium dioxide (TiO2) thin filmsprepared by atomic layer deposition (ALD) are suitable for variousapplications [1–4]. For instance, there has been a great interest in TiO2
as a high-permittivity (high-k) dielectric for metal–insulator–metalcapacitors of dynamic random access memories (DRAM) [5–7] and asa material of anti-corrosive coatings for different applications [8–10].For both applications, it is important to have impurity-free and phase-purefilms. To obtain this kind of films, a suitable precursor combinationshould be selected. In ALD of TiO2, several combinations of precursorsincluding TiCl4–H2O [11–13], TiCl4–H2O2 [14], Ti(OCH2CH3)4–H2O[15,16], Ti[OCH(CH3)2]4–H2O [17–19], Ti[OCH(CH3)2]4–H2O2 [18],TiI4–H2O–H2O2 [20–22], etc. have been investigated. In most cases, thevapor of either water or hydrogen peroxide or both at the same timehas been used as the oxygen source. The processes have been describedto proceed mainly via the formation of hydroxyl groups on the surface,although oxygen bridges are also expected to participate in the surfacereactions at higher temperatures [23]. In some applications, e.g. inanticorrosive coatings or DRAM capacitors, the possible hydrogencontamination of films obtained in these processes may markedlyreduce the material quality [24,25]. An alternative approach for ALD ofmetal oxides is to apply O2 and O3 as oxygen precursors. For example,TiI4–O2 [26], Ti(OCH(CH3)2)4–O2 [27], Ti(OCH(CH3)2)4–O3 [28], andTi(N(CH3)2)4–O2 [29] as possible precursor combinations for deposition
rights reserved.
of TiO2 have been described earlier. Predominately, different organiccompounds have been combined with oxygen and ozone. The maindrawback of this kind of metal precursors is carbon contamination ofthe films deposited at lower temperatures and thermal decompositionof these precursors that limits application of the corresponding ALDprocesses at higher temperatures [30]. Moreover, the films still maycontain residual hydrogen as a constituent of these metal precursors.Relatively low concentration of impurities has been reported for TiO2
films deposited from TiI4 and O2 [26] but in this case, high evaporationtemperature of TiI4 and formation of highly corrosive reaction by-products are disadvantages. In addition, notable deviations from self-limited growth have been observed in the case of TiI4-based ALDprocesses at temperatures exceeding 400 °C [20].
The goal of this study is to clarify the possibilities to use TiCl4 andozone as hydrogen-free precursors in ALD and to reveal how the ap-plication of ozone as an oxygen precursor instead of H2O influencesthe phase composition, morphology and optical parameters of TiO2
thin films.
2. Experimental details
2.1. Atomic layer deposition
TiO2 films were deposited in a low-pressure flow-type ALD reactordescribed elsewhere [31]. The ALD cycle, which was repeated untilthe required thickness of a film was obtained, contained TiCl4 pulse,purge, O3 pulse and another purge. Nitrogen of 99.999% purity(AGA) was used as a carrier and purge gas. During the depositionthe gas pressure ranged from 220 to 240 Pa in the reaction chamber.The vapor of TiCl4 was led into the reactor from an external reservoir
10-1 100 10110-3
10-2
10-1
Pulse duration, s
, , TiCl4 pulse varied
, O3 pulse varied
H2O pulse varied
TiCl4-O3 250°C
TiCl4-H2O 160°C
TiCl4-O3 225°C
Mas
s gr
owth
per
cyc
le, n
g/m
m2
100
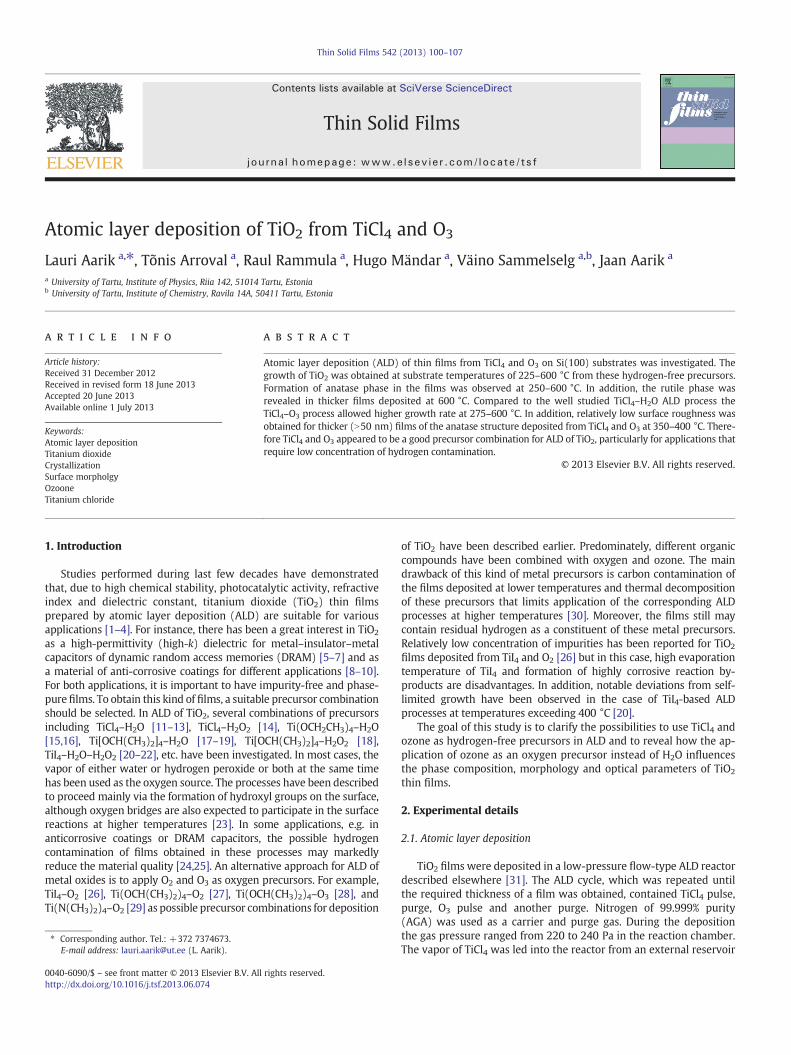
Fig. 1. Mass growth per cycle as a function of precursor pulse duration measured byQCM for TiCl4–O3 process at 225 and 250 °C and for TiCl4–H2O process at 160 °C. Thefirst purge, oxygen precursor pulse and the second purge were kept at 5, 5 and 10 s,respectively, when TiCl4 pulse duration was varied. TiCl4 pulse, the first purge, andthe second purge were kept at 5, 5 and 10 s, respectively, when oxygen precursorpulse duration was varied.
101L. Aarik et al. / Thin Solid Films 542 (2013) 100–107
kept with liquid TiCl4 (99.9% purity) at room temperature (20–23 °C).A capillary was used to control the vapor flow. Ozone was producedfrom O2 (99.999% purity, AGA) using BMT Messtechnik 802 N gener-ator. The ozone concentration, measured by BMT Messtechnik 964analyzer, was 200–220 g/m3 in our experiments. The partial pressureof the oxygen precursor was 34 Pa in the reaction chamber during theO3/O2 pulse.
In order to characterize the film growth in real time and optimizethe deposition parameters, we used quartz crystal microbalance(QCM) data acquired by Q-pod quartz crystal monitor (Inficon). Onthe basis of QCM data obtained, the ALD cycle times were chosenfor further growth experiments in which films were deposited ontoSi (100) substrates. If not stated otherwise, then ALD cycle timeparameters of 2–2–5–5 s, i.e. the TiCl4 pulse of 2 s, the first purge of2 s, ozone pulse of 5 s and the second purge of 5 s, were used forthe deposition of films on these substrates. The Si(100) substrateswere etched in HF and then rinsed in de-ionized water immediatelybefore loading the substrates into the reactor. During heating thereaction chamber up to the growth temperature (TG) the substrateswere purged with pure carrier gas. The carrier gas flow and pressurewere similar to those used during the following deposition of thefilms.
For deposition of reference films, a well-known TiCl4–H2O processwas applied. In this case, the partial pressure of H2O was 13 Pa in thereaction chamber during the oxygen precursor pulse. The partialpressure of H2O was kept lower than that of ozone and the H2Opulse was shorter (2 s) because H2O was more reactive in combina-tion with TiCl4 and removal of excessive H2O was more difficultfrom the reactor during the purge, particularly at lower temperatures.In addition, a TiCl4 pulse of 0.5 s duration was used in the TiCl4–H2Oprocess. This duration was sufficient to obtain reliable saturation ofadsorption and resulted in lower surface roughness of films thanlonger TiCl4 pulses did [32]. Other process parameters were similarin the TiCl4–O3 and TiCl4–H2O processes studied in this work.
2.2. Characterization
X-ray diffractometer SmartLab (Rigaku™) was used to evaluatethe thickness, density and surface roughness by the X-ray reflection(XRR) method and to characterize the crystal structure by grazingincidence X-ray diffraction (GIXRD) method. The measurementswere performed at room temperature using CuKα radiation from a9 kW X-ray tube with a rotating anode. The GIXRD studies werecarried out at an incidence angle of 0.29°. This angle was close to theoptimum values for anatase and rutile films and allowed efficientreduction of the reflections from the substrate. In addition to GIXRD,the Raman spectroscopy method was applied for structure studies.The Raman spectra were recorded with a Renishaw inVia micro-Raman spectrometer. The power of the incident laser beam with awavelength of 514 nm was about 10 mW on the sample and theRaman spectra were recorded with a spectral resolution of 1.5 cm−1
in these measurements. A silicon reference sample was used for thecalibration of the Raman shift. Information on the mass thickness andimpurity content in the films was acquired from X-ray fluorescencespectroscopy (XRF) measurements.
As XRR did not allow reliable characterization of very rough films,root mean square (RMS) roughness was measured also by the atomicforce microscopy (AFM) using Autoprobe CP II (Veeco InstrumentsInc.). The studies were carried out in air using silicon cantileverswith a typical tip radius of ≤10 nm and data were collected fromthe surface area of 1 × 1 or 5 × 5 μm2. The RMS surface roughnesswas analyzed by Veeco SPMlab NT v6.0.2 software package. In order todetermine the refractive index values and obtain supporting informationon film thickness, we employed spectroscopic ellipsometer GES5-E(SEMILAB, Sopra). From the results of spectroscopic ellipsometry (SE)studies, we also estimated the thickness of the interface layer formed
between a substrate and TiO2 film. In addition, the thicknesses of TiO2
films determined by SE were combined with XRF on mass thicknessdata for alternative estimation of the film densities.
3. Results and discussion
3.1. Growth rate
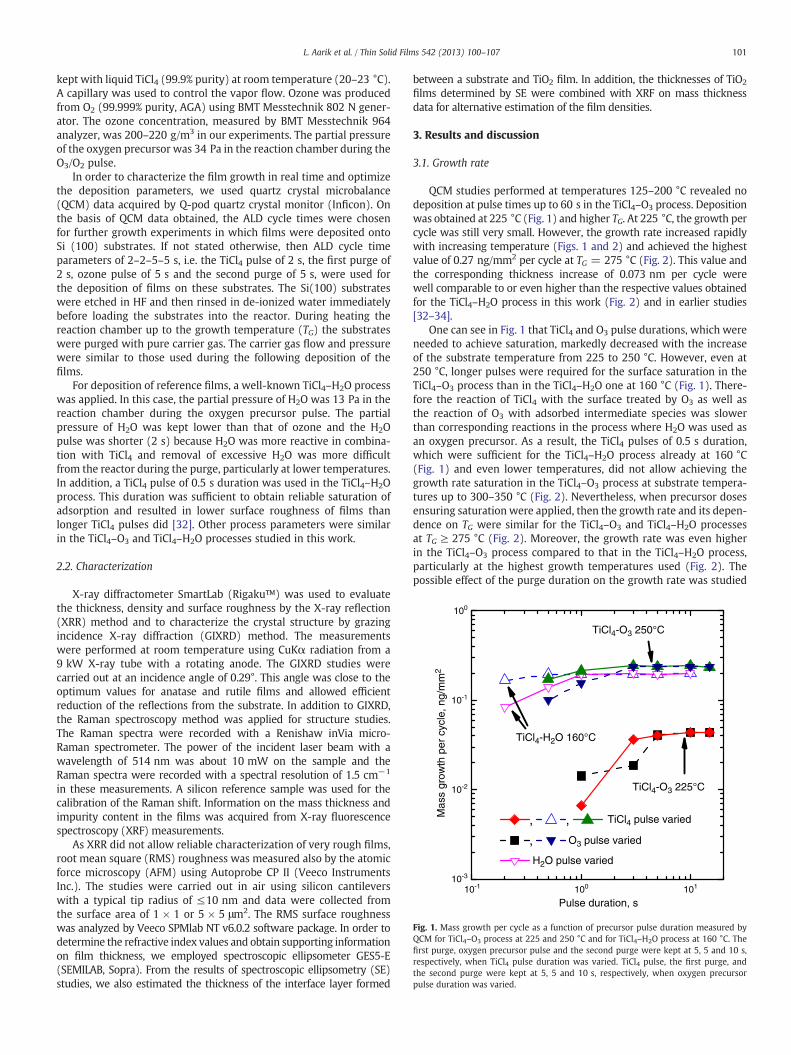
QCM studies performed at temperatures 125–200 °C revealed nodeposition at pulse times up to 60 s in the TiCl4–O3 process. Depositionwas obtained at 225 °C (Fig. 1) and higher TG. At 225 °C, the growth percycle was still very small. However, the growth rate increased rapidlywith increasing temperature (Figs. 1 and 2) and achieved the highestvalue of 0.27 ng/mm2 per cycle at TG = 275 °C (Fig. 2). This value andthe corresponding thickness increase of 0.073 nm per cycle werewell comparable to or even higher than the respective values obtainedfor the TiCl4–H2O process in this work (Fig. 2) and in earlier studies[32–34].
One can see in Fig. 1 that TiCl4 and O3 pulse durations, which wereneeded to achieve saturation, markedly decreased with the increaseof the substrate temperature from 225 to 250 °C. However, even at250 °C, longer pulses were required for the surface saturation in theTiCl4–O3 process than in the TiCl4–H2O one at 160 °C (Fig. 1). There-fore the reaction of TiCl4 with the surface treated by O3 as well asthe reaction of O3 with adsorbed intermediate species was slowerthan corresponding reactions in the process where H2O was used asan oxygen precursor. As a result, the TiCl4 pulses of 0.5 s duration,which were sufficient for the TiCl4–H2O process already at 160 °C(Fig. 1) and even lower temperatures, did not allow achieving thegrowth rate saturation in the TiCl4–O3 process at substrate tempera-tures up to 300–350 °C (Fig. 2). Nevertheless, when precursor dosesensuring saturation were applied, then the growth rate and its depen-dence on TG were similar for the TiCl4–O3 and TiCl4–H2O processesat TG ≥ 275 °C (Fig. 2). Moreover, the growth rate was even higherin the TiCl4–O3 process compared to that in the TiCl4–H2O process,particularly at the highest growth temperatures used (Fig. 2). Thepossible effect of the purge duration on the growth rate was studied
0.00
0.05
0.10
0.15
0.20
0.25
0.30
100 200 300 400 500 6000.00
0.05
0.10
0.15
0.20
0.25
0.30 TiCl4-O3
TiCl4-O3; 2-2-5-5 s
TiCl4-H2O; 0.5-2-2-5 s
TiCl4-O3; 0.5-2-5-5 s
(a)
(b)
Growth temperature, °C
8-13 nm
12-20 nm
40-60 nm
70-95 nm
TiCl4-H2O
Mas
s gr
owth
per
cyc
le, n
g/m
m2
Fig. 2. Mass growth per cycle as a function of growth temperature for films (a) depositedat constant number of ALD cycles and different ALD cycle time parameters and (b) forfilms with different thicknesses.
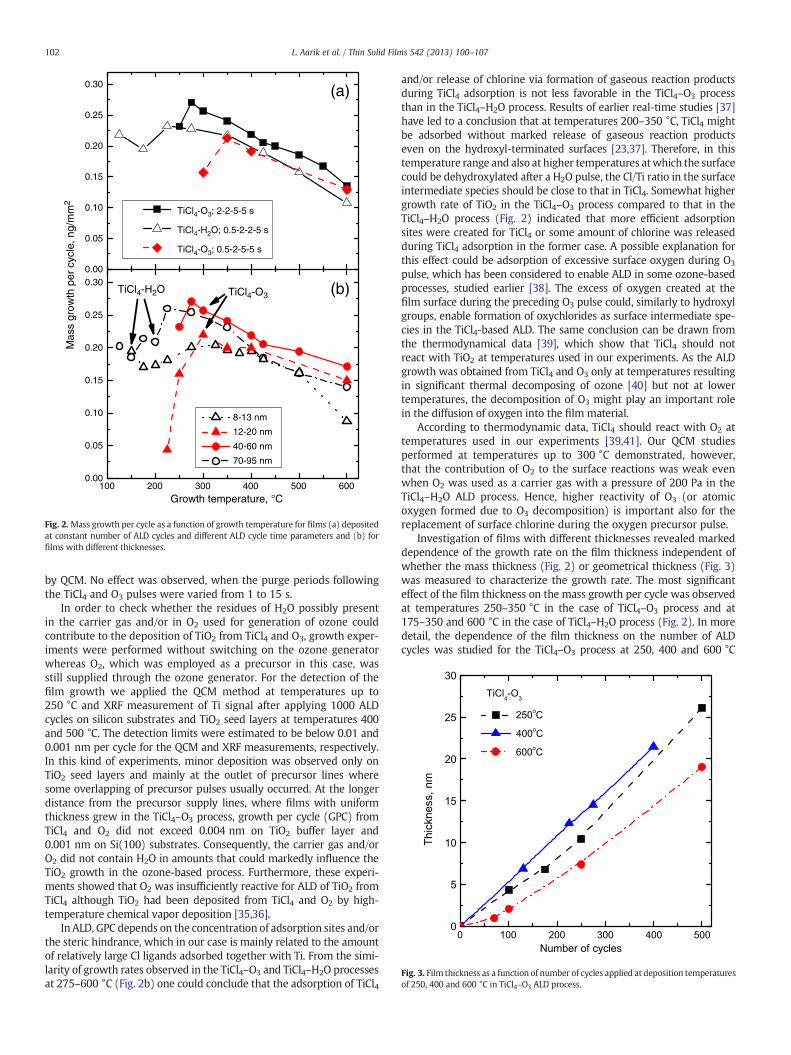
Fig. 3. Film thickness as a function of number of cycles applied at deposition temperaturesof 250, 400 and 600 °C in TiCl4–O3 ALD process.
102 L. Aarik et al. / Thin Solid Films 542 (2013) 100–107
by QCM. No effect was observed, when the purge periods followingthe TiCl4 and O3 pulses were varied from 1 to 15 s.
In order to check whether the residues of H2O possibly presentin the carrier gas and/or in O2 used for generation of ozone couldcontribute to the deposition of TiO2 from TiCl4 and O3, growth exper-iments were performed without switching on the ozone generatorwhereas O2, which was employed as a precursor in this case, wasstill supplied through the ozone generator. For the detection of thefilm growth we applied the QCM method at temperatures up to250 °C and XRF measurement of Ti signal after applying 1000 ALDcycles on silicon substrates and TiO2 seed layers at temperatures 400and 500 °C. The detection limits were estimated to be below 0.01 and0.001 nm per cycle for the QCM and XRF measurements, respectively.In this kind of experiments, minor deposition was observed only onTiO2 seed layers and mainly at the outlet of precursor lines wheresome overlapping of precursor pulses usually occurred. At the longerdistance from the precursor supply lines, where films with uniformthickness grew in the TiCl4–O3 process, growth per cycle (GPC) fromTiCl4 and O2 did not exceed 0.004 nm on TiO2 buffer layer and0.001 nm on Si(100) substrates. Consequently, the carrier gas and/orO2 did not contain H2O in amounts that could markedly influence theTiO2 growth in the ozone-based process. Furthermore, these experi-ments showed that O2 was insufficiently reactive for ALD of TiO2 fromTiCl4 although TiO2 had been deposited from TiCl4 and O2 by high-temperature chemical vapor deposition [35,36].
In ALD, GPC depends on the concentration of adsorption sites and/orthe steric hindrance, which in our case is mainly related to the amountof relatively large Cl ligands adsorbed together with Ti. From the simi-larity of growth rates observed in the TiCl4–O3 and TiCl4–H2O processesat 275–600 °C (Fig. 2b) one could conclude that the adsorption of TiCl4
and/or release of chlorine via formation of gaseous reaction productsduring TiCl4 adsorption is not less favorable in the TiCl4–O3 processthan in the TiCl4–H2O process. Results of earlier real-time studies [37]have led to a conclusion that at temperatures 200–350 °C, TiCl4 mightbe adsorbed without marked release of gaseous reaction productseven on the hydroxyl-terminated surfaces [23,37]. Therefore, in thistemperature range and also at higher temperatures atwhich the surfacecould be dehydroxylated after a H2O pulse, the Cl/Ti ratio in the surfaceintermediate species should be close to that in TiCl4. Somewhat highergrowth rate of TiO2 in the TiCl4–O3 process compared to that in theTiCl4–H2O process (Fig. 2) indicated that more efficient adsorptionsites were created for TiCl4 or some amount of chlorine was releasedduring TiCl4 adsorption in the former case. A possible explanation forthis effect could be adsorption of excessive surface oxygen during O3
pulse, which has been considered to enable ALD in some ozone-basedprocesses, studied earlier [38]. The excess of oxygen created at thefilm surface during the preceding O3 pulse could, similarly to hydroxylgroups, enable formation of oxychlorides as surface intermediate spe-cies in the TiCl4-based ALD. The same conclusion can be drawn fromthe thermodynamical data [39], which show that TiCl4 should notreact with TiO2 at temperatures used in our experiments. As the ALDgrowth was obtained from TiCl4 and O3 only at temperatures resultingin significant thermal decomposing of ozone [40] but not at lowertemperatures, the decomposition of O3 might play an important rolein the diffusion of oxygen into the film material.
According to thermodynamic data, TiCl4 should react with O2 attemperatures used in our experiments [39,41]. Our QCM studiesperformed at temperatures up to 300 °C demonstrated, however,that the contribution of O2 to the surface reactions was weak evenwhen O2 was used as a carrier gas with a pressure of 200 Pa in theTiCl4–H2O ALD process. Hence, higher reactivity of O3 (or atomicoxygen formed due to O3 decomposition) is important also for thereplacement of surface chlorine during the oxygen precursor pulse.
Investigation of films with different thicknesses revealed markeddependence of the growth rate on the film thickness independent ofwhether the mass thickness (Fig. 2) or geometrical thickness (Fig. 3)was measured to characterize the growth rate. The most significanteffect of the film thickness on the mass growth per cycle was observedat temperatures 250–350 °C in the case of TiCl4–O3 process and at175–350 and 600 °C in the case of TiCl4–H2O process (Fig. 2). In moredetail, the dependence of the film thickness on the number of ALDcycles was studied for the TiCl4–O3 process at 250, 400 and 600 °C
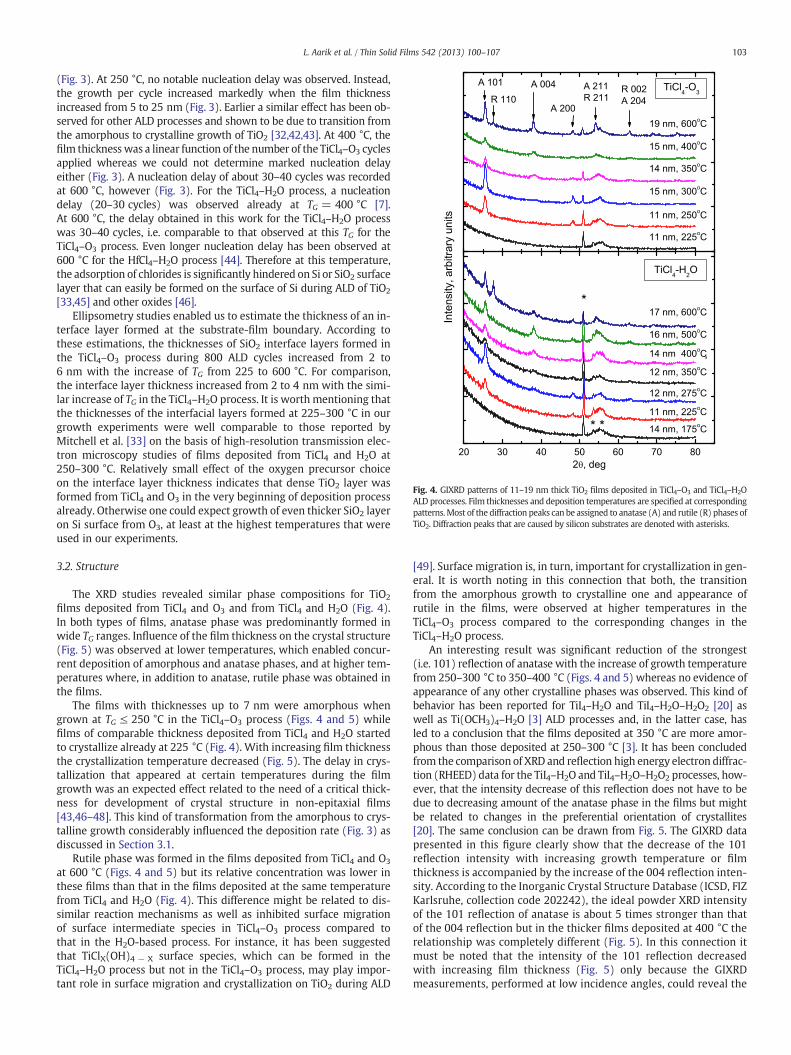
Fig. 4. GIXRD patterns of 11–19 nm thick TiO2 films deposited in TiCl4–O3 and TiCl4–H2OALD processes. Film thicknesses and deposition temperatures are specified at correspondingpatterns.Most of the diffraction peaks can be assigned to anatase (A) and rutile (R) phases ofTiO2. Diffraction peaks that are caused by silicon substrates are denoted with asterisks.
103L. Aarik et al. / Thin Solid Films 542 (2013) 100–107
(Fig. 3). At 250 °C, no notable nucleation delay was observed. Instead,the growth per cycle increased markedly when the film thicknessincreased from 5 to 25 nm (Fig. 3). Earlier a similar effect has been ob-served for other ALD processes and shown to be due to transition fromthe amorphous to crystalline growth of TiO2 [32,42,43]. At 400 °C, thefilm thicknesswas a linear function of the number of the TiCl4–O3 cyclesapplied whereas we could not determine marked nucleation delayeither (Fig. 3). A nucleation delay of about 30–40 cycles was recordedat 600 °C, however (Fig. 3). For the TiCl4–H2O process, a nucleationdelay (20–30 cycles) was observed already at TG = 400 °C [7].At 600 °C, the delay obtained in this work for the TiCl4–H2O processwas 30–40 cycles, i.e. comparable to that observed at this TG for theTiCl4–O3 process. Even longer nucleation delay has been observed at600 °C for the HfCl4–H2O process [44]. Therefore at this temperature,the adsorption of chlorides is significantly hindered on Si or SiO2 surfacelayer that can easily be formed on the surface of Si during ALD of TiO2
[33,45] and other oxides [46].Ellipsometry studies enabled us to estimate the thickness of an in-
terface layer formed at the substrate-film boundary. According tothese estimations, the thicknesses of SiO2 interface layers formed inthe TiCl4–O3 process during 800 ALD cycles increased from 2 to6 nm with the increase of TG from 225 to 600 °C. For comparison,the interface layer thickness increased from 2 to 4 nm with the simi-lar increase of TG in the TiCl4–H2O process. It is worth mentioning thatthe thicknesses of the interfacial layers formed at 225–300 °C in ourgrowth experiments were well comparable to those reported byMitchell et al. [33] on the basis of high-resolution transmission elec-tron microscopy studies of films deposited from TiCl4 and H2O at250–300 °C. Relatively small effect of the oxygen precursor choiceon the interface layer thickness indicates that dense TiO2 layer wasformed from TiCl4 and O3 in the very beginning of deposition processalready. Otherwise one could expect growth of even thicker SiO2 layeron Si surface from O3, at least at the highest temperatures that wereused in our experiments.
3.2. Structure
The XRD studies revealed similar phase compositions for TiO2
films deposited from TiCl4 and O3 and from TiCl4 and H2O (Fig. 4).In both types of films, anatase phase was predominantly formed inwide TG ranges. Influence of the film thickness on the crystal structure(Fig. 5) was observed at lower temperatures, which enabled concur-rent deposition of amorphous and anatase phases, and at higher tem-peratures where, in addition to anatase, rutile phase was obtained inthe films.
The films with thicknesses up to 7 nm were amorphous whengrown at TG ≤ 250 °C in the TiCl4–O3 process (Figs. 4 and 5) whilefilms of comparable thickness deposited from TiCl4 and H2O startedto crystallize already at 225 °C (Fig. 4). With increasing film thicknessthe crystallization temperature decreased (Fig. 5). The delay in crys-tallization that appeared at certain temperatures during the filmgrowth was an expected effect related to the need of a critical thick-ness for development of crystal structure in non-epitaxial films[43,46–48]. This kind of transformation from the amorphous to crys-talline growth considerably influenced the deposition rate (Fig. 3) asdiscussed in Section 3.1.
Rutile phase was formed in the films deposited from TiCl4 and O3
at 600 °C (Figs. 4 and 5) but its relative concentration was lower inthese films than that in the films deposited at the same temperaturefrom TiCl4 and H2O (Fig. 4). This difference might be related to dis-similar reaction mechanisms as well as inhibited surface migrationof surface intermediate species in TiCl4–O3 process compared tothat in the H2O-based process. For instance, it has been suggestedthat TiClX(OH)4 − X surface species, which can be formed in theTiCl4–H2O process but not in the TiCl4–O3 process, may play impor-tant role in surface migration and crystallization on TiO2 during ALD
[49]. Surface migration is, in turn, important for crystallization in gen-eral. It is worth noting in this connection that both, the transitionfrom the amorphous growth to crystalline one and appearance ofrutile in the films, were observed at higher temperatures in theTiCl4–O3 process compared to the corresponding changes in theTiCl4–H2O process.
An interesting result was significant reduction of the strongest(i.e. 101) reflection of anatase with the increase of growth temperaturefrom 250–300 °C to 350–400 °C (Figs. 4 and 5) whereas no evidence ofappearance of any other crystalline phases was observed. This kind ofbehavior has been reported for TiI4–H2O and TiI4–H2O–H2O2 [20] aswell as Ti(OCH3)4–H2O [3] ALD processes and, in the latter case, hasled to a conclusion that the films deposited at 350 °C are more amor-phous than those deposited at 250–300 °C [3]. It has been concludedfrom the comparison of XRD and reflection high energy electron diffrac-tion (RHEED) data for the TiI4–H2O and TiI4–H2O–H2O2 processes, how-ever, that the intensity decrease of this reflection does not have to bedue to decreasing amount of the anatase phase in the films but mightbe related to changes in the preferential orientation of crystallites[20]. The same conclusion can be drawn from Fig. 5. The GIXRD datapresented in this figure clearly show that the decrease of the 101reflection intensity with increasing growth temperature or filmthickness is accompanied by the increase of the 004 reflection inten-sity. According to the Inorganic Crystal Structure Database (ICSD, FIZKarlsruhe, collection code 202242), the ideal powder XRD intensityof the 101 reflection of anatase is about 5 times stronger than thatof the 004 reflection but in the thicker films deposited at 400 °C therelationship was completely different (Fig. 5). In this connection itmust be noted that the intensity of the 101 reflection decreasedwith increasing film thickness (Fig. 5) only because the GIXRDmeasurements, performed at low incidence angles, could reveal the
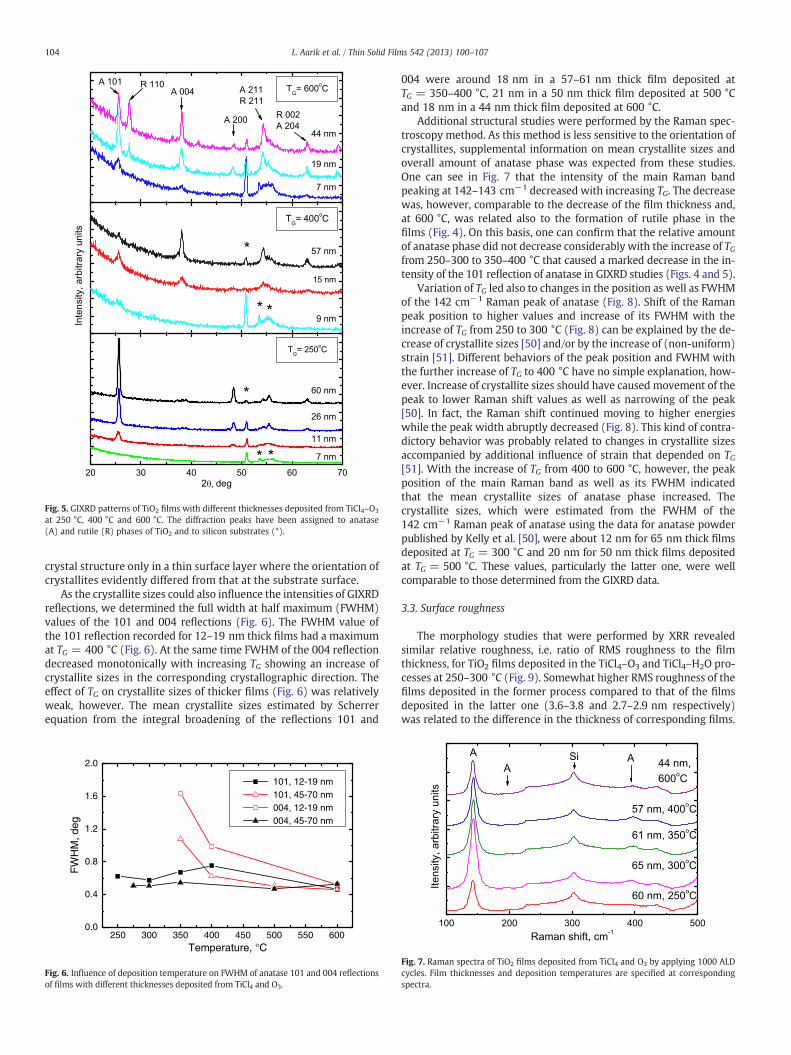
Fig. 5. GIXRD patterns of TiO2 films with different thicknesses deposited from TiCl4–O3
at 250 °C, 400 °C and 600 °C. The diffraction peaks have been assigned to anatase(A) and rutile (R) phases of TiO2 and to silicon substrates (*).
104 L. Aarik et al. / Thin Solid Films 542 (2013) 100–107
crystal structure only in a thin surface layer where the orientation ofcrystallites evidently differed from that at the substrate surface.
As the crystallite sizes could also influence the intensities of GIXRDreflections, we determined the full width at half maximum (FWHM)values of the 101 and 004 reflections (Fig. 6). The FWHM value ofthe 101 reflection recorded for 12–19 nm thick films had a maximumat TG = 400 °C (Fig. 6). At the same time FWHM of the 004 reflectiondecreased monotonically with increasing TG showing an increase ofcrystallite sizes in the corresponding crystallographic direction. Theeffect of TG on crystallite sizes of thicker films (Fig. 6) was relativelyweak, however. The mean crystallite sizes estimated by Scherrerequation from the integral broadening of the reflections 101 and
250 300 350 400 450 500 550 6000.0
0.4
0.8
1.2
1.6
2.0
FW
HM
, deg
Temperature, °C
101, 12-19 nm 101, 45-70 nm 004, 12-19 nm 004, 45-70 nm
Fig. 6. Influence of deposition temperature on FWHM of anatase 101 and 004 reflectionsof films with different thicknesses deposited from TiCl4 and O3.
004 were around 18 nm in a 57–61 nm thick film deposited atTG = 350–400 °C, 21 nm in a 50 nm thick film deposited at 500 °Cand 18 nm in a 44 nm thick film deposited at 600 °C.
Additional structural studies were performed by the Raman spec-troscopy method. As this method is less sensitive to the orientation ofcrystallites, supplemental information on mean crystallite sizes andoverall amount of anatase phase was expected from these studies.One can see in Fig. 7 that the intensity of the main Raman bandpeaking at 142–143 cm−1 decreased with increasing TG. The decreasewas, however, comparable to the decrease of the film thickness and,at 600 °C, was related also to the formation of rutile phase in thefilms (Fig. 4). On this basis, one can confirm that the relative amountof anatase phase did not decrease considerably with the increase of TGfrom 250–300 to 350–400 °C that caused a marked decrease in the in-tensity of the 101 reflection of anatase in GIXRD studies (Figs. 4 and 5).
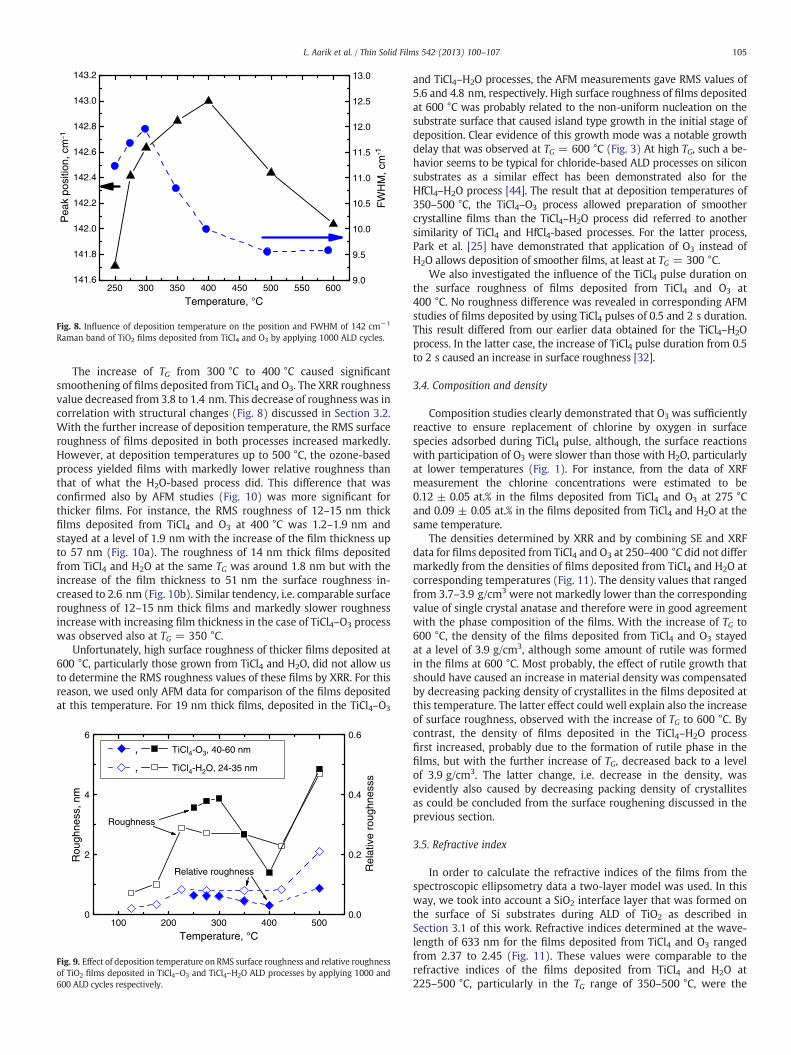
Variation of TG led also to changes in the position as well as FWHMof the 142 cm−1 Raman peak of anatase (Fig. 8). Shift of the Ramanpeak position to higher values and increase of its FWHM with theincrease of TG from 250 to 300 °C (Fig. 8) can be explained by the de-crease of crystallite sizes [50] and/or by the increase of (non-uniform)strain [51]. Different behaviors of the peak position and FWHM withthe further increase of TG to 400 °C have no simple explanation, how-ever. Increase of crystallite sizes should have caused movement of thepeak to lower Raman shift values as well as narrowing of the peak[50]. In fact, the Raman shift continued moving to higher energieswhile the peak width abruptly decreased (Fig. 8). This kind of contra-dictory behavior was probably related to changes in crystallite sizesaccompanied by additional influence of strain that depended on TG[51]. With the increase of TG from 400 to 600 °C, however, the peakposition of the main Raman band as well as its FWHM indicatedthat the mean crystallite sizes of anatase phase increased. Thecrystallite sizes, which were estimated from the FWHM of the142 cm−1 Raman peak of anatase using the data for anatase powderpublished by Kelly et al. [50], were about 12 nm for 65 nm thick filmsdeposited at TG = 300 °C and 20 nm for 50 nm thick films depositedat TG = 500 °C. These values, particularly the latter one, were wellcomparable to those determined from the GIXRD data.
3.3. Surface roughness
The morphology studies that were performed by XRR revealedsimilar relative roughness, i.e. ratio of RMS roughness to the filmthickness, for TiO2 films deposited in the TiCl4–O3 and TiCl4–H2O pro-cesses at 250–300 °C (Fig. 9). Somewhat higher RMS roughness of thefilms deposited in the former process compared to that of the filmsdeposited in the latter one (3.6–3.8 and 2.7–2.9 nm respectively)was related to the difference in the thickness of corresponding films.
Fig. 7. Raman spectra of TiO2 films deposited from TiCl4 and O3 by applying 1000 ALDcycles. Film thicknesses and deposition temperatures are specified at correspondingspectra.
250 300 350 400 450 500 550 600141.6
141.8
142.0
142.2
142.4
142.6
142.8
143.0
143.2
Temperature, °C
Pea
k po
sitio
n, c
m
9.0
9.5
10.0
10.5
11.0
11.5
12.0
12.5
13.0
FW
HM
, cm
-1
Fig. 8. Influence of deposition temperature on the position and FWHM of 142 cm−1
Raman band of TiO2 films deposited from TiCl4 and O3 by applying 1000 ALD cycles.
105L. Aarik et al. / Thin Solid Films 542 (2013) 100–107
The increase of TG from 300 °C to 400 °C caused significantsmoothening of films deposited from TiCl4 and O3. The XRR roughnessvalue decreased from 3.8 to 1.4 nm. This decrease of roughness was incorrelation with structural changes (Fig. 8) discussed in Section 3.2.With the further increase of deposition temperature, the RMS surfaceroughness of films deposited in both processes increased markedly.However, at deposition temperatures up to 500 °C, the ozone-basedprocess yielded films with markedly lower relative roughness thanthat of what the H2O-based process did. This difference that wasconfirmed also by AFM studies (Fig. 10) was more significant forthicker films. For instance, the RMS roughness of 12–15 nm thickfilms deposited from TiCl4 and O3 at 400 °C was 1.2–1.9 nm andstayed at a level of 1.9 nm with the increase of the film thickness upto 57 nm (Fig. 10a). The roughness of 14 nm thick films depositedfrom TiCl4 and H2O at the same TG was around 1.8 nm but with theincrease of the film thickness to 51 nm the surface roughness in-creased to 2.6 nm (Fig. 10b). Similar tendency, i.e. comparable surfaceroughness of 12–15 nm thick films and markedly slower roughnessincrease with increasing film thickness in the case of TiCl4–O3 processwas observed also at TG = 350 °C.
Unfortunately, high surface roughness of thicker films deposited at600 °C, particularly those grown from TiCl4 and H2O, did not allow usto determine the RMS roughness values of these films by XRR. For thisreason, we used only AFM data for comparison of the films depositedat this temperature. For 19 nm thick films, deposited in the TiCl4–O3
100 200 300 400 5000
2
4
6
, TiCl4-O3, 40-60 nm
, TiCl4-H2O, 24-35 nm
Temperature, °C
Rou
ghne
ss, n
m
0.0
0.2
0.4
0.6
Rel
ativ
e ro
ughn
esss
Relative roughness
Roughness
Fig. 9. Effect of deposition temperature on RMS surface roughness and relative roughnessof TiO2 films deposited in TiCl4–O3 and TiCl4–H2O ALD processes by applying 1000 and600 ALD cycles respectively.
and TiCl4–H2O processes, the AFM measurements gave RMS values of5.6 and 4.8 nm, respectively. High surface roughness of films depositedat 600 °C was probably related to the non-uniform nucleation on thesubstrate surface that caused island type growth in the initial stage ofdeposition. Clear evidence of this growth mode was a notable growthdelay that was observed at TG = 600 °C (Fig. 3) At high TG, such a be-havior seems to be typical for chloride-based ALD processes on siliconsubstrates as a similar effect has been demonstrated also for theHfCl4–H2O process [44]. The result that at deposition temperatures of350–500 °C, the TiCl4–O3 process allowed preparation of smoothercrystalline films than the TiCl4–H2O process did referred to anothersimilarity of TiCl4 and HfCl4-based processes. For the latter process,Park et al. [25] have demonstrated that application of O3 instead ofH2O allows deposition of smoother films, at least at TG = 300 °C.
We also investigated the influence of the TiCl4 pulse duration onthe surface roughness of films deposited from TiCl4 and O3 at400 °C. No roughness difference was revealed in corresponding AFMstudies of films deposited by using TiCl4 pulses of 0.5 and 2 s duration.This result differed from our earlier data obtained for the TiCl4–H2Oprocess. In the latter case, the increase of TiCl4 pulse duration from 0.5to 2 s caused an increase in surface roughness [32].
3.4. Composition and density
Composition studies clearly demonstrated that O3 was sufficientlyreactive to ensure replacement of chlorine by oxygen in surfacespecies adsorbed during TiCl4 pulse, although, the surface reactionswith participation of O3 were slower than those with H2O, particularlyat lower temperatures (Fig. 1). For instance, from the data of XRFmeasurement the chlorine concentrations were estimated to be0.12 ± 0.05 at.% in the films deposited from TiCl4 and O3 at 275 °Cand 0.09 ± 0.05 at.% in the films deposited from TiCl4 and H2O at thesame temperature.
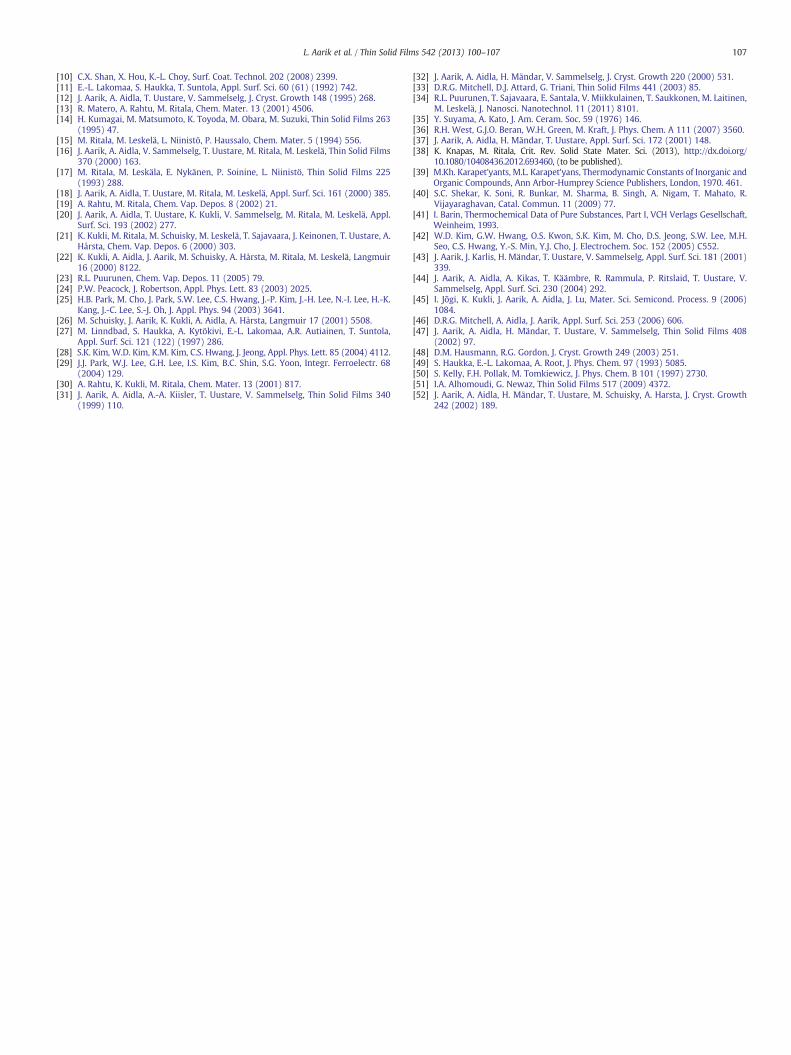
The densities determined by XRR and by combining SE and XRFdata for films deposited from TiCl4 and O3 at 250–400 °C did not differmarkedly from the densities of films deposited from TiCl4 and H2O atcorresponding temperatures (Fig. 11). The density values that rangedfrom 3.7–3.9 g/cm3 were not markedly lower than the correspondingvalue of single crystal anatase and therefore were in good agreementwith the phase composition of the films. With the increase of TG to600 °C, the density of the films deposited from TiCl4 and O3 stayedat a level of 3.9 g/cm3, although some amount of rutile was formedin the films at 600 °C. Most probably, the effect of rutile growth thatshould have caused an increase in material density was compensatedby decreasing packing density of crystallites in the films deposited atthis temperature. The latter effect could well explain also the increaseof surface roughness, observed with the increase of TG to 600 °C. Bycontrast, the density of films deposited in the TiCl4–H2O processfirst increased, probably due to the formation of rutile phase in thefilms, but with the further increase of TG, decreased back to a levelof 3.9 g/cm3. The latter change, i.e. decrease in the density, wasevidently also caused by decreasing packing density of crystallitesas could be concluded from the surface roughening discussed in theprevious section.
3.5. Refractive index
In order to calculate the refractive indices of the films from thespectroscopic ellipsometry data a two-layer model was used. In thisway, we took into account a SiO2 interface layer that was formed onthe surface of Si substrates during ALD of TiO2 as described inSection 3.1 of this work. Refractive indices determined at the wave-length of 633 nm for the films deposited from TiCl4 and O3 rangedfrom 2.37 to 2.45 (Fig. 11). These values were comparable to therefractive indices of the films deposited from TiCl4 and H2O at225–500 °C, particularly in the TG range of 350–500 °C, were the
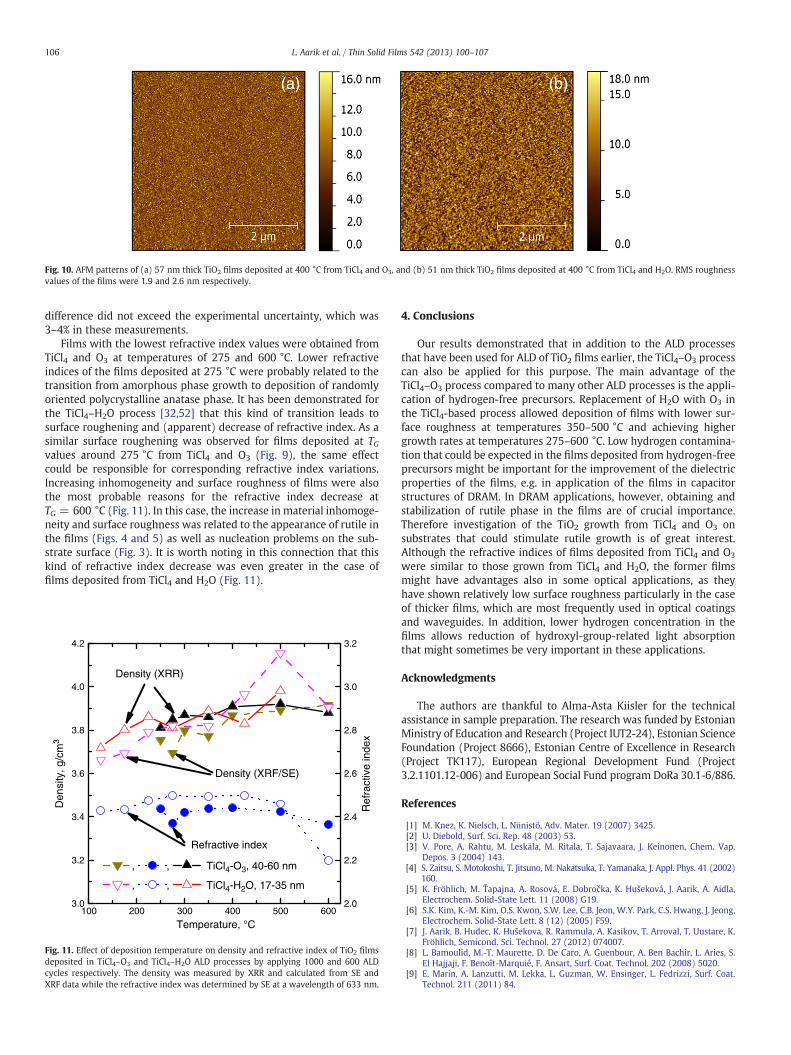
Fig. 10. AFM patterns of (a) 57 nm thick TiO2 films deposited at 400 °C from TiCl4 and O3, and (b) 51 nm thick TiO2 films deposited at 400 °C from TiCl4 and H2O. RMS roughnessvalues of the films were 1.9 and 2.6 nm respectively.
106 L. Aarik et al. / Thin Solid Films 542 (2013) 100–107
difference did not exceed the experimental uncertainty, which was3–4% in these measurements.
Films with the lowest refractive index values were obtained fromTiCl4 and O3 at temperatures of 275 and 600 °C. Lower refractiveindices of the films deposited at 275 °C were probably related to thetransition from amorphous phase growth to deposition of randomlyoriented polycrystalline anatase phase. It has been demonstrated forthe TiCl4–H2O process [32,52] that this kind of transition leads tosurface roughening and (apparent) decrease of refractive index. As asimilar surface roughening was observed for films deposited at TGvalues around 275 °C from TiCl4 and O3 (Fig. 9), the same effectcould be responsible for corresponding refractive index variations.Increasing inhomogeneity and surface roughness of films were alsothe most probable reasons for the refractive index decrease atTG = 600 °C (Fig. 11). In this case, the increase in material inhomoge-neity and surface roughness was related to the appearance of rutile inthe films (Figs. 4 and 5) as well as nucleation problems on the sub-strate surface (Fig. 3). It is worth noting in this connection that thiskind of refractive index decrease was even greater in the case offilms deposited from TiCl4 and H2O (Fig. 11).
100 200 300 400 500 6003.0
3.2
3.4
3.6
3.8
4.0
4.2
, , TiCl4-O3, 40-60 nm
, , TiCl4-H2O, 17-35 nm
Temperature, °C
Density (XRF/SE)
Density (XRR)
2.0
2.2
2.4
2.6
2.8
3.0
3.2
Ref
ract
ive
inde
x
Refractive index
Den
sity
, g/c
m3
Fig. 11. Effect of deposition temperature on density and refractive index of TiO2 filmsdeposited in TiCl4–O3 and TiCl4–H2O ALD processes by applying 1000 and 600 ALDcycles respectively. The density was measured by XRR and calculated from SE andXRF data while the refractive index was determined by SE at a wavelength of 633 nm.
4. Conclusions
Our results demonstrated that in addition to the ALD processesthat have been used for ALD of TiO2 films earlier, the TiCl4–O3 processcan also be applied for this purpose. The main advantage of theTiCl4–O3 process compared to many other ALD processes is the appli-cation of hydrogen-free precursors. Replacement of H2O with O3 inthe TiCl4-based process allowed deposition of films with lower sur-face roughness at temperatures 350–500 °C and achieving highergrowth rates at temperatures 275–600 °C. Low hydrogen contamina-tion that could be expected in the films deposited from hydrogen-freeprecursors might be important for the improvement of the dielectricproperties of the films, e.g. in application of the films in capacitorstructures of DRAM. In DRAM applications, however, obtaining andstabilization of rutile phase in the films are of crucial importance.Therefore investigation of the TiO2 growth from TiCl4 and O3 onsubstrates that could stimulate rutile growth is of great interest.Although the refractive indices of films deposited from TiCl4 and O3
were similar to those grown from TiCl4 and H2O, the former filmsmight have advantages also in some optical applications, as theyhave shown relatively low surface roughness particularly in the caseof thicker films, which are most frequently used in optical coatingsand waveguides. In addition, lower hydrogen concentration in thefilms allows reduction of hydroxyl-group-related light absorptionthat might sometimes be very important in these applications.
Acknowledgments
The authors are thankful to Alma-Asta Kiisler for the technicalassistance in sample preparation. The research was funded by EstonianMinistry of Education and Research (Project IUT2-24), Estonian ScienceFoundation (Project 8666), Estonian Centre of Excellence in Research(Project TK117), European Regional Development Fund (Project3.2.1101.12-006) and European Social Fund program DoRa 30.1-6/886.
References
[1] M. Knez, K. Nielsch, L. Niinistö, Adv. Mater. 19 (2007) 3425.[2] U. Diebold, Surf. Sci. Rep. 48 (2003) 53.[3] V. Pore, A. Rahtu, M. Leskäla, M. Ritala, T. Sajavaara, J. Keinonen, Chem. Vap.
Depos. 3 (2004) 143.[4] S. Zaitsu, S. Motokoshi, T. Jitsuno, M. Nakatsuka, T. Yamanaka, J. Appl. Phys. 41 (2002)
160.[5] K. Fröhlich, M. Ťapajna, A. Rosová, E. Dobročka, K. Hušeková, J. Aarik, A. Aidla,
Electrochem. Solid-State Lett. 11 (2008) G19.[6] S.K. Kim, K.-M. Kim, O.S. Kwon, S.W. Lee, C.B. Jeon, W.Y. Park, C.S. Hwang, J. Jeong,
Electrochem. Solid-State Lett. 8 (12) (2005) F59.[7] J. Aarik, B. Hudec, K. Hušekova, R. Rammula, A. Kasikov, T. Arroval, T. Uustare, K.
Fröhlich, Semicond. Sci. Technol. 27 (2012) 074007.[8] L. Bamoulid, M.-T. Maurette, D. De Caro, A. Guenbour, A. Ben Bachir, L. Aries, S.
El Hajjaji, F. Benoît-Marquié, F. Ansart, Surf. Coat. Technol. 202 (2008) 5020.[9] E. Marin, A. Lanzutti, M. Lekka, L. Guzman, W. Ensinger, L. Fedrizzi, Surf. Coat.
Technol. 211 (2011) 84.
107L. Aarik et al. / Thin Solid Films 542 (2013) 100–107
[10] C.X. Shan, X. Hou, K.-L. Choy, Surf. Coat. Technol. 202 (2008) 2399.[11] E.-L. Lakomaa, S. Haukka, T. Suntola, Appl. Surf. Sci. 60 (61) (1992) 742.[12] J. Aarik, A. Aidla, T. Uustare, V. Sammelselg, J. Cryst. Growth 148 (1995) 268.[13] R. Matero, A. Rahtu, M. Ritala, Chem. Mater. 13 (2001) 4506.[14] H. Kumagai, M. Matsumoto, K. Toyoda, M. Obara, M. Suzuki, Thin Solid Films 263
(1995) 47.[15] M. Ritala, M. Leskelä, L. Niinistö, P. Haussalo, Chem. Mater. 5 (1994) 556.[16] J. Aarik, A. Aidla, V. Sammelselg, T. Uustare, M. Ritala, M. Leskelä, Thin Solid Films
370 (2000) 163.[17] M. Ritala, M. Leskäla, E. Nykänen, P. Soinine, L. Niinistö, Thin Solid Films 225
(1993) 288.[18] J. Aarik, A. Aidla, T. Uustare, M. Ritala, M. Leskelä, Appl. Surf. Sci. 161 (2000) 385.[19] A. Rahtu, M. Ritala, Chem. Vap. Depos. 8 (2002) 21.[20] J. Aarik, A. Aidla, T. Uustare, K. Kukli, V. Sammelselg, M. Ritala, M. Leskelä, Appl.
Surf. Sci. 193 (2002) 277.[21] K. Kukli, M. Ritala, M. Schuisky, M. Leskelä, T. Sajavaara, J. Keinonen, T. Uustare, A.
Hårsta, Chem. Vap. Depos. 6 (2000) 303.[22] K. Kukli, A. Aidla, J. Aarik, M. Schuisky, A. Hårsta, M. Ritala, M. Leskelä, Langmuir
16 (2000) 8122.[23] R.L. Puurunen, Chem. Vap. Depos. 11 (2005) 79.[24] P.W. Peacock, J. Robertson, Appl. Phys. Lett. 83 (2003) 2025.[25] H.B. Park, M. Cho, J. Park, S.W. Lee, C.S. Hwang, J.-P. Kim, J.-H. Lee, N.-I. Lee, H.-K.
Kang, J.-C. Lee, S.-J. Oh, J. Appl. Phys. 94 (2003) 3641.[26] M. Schuisky, J. Aarik, K. Kukli, A. Aidla, A. Hårsta, Langmuir 17 (2001) 5508.[27] M. Linndbad, S. Haukka, A. Kytökivi, E.-L. Lakomaa, A.R. Autiainen, T. Suntola,
Appl. Surf. Sci. 121 (122) (1997) 286.[28] S.K. Kim, W.D. Kim, K.M. Kim, C.S. Hwang, J. Jeong, Appl. Phys. Lett. 85 (2004) 4112.[29] J.J. Park, W.J. Lee, G.H. Lee, I.S. Kim, B.C. Shin, S.G. Yoon, Integr. Ferroelectr. 68
(2004) 129.[30] A. Rahtu, K. Kukli, M. Ritala, Chem. Mater. 13 (2001) 817.[31] J. Aarik, A. Aidla, A.-A. Kiisler, T. Uustare, V. Sammelselg, Thin Solid Films 340
(1999) 110.
[32] J. Aarik, A. Aidla, H. Mändar, V. Sammelselg, J. Cryst. Growth 220 (2000) 531.[33] D.R.G. Mitchell, D.J. Attard, G. Triani, Thin Solid Films 441 (2003) 85.[34] R.L. Puurunen, T. Sajavaara, E. Santala, V. Miikkulainen, T. Saukkonen, M. Laitinen,
M. Leskelä, J. Nanosci. Nanotechnol. 11 (2011) 8101.[35] Y. Suyama, A. Kato, J. Am. Ceram. Soc. 59 (1976) 146.[36] R.H. West, G.J.O. Beran, W.H. Green, M. Kraft, J. Phys. Chem. A 111 (2007) 3560.[37] J. Aarik, A. Aidla, H. Mändar, T. Uustare, Appl. Surf. Sci. 172 (2001) 148.[38] K. Knapas, M. Ritala, Crit. Rev. Solid State Mater. Sci. (2013), http://dx.doi.org/
10.1080/10408436.2012.693460, (to be published).[39] M.Kh. Karapet'yants, M.L. Karapet'yans, Thermodynamic Constants of Inorganic and
Organic Compounds, Ann Arbor-Humprey Science Publishers, London, 1970. 461.[40] S.C. Shekar, K. Soni, R. Bunkar, M. Sharma, B. Singh, A. Nigam, T. Mahato, R.
Vijayaraghavan, Catal. Commun. 11 (2009) 77.[41] I. Barin, Thermochemical Data of Pure Substances, Part I, VCH Verlags Gesellschaft,
Weinheim, 1993.[42] W.D. Kim, G.W. Hwang, O.S. Kwon, S.K. Kim, M. Cho, D.S. Jeong, S.W. Lee, M.H.
Seo, C.S. Hwang, Y.-S. Min, Y.J. Cho, J. Electrochem. Soc. 152 (2005) C552.[43] J. Aarik, J. Karlis, H. Mändar, T. Uustare, V. Sammelselg, Appl. Surf. Sci. 181 (2001)
339.[44] J. Aarik, A. Aidla, A. Kikas, T. Käämbre, R. Rammula, P. Ritslaid, T. Uustare, V.
Sammelselg, Appl. Surf. Sci. 230 (2004) 292.[45] I. Jõgi, K. Kukli, J. Aarik, A. Aidla, J. Lu, Mater. Sci. Semicond. Process. 9 (2006)
1084.[46] D.R.G. Mitchell, A. Aidla, J. Aarik, Appl. Surf. Sci. 253 (2006) 606.[47] J. Aarik, A. Aidla, H. Mändar, T. Uustare, V. Sammelselg, Thin Solid Films 408
(2002) 97.[48] D.M. Hausmann, R.G. Gordon, J. Cryst. Growth 249 (2003) 251.[49] S. Haukka, E.-L. Lakomaa, A. Root, J. Phys. Chem. 97 (1993) 5085.[50] S. Kelly, F.H. Pollak, M. Tomkiewicz, J. Phys. Chem. B 101 (1997) 2730.[51] I.A. Alhomoudi, G. Newaz, Thin Solid Films 517 (2009) 4372.[52] J. Aarik, A. Aidla, H. Mändar, T. Uustare, M. Schuisky, A. Harsta, J. Cryst. Growth
242 (2002) 189.