Embed Size (px)
Citation preview
Atmospheric Teleconnections From the Equatorial Pacific
J. Bjerknes 1969
Jason P. CriscioGEOS 51325 Jan 2006

Questions
1. What are the fundamental components of Bjerknes' coupled ocean atmosphere system, and how do they explain tropical teleconnections?
2. What was Bjerknes’ mechanism for extratropical teleconnections?
3. What components of ENSO events could Bjerknes not explain?
Purposes
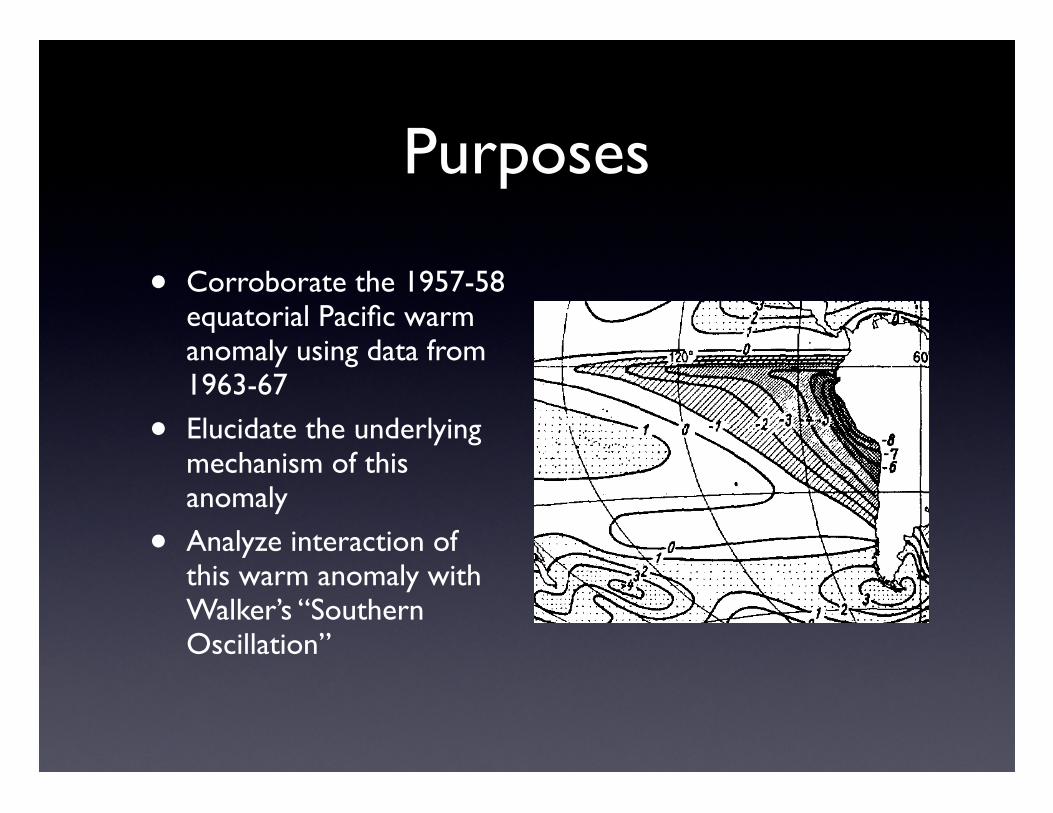
• Corroborate the 1957-58 equatorial Pacific warm anomaly using data from 1963-67
• Elucidate the underlying mechanism of this anomaly
• Analyze interaction of this warm anomaly with Walker’s “Southern Oscillation”
166 MONTHLY WEATHER REVIEW Vol. 97, No. 3
<..ll,",l , 11,,1,,,,.. , ,.., /I ,,,,,, lh.llllh ~ Ib," .KIIII, \,,, ,,,. +,",,,
FIGURE 7.-Sea-surface temperature represented as deviation from the average a t each latitude (from Dietrich and Kalle, 1957).
models. The scope of this article does not go that far,
but purports to describe some of the empirical facts that must be built into the models to make them resemble
nature.
In general, it is to be expected that longer time lags
will be found in the oceanic response to an atmospheric impulse than vice versa. One sign to that effect can prob-
ably be seen by a comparison of January 1.963 (fig. 2) and January 1965 (fig. 4). In both of those Januaries the Canton Island water temperature was at the lower end
of its range of variation, and also in both months the aridity prevailed. Nonetheless, January 1965 did not
exhibit quite as weak a Hadley circulation as in January 1963. The reason probably must have been that about 4 yr of cool equatorial waters had preceded January 1963 (from the end of 1959). The long uninterrupted up-
welling and spreading of the cold water at the surface must have made the tongue of cold water wider in Jan- uary 1963 than in January 1965 when the upwelling had only just begun to reestablish the cold tongue. If this explanation holds true i t is obvious that a regular mon-
itoring of the temperature of the tropical east Pacific is indispensable for long-range forecasting in Worth and
South America. We will see subsequently that such mon- itoring of the thermal state of the tropical east Pacific will have implications also for the understanding of climatic anomalies in the tropical countries bordering
the west Pacific.
3. BRIEF GEOGRAPHICAL SURVEY
OF THE EQUATORIAL COLD WATER
Figure 7 (Dietrich and Kalle, 1957) shows the geo- graphical extent of the equatorial cold water in a map
presentation of the quantity AT, = (Ts-Ts), where Ts is the sea-surface temperature and T, is its average
global value along the part of each latitude circle situated over the oceans. The value of T, is marked a t the right-
hand edge of the world map. For the Equator 'T, is 26.5"C or 79.7"F.
The Pacific equatorial cold water is by far the most extensive and the coldest of its kind. Delineated by the
zero line of AT,, it covers about 85" of longitude of the
Equator extending westward from the coast of South America. Defined the same way, the Atlantic equatorial cold water covers 40" of longitude extending westward
from the coast of Africa. The negative value a t AT,
there, however, ba.rely exceeds -l"C, whereas ATs at the coast of Equador is "3.5"C and along most of the coast of Peru exceeds -8°C. The corresponding coastal cold water off southwest Africa has an equally big negative AT, as that off Peru, but it does not extend with appreci-
ably negative AT, to the Equator. The Indian Ocean has
no equatorial cold water, as such, but due to the alternate monsoons from north and south along the east African coast, AT, is there a degree or two lower than at the coast
of Sumatra.
Data
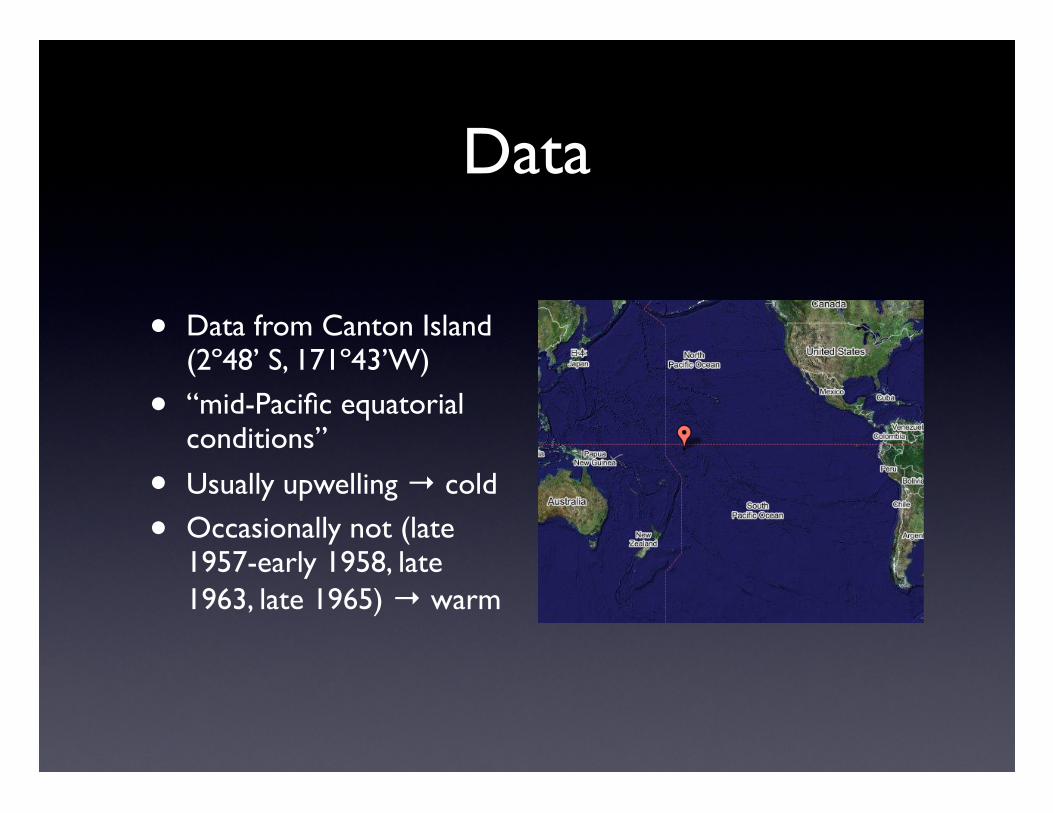
• Data from Canton Island (2º48’ S, 171º43’W)
• “mid-Pacific equatorial conditions”
• Usually upwelling ! cold
• Occasionally not (late 1957-early 1958, late 1963, late 1965) ! warm
164 MONTHLY WEATHER REVIEW
CANTON ISLAND 2"48'S 17l043'W
I 1950 I 1951 I 1952 I 1953 I 1954 I 1955 IC,
- 289"
200-
100 loo-
0 0
1956 1957 1958 I 1959 1960 1961 C
400
mm - 400
1962 1963 I 1964 1965 I 1966 1967 F 86'
I 30*
400 400
300 300
200 zoo
100 100
0 0
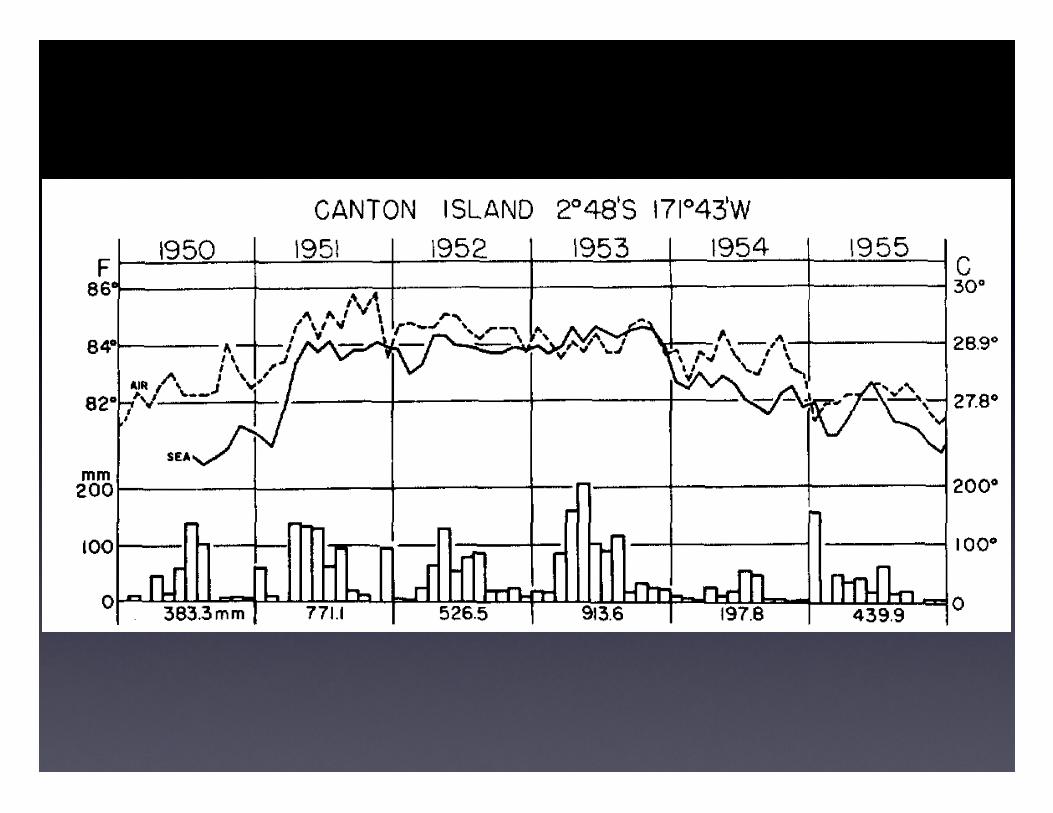
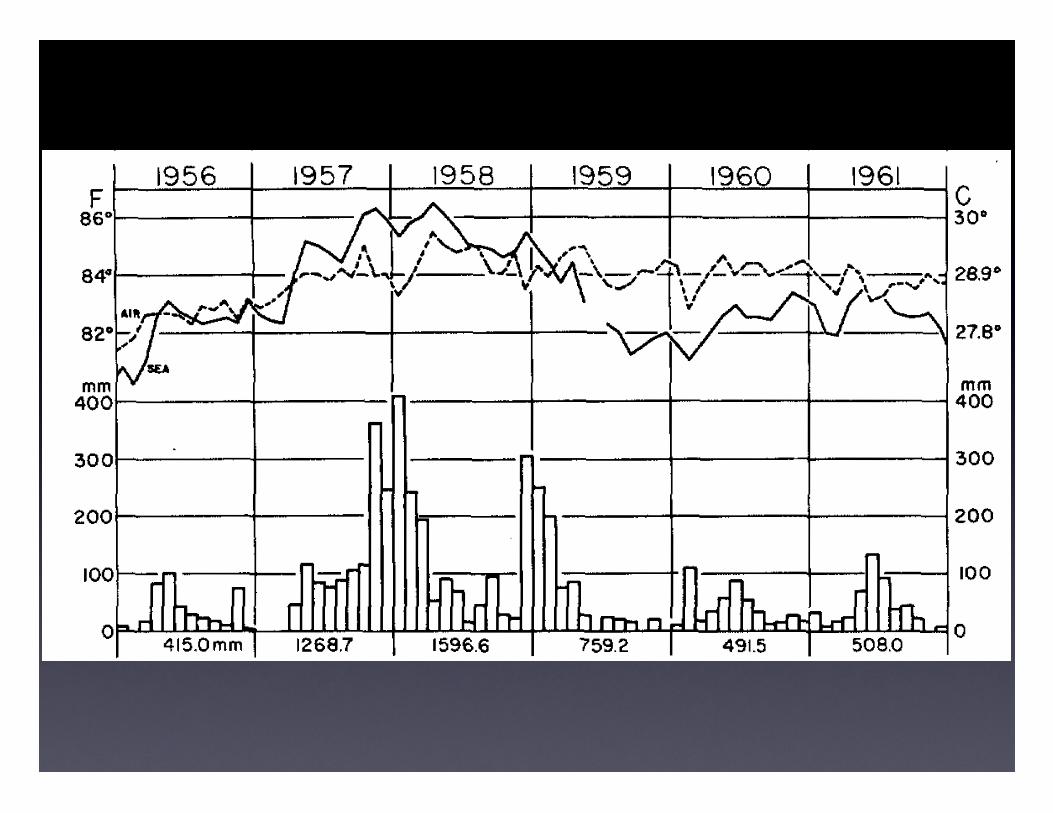
FIGURE 1.-Time series of monthly air and sea temperatures and of monthly precipitation a t Canton Island from 1950 to 1967.
season). All the big rainfall maxima a t Canton Island in figure 1 occur at the same season.
It is likely that the strong interannual variability of
rainfall shown by Canton Island applies to a rather large equatorial area of the central Pacific. Within that area,
accordingly, the supply of released heat of condensation may vary interannually to such an extent that a visible response of the Hadley circulation should result. To test this idea the large-scale surface pressure field, averaged for each of five successive Januaries, over the Pacific and
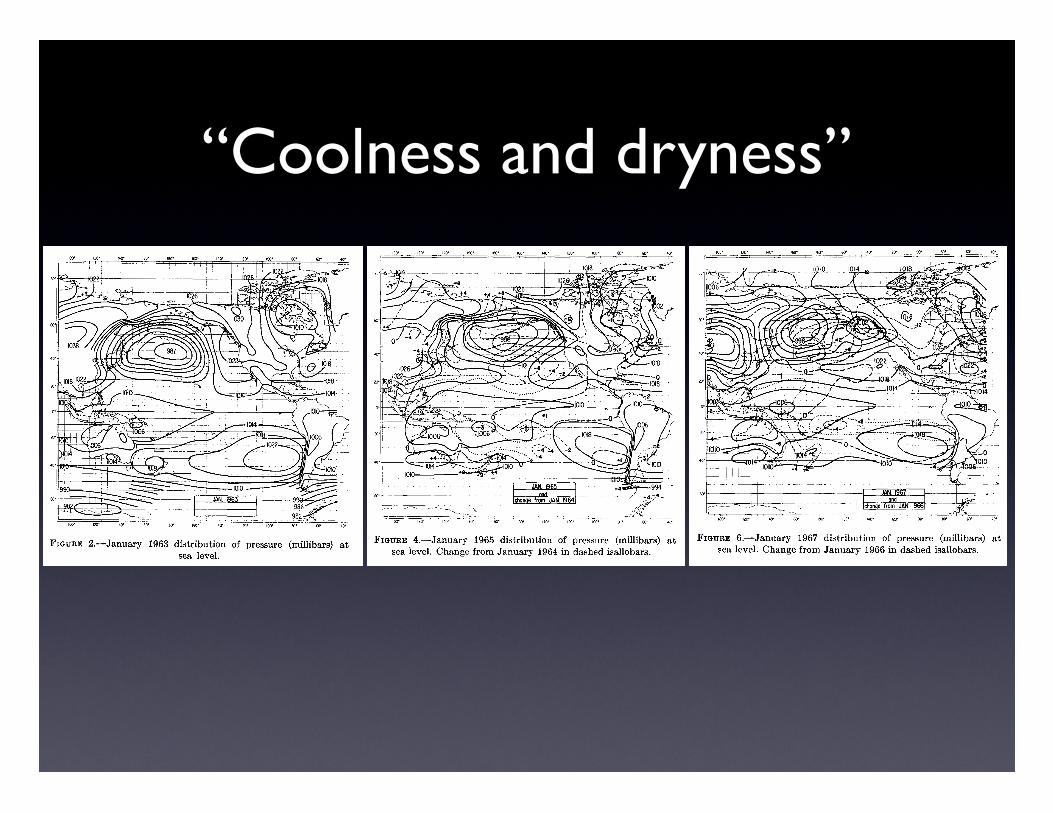
adjacent continents is presented in figures 2-6. The selection of the January maps of 1963, 1964, 1965,
1966, and 1967 brings into focus the anomalies. of the large-scale flow that evolved together with the extreme coolness and dryness of the central Pacific equa.toria1 belt
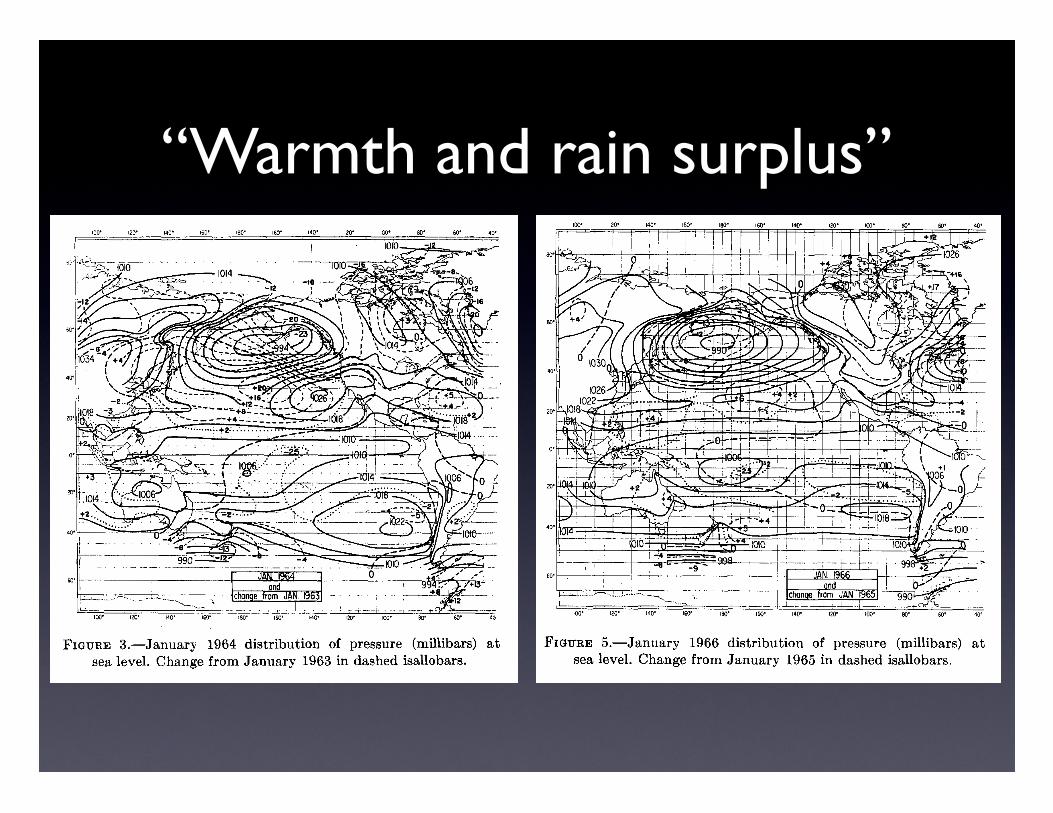
in January 1963, 1965, and 1967 and the extreme warmth and rain surplus of the same belt in January 1964 and 1966.
\. L-
IW' 120' two' 160' $ w tw. taw 88. 80. m. $0
__I_ .I -~ . ! --."--I. . .. ., "" *ria..-"
FIGURE 3.-January 1964 distribution of pressure (millibars) a t
sea level. Change from January 1963 in dashed isallobars.
~ .. -. . . .
Concentrating first on the pressure change from map
to map a t the Equator, we find on alternate maps a fall in the eastern and a rise in the western Pacific and vice
versa. The zero isallobar intersects the Equator at 175OE
in figure 3, 17OOW in figure 4, 168'E in figure 5, and 178'E in figure 6, in other words a little west of the dateline on 'the average. At that longitude the maxi-mum westward pressure gradient along the Equator and presumably also
the maximum equatorial easterlies were observed in January 1963, 1965, and 1967. These were then also the
164 MONTHLY WEATHER REVIEW
CANTON ISLAND 2"48'S 17l043'W
I 1950 I 1951 I 1952 I 1953 I 1954 I 1955 IC,
- 289"
200-
100 loo-
0 0
1956 1957 1958 I 1959 1960 1961 C
400
mm - 400
1962 1963 I 1964 1965 I 1966 1967 F 86'
I 30*
400 400
300 300
200 zoo
100 100
0 0
FIGURE 1.-Time series of monthly air and sea temperatures and of monthly precipitation a t Canton Island from 1950 to 1967.
season). All the big rainfall maxima a t Canton Island in figure 1 occur at the same season.
It is likely that the strong interannual variability of
rainfall shown by Canton Island applies to a rather large equatorial area of the central Pacific. Within that area,
accordingly, the supply of released heat of condensation may vary interannually to such an extent that a visible response of the Hadley circulation should result. To test this idea the large-scale surface pressure field, averaged for each of five successive Januaries, over the Pacific and
adjacent continents is presented in figures 2-6. The selection of the January maps of 1963, 1964, 1965,
1966, and 1967 brings into focus the anomalies. of the large-scale flow that evolved together with the extreme coolness and dryness of the central Pacific equa.toria1 belt
in January 1963, 1965, and 1967 and the extreme warmth and rain surplus of the same belt in January 1964 and 1966.
\. L-
IW' 120' two' 160' $ w tw. taw 88. 80. m. $0
__I_ .I -~ . ! --."--I. . .. ., "" *ria..-"
FIGURE 3.-January 1964 distribution of pressure (millibars) a t
sea level. Change from January 1963 in dashed isallobars.
~ .. -. . . .
Concentrating first on the pressure change from map
to map a t the Equator, we find on alternate maps a fall in the eastern and a rise in the western Pacific and vice
versa. The zero isallobar intersects the Equator at 175OE
in figure 3, 17OOW in figure 4, 168'E in figure 5, and 178'E in figure 6, in other words a little west of the dateline on 'the average. At that longitude the maxi-mum westward pressure gradient along the Equator and presumably also
the maximum equatorial easterlies were observed in January 1963, 1965, and 1967. These were then also the
Theory
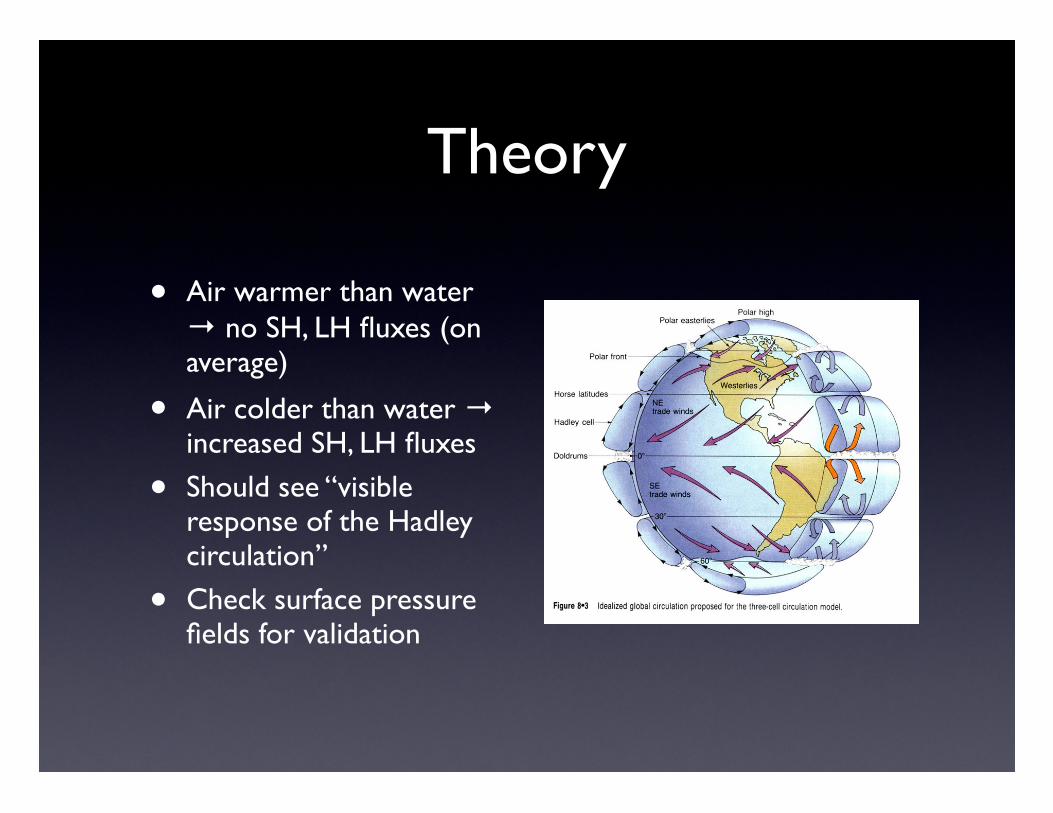
• Air warmer than water ! no SH, LH fluxes (on average)
• Air colder than water ! increased SH, LH fluxes
• Should see “visible response of the Hadley circulation”
• Check surface pressure fields for validation
164 MONTHLY WEATHER REVIEW
CANTON ISLAND 2"48'S 17l043'W
I 1950 I 1951 I 1952 I 1953 I 1954 I 1955 IC,
- 289"
200-
100 loo-
0 0
1956 1957 1958 I 1959 1960 1961 C
400
mm - 400
1962 1963 I 1964 1965 I 1966 1967 F 86'
I 30*
400 400
300 300
200 zoo
100 100
0 0
FIGURE 1.-Time series of monthly air and sea temperatures and of monthly precipitation a t Canton Island from 1950 to 1967.
season). All the big rainfall maxima a t Canton Island in figure 1 occur at the same season.
It is likely that the strong interannual variability of
rainfall shown by Canton Island applies to a rather large equatorial area of the central Pacific. Within that area,
accordingly, the supply of released heat of condensation may vary interannually to such an extent that a visible response of the Hadley circulation should result. To test this idea the large-scale surface pressure field, averaged for each of five successive Januaries, over the Pacific and
adjacent continents is presented in figures 2-6. The selection of the January maps of 1963, 1964, 1965,
1966, and 1967 brings into focus the anomalies. of the large-scale flow that evolved together with the extreme coolness and dryness of the central Pacific equa.toria1 belt
in January 1963, 1965, and 1967 and the extreme warmth and rain surplus of the same belt in January 1964 and 1966.
\. L-
IW' 120' two' 160' $ w tw. taw 88. 80. m. $0
__I_ .I -~ . ! --."--I. . .. ., "" *ria..-"
FIGURE 3.-January 1964 distribution of pressure (millibars) a t
sea level. Change from January 1963 in dashed isallobars.
~ .. -. . . .
Concentrating first on the pressure change from map
to map a t the Equator, we find on alternate maps a fall in the eastern and a rise in the western Pacific and vice
versa. The zero isallobar intersects the Equator at 175OE
in figure 3, 17OOW in figure 4, 168'E in figure 5, and 178'E in figure 6, in other words a little west of the dateline on 'the average. At that longitude the maxi-mum westward pressure gradient along the Equator and presumably also
the maximum equatorial easterlies were observed in January 1963, 1965, and 1967. These were then also the
March 1969 J. Bjerknes 165
FIGURE 4.-January 1965 distribution of pressure (millibars) at FIGURE 6.-January 1967 distribution of pressure (millibars) at sea level. Change from January 1964 in dashed isallobars. sea level. Change from January 1966 in dashed isallobars.
The pressure gradients maintaining the northeast trade winds had their maximum strength in the Januaries 1964
and 1966 when the equatorial water was at its warmest. We may conclude from this that the strength of the winter-
time Hadley circulation is decided by the heat input from the equatorial ocean. This corroborates the findings in
ocean warming during the 1957-58 El Nifio.
The Januaries 1964 and 1966 also excelled over those in 1963, 1965, and 1967 in the strength of the westerlies in the central and eastern North Pacific. This also must
be related to the show of strength of the Hadley circula-
- tropical jet stream from which westerly angular momen- tum is supplied to middle latitudes by the large-scale meridional eddy flux. It is the convergence of that angular momentum flux over middle latitudes that makes it possible for the atmosphere to maintain the prevailing
iW. ,lO. ,6c ,BO. ,M. ,40' ,hy ,Oo. 81. 60. 10. surface westerlies, as it evidently did efficiently in January 1964 and 1966 and less efficiently in the Januaries of
Blocking of the surface westerlies, of course, occurred
60'
40. the study of the meteorological effects of the equatorial
20' tion: a strong Hadley circulation maintains a strong sub-
FIQURE 5.-January 1966 distribution of pressure (millibars) a t 1963, 1965, and 1967. sea level. Change from January 1965 in dashed isallobars.
cold Januaries over the whole mid-Pacific part of the equatorial belt.
The two warm Januaries, 1964 and 1966, differed from the cold ones by the presence of low-pressure systems in the latitude belt of 10' to 15's. These Lows eliminated the geostrophic easterlies south of the Equator over a span of longitude straddling the dateline. The lack of upwelling and resultant high water temperatures at Canton Island in those two Januaries are therefore easy to understand.
- preferentially during the three low index Januaries, most
definitely so in January 1963 when the monthly averaged
map shows no pressure gradient for westerlies over the ocean east of 145"W.
The time lag of the large-scale atmospheric response to the initial anomaly of heat input from the equatorial ocean appears to be quite small and would have to be
identified by daily instead of monthly basic data. Very desirable for checking purposes is, of course, also the eventual numerical simulat,ion of the described ocean-
atmosphere interaction by sufficiently realistic dynamic
“Coolness and dryness”
“Warmth and rain surplus”
164 MONTHLY WEATHER REVIEW
CANTON ISLAND 2"48'S 17l043'W
I 1950 I 1951 I 1952 I 1953 I 1954 I 1955 IC,
- 289"
200-
100 loo-
0 0
1956 1957 1958 I 1959 1960 1961 C
400
mm - 400
1962 1963 I 1964 1965 I 1966 1967 F 86'
I 30*
400 400
300 300
200 zoo
100 100
0 0
FIGURE 1.-Time series of monthly air and sea temperatures and of monthly precipitation a t Canton Island from 1950 to 1967.
season). All the big rainfall maxima a t Canton Island in figure 1 occur at the same season.
It is likely that the strong interannual variability of
rainfall shown by Canton Island applies to a rather large equatorial area of the central Pacific. Within that area,
accordingly, the supply of released heat of condensation may vary interannually to such an extent that a visible response of the Hadley circulation should result. To test this idea the large-scale surface pressure field, averaged for each of five successive Januaries, over the Pacific and
adjacent continents is presented in figures 2-6. The selection of the January maps of 1963, 1964, 1965,
1966, and 1967 brings into focus the anomalies. of the large-scale flow that evolved together with the extreme coolness and dryness of the central Pacific equa.toria1 belt
in January 1963, 1965, and 1967 and the extreme warmth and rain surplus of the same belt in January 1964 and 1966.
\. L-
IW' 120' two' 160' $ w tw. taw 88. 80. m. $0
__I_ .I -~ . ! --."--I. . .. ., "" *ria..-"
FIGURE 3.-January 1964 distribution of pressure (millibars) a t
sea level. Change from January 1963 in dashed isallobars.
~ .. -. . . .
Concentrating first on the pressure change from map
to map a t the Equator, we find on alternate maps a fall in the eastern and a rise in the western Pacific and vice
versa. The zero isallobar intersects the Equator at 175OE
in figure 3, 17OOW in figure 4, 168'E in figure 5, and 178'E in figure 6, in other words a little west of the dateline on 'the average. At that longitude the maxi-mum westward pressure gradient along the Equator and presumably also
the maximum equatorial easterlies were observed in January 1963, 1965, and 1967. These were then also the
March 1969 J. Bjerknes 165
FIGURE 4.-January 1965 distribution of pressure (millibars) at FIGURE 6.-January 1967 distribution of pressure (millibars) at sea level. Change from January 1964 in dashed isallobars. sea level. Change from January 1966 in dashed isallobars.
The pressure gradients maintaining the northeast trade winds had their maximum strength in the Januaries 1964
and 1966 when the equatorial water was at its warmest. We may conclude from this that the strength of the winter-
time Hadley circulation is decided by the heat input from the equatorial ocean. This corroborates the findings in
ocean warming during the 1957-58 El Nifio.
The Januaries 1964 and 1966 also excelled over those in 1963, 1965, and 1967 in the strength of the westerlies in the central and eastern North Pacific. This also must
be related to the show of strength of the Hadley circula-
- tropical jet stream from which westerly angular momen- tum is supplied to middle latitudes by the large-scale meridional eddy flux. It is the convergence of that angular momentum flux over middle latitudes that makes it possible for the atmosphere to maintain the prevailing
iW. ,lO. ,6c ,BO. ,M. ,40' ,hy ,Oo. 81. 60. 10. surface westerlies, as it evidently did efficiently in January 1964 and 1966 and less efficiently in the Januaries of
Blocking of the surface westerlies, of course, occurred
60'
40. the study of the meteorological effects of the equatorial
20' tion: a strong Hadley circulation maintains a strong sub-
FIQURE 5.-January 1966 distribution of pressure (millibars) a t 1963, 1965, and 1967. sea level. Change from January 1965 in dashed isallobars.
cold Januaries over the whole mid-Pacific part of the equatorial belt.
The two warm Januaries, 1964 and 1966, differed from the cold ones by the presence of low-pressure systems in the latitude belt of 10' to 15's. These Lows eliminated the geostrophic easterlies south of the Equator over a span of longitude straddling the dateline. The lack of upwelling and resultant high water temperatures at Canton Island in those two Januaries are therefore easy to understand.
- preferentially during the three low index Januaries, most
definitely so in January 1963 when the monthly averaged
map shows no pressure gradient for westerlies over the ocean east of 145"W.
The time lag of the large-scale atmospheric response to the initial anomaly of heat input from the equatorial ocean appears to be quite small and would have to be
identified by daily instead of monthly basic data. Very desirable for checking purposes is, of course, also the eventual numerical simulat,ion of the described ocean-
atmosphere interaction by sufficiently realistic dynamic
Surface Pressure Analysis
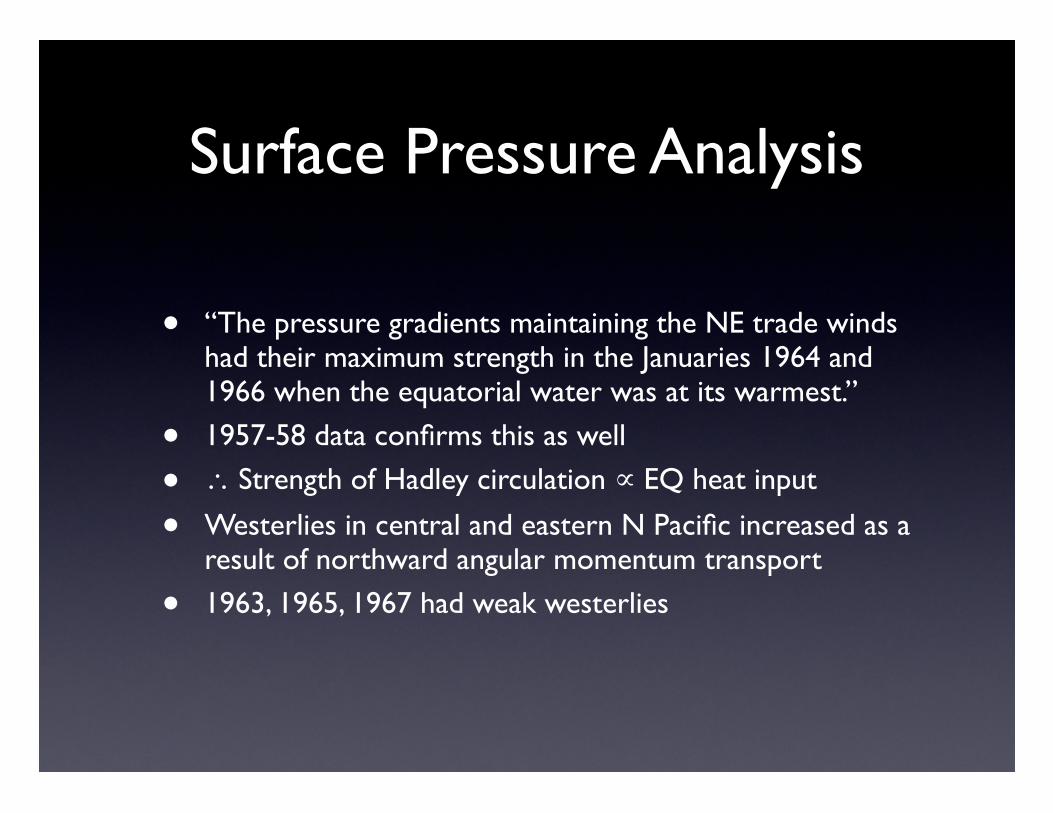
• “The pressure gradients maintaining the NE trade winds had their maximum strength in the Januaries 1964 and 1966 when the equatorial water was at its warmest.”
• 1957-58 data confirms this as well
• ! Strength of Hadley circulation " EQ heat input
• Westerlies in central and eastern N Pacific increased as a result of northward angular momentum transport
• 1963, 1965, 1967 had weak westerlies

Equatorial Cold Water166 MONTHLY WEATHER REVIEW Vol. 97, No. 3
<..ll,",l , 11,,1,,,,.. , ,.., /I ,,,,,, lh.llllh ~ Ib," .KIIII, \,,, ,,,. +,",,,
FIGURE 7.-Sea-surface temperature represented as deviation from the average a t each latitude (from Dietrich and Kalle, 1957).
models. The scope of this article does not go that far,
but purports to describe some of the empirical facts that must be built into the models to make them resemble
nature.
In general, it is to be expected that longer time lags
will be found in the oceanic response to an atmospheric impulse than vice versa. One sign to that effect can prob-
ably be seen by a comparison of January 1.963 (fig. 2) and January 1965 (fig. 4). In both of those Januaries the Canton Island water temperature was at the lower end
of its range of variation, and also in both months the aridity prevailed. Nonetheless, January 1965 did not
exhibit quite as weak a Hadley circulation as in January 1963. The reason probably must have been that about 4 yr of cool equatorial waters had preceded January 1963 (from the end of 1959). The long uninterrupted up-
welling and spreading of the cold water at the surface must have made the tongue of cold water wider in Jan- uary 1963 than in January 1965 when the upwelling had only just begun to reestablish the cold tongue. If this explanation holds true i t is obvious that a regular mon-
itoring of the temperature of the tropical east Pacific is indispensable for long-range forecasting in Worth and
South America. We will see subsequently that such mon- itoring of the thermal state of the tropical east Pacific will have implications also for the understanding of climatic anomalies in the tropical countries bordering
the west Pacific.
3. BRIEF GEOGRAPHICAL SURVEY
OF THE EQUATORIAL COLD WATER
Figure 7 (Dietrich and Kalle, 1957) shows the geo- graphical extent of the equatorial cold water in a map
presentation of the quantity AT, = (Ts-Ts), where Ts is the sea-surface temperature and T, is its average
global value along the part of each latitude circle situated over the oceans. The value of T, is marked a t the right-
hand edge of the world map. For the Equator 'T, is 26.5"C or 79.7"F.
The Pacific equatorial cold water is by far the most extensive and the coldest of its kind. Delineated by the
zero line of AT,, it covers about 85" of longitude of the
Equator extending westward from the coast of South America. Defined the same way, the Atlantic equatorial cold water covers 40" of longitude extending westward
from the coast of Africa. The negative value a t AT,
there, however, ba.rely exceeds -l"C, whereas ATs at the coast of Equador is "3.5"C and along most of the coast of Peru exceeds -8°C. The corresponding coastal cold water off southwest Africa has an equally big negative AT, as that off Peru, but it does not extend with appreci-
ably negative AT, to the Equator. The Indian Ocean has
no equatorial cold water, as such, but due to the alternate monsoons from north and south along the east African coast, AT, is there a degree or two lower than at the coast
of Sumatra.
!TS = TS - <TS>

Walker Circulation
• “When the cold water belt along the EQ is well developed, the air above it will be too cold and heavy to join the ascending motion in the Hadley circulation.”
• Flows west, heats up over warm ocean, rises
• Air flows down the pressure gradient both aloft and at the surface
March 1969 J. Bjerknes 167
IO0
MB
I50
300
200
500
700
S.L.
0" 20"E 40 60 80 100 120 1 4 0 1 6 0 9 180 16N 140 120 100 80 60 40 2OW 0'
FIGURE 8.-Profile of height (dynamic meter) of standard isobaric
surfaces along the Equator in January and July, based on data
from Heastie and Stephenson (1960). "Walker Circulation" over
the Pacific entered as suggested in the present article. The narrow maximum a t 180" in January and the big maximum a t 80"E in July are possibly spurious features.
All these geographical anomalies of equatorial water temperatures have their meteorological side effects. As
far as the Pacific is concerned the equatorial cold air is
unique in its large areal coverage. It also exhibits the greatest negative air temperature anoma.ly for an equa-
torial location, namely in the region of the Galapagos Islands. Contributing to the anomalously low equatorial air temperatures in that region is also the water and air advection from the southeast in the zone of upwelling along the coast of South America. The continued cold water advection westward from the Galapagos Islands is
also important, but the quantitative assessment of that cooling factor has had to be lowered considerably after
the discovery of the Equatorial Countercurrent ~1 mere 50 m on the average under the ocean surface.
4. THE "WALKER CIRCULATION"
When the cold water belt along the Equator is well
developed, the air above it will be too cold and heavy to join the ascending motion in the Hadley circulations.
Instead, the equatorial air flows westward between the
Hadley circulations of the two hemispheres to the warm
west Pacific. There, after having been heated and supplied
by moisture from the warm waters, the equatorial air can
take part in large-scale, moist-adiabatic ascent. The dynamic conditions governing that kind of motion can
be analyzed in the schematic figure 8, which presents a vertical profile of the pressure field along the Equator.
In the Pacific part of that round-the-world profile, the horizontal pressure gradient is directed westward along
the ocean surface (except 1oca.lly near the South American
coast) and eastward in the upper troposphere. If the equatorial air were enclosed between zonal vertical walls,
a simple circulation as shown by the schematic streamlines
in figure 8 would develop. The moist-adiabatically ascend- ing motion in the west would be adjusted so as to occupy
less space than the descending motion in the east, whereby a steady-state field of temperature can be maintained (the
warming by descent - -w(yd"y) being compensated by the net radiative heat loss).
Without the zonal walls, this equatorial circulation does enter into exchange of absolute angular momentum
with adjacent parts of the atmosphere to the north and
the south; and, since the equatorial belt of the atmos- phere is always endowed with a greater absolute angular
momentum than adjacent zonal belts, a divergence of
absolute angular momentum must result at the Equator. Under steady-state conditions this loss of absolute angular
momentum in the equatorial atmosphere is compensated
by the frictional torque about the axis of the earth at the
interface of atmosphere and ocean.
The resultant streamline picture of the zonal wind
components in the equatorial vertical profile will be the vectorial sum of the thermally driven circulation in figure
8 plus a field of easterly wind components whose strength depends on the intensity of the divergence of the merid-
ional and vertical fluxes of absolute angular momentum.
Wind measurements have identified the upper tropo-
spheric equatorial westerlies over the Pacific. Sadler (1959)
states: "The upper tropospheric flow reverses near 150'E where the west components increase toward the east and
the east components toward the west. The reversal region
is a semipermanent feature with a seasonal and annual longitudinal variation . . . Recent data show that the west flow continues to increase to beyond 160"w. The easterlies increase to beyond Singapore where they are a
persistent feature averaging greater than 90-perc.ent
steadiness for most of the year." The span of longitude occupied by upper tropospheric westerlies thus may extend
from 150°E, which is over the warmest part of the equa- torial Pacific (see fig. 7) to well beyond 16Oow, in other words to the cold part of the equatorial Pacific. It seems
reasonable to assume that it is the gradient of sea tempera- ture along the Equator which is the muse of the thermal
circ.ulation entered in figure 8. Hereafter, in th.e present art,icle that circulation will be referred to as the "Walker

Walker Circulation

Walker Circulation168 MONTHLY WEATHER REVIEW Vol. 97, No. 3
Circulation" since it can be shown to be an important part, of the mechanism of Walker's "Southern Oscillation."
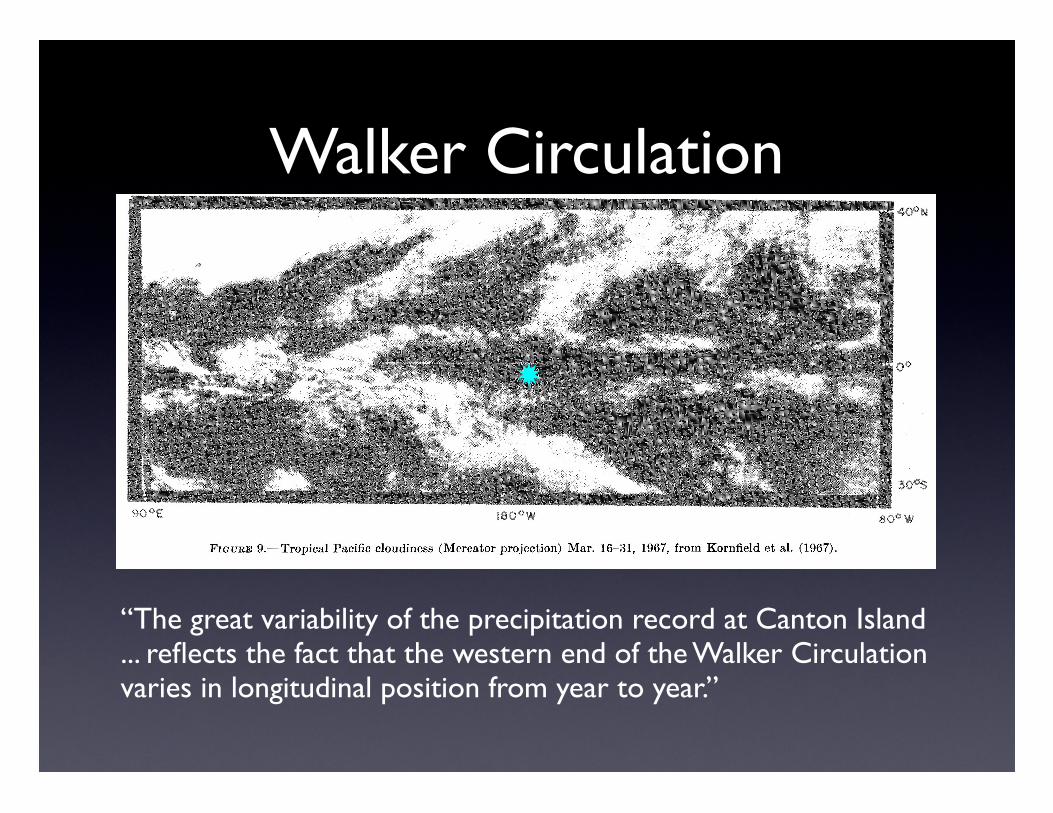
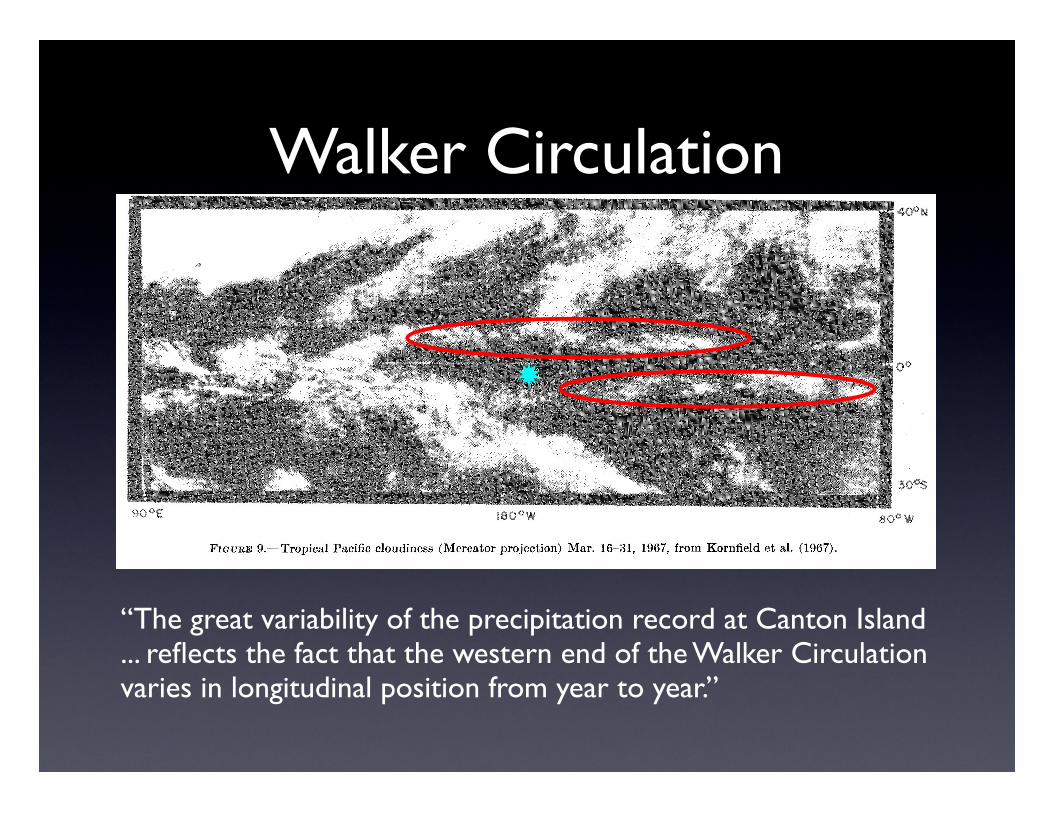
The great variability of the precipitation record at
Canton Island in figure 1 reflects the fact that the western end of the Walker Circulation varies in longitudinal position from year to year. When the equatorial cold water and the arid regime reach Canton Island, that is a sign that the axis of the Walker Circulation is west of
172"W, so that subsiding air prevails over the island. When the Walker Circulation axis is located east of 172"W, Canton Island is under the rising air column with frequent rain from midtropospheric cloud as well as from convective cloud favored by the positive sea-minus-air temperature difference.
Figure 9 is a composite cloudiness picture of the tropical Pacific from ESSA 3 and 5 obtained by superposition of
daily pictures during the equinoctial period Mar. 16-31, 1967 (Kornfield et al., 1967). As can be seen from figure 1,
the period was characterized by cold water and a relatively arid climate at Canton Island, 172"W. The axis of the Walker Circulation must have been located approximately a t 160"E where the equatorial easterlies begin to show cloud after having been rather cloudless all the way from the coast of South America, at 80"W. The sinking air in the Walker Circulation thus in this case seems to occupy about 120" of longitude and the rising air some 20" to 30"
of longitude. The arid zone is flanked to the north and sauth by almost
straight, narrow cloud bands at the equatorward edges of
the Hadley circulations of the Northern and Southern Hemispheres.
Satellite cloud pictures from the met-warm periods in figure 1 show the transition from cloudy to much less cloudiness at the Equator well east of the Canton Island
longitude, for instance near 160"w in January 1964 During the longer lasting wet-warm period in 1957-58 there was evidence of warm water at the Equator as far
east as 145"w (Austin, 1960), and the South American coast had then one of its major El Niao occurrences, perhaps indicating that there was warm water all along the Pacific Equator. Under those extreme conditions the water temperature gradient along the Equator must have vanished temporarily. The Walker Circulation, which derives its propulsion from the longitudinal temperature contrast, also seems to have stopped, because westerly surface winds were occasionally observed a t 145"W on the
Equator in November 1957 (Aus'bin, 1960).
A more permanent display of westerly surface winds a t the Equator is known over the Indian Ocean as first described by Fletcher (1945) and amply verified by the International Indian Ocean Project in 1963-64. The dynamical justification for these equatorial westerlies could be sought in the fact that the surface temperatures of the equatorial belt of the Indian Ocean are a little lower at the African coast than at the coast of Sumatra. A weak thermally driven air circulation along the Equator with sinking air off Africa and rising air over Indonesia is
therefore a possibility.
The eqlmtorial Atlantic is analogous to the equatorial Pacific in that the warmest part is in the west, a t the
coast of Brazil, but the west-east contrast of water tem- perature is much smaller than in the Pacific. However, satellite pictures indicate that, in the season of greatest rainfall (Janllary) in interior equatorial Brazil, a thermally driven eqnatorial circulation is operating from the Gulf of
Guinea to the Andes. The axis o f that circulation is near
the mouth of the Amazon, leaving the dry northeast
“The great variability of the precipitation record at Canton Island ... reflects the fact that the western end of the Walker Circulation varies in longitudinal position from year to year.”
Walker Circulation168 MONTHLY WEATHER REVIEW Vol. 97, No. 3
Circulation" since it can be shown to be an important part, of the mechanism of Walker's "Southern Oscillation."
The great variability of the precipitation record at
Canton Island in figure 1 reflects the fact that the western end of the Walker Circulation varies in longitudinal position from year to year. When the equatorial cold water and the arid regime reach Canton Island, that is a sign that the axis of the Walker Circulation is west of
172"W, so that subsiding air prevails over the island. When the Walker Circulation axis is located east of 172"W, Canton Island is under the rising air column with frequent rain from midtropospheric cloud as well as from convective cloud favored by the positive sea-minus-air temperature difference.
Figure 9 is a composite cloudiness picture of the tropical Pacific from ESSA 3 and 5 obtained by superposition of
daily pictures during the equinoctial period Mar. 16-31, 1967 (Kornfield et al., 1967). As can be seen from figure 1,
the period was characterized by cold water and a relatively arid climate at Canton Island, 172"W. The axis of the Walker Circulation must have been located approximately a t 160"E where the equatorial easterlies begin to show cloud after having been rather cloudless all the way from the coast of South America, at 80"W. The sinking air in the Walker Circulation thus in this case seems to occupy about 120" of longitude and the rising air some 20" to 30"
of longitude. The arid zone is flanked to the north and sauth by almost
straight, narrow cloud bands at the equatorward edges of
the Hadley circulations of the Northern and Southern Hemispheres.
Satellite cloud pictures from the met-warm periods in figure 1 show the transition from cloudy to much less cloudiness at the Equator well east of the Canton Island
longitude, for instance near 160"w in January 1964 During the longer lasting wet-warm period in 1957-58 there was evidence of warm water at the Equator as far
east as 145"w (Austin, 1960), and the South American coast had then one of its major El Niao occurrences, perhaps indicating that there was warm water all along the Pacific Equator. Under those extreme conditions the water temperature gradient along the Equator must have vanished temporarily. The Walker Circulation, which derives its propulsion from the longitudinal temperature contrast, also seems to have stopped, because westerly surface winds were occasionally observed a t 145"W on the
Equator in November 1957 (Aus'bin, 1960).
A more permanent display of westerly surface winds a t the Equator is known over the Indian Ocean as first described by Fletcher (1945) and amply verified by the International Indian Ocean Project in 1963-64. The dynamical justification for these equatorial westerlies could be sought in the fact that the surface temperatures of the equatorial belt of the Indian Ocean are a little lower at the African coast than at the coast of Sumatra. A weak thermally driven air circulation along the Equator with sinking air off Africa and rising air over Indonesia is
therefore a possibility.
The eqlmtorial Atlantic is analogous to the equatorial Pacific in that the warmest part is in the west, a t the
coast of Brazil, but the west-east contrast of water tem- perature is much smaller than in the Pacific. However, satellite pictures indicate that, in the season of greatest rainfall (Janllary) in interior equatorial Brazil, a thermally driven eqnatorial circulation is operating from the Gulf of
Guinea to the Andes. The axis o f that circulation is near
the mouth of the Amazon, leaving the dry northeast
“The great variability of the precipitation record at Canton Island ... reflects the fact that the western end of the Walker Circulation varies in longitudinal position from year to year.”
Southern Oscillation
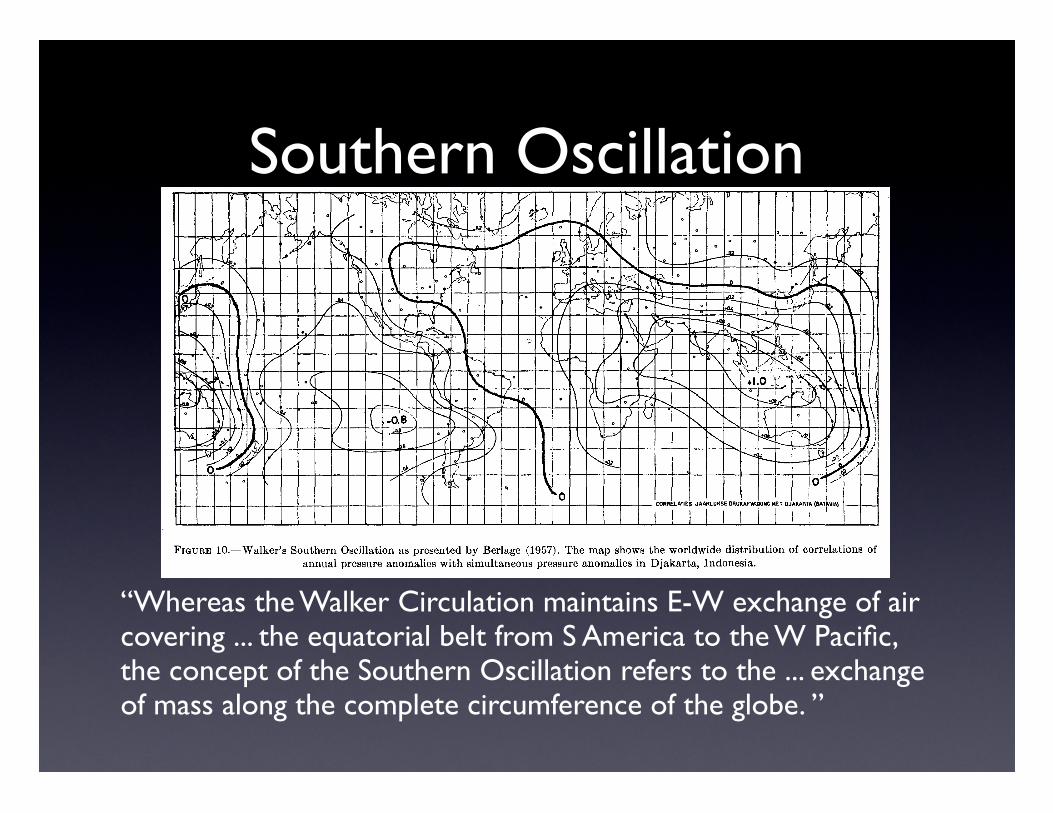
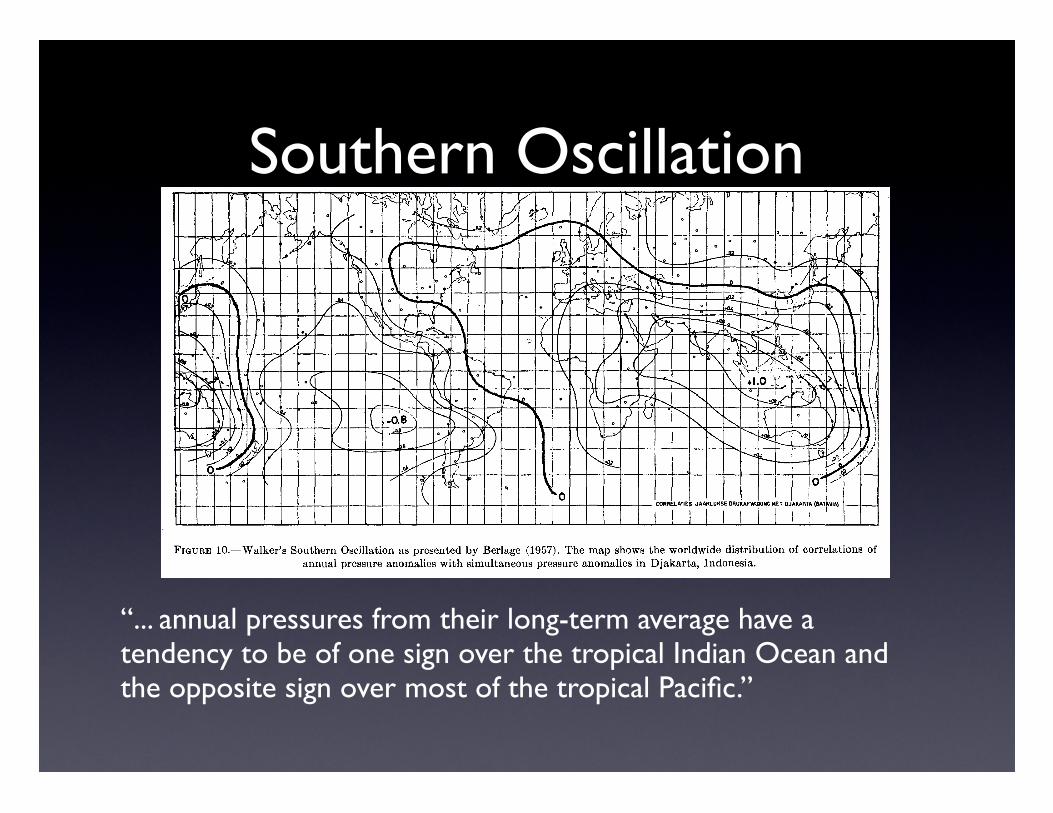
“Whereas the Walker Circulation maintains E-W exchange of air covering ... the equatorial belt from S America to the W Pacific, the concept of the Southern Oscillation refers to the ... exchange of mass along the complete circumference of the globe. ”
March 1969 J. Bjerknes 169
FIGURE 10.-Walker's Southern Oscillation as presented by Berlage (1957). The map shows the worldwide distribution of correlations of annual pressure anomalies with simultaneous pressure anomalies in Djakarta, Indonesia.
corner of Brazil (province of Ceara) and the equatorial
Atlantic under sinking air.
Further discussion of the relatively weak thermal circulations along the Equator in the Atlantic and the
Indian Ocean is beyond the scope of this article. In what
follows, we endeavor to trace the tropical teleconnec- tions emanating from the equatorial Pacific.
5. WALKER'S "SOUTHERN OSCILLATION"
The Walker Circulation described in section 4 must be part of the mechanism of the st,ill larger "Southern
Oscillation" statistically defined by Sir Gilbert Walker
(1923, 1924, 1928, 1937) and Walker and Bliss (1930, 1932) in the World Weather I to VI sequence of research reports. Whereas the Walker Circulation maintains east-west exchange of air covering a little over an earth quadrant
of the equatorial belt from South America to the west
Pacific, the concept of the Southern Oscillation refers to the barometrically recorded exc.hange of mass along the
complete circumference of the globe in tropical latitudes. What distinguishes the Walker Circulation from other t'ropical east-west exchanges of air is that it operates a
large tapping of potential energy by combining the large- scale r i se of warm-moist and descent' of colder dry air. The fluctuations in the running of the Walker Circulat,ion
are therefore likely to initiate some of the major pulses
of the Southern Oscillation. The Southern Oscillation, as mapped in modernized
form by Berlage (1957)) is reproduced in figure 10. It shows, essentially, how simultaneous deviations of mean
annual pressures from their long-term average have a tendency to be of one sign over the tropical Indian Ocean
and the opposite sign over most of the tropical Pacific. The nodal line between the area of positive and negative
deviations from long-term averages runs approximately north-south through the west Pacific and intersects the Equator at 165"E. The correlations of annual pressure anomalies with those of the arbitrarily chosen reference
station, Djakarta (6"S, 107"E), have the surprisingly large
value of -0.8 a t Easter Island (29"S, 109"W). Walker
did not have the Easter Island data and had to base his discussion on Santiago, Chile, where the negative correla- tion with Djakarta is not quite as impressive. The present
author would suggest that the negative correlation at the approximate longitude of Easter Island but closer to the
Equator, and thus out of reach of the extratropical dis- turbances, would show even better negative correlations than -0.8. Be that as it may (there are no island-based
pressure records for the test of the idea), there is a definite
tendency for opposite phase of pressure anomalies at Djakarta and over the eastern equatorial Pacific, and the nodal line in the pressure oscillation is located over the western Pacific near 165"E. The equatorial pressure changes between consecutive Januaries in figures 2 to 6
also conform to that pattern. Indonesia and the Indian
Ocean had a pressure surplus in January 1964 and 1966 and a pressure deficit in January 1963, 1965, and 1967.
The degree of change of the equatorial pressure profile
at extreme phases of the Southern Oscillation can be
judged in figure 8 by the length of the marker DJ a t the
Southern Oscillation
“... annual pressures from their long-term average have a tendency to be of one sign over the tropical Indian Ocean and the opposite sign over most of the tropical Pacific.”
March 1969 J. Bjerknes 169
FIGURE 10.-Walker's Southern Oscillation as presented by Berlage (1957). The map shows the worldwide distribution of correlations of annual pressure anomalies with simultaneous pressure anomalies in Djakarta, Indonesia.
corner of Brazil (province of Ceara) and the equatorial
Atlantic under sinking air.
Further discussion of the relatively weak thermal circulations along the Equator in the Atlantic and the
Indian Ocean is beyond the scope of this article. In what
follows, we endeavor to trace the tropical teleconnec- tions emanating from the equatorial Pacific.
5. WALKER'S "SOUTHERN OSCILLATION"
The Walker Circulation described in section 4 must be part of the mechanism of the st,ill larger "Southern
Oscillation" statistically defined by Sir Gilbert Walker
(1923, 1924, 1928, 1937) and Walker and Bliss (1930, 1932) in the World Weather I to VI sequence of research reports. Whereas the Walker Circulation maintains east-west exchange of air covering a little over an earth quadrant
of the equatorial belt from South America to the west
Pacific, the concept of the Southern Oscillation refers to the barometrically recorded exc.hange of mass along the
complete circumference of the globe in tropical latitudes. What distinguishes the Walker Circulation from other t'ropical east-west exchanges of air is that it operates a
large tapping of potential energy by combining the large- scale r i se of warm-moist and descent' of colder dry air. The fluctuations in the running of the Walker Circulat,ion
are therefore likely to initiate some of the major pulses
of the Southern Oscillation. The Southern Oscillation, as mapped in modernized
form by Berlage (1957)) is reproduced in figure 10. It shows, essentially, how simultaneous deviations of mean
annual pressures from their long-term average have a tendency to be of one sign over the tropical Indian Ocean
and the opposite sign over most of the tropical Pacific. The nodal line between the area of positive and negative
deviations from long-term averages runs approximately north-south through the west Pacific and intersects the Equator at 165"E. The correlations of annual pressure anomalies with those of the arbitrarily chosen reference
station, Djakarta (6"S, 107"E), have the surprisingly large
value of -0.8 a t Easter Island (29"S, 109"W). Walker
did not have the Easter Island data and had to base his discussion on Santiago, Chile, where the negative correla- tion with Djakarta is not quite as impressive. The present
author would suggest that the negative correlation at the approximate longitude of Easter Island but closer to the
Equator, and thus out of reach of the extratropical dis- turbances, would show even better negative correlations than -0.8. Be that as it may (there are no island-based
pressure records for the test of the idea), there is a definite
tendency for opposite phase of pressure anomalies at Djakarta and over the eastern equatorial Pacific, and the nodal line in the pressure oscillation is located over the western Pacific near 165"E. The equatorial pressure changes between consecutive Januaries in figures 2 to 6
also conform to that pattern. Indonesia and the Indian
Ocean had a pressure surplus in January 1964 and 1966 and a pressure deficit in January 1963, 1965, and 1967.
The degree of change of the equatorial pressure profile
at extreme phases of the Southern Oscillation can be
judged in figure 8 by the length of the marker DJ a t the

Southern Oscillation
March 1969 J. Bjerknes 167
IO0
MB
I50
300
200
500
700
S.L.
0" 20"E 40 60 80 100 120 1 4 0 1 6 0 9 180 16N 140 120 100 80 60 40 2OW 0'
FIGURE 8.-Profile of height (dynamic meter) of standard isobaric
surfaces along the Equator in January and July, based on data
from Heastie and Stephenson (1960). "Walker Circulation" over
the Pacific entered as suggested in the present article. The narrow maximum a t 180" in January and the big maximum a t 80"E in July are possibly spurious features.
All these geographical anomalies of equatorial water temperatures have their meteorological side effects. As
far as the Pacific is concerned the equatorial cold air is
unique in its large areal coverage. It also exhibits the greatest negative air temperature anoma.ly for an equa-
torial location, namely in the region of the Galapagos Islands. Contributing to the anomalously low equatorial air temperatures in that region is also the water and air advection from the southeast in the zone of upwelling along the coast of South America. The continued cold water advection westward from the Galapagos Islands is
also important, but the quantitative assessment of that cooling factor has had to be lowered considerably after
the discovery of the Equatorial Countercurrent ~1 mere 50 m on the average under the ocean surface.
4. THE "WALKER CIRCULATION"
When the cold water belt along the Equator is well
developed, the air above it will be too cold and heavy to join the ascending motion in the Hadley circulations.
Instead, the equatorial air flows westward between the
Hadley circulations of the two hemispheres to the warm
west Pacific. There, after having been heated and supplied
by moisture from the warm waters, the equatorial air can
take part in large-scale, moist-adiabatic ascent. The dynamic conditions governing that kind of motion can
be analyzed in the schematic figure 8, which presents a vertical profile of the pressure field along the Equator.
In the Pacific part of that round-the-world profile, the horizontal pressure gradient is directed westward along
the ocean surface (except 1oca.lly near the South American
coast) and eastward in the upper troposphere. If the equatorial air were enclosed between zonal vertical walls,
a simple circulation as shown by the schematic streamlines
in figure 8 would develop. The moist-adiabatically ascend- ing motion in the west would be adjusted so as to occupy
less space than the descending motion in the east, whereby a steady-state field of temperature can be maintained (the
warming by descent - -w(yd"y) being compensated by the net radiative heat loss).
Without the zonal walls, this equatorial circulation does enter into exchange of absolute angular momentum
with adjacent parts of the atmosphere to the north and
the south; and, since the equatorial belt of the atmos- phere is always endowed with a greater absolute angular
momentum than adjacent zonal belts, a divergence of
absolute angular momentum must result at the Equator. Under steady-state conditions this loss of absolute angular
momentum in the equatorial atmosphere is compensated
by the frictional torque about the axis of the earth at the
interface of atmosphere and ocean.
The resultant streamline picture of the zonal wind
components in the equatorial vertical profile will be the vectorial sum of the thermally driven circulation in figure
8 plus a field of easterly wind components whose strength depends on the intensity of the divergence of the merid-
ional and vertical fluxes of absolute angular momentum.
Wind measurements have identified the upper tropo-
spheric equatorial westerlies over the Pacific. Sadler (1959)
states: "The upper tropospheric flow reverses near 150'E where the west components increase toward the east and
the east components toward the west. The reversal region
is a semipermanent feature with a seasonal and annual longitudinal variation . . . Recent data show that the west flow continues to increase to beyond 160"w. The easterlies increase to beyond Singapore where they are a
persistent feature averaging greater than 90-perc.ent
steadiness for most of the year." The span of longitude occupied by upper tropospheric westerlies thus may extend
from 150°E, which is over the warmest part of the equa- torial Pacific (see fig. 7) to well beyond 16Oow, in other words to the cold part of the equatorial Pacific. It seems
reasonable to assume that it is the gradient of sea tempera- ture along the Equator which is the muse of the thermal
circ.ulation entered in figure 8. Hereafter, in th.e present art,icle that circulation will be referred to as the "Walker
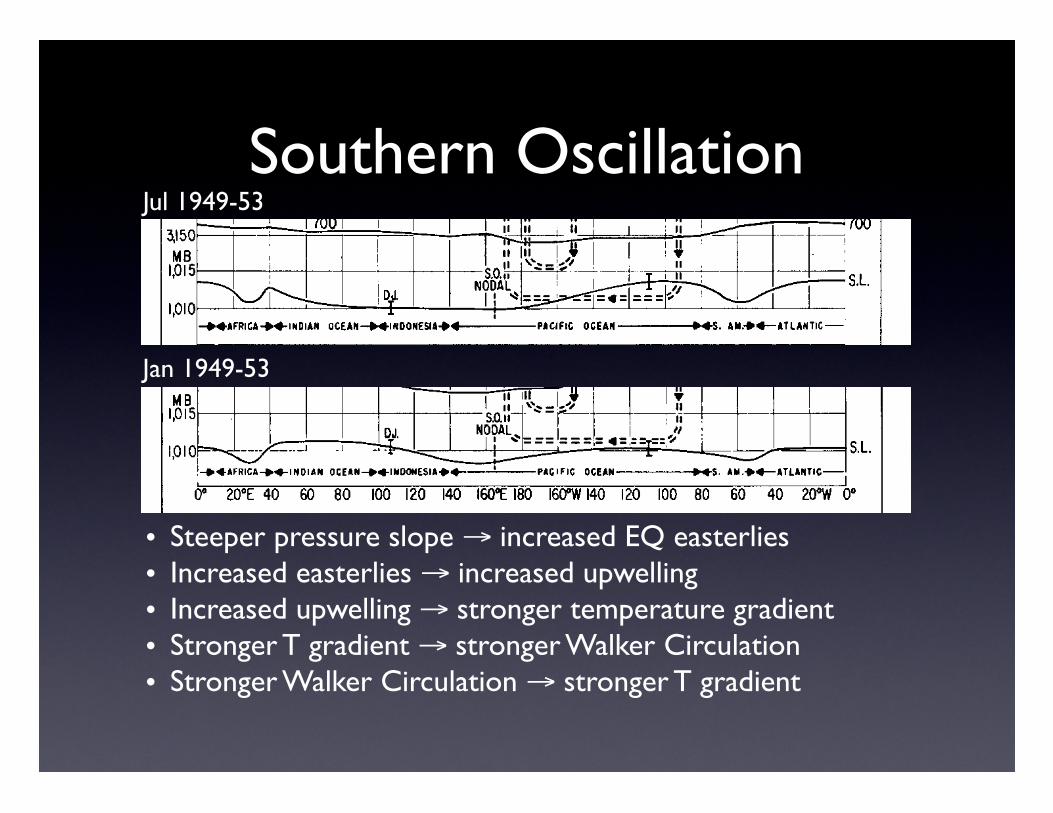
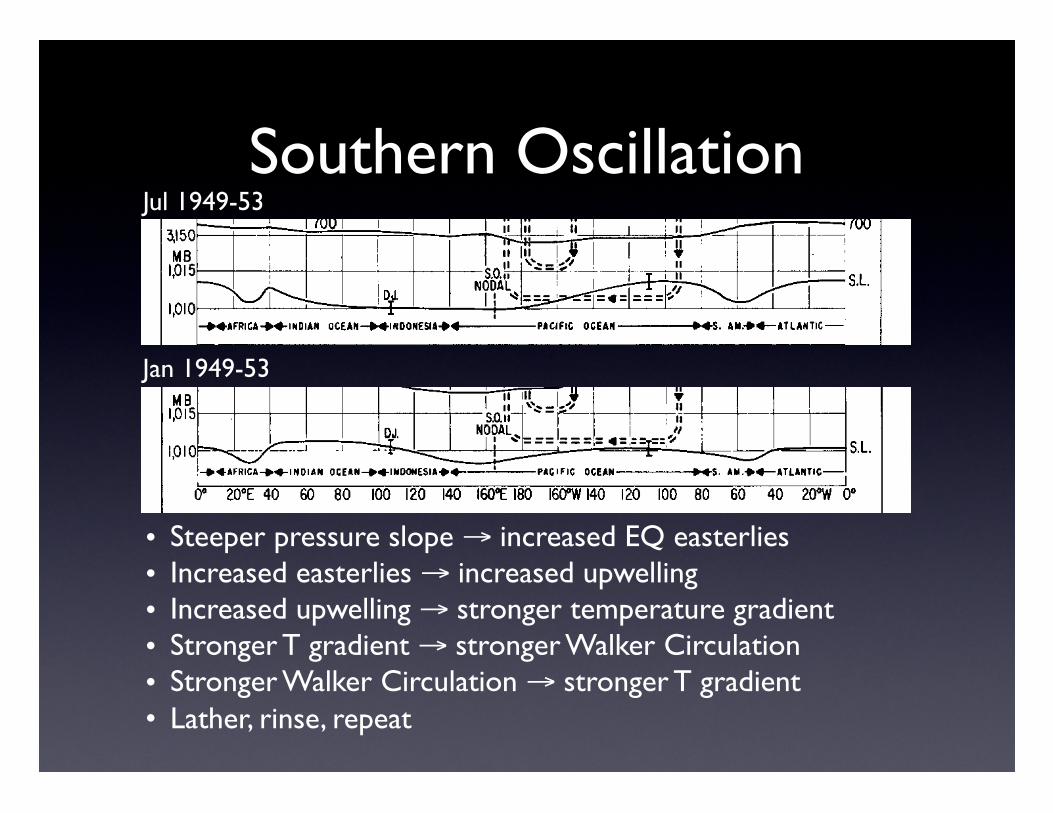
Jul 1949-53
Jan 1949-53
Southern Oscillation
March 1969 J. Bjerknes 167
IO0
MB
I50
300
200
500
700
S.L.
0" 20"E 40 60 80 100 120 1 4 0 1 6 0 9 180 16N 140 120 100 80 60 40 2OW 0'
FIGURE 8.-Profile of height (dynamic meter) of standard isobaric
surfaces along the Equator in January and July, based on data
from Heastie and Stephenson (1960). "Walker Circulation" over
the Pacific entered as suggested in the present article. The narrow maximum a t 180" in January and the big maximum a t 80"E in July are possibly spurious features.
All these geographical anomalies of equatorial water temperatures have their meteorological side effects. As
far as the Pacific is concerned the equatorial cold air is
unique in its large areal coverage. It also exhibits the greatest negative air temperature anoma.ly for an equa-
torial location, namely in the region of the Galapagos Islands. Contributing to the anomalously low equatorial air temperatures in that region is also the water and air advection from the southeast in the zone of upwelling along the coast of South America. The continued cold water advection westward from the Galapagos Islands is
also important, but the quantitative assessment of that cooling factor has had to be lowered considerably after
the discovery of the Equatorial Countercurrent ~1 mere 50 m on the average under the ocean surface.
4. THE "WALKER CIRCULATION"
When the cold water belt along the Equator is well
developed, the air above it will be too cold and heavy to join the ascending motion in the Hadley circulations.
Instead, the equatorial air flows westward between the
Hadley circulations of the two hemispheres to the warm
west Pacific. There, after having been heated and supplied
by moisture from the warm waters, the equatorial air can
take part in large-scale, moist-adiabatic ascent. The dynamic conditions governing that kind of motion can
be analyzed in the schematic figure 8, which presents a vertical profile of the pressure field along the Equator.
In the Pacific part of that round-the-world profile, the horizontal pressure gradient is directed westward along
the ocean surface (except 1oca.lly near the South American
coast) and eastward in the upper troposphere. If the equatorial air were enclosed between zonal vertical walls,
a simple circulation as shown by the schematic streamlines
in figure 8 would develop. The moist-adiabatically ascend- ing motion in the west would be adjusted so as to occupy
less space than the descending motion in the east, whereby a steady-state field of temperature can be maintained (the
warming by descent - -w(yd"y) being compensated by the net radiative heat loss).
Without the zonal walls, this equatorial circulation does enter into exchange of absolute angular momentum
with adjacent parts of the atmosphere to the north and
the south; and, since the equatorial belt of the atmos- phere is always endowed with a greater absolute angular
momentum than adjacent zonal belts, a divergence of
absolute angular momentum must result at the Equator. Under steady-state conditions this loss of absolute angular
momentum in the equatorial atmosphere is compensated
by the frictional torque about the axis of the earth at the
interface of atmosphere and ocean.
The resultant streamline picture of the zonal wind
components in the equatorial vertical profile will be the vectorial sum of the thermally driven circulation in figure
8 plus a field of easterly wind components whose strength depends on the intensity of the divergence of the merid-
ional and vertical fluxes of absolute angular momentum.
Wind measurements have identified the upper tropo-
spheric equatorial westerlies over the Pacific. Sadler (1959)
states: "The upper tropospheric flow reverses near 150'E where the west components increase toward the east and
the east components toward the west. The reversal region
is a semipermanent feature with a seasonal and annual longitudinal variation . . . Recent data show that the west flow continues to increase to beyond 160"w. The easterlies increase to beyond Singapore where they are a
persistent feature averaging greater than 90-perc.ent
steadiness for most of the year." The span of longitude occupied by upper tropospheric westerlies thus may extend
from 150°E, which is over the warmest part of the equa- torial Pacific (see fig. 7) to well beyond 16Oow, in other words to the cold part of the equatorial Pacific. It seems
reasonable to assume that it is the gradient of sea tempera- ture along the Equator which is the muse of the thermal
circ.ulation entered in figure 8. Hereafter, in th.e present art,icle that circulation will be referred to as the "Walker
March 1969 J. Bjerknes 167
IO0
MB
I50
300
200
500
700
S.L.
0" 20"E 40 60 80 100 120 1 4 0 1 6 0 9 180 16N 140 120 100 80 60 40 2OW 0'
FIGURE 8.-Profile of height (dynamic meter) of standard isobaric
surfaces along the Equator in January and July, based on data
from Heastie and Stephenson (1960). "Walker Circulation" over
the Pacific entered as suggested in the present article. The narrow maximum a t 180" in January and the big maximum a t 80"E in July are possibly spurious features.
All these geographical anomalies of equatorial water temperatures have their meteorological side effects. As
far as the Pacific is concerned the equatorial cold air is
unique in its large areal coverage. It also exhibits the greatest negative air temperature anoma.ly for an equa-
torial location, namely in the region of the Galapagos Islands. Contributing to the anomalously low equatorial air temperatures in that region is also the water and air advection from the southeast in the zone of upwelling along the coast of South America. The continued cold water advection westward from the Galapagos Islands is
also important, but the quantitative assessment of that cooling factor has had to be lowered considerably after
the discovery of the Equatorial Countercurrent ~1 mere 50 m on the average under the ocean surface.
4. THE "WALKER CIRCULATION"
When the cold water belt along the Equator is well
developed, the air above it will be too cold and heavy to join the ascending motion in the Hadley circulations.
Instead, the equatorial air flows westward between the
Hadley circulations of the two hemispheres to the warm
west Pacific. There, after having been heated and supplied
by moisture from the warm waters, the equatorial air can
take part in large-scale, moist-adiabatic ascent. The dynamic conditions governing that kind of motion can
be analyzed in the schematic figure 8, which presents a vertical profile of the pressure field along the Equator.
In the Pacific part of that round-the-world profile, the horizontal pressure gradient is directed westward along
the ocean surface (except 1oca.lly near the South American
coast) and eastward in the upper troposphere. If the equatorial air were enclosed between zonal vertical walls,
a simple circulation as shown by the schematic streamlines
in figure 8 would develop. The moist-adiabatically ascend- ing motion in the west would be adjusted so as to occupy
less space than the descending motion in the east, whereby a steady-state field of temperature can be maintained (the
warming by descent - -w(yd"y) being compensated by the net radiative heat loss).
Without the zonal walls, this equatorial circulation does enter into exchange of absolute angular momentum
with adjacent parts of the atmosphere to the north and
the south; and, since the equatorial belt of the atmos- phere is always endowed with a greater absolute angular
momentum than adjacent zonal belts, a divergence of
absolute angular momentum must result at the Equator. Under steady-state conditions this loss of absolute angular
momentum in the equatorial atmosphere is compensated
by the frictional torque about the axis of the earth at the
interface of atmosphere and ocean.
The resultant streamline picture of the zonal wind
components in the equatorial vertical profile will be the vectorial sum of the thermally driven circulation in figure
8 plus a field of easterly wind components whose strength depends on the intensity of the divergence of the merid-
ional and vertical fluxes of absolute angular momentum.
Wind measurements have identified the upper tropo-
spheric equatorial westerlies over the Pacific. Sadler (1959)
states: "The upper tropospheric flow reverses near 150'E where the west components increase toward the east and
the east components toward the west. The reversal region
is a semipermanent feature with a seasonal and annual longitudinal variation . . . Recent data show that the west flow continues to increase to beyond 160"w. The easterlies increase to beyond Singapore where they are a
persistent feature averaging greater than 90-perc.ent
steadiness for most of the year." The span of longitude occupied by upper tropospheric westerlies thus may extend
from 150°E, which is over the warmest part of the equa- torial Pacific (see fig. 7) to well beyond 16Oow, in other words to the cold part of the equatorial Pacific. It seems
reasonable to assume that it is the gradient of sea tempera- ture along the Equator which is the muse of the thermal
circ.ulation entered in figure 8. Hereafter, in th.e present art,icle that circulation will be referred to as the "Walker
Jul 1949-53
Jan 1949-53
• Steeper pressure slope # increased EQ easterlies• Increased easterlies # increased upwelling• Increased upwelling # stronger temperature gradient• Stronger T gradient # stronger Walker Circulation• Stronger Walker Circulation # stronger T gradient
Southern Oscillation
March 1969 J. Bjerknes 167
IO0
MB
I50
300
200
500
700
S.L.
0" 20"E 40 60 80 100 120 1 4 0 1 6 0 9 180 16N 140 120 100 80 60 40 2OW 0'
FIGURE 8.-Profile of height (dynamic meter) of standard isobaric
surfaces along the Equator in January and July, based on data
from Heastie and Stephenson (1960). "Walker Circulation" over
the Pacific entered as suggested in the present article. The narrow maximum a t 180" in January and the big maximum a t 80"E in July are possibly spurious features.
All these geographical anomalies of equatorial water temperatures have their meteorological side effects. As
far as the Pacific is concerned the equatorial cold air is
unique in its large areal coverage. It also exhibits the greatest negative air temperature anoma.ly for an equa-
torial location, namely in the region of the Galapagos Islands. Contributing to the anomalously low equatorial air temperatures in that region is also the water and air advection from the southeast in the zone of upwelling along the coast of South America. The continued cold water advection westward from the Galapagos Islands is
also important, but the quantitative assessment of that cooling factor has had to be lowered considerably after
the discovery of the Equatorial Countercurrent ~1 mere 50 m on the average under the ocean surface.
4. THE "WALKER CIRCULATION"
When the cold water belt along the Equator is well
developed, the air above it will be too cold and heavy to join the ascending motion in the Hadley circulations.
Instead, the equatorial air flows westward between the
Hadley circulations of the two hemispheres to the warm
west Pacific. There, after having been heated and supplied
by moisture from the warm waters, the equatorial air can
take part in large-scale, moist-adiabatic ascent. The dynamic conditions governing that kind of motion can
be analyzed in the schematic figure 8, which presents a vertical profile of the pressure field along the Equator.
In the Pacific part of that round-the-world profile, the horizontal pressure gradient is directed westward along
the ocean surface (except 1oca.lly near the South American
coast) and eastward in the upper troposphere. If the equatorial air were enclosed between zonal vertical walls,
a simple circulation as shown by the schematic streamlines
in figure 8 would develop. The moist-adiabatically ascend- ing motion in the west would be adjusted so as to occupy
less space than the descending motion in the east, whereby a steady-state field of temperature can be maintained (the
warming by descent - -w(yd"y) being compensated by the net radiative heat loss).
Without the zonal walls, this equatorial circulation does enter into exchange of absolute angular momentum
with adjacent parts of the atmosphere to the north and
the south; and, since the equatorial belt of the atmos- phere is always endowed with a greater absolute angular
momentum than adjacent zonal belts, a divergence of
absolute angular momentum must result at the Equator. Under steady-state conditions this loss of absolute angular
momentum in the equatorial atmosphere is compensated
by the frictional torque about the axis of the earth at the
interface of atmosphere and ocean.
The resultant streamline picture of the zonal wind
components in the equatorial vertical profile will be the vectorial sum of the thermally driven circulation in figure
8 plus a field of easterly wind components whose strength depends on the intensity of the divergence of the merid-
ional and vertical fluxes of absolute angular momentum.
Wind measurements have identified the upper tropo-
spheric equatorial westerlies over the Pacific. Sadler (1959)
states: "The upper tropospheric flow reverses near 150'E where the west components increase toward the east and
the east components toward the west. The reversal region
is a semipermanent feature with a seasonal and annual longitudinal variation . . . Recent data show that the west flow continues to increase to beyond 160"w. The easterlies increase to beyond Singapore where they are a
persistent feature averaging greater than 90-perc.ent
steadiness for most of the year." The span of longitude occupied by upper tropospheric westerlies thus may extend
from 150°E, which is over the warmest part of the equa- torial Pacific (see fig. 7) to well beyond 16Oow, in other words to the cold part of the equatorial Pacific. It seems
reasonable to assume that it is the gradient of sea tempera- ture along the Equator which is the muse of the thermal
circ.ulation entered in figure 8. Hereafter, in th.e present art,icle that circulation will be referred to as the "Walker
March 1969 J. Bjerknes 167
IO0
MB
I50
300
200
500
700
S.L.
0" 20"E 40 60 80 100 120 1 4 0 1 6 0 9 180 16N 140 120 100 80 60 40 2OW 0'
FIGURE 8.-Profile of height (dynamic meter) of standard isobaric
surfaces along the Equator in January and July, based on data
from Heastie and Stephenson (1960). "Walker Circulation" over
the Pacific entered as suggested in the present article. The narrow maximum a t 180" in January and the big maximum a t 80"E in July are possibly spurious features.
All these geographical anomalies of equatorial water temperatures have their meteorological side effects. As
far as the Pacific is concerned the equatorial cold air is
unique in its large areal coverage. It also exhibits the greatest negative air temperature anoma.ly for an equa-
torial location, namely in the region of the Galapagos Islands. Contributing to the anomalously low equatorial air temperatures in that region is also the water and air advection from the southeast in the zone of upwelling along the coast of South America. The continued cold water advection westward from the Galapagos Islands is
also important, but the quantitative assessment of that cooling factor has had to be lowered considerably after
the discovery of the Equatorial Countercurrent ~1 mere 50 m on the average under the ocean surface.
4. THE "WALKER CIRCULATION"
When the cold water belt along the Equator is well
developed, the air above it will be too cold and heavy to join the ascending motion in the Hadley circulations.
Instead, the equatorial air flows westward between the
Hadley circulations of the two hemispheres to the warm
west Pacific. There, after having been heated and supplied
by moisture from the warm waters, the equatorial air can
take part in large-scale, moist-adiabatic ascent. The dynamic conditions governing that kind of motion can
be analyzed in the schematic figure 8, which presents a vertical profile of the pressure field along the Equator.
In the Pacific part of that round-the-world profile, the horizontal pressure gradient is directed westward along
the ocean surface (except 1oca.lly near the South American
coast) and eastward in the upper troposphere. If the equatorial air were enclosed between zonal vertical walls,
a simple circulation as shown by the schematic streamlines
in figure 8 would develop. The moist-adiabatically ascend- ing motion in the west would be adjusted so as to occupy
less space than the descending motion in the east, whereby a steady-state field of temperature can be maintained (the
warming by descent - -w(yd"y) being compensated by the net radiative heat loss).
Without the zonal walls, this equatorial circulation does enter into exchange of absolute angular momentum
with adjacent parts of the atmosphere to the north and
the south; and, since the equatorial belt of the atmos- phere is always endowed with a greater absolute angular
momentum than adjacent zonal belts, a divergence of
absolute angular momentum must result at the Equator. Under steady-state conditions this loss of absolute angular
momentum in the equatorial atmosphere is compensated
by the frictional torque about the axis of the earth at the
interface of atmosphere and ocean.
The resultant streamline picture of the zonal wind
components in the equatorial vertical profile will be the vectorial sum of the thermally driven circulation in figure
8 plus a field of easterly wind components whose strength depends on the intensity of the divergence of the merid-
ional and vertical fluxes of absolute angular momentum.
Wind measurements have identified the upper tropo-
spheric equatorial westerlies over the Pacific. Sadler (1959)
states: "The upper tropospheric flow reverses near 150'E where the west components increase toward the east and
the east components toward the west. The reversal region
is a semipermanent feature with a seasonal and annual longitudinal variation . . . Recent data show that the west flow continues to increase to beyond 160"w. The easterlies increase to beyond Singapore where they are a
persistent feature averaging greater than 90-perc.ent
steadiness for most of the year." The span of longitude occupied by upper tropospheric westerlies thus may extend
from 150°E, which is over the warmest part of the equa- torial Pacific (see fig. 7) to well beyond 16Oow, in other words to the cold part of the equatorial Pacific. It seems
reasonable to assume that it is the gradient of sea tempera- ture along the Equator which is the muse of the thermal
circ.ulation entered in figure 8. Hereafter, in th.e present art,icle that circulation will be referred to as the "Walker
Jul 1949-53
Jan 1949-53
• Steeper pressure slope # increased EQ easterlies• Increased easterlies # increased upwelling• Increased upwelling # stronger temperature gradient• Stronger T gradient # stronger Walker Circulation• Stronger Walker Circulation # stronger T gradient• Lather, rinse, repeat

So... Who’s On First?
“There is thus ample reason for a never-ending succession of alternating trends by air-sea interaction in the equatorial belt, but just how the turnabout between trends takes place is not yet quite clear.... An additional key to the problem may have to be developed by the science of dynamic oceanography.”

Teleconnections170 MONTHLY WEATHER REVIEW
FIGURE 11.-The Southern Oscillation from 1955 to 1967 represented
by 6-mo overlapping averages of Djakarta monthly pressure
anomalies.. Dashed curve based on Singapore data. On same time
scale: sea temperature a t the Equator at approximately 165"W,
and sea temperature by monthly averages a t Canton Island.
longitude of Djakarta and of a corresponding marker at the longitude of the pressure maximum over the eastern
Pacific. The markers refer to known recorded extremes of
monthly averages, which numerically may deviate about
f 1.5 mb from the long-term average for the month under
consideration. Since opposite signs of pressure extremes
usually occur simultaneously at Djakarta and in the east Pacific, the shape of the pressure profiles in figure 8 may
change quite perceptibly. Of particular dynamic signifi-
cance are the processes connected with the changes in slope of the pressure profile along the bottom of the Walker Circulation.
A change toward a steeper pressure slope at the base
of the Walker Circulation is associated with an increase in the equatorial easterly winds and hence also with an
increase in the upwelling and a sharpening of the contrast
of surface temperature between the eastern and western equatorial Pacific. This chain reaction shows that an in-
tensifying Walker Circulation also provides for an increase of the east-west temperature contrast that is the cause of the Walker Circulation in the first place. Trends of in-
crease in the Walker Circulation and corresponding trends in the Southern Oscillation probably operate in that way.
On the other hand, a case can also be made for a trend of decreasing speed of the Walker Circulation, as follows. A decrease of the equatorial easterlies weakens the equatorial
upwelling, thereby the eastern equatorial Pacific becomes warmer and supplies heat also to the atmosphere above it. This lessens the east-west temperature contrast within the Walker Circulation and makes that circulation slow
down. There is thus ample reason for a never-ending succession
of alternating trends by air-sea interaction in the equa-
torial belt, but just how the turnabout between trends takes place is not yet quite clear. The study of a sequence of global meteorological maps during typical turnabouts may clarify part of the problem. An additional key to the
problem may have to be developed by the science of dynamic oceanography.
I I PRESSURE ANOMALY, DiAKARTA 6's 107"E I
FIGURE 12.-Djakarta monthly pressure anomalies from 1962 to
1965 continued on the basis of Singapore data, and sea tempera-
ture at the Equator, 165OW.
6. ANALYSIS .OF THE CIRCULATION CHANGES
CONNECTED WITH THE WARMING TREND IN THE CENTRAL EQUATORIAL PACIFIC IN 1963
Figure 11 shows the Southern Oscillation during the
years 1955 to 1967 as represented by a time series of Djakarta pressure anomalies,2 smoothed by 6-mo over-
lapping, and, on the same time scale, two curves represent- ing the temperature of the surface water in the equatorial belt of the mid-Pacific. The bottom curve shows the
succession of monthly averaged sea-surface temperatures a t Canton Island (the same as shown in fig. 1). The other
curve of sea temperature is obtained from ships crossing the Equator near 165"W while plying between Hawaii and Samoa. Ship crossings were more frequent in the
late 1950's than in later years, which accounts for the different density of short-period detail along the time series. The longer period trends of the ship curve show a satisfactory agreement with those recorded a t Canton
Island a t 2"43'S, as could well be expected. However, the additional similarity of long trends in
Djakarta pressure anomalies and those of the sea-surface
temperature of the equatorial Pacific, one earth quadrant away, is a remarkable fact of organized teleconnections. That teleconnection, by the way, extends even farther east to the upwelling water at the coast of Peru whose temperature is also most of the time correlated to Djakarta
pressure anomalies (see Berlage, 1966, p. 18).
In the case under consideration it is possible to get some information on the lag between the warming in the equatorial Pacific and the pressure rise in Indonesia. This is shown in figure 12, where the Djakarta monthly pressure anomalies from 1962 to 1965 and continued data from
Singapore are depicted without smoothing. The change from negative anomalies, which had prevailed for approxi- mately 4 yr, to positive ones took place in one jump of
2 Djakarta data end with February 1966. The rest of the time Series (in dashed Curve)
is based on Singapore for the time being.
“...similarity of long trends in Djakarta pressure anomalies and those of the sea-surface temperature of the equatorial Pacific, one earth quadrant away, is a remarkable fact of organized teleconnections.”

Teleconnections J. Bjerknes 171' March 1969
1963
EASTER ISLAND 29' 9's 109' 27'W
CANTON ISLAND 2' 46's 171' 43'W
? RABAUL 4' 13's 152' I I 'E
AMBONA 3' 42's 1 2 8 O 5'E
DJAKARTA 6" I I ' S 1 0 6 O 5 0 ' E
CANTON ISLAND
MINUS RAEAUL
FIGURE 13.-Selected time series of monthly pressure in 1963 at
Pacific and Indonesian stations. See text for discussion.
almost 2 mb from May to June 1963. Actually, the normal change between those 2 mo, determined from the period 1866-1942, is "0.43 mb; the real change in 1963 was $2.36 mb and the change in anomaly +1.93 mb.
The warming of the equatorial Pacific, which was also a quick process, took place a full month earlier. This establishes the Pacific Ocean warming as the cause of the lag-correlated adjustment of the pressure field over Indo- nesia in the Southern Oscillation pulse of 1963. The remote control must have operated through the Walker Circula- tion, which had to slow down when the east Pacific
equatorial tongue of cold water became less cold and pro- vided less east-west temperature contrast within the
Walker Circulation. The corresponding automatic pressure
response reduces the east to west pressure drop along the
Equator and shows up as pressure rise in the western
Pacific.
Figure 13 shows by means of selected time series of
surface pressure how the chain reaction progressed from
the southeast Pacific to Indonesia.
The Easter Island curve indicates a relatively strong
southeast Pacific High in the first 3 mo of 1963 during
which the upwelling at the South American coast and
along the Equator must have been well maintained.
Then, from March to April the 5-mb drop at Easter
Island must have signaled a weakening of the upwelling all the way along the Equator to the mid-Pacific.. The steep rise in the ship-based time series of sea temperature at 165"W occurred at that stage (figs. 11 and 12).
The decrease in the westward pressure gradient along the Equator-can only indirectly be represented in figure 13
by the pressure difference between the two stations Canton Island, 2"46'S, and Rabaul, 4"13'S, neither of which is exactly at the Equator; but the decrease with time of the pressure difference of Canton Island minus Rabaul (bottom curve in figure 13) from 2 mb to about zero from February to July is big enough to be strongly indicative of the supposed weakening of the westward pressure gradient also at the Equator. The same, with good reason, can be assumed to take place east of Canton Island where no island-based pressure records are avail- able. Most likely the 5-mb pressure fall shown at Easter Island from March to April must have extended to the Equator with perhaps a l-mb pressure fall there. The inference from the pressure field (seen together with the simultaneous 2.2-mb pressure rise at Lae, on the Pacific coast of New Guinea) points definitely toward an ocean- wide slowdown of the Walker Circulation. The normal seasonal change from January to July over the equatorial Pacific, according to figure 8, goes in the sense of strength- ening the Walker Circulation. Considering this, it can be
seen that the year 1963 brought about equatorial Pacific conditions strongly deviating from normal.
It is with this general background in mind that it can be visualized what had to happen when, during the approach of the 1963 Southern Hemisphere winter, the equatorial belt of the Pacific Ocean had become much warmer than normal. Obviously, the southern Hadley circulations would strengthen. That is what happened from May to June 1963. A 3-mb rise started at Easter Island, and general rise of up to 6 mb took place in the Australian part of the subtropical high-pressure belt. It is the northern fringe of the Australian pressure rise that is also recorded at the Indonesian stations Ambona and Djakarta (fig. 13) from May t o June. These two localities were not yet reached by the upward pressure adjustment that was quite strong in eastern New Guinea when the Walker Circulation slowed down from March to April.
It is worthy of note that the strengthening of the
southern Hadley circulations from May to June left the
region between Easter Island and Australia in its normal
cool pattern of isobars. Moving anticyclones may cross
that area, but it is not the place for big anticyclones to
become stationary and dominate the average monthly
flow pattern. This is then also what makes it possible for
the positive sea-temperature anomalies in the west
Pacific equatorial belt to survive a southern winter sewon
as they did in 1963. The same condition of equatorial
heat surplus that started in April 1963 thus remained
long enough to vitalize the northern Hadley circulation
in the northern winter of 1963-64, as shown in figure 3.
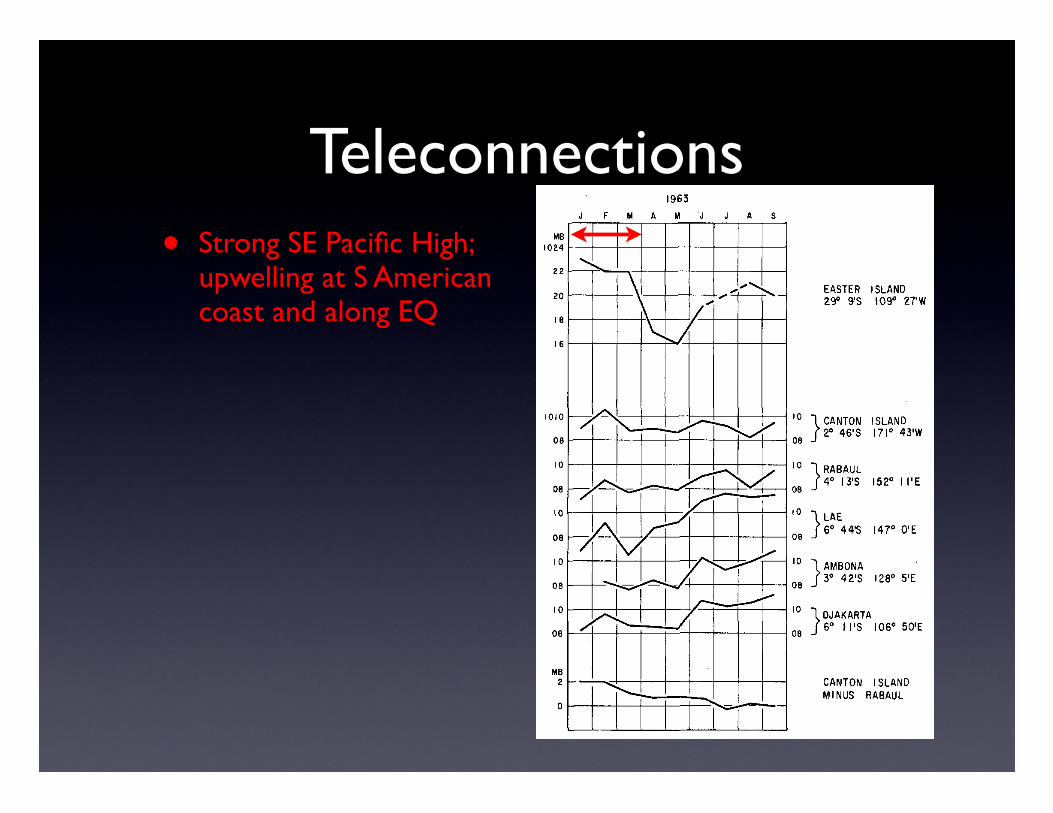
• Strong SE Pacific High; upwelling at S American coast and along EQ
• Pressure drop signals weakening in upwelling along EQ to mid-Pacific
• Decrease in westward pressure gradient (Canton - Rabaul)
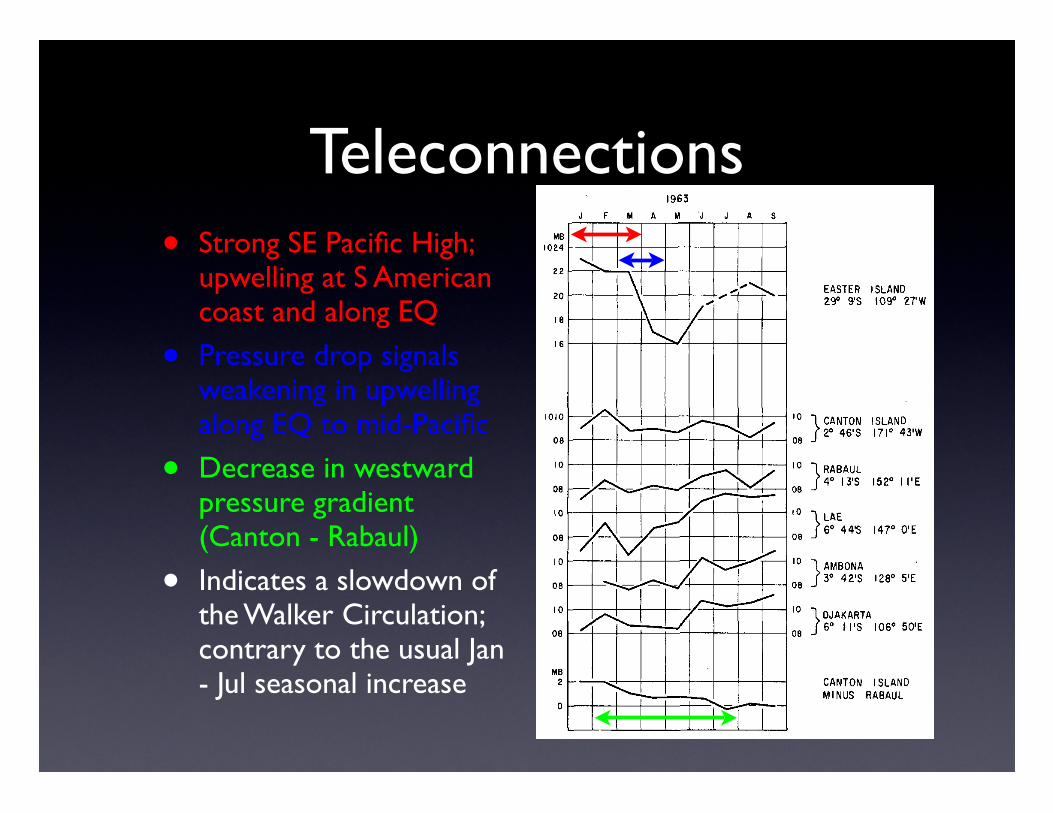
• Indicates a slowdown of the Walker Circulation; contrary to the usual Jan - Jul seasonal increase
Teleconnections
“The demonstrated recurrence of cases showing the strengthening of the wintertime Hadley circulations by the injection of surplus heat and latent heat supply from the Pacific equatorial belt now justifies a cautious use of such experience in long-range forecasting.”
Teleconnections
“...the temperature variation at the Pacific Equator are associated with Sir Gilbert Walker’s Southern Oscillation.”
“... the thermally maintained Walker circulation along the Pacific Equator initiated a new major pulse in the Southern Oscillation after several years of only minor pulses.”
Questions
1. What are the fundamental components of Bjerknes' coupled ocean atmosphere system, and how do they explain tropical teleconnections?
2. What was Bjerknes’ mechanism for extratropical teleconnections?
3. What components of ENSO events could Bjerknes not explain?


![Recent Advances in Atmospheric, Solar-Terrestrial Physics ...newserver.stil.bas.bg/SUNGEO//00SGArhiv/SG_v12_Sup_2017...Equatorial Electrojet Year IEEY [1992-1993] and International](https://img.pdfslide.us/doc/110x75/607941317b8f3520874d6080/recent-advances-in-atmospheric-solar-terrestrial-physics-equatorial-electrojet.jpg)