Embed Size (px)
Citation preview
Atmospheric Environment Vol. 27A, No. 1, pp. 43-55, 1993. 0(g)4-6981/93 $6,00+0.00 Printed in Great Britain. © 1993 Pergamon Press Ltd
ATMOSPHERIC SULPHUR DEPOSITION TO FOREST STANDS: THROUGHFALL ESTIMATES COMPARED TO
ESTIMATES FROM INFERENCE
GEERT P. J. DRAAIJERS
Department of Physical Geography, University of Utrecht, P.O. Box 80.115, 3508 TC, Utrecht, the Netherlands
and
JAN WILLEM ERISMAN
National Institute of Public Health and Environmental Protection, P.O. Box 1, 3720 BA, Bilthoven, the Netherlands
(First received 2 May 1992 and in final form 30 July 1992)
Abstract--Wet and dry deposition of sulphur was estimated for 30 forest stands in the Netherlands using a throughfall method and an inferential method. Dry deposition estimates of the throughfall method were significantly higher compared to estimates from inference. The major sources of uncertainty of the throughfall dry deposition estimates were associated with non-representative throughfall sampling, wet deposition estimates, canopy exchange processes, deposition of neutral salts, dry deposition directly onto the throughfall collectors, and with the omission of stemflow fluxes and dry deposition directly to the undergrowth vegetation and forest floor. These uncertainties were found to act both ways to approximately the same extent and were not able to explain the observed gap between the two dry deposition estimates. For the inferential method, major sources of uncertainty in the dry deposition estimates arose in calculation of the dry deposition velocity of SO2 and the omission of occult deposition of SO~-. In this study, uncertainties associated with the spatial averaging of air concentrations of SO2 and SO4 aerosol and the calculation of the deposition velocity of SO4 aerosol were found to be relatively small. Modifying the Rc parametrization of SOz, based on recent dry deposition measurements made over heather in the Netherlands, resulted in fairly good agreement between both dry deposition estimates. Occult deposition of SO~- was found to contribute significantly to the total sulphur deposition to the forest stands. Both the modified Re parametrization and the incorporation of occult deposition led to systematically higher sulphur deposition estimates by the inferential method compared to originally inferred deposition. This implies that in the Netherlands, sulphur deposition to forest ecosystems might have been underestimated heretofore.
Key word index: Atmospheric deposition, sulphur, forests, throughfall, inferential modelling.
1. I N T R O D U C T I O N
Numerous reports indicate that high atmospheric input of sulphur and nitrogen may severely affect the functioning of several ecosystems (e.g. Johnson and Lindberg, 1992). In Europe, the U.S.A. and Canada, critical loads serve as a tool to assess the occurrence of effects in natural ecosystems due to acid deposition (Nilson and Grennfelt, 1988; Hetteling et al., 1991). A critical load is defined as a quantitative estimate of an exposure to one or more pollutants below which significant harmful effects do not occur. Critical loads refer directly to soil loads. For the estimation of critical load exceedances, on which measures will be based, actual and future soil loads have to be mapped.
Presently, critical load exceedance maps of Europe have been made using deposition estimates by a long* range transport model (EMEP) on a 150x 150km scale (Hetterling et al., 1991). Dry deposition to forests is higher than to non-forested areas because of the greater roughness and receptor surface of forests
43
compared to other kinds of vegetation (Unswortn and Wilshaw, 1989; Ivens, 1990). For this reason, to assess deposition to forest ecosystems within a grid, filtering factors have been used together with EMEP model results. However, an essential drawback of this model is that it does not take into account the large depos- ition variability over different types of landscapes and within forested areas. Variability within forested areas is, to a large extent, caused by differences in canopy structure and edge effects (Draaijers et al., 1991).
To assess the ecological impact of atmospheric pollutants on forest ecosystems, it is necessary to quantify the input of atmospheric pollutants on stand level and to make a linkage between modelled depos- ition estimates and soil loads. Several methods exist to estimate the deposition to forests on such small scales. Basically these methods fall into two categories: micrometeorological techniques and surface wash methods (Davidson and Wu, 1990). Micrometeoro- logical approaches have many drawbacks, the limita- tion to certain terrain situations (adequate fetch, uni-
44 G . P . J . DRAAIJERS and J. W. ERISMAN
form vegetation) being one of the most important. A widely used surface wash technique is the throughfall method which proves to be useful in complex forest terrain. However, this method for quantifying depos- ition amounts suffers from interactions of pollutants with the forest canopy (canopy exchange).
Several studies show that there are large differences between throughfall and modelled deposition estim- ates (Ivens, 1990; Lovett et al., 1992; Erisman, 1992b, c; Cape et al., 1992). The relationship between the two quantities is found to be influenced by canopy ex- change processes and uncertainty in deposition estim- ates. Although the (spatial) correlation between the two quantities is found to be high, through- fall estimates are usually higher than deposition estim- ates. For components such as Ca 2 +, K +, Mg2 + and nitrogen compounds (NO 3, N H ~ ) , canopy exchange processes influence the throughfall composit ion such that the relation between throughfall and deposition estimates cannot easily be established. These processes depend on many parameters, e.g. on the occurrence of tree diseases, the nutrient status of the soil, stand characteristics, atmospheric loads, etc. (Parker, 1983), , whose impact cannot always be quantified adequately with present knowledge. S O ~ - , Na ÷ and C I - in throughfall have generally been found not to be influenced by canopy exchange processes to a large extent relative to the atmospheric input (Garten et al., 1988; Lindberg et al., 1990). For this reason, through- fall measurements of these components might be of use in establishing a relationship between throughfall and modelled deposition estimates.
In this study, a systematic investigation is described in which throughfall measurements of S O ~ - obtained in 30 different forest stands with different stand characteristics (Van Ek and Draaijers, 1991) are com- pared with modelled deposition estimates of sulphur components for these stands. Recently, Erisman (1991, 1992a) developed the Dutch Empirical Acid Depos- ition Model (DEADM), through which deposition of potential acidifying components is estimated on a small scale, taking into account land use and aerody- namic roughness. In contrast to the E M E P model, deposition data from D E A D M are receptor specific. The set-up of the throughfall measurements was such that certain processes which might influence the relation between throughfall and model deposition estimates, have been explicitly excluded, i.e. negligible concentration variation due to local sources, no roughness transition zones such as forest edges, and the same measuring method and strategy in all forest stands. Furthermore, canopy exchange processes due to diseases, pollen and algae were investigated and reported by Van Ek and Draaijers (1991).
2. METHODS
2.1. Throuohfall measurements
A throughfall monitoring program was performed in the middle (thus minimizing edge effects) of 30 different forest
stands. The size of an individual forest stand amounted at least to 1 ha. All forest stands were growing on poor sandy podzolic soils and were 30-80 years in age. Nine measure- ment sites were situated in Douglas fir (Pseudotsuga menzies- sii Mirb. Franco) stands, 10 sites in Scotch pine (Pinus sylvestris L.) and 11 sites in oak (Quercus robur L.) stands. For all forest stands, the aerodynamic roughness and collecting surface area of the canopy was estimated through extensive field measurements (Draaijers et al., 1992). The leaf area index (LAI) of the 30 forest stands was averaged to 6.7 and ranged from 2.4 to 12.0.
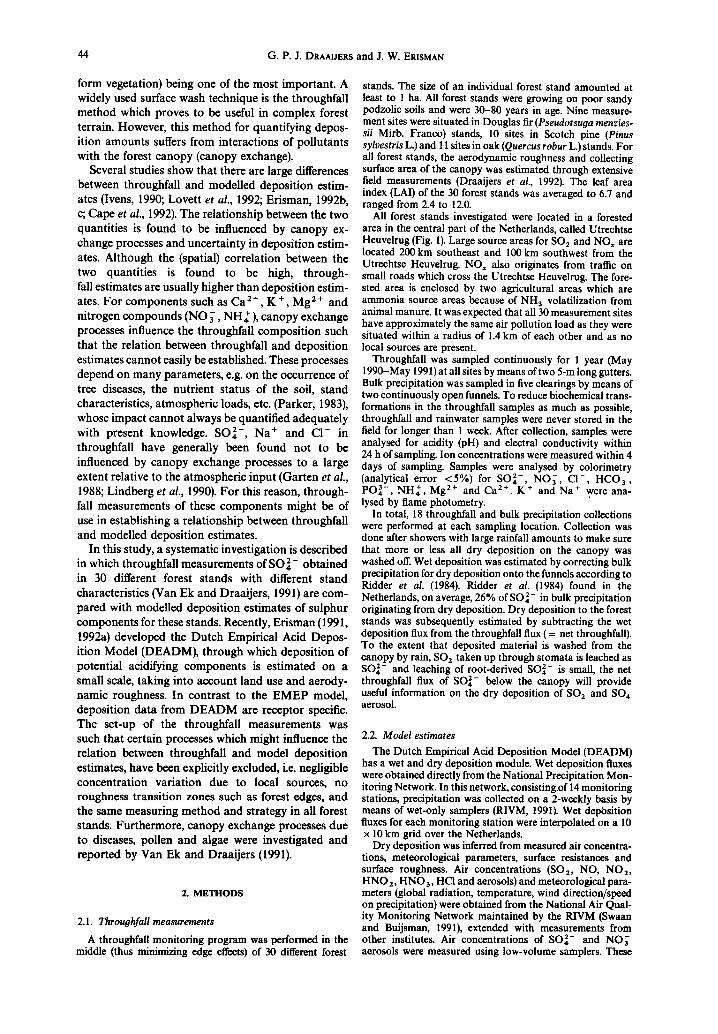
All forest stands investigated were located in a forested area in the central part of the Netherlands, called Utrechtse Heuvelrug (Fig. 1). Large source areas for SO2 and NOx are located 200 km southeast and 100 km southwest from the Utrechtse Heuvelrug. NOx also originates from traffic on small roads which cross the Utrechtse Heuvelrug. The fore- sted area is enclosed by two agricultural areas which are ammonia source areas because of NH 3 volatilization from animal manure. It was expected that all 30 measurement sites have approximately the same air pollution load as they were situated within a radius of 1.4 km of each other and as no local sources are present.
Throughfall was sampled continuously for 1 year (May 1990-May 1991) at all sites by means of two 5-m long gutters. Bulk precipitation was sampled in five clearings by means of two continuously open funnels. To reduce biochemical trans- formations in the throughfall samples as much as possible, throughfall and rainwater samples were never stored in the field for longer than 1 week. After collection, samples were analysed for acidity (pH) and electral conductivity within 24 h of sampling. Ion concentrations were measured within 4 days of sampling. Samples were analysed by colorimetry (analytical error <5%) for SO~-, NO~, CI- , HCO~, PO~-, NH4 +, Mg 2+ and Ca 2+. K + and Na + were ana- lysed by flame photometry.
In total, 18 throughfall and bulk precipitation collections were performed at each sampling location. Collection was done after showers with large rainfall amounts to make sure that more or less all dry deposition on the canopy was washed off. Wet deposition was estimated by correcting bulk precipitation for dry deposition onto the funnels according to Ridder et al. (1984). Ridder et al. (1984) found in the Netherlands, on average, 26% of SO~- in bulk precipitation originating from dry deposition. Dry deposition to the forest stands was subsequently estimated by subtracting the wet deposition flux from the throughfall flux ( = net throughfall). To the extent that deposited material is washed from the canopy by rain, SO2 taken up through stomata is leached as SO~- and leaching of root-derived SO~- is small, the net throughfall flux of SO~- below the canopy will provide useful information on the dry deposition of SO2 and SO4 aerosol.
2.2. Model estimates
The Dutch Empirical Acid Deposition Model (DEADM) has a wet and dry deposition module. Wet deposition fluxes were obtained directly from the National Precipitation Mon- itoring Network. In this network, consisting .of 14 monitoring stations, precipitation was collected on a 2-weekly basis by means of wet-only samplers (RIVM, 1991). Wet depbsition fluxes for each monitoring station were interpolated on a 10 x 10 km grid over the Netherlands.
Dry deposition was inferred from measured air concentra- tions, meteorological parameters, surface resistances and surface roughness. Air concentrations (SO2, NO, NO2, HNO 2, HNO 3, HCI and aerosols) and meteorological para- meters (global radiation, temperature, wind direction/speed on precipitation) were obtained from the National Air Qual- ity Monitoring Network maintained by the RIVM (Swaan and Buijsman, 1991), extended with measurements from other institutes. Air concentrations of SO~- and NO~ aerosols were measured using low-volume samplers. These
Sulphur deposition estimates 45
• foreat
I I agricultural area
~ clearing/heather
~ built- up area
o i 2km I I i
road
• throughfall measurement site
Fig. 1. The location of the throughfall measurement sites and the grids used in the Dutch Empirical Acid Deposition Model (DEADM).
samplers only collect aerosols with mass median diameters smaller than 2/zm (fine particles, mainly (NH 4)2 SO4). Non- acidifying (neutral) S O l - -containing particles are not sam- pled because they usually have mass median diameters larger than 2/~m (Davidson and Wu, 1990). For NH a and NH + air concentrations, results of model calculations were used (As- man and Van Jaarsveld, 1990). Detailed land-use informa- tion was used to characterize roughness lengths. The rough- ness length for forests was related to trcc species, mean tree height and crown coverage of the forest stand and was estimated for summer and winter months separately (Eris- man, 1990, 1992c). The information required for this com- putation was obtained from the Dutch Forest Statistics (Meijers, 1990).
For every 2 h, a wind field and concentration fields were obtained via extrapolation of the measurements at each individual station to a height of 50 m and subsequent inter- polation onto a grid system over the Netherlands. The 50 m height was chosen because it was assumed that at this height concentration and wind speed arc not substantially influ- enced by surface characteristics (Erisman, 1991, 1992c). With
the land-use information and component-specific surface resistances, appropriate dry deposition velocities were calcu- lated for the different gases and aerosols for each 1 x 1 km grid (Fig. 1). Accordingly, 2-hourly averaged dry deposition fluxes were calculated by multiplying the air concentrations with the dry deposition velocities. Total deposition was calculated by adding the wet and dry deposition fluxes.
Dry deposition velocities of gases were calculated as the inverse of the sum of the aerodynamic resistance (Ra), quasi- laminar layer resistance (Rb) and the surface or canopy resistance (Re). The aerodynamic resistance to transport of gases across the constant flux layer was assumed to be similar to that of heat (Hicks et al., 1989) and approximated follow- ing the procedures used by Garland (1977). The quasi- laminar layer resistance was approximated by the procedures presented by Wesely and Hicks (1977). The surface or canopy resistance was the most uncertain of the three resistances. Normally, Rc is obtained from dry deposition mea- surements as a residual resistance: the dry deposition velocity is measured by gradient techniques or eddy correlation and R, and R b a r c determined by meteorological measurements.
46 G . P . J . DRAAIJERS and J, W. ERISMAN
In DEADM, the Rc of SO2 was parametrized based on dry deposition measurements made in the Netherlands by On- derdelinden and Van Jaarsveld (1984) and Erisman et aL (1992):
ex ---~ [ l+exp(-~-----)][15+(lO p ( 4 ) )
• oxp( Rc
ml
where Q is the global radiation, ~ the duration of the preceding rain period (in h), B the number of preceding dry hours and ml a factor depending on the month considered. With snow cover and temperatures below 0 °C the R, of SO2 equalled 500 s m -1. Thus, the R, of SO 2 was determined by global radiation, surface wetness, temperature and snow cover. No information on the impact of soil or type of vegetation was available.
In DEADM, the calculation o[ the dry deposition velocity of particles was based on parametrizations done by Wesely et al. (1985) which were revised on the basis of the results of observations done by Hicks et al. (1989) and Waraghai and Gravenhorst (1989). Further details on the assessment of dry deposition velocities of gases and particles can be found in Erisman (1991, 1992b).
3. RESULTS AND DISCUSSION
3.1. Total deposi t ion
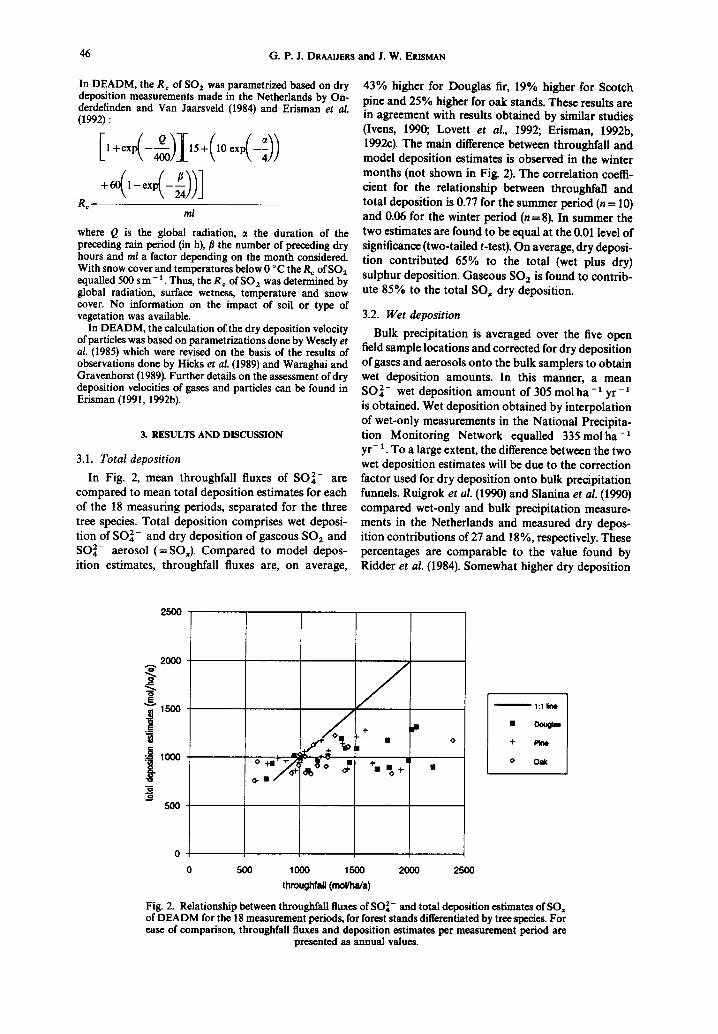
In Fig. 2, mean throughfall fluxes of SO~- are compared to mean total deposition estimates for each of the 18 measuring periods, separated for the three tree species. Total deposition comprises wet deposi- tion of SO~- and dry deposition of gaseous SO2 and SO~- aerosol ( = SOx). Compared to model depos- ition estimates, throughfall fluxes are, on average,
43% higher for Douglas fir, 19% higher for Scotch pine and 25% higher for oak stands. These results are in agreement with results obtained by similar studies (Ivens, 1990; Lovett et al., 1992; Erisman, 1992b, 1992c). The main difference between throughfall and model deposition estimates is observed in the winter months (not shown in Fig. 2). The correlation coeffi- cient for the relationship between throughfarl and total deposition is 0.77 for the summer period (n= 10) and 0.06 for the winter period (n = 8). In summer the two estimates are found to be equal at the 0.01 level of significance (two-tailed t-test). On average, dry deposi- tion contributed 65% to the total (wet plus dry) sulphur deposition. Gaseous SO2 is found to contrib- ute 85% to the total SOx dry deposition.
3.2. W e t deposi t ion
Bulk precipitation is averaged over the five open field sample locations and corrected for dry deposition of gases and aerosols onto the bulk samplers to obtain wet deposition amounts. In this manner, a mean SO 2- wet deposition amount of 305 mol ha - ~ yr - is obtained. Wet deposition obtained by interpolation of wet-only measurements in the National Precipita- tion Monitoring Network equalled 335molha -~ yr - ~. To a large extent, the difference between the two wet deposition estimates will be due to the correction factor used for dry deposition onto bulk precipitation funnels. Ruigrok et al. (1990) and Slanina et al. (1990) compared wet-only and bulk precipitation measure- ments in the Netherlands and measured dry depos- ition contributions of 27 and 18%, respectively. These percentages are comparable to the value found by Ridder et al. (1984). Somewhat higher dry deposition
2500
2O00
lSOO
. i looo
I u
5OO
<3-
/ +
*,, . . , . '
1:1 l i n t
• oouom
0 Oak
500 1000 1500 2000 2500
throughfafl (mol/ha/a)
Fig. 2. Relationship between throughfall fluxes of SO~- and total deposition estimates of SO~ of DEADM for the 18 measurement periods, for forest stands differentiated by tree species. For ease of comparison, throughfall fluxes and deposition estimates per measurement period are
presented as annual values.

Sulphur deposition estimates 47
contributions are recorded by Georgii et al. (1986) in Germany (34%) but considerable lower values by Grennfelt et al. (1985) in Sweden (5%), Mosello et al. (1988) in Italy (8%), Clark and Lambert (1987) in the United Kingdom (8%) and Richter and Lindberg (1988) in the U.S.A. (13%). Most probably, the amount of dry deposition onto bulk precipitation funnels will be influenced by the distance to sources and local circumstances, e.g. windshading effects around the funnels. To a smaller extent, differences between the two wet deposition estimates may be the result of the interpolation procedure used in the
National Precipitation Monitoring Network through which local sources (wash-out) and local shower pat- terns are neglected, and to the slightly different meas- urement protocols and analytical procedures applied.
3.3. Dry deposition
In Fig. 3a, mean net throughfall fluxes of SO 2- are compared to dry deposition estimates of SOx (SO2 + SO 2- particle) of DEADM for the 18 measurement periods. Throughfall data, suggest, on average, 47% higher dry deposition amounts compared to model estimates. In Fig. 4a, the spatial variability between
(a) asoo
2000
~ 1 5 0 0
lOOO
5OO O- •
J +
• + oP •
J I P
, +
500 1000 1500
net throughfall (tool/ha/a)
O,
2000 2500
~ l : l l k W
+ Pine
O Oak
(b) 2500
-i
J 0
+11
0
÷
0 0
"o +'~
-p
<>
d'o
• oou¢=
+ Pine
0 Oak
1:1 l ine
0 500 1000 1500 2000 2500
net thmughfall (mot/ha/a)
Fig. 3. Relationship between mean net throughfall fluxes of SO 2- and model dry deposition estimates of SOx (SO2 +SO~- aerosol) for the 18 measurement periods, for forest stands differentiated by tree species. (a) Original R, parametrization, (b) modified R c parametrization. For ease of comparison, throughfall fluxes and deposition estimates per measurement period
are presented as annual values.
=e,
2000
1 5 0 0
1000
5oo / 0
/ / /
500 1000 1500
net throughfall (moVha/a) 2000 2500
+ plno
o O ~
(b) 2soo
~ 2000
1500
IOO0
1 500
// / .
!B •
o
/ / 0 ,~0 1000 1500
nat throughfalt (molffm/a)
/
2000 2500
1:l line
+ Pine
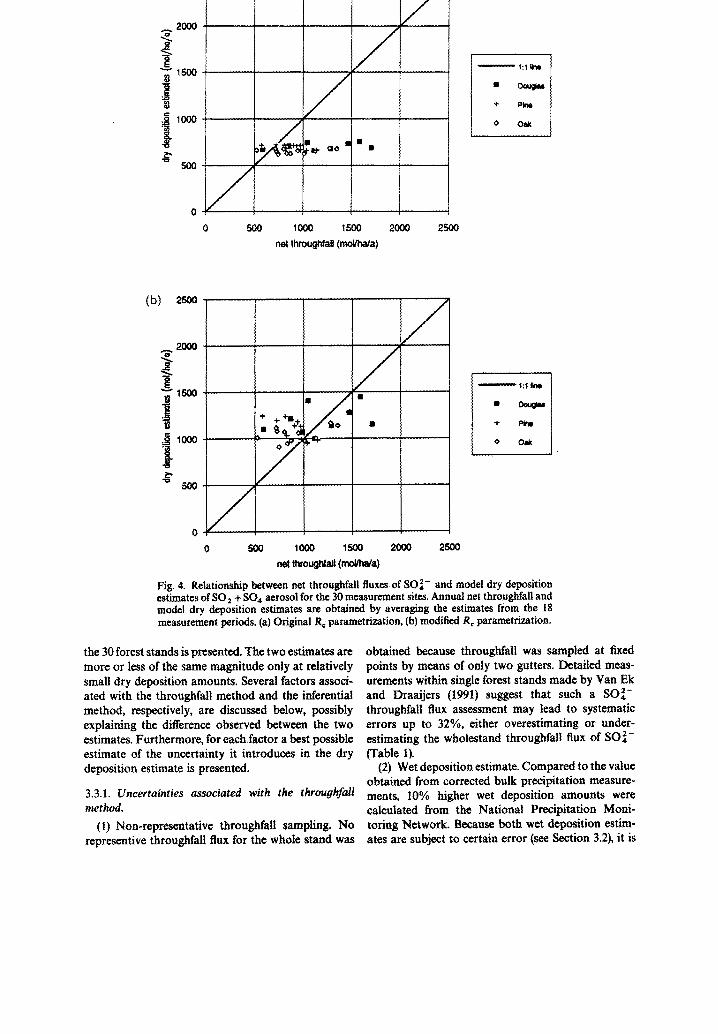
Fig. 4, Relationship between net throughfall fluxes of SOi- and model dry deposition estimates of SO 2 + SO, aerosol for the 30 me, asurement sites. Annual net throughfall and model dry deposition estimates are obtained by averaging the estimates from the 18 measurement periods. (a) Original Ro paramctrization, (b) modified Rc parametrization.
the 30 forest stands is presented. The two estimates are more or less of the same magnitude only at relatively small dry deposition amounts. Several factors associ- ated with the throughfall method and the inferential method, respectively, are discussed below, possibly explaining the difference observed between the two estimates. Furthermore, for eachfactor a best possible estimate of the uncertainty it introduces in the dry deposition estimate is presented.
3.3.1. Uncertainties associated with the throuahfail method.
(1) Non-representative throughfall sampling. No represcntive throughfali flux for the whole stand was
obtained because throughfall was sampled at fixed points by means of only two gutters. Detailed meas- urements within single forest stands made by Van Ek and Draaijers (1991) suggest that such a SO~- throughfaU flux assessment may lead to systematic errors up to 32%, either overestimating or under- estimating the wholestand throughfall flux of SO 2- (Table I).
(2) Wet deposition estimate. Compared to the value obtained from corrected bulk precipitation measure- merits, 10% higher wet deposition amounts were calculated from the National Precipitation Moni- toring Network. Because both wet deposition estim- ates are subject to certain error (see Section 3.2), it is
Sulphur deposition estimates 49
not clear which one should be preferred for the computation of net throughfall. By using the wet deposition flux from the National Precipitation Moni- toring Network, a 5% lower net throughfall flux would have been obtained (Table 1).
(3) Stemflow contribution. Stemflow was not meas- ured during the experiments. An underestimate of the deposition flux is made when considering only through- fall. An estimate of the contribution of stemflow to the total SO~- flux to the forest floor can be obtained from the literature. Ivens (1990) estimated for nine Douglas fir stands this contribution to be, on average, 5.9°,6. Van Breemen et al. (1988) reported, for two oak stands, a mean stemflow contribution of 8.0%. Nicholson et al. (1980) and Alcock and Morton (1981) measured for Scotch pine stands with extremely high stem density (4000 and 2500 trees ha - 1, respectively), stemflow contributions of 28.3 and 22.0%, respect- ively. Scotch pine stands used in this study had much lower stem densities (ranging from 400 to 1100 trees ha - 1), suggesting considerably lower stemflow contri- butions. For this reason, it can be concluded that by neglecting stemflow in this study, the total deposition to the forest floor is underestimated by approximately 15% at most (Table 1).
(4) Dry deposition to the forest floor. Dry depos- ition to the forest floor and undergrowth vegetation was neglected in this study. By considering only throughfall data, an underestimate of the total depos- ition to the forest floor is made. It can be hypothesized that the amount of dry deposition to the forest floor largely depends on below canopy air concentrations and wind speeds (turbulence intensities) and the struc-
ture of the forest floor. It is expected that in general, this flux is low because of the low air concentrations and low wind speeds usually found beneath forest canopies (Lovett and Lindberg, 1992). Although it is not possible to make a precise estimate, it is assumed that dry deposition to the forest floor contributes at most 10% to the total dry deposition to the forest in this study (Table 1).
(5) Dry deposition onto gutters. For a Douglas fir forest in the Netherlands, Slanina et al. (1990) made a comparison between throughfall fluxes measured with continuously open funnels and throughfall fluxes measured by means of wet-only collectors. The con- tinuously open funnels showed 12% higher SO 2- throughfall fluxes compared to the wet-only through- fall flux assessment. Richter and Lindberg (1988) found for a chestnut oak forest in a remote area in the U.S.A. negligible differences between continuously open and wet-only throughfall samplers. Most prob- ably, this difference will be a function of local SO2 and SO~- aerosol air concentrations and canopy struc- ture. In this study, instead of funnels, gutters were used which were regularly cleaned. For this reason, the contribution of dry deposition onto the gutters to the throughfall flux of SO~- is considered to be 10% at most (Table 1).
(6) Dry deposition of neutral salts. Dry deposition of sea salts (Na2SO4) and other neutral salts (e.g. C a S e 4 originating from unpaved roads) contribute to the throughfall flux of sulphate. In this paper, the emphasis is placed on deposition of acidifying com- ponents. Lack of ambient air concentrations of neutral sulphate-containing salts prevents making dry depos-
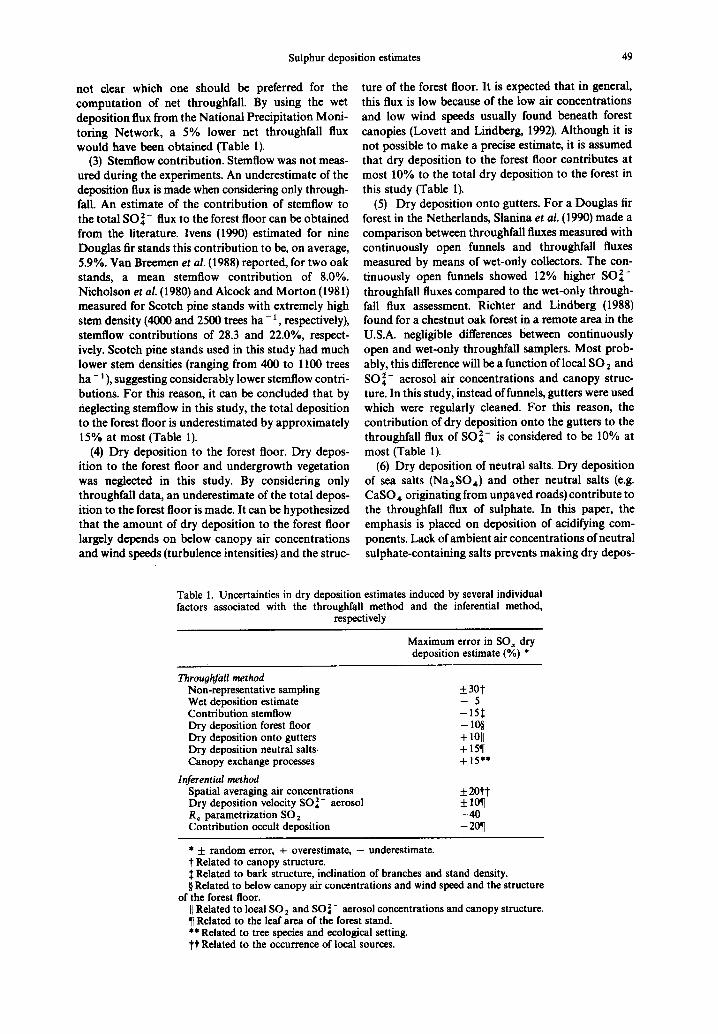
Table 1. Uncertainties in dry deposition estimates induced by several individual factors associated with the throughfall method and the inferential method,
respectively
Maximum error in SO~ dry deposition estimate (%) *
Throughfall method Non-representative sampling Wet deposition estimate Contribution stemflow Dry deposition forest floor Dry deposition onto gutters Dry deposition neutral salts. Canopy exchange processes
Inferential method Spatial averaging air concentrations Dry deposition velocity SO~- aerosol Rc parametrization SO2 Contribution occult deposition
_+ 30t - 5 -15t -10~ + 1011 + 15¶ +15"*
+20tt
-40 -20~
* + random error, + overestimate, - underestimate. Related to canopy structure. Related to bark structure, inclination of branches and stand density.
§ Related to below canopy air concentrations and wind speed and the structure of the forest floor.
B[ Related to local SO2 and SO~- aerosol concentrations and canopy structure. ¶ Related to the leaf area of the forest stand. ** Related to tree species and ecological setting. t'[" Related to the occurrence of local sources.
50 G.P .J . DRAAIJERS and J. W. ERISMAN
ition estimates using the inferential method. For this reason, the contribution of neutral salts to the through- fall flux had to be identified. The contribution of dry deposition of sea salt to the net through- fall flux of sulphate is estimated by assuming that the concentration ratio of SO~- to Na ÷ in throughfall is the same as in sea water (0.06 on a molar basis). The contribution of dry deposition of CaSO4 is estimated by assuming that 50% of all Ca 2 ÷ in throughfall originates from dry deposition of these particles. This percentage is based on measurements done by Slanina et al. (1983) which are discussed in Erisman (1992c). A correction is made for the contribution of foliar lea- ching to the throughfall flux of Ca2 + (Van Ek and Draaijers, 1991) and for the contribution of dry depos- ition of Ca 2÷ and Na ÷ to the funnels of the bulk samplers (Ridder et al., 1984). In this manner, the dry deposition of Na2SO4 and CaSO4 is estimated to contribute 5.7 and 4.1%, respectively, to the net throughfall flux of sulphate (Table 1). No reliable method is available for estimating the contribution of other sulphate-containing salts (e.g. MgSO 4 and K2SO4). However, it may be hypothesized that most Mg in net throughfall is derived from sea salt dry deposition (MgC12) or is associated with foliar lea- ching (Van Ek and Draaijers, 1991). Furthermore, nearly all K in net throughfall may be considered as derived from foliar leaching (Van Ek and Draaijers, 1991). It is assumed that the joint contribution of all sulphate-containing salts to the net throughfall flux of SO 2- did not exceed 15% (Table 1).
(7) Canopy exchange processes. SO2 is taken up by stomata to some extent. If part of the SO2 is retained in the foliage, this would result in an underestimate of dry deposition by measuring net throughfall. Field measurements and cuvette data of Gay and Murphy (1985) suggest that approximately 30-70% of the total dry-deposited SO2 may be retained in the canopy. However, Granat and H/illgren (1992) conclude that essentially all of the dry-deposited sulphur dioxide retained in the canopy is eventually extracted by rain and appears in throughfall but it has been found difficult to distinguish between SO 2- taken up by roots and SO42- formed by stomatal uptake of SO2 (Schaefer and Reiners, 1990). Based on 35S experi- ments, Garten et al. (1988) and Lindberg et al. (1990) conclude that foliar leaching of soil-derived SO 2- may contribute at most 10% to the net throughfall of sulphate in heavily SO2 polluted areas. These results cannot be generalized to other situations without due consideration. Different tree species growing in differ- ent ecological settings probably respond differently with respect to canopy exchange. Furthermore, insect plagues, algae and diseases might enhance canopy leaching. Van Ek and Draaijers (1991) showed that pollen and algae did not change throughfall composi- tion significantly in this study. However, an infection with Microshaera aliphilitoides in the oak stands dur- ing the summer may have enhanced canopy leaching of SO~- to some extent. Also during the sprouting of
the leaves in spring, some enhanced SO~- leaching occurred in the oak stands (Van Ek and Draaijers, 1991). It is concluded that in this study, foliar leaching of soil-derived SO4 contributed at most 15% to the net throughfall flux of sulphate, and that irreversible uptake of SO 2 was negligible (Table 1).
Uncertainties associated with the throughfall method are found to act both ways to approximately the same extent (Table 1): dry deposition onto through- fall gutters, dry deposition of neutral salts and canopy exchange processes resulting in an overestim- ate of dry deposition of (acidifying) SOx, and the wet deposition estimate, the omission of stemflow and the omission of dry deposition to the forest floor resulting in a dry deposition underestimate. For this reason, it is concluded that uncertainties associated with the throughfall method cannot explain the systematic differences observed between throughfall and inferen- tial dry deposition estimates.
3.3.2. Uncertainties associated with the inferential method.
(1) Spatial averaging of SO2 and SO4 concentra- tions. In the inferential method, air concentrations of SO2 and SO4 aerosol at the measurement sites are calculated via extrapolation and interpolation proced- ures. A comparison between measured concentrations above a forest and interpolated values showed very good agreement and Erisman (1992a, 1992c) estimated the uncertainty associated with extrapolation and interpolation errors to be at most 20% (Table 1). The contribution of local sources to the overall air concen- trations of SO2 and SO 2- aerosol is supposed to be negligible: local sources of some importance might have been the burning of sulphur-containing fuels by traffic and by space heating, but no relationship was observed between sulphate net throughfall fluxes and the distance to the nearest road or built-up area (Van Ek and Draaijers, 1991).
(2) Parametrization of the dry deposition velocity of SO 42- aerosol. In the inferential method, the yearly mean dry deposition velocity for sulphate aerosol approximates 0.7 cm s - t. Sulphate aerosols are found to contribute, on average, less than 15% to the total deposition of SOx in this study. For this reason, the uncertainty in the dry deposition velocity of SO~- aerosol, which amounts to 50% according to Erisman (1991), contributes only to a small extent to the overall uncertainty of the SOx dry deposition estimate by inference (Table I).
(3) R c parametrization of SO 2. The average R c value for the 18 measuring periods is about 60 s m - 1. The Re parametrization for SO2 in the model is based on dry deposition experiments (mainly over grassland) in the Netherlands. The parametrization is independ- ent of receptor characteristics. Recent measurements made over a grassland and a heathland show that in a neutral or alkaline environment the R c of SO2 is negligible if the surface is wet (Erisman et al., 1992; Erisman and Wyers, 1992). Surface wetness is found to

Sulphur deposition estimates 51
occur during and after rain or fog events and at relative humidities (r.h.) above 80-90%. A clear de- pendence was observed between the R c of SO 2 and the ambient relative humidity (Erisman and Wyers, 1992). These results are used here for studying the sensitivity of the model, and the effect on the results of the comparison with throughfall, i.e. the paramet- rization of R~ was extended by assuming R c =0 at r.h. >90%. Relative humidities were obtained from hourly-based measurements from the Dutch Royal Meteorological Institute (KNMI, 1991).
In Fig. 3b, the new dry deposition estimates using this parametrization are plotted against net through- fall fluxes for the 18 measuring periods. Fairly good agreement is found between the two quantities (r = 0.67), both estimates being equal at the 0.002 level of significance. The average Rc value for the 18 measuring periods amounts to 5 s m - ~. The correla- tion coefficient between net throughfall and model dry deposition estimates amounts to 0.91 for the summer period and 0.62 for the winter period. In summer, the two quantities are equal at the <0.001 level of signifi- cance; in winter at the 0.1 level of significance. Con- sequently, it can be concluded that when the Re parametrization of SO2 is modified, the initial ob- served gap between net throughfall fluxes of SO 2- and model dry deposition estimates of SOx is, to a large extent, eliminated.
In Fig. 4b, the relationship between net throughfall and model dry deposition estimates is presented using the modified Rc parametrization. Although both es- timates are found to be equal at the 0.06 level of significance, only reasonable agreement is observed (r = 0.35). The relationship between the two quantities is found to be far better in the winter period (r=0.71) in comparison with the summer period (r =0.01). The spatial variation of net throughfall appeared to be much larger than that of dry deposition estimates, suggesting that the model underestimates dry depos- ition at high deposition amounts and overestimates dry deposition at low deposition amounts. Dry depos- ition of gases and aerosols is found to be related to the leaf area of a forest stand (e.g. Wiman and Agren, 1985; Meyers et al., 1989). The same holds true for occult deposition (Lovett and Reiners, 1986). However, the impact of leaf area is only indirectly (via crown coverage) represented in the roughness length com- putation and not taken along in the R~ parametriza- tion of SO 2. Occult deposition is even omitted by the model. This might explain the relatively small spatial variability found in the model dry deposition estim- ates. The larger spatial variability in net throughfall fluxes may partly be induced by canopy exchange processes which are believed to be related also to the leaf area of forest stands, and to non-representative throughfall sampling.
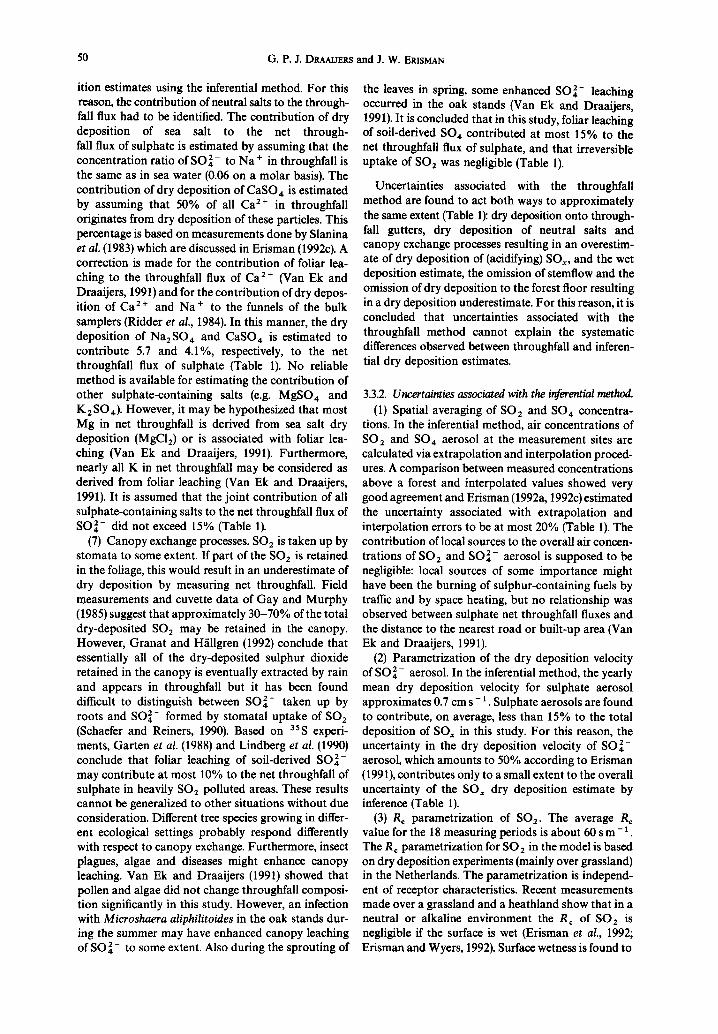
With an annual mean surface resistance near zero, dry deposition of SO 2 should strongly relate to the aerodynamic roughness of the canopy. In Fig. 5, relationships are presented between the roughness
length (z 0) of the 30 measurement sites, and annual net throughfall fluxes, respectively model dry deposition estimates. Reasonable agreement is observed (r = 0.58 and 0.69, respectively), net throughfall fluxes and model dry deposition estimates showing similar varia- tions with z o. In the winter period almost linear relationships are observed (r = 0.71 and 0.998, respect- ively), indicating that in this period dry deposition of SO2 is determined aerodynamically with negligible surface resistance. This can be explained by the high relative humidities in the Netherlands which seldom drop below 80-90% in the winter period (KNMI, 1991). In summer, relationships between Zo and net throughfall, respectively model dry deposition estim- ates are much weaker (r = 0.30 and 0.26, respectively), indicating that processes other than aerodynamic pro- cesses determine dry deposition amounts of SO2. Prob- ably, the R c parametrization should be expanded with receptor-specific information to obtain better model SO 2 dry deposition estimates in the summer period.
(4) Occult deposition. Cloud and fog water (occult) deposition is not taken into account in the model. Up to now it was assumed that in the Netherlands occult deposition is of minor importance relative to wet and dry deposition (Slanina et al., 1990; Rfmer et al., 1990; Van Aalst and Erisman, 1990). However, through their large receptor surface, forests might be an effective receptor for fog and cloud water. Forest stands with large receptor surface areas, especially, might receive a relatively large additional input. To make a rough estimate of the potential magnitude of occult sulphate deposition to the 30 forest stands, it is assumed tl~at during 1 h of fog, approximately 10 ml fog water per square metre leaf area is deposited (Eiden, 1989). Fog with a visibility smaller than 500 m is found to occur 270 h during the total measurement period, i.e. 1 year (KNMI, 1991). The average SO 2- concentration in fog droplets in the Netherlands is 1500#mole -1 (Slanina et al., 1990). Assuming a linear relationship between LAI and occult deposition, occult sulphate deposition can be calculated to be on average 270 mol ha - 1 yr - 1, ranging from 100 mol ha - 1 yr - 1 at LAI = 2.4 to approximately 490 mol ha - ~ yr - ~ at L A I = 12.0. Lovett and Reiners (1986) found a uni- modal relationship between LAI and the deposition velocity of cloud droplets. Decreasing deposition velo- cities at high LAI values were attributed to reduced turbulent exchange and in-canopy wind speeds. This observation suggests that our estimates for occult deposition to forests with high leaf area may be a little too high.
Unsworth and Wilshow (1989) published a model in which occult deposition is calculated using informa- tion on aerodynamic properties of the receptor sur- face, wind speed, liquid water content and cloudwater chemistry. KNMI (1991) published observations on hourly weather type at several locations in the Nether- lands. The Unsworth and Wilshow (1989) model is applied for each hour for which fog occurred accord- ing to KNMI. In this way, a stand-dependent average

52 G.P.J. DRAALIERS and J. W. ERISMAN
(a) 2OOO
A
i 1000 I
0.5
E • |
1.5
Zo (s)
2.5
(b) 2000
1000
i ~,soo
• q l r • | •
0 0 0.5 1.5 2 2.5
Zo (=)
Fig. 5. Relationship between roughness length (Zo) and (a) mean net throughfaU fluxes and (b) model dry deposition estimates (with the modified Rc parametrization).
deposition velocity for fog is calculated during the measuring period, i.e. 1 year. By taking a mean liquid water content of 0.1 g m - 3 and a mean SO, concen- tration of 1500 pmol d - 1, an occult deposition flux of 50-170 tool SO4 h a - t y r - t is calculated, depending on Zo. The temporal variation of occult deposition cannot be estimated because of lack of information on the temporal variability of liquid water content and fog composition. In the Netherlands, occult depos- ition occurs mainly in the winter months (KNMI, 1991).
The calculated SO4 input by occult deposition depends strongly on the water flux to the forest canopy and the average fog composition. Two differ- ent approaches lead to a difference in the occult deposition estimate of a factor of two. This reflects the large uncertainty related to estimates of occult depos- ition to forests. On the other hand, estimates show that occult deposition is a significant input of SO4 to our forests, being about 10-20% of the dry deposition flux of SO x.
In Table 1, uncertainties associated with the inferen- tial method are summarized. Uncertainties induced by
the parametrization of the dry deposition veloc)ty of SO, 2- aerosol and the spatial averaging of ai~oncen- trations of SO2 and SO, 2- aerosol wer~ relatively small, resulting in either dry deposition underestima- tes or overestimates. Applying a modified R~ para- metrization and taking along occult deposition sys- tematically enhanced sulphur deposition estimates of the inferential method, through which the initial ob- served difference between throughfall and inference dry deposition estimates was completely eliminated.
4. CONCLUSIONS
Wet deposition estimates of sulphate from bulk samplers in the vicinity of the measurement sites, using correction factors for dry deposition directly onto the funnels, are found to be somewhat lower compared to interpolated estimates from wet-only samplers from the National Precipitation Monitoring Network. Dif- ferences are caused by the chosen correction factors

Sulphur deposition estimates 53
for dry deposition onto bulk samplers, by the inter- polation procedure used in the National Precipitation Monitoring Network, and by the measurement pro- tocols and analytical procedures applied.
Throughfall data suggest approximately 50% higher dry deposition amounts compared to model estimates. Dry deposition estimates of (acidifying) sulphate from throughfall data are found to be ob- scured through uncertainties associated with non- representive throughfall sampling, estimating wet de- position, the omission of stemflow fluxes and dry deposition directly to the undergrowth vegetation and forest floor, dry deposition directly onto the through- fall gutters, dry deposition of neutral salts, and canopy exchange processes. However, these uncertainties are found to act in opposing directions to approximately the same extent.
For the inferential method, uncertainties primarily arise in the calculation of the deposition velocity of SO 2. To a smaller extent, uncertainties arise in the calculation of the deposition velocity of SO 2- aerosol and the spatial averaging of air concentrations of SO2 and SO 2- aerosol. The major source of error is the specification of the surface resistance of SO2 and the omission of occult deposition. Based on results from recent dry deposition measurements of SO2 made over heather in the Netherlands (Erisman and Wyers, 1992) the R c parametrization is modified, i.e. includ- ing Rc = 0 at relative humidities over 90%. By modi- fying the R c parametrization of SO 2, better results in the comparison between model dry deposition estim- ates and net throughfall fluxes are obtained.
In the winter period, a clear relationship between dry deposition and the roughness length of the forest stand is observed, indicating dry deposition of SO 2 being determined aerodynamically, with negligible surface resistance. In summer, this relationship is much weaker, suggesting aerodynamic processes be- ing of less importance. In this period, better agreement between model dry deposition estimates and net throughfall fluxes will be obtained if the impact of the vegetation type and leaf area on the surface resistance of SO 2 and canopy exchange are taken along.
Up to now, occult deposition of sulphate is only found to be significant in forests at altitudes above approximately 400 m above sea level (Fowler et al., 1991; Lovett and Kinsman, 1990; Joslin and Wolfe, 1992). However, this research indicates that occult deposition may also contribute significantly to the total deposition to lowland forest ecosystems, espe- cially to forests with large receptor surface areas. Improving inferential deposition modelling, therefore, requires the incorporation of an occult deposition module in DEADM.
Both the modified R c parametrization and the incorporation of occult deposition lead to much higher sulphur deposition estimates by the model compared to model estimates made in the past. This implicates that sulphur deposition to Dutch forest ecosystems may have been underestimated up to now.
Acknowledgements--The authors are indebted to the follow- ing people who made valuable comments on a draft version of this paper: Dr Remco Van Ek, Department of Physical Geography of the University of Utrecht; Dr Frank de Leeuw, National Institute of Public Health and Environmental Protection; and Dr Wilfried Ivens, Department of Natural Sciences of the Open University.
REFERENCES
Alcock M. R. and Morton A. J. (1981) The sulphur content and pH of rainfall and throughfall under pine and birch. J. appl. Ecol. 18, 835-839.
Asman W. A. H. and Van Jaarsveld H. A. (1990) A variable- resolution model applied for ammonia and ammonium. Report 228471007, National Institute of Public Health and Environmental Protection, the Netherlands.
Cape J. N., Sheppard L. J., Fowler D., Harrison A. F., Parkinson J. A., Dao P. and Paterson I. S. (1992) Contribu- tion of canopy leaching to sulphate deposition in a Scotch pine forest. Envir. Pollut. 75, 229-236.
Clarke A. G. and Lambert D. R. (1987) Local factors affecting the chemistry of precipitation. In Acid Rain: Scientific and Technical Advances (edited by Perry R., Harrison R. M., Bell J. N. B. and Lester J. N.). Selpter, London.
Davidson C. I. and Wu Y. L. (1990) Dry deposition of particles and vapors. In Acid Precipitation: Sources, Depos- ition and Canopy Interactions (edited by Lindberg S. E., Page A. L. and Norton S. A.).Springer, Berlin.
Draaljers G. P. J., Van Ek R., Bieuten W. and Meijers R. (1991) Measuring and modelling atmospheric dry depos- ition in complex forest terrain. Conf. Acidification Re- search: Evaluation and Policy Applications, Maastricht, 14-17 October.
Draaijers G. P. J., Van Ek R. and Meijers R. (1992) Research on the impact of forest stand structure on atmospheric deposition. Envir. Pollut. 75, 243-249.
Eiden R. (1989) Air pollution and deposition. In Ecological Studies (edited by Schulze E. D., Lange O. L. and Oren R.), Vol. 77. Springer, Berlin,
Erisman J. W. (1990) Estimates of the roughness length at Dutch Air Quality Monitoring stations and on a.grid basis over the Netherlands. Report 723001003, National In- stitute of Public Health and Environmental Protection, the Netherlands.
Erisman J. W. (1991) Acid deposition in the Netherlands. Report 723001002, National institute of Public Health and Environmental Protection, the Netherlands.
Erisman J. W. (1992a) Acid deposition in the Netherlands; part I. Methods and results. Wat. Soil Air Pollut. (sub- mitted).
Erisman J. W. (1992b) Acid deposition in the Netherlands; part II. Throughfall measurements compared to depos- ition estimates. Wat. Air Soil Pollut. (submitted).
Erisman J. W. (1992c) Atmospheric deposition of acidifying compounds in the Netherlands. Ph.D. thesis, Faculty of Physics and Astronomy, University of Utrecht, the Netherlands.
Erisman J. W., Versluis A. H., Verplanke T. A. J. W., De Haan D., Elzakker D. and Van Aalst R. M. (1992) Monitoring the dry deposition of SO2 in the Netherlands. Atmospheric Environment (in press).
Erisman J. W. and Wyers G. P. (1992) On the interaction between deposition of SO 2 and NH 3. Atmospheric Envir- onment (submitted).
Fowler D., Duyzer J. H. and Baldocchi D. D. (1991) Inputs of trace gases, particles and cloud droplets to terrestrial surfaces. Proc. R. Soc. (Edin.) 97B, 35-59.
Garland J. A. (1977) Dry and wet removal of sulfur from the atmosphere. Atmospheric Environment 12, 349.
54 G.P . J . DRAAIJERS and J. W. ERISMAN
Garten C. T., Bondietti E. A. and Lomax R. D. (1988) Contribution of foliar leaching and dry deposition to sulphate in net throughfall below deciduous trees. Atmo- spheric Environment 22, 1425-1432.
Gay D. W. and Murphy C. E. (1985) The deposition of SO 2 on forests. Final report, EPRI project RP 1813-2, Electric Power Research Institute, Pale Alto, CA.
Georgii H. W., Grosch S. and Schmitt G. (1986) Assessment of dry and wet pollutant deposition to forests in the Federal Republic of Germany. Final report, part A, In- stitute ffir Meteorologie und Geophysik, J. W. Goethe Universit/it, Frankfurt, F.R.G. (in German).
Granat L. and H/illgren J. E. (1992) Relation between estim- ated dry deposition and throughfall in a coniferous forest exposed to controlled levels of SO 2 and NO 2. Envir. Pollut. 75, 237-242.
Grennfeit P., Larsson S., Leyton P. and Olsson B. (1985) Atmospheric deposition in the Lake G/irdsj6n area, SW Sweden. Ecol. Bull. 37, 101-108.
Hetteling J. P., Downing R. J. and De Smet P. A. M. (1991) Mapping critical loads for Europe. Report 259101001, Coordination Center for Effects, National Institute of Public Health and Environmental Protection, Bilthoven, the Netherlands.
Hicks B. B., Draxler R. R., Albritton D. L., Fehsenfeld F. C., Hales J. M., Meyers T. P., Vong R. L., Dodge M., Schwarz S. E., Tanner R. L., Davidson C. I., Lindberg S. E. and Wesely M. L. (1989) Atmospheric processes research and processes model development. State of ScienCe/Technol- ogy report 2, National Acid Precipitation Assessment Program.
Ivens W. P. M. F. (1990) Atmospheric deposition onto forests. Ph.D. thesis, Department of Physical Geography, University of Utrecht, the Netherlands.
Johnson D. W. and Lindberg S. E. (1992) Atmospheric Deposition and Forest Nutrient Cycling Results of the Integrated Forest Study. Springer, New York. \
Joslin J. D. and Wolfe M. H. (1992) Tests of the use of ~ t throughfall sulfate to estimate dry and occult sulfur depoS, ition. Atmospheric Environment, 26A, 63-72.
KNMI (1991) Information obtained from the Royal Meteorological Institute of the Netherlands.
Lindberg S. E., Lovett G. M., Knoer K. and Ragsdale H. (1990) The Integrated Forest Study: atmospheric depos- ition and canopy interactions of sulphur, nitrogen and cations. NAPAP 1990 Int. Conf. Acidic Deposition: State of Science and Technology, Hilton Head Island, U.S.A.
Lovett (3. M. and Kinsman J. D. (1990) Atmospheric pollu- tant deposition to high-elevation ecosystems. Atmospheric Environment 24A, 2767-2786.
Lover (3. M. and Lindberg S. E. (1992) Concentration and deposition of particles and vapors in a vertical profile through a forest canopy. Atmospheric Environment 26A, 469-1476.
Lover G. M. and Reiners W. A. (1986) Canopy structure and cloud water deposition in subalpine coniferous forests. Tellus 38B, 319-327.
Lover G. M., Likens G. E. and Nolan S. S. (1992) Dry deposition of sulphur to the Hubbard Brook experimental forest: a preliminary comparison of methods. In Pre- cipitation Scavenging and Atmosphere-Surface Exchange (edited by Schwartz S. E.). Hemisphere, New York (in press).
Meyers T. P., Huebert B. J. and Hicks B. B. (1989) HNOa deposition to a deciduous forest. Boundary-Layer Met. 49, 395-410.
Meijers R. (1990) Parametrization of the structure of Dutch nature areas (in Dutch). Department of Physical Geo- graphy, University of Utrecht, the Netherlands.
Mosello R., Marchetto A. and Tartari G. A. (1988) Bulk and wet atmospheric deposition chemistry at Pallanza (Italy). Wat. Air Soil Pollut. 42, 137-151.
Nicholson I. A., Cape N., Fowler D., Kinnaird J. W. and Paterson I. S. (1980) Effects of a Scotch pine (Pinus sylvestris L.) canopy on the chemical composition and deposition pattern of precipitation. In Ecological Impact of Acid Precipitation (edited by Drabi6s D. and Tollan A.). SNSF project, Norway.
Nilsson J. and Grennfelt P. (1988) Critical loads for sulphur and nitrogen. Report from Workshop in Skokloster, Swe- den, NORD 1988:15, Nordic Council of Ministers, Solna, Sweden.
Onderdelinden D. and Van Jaarsveld J. A. (1984) Measuring sulphur deposition in the Netherlands (in Dutch). Report 842017001, National Institute of Public Health and Envir- onmental Pollution, the Netherlands.
Parker G. G. (1983) Throughfall and stemflow in the forest nutrient cycle. Adv. Ecol. Res. 13, 58-120.
Richter D. D. and Lindberg S. E. (1988) Wet deposition estimates from long term bulk and event wet-only samples of incident precipitation and throughfali. J. Envir. Qual. 17, 619-622.
Ridder T. B., Baard J. H. and Buishand T. A. (1984) The impact of sample strategy and analysis protocol on con- centrations in rainwater (in Dutch). Technical report TR-55, Royal Meteorological Institute of the Netherlands.
RIVM (1991) Jaarverslag luchtkwaliteit 1990. Report 222101006, National Institute of Public Health and Envir- onmental Protection, Bilthoven, the Netherlands.
R6mer F. (3, Te Winkel B. H., Ruigrok W., Stecnkist R. and Van Wakeren J. H. A. (1990) The chemical composition of dew and the deposition flux of water vapour: field measure- ment and modelling. Final report 50583-MOC90-3411, KEMA, Arnhem, the Netherlands.
Ruijgrok W., Visser H., and R6mer F. (3. (1990) Comparison of bulk and wet-only samplers for trend detection in wet deposition. Int. Workshop on Cloud Chemistry and Wet Deposition, Utrecht, the Netherlands 10-12 April.
Schaefer D. A. and Reiners W. A. (1990) Throughfall chemis- try and canopy processing mechanisms. In Acid Depos- ition, Vol 3: Sources, Deposition and Canopy Interactions (edited by Lindberg S. E., Page A. L. and Norton S. A.). Springer, New York.
Slanina J., Romer F. G. and Asman W. A. H. (1983) Investiga- tion of the source regions for acid deposition in the Netherlands. In Prec. CEC Workshop on Physico-chemical Behaviour of Atmospheric Pollutants, Berlin, 9 September 1982.
Slanina J., Keuken M. P., Arends B., Veltkamp A. C. and Wyers (3. P. (1990) Report on the contribution of ECN to the second phase of the Dutch Priority Programme on Acidification. ECN, Petten, the Netherlands.
Swaan P. and Buijsman E. (1991) Measurements in the National Air Quality Monitoring Network (in Dutch). Report 222104006, National Institute of Public Health and Environmental Protection.
Unsworth M. H. and Wilshaw J. C. (1989) Wet, occult and dry deposition of pollutants on forests. Agric. For. Met. 47, 221-238.
Van Aalst R. M. and Erisman J. W. (1990) Atmospheric input. In Acidification Research in the Netherlands (edited by Heij G. J. and Schneider T.), Studies in Environmental Science 46. Elsevier, Amsterdam.
Van Br¢cmen N., Visser W. F. J. and Pape Th. (1988) Biogeochemistry of an oak-woodland ecosystem in the Netherlands affected by acid deposition. Agricultural Research Report 930, Pudoc, Wageningen, the Nether- lands.
Van Ek R. and Draaijers (3. P. J. (1991) Atmospheric deposition in relation to forest stand structure. Report 1991-01 AD, Department of Physical Geography, Univer- sity of Utrecht, the Netherlands.
Waraghal A. and Gravenhorst (3. (1989) Dry deposition of atmospheric particles to an old spruce stand. In Mech-

Sulphur deposition estimates 55
anisms and Effects of Pollutant-transfer into Forests (edited by Georgii H. W.), pp. 77-86. Kluwer, Dordrecht.
Wesely M. L. and Hicks B. B. (1977) Some factors that affect the deposition rates of sulphur dioxide and similar gases on vegetation. Air Poilut. Control Ass. 27, 1110-1116.
Wesely M. L., Cook D. R. and Hart R. L. (1985) Measure-
ments and parametrization of particulate sulphur dry deposition over grass. J. oeophys. Res. 90, 2131-2143.
Wiman B. L. B. and Agren G. I. (1985) Aerosol depletion and deposition in forests--a model analysis. Atmospheric En- vironment 19, 335-347.
~(A) 27:1-~