Embed Size (px)
Citation preview

Atmospheric Neutrino Oscillations in Soudan 2
Peter Litchfield
For the Soudan 2 Collaboration
Neutrino and background data
Azimuthal, zenith and L/E distributions
Bin-free likelihood analysis
Feldman-Cousins analysis for confidence limits on m2 and sin22
Results submitted to Phys Rev D and more details in hep-ex/0307069
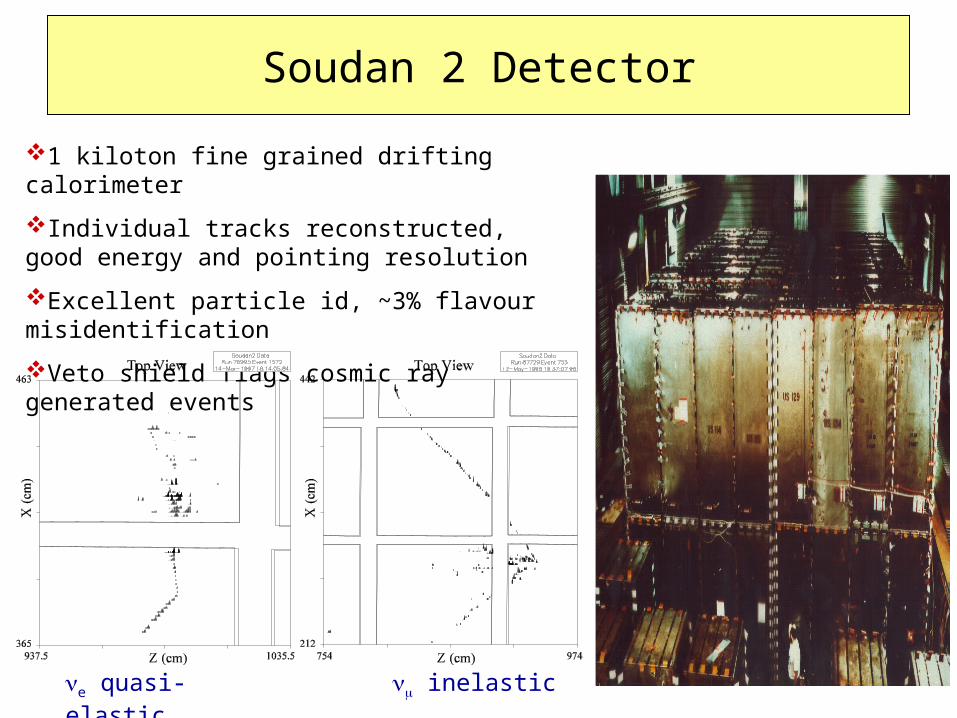
Soudan 2 Detector
1 kiloton fine grained drifting calorimeter
Individual tracks reconstructed, good energy and pointing resolution
Excellent particle id, ~3% flavour misidentification
Veto shield flags cosmic ray generated events
e quasi-elastic inelastic

Data Sets
5.90 kiloton years of data taken between 1989 and 2001. 488 contained and partially contained and e candidate events with
no activity in the surrounding veto shield. 516 contained events with in time shield activity, produced by
secondary neutrons and gammas from cosmic ray muon interactions. Used to simulate the background in the neutrino events.
3624 MC neutrino events generated using the Bartol 96 flux and the NEUGEN neutrino event generator, inserted in the data stream and processed identically to the data events.
Data divided into; high resolution sample (high energy events with reconstructed
recoil protons and pions) which have good pointing accuracy The rest, low energy, low resolution sample.

Backgrounds
Neutrino events distinguished statistically from neutron and gamma events via the depth distribution in the detector
Background depth distribution represented by the shield tagged sample, neutrino by the MC
Neutron interaction length ~80cm, gamma conversion length ~15cm
Backgrounds dependent on event energy and topology
Data divided into 6 samples and fraction of background fitted independently in each.
~10% overall background
MC+background
MC Background

Zenith and Azimuthal Angles
Oscillation probability
High resolution events L depends only on the zenith
angle, not the azimuthal angle e-flavor events agree with the
MC prediction up to a normalization factor
-flavor events show a zenith angle dependent depletion
Soudan is near the magnetic pole; no geomagnetic azimuthal dependence
E
LmP 222 27.1sin2sin
Unoscillated MC+background
Best fit oscillation parameters +background
Background contribution

L/E distribution
High resolution events e-flavor events follow the MC
prediction up to a ~90% normalization factor
-flavor events show a depletion above log10(L/E) of ~ 1.5
Consistent with neutrino oscillations with m2<~0.025 eV2
Unoscillated MC+background
Best fit oscillation parameters +background
Background contribution

Likelihood Analysis
Data assumed to be represented by the sum of MC neutrino events, weighted by the oscillation probability plus background represented by the shield tagged events
Bin-free likelihood analysis performed. Likelihood given by (d = depth)
Shape factor Q given by
k sums taken over the different data sets, background fraction fitted independently in each
X is a pdf describing the L/E distributions and containing the oscillation probability for the neutrino events
D is a pdf describing the depth distribution
eee1,5k N1,i
kkkii
k MMNMMNdELQLk
lnln),/(ln
)()/()()2sin,,/(1
, 22i
kR
kR
kRi
kkkkii
k dDELXNdDmELXACM
dxQ

Likelihood results
Likelihood calculated on a 15x80 grid of sin22, log10m2
Difference (L) from best likelihood plotted.
No oscillations gives a likelihood rise of 11.3
Best likelihood sin22=0.97 m2=0.0052 Normalization of MC relative
to Bartol 96=0.91 Fraction of background=9.6%

Feldman-Cousins analysis
Proposed by Feldman and Cousins for the calculation of confidence levels to allow for statistics, systematic errors, physical constraints and any biases in the analysis procedure.
At each grid square MC experiments are generated and analyzed just like the data.
Neutrino events and background events are incorporated at each grid square according to the fitted amounts at that square in the data
Systematic effects are incorporated into the MC experiments.
For the uncertainty in energy calibration
For the uncertainty in the neutrino flux as a function of energy
For the uncertainty in the /e flux ratio
For the uncertainty in the neutrino cross-sections

Feldman-Cousins analysis
1000 experiments generated at each grid point and the difference between the best fit likelihood and the likelihood at the generated grid square (LMC)
histogramed.
This is the likelihood distribution expected if the truth was at this grid square
The likelihood containing 90% of the MC experiments (L90) is obtained. If the data likelihood is less than L90 the point is within the 90% confidence region.
The probability of the no oscillation hypothesis is given by the fraction of experiments at the no oscillation grid square with likelihood > data likelihood (5.8x10⁻⁴)
“no oscillation” (min m2,sin22)
100000 experiments

L90 surface
Shape is mostly a function of the background and Monte Carlo normalization fitting.
Some contribution from the systematic effects on the neutrino flux, neutrino cross-sections and detector energy calibration
L90 is significantly greater than 2.3 over most of the surface

Confidence regions
68%,90% and 95% confidence level contours are plotted
The 90% sensitivity (defined as the 90% confidence contour calculated from the MC experiments) is slightly bigger than the data 90% contour, more corresponding to the 95% contour. Due to the data electron and muon best normalisation being slightly different.
The contour defined by a 2.3 rise in data likelihood corresponds closely to the 68% Feldman-Cousins confidence level contour

Comparison with other experiments
There is excellent agreement at the 90% level between Soudan 2, Super-K and MACRO.
At the 68% confidence level Soudan 2 prefers the lower part of the Super-K allowed region
The 3-d Battistoni prediction for the neutrino flux gave very similar results for the confidence regions but required a normalization factor of 1.05 to be compared with 0.91 for the Bartol 96 calculation

Summary
Soudan 2 observes a depletion of the atmospheric flux, consistent with oscillations.
A bin-free likelihood analysis has been carried out using the Feldman-Cousins prescription.
The probability of the no oscillation hypothesis is 5.8x10⁻⁴.
The 90% confidence level contours in the sin22,m2 plane are consistent with those found by Super-K and MACRO.
This is the first experiment to confirm the Super-K results on fully reconstructed neutrino events covering the full angular and L/E range.
Soudan 2 is a drifting iron calorimeter at a different site to the Super-K water cherenkov. All detector based systematics are quite different.
The excellent agreement is a strong confirmation that neutrino oscillations, and thus neutrino mass, exist