Embed Size (px)
Citation preview
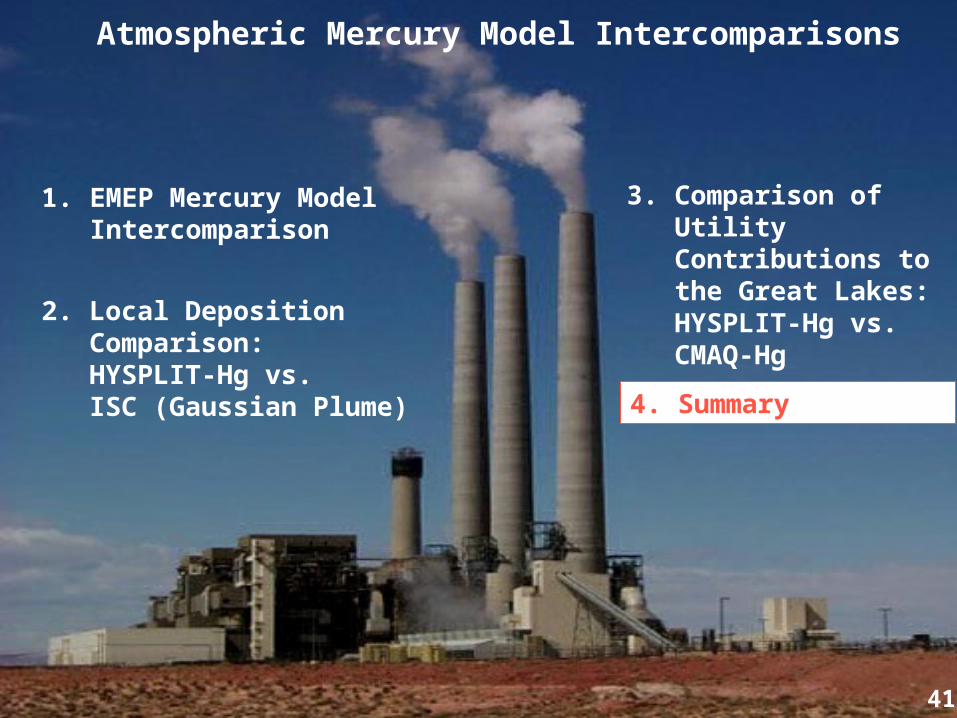
Atmospheric Mercury Model Intercomparisons
Presentation atCollaborative Meeting on Modeling Mercury
in Freshwater Environments Niagara Falls, NY, January 19-20, 2006
Dr. Mark CohenNOAA Air Resources Laboratory
1315 East West Highway, R/ARL, Room 3316
Silver Spring, Maryland, [email protected]
http://www.arl.noaa.gov/ss/transport/cohen.html
2. Local Deposition Comparison:HYSPLIT-Hg vs.ISC (Gaussian Plume)
Atmospheric Mercury Model Intercomparisons
3. Comparison of Utility Contributions to the Great Lakes:HYSPLIT-Hg vs. CMAQ-Hg
4. Summary
2
1. EMEP Mercury Model Intercomparison
2. Local Deposition Comparison:HYSPLIT-Hg vs.ISC (Gaussian Plume)
Atmospheric Mercury Model Intercomparisons
3. Comparison of Utility Contributions to the Great Lakes:HYSPLIT-Hg vs. CMAQ-Hg
4. Summary
3
1. EMEP Mercury Model Intercomparison
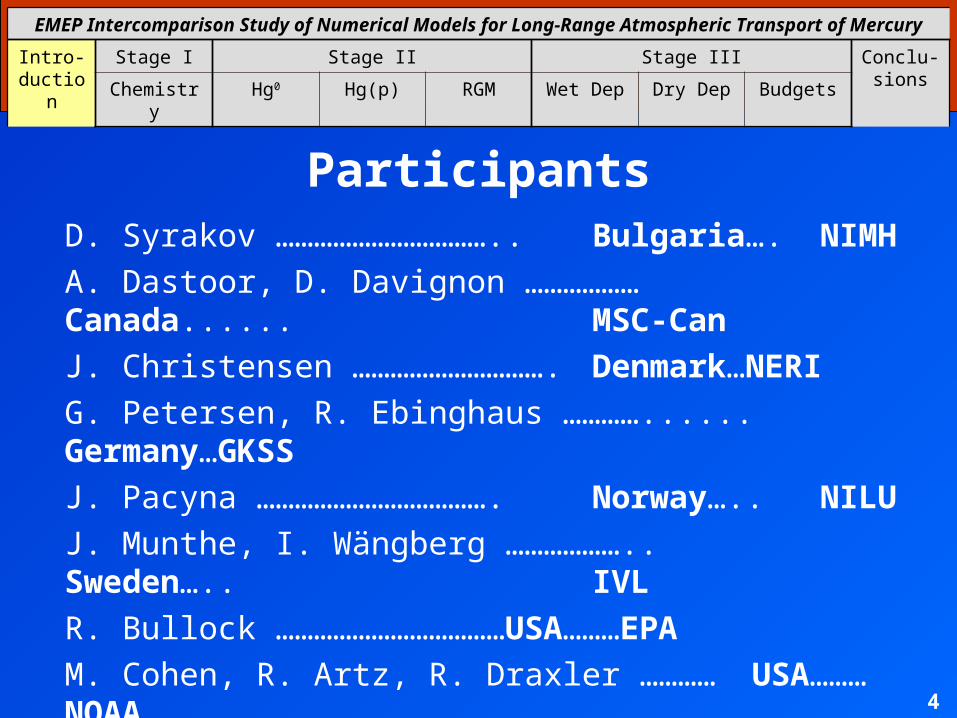
EMEP Intercomparison Study of Numerical Models for Long-Range Atmospheric Transport of Mercury
Intro-duction
Stage I Stage II Stage III Conclu-sionsChemistry Hg0 Hg(p) RGM Wet Dep Dry Dep Budgets
4
ParticipantsD. Syrakov …………………………….. Bulgaria….NIMH
A. Dastoor, D. Davignon ……………… Canada...... MSC-Can
J. Christensen …………………………. Denmark…NERI
G. Petersen, R. Ebinghaus …………...... Germany…GKSS
J. Pacyna ………………………………. Norway…..NILU
J. Munthe, I. Wängberg ……………….. Sweden….. IVL
R. Bullock ………………………………USA………EPA
M. Cohen, R. Artz, R. Draxler …………USA………NOAA
C. Seigneur, K. Lohman ………………..USA……... AER/EPRI
A. Ryaboshapko, I. Ilyin, O.Travnikov… EMEP……MSC-E
EMEP Intercomparison Study of Numerical Models for Long-Range Atmospheric Transport of Mercury
Intro-duction
Stage I Stage II Stage III Conclu-sionsChemistry Hg0 Hg(p) RGM Wet Dep Dry Dep Budgets
5
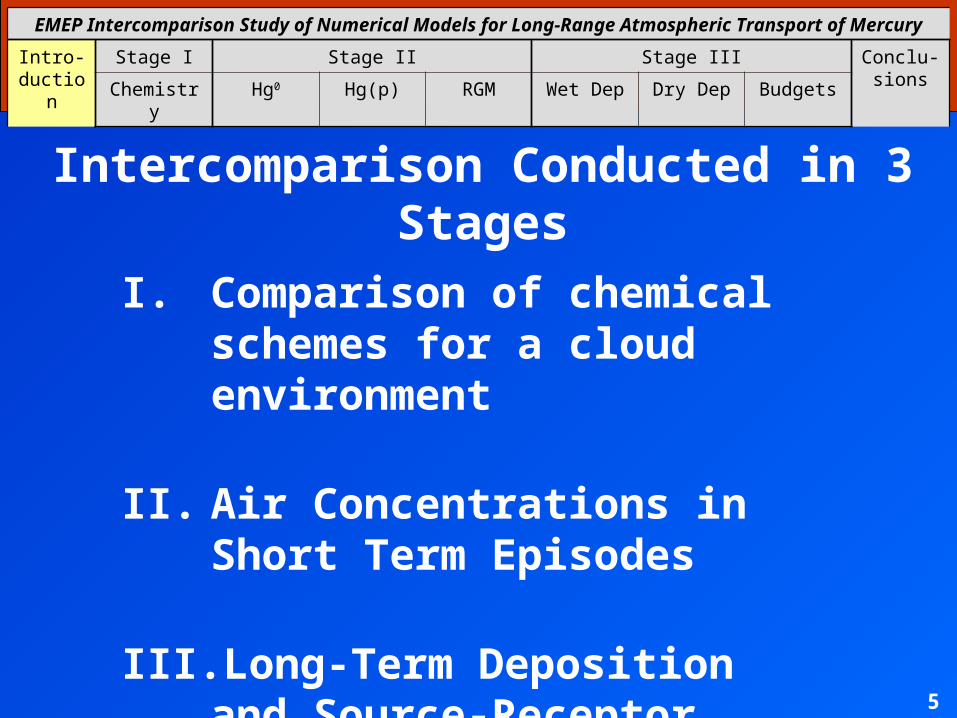
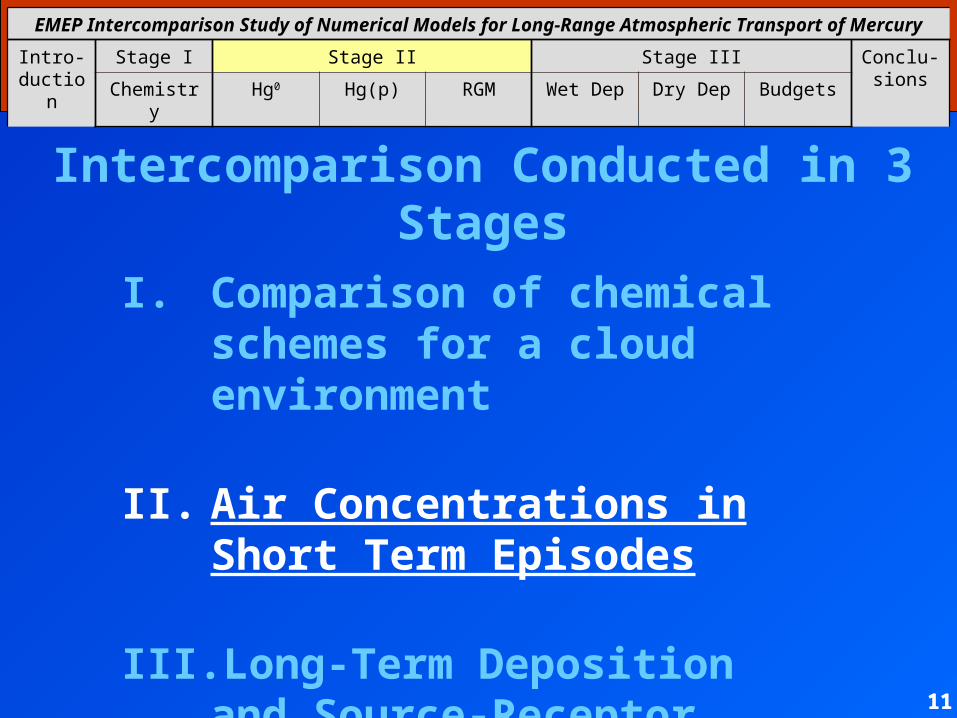
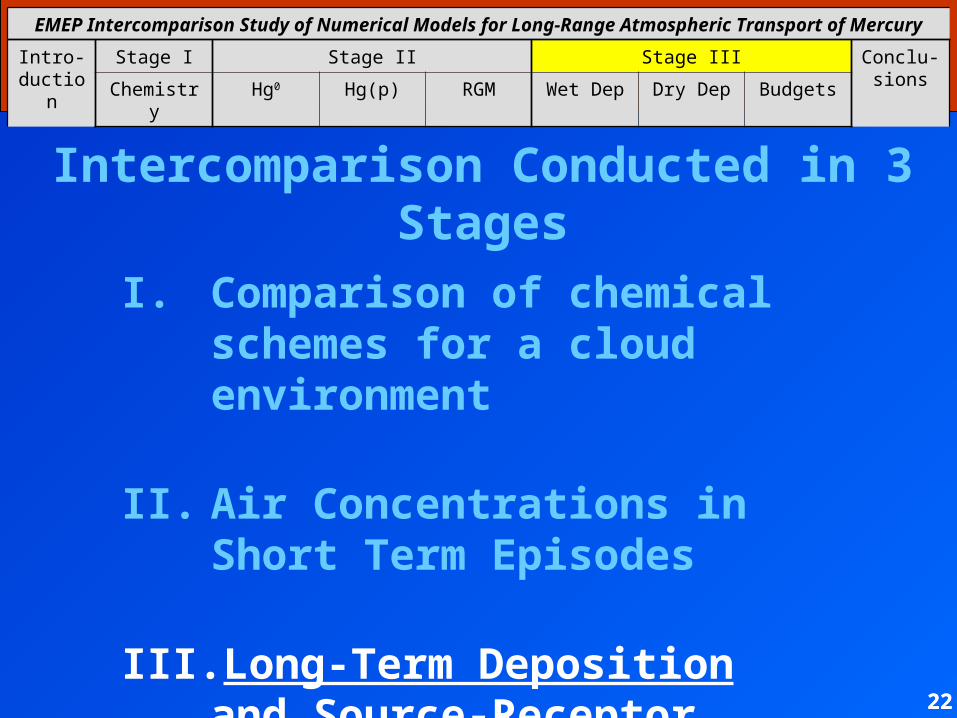
Intercomparison Conducted in 3 Stages
I. Comparison of chemical schemes for a cloud environment
II. Air Concentrations in Short Term Episodes
III. Long-Term Deposition and Source-Receptor Budgets
EMEP Intercomparison Study of Numerical Models for Long-Range Atmospheric Transport of Mercury
Intro-duction
Stage I Stage II Stage III Conclu-sionsChemistry Hg0 Hg(p) RGM Wet Dep Dry Dep Budgets
6
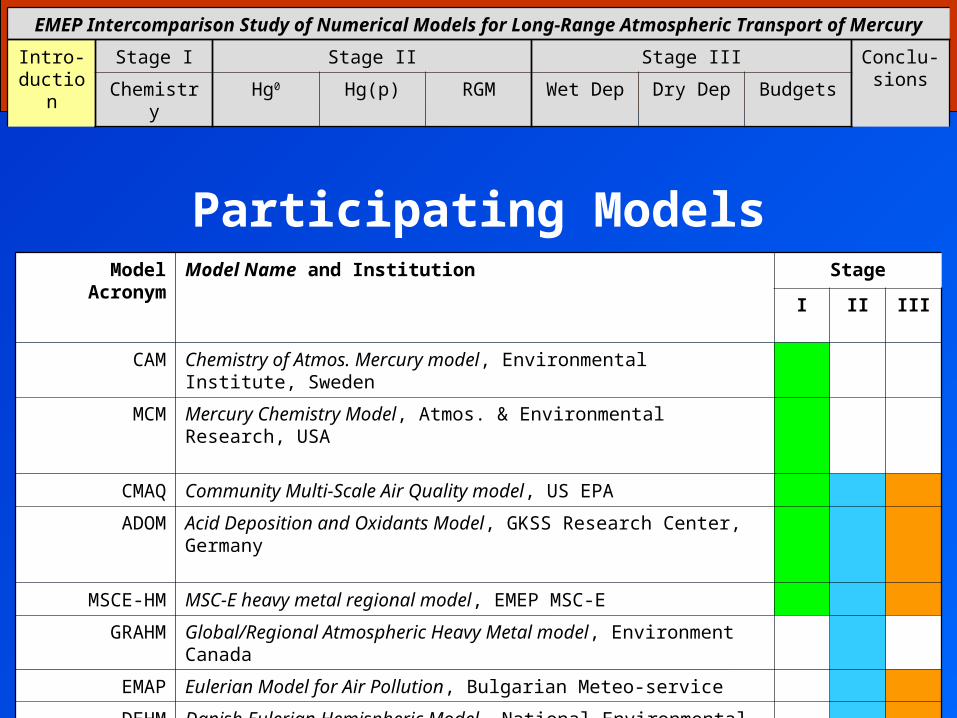
Model Acronym Model Name and Institution Stage
I II III
CAM Chemistry of Atmos. Mercury model, Environmental Institute, Sweden
MCM Mercury Chemistry Model, Atmos. & Environmental Research, USA
CMAQ Community Multi-Scale Air Quality model, US EPA
ADOM Acid Deposition and Oxidants Model, GKSS Research Center, Germany
MSCE-HM MSC-E heavy metal regional model, EMEP MSC-E
GRAHM Global/Regional Atmospheric Heavy Metal model, Environment Canada
EMAP Eulerian Model for Air Pollution, Bulgarian Meteo-service
DEHM Danish Eulerian Hemispheric Model, National Environmental Institute
HYSPLIT Hybrid Single Particle Lagrangian Integrated Trajectory model, US NOAA
MSCE-HM-Hem MSC-E heavy metal hemispheric model, EMEP MSC-E
Participating Models
EMEP Intercomparison Study of Numerical Models for Long-Range Atmospheric Transport of Mercury
Intro-duction
Stage I Stage II Stage III Conclu-sionsChemistry Hg0 Hg(p) RGM Wet Dep Dry Dep Budgets
7
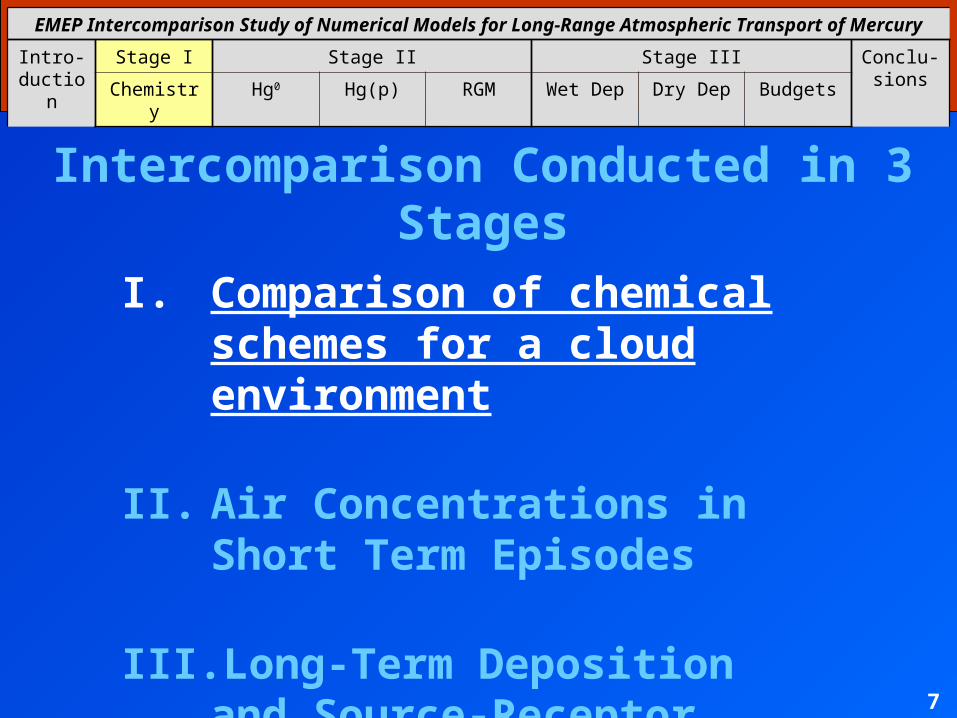
Intercomparison Conducted in 3 Stages
I. Comparison of chemical schemes for a cloud environment
II. Air Concentrations in Short Term Episodes
III. Long-Term Deposition and Source-Receptor Budgets
EMEP Intercomparison Study of Numerical Models for Long-Range Atmospheric Transport of Mercury
Intro-duction
Stage I Stage II Stage III Conclu-sionsChemistry Hg0 Hg(p) RGM Wet Dep Dry Dep Budgets
8
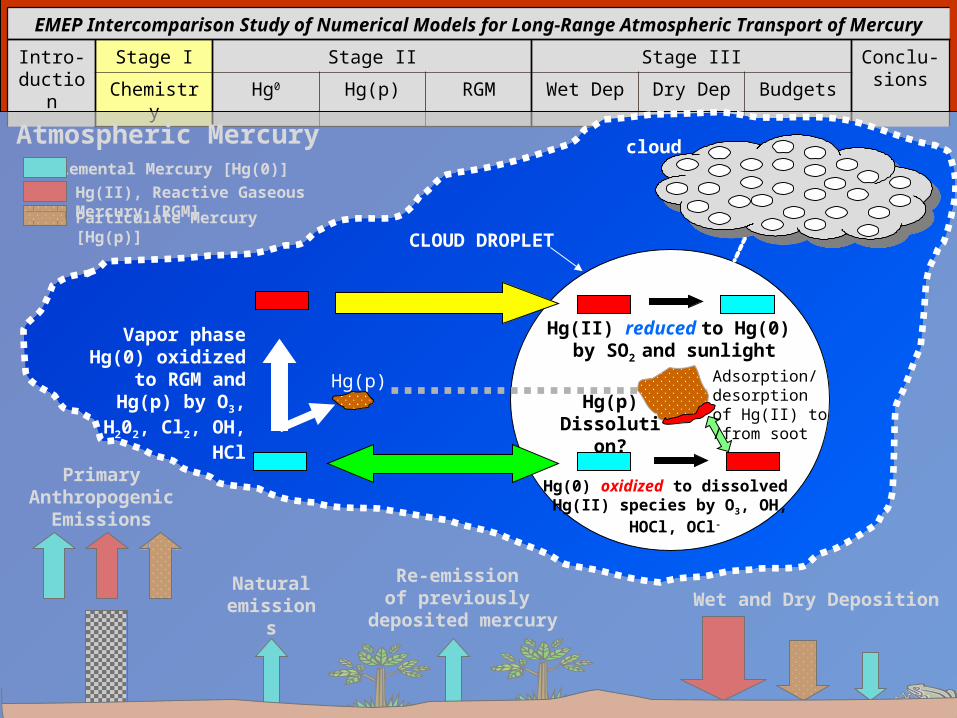
Hg(II), Reactive Gaseous Mercury [RGM]
Elemental Mercury [Hg(0)]
Particulate Mercury [Hg(p)]
Atmospheric Mercury
Re-emission of previously
deposited mercury
PrimaryAnthropogenic
Emissions
Naturalemissions Wet and Dry Deposition
CLOUD DROPLET
cloud
Hg(II) reduced to Hg(0) by SO2 and sunlight
Hg(0) oxidized to dissolved Hg(II) species by O3, OH,
HOCl, OCl-
Adsorption/desorptionof Hg(II) to/from soot
Hg(p)
Vapor phase Hg(0) oxidized to RGM and Hg(p) by O3,
H202, Cl2, OH, HCl Hg(p) Dissolution?
EMEP Intercomparison Study of Numerical Models for Long-Range Atmospheric Transport of Mercury
Intro-duction
Stage I Stage II Stage III Conclu-sionsChemistry Hg0 Hg(p) RGM Wet Dep Dry Dep Budgets
9
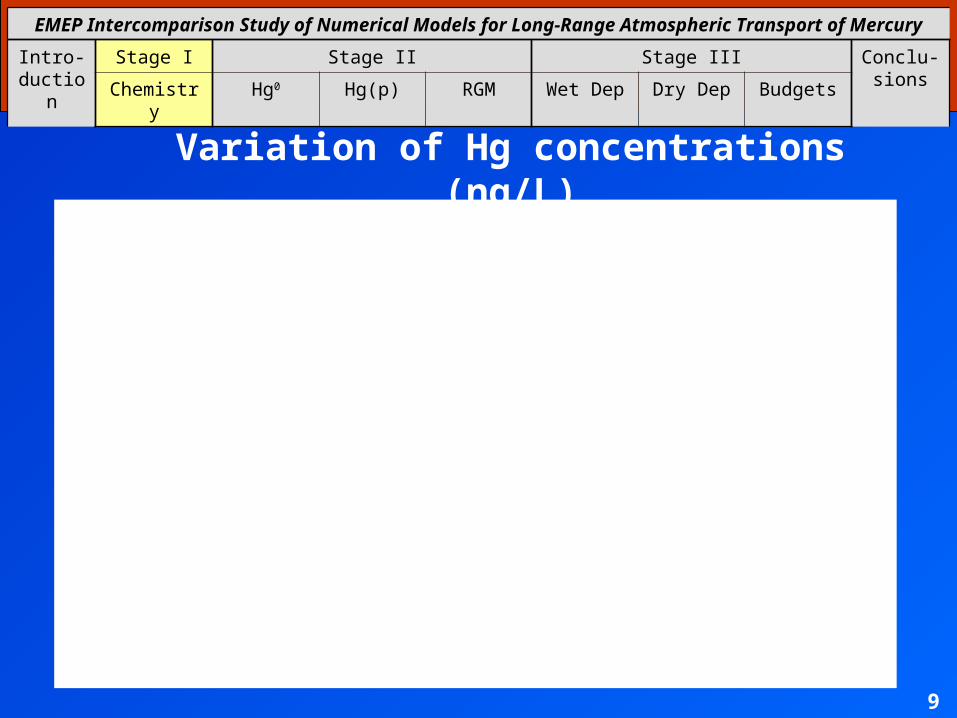
Variation of Hg concentrations (ng/L)
0
20
40
60
80
100
120
140
160
TCM AER CAM MSC-E CMAQ
Models
Co
nce
ntr
atio
n, n
g/L
EMEP Intercomparison Study of Numerical Models for Long-Range Atmospheric Transport of Mercury
Intro-duction
Stage I Stage II Stage III Conclu-sionsChemistry Hg0 Hg(p) RGM Wet Dep Dry Dep Budgets
10
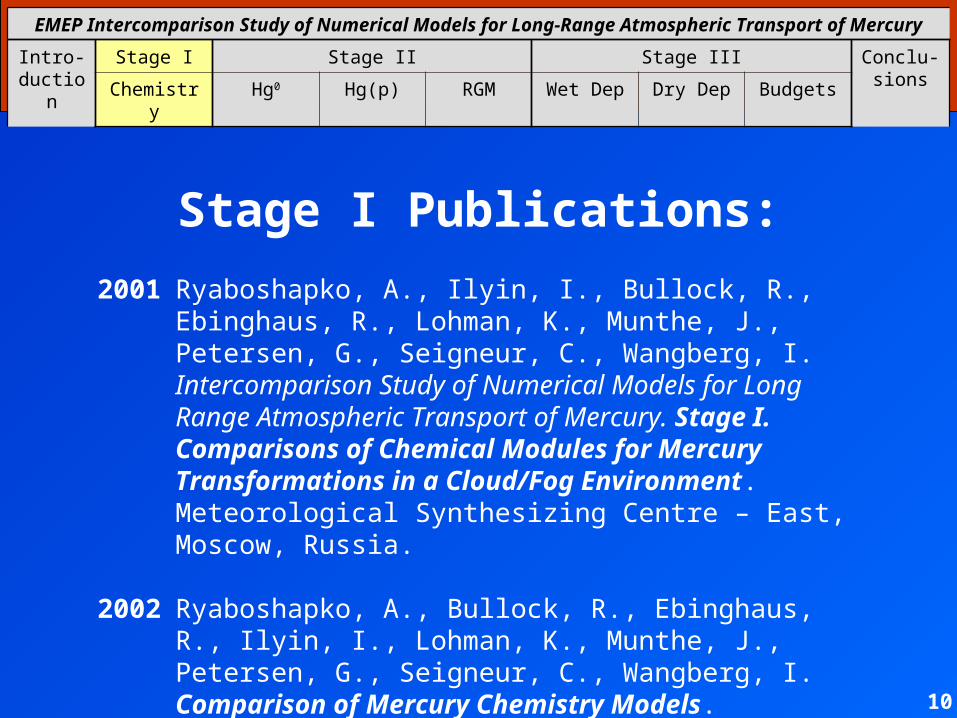
Stage I Publications:
2001 Ryaboshapko, A., Ilyin, I., Bullock, R., Ebinghaus, R., Lohman, K., Munthe, J., Petersen, G., Seigneur, C., Wangberg, I. Intercomparison Study of Numerical Models for Long Range Atmospheric Transport of Mercury. Stage I. Comparisons of Chemical Modules for Mercury Transformations in a Cloud/Fog Environment. Meteorological Synthesizing Centre – East, Moscow, Russia.
2002 Ryaboshapko, A., Bullock, R., Ebinghaus, R., Ilyin, I., Lohman, K., Munthe, J., Petersen, G., Seigneur, C., Wangberg, I. Comparison of Mercury Chemistry Models. Atmospheric Environment 36, 3881-3898.
11
EMEP Intercomparison Study of Numerical Models for Long-Range Atmospheric Transport of Mercury
Intro-duction
Stage I Stage II Stage III Conclu-sionsChemistry Hg0 Hg(p) RGM Wet Dep Dry Dep Budgets
11
Intercomparison Conducted in 3 Stages
I. Comparison of chemical schemes for a cloud environment
II. Air Concentrations in Short Term Episodes
III. Long-Term Deposition and Source-Receptor Budgets
EMEP Intercomparison Study of Numerical Models for Long-Range Atmospheric Transport of Mercury
Intro-duction
Stage I Stage II Stage III Conclu-sionsChemistry Hg0 Hg(p) RGM Wet Dep Dry Dep Budgets
12
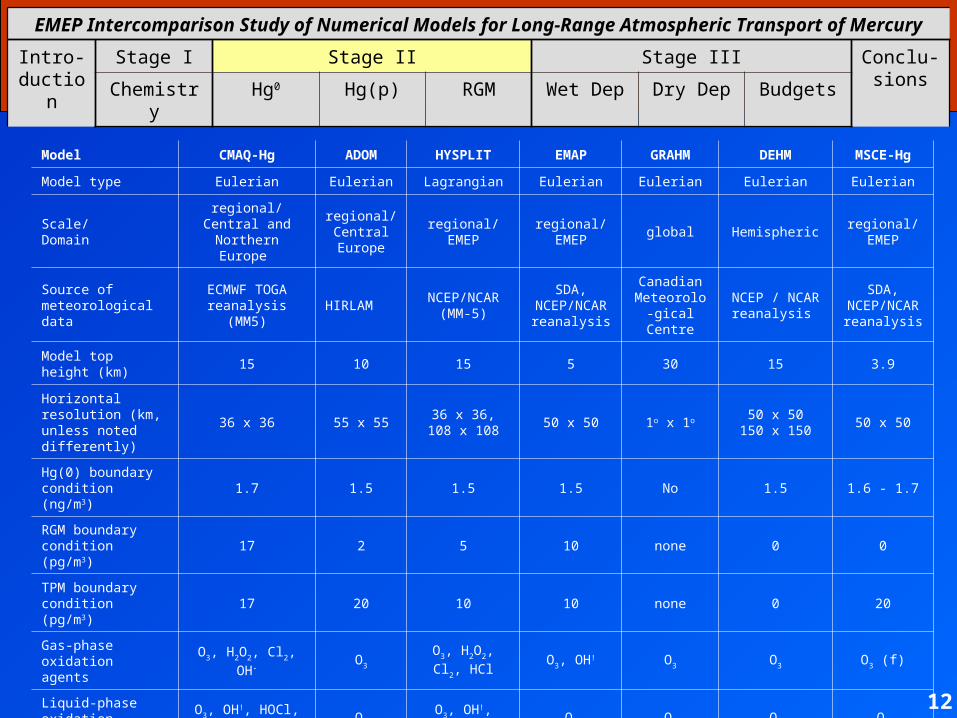
Model CMAQ-Hg ADOM HYSPLIT EMAP GRAHM DEHM MSCE-Hg
Model type Eulerian Eulerian Lagrangian Eulerian Eulerian Eulerian Eulerian
Scale/Domain
regional/Central and
Northern Europe
regional/ Central Europe
regional/EMEP
regional/EMEP
global Hemisphericregional/EMEP
Source of meteorological data
ECMWF TOGA reanalysis (MM5)
HIRLAMNCEP/NCAR
(MM-5)
SDA,NCEP/NCAR
reanalysis
Canadian Meteorolo-gical Centre
NCEP / NCAR reanalysis
SDA,NCEP/NCAR
reanalysis
Model top height (km) 15 10 15 5 30 15 3.9
Horizontal resolution (km, unless noted differently)
36 x 36 55 x 5536 x 36,
108 x 10850 x 50 1o x 1o 50 x 50
150 x 15050 x 50
Hg(0) boundary condition (ng/m3)
1.7 1.5 1.5 1.5 No 1.5 1.6 - 1.7
RGM boundary condition (pg/m3)
17 2 5 10 none 0 0
TPM boundary condition (pg/m3)
17 20 10 10 none 0 20
Gas-phase oxidation agents
O3, H2O2, Cl2, OH· O3
O3, H2O2,
Cl2, HClO3, OH! O3 O3 O3 (f)
Liquid-phase oxidation agents
O3, OH!, HOCl, OCl- O3
O3, OH!, HOCl,
OCl-O3 O3 O3 O3
Liquid-phase reduction agents
SO3=, hv, HO2 SO3
= SO3=, HO2 SO3
= SO3= SO3
= SO3=, HO2
EMEP Intercomparison Study of Numerical Models for Long-Range Atmospheric Transport of Mercury
Intro-duction
Stage I Stage II Stage III Conclu-sionsChemistry Hg0 Hg(p) RGM Wet Dep Dry Dep Budgets
13
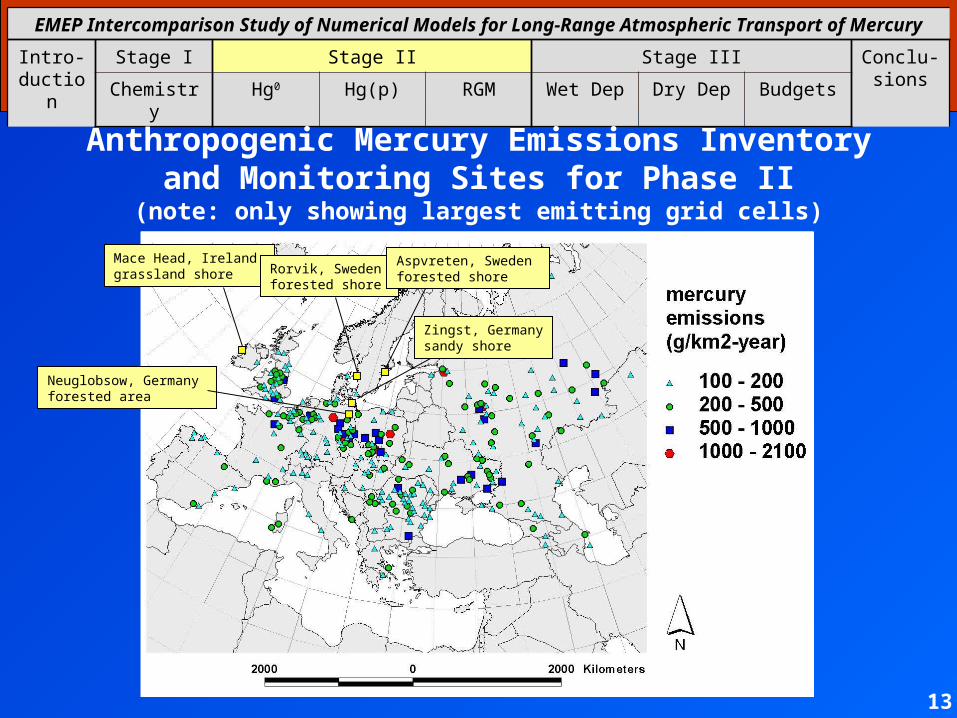
Anthropogenic Mercury Emissions Inventoryand Monitoring Sites for Phase II
(note: only showing largest emitting grid cells)
Mace Head, Ireland grassland shore Rorvik, Sweden
forested shore
Aspvreten, Sweden forested shore
Zingst, Germanysandy shore
Neuglobsow, Germany forested area
EMEP Intercomparison Study of Numerical Models for Long-Range Atmospheric Transport of Mercury
Intro-duction
Stage I Stage II Stage III Conclu-sionsChemistry Hg0 Hg(p) RGM Wet Dep Dry Dep Budgets
14
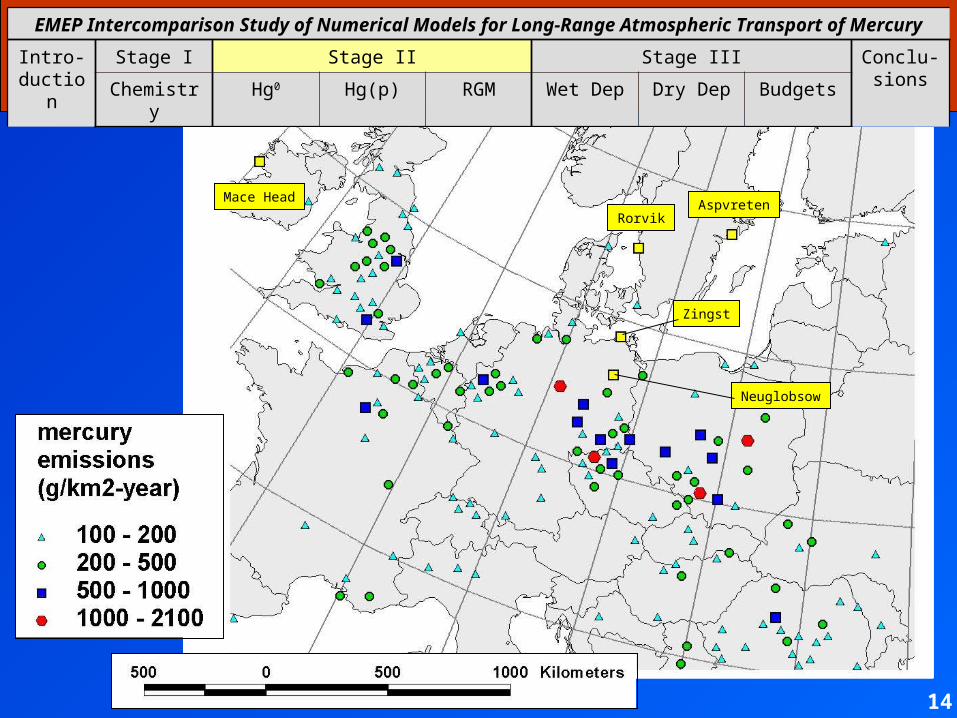
Neuglobsow
Zingst
AspvretenRorvik
Mace Head
EMEP Intercomparison Study of Numerical Models for Long-Range Atmospheric Transport of Mercury
Intro-duction
Stage I Stage II Stage III Conclu-sionsChemistry Hg0 Hg(p) RGM Wet Dep Dry Dep Budgets
15
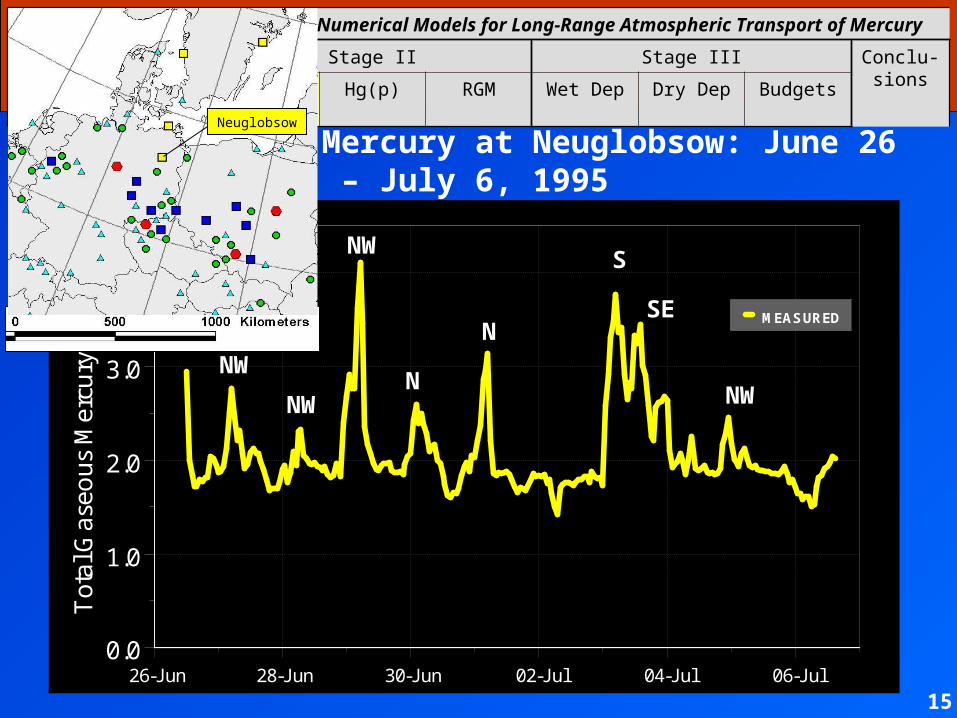
Total Gaseous Mercury at Neuglobsow: June 26 – July 6, 1995
26-Jun 28-Jun 30-Jun 02-Jul 04-Jul 06-Jul 08-Jul0.0
1.0
2.0
3.0
4.0
Tot
al G
aseo
us M
ercu
ry (
ng/m
3)
MEASURED
NW
NW
NW
N
N
S
SE
NW
Neuglobsow
EMEP Intercomparison Study of Numerical Models for Long-Range Atmospheric Transport of Mercury
Intro-duction
Stage I Stage II Stage III Conclu-sionsChemistry Hg0 Hg(p) RGM Wet Dep Dry Dep Budgets
16
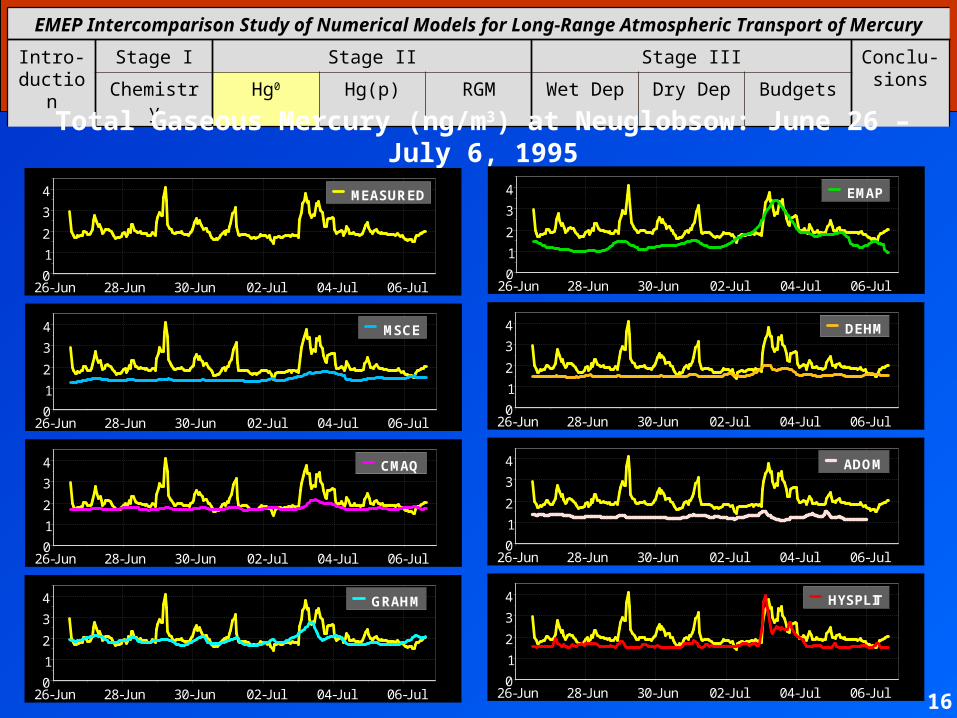
Total Gaseous Mercury (ng/m3) at Neuglobsow: June 26 – July 6, 1995
26-Jun 28-Jun 30-Jun 02-Jul 04-Jul 06-Jul0
1
2
3
4 MEASURED
26-Jun 28-Jun 30-Jun 02-Jul 04-Jul 06-Jul0
1
2
3
4 MSCE
26-Jun 28-Jun 30-Jun 02-Jul 04-Jul 06-Jul0
1
2
3
4 CMAQ
26-Jun 28-Jun 30-Jun 02-Jul 04-Jul 06-Jul0
1
2
3
4 GRAHM
26-Jun 28-Jun 30-Jun 02-Jul 04-Jul 06-Jul0
1
2
3
4 EMAP
26-Jun 28-Jun 30-Jun 02-Jul 04-Jul 06-Jul0
1
2
3
4 DEHM
26-Jun 28-Jun 30-Jun 02-Jul 04-Jul 06-Jul0
1
2
3
4 ADOM
26-Jun 28-Jun 30-Jun 02-Jul 04-Jul 06-Jul0
1
2
3
4 HYSPLIT
EMEP Intercomparison Study of Numerical Models for Long-Range Atmospheric Transport of Mercury
Intro-duction
Stage I Stage II Stage III Conclu-sionsChemistry Hg0 Hg(p) RGM Wet Dep Dry Dep Budgets
17
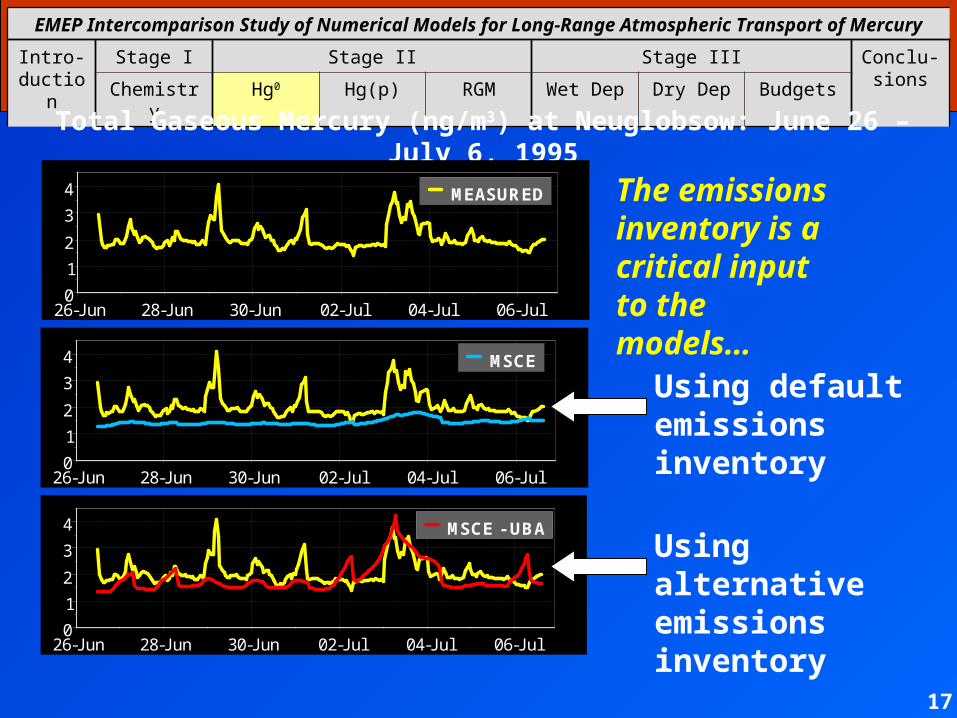
Total Gaseous Mercury (ng/m3) at Neuglobsow: June 26 – July 6, 1995
26-Jun 28-Jun 30-Jun 02-Jul 04-Jul 06-Jul0
1
2
3
4 MEASURED
26-Jun 28-Jun 30-Jun 02-Jul 04-Jul 06-Jul0
1
2
3
4 MSCE
Using default emissions inventory
The emissions inventory is a critical input to the models…
26-Jun 28-Jun 30-Jun 02-Jul 04-Jul 06-Jul0
1
2
3
4 MSCE - UBA
Using alternative emissions inventory
EMEP Intercomparison Study of Numerical Models for Long-Range Atmospheric Transport of Mercury
Intro-duction
Stage I Stage II Stage III Conclu-sionsChemistry Hg0 Hg(p) RGM Wet Dep Dry Dep Budgets
18
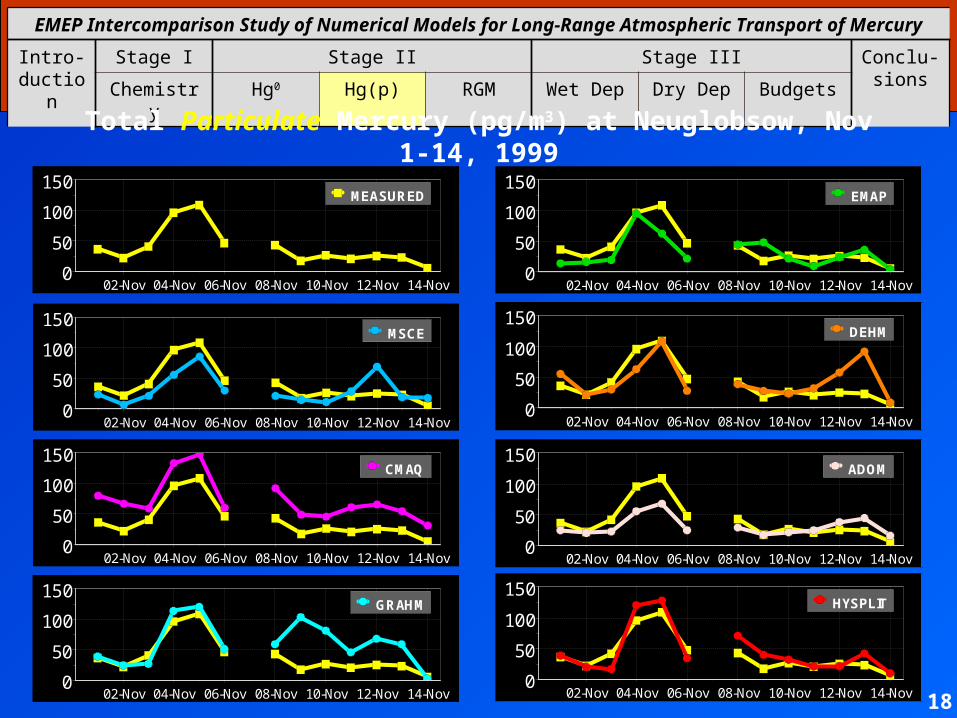
Total Particulate Mercury (pg/m3) at Neuglobsow, Nov 1-14, 1999
02-Nov 04-Nov 06-Nov 08-Nov 10-Nov 12-Nov 14-Nov 16-Nov0
50
100
150MEASURED
02-Nov 04-Nov 06-Nov 08-Nov 10-Nov 12-Nov 14-Nov 16-Nov0
50
100
150CMAQ
02-Nov 04-Nov 06-Nov 08-Nov 10-Nov 12-Nov 14-Nov 16-Nov0
50
100
150GRAHM
02-Nov 04-Nov 06-Nov 08-Nov 10-Nov 12-Nov 14-Nov 16-Nov0
50
100
150EMAP
02-Nov 04-Nov 06-Nov 08-Nov 10-Nov 12-Nov 14-Nov 16-Nov0
50
100
150DEHM
02-Nov 04-Nov 06-Nov 08-Nov 10-Nov 12-Nov 14-Nov 16-Nov0
50
100
150ADOM
02-Nov 04-Nov 06-Nov 08-Nov 10-Nov 12-Nov 14-Nov 16-Nov0
50
100
150HYSPLIT
02-Nov 04-Nov 06-Nov 08-Nov 10-Nov 12-Nov 14-Nov 16-Nov0
50
100
150MSCE

19
MSCE Neuglobsow RGM
0
10
20
30
40
50
60
11
/1/1
99
9
11
/2/1
99
9
11
/3/1
99
9
11
/4/1
99
9
11
/5/1
99
9
11
/6/1
99
9
11
/7/1
99
9
11
/8/1
99
9
11
/9/1
99
9
11
/10
/19
99
11
/11
/19
99
11
/12
/19
99
11
/13
/19
99
11
/14
/19
99
pg
/m3
ObsCalc
a
CMAQ Neuglobsow RGM
0
10
20
30
40
50
60
70
1/1
1/9
9
2/1
1/9
9
3/1
1/9
9
4/1
1/9
9
5/1
1/9
9
6/1
1/9
9
7/1
1/9
9
8/1
1/9
9
9/1
1/9
9
10
/11
/99
11
/11
/99
12
/11
/99
13
/11
/99
14
/11
/99
pg
/m3
ObsCalc
a
ADOM Neuglobsow RGM
0
10
20
30
40
50
60
70
11
/1/9
9
11
/2/9
9
11
/3/9
9
11
/4/9
9
11
/5/9
9
11
/6/9
9
11
/7/9
9
11
/8/9
9
11
/9/9
9
11
/10/
99
11
/11/
99
11
/12/
99
11
/13/
99
11
/14/
99
pg
/m3
ObsCalc
a
EMAP Neuglobsow RGM
0
5
10
15
20
25
11
/1/1
99
9
11
/2/1
99
9
11
/3/1
99
9
11
/4/1
99
9
11
/5/1
99
9
11
/6/1
99
9
11
/7/1
99
9
11
/8/1
99
9
11
/9/1
99
9
11
/10
/19
99
11
/11
/19
99
11
/12
/19
99
11
/13
/19
99
11
/14
/19
99
pg
/m3
ObsCalc
a
GRAHM Neuglobsow RGM
0
35
70
105
140
11/1
/99
11/2
/99
11/3
/99
11/4
/99
11/5
/99
11/6
/99
11/7
/99
11/8
/99
11/9
/99
11/1
0/99
11/1
1/99
11/1
2/99
11/1
3/99
11/1
4/99
pg/m
3
ObsCalc
a
HYSPLIT Neuglobsow RGM
0
10
20
30
40
50
60
11/1
/99
11/2
/99
11/3
/99
11/4
/99
11/5
/99
11/6
/99
11/7
/99
11/8
/99
11/9
/99
11/1
0/99
11/1
1/99
11/1
2/99
11/1
3/99
11/1
4/99
pg/m
3
ObsCalc
a
EMEP Intercomparison Study of Numerical Models for Long-Range Atmospheric Transport of Mercury
BudgetsDry DepWet DepRGMHg(p)Hg0Chemistry
Conclu-sions
Stage IIIStage IIStage IIntro-duction
DEHM Neuglobsow RGM
0
6
12
18
24
30
11/1
/199
9
11/2
/199
9
11/3
/199
9
11/4
/199
9
11/5
/199
9
11/6
/199
9
11/7
/199
9
11/8
/199
9
11/9
/199
9
11/1
0/19
99
11/1
1/19
99
11/1
2/19
99
11/1
3/19
99
11/1
4/19
99
pg/m
3
ObsCalc
a
Reactive Gaseous Mercury at Neuglobsow, Nov 1-14, 1999
EMEP Intercomparison Study of Numerical Models for Long-Range Atmospheric Transport of Mercury
BudgetsDry DepWet DepRGMHg(p)Hg0Chemistry
Conclu-sions
Stage IIIStage IIStage IIntro-duction
20
Overall Phase II statistics for 2-week episode means
0
20
40
60
80
100
Deviation fac tor
Perc
en
tag
e,
%
2 3 5 10
TGMTPM RGM
Deviation Factor
RGM: 90% within a factor of 10
RGM: 50% within a factor of 2
TPM: 90% within a factor of 2.5
TGM: all within a factor of 1.35
EMEP Intercomparison Study of Numerical Models for Long-Range Atmospheric Transport of Mercury
Intro-duction
Stage I Stage II Stage III Conclu-sionsChemistry Hg0 Hg(p) RGM Wet Dep Dry Dep Budgets
21
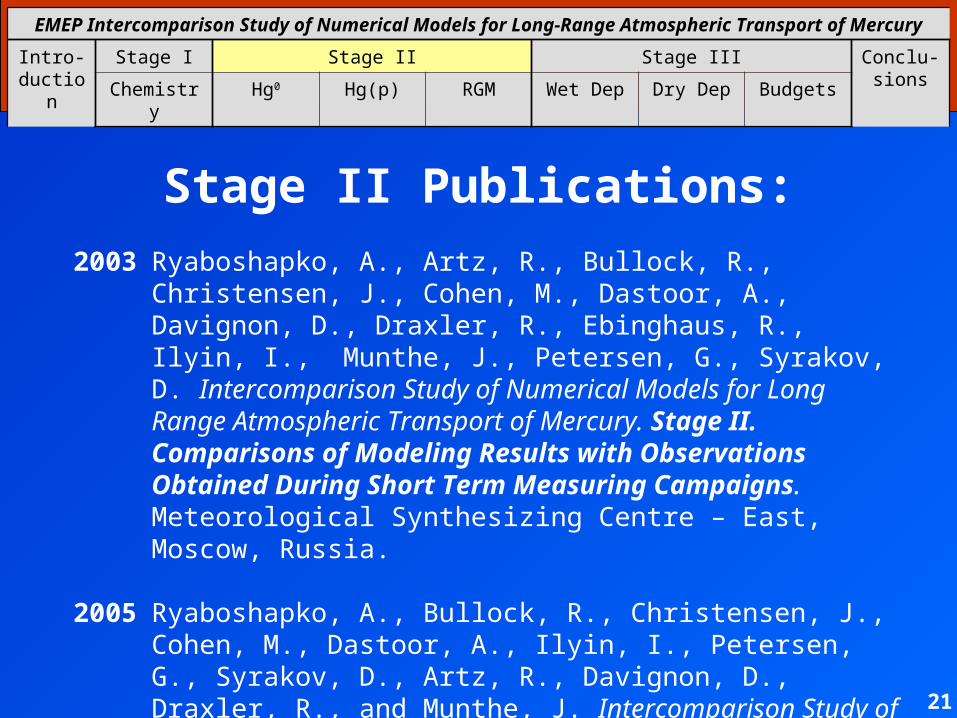
Stage II Publications:
2003 Ryaboshapko, A., Artz, R., Bullock, R., Christensen, J., Cohen, M., Dastoor, A., Davignon, D., Draxler, R., Ebinghaus, R., Ilyin, I., Munthe, J., Petersen, G., Syrakov, D. Intercomparison Study of Numerical Models for Long Range Atmospheric Transport of Mercury. Stage II. Comparisons of Modeling Results with Observations Obtained During Short Term Measuring Campaigns. Meteorological Synthesizing Centre – East, Moscow, Russia.
2005 Ryaboshapko, A., Bullock, R., Christensen, J., Cohen, M., Dastoor, A., Ilyin, I., Petersen, G., Syrakov, D., Artz, R., Davignon, D., Draxler, R., and Munthe, J. Intercomparison Study of Atmospheric Mercury Models. Phase II. Comparison of Models with Short-Term Measurements. Submitted to Atmospheric Environment.
22
EMEP Intercomparison Study of Numerical Models for Long-Range Atmospheric Transport of Mercury
Intro-duction
Stage I Stage II Stage III Conclu-sionsChemistry Hg0 Hg(p) RGM Wet Dep Dry Dep Budgets
22
Intercomparison Conducted in 3 Stages
I. Comparison of chemical schemes for a cloud environment
II. Air Concentrations in Short Term Episodes
III. Long-Term Deposition and Source-Receptor Budgets
23
EMEP Intercomparison Study of Numerical Models for Long-Range Atmospheric Transport of Mercury
Intro-duction
Stage I Stage II Stage III Conclu-sionsChemistry Hg0 Hg(p) RGM Wet Dep Dry Dep Budgets
23
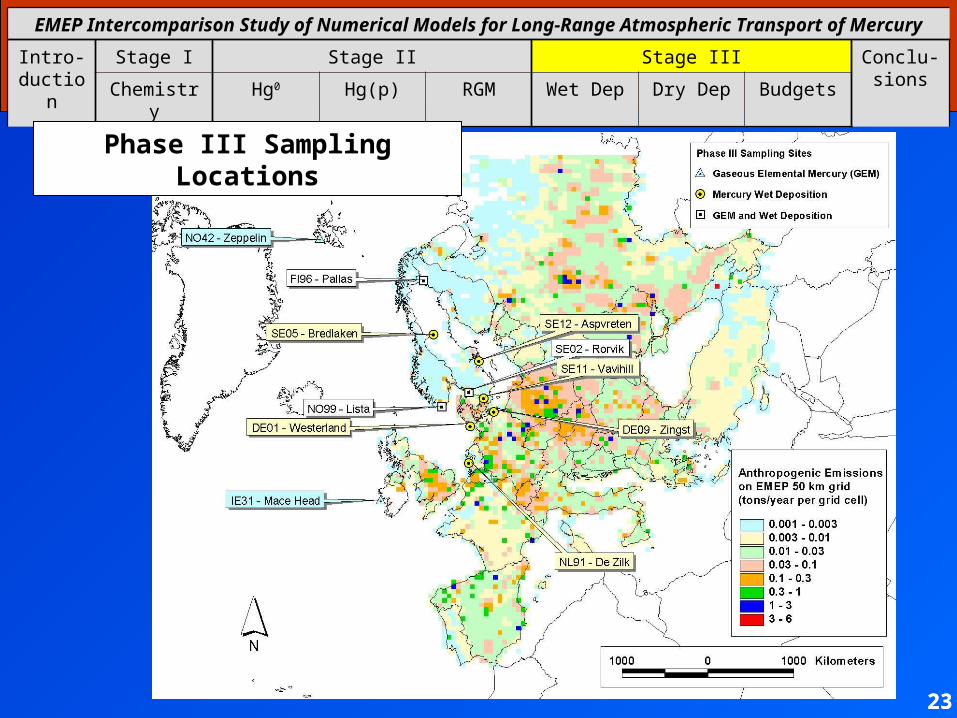
Phase III Sampling Locations
EMEP Intercomparison Study of Numerical Models for Long-Range Atmospheric Transport of Mercury
Intro-duction
Stage I Stage II Stage III Conclu-sionsChemistry Hg0 Hg(p) RGM Wet Dep Dry Dep Budgets
24
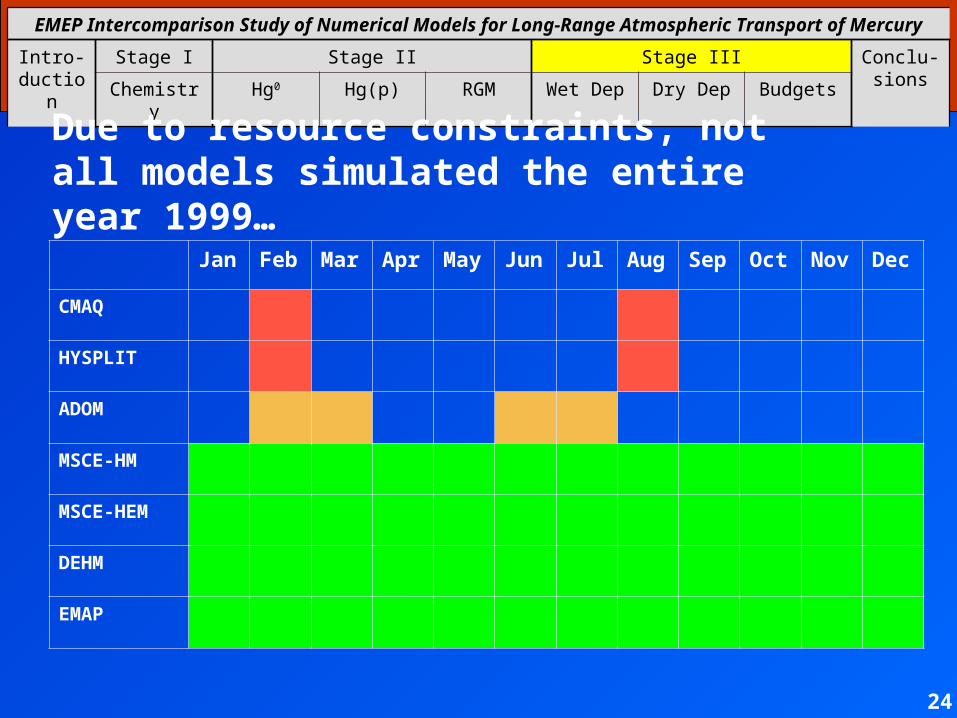
Due to resource constraints, not all models simulated the entire year 1999…
Jan Feb Mar Apr May Jun Jul Aug Sep Oct Nov Dec
CMAQ
HYSPLIT
ADOM
MSCE-HM
MSCE-HEM
DEHM
EMAP
EMEP Intercomparison Study of Numerical Models for Long-Range Atmospheric Transport of Mercury
Intro-duction
Stage I Stage II Stage III Conclu-sionsChemistry Hg0 Hg(p) RGM Wet Dep Dry Dep Budgets
25
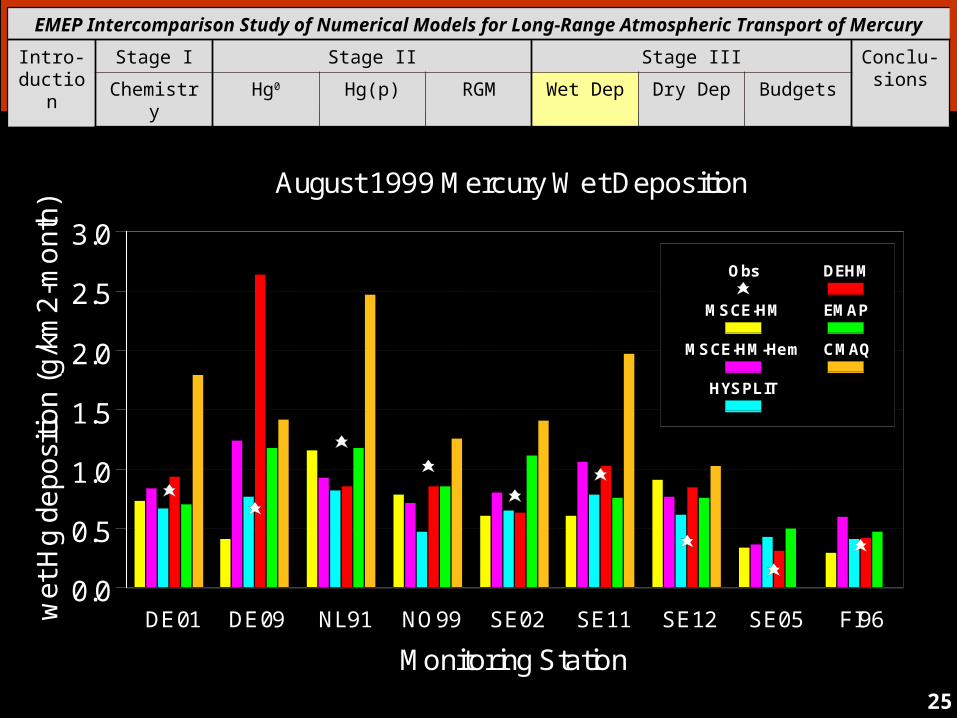
DE01 DE09 NL91 NO99 SE02 SE11 SE12 SE05 FI96
Monitoring Station
0.0
0.5
1.0
1.5
2.0
2.5
3.0
wet
Hg
depo
sitio
n (g
/km
2-m
ont
h)
Obs
MSCE-HM
MSCE-HM-Hem
HYSPLIT
DEHM
EMAP
CMAQ
August 1999 Mercury Wet Deposition
EMEP Intercomparison Study of Numerical Models for Long-Range Atmospheric Transport of Mercury
Intro-duction
Stage I Stage II Stage III Conclu-sionsChemistry Hg0 Hg(p) RGM Wet Dep Dry Dep Budgets
26
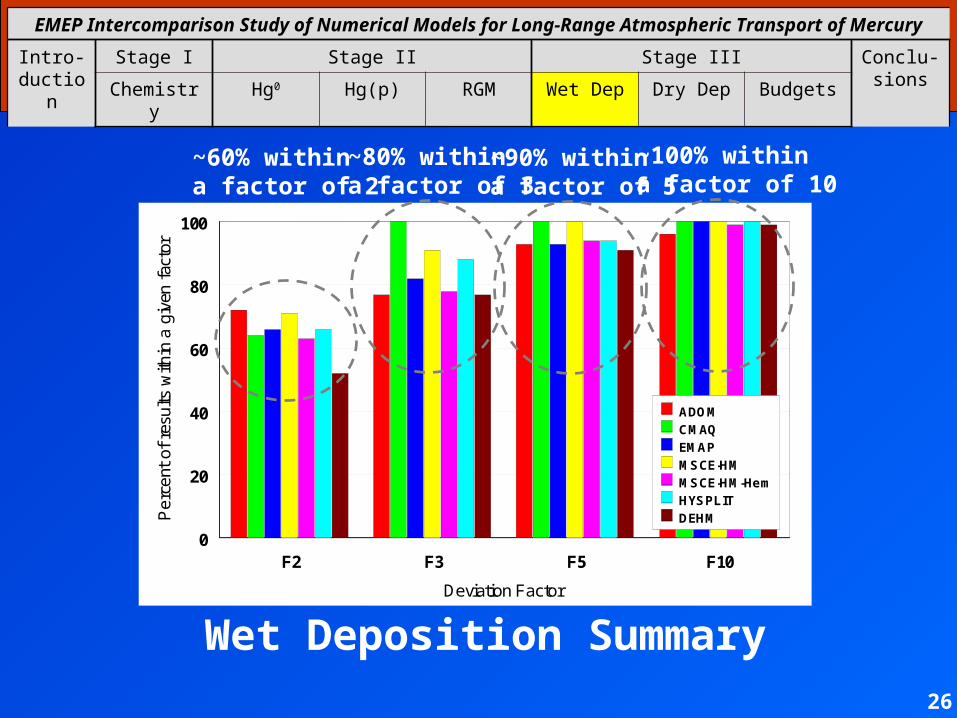
F2 F3 F5 F10
Deviation Factor
0
20
40
60
80
100
Per
cent
of
resu
lts w
ithin
a g
iven
fac
tor
ADOM
CMAQ
EMAP
MSCE-HM
MSCE-HM-Hem
HYSPLIT
DEHM
Wet Deposition Summary
~60% within a factor of 2
~80% within a factor of 3
~90% within a factor of 5
~100% within a factor of 10
EMEP Intercomparison Study of Numerical Models for Long-Range Atmospheric Transport of Mercury
Intro-duction
Stage I Stage II Stage III Conclu-sionsChemistry Hg0 Hg(p) RGM Wet Dep Dry Dep Budgets
27
For dry deposition, there are no measurement results to compare the models against;
However, the models can be compared against each other…
EMEP Intercomparison Study of Numerical Models for Long-Range Atmospheric Transport of Mercury
Intro-duction
Stage I Stage II Stage III Conclu-sionsChemistry Hg0 Hg(p) RGM Wet Dep Dry Dep Budgets
28
DE01 DE09 NL91 NO99 SE02 SE11 SE12 SE05 FI96
Monitoring Station
0.0
0.1
0.2
0.3
0.4
0.5
0.6
0.7
0.8
Hg
dry
depo
sitio
n (g
/km
2-m
onth
)
model avg
MSCE-HM
MSCE-HEM
HYSPLIT
DEHM
EMAP
CMAQ
August 1999 Mercury Dry Deposition
EMEP Intercomparison Study of Numerical Models for Long-Range Atmospheric Transport of Mercury
Intro-duction
Stage I Stage II Stage III Conclu-sionsChemistry Hg0 Hg(p) RGM Wet Dep Dry Dep Budgets
29
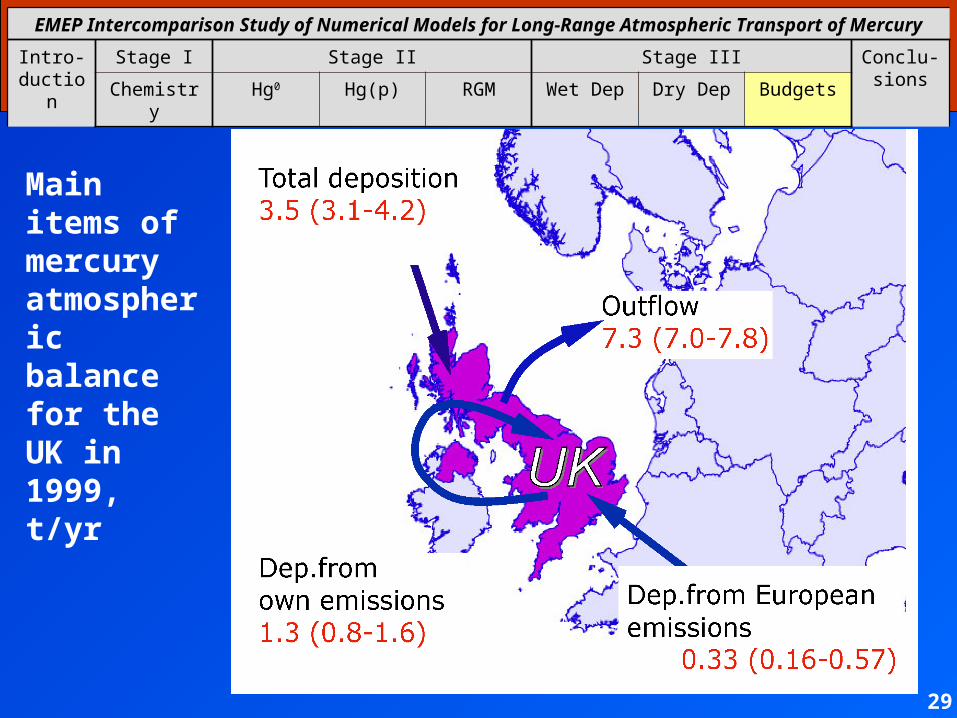
Main items of mercury atmospheric balance for the UK in 1999, t/yr
EMEP Intercomparison Study of Numerical Models for Long-Range Atmospheric Transport of Mercury
Intro-duction
Stage I Stage II Stage III Conclu-sionsChemistry Hg0 Hg(p) RGM Wet Dep Dry Dep Budgets
30
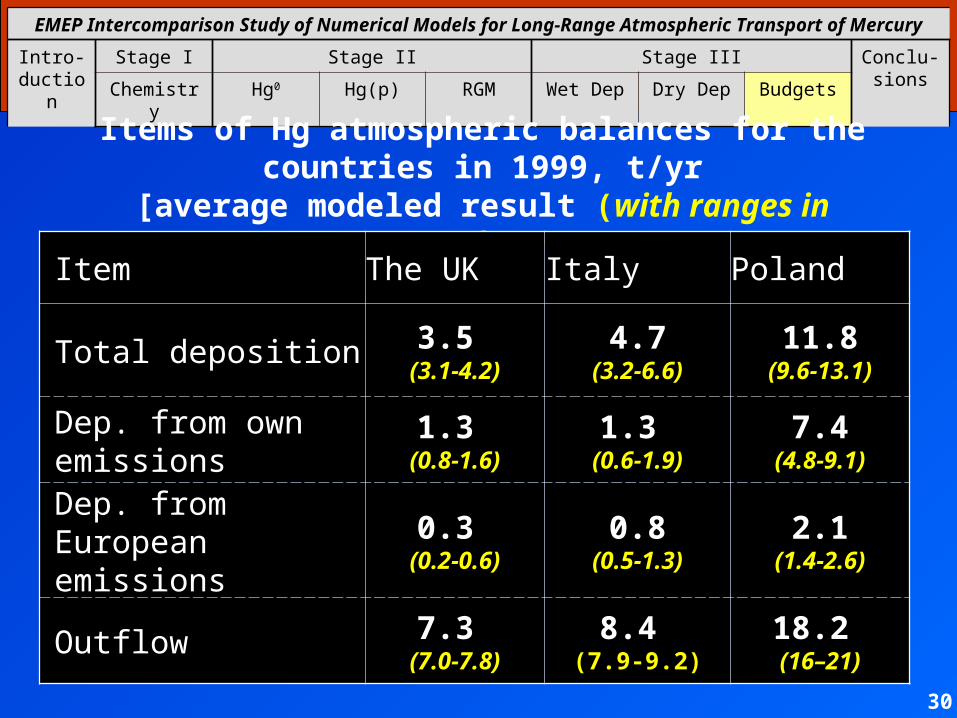
Items of Hg atmospheric balances for the countries in 1999, t/yr[average modeled result (with ranges in parentheses)]
Item The UK Italy Poland
Total deposition 3.5 (3.1-4.2)
4.7(3.2-6.6)
11.8(9.6-13.1)
Dep. from own emissions
1.3 (0.8-1.6)
1.3 (0.6-1.9)
7.4(4.8-9.1)
Dep. from European emissions
0.3 (0.2-0.6)
0.8(0.5-1.3)
2.1(1.4-2.6)
Outflow 7.3 (7.0-7.8)
8.4 (7.9-9.2)
18.2 (16–21)
EMEP Intercomparison Study of Numerical Models for Long-Range Atmospheric Transport of Mercury
Intro-duction
Stage I Stage II Stage III Conclu-sionsChemistry Hg0 Hg(p) RGM Wet Dep Dry Dep Budgets
31
Stage III Publication:
2005 Ryaboshapko, A., Artz, R., Bullock, R., Christensen, J., Cohen, M., Draxler, R., Ilyin, I., Munthe, J., Pacyna, J., Petersen, G., Syrakov, D., Travnikov, O. Intercomparison Study of Numerical Models for Long Range Atmospheric Transport of Mercury. Stage III. Comparison of Modelling Results with Long-Term Observations and Comparison of Calculated Items of Regional Balances. Meteorological Synthesizing Centre – East, Moscow, Russia.
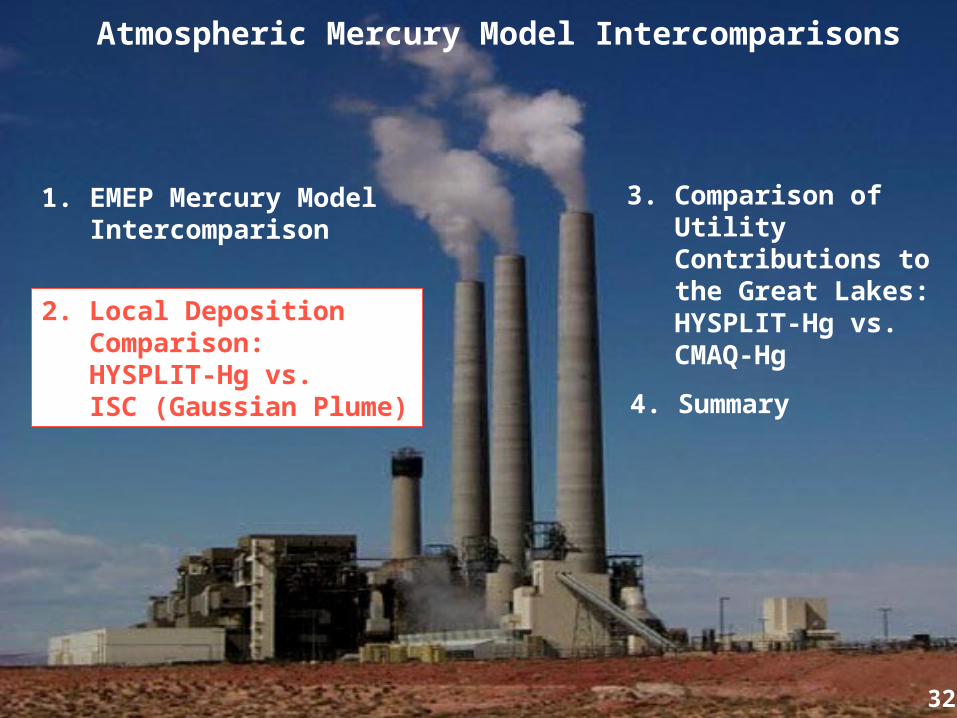
2. Local Deposition Comparison:HYSPLIT-Hg vs.ISC (Gaussian Plume)
Atmospheric Mercury Model Intercomparisons
3. Comparison of Utility Contributions to the Great Lakes:HYSPLIT-Hg vs. CMAQ-Hg
4. Summary
32
1. EMEP Mercury Model Intercomparison

0 - 15 15 - 30 30 - 60
distance range from source (km)
0.01
0.1
1
10
100
1000
for
1 kg
/day
sou
rce
ug/m
2-ye
ar
Hg(2)_50mHg(2)_250mHg(2)_500mHg(p)_250mHg(0)_250m
Wet + Dry Deposition: ISC (Kansas City)for emissions of different mercury forms from different stack heights
Calculated from data used to produce Appendix A of USEPA (2005): Clean Air Mercury Rule (CAMR) Technical Support Document: Methodology Used to Generate Deposition, Fish Tissue Methylmercury Concentrations, and Exposure for Determining Effectiveness of Utility Emissions Controls: Analysis of Mercury from Electricity Generating Units 33

0 - 15 15 - 30 30 - 60
distance range from source (km)
0.01
0.1
1
10
100
1000
for
1 kg
/day
sou
rce
ug/m
2-ye
ar
Hg(2)_50m
Hg(2)_250m
Hg(2)_500m
Hg(p)_250m
Hg(0)_250m
Wet + Dry Deposition: HYSPLIT (Nebraska)for emissions of different mercury forms from different stack heights
0 - 15 15 - 30 30 - 60
distance range from source (km)
0.01
0.1
1
10
100
1000
for
1 kg
/day
so
urce
ug/m
2-ye
ar
Hg(2)_50m
Hg(2)_250m
Hg(2)_500m
Hg(p)_250m
Hg(0)_250m
Wet + Dry Deposition: ISC (Kansas City)for emissions of different mercury forms from different stack heights
0 - 15 15 - 30 30 - 60
distance range from source (km)
0.01
0.1
1
10
100
1000
for
1 kg
/day
so
urce
ug/m
2-ye
ar
Hg(2)_50m
Hg(2)_250m
Hg(2)_500m
Hg(p)_250m
Hg(0)_250m
Wet + Dry Deposition: ISC (Tampa)for emissions of different mercury forms from different stack heights
0 - 15 15 - 30 30 - 60
distance range from source (km)
0.01
0.1
1
10
100
1000
for
1 kg
/day
so
urce
ug/m
2-ye
ar
Hg(2)_50m
Hg(2)_250m
Hg(2)_500m
Hg(p)_250m
Hg(0)_250m
Wet + Dry Deposition: ISC (Phoenix)for emissions of different mercury forms from different stack heights
0 - 15 15 - 30 30 - 60
distance range from source (km)
0.01
0.1
1
10
100
1000fo
r 1
kg/d
ay s
our
ceug
/m2-
year
Hg(2)_50m
Hg(2)_250m
Hg(2)_500m
Hg(p)_250m
Hg(0)_250m
Wet + Dry Deposition: ISC (Indianapolis)for emissions of different mercury forms from different stack heights
HYSPLIT 1996
ISC: 1990-1994
Different Time Periods and Locations, but Similar Results
34
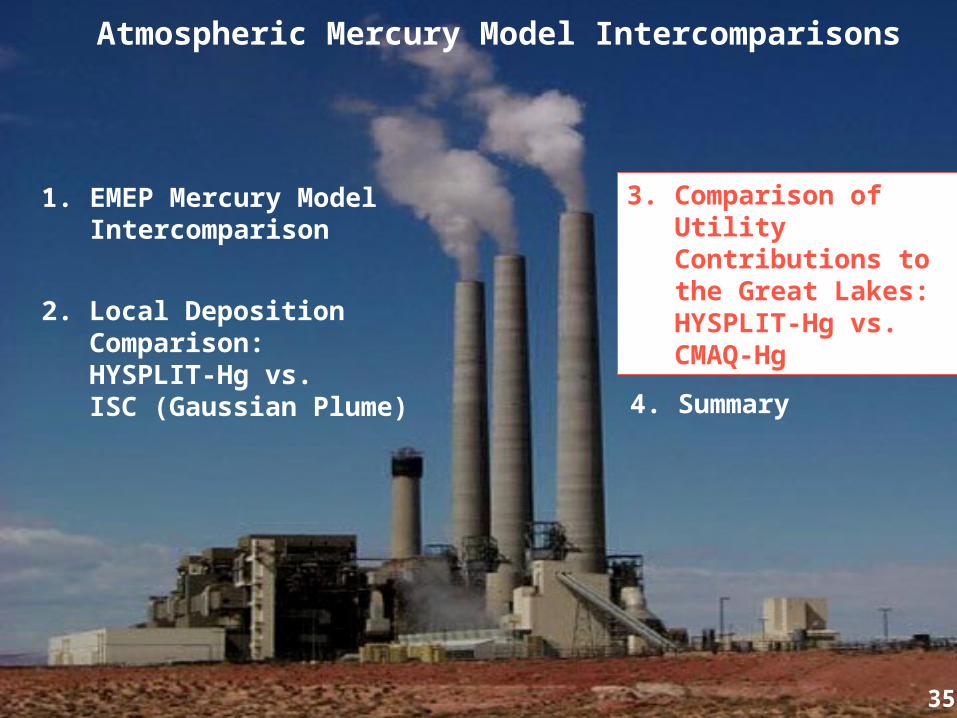
2. Local Deposition Comparison:HYSPLIT-Hg vs.ISC (Gaussian Plume)
Atmospheric Mercury Model Intercomparisons
3. Comparison of Utility Contributions to the Great Lakes:HYSPLIT-Hg vs. CMAQ-Hg
4. Summary
35
1. EMEP Mercury Model Intercomparison
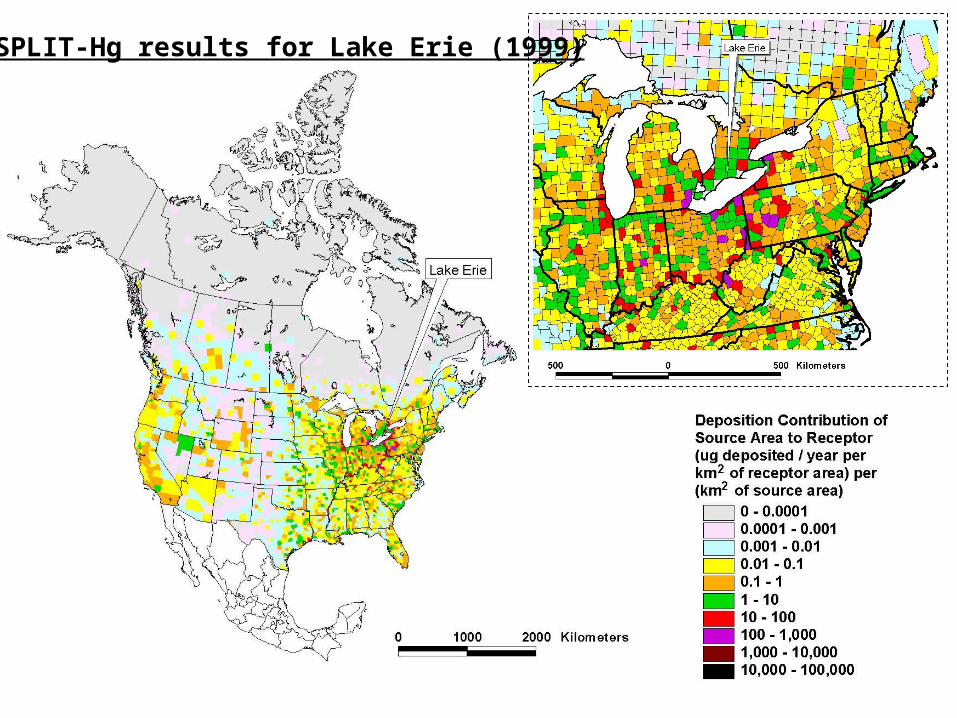
HYSPLIT-Hg results for Lake Erie (1999)
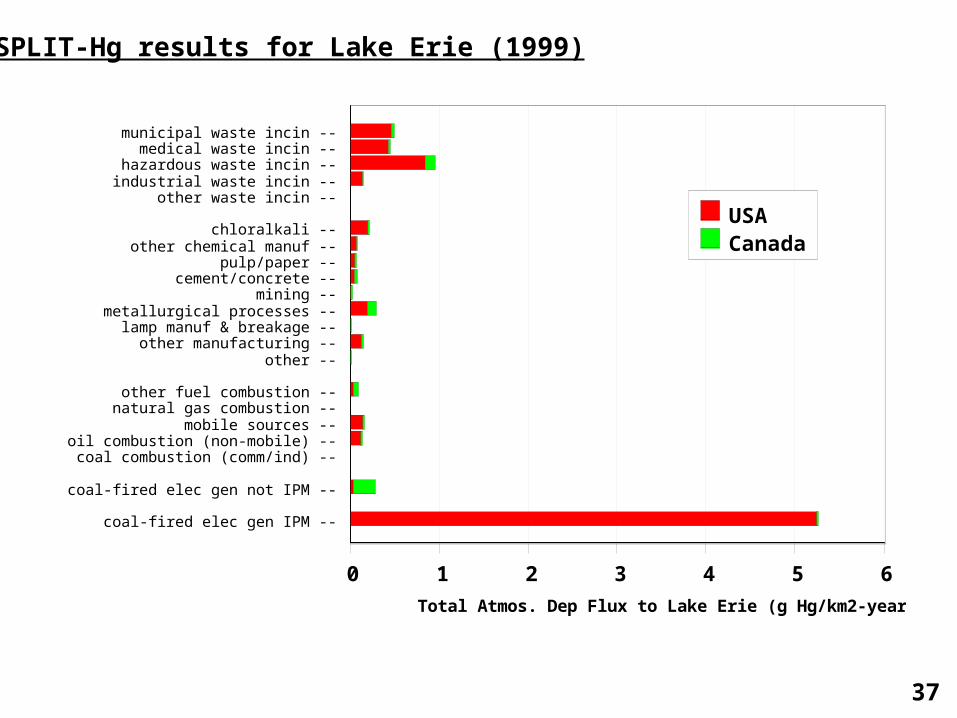
municipal waste incin --medical waste incin --
hazardous waste incin --industrial waste incin --
other waste incin --
chloralkali --other chemical manuf --
pulp/paper --cement/concrete --
mining --metallurgical processes --lamp manuf & breakage --other manufacturing --
other --
other fuel combustion --natural gas combustion --
mobile sources --oil combustion (non-mobile) --coal combustion (comm/ind) --
coal-fired elec gen not IPM --
coal-fired elec gen IPM --
0 1 2 3 4 5 6
Total Atmos. Dep Flux to Lake Erie (g Hg/km2-year)
USACanada
37
HYSPLIT-Hg results for Lake Erie (1999)
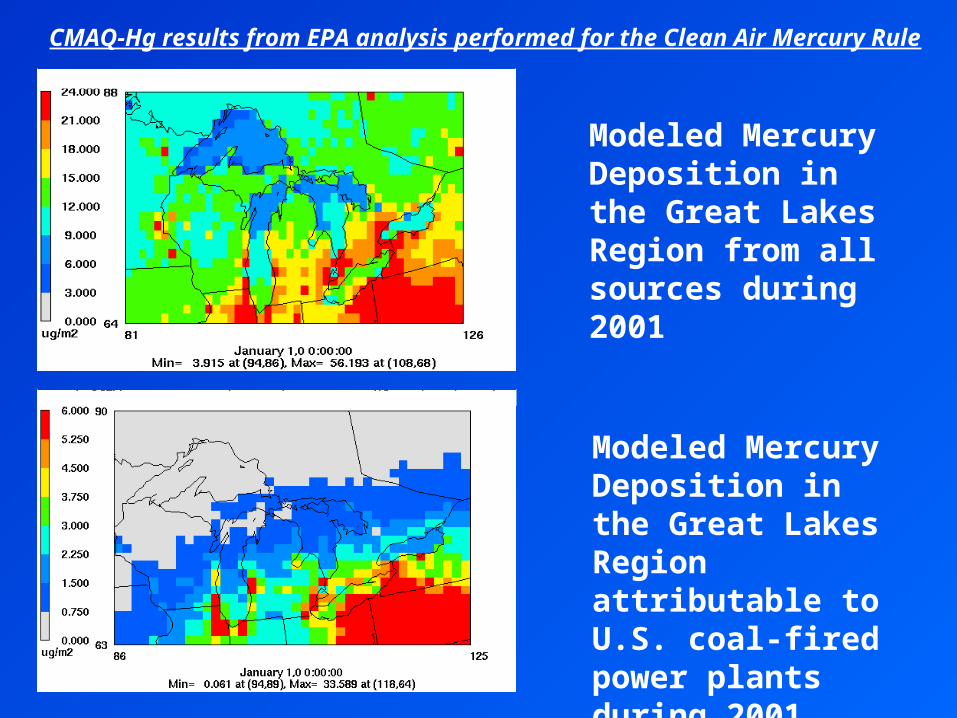
Modeled Mercury Deposition in the Great Lakes Region from all sources during 2001
Modeled Mercury Deposition in the Great Lakes Region attributable to U.S. coal-fired power plants during 2001
CMAQ-Hg results from EPA analysis performed for the Clean Air Mercury Rule

Erie Ontario Michigan Huron Superior0
1
2
3
4
5
6
7
8
De
po
sitio
n (
ug
/m2
-ye
ar) HYSPLIT
CMAQ
Model-estimated U.S. utility atmospheric mercury deposition contribution to the Great Lakes: HYSPLIT-Hg (1996 meteorology, 1999 emissions) vs. CMAQ-HG (2001 meteorology, 2001 emissions).
39

Erie Ontario Michigan Huron Superior0
1
2
3
4
5
6
7
8
De
po
sitio
n (
ug
/m2
-ye
ar)
HYSPLIT
25% added to CMAQ
CMAQ
Model-estimated U.S. utility atmospheric mercury deposition contribution to the Great Lakes: HYSPLIT-Hg (1996 meteorology, 1999 emissions) vs. CMAQ-Hg (2001 meteorology, 2001 emissions).
This figure also shows an added component of the CMAQ-Hg estimates -- corresponding to 30% of the CMAQ-Hg results – in an attempt to adjust the CMAQ-Hg results to account for the deposition underprediction found in the CMAQ-Hg model evaluation.
40
2. Local Deposition Comparison:HYSPLIT-Hg vs.ISC (Gaussian Plume)
Atmospheric Mercury Model Intercomparisons
3. Comparison of Utility Contributions to the Great Lakes:HYSPLIT-Hg vs. CMAQ-Hg
4. Summary
41
1. EMEP Mercury Model Intercomparison
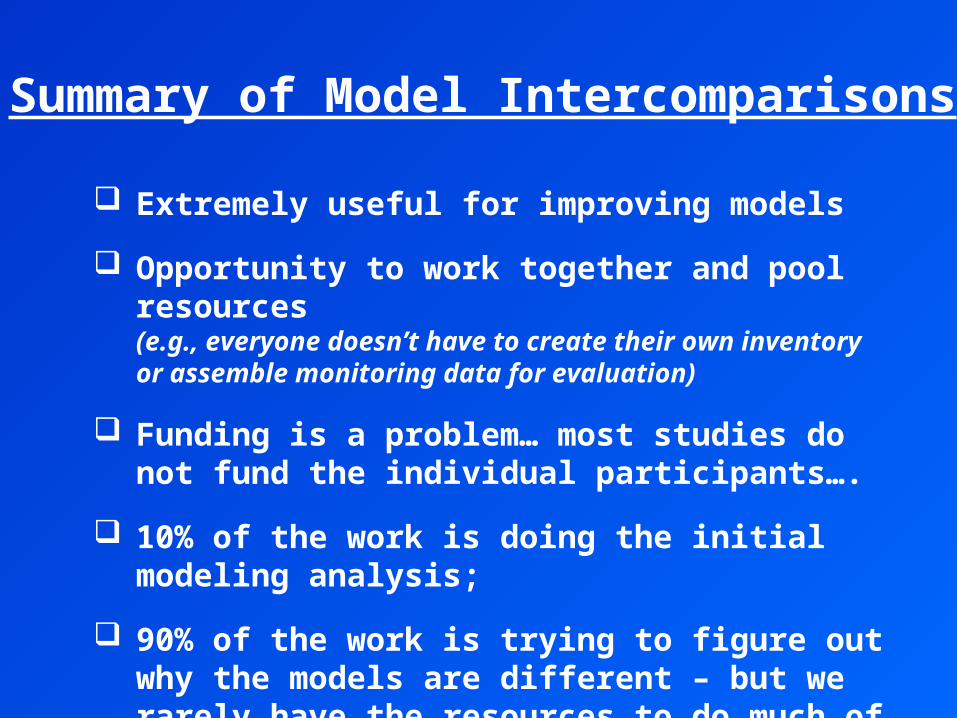
Summary of Model Intercomparisons
Extremely useful for improving models
Opportunity to work together and pool resources (e.g., everyone doesn’t have to create their own inventory or assemble monitoring data for evaluation)
Funding is a problem… most studies do not fund the individual participants….
10% of the work is doing the initial modeling analysis;
90% of the work is trying to figure out why the models are different – but we rarely have the resources to do much of this

Thanks!

Extra Slides
EMEP Intercomparison Study of Numerical Models for Long-Range Atmospheric Transport of Mercury
Intro-duction
Stage I Stage II Stage III Conclu-sionsChemistry Hg0 Hg(p) RGM Wet Dep Dry Dep Budgets
45
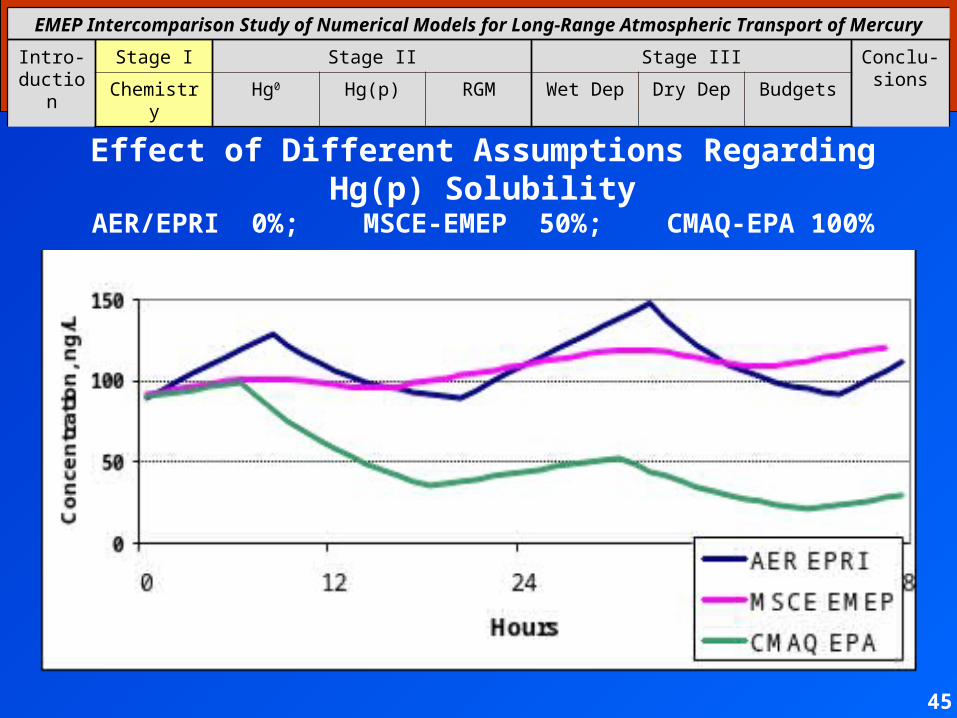
Effect of Different Assumptions Regarding Hg(p) SolubilityAER/EPRI 0%; MSCE-EMEP 50%; CMAQ-EPA 100%
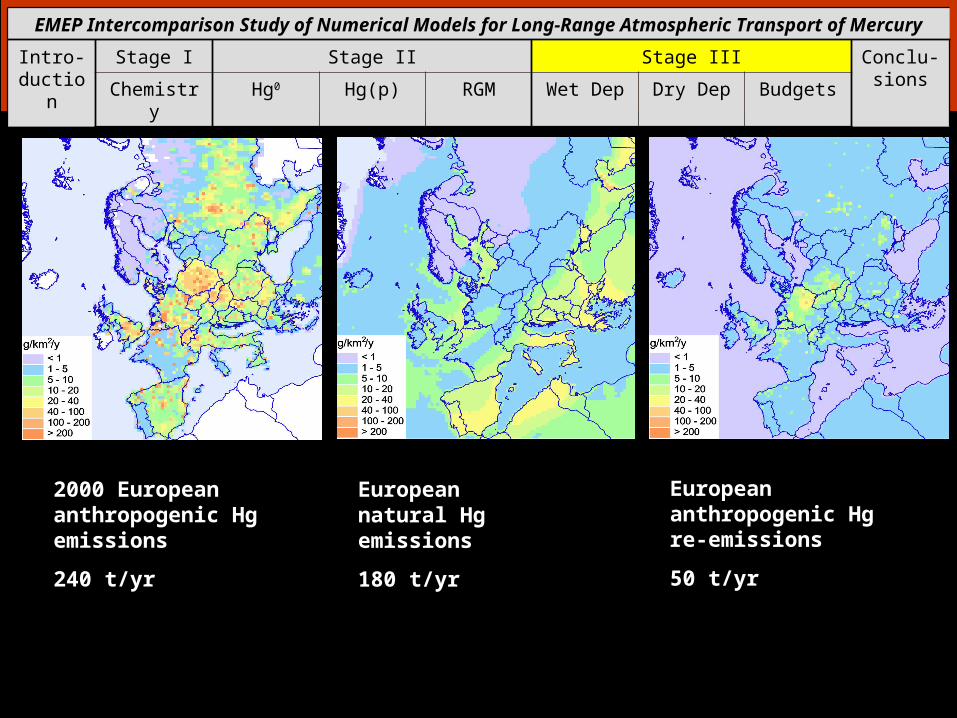
2000 European anthropogenic Hg emissions
240 t/yr
EMEP Intercomparison Study of Numerical Models for Long-Range Atmospheric Transport of Mercury
Intro-duction
Stage I Stage II Stage III Conclu-sionsChemistry Hg0 Hg(p) RGM Wet Dep Dry Dep Budgets
European anthropogenic Hg re-emissions
50 t/yr
European natural Hg emissions
180 t/yr
EMEP Intercomparison Study of Numerical Models for Long-Range Atmospheric Transport of Mercury
Intro-duction
Stage I Stage II Stage III Conclu-sionsChemistry Hg0 Hg(p) RGM Wet Dep Dry Dep Budgets
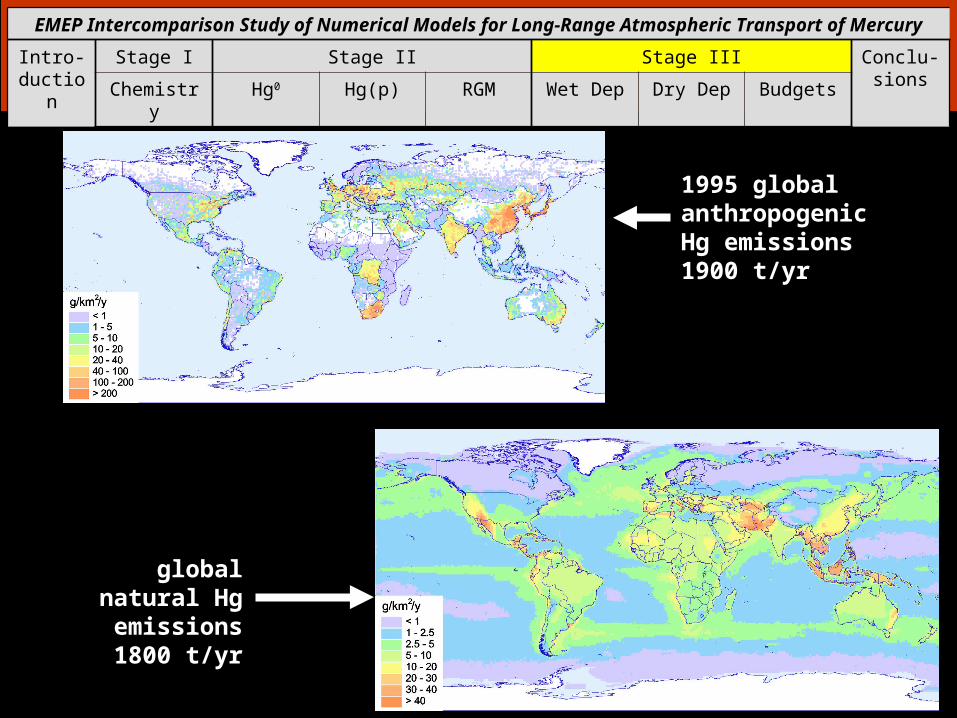
global natural Hg emissions1800 t/yr
1995 global anthropogenic Hg emissions1900 t/yr
EMEP Intercomparison Study of Numerical Models for Long-Range Atmospheric Transport of Mercury
Intro-duction
Stage I Stage II Stage III Conclu-sionsChemistry Hg0 Hg(p) RGM Wet Dep Dry Dep Budgets
48
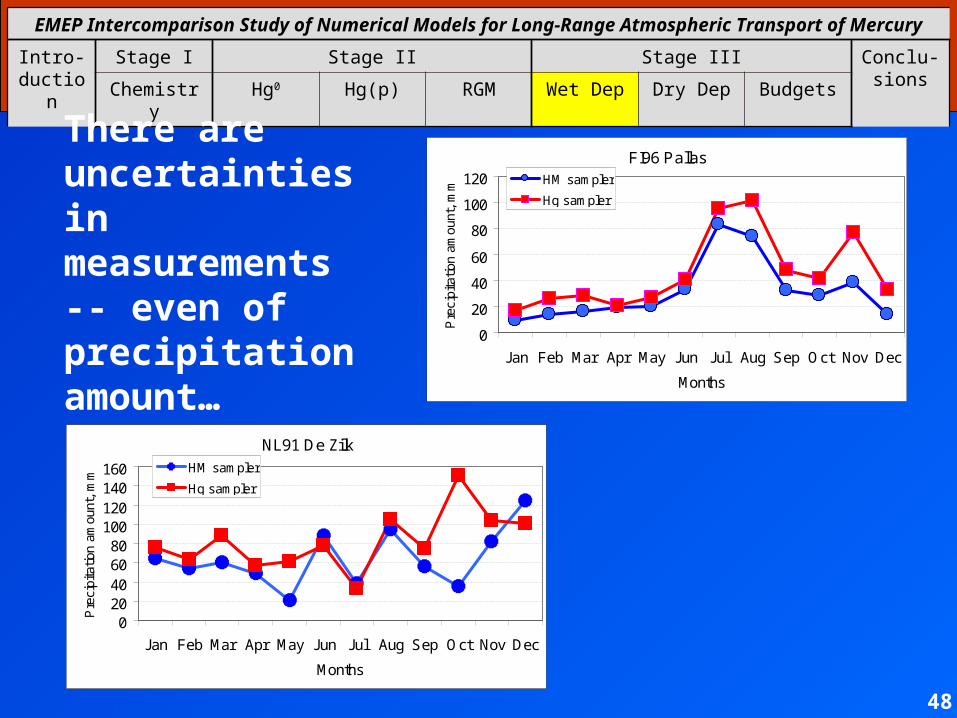
There are uncertainties in measurements -- even of precipitation amount…
NL91 De Zilk
020406080
100120140160
Jan Feb Mar Apr May Jun Jul Aug Sep Oct Nov Dec
Months
Pre
cipi
tatio
n am
ount
, m
m
HM sampler
Hg sampler
FI96 Pallas
0
20
40
60
80
100
120
Jan Feb Mar Apr May Jun Jul Aug Sep Oct Nov Dec
Months
Pre
cipi
tatio
n am
ount
, m
m
HM sampler
Hg sampler
EMEP Intercomparison Study of Numerical Models for Long-Range Atmospheric Transport of Mercury
Intro-duction
Stage I Stage II Stage III Conclu-sionsChemistry Hg0 Hg(p) RGM Wet Dep Dry Dep Budgets
DE01 DE09 NL91 NO99 SE02 SE11 SE12 SE05 FI96
Monitoring Station
0.0
0.5
1.0
1.5
wet
Hg
depo
sitio
n (g
/km
2-m
ont
h)
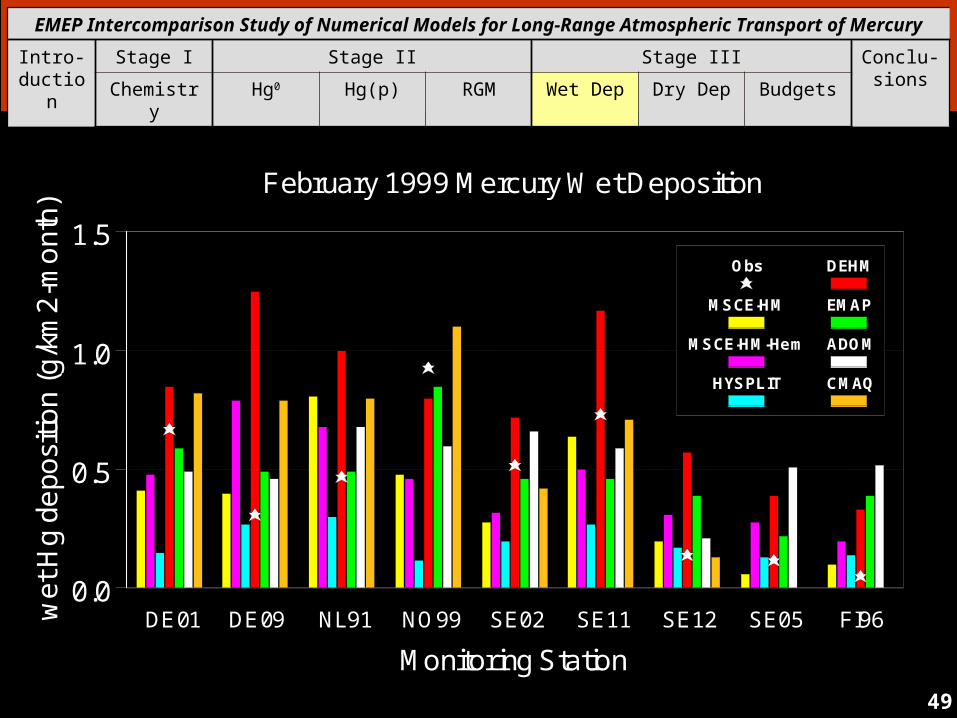
Obs
MSCE-HM
MSCE-HM-Hem
HYSPLIT
DEHM
EMAP
ADOM
CMAQ
February 1999 Mercury Wet Deposition
49
EMEP Intercomparison Study of Numerical Models for Long-Range Atmospheric Transport of Mercury
Intro-duction
Stage I Stage II Stage III Conclu-sionsChemistry Hg0 Hg(p) RGM Wet Dep Dry Dep Budgets
50
DE01 DE09 NL91 NO99 SE02 SE11 SE12 SE05 FI96
Monitoring Station
0.0
5.0
10.0
15.0
20.0
wet
Hg
depo
sitio
n (g
/km
2-y
ear)
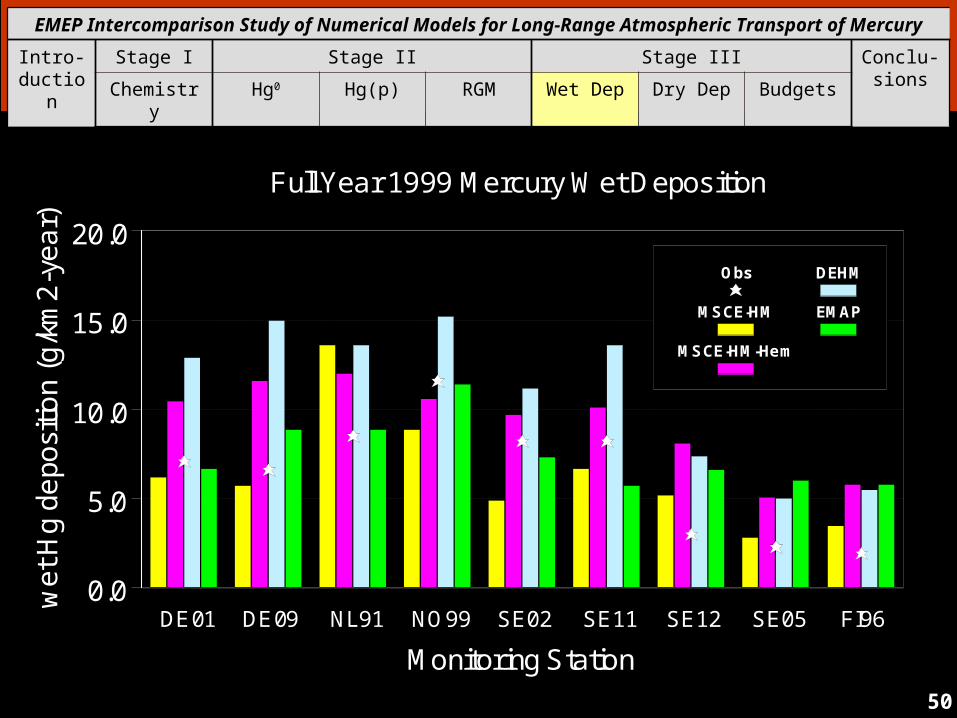
Obs
MSCE-HM
MSCE-HM-Hem
DEHM
EMAP
Full Year 1999 Mercury Wet Deposition

EMEP Intercomparison Study of Numerical Models for Long-Range Atmospheric Transport of Mercury
Intro-duction
Stage I Stage II Stage III Conclu-sionsChemistry Hg0 Hg(p) RGM Wet Dep Dry Dep Budgets
51
DE01 DE09 NL91 NO99 SE02 SE11 SE12 SE05 FI96
Monitoring Station
0.0
0.1
0.2
0.3
0.4
0.5
0.6
0.7
Hg
dry
depo
sitio
n (g
/km
2-m
onth
)
model avg
MSCE-HM
MSCE-HEM
HYSPLIT
DEHM
EMAP
ADOM
CMAQ
February 1999 Mercury Dry Deposition
EMEP Intercomparison Study of Numerical Models for Long-Range Atmospheric Transport of Mercury
Intro-duction
Stage I Stage II Stage III Conclu-sionsChemistry Hg0 Hg(p) RGM Wet Dep Dry Dep Budgets
52
DE01 DE09 NL91 NO99 SE02 SE11 SE12 SE05 FI96
Monitoring Station
0.0
1.0
2.0
3.0
4.0
5.0
6.0
7.0
Hg
dry
depo
sitio
n (g
/km
2-ye
ar)
model avg
MSCE-HM
MSCE-HEM
DEHM
EMAP
Full Year 1999 Mercury Dry Deposition
EMEP Intercomparison Study of Numerical Models for Long-Range Atmospheric Transport of Mercury
Intro-duction
Stage I Stage II Stage III Conclu-sionsChemistry Hg0 Hg(p) RGM Wet Dep Dry Dep Budgets
53
In the following, the total model-predicted deposition (= wet + dry) is compared
EMEP Intercomparison Study of Numerical Models for Long-Range Atmospheric Transport of Mercury
Intro-duction
Stage I Stage II Stage III Conclu-sionsChemistry Hg0 Hg(p) RGM Wet Dep Dry Dep Budgets
54
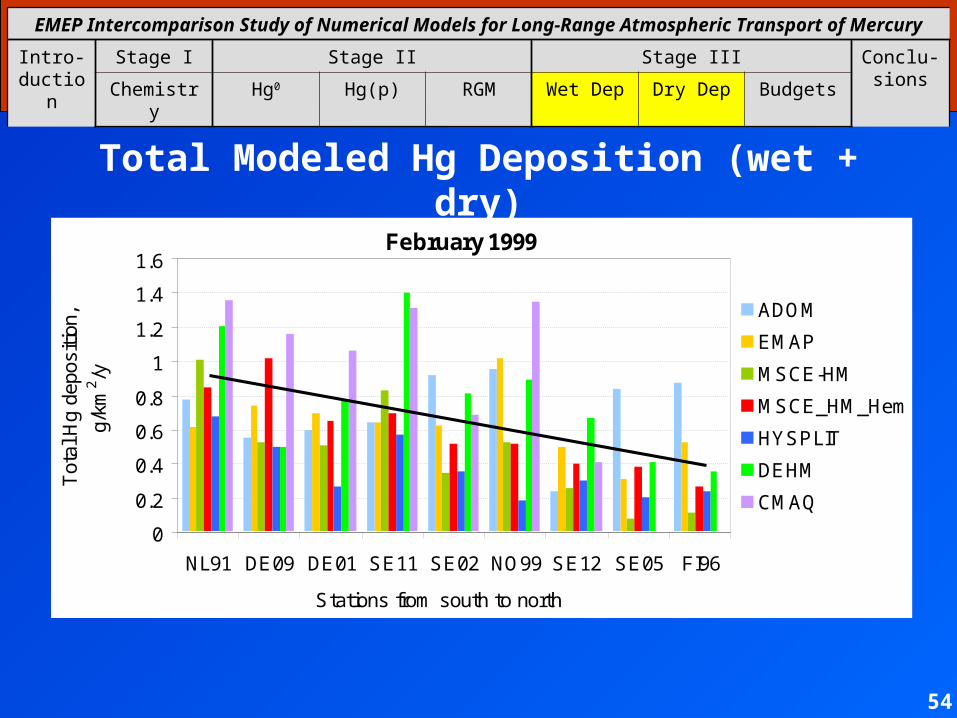
February 1999
0
0.2
0.4
0.6
0.8
1
1.2
1.4
1.6
NL91 DE09 DE01 SE11 SE02 NO99 SE12 SE05 FI96
Stations from south to north
Tot
al H
g de
posi
tion,
g/km
2/y
ADOM
EMAP
MSCE-HM
MSCE_HM_Hem
HYSPLIT
DEHM
CMAQ
Total Modeled Hg Deposition (wet + dry)
EMEP Intercomparison Study of Numerical Models for Long-Range Atmospheric Transport of Mercury
Intro-duction
Stage I Stage II Stage III Conclu-sionsChemistry Hg0 Hg(p) RGM Wet Dep Dry Dep Budgets
55
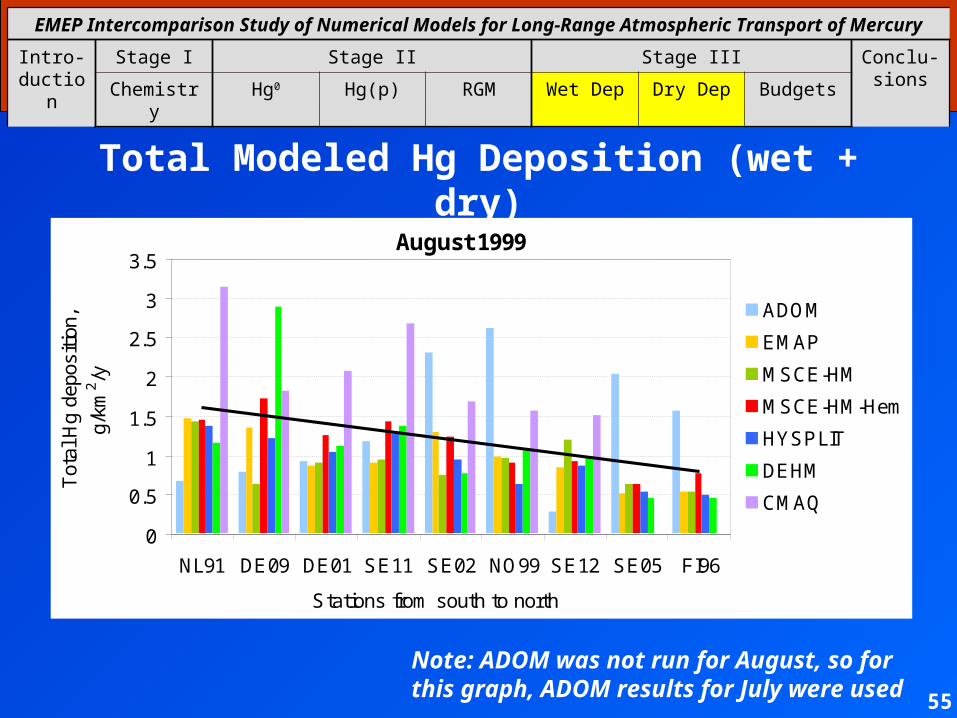
Total Modeled Hg Deposition (wet + dry)
August 1999
0
0.5
1
1.5
2
2.5
3
3.5
NL91 DE09 DE01 SE11 SE02 NO99 SE12 SE05 FI96
Stations from south to north
Tot
al H
g de
posi
tion,
g/km
2/y
ADOM
EMAP
MSCE-HM
MSCE-HM-Hem
HYSPLIT
DEHM
CMAQ
Note: ADOM was not run for August, so for this graph, ADOM results for July were used
EMEP Intercomparison Study of Numerical Models for Long-Range Atmospheric Transport of Mercury
Intro-duction
Stage I Stage II Stage III Conclu-sionsChemistry Hg0 Hg(p) RGM Wet Dep Dry Dep Budgets
56
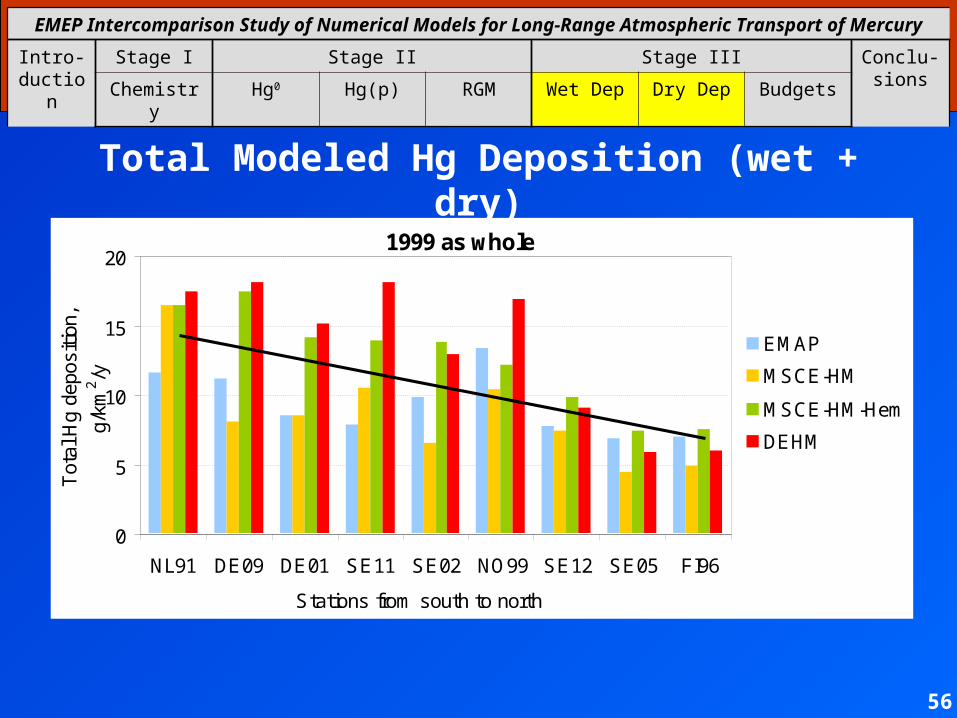
Total Modeled Hg Deposition (wet + dry)
1999 as whole
0
5
10
15
20
NL91 DE09 DE01 SE11 SE02 NO99 SE12 SE05 FI96
Stations from south to north
Tot
al H
g de
posi
tion,
g/km
2/y
EMAP
MSCE-HM
MSCE-HM-Hem
DEHM
EMEP Intercomparison Study of Numerical Models for Long-Range Atmospheric Transport of Mercury
Intro-duction
Stage I Stage II Stage III Conclu-sionsChemistry Hg0 Hg(p) RGM Wet Dep Dry Dep Budgets
57
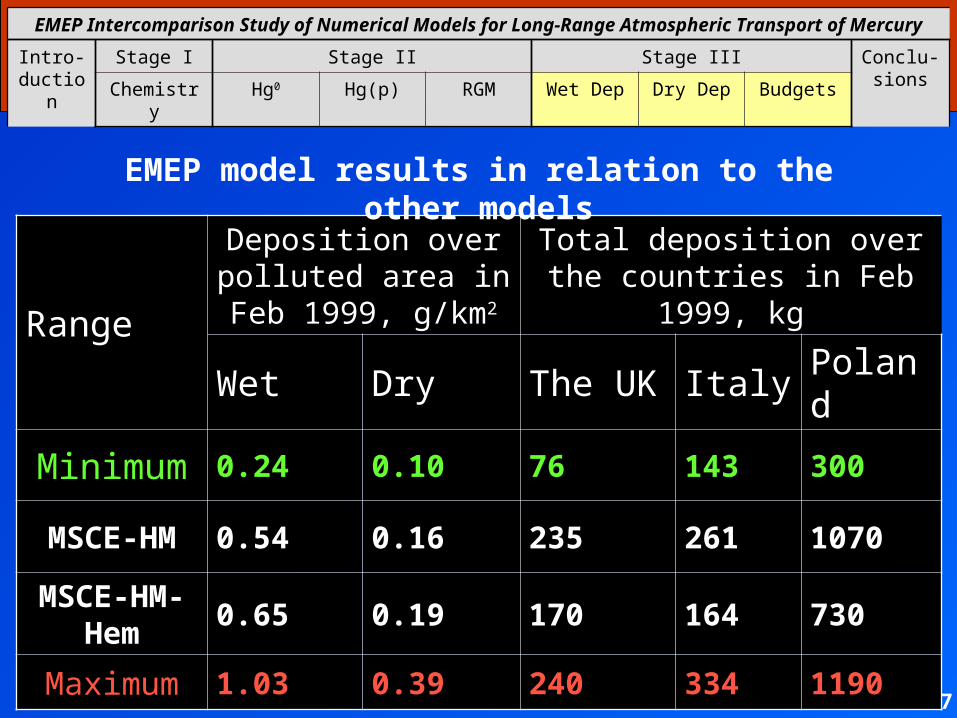
Range
Deposition over polluted area in Feb
1999, g/km2
Total deposition over the countries in Feb 1999, kg
Wet Dry The UK Italy Poland
Minimum 0.24 0.10 76 143 300
MSCE-HM 0.54 0.16 235 261 1070
MSCE-HM-Hem
0.65 0.19 170 164 730
Maximum 1.03 0.39 240 334 1190
EMEP model results in relation to the other models
EMEP Intercomparison Study of Numerical Models for Long-Range Atmospheric Transport of Mercury
Intro-duction
Stage I Stage II Stage III Conclu-sionsChemistry Hg0 Hg(p) RGM Wet Dep Dry Dep Budgets
58
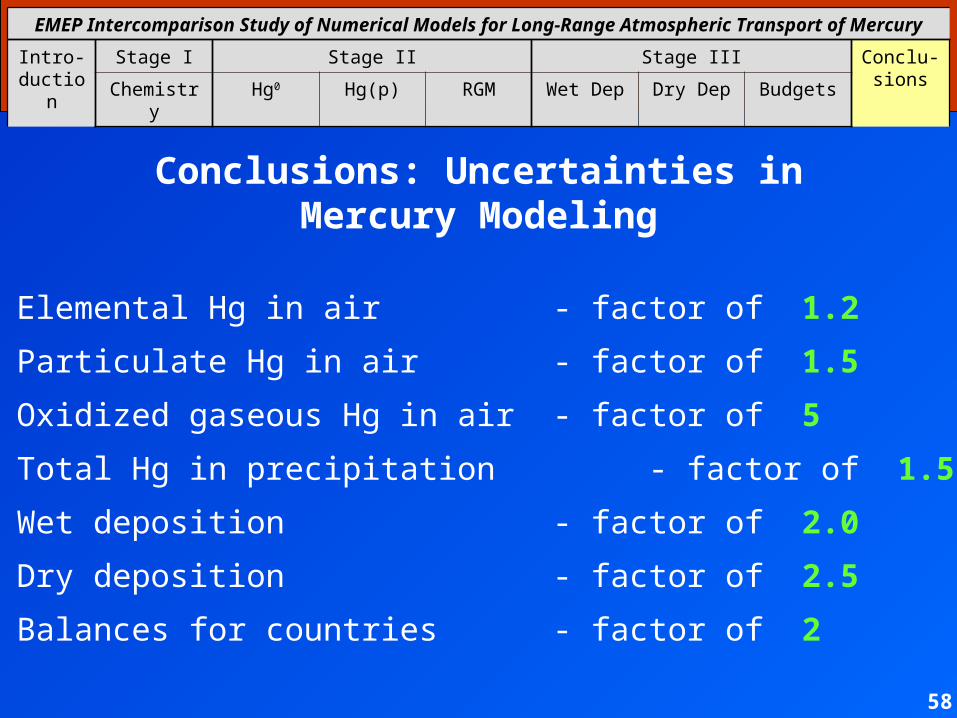
Conclusions: Uncertainties in Mercury Modeling
• Elemental Hg in air - factor of 1.2
• Particulate Hg in air - factor of 1.5
• Oxidized gaseous Hg in air - factor of 5
• Total Hg in precipitation - factor of 1.5
• Wet deposition - factor of 2.0
• Dry deposition - factor of 2.5
• Balances for countries - factor of 2


![PHOTOGRAPHS OF NIAGARA, MARINETTE … of Niagara... · PHOTOGRAPHS OF NIAGARA, MARINETTE COUNTY, WISCONSIN [Compiled and Captioned by William John Cummings] 3 View of Niagara, Wisconsin,](https://img.pdfslide.us/doc/110x75/5b993acd09d3f207308b54bc/photographs-of-niagara-marinette-of-niagara-photographs-of-niagara-marinette.jpg)