Embed Size (px)
Citation preview

Vol. 156: 299-309,1997 MARINE ECOLOGY PROGRESS SERIES Mar Ecol Prog Ser
Published September 25
Atmospheric input of lead into the German Bight- a high resolution measurement and model case
study
K. Heinke S~hliinzen'~', Thomas Stahlschmidt2, Andreas ~ e b e r s ~ , Ulrike Niemeierl, Michael Kriews3, Walter an neck er^
'Zentrum fiir Meeres- und Klimaforschung der Universitat Hamburg, Meteorologisches Institut. Bundesstr. 55, D-20146 Hamburg, Germany
21nstitut fiir Anorganische und Angewandte Chemie, Universitat Hamburg, Martin-Luther-King-Platz 6, D-20146 Hamburg, Germany
3~l fred-~egener-~nst i tut fiir Polar- und Meeresforschung, Postfach 120161, D-27515 Bremerhaven, Germany
ABSTRACT: The atmospheric input of lead into the German Bight is calculated from measured atmos- pheric concentrations, from modelled as well as measurement-derived deposition velocities, and from measured wet deposition values, with a temporal resolution between 6 and 24 h. The measurements were taken at several coastal sites and on a ship in the German Bight during a 1 wk drift experiment in April 1991. The applied model is a 3-dimensional nonhydrostatic atmospheric mesoscale model. The calculated input data depend on deposition velocities and integration time. Due to variation in dry deposition the atmospheric input values can differ by a factor of 3. Total deposition values and thus atmospheric input data can differ by a factor of 10. Calculated backward trajectories show that the observed time-lag in the occurrence of concentration maxima can be explained by the travel time of the advected air masses between the measurement sites. By use of backward trajectories and results of the mesoscale model the measured values are associated with source areas for a day with very high atmos- pheric lead concentrations. It is shown that up to 50% of the contaminants can reach the German Bight via long-range transport. Mesoscale atmospheric phenomena also influence the wind field and the con- centrations.
KEY WORDS: North Sea. German Bight. Atmospheric input. Dry deposition. Wet deposition . Atmos- pheric lead concentration . Mesoscale model
INTRODUCTION
The pollution of marginal seas is caused by inputs not only from rivers, coastal industries, and dumping but also from the atmosphere in considerable amounts. This is especially true for the North Sea, which is situ- ated close to major industrial centres and highly popu- lated areas. The input quantities have been widely dis- cussed in earlier papers (e.g. INC 1987, Warmenhoven et al. 1989, QSR 1993) and thus are only briefly sum- marized here. Fig. l a shows the relative contributions of the atmosphere and other paths for the whole North Sea area. The values are based on the data compiled
for the Second International North Sea Conference (INC 1987). The input via the atmosphere amounts to more than two thirds of the total for cadmium and lead and to more than one third for zinc and copper. The data for the German Bight compiled in Fig. l b are based on the input values for the Wadden Sea area (Schliinzen 1994a) recalculated for the German Bight (area: 24000 km2). Due to the proximity of the river estuaries, the proportion of the atmospheric input is lower for the more coastal area compared to the whole North Sea. However, it still accounts for a considerable amount of lead and cadmium as well as of some organic contaminants which are not regarded here.
The relative contributions given in Fig. 1 correspond to annual means. These are strongly influenced by
0 Inter-Research 1997 Resale of full article not permitted

300 Mar Ecol Prog Ser 156: 299-309, 1997
North Sea l 1 m
] b German B~ght
Fig. 1. Fractional inputs ( O h )
into (a) the North Sea (data from INC 1987) and (b) the German Bight (data from
Schliinzen 1994a)
short-term deposition events, as has been derived from long-term investigations (Dannecker et al. 1994, Ker- sten et al. 1994). Measurements and model results show that the atmospheric input can change consider- ably within 1 d. This can be caused by changes in con- taminant concentration in air due to a wind shift, as shown in this paper (factor of 50: section 'Measured concentrations' below), and by changes in deposition velocity due to different atmospheric stratification and wind velocity (factor of 2: Schliinzen & Krell 1994). Additionally, wet deposition can enhance dry deposi- tion by up to a factor of 10 within a few hours (section 'Calculated atmospheric input ...' below; Spokes et al. 1993). For this reason, studies of transfer processes in the ecosystem as described by Sundermann (1997 in this volume) need input data with a temporal resolu- tion of a few hours.
To investigate the transfer processes in the German Bight ecosystem, lead was used as a key contaminant in the German research project PRISMA. Lead is released into the marine environment by river dis- charges, atmospheric deposition, relllobilization iron1 sediment and removal from bacterio-, phyto-, zoo- plankton and other biota it might be incorporated within or attached to. The accumulation factors for phytoplankton can be much higher for lead than they are for other heavy metals (Karbe et al. 1994). Most lead, however, is bound to the body surface and only a little is incorporated. Therefore, lead is a less crucial heavy metal for the plankton than e.g. mercury is. Nevertheless, lead is suitable for studying temporal concentration changes in the ecosystem, because it is found and can reliably be measured in all compart- ments of the ecosystem (including the atmosphere;
Kersten et al. 1992, Kriews 1992, Krause et al. 1994). In addition, the atmospheric transport and deposition of other heavy metals like cadmium is similar to that for lead, which makes lead a very good example for study- ing the atmospheric input.
Since the atmospheric contribution to the mean input is high for lead (see Fig. 1) some effort has to be made to estimate the atmospheric input of lead into the sea at a resolution matching the measurements in the water. Since i t is not possible to measure the dry deposition directly with a high temporal resolution, the values presented in this paper are calculated from high reso- lution concentration measurements (section 'Measur- ing atmospheric concentrations') and model results (section 'Modelling atmospheric concentrations and deposition'). The resulting deposition values and derived input data are given in the section 'Calculated atmospheric input.. .'.
MEASURING ATMOSPHERIC CONCENTRATIONS
The atmospheric concentrations of lead and other heavy metals were measured at 5 sites in the area of the German Bight during the first PRISMA experiment. It was performed in April 1991 and included 3 drift- experiment periods. Details on the experiment are given by Brockmann et al. (1997 in this volume). Below, atmospheric concentrations and the atmos- pheric input are presented for the third drift period (April 23 to 30, 1991). Measurements and model results for other compartments of the ecosystem are given by Konig et al. (1997), Moll (1997) and Raabe et al. (1997) (all in this volume).
Schliinzen et al.: PRISMA-Atmospheric input of lead 301
Measurement strategy
Durlng the experiment, bulk aerosol samples were taken on board the RV 'Valdivia', from which mea- surements in the water column were also performed. For interpretation of the measured atmospheric con- centrations, additional samples were taken at the Ger- man research platform Nordsee (FP 'Nordsee'), at the isle of Helgoland, and at 2 coastal measurement sites, namely Westerhever on the Eiderstedt peninsula and Neuharlingersiel on the East Frisian coast (see Fig 8 for the location of the sites). The sampling intervals were scheduled on board RV 'Valdivia' depending on the local wind direction and in consistency with other meteorological measurements, e.g. the rawinsonde ascents (Schrum et al. 1997 in this volume). During periods of easterly wind directions, when air masses of continental origin were advected, the temporal resolu- tion of the measurements was increased. The atmos- pheric aerosol was accum.ulated for 6 h, thus the mea- surements were 6-hourly integrations. For westerly wind directions, when the advected air was very clean, the intervals were extended to 24 h . The measured alr concentrations confirmed this sampling strategy, since they clearly changed for different wind directions dur- ing the drift experiment.
Aerosol was collected at a fixed inlet velocity on pre- washed cellulose nitrate filters under non-isokinetic con- ditions. Under these conditions, the upper size limit of the collected particles depends on the wind velocity (Zebel1979). The maximum aerodynamic diameters lie at about 30 pm for no-wind conditions (Kriews 1992) and are lower for higher wind velocities. Trace element analysis was performed with Graphite Furnace Atomic Absorption Spectrometry (GF-AAS) after a wet oxidative acid digestion procedure. Rain samples were collected with a specially prepared funnel on a n event basis on board RV 'Valdivia' and with automatic rain collectors or bulk samplers at Westerhever and Neuharlingersiel. On board RV 'Valdivia' sample preparation and handling
were carried out under clean room conditions. Sampling and analytical techniques are described in detail by Kriews (1992) and Schulz (1993).
Measured concentrations
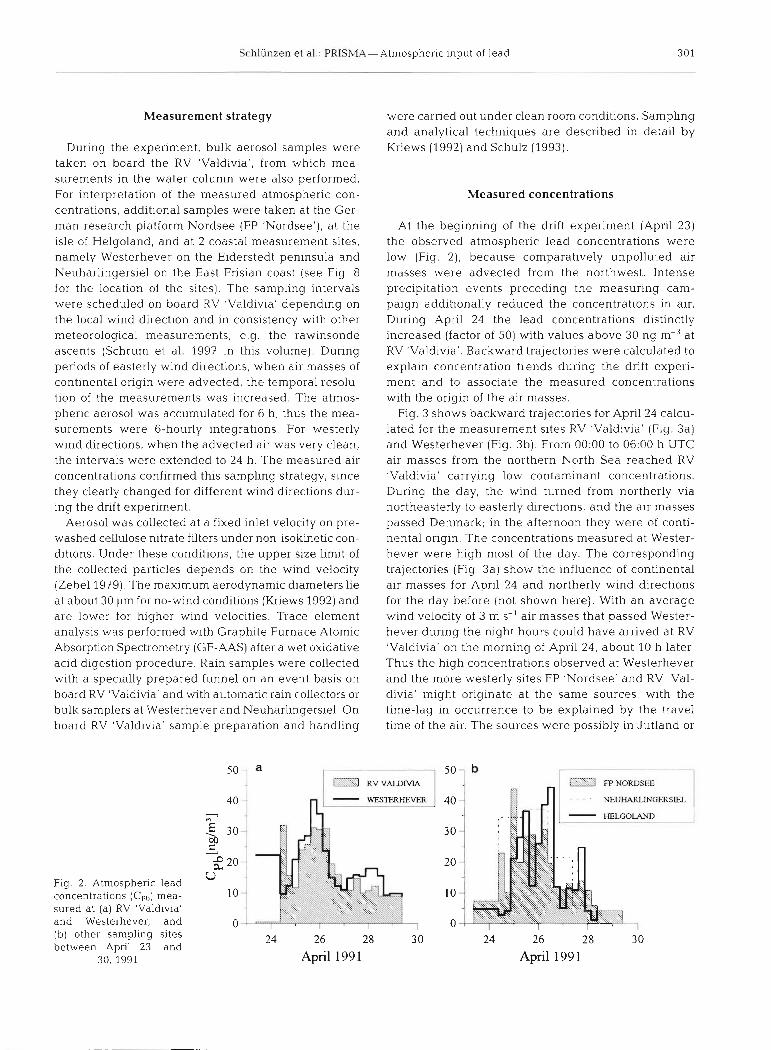
At the beginning of the drift experiment (April 23) the observed atmospheric lead concentrations were low (Fig. 2), because comparatively unpolluted air masses were advected from the northwest. Intense precipitation events preceding the measuring cam- paign additionally reduced the concentrations in air. During April 24 the lead concentrations distinctly increased (factor of 50) with values above 30 ng m-3 a t RV 'Valdivia'. Backward trajectories were calculated to explain concentration trends during the drift experi- ment and to associate the measured concentrations with the origin of the air masses.
Fig. 3 shows backward trajectories for April 24 calcu- lated for the measurement sites RV 'Valdivia' (Fig. 3a) and Westerhever (Fig. 3b) . From 00:OO to 06:OO h UTC air masses from the northern North Sea reached RV 'Valdivia' carrying low contaminant concentrations. During the day, the wind turned from northerly via northeasterly to easterly directions, and the air masses passed Denmark; in the afternoon they were of conti- nental origin. The concentrations measured at Wester- hever were high most of the day. The corresponding trajectories (Fig. 3a) show the influence of continental air masses for April 24 and northerly wind directions for the day before (not shown here). With a n average wind velocity of 3 m S-' air masses that passed Wester- hever during the night hours could have arrived a t RV 'Valdivia' on the morning of April 24, about 10 h later. Thus the high concentrations observed at Westerhever and the more westerly sites FP 'Nordsee' and RV 'Val- divia' might originate at the same sources, with the time-lag in occurrence to be explained by the travel time of the air. The sources were possibly in Jutland or
R V V A L D M A :>$TtT FP N O ~ S ~ F
NEUHARIINOERSIEL
HELGOLAM)
Fig. 2. Atmospheric lead concentrations (Cp,,) mea- sured at (a) RV 'Valdivia' and Westerhever, and (b) other sampling sites between April 23 and
24 26 28 3 0
30, 1991 April 199 1 24 26 28 3 0
April 199 1

Mar Ecol Prog Ser 156: 299-309, 1997
1 Ea&wardlramclr*W S u k e wmd Dsstlnencm. FS Wine' I Emlrrreloa: I
Fig. 3. Backward wind trajectories for (a) RV 'Valdivia' and (b) Westerhever for April 24, 00:OO to 24:OO h UTC
over the continent, but cot close tc the German Bight. On the same day, the concentrations were still low at the more southerly measurement site Helgoland, whereas the East Frisian coastal measurement site Neuharlingersiel showed higher concentrations (Fig. 2b). The difference can be explained by the mesoscale flow pattern (see Fig. 6) which shows that different air masses are advected to these measurement sites. Pos- sibly, these 2 air masses have different sources situated close to the German Bight. These hypotheses are con- firmed by the mesoscale model results, as will be shown below ('Modelling atmospheric concentrations and deposition-Model results').
Fig. 4 shows backward trajecto- ries for April 25 to 27, 1991, calcu- lated for RV 'Valdivia'. During this time interval, air masses with high concentration levels reached RV 'Valdivia' as well as the other mea- surement sites. As can be seen from the backward trajectories, the sam- pled air masses had somewhat dif- ferent origlns during the 2 days. On April 25 the air crossed Schleswig- Holstein and was possibly of conti- nental origin again. Thus, highly polluted air was advected. During April 26 the wind changed slightly to northeasterly directions, and air masses transported over the Baltic Sea, passing the southern region of Sweden, reached the sampling site. The concentrations decreased dur- ing April 26. Rain events which were observed over land can only partly explain the reduction; it was mainly caused by the wind shift and thus differences in the source areas.
In the following days the mea- sured atmospheric concentrations were around 10 ng m-3 at RV 'Val- divia', and the probed air masses at the measurement sites were mainly advected from northerly and north- easterly directions. The concentra- tions were at times reduced by pre- cipitation which occurred over land. over the German Bight, and around the ship. On the 28th RV 'Valdivia' was in a precipitation area and wet deposition samples could be taken at this site.
MODELLING ATMOSPHERIC CONCENTRATIONS AND DEPOSITION
The model calculations were performed using the 3- dimensional, nonhydrostatic atmospheric mesoscale transport and flow model METRAS. The model was developed at the Meteorological Institute, University of Hamburg, for the calculation of atmospheric flows in the mesoscale-7 and mesoscale-P range (Schliinzen 1990, Wu & Schlunzen 1992, Niemeier & Schliinzen 1993) and for pollution transport studies especially in coastal areas (Schliinzen & Pahl 1992, Schliinzen 1994a, Schlunzen & Krell 1994). In the present paper

Schlunzen et al.: PRISMA-Atrnosphenc input of lead 303
and atmospheric stratification fol- 26Av1' '391 09W U-C IU Z : A ~ I 1-1 W uu UTC
lows Dunst (1982). A surface energy
the model 1s used to calculate the deposition veloclty and is applied in a 3-dimensional case study of lead deposition
Description of the atmospheric transport model
An expllclt description of the model is given in Schlunzen (1988, 1990) and Schlunzen et a1 (1996) The main features are typical for nonhydrostatic mesoscale models, as can be seen from Schlunzen (1994b) Here, only those qualities of the model are descnbed in detail whlch
Ba~hwald IrdK'WlCS Surtace w l M Desl~nalfon FS Valohla Erpbral!ons 2 5 ~ ~ 1991 3 9 ~ ~ U T C I C Z ~ A D ~ I l W l C ~ O O U T C Number of lralecrnrres 25 are Important for the slnlulation of M a x I f ~ l l m e 60h Trne~nr-n I r hleanwo*jue\ocly 2 9 m r Plo't-3 lraiecrores 25
contaminant transport over coastal
budget equation is applied to corn- Fig. 4 Backward wind trajectories for RV 'Valdlv~a' for ( a ) Apnl 25, 09:OO h UTC, pute the time-dependent surface to April 26, 09:OO h UTC, and (b) Apnl 26, 09:OO h UTC, to Apnl 27, 09:OO h UTC
temperature over land and mudflats. A corresponding equation is used for humidity. Dry deposition is calculated as a function of water: Garratt & Hicks 1973). These are also consid- deposition velocity Vd and concentration C at the low- ered in the values for the surface resistances, which est grid point above the surface, following the resis- are taken from Walcek et al. (1986). The deposition ve- tance model concept (e.g. Chang et al. 1987): locity of lead is determined differently, since lead is
transported on aerosols of a particle size between 0.1 Vd.C = ( r , + r m + r s ) - ' . C
and 1 pm (Seinfeld 1986). Following Voldner et al. The atmospheric resistance r, depends on the calcu- (1986), the surface resistances rs are taken to be zero
lated wind velocity and atmospheric stability. For for particles. The values for the sublayer resistances r,, gases, the sublayer resistance rm and the surface resis- depend on land use characteristics and short wave ra- tance rs both have to be taken into account. The sub- diation. Over water, the sublayer resistance is zero, re- layer resistances are calculated with respect to differ- sulting in higher deposition velocities over water com- ent land use characteristics (urban areas: Brutsaert pared to the values over land. Neglecting the sublayer 1975; vegetation, mudflats: Weseley & Hicks 1977; resistance r, over water is equivalent to neglecting
areas and for modelling dry deposl- tion
The model is based on the funda-
b sw~/ul A- u.--.&d ~ d 7 / S 58 r i l l
S JY mental conservation principles of ,l
c/- 4
fluid dynamics, namely those of mass, momentum and energy Wind B
i \
field, temperature, humidity, cloud d i
and ralnwater content, as well as tracer concentrations are calculated from prognostic equations, pressure and denslty from diagnostic ones The subgnd-scale turbulent fluxes important for the dispersion of emit- ted contarmnants are parameterlzed
' I 2
with a flrst-order closure scheme The determlnatlon of exchange coef- ficients dependent on wlnd shear
BaCkwa d l r B p totar Sudacw w l d ks11ra.k-r FS Valbvln

Mar EcolProg Ser 156: 299-309, 1997
smaller particles In this area. In the present study only hygroscopic aerosols (e.g, s.ulphate) of a particle size above 0.8 pm are considered in the modelled deposi- tion velocities. Thus, the deposition velocities calcu- lated here are in the high end of the possible range.
With the described features, the atmospheric meso- scale model can be applied to simulate a realistic diur- nal cycle of the atmospheric boundary layer height and of vertical mixing, as well as of wind, temperature, humidity, and precipitation fields. In addition, the tracer transport and dry and wet deposition can be cal- culated at a high temporal and spatial resolution. Thus the deposition velocity and the atmospheric concentra- tion can be calculated at the same temporal resolution as is necessary for comparison with and interpretation of measurements.
Model results
In the case study presented In this paper, cloud development and wet deposition processes have not been included, because wet deposition took place directly at the measurement site RV 'Valdivia' only for a few hours (see the section 'Measured concentrations' above).
The l-dimensiona.1 version of the mesoscale model METRAS was applied to calculate the dry deposition velocity corresponding to the measurement intervals given in Fig. 2. The model was initialized for a neutral atmospheric stratification and with the wind velocities measured at RV 'Valdivia' (Schrum et al. 1997). The resulting deposition velocities are given in Fig. 5 Most of the time the simulated deposition velocities are around 0.6 cm S-'. On April 27 the values are highest ( l .? cm S-'), because the wind velocities were above 10 m S-' for some hours. The modelled values are in the range given by measurements over the Great Lakes
23 24 25 26 27 28 29 30 April 199 1
Fig. 5. Simulated deposition velocities for lead, dependent on measured wind velocities at RV 'Valdivia' for the measure-
ment intervals given in Fig. 2a
(Voldner et al. 1986) and above the values (by a factor of 2 to 10) calculated from impactor measurements (Steiger et al. 1989, Kriews 1992, Dannecker et al. 1994). The discrepancy can be explained by the aerosol spectrum, for which different assumptions are made when calculating deposition velocities in the model and from the impactor measurements. In the aerosol spectrum applied to measurements, the parti- cle growth due to the high humidity over water sur- faces and thus the increase in aerosol mass is not con- sidered. In contrast, the METRAS model results are based on the dssumption that lead is transported over water on sulphate aerosol which has grown (particle size above 0.8 pm). Both calculations neglect the bi- modal particle size distribution found over the sea (Steiger et al. 1989, Schulz et al. 1994). For this reason, the modelled deposition velocities characterise the upper limit of the deposition velocity values, whereas the deposition velocities calculated from the impactor measurements mark the lower limit for Vd over water.
Very high concentrations were measured at the northern sampling sites on April 24. For this day back- ward trajectories show that long-range transport might have caused the high concentrations (section 'Mea- sured concentrations' above). To confirm this hypothe- sis, the 3-dimensional version of the METRAS model was appljed. The model, was initialized with mean pro- files derived from the rawins0nd.e data taken from RV 'Gauss' (April 23: 10:OO h UTC; April 24: 10:00, 16:00, 22:OO h UTC), which was close to RV 'Valdivia' in the German Bight. The mean stratification in the atmos- phere generally was slightly stable with an inversion at an altitude of 2000 m. The wind velocity close to th.e ocean surface was 4.2 m s ' from the northeast an.d the water temperature was 7.2"C. For details on the mete- orological situation see Schrum et al. (1997). The lead emission data for Germany were taken from Munch & Axenfeld (1990); they correspond to emission values for 1987. Because of the emission redu.ctlons carried out in Germany in the meantime, the values used in the model for Germany lie above the emiss~ons for 1991 The sources in the model areas representing Denmark and the Netherlands were appropriately esti- mated, but point sources were neglected.
In Fig. 6 the simulated wind and temperature fields are given for a height of 10 m, above the ground for 08:OO and 14:OO h UTC. In the morning the fie1d.s are quite homogeneous-the air temperature over the land is about 2°C higher than over the German Bight. The wind comes from easterly directions and the wind velocity is slightly higher over the German Bight (3 to 4 m SS ' ) than over land ( l to 2 5 m S-'). During the day, the temperature rises up to ab0u.t 12°C over the land surfaces (Fig 6b). Since the temperature over water does not change correspondingly, the resulting tem-

Schlunzen et a1 PRISMA-Atrnosphenc input of lead
Fig. 6. Simulated wind and temperature f~eld for the area of the German Bight for Apnl 24 (a) 08 00 h UTC, (b) 14:00 h UTC Temperature increment 1s 1°C
perature difference at the coast causes a convergence zone with a wind parallel to the coast. At the East Frisian coast the modelled wind velocity is highest (up to 6 m S-') whereas it is lower in the area of the German Bight (3 to 6 m S-'), at the North Frisian coast and over land (both 1 to 3 m S-'). The simulated wind and tem- perature fields correspond to the observed wind direc- tions and temperatures over land, but show a differ- ence in wind direction of 30" relative to the directions measured at RV 'Valdivia'
The wind flelds influence the deposition field as can be seen from Fig. 7 The hourly dry deposition values are between 200 and 300 ng m-2 h ' at 08:OO h UTC. Durlng the day the boundary layer height increases, and the concentrations (not shown here) close to the surface decrease over the German Bight and at the North Frisian coast. They increase at the East Frisian coast. These model findings are consistent with the measurements (Fig. 2) . Lower concentrations were measured at Westerhever and Helgoland during the

Mar Ecol Prog Ser 156: 299-309, 1997
afternoon, whereas the concentrations were higher at Neuharlingersiel. The concentrations measured at these sites probably originate from sources close to the German Bight. However, large-scale transports were also ~mportant; they influenced the concentration level and caused the increase in concentration at FP 'Nord- see' and RV 'Valdivia' (see the section 'Measured con- centrations' above).
The deposition velocity remains about the same fur- ther offshore during the day, but decreases in the con- vergence zone at the North Frisian coast (1.2 mm s-'). For this reason and due to the reduced concentra- tions, the atmospheric input is mostly lower in the afternoon compared to 08:OO h UTC, and minimum input values are to be found close to the North Frislan coast. Only at the East Frisian coastline, where higher deposition velocities and concentrations are modelled, is the atmospheric input higher at 14:OO h than at 08:OO h UTC.
The simulated lead concentrations are around 13 ng m-3 at RV 'Valdivia'. This value is lower by up to a fac- tor of 3 than the concentrations measured there on April 24 (32, 17 and 13 ng m-3; Fig. 2a). There are 3 possible explanations. The simulated wind field gives a wind direction for the drift area which is 30" too far to the north, and thus some sources in Schleswig-Hol- stein might not have contributed to the concentrations modelled for the measurement site RV 'Valdivia'. However, this effect seems to be of minor importance since the backward trajectories presented in Fig. 3 indicate that the contaminants have been transported over Denmark. The second reason might be the ernis-
sion data. While these were too high for Germany, the emission values estimated for the southern part of Den- mark were too low and did not include industrial point sources. However, only the very southern part of Den- mark is included in the model calculations and most of the sources there are included. The third reason again focuses on missing emission data. These might not be missing in the model area itself, but fluxes across the lateral boundaries- which can include influences of remote sources-might be underestimated. In the sim- ulations they are assumed to produce background con- centration values outside the model area. If long-range transport were included in the model calculations, these values would have to be considerably higher. It can be concluded from mesoscale model results and backward trajectories that during the first measure- ment interval on April 24 at least 50% of the concen- trations measured at RV 'Valdivia' had sources outside the model area and that long-range transport was responsible for the increase in concentration. Sources at a distance of up to 100 km may have caused concen- trations of 13 ng m-3 for the day examined.
CALCULATED ATMOSPHERIC INPUT - MERGED MEASUREMENT AND MODEL RESULTS
Fig. 8 shows lead deposition values calculated with 3 different methods at the 5 sampling sites for the period of the drift experiment. The dry deposition rates, Fdlr are based on the concentration measurements and an average deposition velocity for lead of 0.17 cm S-',
1 Neuharhgersiel 2 FP NORDSEE 3 Westerheversand
5 RV V A L D M A
Fig. 8. Mean daily dry deposition values of lead (pg m-? d-l) calculated
10 201L with deposition veloci- ties based on impactor
o measurements. Fdlr and with modelled deposition
Fdl Fw velocities, FdZ; and mean wet deposition values, F,. Results are integral data for the whole drift experiment period (6 d). No wet deposition oc-
10
20 M curred at Helgoland and FP 'Nordsee' Displayed
0 are mean values and 10" F d ~ F~ standard deviations

Schlunzen et al.. PRISMA-Atmosphenc input of lead 307
derived from impactor measurements. These mark the lower limit for dry deposition values (see the section 'Model results' above). The upper limit for dry deposi- tion rates is given by Fd2, which is calculated from measured concentrations and modelled deposition velocities. The wet deposition rates, F,, are calculated from sampled precipitation amounts and lead concen- trations measured in the rain samples.
In general, dry deposition seems to be representa- tively measured, because deposition values are at about 3 1-19 n1r2 d-' for Fdl and at about 10 pg m-2 d-' for F,, for all measurement sites. Wet deposition values differ. They lie between minimum and maximum dry deposition values at the measurement sites RV 'Val- divia' and Westerhever. Based on these measure- ments, about half of the atmospheric input into the German Bight was caused by dry and half by wet deposition during the drift expenment. However, the greater proportion of wet deposition at Neuharlinger- siel (about 70% of the total) shows the uncertainty of this conclusion when it is applied to the whole German Bight. The enhanced wet deposition at Neuharlinger- siel is caused by the more frequent rain events in that area. The low rain amounts at Helgoland (below 0.1 mm for the drift period) result in negligible wet deposition values here. The different results show that a n integration period of 6 d is too short to calculate area-representative wet deposition values, due to the random occurrence of precipitation.
During the drift experiment, the atmospheric lead input into the German Bight was low in the area of Helgoland, whereas it was a factor of 10 higher at the East Frisian coastline. Deriving yearly input data based on these results for the whole German Bight, the val- ues are between 25 t yr-l (based on Helgoland data, Fdl) and 250 t yr-' (based on Neuharlingersiel data, F,, plus F,). Yearly means calculated from long term mea- surements show a lower range (110 to 240 t yr-'; recal- culated values based on Schlunzen 1994a). The enlarged range resulting from the present 1 wk exper-
iment underlines the importance of long-term mea- surements when mean atmospheric input values are to be estimated. At the same time, it shows the impor- tance of high resolution measurements when causes of high or low concentrations in seawater are to be inves- tigated.
Assuming that the atmospheric input of lead com- pounds (3 to 30 pg m-' d-') was completely absorbed by the sea water, the average daily increase of lead in the upper meter of the water column was between 3 and 30 ng kg-' d-'. This value is 1 to 100% of the observed low lead concentrations in the water and is far beyond or in the range of observed changes in con- centrations. For the measurement site RV 'Valdivia', where the measurements in the water column were performed, the mean total deposition was about 9 n g kg-' d-l. However, for individual days the total deposi- tion was considerably higher.
Fig. 9a shows the lead concentration in air and the dry deposition values calculated with the modelled deposition velocity of lead. Individual lead dry deposi- tion values range from 1 to 25 pg m-' d-' and are thus up to a factor of about 3 higher than the mean value of 9 pg m-, d-l. Furthermore, the maximum dry deposi- tion is only about 10% of the total deposition (Fig. 9b). The difference was caused by 1 rain event which lasted for 5 h only, but considerably influenced the total deposition. With a total deposition of 220 yg m-, d-' the daily increase of lead concentration in the upper meter of the water column was about 200 n g kg-' d-l), a value well in the range of measured sea water concentrations and their changes.
CONCLUSIONS
The results presented on atmospheric input into the German Bight elucidate possible causes of high con- centrations and show the range of input data. The inte- gral dry deposition values were within the same order
Fig. 9. (a) Atmospheric lead concentrations, C,, (ng m-3), and lead dry deposition rates, F,(Pb) (pg m-2 d-' ) , calculated with the modelled depo- sition velocity for lead. (b) Dry deposition rates, F,(Pb), compared with total deposition rates, F,iPbi: note difference in , \ ,.
scales April 1991 April 1991
308 Mar Ecol Prog Ser 1
of magnitude at all sites in the measurement area. In the case of precipitation, wet deposition could become the main contributor to the total deposition, and the values dlffered considerably between the measure- ment sites (up to a factor 10). A sampling time of 1 wk did not result in similar deposition values over an area of about 120 by 120 km'. This shou1.d be considered when comparing results from large-scale models with single measurements. It can be assumed that for longer time periods the probability that similar rain amounts will be measured at all sltes increases and measure- ments and model results will become more compara- ble. Due to the relevance of wet deposition for the total deposition, wet and dry deposition values should be determined separately, in measurements as well as in models. These data allotv comparisons even for short time intervals, as shown in the present paper (section 'Model results').
The differences in the deposition velocities calcu- lated from impactor measurements and in the model have been explained by the used aerosol slze distribu- tions ('Model results'). The 2 values for dry deposition data presented in this paper mark the lower and upper limits. For future model studies and evaluations of measurement data, the bimodal structure of the aerosol size spectrum and the growing of hygroscopic particles over water due to humidity should be taken into account.
Models have been shown to be a helpful tool for the interpretation of measurements and they can help to pinpoint main source areas. In the work described here, 2 models were applied for different scales (back- ward trajectories, mesoscale model). The model results underline the importance of long-range transport, which can be responsible for up to 50% of the mea- sured concentrations. Mesoscale phenomena were also found to influence the concentrations. The present measurement and model case study verifies again that sources in the area of the German Bight as well as remote sources contribute substantially to the atmos- pheric lead input.
The range of high-resolution total deposition data and the resultant concentration changes in the water column (sectlon 'Calculated atmospheric input.. . ' ) underline the importance of high-resolution data when investigating changes in the water column. The 6 d mean value for the drift experiment (9 ng kg-' d-l) was not sufficient to reflect possible minima and maxima in atmospheric input. These lay an order of magnitude below or a factor of 25 above the mean values. Since they are crucial parameters when explaining transfer processes in the water column, they should be mea- sured and modelled with a high temporal and spatial resolution, a t least in investigations which aim to clar- ify transfer processes in the ocean.
Acknowledgcn~mts. We thank Ursula Bredthauer, Holger Gerwiy, dnd Gotz Stcinhoff at the Institut fur Anorganische und Angewandte Chemie, Universitat Hamburg, for the chemical analysis, XIartind Fdlke (now at the Urnweltbehorde Hamburg) for taking the meteorological measurements on board RV 'Gauss', and Volker Reinhardt at the Meteorolog- isches Institut, Universitat Hamburg, for calculating the back- ward trajectorics. We thank the German Weather Serv~ce for kindly maklng the meteorological data available to us. This work was funded by the Universitat Hamburg and by the Minister fiir Forschung und Technologie, Bonn, under grant number 03F0558A1 The authors are responsible for the con- tents of thls publication.
LITERATURE CITED
Brockmann UH, Raabe T, Nagel K, Haarich M (1997) Mea- surement strategy of PRISIMA; design and realisation. Mar Ecol Prog Ser 156-245-254
Brutsaert W (1975) The roughness length for water vapour, sensible heat, and other scalars. J Atmos Sci 32:2028-2031
Chang JS, Brost RA, Isaksen ISA, Madronich S, Middelton P. Stockwell WR, Walcek CJ (1987) A three dimensional Eulerian and deposition model. physical concepts and for- mulation. J Geophys Res 92:14681-14700
Dannecker W. Hinzpeter H, Kirzel HJ, Luthardt H, Kriews M, Naumann K, Schulz M, Schwikowsky M, Steiger M , Terzenbach U (1994) Atmospheric transport of contami- nants, their ambient concentration and input into the North Sea. In: Sundermann J (ed) Circulation and contam- inant fluxes in the North Sea. Springer-Verlag, Berlin, p 138-189
Dunst M (1982) On the vertical structure of the eddy diffusion coefficient in the PBL. Atmos Environ 16:2071-2074
Garratt JR , Hicks BB (1973) Momentum, heat and water vapour transfer to and from natural and artificial surfaces. Q J R Meteor01 Soc 99:680-687
INC (1987) Der Qualitatszustand der Nordsec-Zusammen- fassung. Report by Wissenschaftlich-Technische Arbeits- gruppe zur zwelten Internationalen Nordseekonferenz. Her Majesty's Stationery Office, London
Karbe L, Aletsee L, Diirselen CD, Heyer K, Kammann U, Krause M, Rick HJ, Steinhardt H (1994) Bioaccumulation and effects of plankton and benthos on the fate of contam- inants. In: Sundermann J (ed) Circulation and contaml- nant fluxes in the North Sea. Springer-Verlag, Berlin, p 555-597
Kersten M, Forstner U, Kriews M , Krause P, Dannecker W, Garbe CD, Hock M, Terzenbach U, Grass1 H (1992) Pollu- tion source reconnaissance using stable lead isotope ratios ('""'?"~b) In: Vernet JP (ed] Trace metals in the environ- ment Impact of heavy metals on the environment. Else- vier. Amsterdam, p 311-325
Kersten M, Kriews M, Kuhn W, Rick HJ (1994) Combined effects of abiotic and biotic factors on heavy metal fluxes. In: Siindermann J (ed) Circulation and contaminant fluxes in the North Sea. Springer-Verlag, Berlin, p 598-619
Konig P, Schrum C (1997) Hydrographic observations and model results from a PRISMA drift experiment. Mar Ecol Prog Ser 156:255-261
Krause P. Kriews M. Dannecker W, Garbe-Schonberg CD, Kersten M (1994) Determination of '0""U7Pb isotope ratios by ICP-MS in particulate matter from the North Sea envi- ronment. Fresenius J Analyt Chem 347:324-329
Knews M (1992) Charakterisierung mariner Aerosole in der Deutschen Bucht sowie ProzeDstudien zum Verhalten

Schlunzen et al.: PRISMA-Atmospheric input of lead 309
von Spurenmetallen beim Ubergang Atmosphare/Meer- wasser. Schriftenreihe Angewandte Analytik, Institut fur Anorganische und Angewandte Chemie, Univers~ty of Hamburg 15
Moll A (1997) Phosphate and plankton dynamics during a drift experiment in the German Bight: simulation of phos- phorus-related plankton production. Mar Ecol Prog Ser 156:289-297
Munch G, Axenfeld F (1990) Emissions-Datenbasis fiir die Untersuchung und Bewertung des Pb-Eintrags uber die Atmosphare in Nord- und Ostsee mit Hilfe eines meso- skaligen Ausbreitungsmodells (GESIMA). In: Eppel DP, Kapitza H (eds) Simulation des Transports und der Depo- sition atmospharischen Bleis in der norddeutschen Kustenregion. AbschluDbericht, Forschungsprojekt UFA- FB 92-104 02 583. GKSS-Forschungszentrum, Geesthacht
Niemeier U, Schlunzen KH (1993) Modelling steep terrain influences on flow patterns at the isle of Helgoland. Beitr Phys Atmosph 66~45-62
QSR (1993) Quality status report of the North Sea 1993. Report on sub-region ?a. Salchow R (ed) Bundesamt fur Seeschiffahrt und Hydrographie, Hamburg
Raabe TU, Brockmann UH, Durselen CD, Krause M, Rlck HJ (1997) Nutrient and plankton dynamics during a spring drift experiment in the German Right. Mar Ecol Prog Ser 156:275-288
Schliinzen KH (1988) Das mesoskalige Modell 'METRAS'- Grundlagen, Validierung, Anwendung. Hamburger Geo- phys Einzelschr A88
Schlunzen KH (1990) Numerical studies on the inland pene- tration of sea breeze fronts at a coastline wlth tidally flooded mudflats. Beitr Phys Atmosph 63:243-256
Schlunzen KH (1994a) Atmospharischer Eintrag von Nahr- und Schadstoffen. In: Lozan JL, Lenz W, Rachor E, Reise K, von Westenhagen H (eds) Warnsignale aus dem Wat- tenmeer-wissenschaftliche Fakten. Blackwell Wissen- schafts-Verlag, Berlin, p 45-48
Schlunzen KH (1994b) Mesoscale modelling-overview on the German nonhydrostatic models. Beitr Phys Atmosph 67:243-253
Schlunzen KH, Bigalke K, Niemeier U, Lenz CJ, Lupkes C, von Salzen K (1996) Concept and realisation of the meso- scale transport and fluid-model 'METRAS' METRAS Tech Rep 5, Meteorologisches Institut, University of Hamburg
Schlunzen KH, Krell U (1994) Mean and local transport in air. In: Sundermann J (ed) Circulation and contaminant fluxes in the North Sea. Springer Verlag, Berlin, p 317-344
Schlunzen KH, Pahl S (1992) Modification of dry deposition in a developing sea-breeze circulation-a numerical case study. Atmos .Environ 26A: 51-61
This article was submitted to the editor
Schrum C, Konig P, Michaelsen K, Niemeier U, Pohlmann T (1997) Meteorological and oceanographic situation in the German Blght from 23 to 29 April 1991. Mar Ecol Prog Ser 156.263-273
Schulz M (1993) Raumliche und zeitliche Verteilung atmo- sphanscher Eintrage von Spurenelementen in die Nord- see. Schriftenreihe Angewandte Analytik, lnstitut fur Anorganlsche und Angewandte Chemie, University of Hamburg 17
Schulz M, Stahlschmidt T, Maenhaut W, Francois F, Larsen SE (1994) The change of aerosol size distributions mea- sured in a Lagrangian-type-experiment to study deposi- tion and transport processes in the marine atmosphere. In: Proceedings of the EUROTRAC Symposium. April 1994, Garmisch-Partenkirchen, Germany. EUROTRAC Office. Garmisch-Partenkirchen, p 702-706
Seinfeld J H (1986) Atmospheric chemistry and physics of air pollution. Wiley & Sons, New York
Spokes L, Jickells T. Rendell A, Schulz M, Rebers A, Dan- necker W, Kriiger 0, Leermakers M, Baeyens W (1993) High atmospheric nitrogen deposition events over the North Sea. Mar Pollut Bull 26:698-703
Steiger M Schulz M, Schwikowski M, Naumann K, Dan- necker W (1989) Variability of aerosol size distributions above the North Sea and its implication to dry deposition estimates. J Aerosol Sci 20:1229-1232
Sundermann J (1997) The PRISMA project: a n investigation of processes controlling contaminant fluxes in the German Bight. Mar Ecol Prog Ser 156:239-243
Voldner EC, Barrie LA, Sirois A (1986) A literature review of dry deposition of oxides of sulphur and nitrogen with emphasis on long-range transport modelling In North America. Atmos Environ 20:2101-2123
Walcek CJ, Brost RA, Chang JS (1986) SOz, sulfate and HNO, deposition velocities computed using regional landuse and meteorological data. Atmos Environ 20:949-964
Warmenhoven JP, Duiser JA, de Leu LTh. Veldt C (1989) The contribution of the input from the atmosphere to the cont- amination of the North Sea and the Dutch Wadden Sea. Rep No. R89/349A, TNO, Apeldorn
Weseley ML. Hicks BB (1977) Some factors that affect the deposition rate of sulfur dioxide and similar gases on veg- etation. J Air Pollut Control Assoc 27:1110-1116
Wu Z, Schliinzen KH (1992) Numerical studies on the local wind structures forced by the complex terrain of Qingdao area. Acta Meteor01 Sin 6:355-366
Zebel G (1979) Modellrechnungen uber den Einflun des Windes auf die Einsaugkoeffizienten von Staubteilchen fiir zwei verschiedene Probenahmekopfe. Staub Reinhal- tung Luft 39:349-362
Manuscript received: January 2, 1997 Revised version accepted: June 2, 1997


![Dynamical analysis of toxin generating Phytoplankton ......reproduce when infected by the German Bight disease [13]. This system has been explored from the perspectiveof stability](https://img.pdfslide.us/doc/110x75/60f85b08eb25954c136dc686/dynamical-analysis-of-toxin-generating-phytoplankton-reproduce-when-infected.jpg)