Embed Size (px)
Citation preview

Phil. Trans. R. Soc. A. doi:10.1098/not yet assigned
Atmospheric changes from solar eclipses
K. L. Aplin1, C. J. Scott2 and S. L. Gray2
1. Department of Physics, University of Oxford, Denys Wilkinson Building, Keble Road, Oxford OX1 3RH
2. Department of Meteorology, University of Reading, PO Box 243, Earley Gate, Reading RG6 6BB
Keywords: meteorological models, eclipse wind, history of meteorology, gravity waves, ionosphere, upper
atmosphere

Summary This article reviews atmospheric changes associated with 44 solar eclipses, beginning with the first quantitative results available, from 1834 (earlier qualitative, accounts also exist). Eclipse meteorology attracted relatively few publications until the total solar eclipse of 16 February 1980, with the 11 August 1999 eclipse producing the most papers. Eclipses passing over populated areas such as Europe, China and India now regularly attract scientific attention, whereas atmospheric measurements of eclipses at remote locations remain rare. Many measurements and models have been used to exploit the uniquely predictable solar forcing provided by an eclipse. In this paper we compile the available publications and review a sub-set of them chosen on the basis of importance and novelty. Beyond the obvious reduction in incoming solar radiation, atmospheric cooling from eclipses can induce dynamical changes. Observations and meteorological modelling provide evidence for the generation of a local eclipse circulation which may be the origin of the “eclipse wind”. Gravity waves set up by the eclipse can, in principle, be detected as atmospheric pressure fluctuations, though theoretical predictions are limited, and many of the data are inconclusive. Eclipse events providing important early insights into the ionisation of the upper atmosphere are also briefly reviewed.
Main Text
1. Introduction The weather during solar eclipses has always been of interest, because of the effect it has on the viewing experience. Early observations were compiled by Halley (1714) to deduce the path of a total solar eclipse across the UK on 22 April 1713, with the help of observers across the country. Inclement weather occasionally impeded the spectacle, as Halley explained, “My worthy collegue Dr John Keill by reason of Clouds saw nothing distinctly at Oxford but the End…”. As well as the excitement of darkness falling, and birdsong stopping, Halley noted other widely-observed meteorological effects, particularly, “the Chill and Damp which attended the Darkness of this Eclipse”. The first known quantitative eclipse weather observations, on 30 November 1834, were reported in the Boston Medical and Surgical Journal (Anon, 1834). Although not named, the author was a diligent observer, finding that temperature measured in the shade and, “of course, in a northern exposure”, dropped by 1.5 ºF from the start of the eclipse to greatest obscuration, with no substantive change in the pressure. Soon afterwards, careful qualitative observations from a UK partial eclipse of 15 May 1836 were made by Birt (1836) who used Luke Howard’s then-novel cloud classifications to give a detailed account of cloud changes during the eclipse. Cumulus (“fair-weather”) clouds died away as the eclipse developed, which might now be explained in terms of diminished convection from reduced solar heating. Systematic eclipse weather campaigns were pioneered by Winslow Upton who was professor of astronomy at Brown University (Archibald, 1914). He led a series of expeditions, with his first eclipse meteorology publication from the Russian solar eclipse of 19 August 1887 (Archibald, 1914) followed by other eclipses over the USA (Upton and Rotch, 1887; 1893). His work is characterised by multi-instrumented sites with several observers focusing on different aspects to maximise the scientific return (automated records were not used). Soon after this, Clayton (1901a) provided a modernising influence, being the first to apply meteorological techniques such as use of “anomalies” i.e. subtracting the average behaviour to identify the changes caused by the eclipse. Clayton was also the first to recognise the special circumstances provided by an eclipse in imposing a well-understood diminution of solar radiation. As Clayton put it, “the eclipse may be compared to an experiment by Nature … by eliminating the influence of other known phenomena”, which he used to good effect by investigating the dynamical effects of eclipses, discussed in more detail in section 2.1. By the late twentieth century improvements in computing and atmospheric physics led to the extensive use of meteorological models. The first known application of a meteorological model to an eclipse was published by Gross and Hense (1999) in anticipation of the 11 August 1999 European total solar eclipse. Since then, there have been several sophisticated model studies of eclipse meteorology, which will be covered in section 2.2. The final effect of eclipses on the weather to attract significant scientific attention is the generation of gravity waves, fluctuations in atmospheric pressure generated by the atmospheric cooling from the

3
Phil. Trans. R. Soc. A.
obscuration of the Sun by the Moon. This is a relatively recent concept, first predicted by Chimonas (1970) and Chimonas and Hines (1970). Anderson and Keefer (1973) planned and carried out pressure measurements on the basis of these predictions, and retrospectively analysed older eclipse pressure data for the possible existence of gravity waves. Attempts to measure gravity waves at subsequent eclipses have been relatively common, but most of the findings have been inconclusive and inconsistent, section 2.3.
1.1 Summary of previous work and structure of the paper
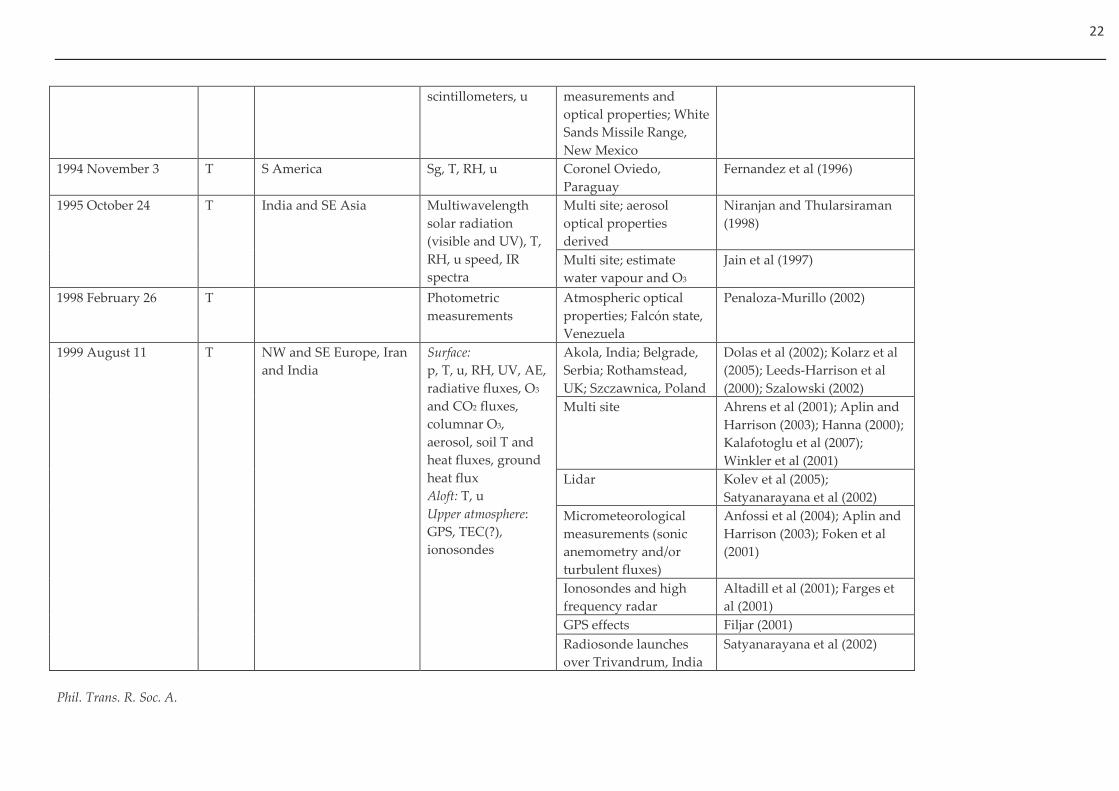
Atmospheric measurements during 44 eclipses are summarised in Table 1. Many articles exist describing eclipse meteorology, about 120 in total, Figure 1. Publications have become significantly more numerous since the 16 Feb 1980 eclipse, with the 11 August 1999 European total solar eclipse provoking the most reports. The number of papers written about each eclipse in recent years appears to be related to the eclipse’s path – if it is over densely populated areas such as Europe, North America, India and China, the Moon’s shadow will pass over existing meteorological stations or provoke atmospheric field campaigns. The role of the amateur observer can also be significant, and is discussed by Hanna (2000; 2016). It is not possible to summarise all the results in Table 1 here (a subset of the data are tabulated by Kameda et al, 2009) so the approach taken is to focus on work that is of particular interest, usually the first of its kind, or a novel method. For example, meteorological measurements of eclipses over sparsely populated areas such as the poles remain of scientific interest due to the low sun angles and opportunities to investigate rarely-observed effects (e.g Kameda et al, 2009; Sjöblom, 2010), and these are discussed in section 2.4. This paper is organised by topic up to, but not including, results from the March 2015 eclipse, covering circulation changes (section 2.1), meteorological modelling (section 2.2), and gravity waves (section 2.3) in the troposphere and stratosphere. Other effects, such as atmospheric electricity, and novel approaches, like measurements aloft, are mentioned in section 2.4. In the upper atmosphere, here defined as 100 km upwards, photoionisation is dominant and therefore eclipses produce changes that are more significant than those seen in the troposphere and stratosphere. An entire paper could be written on historical work investigating the response of the upper atmosphere to eclipses, but we have provided a brief summary for completeness (section 3).

4
Phil. Trans. R. Soc. A.
Figure 1 Number of papers published about eclipse meteorology by year of publication (a) since the first known quantitative measurements (1834) to the present and (b) from 1990 to the present (excluding the 2015 eclipse), with the years in which eclipses occurred indicated as large black dots at the top. (Note that there were two solar eclipses in 1994 and 2003).
2. Meteorological effects of eclipses in the troposphere and stratosphere
The obvious effect of an eclipse is that the solar radiation reaching the earth decreases as the Moon obscures the Sun’s disk. In a total solar eclipse, the solar radiation drops to zero; in a partial eclipse it does not reach zero. (There is negligible difference between the atmospheric effects of partial and annular eclipses of similar magnitude, as an annular eclipse is when the Moon covers only the centre part of the Sun, leaving a ring of it showing, whereas during a partial eclipse the Moon leaves a crescent of the Sun showing). Cooling from solar eclipses is greater when the sun is higher in the sky since the sun’s obscuration has a larger relative effect on the downwelling solar radiation, i.e. at local noon and near the midsummer solstice. For example, a substantial temperature change, -5 ˚C, was recorded after the 21 June 2001 total solar eclipse over northern Zimbabwe (15 ˚S), which took place near local noon, but close to the southern winter solstice (Figure 2). The maximum surface temperature changes in the literature are about -7 ˚C (e.g. Vogel et al, 2001). For the eclipse in Figure 2, the lag between totality and the temperature minimum is 30 minutes, similar to Vogel et al (2001) but longer than most other clear sky lags (e.g. Kameda et al (2009) quoted 6-30 minutes with an average of 12 minutes). This lag is thought to be caused by the thermal inertia of the surface layer (e.g. Aplin and Harrison, 2003) but it has also been reported to be empirically related to the global solar radiation Sg at fourth contact (Kameda et al 2009). The sensitivity of the temperature change to solar radiation is 0.017±0.001 ˚C/(Wm-2), consistent with other clear sky data (Kameda et al, 2009).

5
Phil. Trans. R. Soc. A.
Figure 2 Temperature change during a total solar eclipse over Mana Pools, northern Zimbabwe on 21 June 2001 (after Milford, 2001). The thin black line indicates the global solar radiation, with measurements during the eclipse period overlain as red points. The air temperature is shown as a thicker green line. All data are 5 minute averages. The time axis is in local time (LT= UT+2h). Colour version available online.
Figure 3 is a summary of meteorological effects due to partial solar eclipses over Reading University’s Atmospheric Observatory, which we believe to be the most comprehensive set of eclipse weather observations from a single site. The diminution in solar radiation is usually detectable in the global solar radiation measurements even under thick cloud, as for the two March eclipses shown, but for the 12 October 1996 eclipse no solar radiation change is evident. Both the August eclipses, which were similar in terms of time of year, day and cloud showed a clear reduction in surface temperature. The largest temperature drop was 1.5˚C, on 11 August 1999, due to the 97% magnitude of the eclipse and the broken cloud cover. In comparison, the cloudy umbral region at Camborne, UK had a local temperature minimum before eclipse maximum (Aplin and Harrison, 2003). Near-surface relative humidity changes are typically anticorrelated with near-surface air temperature changes, and increase directly as a consequence of the cooling during eclipses. For example, Namboodiri et al. (2011) reported a maximum variation of 19% with a 28-minute time lag after the maximum eclipse associated with a 3.5˚C cooling during the 2010 annular eclipse over Thumba, India. A reduction of specific humidity has also been reported and attributed to eclipse-induced subsidence of drier air (Bhat and Jagannathan, 2012) but relative humidity changes are typically dominated by the temperature effect.

6
Phil. Trans. R. Soc. A.
Figure 3 Meteorological effects of partial eclipses measured at Reading University Atmospheric Observatory, with the maximum obscuration (the fraction of the Sun’s area covered by the Moon) indicated as a percentage (a) 12 October 1996 (50%) (no data available after 1800) (b) 11 August 1999 (97%) (c) 3 October 2005 (58%) (d) 29 March 2006 (16%) (e) 1 August 2008 (12%) and (f) 20 March 2015 (85%). The thick orange trace shows the predicted global solar radiation (Sg) during the eclipse using the simple model given in Aplin and Harrison (2003). The thin black line indicates the global solar radiation, with measurements during the eclipse period overlain as red points. The air temperature is shown as a thick green line. All data are 5 minute averages. Colour version available online.
Atmospheric cooling by eclipses is responsible for most of the other more subtle meteorological changes discussed below. Circulations can be modified, small pressure waves, “gravity waves” set up, and atmospheric turbulence suppressed. These can affect surface winds, temperatures and radiation, and the electrical state of the atmosphere.
2.1 Circulation changes Eclipses often modify synoptic or mesoscale circulations in favour of their own local cooling-induced effects. Associated with these circulation changes may be an “eclipse wind” which has been reported anecdotally as darkness descends, perhaps related to the heightened emotional state of some eclipse observers (Anderson, 1999). Subrahamanyan et al (2011) found that the sea breeze circulation at Thumba, a coastal site in southern India, was suppressed during a relatively long 77% annular eclipse occurring near local noon on 10 Jan 2010. During maximum eclipse, radiosonde measurements indicate that the sea breeze cell was only about 300m thick compared to 600m under similar synoptic conditions the preceding day. Clayton (1901a) was the first to propose that solar eclipses modified atmospheric circulation, based on a compilation of observations from several sites across the USA during the 28 May 1900 solar eclipse, as was mentioned in section 1. His results suggested a cooler anticyclonic (clockwise) circulation extending about 1500–2000 miles from the umbra, with a cyclonic (anticlockwise) circulation ring beyond, about 1000 miles across, surrounded by an outer ring of higher pressure. Modelling studies by Prenosil (2000) predicted similar effects to those of Clayton’s theory for the 1999 eclipse over Europe. In high-resolution wind measurements in the umbra and penumbra of the 11 August 1999 eclipse, Aplin and Harrison (2003) found that the eclipse circulation was roughly consistent with Clayton’s model for the penumbra, but that only the umbral region acted as a cold-cored cyclone, with a cold outflow into a surrounding anticyclonic region. Subsequent studies comparing observations from the Met Office surface station network with a

7
Phil. Trans. R. Soc. A.
forecast from its Unified Model (which did not represent the eclipse) found that the circulation changes seen were likely to be eclipse-induced (Gray and Harrison, 2012). These circulation changes could contribute to the sensation of an “eclipse wind” reported by some observers.
2.2 Modelling studies There are a range of model studies of eclipses, summarised in Table 2. The two main categories are discussed here: firstly meteorological models (often from national weather services), which represent most of the recent output, in section 2.2.1 and secondly, a few solar radiation models, covered in section 2.2.2.
2.2.1 Meteorological models One of the underlying problems of eclipse meteorology is distinguishing changes caused by eclipses from other, independent, atmospheric effects. This situation is most complicated when meteorological changes are occurring simultaneously with an eclipse, for example when a weather front is arriving at the observation site. The standard approach used is (a) to compare the data with days before and after the eclipse, or (b) to interpolate the changes during the eclipse period to estimate what would have happened if there was no eclipse. As pointed out by Gray and Harrison (2012), neither of these approaches is ideal since (a) requires consistent conditions on the days either side of the eclipse and (b) neglects temporal lags in eclipse-induced changes, which may persist after the eclipse. Under these circumstances in particular, meteorological models can play an important role, as was hinted in section 2.1 above. Gross and Hense (1999) used the (now no longer operational) German Weather Service forecast model with 14 km grid spacing to predict the effect that the 1999 solar eclipse trajectory would have had over Central Europe for the weather conditions on 11 August 1998, a clear and hot day, and found that a near-midday eclipse six weeks away from the summer solstice would cause a substantial (3.5 ˚C on average) and rapid temperature drop, and that the atmospheric circulation would be affected. Unfortunately, as Aplin and Harrison (2003) reported, a weather front in North Western Europe meant that the weather, and observed effects, could differ substantially from clear sky values. Prenosil (2000) used a low-resolution (63.5 km grid spacing) regional weather prediction model to simulate the tropospheric response to the total solar eclipse on the 11 August 1999 over central Europe both with real time data for that day, and for a water vapour and cloud-free scenario. A cold-cored cyclone circulation was expected, and the maximum temperature change of -2 ˚C was predicted in an area north of Dover, UK and east of Calais, France; both predictions were not inconsistent with the observations by Aplin and Harrison (2003). Vogel et al. (2001) also performed numerical experiments for the 11 August 1999 eclipse, using a high resolution (4-km grid spacing), non-hydrostatic regional atmospheric model (KAMM, Adrian and Fieldler (1991)) coupled to a surface vegetation model and positioned over the upper Rhine valley. An idealised, spatially- and temporally-constant, background flow and cloud-free conditions were assumed. Temperature decreases of 6-7˚C were simulated. The modification of winds on slopes in the inhomogeneous terrain led to large changes in wind direction. However, for homogeneous terrain, small effects on wind field were found, with “no implication of the so called eclipse wind”. Founda et al (2007) performed numerical model experiments with the Weather Research and Forecast (WRF) model for the 29 March 2006 eclipse. They used nested domains with 2 km grid spacing in the highest-resolution domain. In this domain they predicted eclipse-induced 1.5 m temperature anomalies that were consistent in magnitude and timing with those observed (e.g. predicted cooling of 2.8˚C in the centre of Athens near eclipse maximum compared to 2.6˚C observed). Some wind speed and direction changes were measured in totality, but Founda et al (2007) attributed them to a combination of the synoptic evolution and changes in the local sea breeze flow. Eckermann et al (2007) used a US Department of Defense model with a “high top” of 0.001hPa for the eclipse of 4 December 2002. This model, including a radiative code to predict the absorption of atmospheric species such as water vapour and ozone, was used to predict surface temperature and pressure changes by differencing runs initialised for identical pre-eclipse conditions with and without the eclipse trajectory included. Surface temperature changes were greatest over land, with a cooling of 4 ˚C, consistent with observations for other eclipses. Surface pressure fluctuations of 0.1-1hPa were also predicted from gravity waves (similar to the 0.3 hPa predicted by Prenosil (2000)) which will be discussed in the next section. A further application of meteorological modelling demonstrated for this work is that

8
Phil. Trans. R. Soc. A.
atmospheric effects due to eclipses can be predicted in remote areas, such as for the path of the 2002 eclipse over southern Africa, the southern Indian Ocean and Australia. To our knowledge, this eclipse yielded no meteorological observations due to its trajectory over sea and sparsely populated areas. One of the problems of modelling eclipses is that a numerical weather model run with and without an eclipse gives results that represent the eclipse in the model, but do not verify the model itself. To move away from this, Gray and Harrison (2012) employed a different methodology. A high spatial and temporal resolution model was initialised with pre-eclipse weather conditions and run with no knowledge of the eclipse. This model run, when compared to observations made at a network of UK Met Office stations, and those in Aplin and Harrison (2003), could be used to verify the model’s prediction of the changes caused by the eclipse over the UK. Over a sub-selected penumbral region excluding the south-western peninsula (chosen to correspond to the clearer sky, and better instrumented region) a reduction in wind speed of 0.7ms-1 and a backing of the wind direction, i.e. an anticlockwise change corresponding to a more easterly direction, were attributed to the eclipse. This wind direction change, whilst clearly not associated with an actual gust of wind, also supports the concept of an “eclipse wind”, although it is not clear which, if any, of these effects would be detectable by a human observer
2.2.2 Solar radiation models In addition to standard meteorological models, eclipses provide an ideal opportunity for testing solar radiation models. These models mainly simulate the path of photons in the eclipsed region. Whilst this situation is relatively well understood for partial eclipses (e.g. Shaw, 1978), total eclipses present technical challenges, since photons detected within the umbra must have arrived by multiple scattering, and therefore three-dimensional scattering code is needed. These models have contributed to understanding of mainly small effects such as the effect of aerosols on the visible radiation and the contribution of the solar corona to the radiation (e.g. Emde and Mayer, 2007). Limb darkening, changes in the spectral irradiance across the sun’s disk, can also be predicted during solar eclipses using radiative models (Koepke et al, 2001).
2.3 Gravity waves Gravity waves are atmospheric pressure waves, first predicted as a consequence of the transient cooling induced by a solar eclipse by Chimonas (1970) and Chimonas and Hines (1970). Specific predictions were made for the 7 March 1970 eclipse, and, in response, Anderson et al (1972) made sensitive pressure measurements and surveyed historical data. Many of the historical pressure measurements reviewed showed fluctuations of about 24 Pa (1 Pa = 0.01 hPa) with duration of about half the eclipse. The measurements made by Anderson et al (1972) showed a periodicity of 89 min with magnitude of 25 Pa, consistent with the earlier work. These fluctuations were an order of magnitude greater than the 0.2 Pa changes predicted by Chimonas (1970). More recent predictions are larger, 10-100 Pa (Prenosil, 2000; Eckermann et al, 2007), and the range of periodicities actually detected during solar eclipses, summarised in Table 3, have periodicities of 20 min up to several hours. The variability in both measurements and theoretical predictions originates from the range of atmospheric layers from which eclipse-induced gravity waves can be generated, and because several mechanisms are involved. In the stratosphere and troposphere, solar UV radiation is converted into heat (infra-red radiation) by ozone and water vapour respectively. When the solar UV radiation is attenuated, at night or during a solar eclipse, these layers of the atmosphere are cooled and a gravity wave is induced. The daily gravity wave is known as the atmospheric solar tide; further gravity waves are therefore expected to emanate from the penumbral and umbral regions of solar eclipses (Marty et al, 2013). Several theories exist explaining exactly how these gravity waves, are generated and the effects that can be expected from them, but limited predictions are available for surface pressure changes (Marty et al, 2013 and references therein) and the existing observations are only approximately consistent both with each other and the theoretical work. Measurements made so far are summarised graphically in Figure 4.

9
Phil. Trans. R. Soc. A.
Figure 4 Summary of eclipse gravity wave observations, adapted from Marty et al (2013). Measurements not included by Marty et al (2013) are in blue. Measurements made by Marty et al (2013) are stars and those made by others are triangles.
2.4 Other measurements
In this section other eclipse weather measurements of interest from Table 1 are briefly reviewed.
2.4.1 Atmospheric electricity The first measurements to be made at eclipses beyond the standard meteorological quantities of pressure, temperature, wind, humidity and solar radiation, were of atmospheric electricity. Atmospheric electricity refers to both thunder and lightning, and the subtler electrical properties of the atmosphere away from thunderstorms, such as the air’s electrical conductivity. In the early years of the twentieth century atmospheric electricity was a scientific priority due to the recent discovery of radioactivity, and its ability to ionise the air. It was well known at the time that natural ionisation led to the slight electrical conductivity of air, but the origin of “penetrating radiation” which ionised air through thick layers of lead would not be fully understood until Hess’s discovery of cosmic rays in 1912 (Aplin et al, 2008). Although the full text of Knoche and Laub’s (1917) report on atmospheric electrical measurements during eclipses is not available, solar effects on atmospheric electricity would have clearly been of scientific interest and may have motivated early eclipse experiments. An additional source of atmospheric electrical observations was from magnetic observatories, such as the magnetic data from the 21 August 1914 total solar eclipse compiled by Bauer and Fisk (1916), which includes atmospheric electrical and meteorological measurements. Bennett (2016) gives a more detailed account of atmospheric electrical measurements during solar eclipses.
2.4.2 Measurements aloft The first successful measurements away from the surface during a solar eclipse were made by Samuels (1925) who arranged for six kites, each carrying a meteograph, to fly from several sites in the penumbra of a solar eclipse over the USA on 24 January 1925. As the eclipse occurred at approximately 0800 local time, when the sun was low in the winter sky, only two of the six flights showed any detectable response. The kites were at 400-800 m during the eclipse with the largest temperature change at a North Dakota site, where the eclipse magnitude was 95%. (The earliest attempt at eclipse measurements aloft was the launch of two balloons before and after maximum obscuration from Eskdalemuir Magnetic Observatory in Scotland on 21 August 1914, but the balloons were lost, so no data were retrieved (Bauer and Fisk, 1916).)

10
Phil. Trans. R. Soc. A.
No further above-ground measurements during eclipses were attempted, as far as we know, until instrumented rocket launches in the 1970s (e.g. Quiroz and Henry, 1973). In the twenty-first century radiosonde (meteorological weather balloon) launches during eclipses have become more popular (Satyanarayana et al, 2002; Subrahamanyan et al, 2011; Harrison et al, 2016) with some limited recent rocket launches (Namboodiri et al, 2011).
2.4.3 Measurements near the poles As discussed in section 2, measurements of the atmospheric effects of eclipses are most common over populated areas. The unpopulated environments of the poles receive little attention; for example, Kameda et al (2009) provide evidence that 18 total solar eclipses over Antarctica were completely unobserved since the continent was first visited by Captain Cook in the 1770s. In what were probably the first polar meteorological measurements during a total solar eclipse – and almost certainly the first human sighting of any Antarctic eclipse - Kameda et al (2009) and colleagues from the Japanese Antarctic Research Expedition observed the eclipse of 23 November 2003 from Dome Fuji (77 ˚S, 3810m). The temperature of – 51˚C dropped by 3 ˚C in response to the eclipse, although the maximum solar radiation in cloudless skies was only 200 Wm-2. No clear effects on atmospheric pressure or wind were detected. Whilst the temperature change observed was typical, the time lag between the end of totality and the temperature minimum was longer for this eclipse than for others, which motivated Kameda et al (2009) to compare the time lag with minimum temperature against the clear sky global solar radiation for several eclipses, as in section 2 above. The eclipse measurements closest to the poles were published by Sjöblom (2010) who used five sites near Longyearbyen on the Svalbard archipelago at 78 ˚N. The eclipse of 1 August 2008 was of particular interest because, although partial (93%) at that site, the midnight sun was obscured so the eclipse had a significant effect because of the lack of diurnal variation in solar radiation. During and after the eclipse katabatic winds started to flow down to the valleys linking to the large fjord in which Longyearbyen is located, after which stratus clouds started to form, which advected onto land as fog. This fog persisted for three days and all air traffic into and out of the archipelago was stopped. There were few explanations for the fog other than the eclipse since there were no synoptic changes, nor, of course, a sunrise or sunset to modify the local surface radiation balance. Downslope winds are known to occur in mountainous environments as a consequence of local cooling similar to that induced by an eclipse (Sjöblom, 2010). This eclipse has therefore also been the eclipse with the greatest economic impact, even though relatively few people were in the path of the Moon’s shadow.
3. Eclipse effects on the upper atmosphere There have been extensive studies of the Earth’s ionosphere and upper atmosphere during solar eclipses, as it was recognised early in the twentieth century that an eclipse could provide a useful test of scientific theories explaining the behaviour of the upper atmosphere, here defined as from about 100km altitude upwards.
3.1 Scientific motivation The ionosphere is a weakly charged plasma layer of the upper atmosphere, largely generated when atmospheric gases are ionised by incoming solar Extreme Ultraviolet and x-ray radiation and lost through recombination reactions. At any given time, the rate of change of the ion number concentration, N, in a given volume can be represented by the expression;
𝑑𝑁
𝑑𝑡= 𝑞 − 𝐿 − 𝑇 (1)
where q is the ion production rate, L is the ion loss rate and T is the loss rate through ion transport. We now know that, in the ionospheric E region (at around 100 km), the dominant neutral gases are molecular. When ionised, these molecular ions recombine with free electrons, and any excess electron energy causes the neutral molecule formed to break up in a process known as dissociative recombination. The average lifetime of an ion in the E region is of the order of seconds and so the transport term in equation 1 is effectively zero. At the higher altitudes of the F2 region (about 300 km) the dominant ion species is O+ which, due to the lower gas densities and the atomic ions’ inability to recombine with

11
Phil. Trans. R. Soc. A.
energetic electrons, has a longer average lifetime (~10 s) and transport becomes important. The intervening F1 layer therefore represents a transition region between molecular and atomic chemistry. Before spaceflight or even sounding rockets could reach such lofty altitudes, the exact composition of the upper atmosphere remained unknown and solar eclipses were seen as an opportunity to measure the ionospheric decay rate in order to determine which species were involved.
3.2 Measurements Techniques were first developed to determine the ion number density using radio (Briet and Tuve, 1926). A radio signal is returned from the ionosphere when it reaches an altitude where the local plasma frequency matches the radio frequency. Since the local plasma frequency is proportional to the square-root of the ion number density, transmitting radio pulses with a range of shortwave frequencies revealed the height profile of free electrons, with the time-of-flight of the signal being used to estimate the height of the ionospheric layers. During a solar eclipse, with ion production removed at totality, the loss rate, L, was estimated from the time delay between totality and the subsequent minimum in atmospheric ionisation. These experiments invariably under-estimated the loss rate due to the fact that, while emissions from the visible solar disc were obscured by the Moon at totality, emissions from the solar corona were not. Using eclipse experiments to determine loss rates fell out of fashion after sounding rockets were developed that could make direct measurements of upper atmospheric composition. Now that these loss rates are well known, these early eclipse experiments have been re-interpreted to estimate how the relative size of the solar corona has varied throughout the 20th century (Davis et al, 2001, Davis et al, 2009). These two papers contain references to the original research publications, along with details of previously unpublished eclipse measurements obtained from international data archives. Early studies were not restricted to investigations of the loss rate. Beynon and Brown (1956) list details of 22 eclipse experiments prior to 1956 and report details from a symposium held at the Royal Society in London in August 1956 in which experiments conducted during eclipses in the 1950s were discussed. Topics included studies of solar radiation, solar radio noise, ionospheric recombination, and eclipse-induced geomagnetic effects. Modern eclipse studies have benefited from the advent of advanced radar facilities (e.g. Pitout et al, 2013; Wang Hu et al, 2011) and have concentrated on radio propagation studies (e.g. Guha et al, 2012), wave propagation (e.g. Sekar et al, 2014), and the impact of solar eclipses on the upper atmosphere as a way of verifying complex atmospheric models (e.g. Muller-Wodarg et al, 1998; Le et al, 2008; Le et al, 2009).
4. Conclusions Solar eclipses offer a unique opportunity to measure the atmospheric effects of a well-defined attenuation of the incoming solar radiation, an aspect first noticed by Clayton (1901a) who combined multiple observations to make pioneering deductions about circulation changes from eclipses. Clayton's theory was not universally accepted at the time (Bigelow, 1901; Clayton, 1901b) and while more recent work has found eclipse-induced circulations consistent with Clayton's theory (Gray and Harrison, 2012; Aplin and Harrison, 2003), other work has found either no circulation changes (Eaton et al., 1997) or attributed these changes to changes in the synoptic situation or in local mesoscale flows such as sea breezes or mountain slope flows (Vogel et al., 2001; Namboodiri et al., 2011; Founda et al., 2007; KiranKumar et al. 2013). Clayton’s work also represented a transition between the purely empirical and observational aspects of pre-1900 eclipse weather, to the twentieth-century approach of synthesising measurements and searching for broader atmospheric effects beyond surface changes in solar radiation and temperature. In the first half of the twentieth century solar eclipses offered a much-needed opportunity to study the upper atmosphere, which was then almost totally inaccessible, and in the second half the focus shifted to understanding the gravity waves produced by eclipses and their propagation through the atmosphere. In the late twentieth and early twenty-first centuries the use of models has become widespread in eclipse meteorology, both to predict the atmospheric changes caused by eclipses, and to present a verification opportunity for the model.

12
Phil. Trans. R. Soc. A.
Eclipse meteorology is growing as a subject with each eclipse over populated areas now attracting many publications, most notably the 1999 and 2006 eclipses over Europe. There are now over 100 scientific papers reporting highly diverse aspects of eclipse meteorology and it has not been possible to cover them all here, beyond summarising pioneering work and the significant atmospheric effects. The major open scientific question in eclipse meteorology is the origin and effect of gravity waves, which are still poorly understood with many conflicting theories and observations. The detailed circulation changes from eclipses, particularly their extent (or not) under cloudy skies, also require further investigation. It is likely that the forthcoming 2017 total solar eclipse passing from west to east over the USA will stimulate further work in this area.
Additional Information Acknowledgments
Dr J. Milford (formerly of Department of Physics, Zimbabwe University) provided the data shown in Figure 2. Prof R.G. Harrison (Department of Meteorology, University of Reading) provided the data shown in Figure 3. Eclipse ephemera were obtained from http://www.timeanddate.com/, http://calsky.com/ and http://eclipse.gsfc.nasa.gov/eclipse.html. Data Accessibility
Data is available on request from the corresponding author. Competing Interests None. Author Contributions
KLA carried out the data analysis and literature search, and prepared the plots and tables. All authors contributed to manuscript drafting and review, and gave the final approval for publication.
References
Abbott, W. N., (1958) On certain radiometric effects during the partial solar eclipse of February 25, 1952. Geofisica pura e applicata 39.1, 186-193.
Adrian, G., F. Fiedler (1991), Simulation of unstationary wind- and temperature fields over complex terrain and comparison with observations, Contrib. Phys. Atmos., 64, 27–48
Amiridis, V., D. Melas, D. S. Balis, A. Papayannis, D. Founda, E. Katragkou, E. Giannakaki, R. E. Mamouri, E. Gerasopoulos, and C. Zerefos. (2007) Aerosol Lidar observations and model calculations of the Planetary Boundary Layer evolution over Greece, during the March 2006 Total Solar Eclipse. Atmos. Chem. Phys. 7, 24: 6181-6189.
Anderson R. C., Keefer D. R., and O. E. Myers (1972), Atmospheric Pressure and Temperature Changes During the 7 March 1970 Solar Eclipse, J. Atmos. Sci. 29, 3, 583-587
Anderson, J. (1987), Two eclipses visible from a geostationary weather satellite, J. Roy. Ast. Soc. Canada (ISSN 0035-872X), 81, 83-94.
Anon (1834), Meteorological Observations during the Solar Eclipse of 30th November. 1834, at Boston, Mass, The Boston Medical and Surgical Journal, Dec 10, 1834 American Periodicals Series II, Boston.
Anon (1990). Effect of the annular eclipse on the solar radiation and surface meteorological elements, Chinese J. Geophys., 33, 4, 399-407 (in Chinese with English abstract)

13
Phil. Trans. R. Soc. A.
Antonia, R. A., Chambers, A. J., Phong‐Anant, D., Rajagopalan, S., & Sreenivasan, K. R. (1979). Response of atmospheric surface layer turbulence to a partial solar eclipse. Journal of Geophysical Research: Oceans (1978–2012), 84(C4), 1689-1692.
Aplin K.L. and Harrison R.G. (2003), Meteorological effects of the eclipse of 11th August 1999 in cloudy and
clear conditions, Proc. Roy. Soc. Lond. A, 459, 2030, 353-371, doi:10.1098/rspa.2002.1042
Aplin K.L., Harrison R.G. and Rycroft M.J. (2008), Investigating Earth's atmospheric electricity: a role
model for planetary studies, Space Science Reviews 137, 1-4, 11-27 doi: 10.1007/s11214-008-9372-x
Archibald R.C. (1914), Winslow Upton, Science, 39, 997 202-204
Bauer L.A. (1919), The Total Solar Eclipse Of May 29, 1919, At Cape Palmas, Liberia, Monthly Weather Review, 47, 11, 808-809
Bauer L.A. and Fisk H.W. (1916) On the results of some magnetic observations during the solar eclipse of August 21, 1914, Terr. Mag. Atm. Elect., 21, 2, 57-86
Bennett A.J. (2016), Effects of the March 2015 solar eclipse on near-surface atmospheric electricity Phil Trans. Roy. Soc. A, this volume
Beynon, W.J. G., and Brown, G. M. (1956), Solar eclipses and the ionosphere, Pergamon Press, N.Y. and
London
Bhaskar, A., A. Purohit, M. Hemalatha, C. Pai, A. Raghav, C. Gurada, S. Radha et al. (2011), A study of
secondary cosmic ray flux variation during the annular eclipse of 15 January 2010 at Rameswaram, India.
Astroparticle Physics 35, 5: 223-229.
Bhat, G. S., and Jagannathan, R. (2012). Moisture depletion in the surface layer in response to an annular solar eclipse. J. Atmos. Solar-Terr. Phys., 80, 60-67.
Bilham, E. G. (1921) Meteorological observations during the annular solar eclipse of April 8th 1921 Q. J. R. Meteorol. Soc. 47, 206–210.
Birt W.R (1836), Mr W. R Birt’s Meteorological observations made during the solar eclipse of May 15, 1836 at Greenwich, London Edinburgh Phil. Mag J. Sci., 9, 55, 393-394
Blumthaler, M., A. Bais, A. Webb, S. Kazadzis, R. Kift, N. Kouremeti, B. Schallhart, and A. Kazantzidis.
(2006) Variations of solar radiation at the Earth's surface during the total solar eclipse of 29 March 2006. In:
Remote Sensing, pp. 63620F-63620F. International Society for Optics and Photonics
Botley C.M. (1955) Solar Eclipse, 30 June 1954, Weather 10, 357-358
Brazel, A. J., Cerveny, R. S., & Trapido, B. L. (1993). Localized climatic responses during the 11 July 1991 eclipse: Phoenix AZ. Climatic change, 23(2), 155-168.
Breit, G. and Tuve, M.A., A Test of the Existence of the Conducting Layer, Physical Review, 28, 554–575,
1926.
Clayton, H. H. (1901a) The eclipse cyclone and the diurnal cyclones. Ann. Astron. Observ. Harvard College
43, 5–33.
Clayton, H. H. (1901b). Clayton's Eclipse Cyclone and the Diurnal Cyclones. Science, 13(332), 747–750. http://www.jstor.org/stable/1628930
Davis, CJ, Bell, SA, Stamper, R, et al. (2009), A potential lag between the open solar magnetic source flux
and solar EUV and X-ray emissions as measured by the Earth's ionosphere during total solar eclipses, Ann.
Geophys, 27, 6, 2449-2456, 2009.
Davis, CJ, Clarke, EM, Bamford, RA, et al. (2001), Long term changes in EUV and X-ray emissions from the
solar corona and chromosphere as measured by the response of the Earth's ionosphere during total solar
eclipses from 1932 to 1999, Ann. Geophys., 19, 3, 263-273

14
Phil. Trans. R. Soc. A.
De, Syam Sundar, B. K. De, B. Bandyopadhyay, B. K. Sarkar, S. Paul, D. K. Haldar, S. Barui, A. Datta, S. S. Paul, and N. Paul. (2010) The effects of solar eclipse of August 1, 2008 on Earth’s atmospheric parameters." Pure and applied geophysics 167, 10: 1273-1279.
Dorno C. (1925), Radiation And Polarization Measurements During The Solar Eclipse Of April 8, 1921, At Davos, Monthly Weather Review 53, 5, 208
Eaton, F. D., Hines, J. R., Hatch, W. H., Cionco, R. M., Byers, J., Garvey, D., & Miller, D. R. (1997). Solar eclipse effects observed in the planetary boundary layer over a desert. Boundary-Layer Meteorology, 83(2), 331-346.
Emde C and Mayer B. (2007), Simulation of solar radiation during a total eclipse: a challenge for radiative transfer, Atm. Chem. Phys. 7, 2259–2270
Farges, T., Jodogne, J. C., Bamford, R., Le Roux, Y., Gauthier, F., Vila, P. M and Miro, G. (2001).
Disturbances of the western European ionosphere during the total solar eclipse of 11 August 1999
measured by a wide ionosonde and radar network. Journal of Atmospheric and Solar-Terrestrial Physics, 63(9),
915-924.
Farges, T., Le Pichon, A., Blanc, E., Perez, S., and Alcoverro, B. (2003). Response of the lower atmosphere
and the ionosphere to the eclipse of August 11, 1999. Journal of atmospheric and solar-terrestrial physics, 65(6),
717-726.
Fergusson S. P. (1919), Results Of Observations Of Clouds During The Solar Eclipse June 8, 1918, Monthly Weather Review, 47, 3, 149-150
Fernandez W., Castro V. and Hidalgo H. (1993), Air temperature and wind changes in Costa Rica during the total; solar eclipse of July 11, 1991, Earth, Moon and Planets 63, 133-147
Fernandez W., Hidalgo H., Coronel G. and Morales E. (1996), Changes in meteorological variables in Coronel Oviedo, Paraguay, during the total solar eclipse of 3 November 1994, Earth, Moon and Planets 74, 49-59
Finkelstein J., (1973) Temperature variation during solar eclipses, Weather 28, 4, 171
Founda, D., D. Melas, S. Lykoudis, I. Lisaridis, E. Gerasopoulos, G. Kouvarakis, M. Petrakis, and C. Zerefos. (2007) The effect of the total solar eclipse of 29 March 2006 on meteorological variables in Greece, Atmospheric Chemistry and Physics 7, 21: 5543-5553.
Girach, I. A., Nair, P. R., David, L. M., Hegde, P., Mishra, M. K., Kumar, G. M., ... & Naja, M. (2012). The changes in near‐surface ozone and precursors at two nearby tropical sites during annular solar eclipse of 15 January 2010. Journal of Geophysical Research: Atmospheres (1984–2012), 117(D1).
Goodwin, G. L. (1983). Atmospheric gravity wave production for the total eclipse of 11 June 1983. Journal of Atmospheric and Terrestrial Physics, 45(4), 273-274.
Goodwin, G. L., and G. J. Hobson. (1978) Atmospheric gravity waves generated during a solar eclipse. Nature 109-111.
Gray, S. L., & Harrison, R. G. (2012). Diagnosing eclipse-induced wind changes. Proc Roy Soc A: Mathematical, Physical and Engineering Sciences 468, 2143, 1839-1850
Guha, A.; De, B. K. Choudhury, A.; et al. (2012), Spectral character of VLF sferics propagating inside the
Earth-ionosphere waveguide during two recent solar eclipses, J. Geophys. Res., 117
Hall L. F. (1980), Infrared Thermometer Measurements of the Temperature of the Clouds from the Surface during the 7 March 1970 Total Eclipse, J. Atmospheric Sciences, 37, 11, 2568-2574
Halley, E. (1714). Observations of the Late Total Eclipse of the Sun on the 22d of April Last Past, Made before the Royal Society at Their House in Crane-Court in Fleet-Street, London. by Dr. Edmund Halley, Reg. Soc. Secr. with an Account of What Has Been Communicated from Abroad concerning the Same. Philosophical Transactions, 29(338-350), 245-262.
Hanna, E. (2000) Meteorological effects of the solar eclipse of 11 August 1999. Weather 55, 430– 446.

15
Phil. Trans. R. Soc. A.
Hanna, E., J. Penman, T. Jonsson, G.R. Bigg, H. Bjornsson, S. Sjuroarson, M.A. Hansen, J. Cappelen, R.G. Bryant (2016) Meteorological effects of the solar eclipse of 20 March 2015 - analysis of UK Met Office automatic weather station data and comparison with AWS data from the Faroes and Iceland. Phil. Trans. Roy. Soc A., this volume
Harrison R.G. (2016) The solar eclipse: a natural meteorological experiment Phil. Trans. Roy. Soc. A, this volume
Harrison R.G., G.J. Marlton, P.D. Williams, and K.A. Nicoll (2016), Coordinated weather balloon solar radiation measurements during a solar eclipse, Phil. Trans. Roy. Soc. A, this volume
Jagannathan, P., O. Chacko, and S. P. Venkiteshwaran. (1956) Insolation measurements at Poona during the solar eclipse on 14th December 1955. Ind. J. Meteorol. Geophys 8: 93-98.
Jain, S. L., Arya, B. C., Singh, S. K., Tripathi, O. P., & Hamid, A. (1997). Measurements of various atmospheric parameters during a total solar eclipse. Terr. Atmos. Ocean Sci, 8, 371-384.
Jayakrishnan, P. R., Babu, C. A., & Sivaprasad, P. (2013). Drastic variation in the surface boundary layer parameters over Cochin during the annular solar eclipse: Analysis using sonic anemometer data. J. Atmospheric and Solar-Terrestrial Physics, 94, 49-53.
Jeon, B. I., & Oh, I. B. (2011). Characteristics on Variation of Temperature and Ozone Concentration during the Partial Solar Eclipse Event of 22 July 2009 at Busan. J. Env. Sci. International, 20(8), 1049-1059.
Jones B.W. (1976), A Search for Lamb Waves Generated by the Solar Eclipse of 11 May 1975, Journal of the Atmospheric Sciences, 33, 9, 1820-1823
Kalafatoglu, E. , Ceren, Zerefsan Kaymaz, and Tan E.. (2007) August 11, 1999 solar eclipse over Turkey and associated effects, Proc 3rd International Conference on Recent Advances in Space Technologies IEEE, 2007.
Kameda, T., Fujita, K., Sugita, O., Hirasawa, N., and Takahashi, S. (2009). Total solar eclipse over Antarctica on 23 November 2003 and its effects on the atmosphere and snow near the ice sheet surface at Dome Fuji., J. Geophys. Res. (1984–2012), 114(D18).
Kazadzis, S., A. Bais, M. Blumthaler, A. Webb, N. Kouremeti, R. Kift, B. Schallhart, and A. Kazantzidis
(2007) Effects of total solar eclipse of 29 March 2006 on surface radiation. Atmospheric Chemistry and Physics
7, 22 (2007): 5775-5783.
Kazantzidis, A., A. F. Bais, C. Emde, S. Kazadzis, and C. S. Zerefos (2007) Attenuation of global ultraviolet
and visible irradiance over Greece during the total solar eclipse of 29 March 2006. Atmospheric Chemistry
and Physics 7, 23: 5959-5969.
Kidd, R. W. Some Meteorological Effects Of The Total Solar Eclipse, 1983 June 11, J. Brit. Astron. Ass. 95, NO.6/OCT, P.257, 1985
Kimball H.H. (1925), Observations On The Solar Eclipse Of January 24, 1925, At Washington, D. C., Monthly Weather Review, Volume 53, 1, 22-23
Kimball H.H. and Fergusson S.P (1919) Influence Of the Solar Eclipse Of June 8, 1918, Upon Radiation And Other Meteorological Elements, Monthly Weather Review 47, 1, 5-16
KiranKumar, N. V. P., Neethu Purushothaman, and M. Santosh. (2013) Response of spectral characteristics of wind and temperature of atmospheric surface layer to the noontime annular solar eclipse. J. Atmos. Solar-Terr. Phys. 97: 91-98.
Knoche W. and Laub J. (1917), Observations of atmospheric electricity during the total solar eclipse on October 10, 1912, at Boã Vista, Brazil, Monthly Weather Review, 45, 9, 443-443
Koepke, P., Reuder, J., and Schween, J. (2001): Spectral variation of the solar radiation during an eclipse, Meteorologische Zeitschrift, 10, 179–186
Kwak K.H. , Ryu, Y.H., Baik J.J. (2011), Temporal and Spatial Variations of NOx and Ozone Concentrations in Seoul during the Solar Eclipse of 22 July 2009, J Applied Meteorology and Climatology, 50, 3, 500-506

16
Phil. Trans. R. Soc. A.
Le, H., Liu, L., Yue, X., Wan, W., The ionospheric behavior in conjugate hemispheres during the 3 October
2005 solar eclipse, Ann. Geophys., 27, 179-184, 2009.
Le, H.; Liu, L.; Yue, X.; et al., The ionospheric responses to the 11 August 1999 solar eclipse: observations
and modelling, Ann. Geophys., 26, 107-116, 2008.
Manohar, G. K., Kandalgaonkar, S. S., and Kulkarni, M. K. (1995). Impact of a total solar eclipse on surface atmospheric electricity. J. Geophys. Res. Atmospheres (1984–2012), 100(D10), 20805-20814.
Marlton G. J., Harrison R. G. and Nicoll K. A. (2016), On the detection of gravity waves generated by the 20 March 2015 solar eclipse, Phil Trans Roy Soc A, this volume
Marty J., F. Dalaudier, D. Ponceau, E. Blanc, and U. Munkhuu, (2013), Surface Pressure Fluctuations
Produced by the Total Solar Eclipse of 1 August 2008. J. Atmos. Sci., 70, 809–823. doi:
http://dx.doi.org/10.1175/JAS-D-12-091.1
Mauchly, S. J., & Thomson, A. (1920). Results of atmospheric‐electric observations made at Sobral, Brazil, during the total solar eclipse of May 29, 1919. Terrestrial Magnetism and Atmospheric Electricity, 25(2), 41-48.
Mauder M., R. L. Desjardins, Oncley S.P. and MacPherson I. (2007), Atmospheric Response to a Partial Solar Eclipse over a Cotton Field in Central California, Journal of Applied Meteorology and Climatology, 46, 11, 1792-1803
McIntosh, B. A., & ReVelle, D. O. (1984). Traveling atmospheric pressure waves measured during a solar eclipse. Journal of Geophysical Research: Atmospheres (1984–2012), 89(D3), 4953-4962.
Milford J. (2001), Microclimate at Mana Pools: effects of a total eclipse of the sun, Zimbabwe Science News Volume 35 (3+ 4) 2001, pp. 63-68
Morris Bower S. (1955) Solar Eclipse, 30 June 1954, Weather 10, 358
Mueller-Wodarg, I. C. F., A. D. Aylward, and M. Lockwood (1998), Effects of a Mid-Latitude Solar Eclipse on the Thermosphere and Ionosphere - A Modelling Study; Geophys. Res. Lett., Vol. 25, No. 20, 3787-3790.
Muraleedharan, P. M., Nisha, P. G., & Mohankumar, K. (2011). Effect of January 15, 2010 annular solar eclipse on meteorological parameters over Goa, India. J. Atmos. Solar-Terr. Phys., 73(13), 1988-1998.
Namboodiri, K. V. S., Dileep, P. K., Mammen, K., Ramkumar, G., Kiran Kumar, N. V. P., Sreenivasan, S., ... & Manchanda, R. K. (2011). Effects of annular solar eclipse of 15 January 2010 on meteorological parameters in the 0 to 65 km region over Thumba, India. Meteorologische Zeitschrift, 20(6), 635-647.
Niranjan, K., & Thulasiraman, S. (1998). Aerosol optical depth and size distribution changes during the total solar eclipse of 24 October 1995. Terr. Atmos. Oceanic Sci, 9, 255-262.
Peñaloza-Murillo, M. A. (2002). Optical Response of the Atmosphere During the Caribbean Total Solar Eclipses of 26 February 1998 and of 3 February 1916 at Falcón state, Venezuela. Earth, Moon, and Planets, 91(3), 125-159.
Pitout, F.; Blelly, P. -L.; Alcayde, D. (2013), High-latitude ionospheric response to the solar eclipse of 1
August 2008: EISCAT observations and TRANSCAR simulation, J. Atmos. Sol. Terr. Phys., 105, 336-349.
Prenosil, T. (2000) The influence of the 11 August 1999 total solar eclipse on the weather over central Europe. Meteorol. Z. 9, 351–359.
Pruitt, W. O., Lourence, F., & Crawford, T. V. (1965). Radiation and energy balance changes during the eclipse of 20 July 1963. Journal of Applied Meteorology, 4(2), 272-278.
Psiloglou, B. E., and H. D. Kambezidis (2007) Performance of the meteorological radiation model during the solar eclipse of 29 March 2006. Atmospheric Chemistry and Physics 7, no. 23 (2007): 6047-6059.
Quiroz R.S., Henry R.M. (1973), Stratospheric Cooling and Perturbation of the Meridional Flow During the Solar Eclipse of 7 March 1970, J. Atmospheric Sciences, 30, 3, 480-488

17
Phil. Trans. R. Soc. A.
Rabin R.M. and Doviak R.J., (1989): Meteorological and Astronomical Influences on Radar Reflectivity in the Convective Boundary Layer. J. Appl. Meteor., 28, 1226–1235.
Ratnam, M. V., Kumar, M. S., Basha, G., Anandan, V. K., & Jayaraman, A. (2010). Effect of the annular solar eclipse of 15 January 2010 on the lower atmospheric boundary layer over a tropical rural station. Journal of Atmospheric and Solar-Terrestrial Physics, 72(18), 1393-1400.
Samuels L.T. (1925), Special Aerological Observations During The Solar Eclipse Of January 24, 1925, Monthly Weather Review, 53, 1, 23
Satyanarayana, M., Veerabuthiran, S., Rao, D Ramakrishna, Presennakumar, B., Sreelatha, P. and Appu, K S (2002), Solar eclipse induced changes in aerosol extinction profiles: A case study of 11 Aug. 1999 solar eclipse using lidar at a tropical station Trivandrum, India, Indian J. Radio Space Phys., 31 (2), 82-87
Segal M., Turner R. W., J. Prusa, R. J. Bitzer, and S. V. Finley, (1996): Solar Eclipse Effect on Shelter Air Temperature. Bull. Amer. Meteor. Soc., 77, 89–99.
Sekar, R.; Gupta, S. P.; Chakrabarty, D., Characteristics of E-region background ionosphere and plasma
waves measured over the dip equator during total solar eclipse campaign, J. Atmos. Sol. Terr. Phys., 114,
58-65, 2014.
Seykora, E. J., Bhatnagar, A., Jain, R. M., & Streete, J. L. (1985). Evidence of atmospheric gravity waves produced during the 11 June 1983 total solar eclipse Nature 313, 124 - 125; doi:10.1038/313124a0
Sjöblom, A. (2010). A solar eclipse seen from the High Arctic during the period of midnight sun: effects on the local meteorology. Met. Atmos Phys, 107(3-4), 123-136.
Shaw, G. E. (1978) Sky radiance during a total solar eclipse: a theoretical model, Appl. Opt., 17, 272–278
Stewart R.B, and Rouse WR (1974) Radiation and energy budgets at an Arctic site during the solar eclipse of July 10, 1972. Arct Alp Res 6:231–236
Subrahmanyam, K. V., Ramkumar, G., Kumar, K. K., Swain, D., Kumar, S. S., Das, S. S., ... & Babu, A. (2011). Temperature perturbations in the troposphere-stratosphere over Thumba (8.5° N, 76.9° E) during the solar eclipse 2009/2010. Annales Geophysicae, 29(2), 275.
Szałowski, K. (2002). The effect of the solar eclipse on the air temperature near the ground. Journal of atmospheric and solar-terrestrial physics, 64(15), 1589-1600.
Trapasso, L. M. and Kinkel B., 1984, A Study of Local Weather Conditions: The Effects of the May 30, 1984 Eclipse, Weatherwise, Vol. 37, No. 5, pp. 253-256.
Tzanis, C., C. Varotsos, and L. Viras (2008) Impacts of the solar eclipse of 29 March 2006 on the surface
ozone concentration, the solar ultraviolet radiation and the meteorological parameters at Athens, Greece.
Atmospheric Chemistry and Physics 8, 2: 425-430.
Uddin, W., B. Joshi, T. S. Kumar, S. Sharma, and R. Sagar (2007) Observations of total solar eclipse of 29
March 2006 and related atmospheric measurements. Current Science 93, 7: 957-959.
Upton W. and Rotch, A.L. (1887), Meteorological observations during the solar eclipse of August 19, 1887, made at Chlamostino, Russia, American Meteorological Journal. A Monthly Review of Meteorology and Allied Branches of Study (1884-1896), 4, 8, 356.
Upton, W. and Rotch L. A. (1887), Meteorological observations during the solar eclipse of August 19 1887, made at Chlamostino, Russia, Am. Met. J., 4, 8, 356
Upton, W. and Rotch L. A. (1893), Meteorological and other observations made at Willows, California, in connection with the total solar eclipse of January 1, 1889, Annals of the Astronomical Observatory of Harvard College ; v. 29, no. 1
Varney B.M (1925)., Notes On Changes In Some Of The Weather Elements During The Solar Eclipse Of January 24, 1925, Monthly Weather Review Volume 53, 1, 21-22
18
Phil. Trans. R. Soc. A.
Verma, V. P., Chandrasekharan, C. K., Chatterjee, K., Kulshreshtha, S. M., and Das, S. K. (1980). Meteorological Experiments During the Total Solar Eclipse of February 16, 1980, Bull. Ast. Soc. India 8, 153-158
Vogel B., Baldauf M. and Fiedler F. (2001), The influence of a solar eclipse on temperature and wind in the upper Rhine valley – a numerical case study. Met. Z., 10, 3, 207-214
Wang Hu; Wang Jie-Xian; Bai Gui-Xia; et al., Real-time monitoring of ionosphere changes in the Yangtze
River Delta region based on GPS technology during the total solar eclipse of 22 July 2009, Chinese J. of
Geophys, 54, 1718-1726, 2011.
Zanis, P., E. Katragkou, M. Kanakidou, B. E. Psiloglou, S. Karathanasis, M. Vrekoussis, E. Gerasopoulos et
al. (2007), Effects on surface atmospheric photo-oxidants over Greece during the total solar eclipse event of
29 March 2006, Atmospheric Chemistry and Physics 7, 23: 6061-6073.
Zerefos, C. S., E. Gerasopoulos, I. Tsagouri, B. E. Psiloglou, A. Belehaki, T. Herekakis, A. Bais et al (2007)
Evidence of gravity waves into the atmosphere during the March 2006 total solar eclipse. Atmospheric
Chemistry and Physics 7, 18, 4943-4951.
Zirker J.B. (1995) Total eclipses of the sun, Princeton University Press

Tables
Date Type Approximate path over
land
Quantities
measured
Approach References
1834 Nov 30 T USA and Canada p, T Boston, Massachusetts Anon (1834)
1836 May 15 A Central America,
Caribbean, N and E
Europe
u, clouds Qualitative observations
at Greenwich, UK
Birt (1836)
1887 Aug 19 T E Europe, Russia, China,
Japan
P, T, RH, u, clouds Multi site Hesehus and Schönrock in
Anderson et al (1972)
Multi instrumented site Upton and Rotch (1887)
1889 Jan 1 T USA and Canada P, T, u, solar
radiation
Multi sites Upton and Rotch (1893)
1900 May 28 T C America, S USA, Spain,
N Africa
p, T, u ?? Multi sites Clayton (1901)
1912 October 10 T S America AE Ionisation, PG,
conductivity, ion
concentration
Knoche and Laub (1917)
1914 August 21 T Scandinavia, E Europe, Black Sea region
P, T, u, RH, AE, clouds
Multi sites at magnetic observatories worldwide
Bauer and Fisk (1916)
1916 February 3 T N tip of S America,
Caribbean
T, photometric
measurements
Falcón state, Venezuela Penaloza-Murillo (2002)
1918 June 8 T USA Clouds, solar fluxes,
RH, p, u
Multi sites Fergusson (1919); Kimball and
Fergusson (1919)
1919 May 29 T S America, Africa T, RH, p, magnetic
effects, AE
Multi sites Bauer (1919)
Bipolar conductivity
and PG in Brazil
Mauchly and Thomson (1920)
1921 April 8 A N UK, N Norway Solar fluxes. UV, T,
RH, p, clouds,
polarisation
Davos, Switzerland Dorno (1925)
Multi site Billham (1921)
1925 January 24 T N USA (Great Lakes) Solar fluxes, T, u
Aloft: T, RH, u
Washington DC Kimball (1925)
Multi sites Varney (1925)

20
Phil. Trans. R. Soc. A.
Kite flights from two
sites
Samuels (1925)
1936 June 19 T Greece, Russia and China AE Russia Litvinov, in Aplin and
Harrison (2003)
1952 February 25 T C Africa, Gulf states,
Russia
Solar fluxes with
filters
Abbott (1952)
1954 June 30 T N USA, Canada, Iceland,
S Scandinavia, Russia, C
Asia
T Kew Observatory Harrison (2016)
Multi sites in UK and
Sweden
Morris Bower (1955); Botley
(1955)
1955 December 14 T Sri Lanka, SE Asia Solar fluxes Poona, India Jagannathan et al in Aplin and
Harrison (2003)
1963 July 20 T Japan, Alaska and
Canada
Radiative fluxes Pruitt et al (1963)
1970 March 7 T C America, USA E coast
and Canada
Surface: T, IR, p
Aloft: u, T
Rockets; Wallops Island,
USA
Quiroz and Henry (1973);
Staffanson et al (1973)
IR thermometer Hall (1980)
Lee, Florida Anderson et al (1972)
1972 July 10 T E Russia, Alaska, Canada T Canada Finkelstein (1973)
Northern Canada Stewart and Rouse (1974)
1973 June 30 T NE S America, C Africa p, T, u Lee, Florida Anderson and Keefer (1973)
1976 October 23 T Tanzania, Australia P, T, u, turbulent
fluxes
Gravity wave detection
at multiple Australian
sites
Goodwin and Hobson (1978)
New South Wales,
Australia
Antonia et al (1979)
1980 February 16 T S Africa, India and China Surface: p, T, RH,
fluxes, O3, AE
Aloft: T, O3
Array of four sensors
~1000m apart for gravity
wave detection near
Saskatchewan, Canada
McIntosh and Revelle (1984)
multiple sites Verma et al (1980)

21
Phil. Trans. R. Soc. A.
Potential gradient and
air conductivity at
Raichur, India
Manohar et al (1995)
1981 July 31 T Kazahkstan and Russia Fluxes, T Kidd (1985)
1983 June 11 T SE Asia P Gravity waves; multiple
sites
Seykora et al (1985)
1984 May 30 A Mexico and Sahara
Desert
T, RH, u,
evaporation, solar
radiation, net
radiation, radar
reflectivity;
Oklahoma, USA Rabin and Doviak (1989)
Trapasso and Kinkel (1984)
1986 October 3 T Sea between Greenland
and Iceland. Partial over
N America
Infrared and visible
radiation
Satellite observations Anderson (1987)
1987 September 23 A C and E Asia, S Pacific p, T, u, RH,
radiative fluxes, O3
China Anon (1990)
1991 July 11 T C America Surface:
p, T, u, RH profiles,
UV, radiative
fluxes, O3 and CO2
fluxes, columnar
O3, aerosol, soil T
and heat fluxes,
ground heat flux
Aloft: T, u
Sonic anemometry,
aircraft, instrumented
tower at cotton field
(Fresno, California)
Mauder et al (2007)
Multi site; effect of land
use on response
Brazel et al (1993)
Multi site; one
radiosonde launch
Fernandez et al (1993)
1994 May 10 A C America, USA,
Morocco
Radiative fluxes, T,
radar, sodar,
Multi site Segal et al (1996)
Micrometeorological Eaton et al (1997)
22
Phil. Trans. R. Soc. A.
scintillometers, u measurements and
optical properties; White
Sands Missile Range,
New Mexico
1994 November 3 T S America Sg, T, RH, u Coronel Oviedo,
Paraguay
Fernandez et al (1996)
1995 October 24 T India and SE Asia Multiwavelength
solar radiation
(visible and UV), T,
RH, u speed, IR
spectra
Multi site; aerosol
optical properties
derived
Niranjan and Thularsiraman
(1998)
Multi site; estimate
water vapour and O3
Jain et al (1997)
1998 February 26 T Photometric
measurements
Atmospheric optical
properties; Falcón state,
Venezuela
Penaloza-Murillo (2002)
1999 August 11 T NW and SE Europe, Iran
and India
Surface:
p, T, u, RH, UV, AE,
radiative fluxes, O3
and CO2 fluxes,
columnar O3,
aerosol, soil T and
heat fluxes, ground
heat flux
Aloft: T, u
Upper atmosphere:
GPS, TEC(?),
ionosondes
Akola, India; Belgrade,
Serbia; Rothamstead,
UK; Szczawnica, Poland
Dolas et al (2002); Kolarz et al
(2005); Leeds-Harrison et al
(2000); Szalowski (2002)
Multi site Ahrens et al (2001); Aplin and
Harrison (2003); Hanna (2000);
Kalafotoglu et al (2007);
Winkler et al (2001)
Lidar Kolev et al (2005);
Satyanarayana et al (2002)
Micrometeorological
measurements (sonic
anemometry and/or
turbulent fluxes)
Anfossi et al (2004); Aplin and
Harrison (2003); Foken et al
(2001)
Ionosondes and high
frequency radar
Altadill et al (2001); Farges et
al (2001)
GPS effects Filjar (2001)
Radiosonde launches
over Trivandrum, India
Satyanarayana et al (2002)

23
Phil. Trans. R. Soc. A.
Microbarographs for
gravity wave detection
over France
Farges et al (2003)
2001 June 21 T Southern Africa,
Madagascar
T, RH, u, global
solar radiation, soil
heat flux, soil
temperatures
Multi site in Zimbabwe Milford (2001) and this paper
2002 December 4 T Angola and Australia Modelling stratospheric
UV, gravity waves,
surface T changes
Eckermann et al (2007)
2003 May 31 A Greenland, Iceland and
N UK
p Gravity waves at
Inverness, UK
Marlton et al (2016)
2003 November 23 T Antarctica p, T, u, RH,
radiative fluxes,
snow temperatures
Effect on radiation
balance at East
Dronning Maud Land,
Antarctica
Kameda et al (2009)
2006 March 29 T Brazil, N Africa, S
Europe and the Black Sea
states
Surface: p, T, u, RH,
radiative fluxes,
rain, soil T and
moisture, solar
spectral irradiance,
UV, lidar, O3, NOX
Upper atmosphere:
TEC, peak electron
density height
Manavgat, Turkey;
Ibadan, Nigeria
Nymphas et al (2009), Uddin
et al (2007)
Upper atmosphere
effects; search for
gravity waves
Zerefos et al (2007)
Spectral effect of limb
darkening
Kazadzis et al (2007)
Sonic anemometer;
multiple sites
Founda et al (2007)
UV and
photosynthetically
active radiation; single
site
Kazantzidis et al (2007);
Blumthaler et al (2006)
Aerosol lidar for
boundary layer
Amiridis et al (2007)

24
Phil. Trans. R. Soc. A.
investigation
Surface ozone and NO2 Tzanis et al (2007)
2008 August 1 T Canada, Greenland,
Russia and China
T, p, u, RH, AE, net
radiation
Micrometeorological
measurements; multiple
sites on Svalbard
including on a 30m
tower
Sjöblom (2010)
Microbarographs for
gravity waves; multiple
sites
Marty et al (2013)
Atmospheric potential
gradient, sferics;
Calcutta, India
De et al (2010)
2009 July 22 T India, SE Asia, China NOX, O3, T Air pollution
monitoring stations in
Korea
Kwak et al (2011); Jeon et al
(2011)
2010 January 10 T Easter Island and S tip of
S America
Surface: T, p, U, RH,
rain, fluxes, Doppler
sodar, O3, NOX,
turbulent fluxes
Aloft: T, p, u, RH
winds and O3 20-
70km
Upper atm: TEC
(derived from GPS),
Tamil Nadu, India;
Cochin, India
Bhat and Jagganthan (2012);
Jayakrishnan et al (2013)
Radiosonde launches;
multiple sites
Muraleedharan et al (2011)
Near-surface ozone and
NOx; multiple sites
Girach et al (2012)
Multi site ionospheric
study
Kumar et al (2011)
Sea breeze circulation;
turbulent fluxes; rocket,
radiosonde and surface
measurements on day of
eclipse and preceding
day; Thumba, India
Subrahamanyan et al (2011);
KiranKumar et al (2013);
Namboodiri et al (2011)

25
Phil. Trans. R. Soc. A.
Gamma and cosmic rays
with temperature and
pressure at
Rameswaram, India
Bhaskar et al (2011)
Radiosonde launches;
Doppler sodar; 15m
tower; Gadanki, India
Ratnam et al (2010)
Table 1 Meteorological observations during solar eclipses, sorted by date of eclipse. All total (t) or annular (a) eclipses have a partial region for several thousand km around them Contemporary country and region names are used. Modelling studies are not included except when there are no observations available. Where no detail is given in the Approach column it indicates that “standard” meteorological measurements only were made. Abbreviations. p: atmospheric pressure, T: temperature, u: wind speed and direction, RH: relative humidity or other water vapour, UV: ultraviolet radiation, AE: atmospheric electricity, GPS: global positioning system, TEC: total electron content, NOX, nitrogen oxides

Type of model Eclipse the model was applied to, and comments
Reference
NOGAPS-ALPHA: US Department of Defense, high altitude, radiative scheme
2002; referenced to model with no eclipse; predicted gravity wave, temperature and ozone changes; no observations available
Eckermann et al (2007)
UK Met Office, high temporal and spatial resolution
1999; referenced to model with no eclipse; saw circulation changes consistent with observations
Gray and Harrison (2012)
German Weather Service (hydrostatic model)
1999; referenced to 11 August 1998; pan-European effects
Gross and Henze (1999)
BLM regional weather prediction model (German Military Geophysical Office)
1999; low spatial resolution (60km grid square); referenced to model with no eclipse
Prenosil (2000)
KAMM non hydrostatic mesoscale model
1999; referenced to clear sky model; local effects
Vogel et al (2001)
Monte Carlo photon scattering model to predict changes in the visible radiation spectrum
1978 (simple model) 2006 (more complex 3D model)
Shaw (1978) Emde and Mayer (2007)
Meteorological radiation model (MRM)
2006; predictions of global and diffuse solar radiation compared satisfactorily to measurements
Psiloglou and Kambezedis (2007)
Limb darkening model 1999; spectral irradiance, global and diffuse solar radiation compared satisfactorily to measurements
Koepke et al (2001)
Table 2 Summary of eclipse modelling work
Year of eclipse Instrumentation Results Reference
1970 High-resolution barometer in totality
Main periodicity (Fourier analysis) was 89 min, 25 Pa
Anderson et al (1972)
1976 4 microbarograph array, separation 100-1000 km
22-24 min periodicity decaying to 40 min – but waves had started before eclipse (Zirker, 1991)
Goodwin and Hobson (1978)
1999 High-resolution barometer in totality
35 min periodicity (Fourier analysis) decaying to longer period and smaller amplitude. Signals present with 99% confidence compared to non-eclipse times
Aplin and Harrison (2003)
1979 4 infrasound detectors, separation ~ 1000m
12 Pa signal with 2 min periodicity. Not thought to be gravity waves.
Mcintosh and Revelle (1984)
1999 3 microbarograph array, separation ~100km
5 Pa signal with 9-12 min periodicity
Farges et al (2003)
1983 4 microbarograph array, one instrument in totality, separation ~1000km
10–15 Pa fluctuation of period 4 hours
Seykora et al (1985)
2006 Analysed temperature and relative humidity fluctuations
No effects seen Zerefos et al (2007)
Table 3 Summary of ground-based measurements of eclipse-induced gravity waves from the troposphere and stratosphere