Embed Size (px)
Citation preview
ATMA 2016
Tous droits de reproduction réservés – ATMA 2016
ETUDE DES METHANIERS DE NOUVELLE
GENERATION
Michel FAOU, Sébastien ROCHE
Total – Paris (France)
C. H. JIN
SAMSUNG Heavy Industry – Seoul (Korea)
Philippe CORRIGNAN, Pierre MARTY, Cleve WANDJI
Bureau Veritas – Marine & Offshore - Nantes (France)
SOMMAIRE
TOTAL SA, Le Chantier Coréen SAMSUNG HEAVY INDUSTRY et le BUREAU VERITAS se
sont associés dans le cadre d’un « Joint Development Projet» (JIP) pour étudier une nouvelle
génération de navires méthaniers de 180000m3 à rendement énergétique optimisé, en prenant en
compte l’évolution supposée des routes commerciales ainsi que l’utilisation commerciale du navire
tout en vérifiant la conformité aux règlements environnementaux futurs.
Dans ce but, une nouvelle forme de coque, l’optimisation de la propulsion et de la production
électrique ont été réalisés sur la base d’un profil opérationnel prédéfini du navire.
Les lignes de coque ont été optimisées par HydroOcean, filiale du BUREAU VERITAS en utilisant
des outils de simulation numérique, basés sur la théorie de Navier-Stokes, par des calculs en eau
calme comme sur houle (régulière et irrégulière).
Les résultats numériques en eau calme comme sur houle, ont été comparés à des essais en bassin.
SUMMARY
TOTAL SA, the Korean Shipyard SAMSUNG HEAVY INDUSTRIES and BUREAU VERITAS
have teamed up, within the scope of a Joint Industry Project, to design a new generation of
180000m3LNG carrier with high energy efficiency considering future LNG trading patterns, new
trading route and compliance with future environmental regulations.
In this purpose, a full hull form, propulsion and power generation optimization has been performed
for a pre-defined complete operational profile of the ship (i.e. full voyage including loading and
unloading operations, maneuvering, channeling, etc.).
The hull lines have been optimized by BV subsidiary HydrOcean using state-of-the-art Navier–Stokes
Computational Fluid Dynamics (CFD tools), considering both calm water performance and ship
behavior in waves.
The performance of the final design has been validated by calm water and seakeeping model tests.
Tous droits de reproduction réservés – ATMA 2016
1. INTRODUCTION
In 2014, TOTAL, SHI and BV have agreed to
join their knowledge and resources to design a
new generation of LNG carrier with high
energy efficiency. The main aims of this
agreement were:
to design the most optimized and
economical LNG carrier with high
energy efficiency considering the
future LNG trading patterns, new
trading route and compliance with
future environmental regulations;
to study the feasibility of possible
designs and technologies in technical,
operational and economical points of
view in order to optimize the design.
The optimization work started from a
“traditional”, yet modern, design. The cargo
containment was standard, the propulsion was
a dual fuel diesel electric, and the hull
optimized for laden condition. The first
optimization was to choose a more efficient
cargo containment from GTT manufacturer
which promised to reduce boil-off. To
optimize the propulsion, new generation two
stroke, large bore, slow speed, and dual fuel
main engines, promising lower fuel
consumption, have been evaluated using
holistic ship energy modelling. Finally, an
advanced CFD hull optimization for both
laden and ballast conditions have been made.
In the end, the final design reduces
significantly (boil-off) gas consumption
compared to the initial one, making it possible
to sell more cargo at each travel. It also saves
money with lower maintenance costs. The
major developments and conclusions of this
project are presented hereafter.
2. PROPULSION OPTIMISATION
Several years ago, when dual fuel engines did
not exist, LNG carriers were powered by
steam turbines powered by gas boilers burning
the natural boil-off. At some point in time it
was found more economical to use main diesel
engines, running on fuel oil. The major raisons
were the improved LNG tank insulation
reducing amounts of boil off available, the
higher efficiency of diesel engines, the lower
prices of crude oil and the lack of skilled crew
trained in using high pressure steam boilers.
The inevitable remaining gas surplus from boil
off was either burned of re-liquefied, re-
liquefaction being a big energy consumer
process. In the 2000s, the development of dual
fuel engines (gas and fuel), and new air
emission regulations (Tier II and Tier III in
Emission Control Area (ECA) zones)
convinced ship owners to switch back to gas
for LNG propulsion. The first dual fuel
engines available were medium speed engines
and diesel electric (or hybrid) propulsion
architecture became a standard amongst LNG
carriers. The very recent developments and
production of large bore, two stroke, and dual
fuel engines change the deal once again.
In this section, the potential energy saved by
modern dual fuel two stroke diesel engines
will be assessed. Three propulsive
architectures will be compared:
A 4-stroke dual fuel diesel electric
(DFDE)
A 2-stroke dual fuel, low pressure and
low speed engine(LPLS)
A 2-stroke dual fuel, high pressure and
low speed engine with EGR* (HPLS)
The comparison will be made using the
Bureau Veritas holistic energy simulation
platform SEECAT [1]
2.1 Holistic ship energy model
SEECAT stands for Ship Energy Efficiency
Calculation and Analysis Tool. It is a
simulation platform dedicated to model,
calculate and optimize ship’s energy
efficiency. It is able to track energy used all
along the different energy process that occur in
a ship (hull resistance, propeller thrust, engine
propulsion, steam production, exhaust gas heat
transfer, electricity generation, HVAC, etc.).
Calculation are made over a realistic
operational profile with given speed and
loading conditions (see Figure 1). In this case,
it represents a roundtrip between Sabine Pass
(USA) and Incheon (South Korea), through
Panama Canal.
During navigation three speeds are mainly
used 12, 17.5 and 19.5 knots. Figure 2 shows
the speed profile for one round trip. Five
navigation modes are defined over a round

Tous droits de reproduction réservés – ATMA 2016
trip. As represented in Figure 2, each
navigation mode is associated to one number:
1 for seagoing, 2 for maneuvering, 3 for
unloading, 4 for loading and 5 for port. During
a round trip there are two loading conditions:
laden condition from Sabine Pass to Incheon
and ballast condition from Incheon to Sabine
Pass. In addition, the North American NOx
Emission Control Area (NECA) (see green
part in Figure 2) is defined in the operational
profile. In this area the Exhaust Gas
Recirculation (EGR) is activated with the
HPLS architecture to comply with Tier III
regulation of MARPOL Annex VI. Gas mode
is used all time for main engines, auxiliaries
and oil fired boiler. Two-stroke main engines
(HPLS and LPLS) are “off” (i.e. not
consuming gas) during loading, and unloading.
Over this roundtrip, five key performance
indicators (KPI) were calculated by SEECAT:
FBOG: Forced boil-off gas mass
NBOG: Natural boil-off gas mass
GCU: Boil-off gas burnt in the gas
combustion unit
Total gas consumption: gas
consumption from all consumers (gas
boilers, main engines and gensets).
Pilot fuel: pilot fuel consumption in
dual fuel engines
Figure 1: Map of vessel’s route between Sabine Pass (USA) and Incheon (South Korea)
Figure 2a: Ship speed Profile considered
Tous droits de reproduction réservés – ATMA 2016
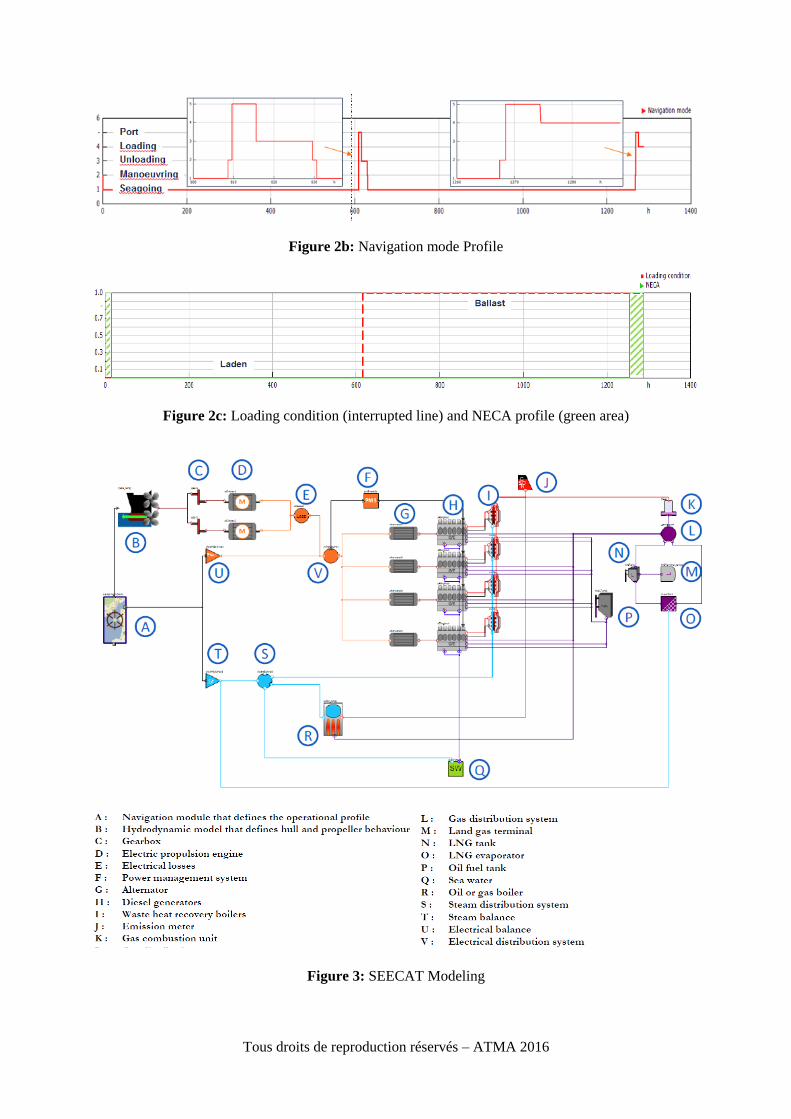
Figure 2b: Navigation mode Profile
Figure 2c: Loading condition (interrupted line) and NECA profile (green area)
Figure 3: SEECAT Modeling

Tous droits de reproduction réservés – ATMA 2016
2.2 Propulsion architecture
Nowadays, the DFDE architecture can be
considered as a traditional propulsive
architecture for LNG carriers. It is composed
of four dual fuel diesel generators (see Figure
3).Propellers are powered by medium speed
synchronous motor with a gear box. Steam is
produced by 4 waste heat recovery boilers
mounted on the four engines and one oil fired
boiler.
The LPLS (Figure 4) and HPLS (Figure 5)
configurations are mechanical propulsion. The
prime movers are two 2-stroke dual fuel
engines. Steam is produced by two waste heat
recovery mounted on the two main engines
exhausts and one oil fired boiler. Electricity is
generated by three gen sets.
Prime movers of DFDE and LPLS
configurations can run all the time in gas
mode, and comply with Tier III NOx
regulations in this mode. HPLS configuration,
that uses high pressure gas system, needs an
additional device to comply with Tier III
regulations. Exhaust Gas Recirculation (EGR)
has been added, and is activated only when the
ship is in a NECA zone.
In addition to the 2-stroke engine and the
EGR, differences between the HPL Sand
LPLS configurations are the high pressure
pumps and compressors as well as the
corresponding electrical balance
Figure 4: SEECAT Modeling with LPLS architecture of the tanker

Tous droits de reproduction réservés – ATMA 2016
Figure 5: SEECAT Modeling with HPLS architecture of the tanker
2.3 Advanced boil-off gas model
Natural gas is transported on board ships under
liquid form (LNG) to save up space. To do so,
LNG is kept at very low temperature (around –
160 °C) in insulated tanks. As insulation is
never perfect, thermal heat from the outside
eventually penetrates the tank and makes LNG
boil. This natural boil-off gas (NBOG) is then
used as fuel in engines for propulsion and
electricity production. If there is too much
NBOG, the remaining gas can be either burned
or re-liquefied. If gas consumption is too high
and there is not enough NBOG, boil-off can be
forced, using an evaporator (heat exchanger).
This later operation is called forced boil-off
gas (FBOG) in opposition to NBOG.
As being as energy efficient and economical as
possible are the two main objectives of this
project, determining the mass flow of NBOG
accurately is of crucial importance.
Classically, NBOG calculations are made
using a static BOG rate according to the
following equation:
This equation is simple and effective when
roughly calculating the remaining volume of
LNG at the end of a journey. But it is not
accurate enough for advanced comparisons
between engines. The evaporation of LNG is a
dynamic and complex process which depends
also on the LNG nitrogen (N2) content. With
the help of TOTAL, BV has built a new model
of LNG tank that calculates the NBOG mass
flow more accurately than traditionally.
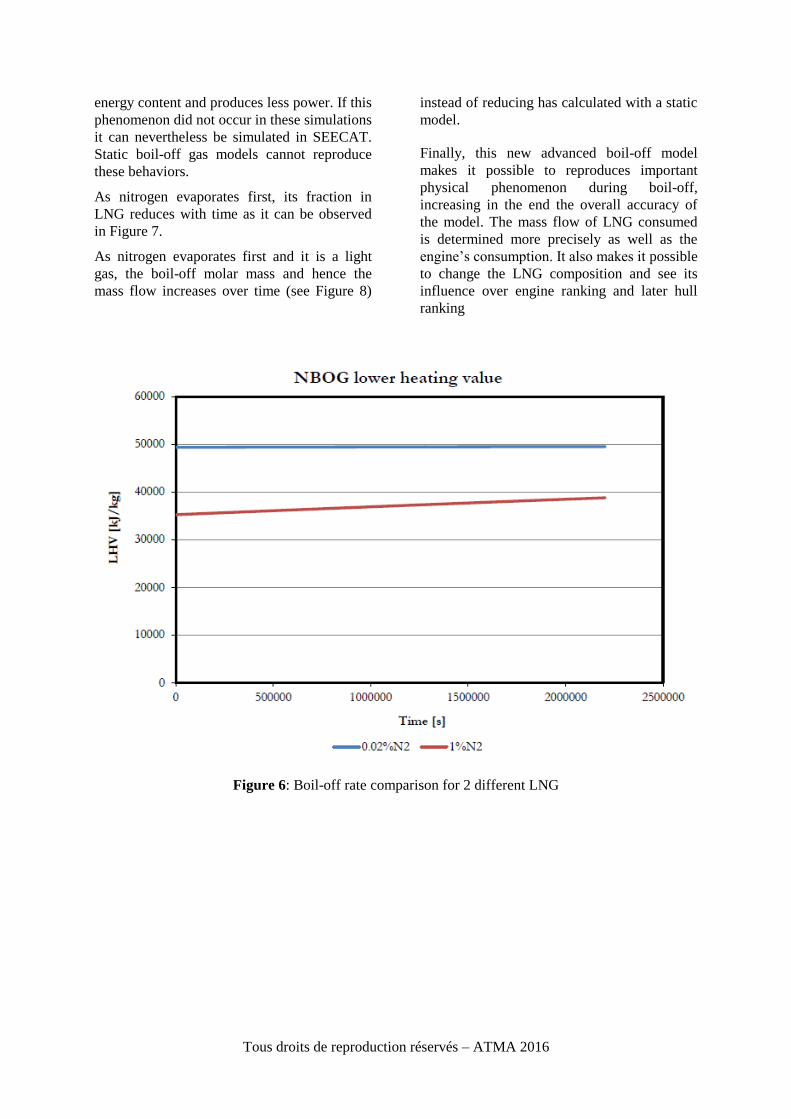
The amount of nitrogen in LNG can vary from
almost zero to a few percent. Despite this
small fraction it can have a big influence on
the quality of the boil-off. As nitrogen is
lighter than LNG it will evaporate in priority,
reaching high percentages in boil-off. For
example, just after loading, for a LNG
containing just 1% of nitrogen, the molar
fraction of nitrogen in boil-off can reach up to
21 %.This has great impact on the engines
behavior as it dilutes the methane and reduces
the boil-off energy content (see Figure 6.
The engine hence requires more boil-off mass
flow to produce the same amount of power. If
methane is diluted too much the engine can be
de-rated, i.e., it can no longer guarantee its
maximum power due to very low boil-off
Tous droits de reproduction réservés – ATMA 2016
energy content and produces less power. If this
phenomenon did not occur in these simulations
it can nevertheless be simulated in SEECAT.
Static boil-off gas models cannot reproduce
these behaviors.
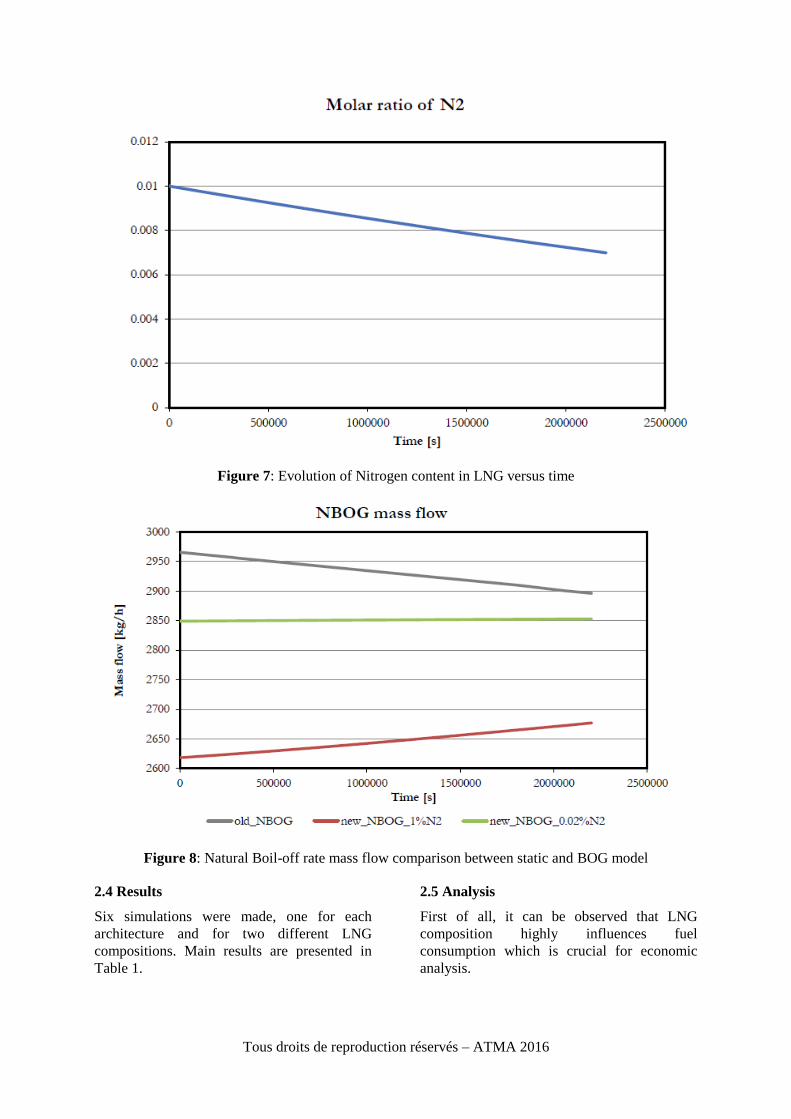
As nitrogen evaporates first, its fraction in
LNG reduces with time as it can be observed
in Figure 7.
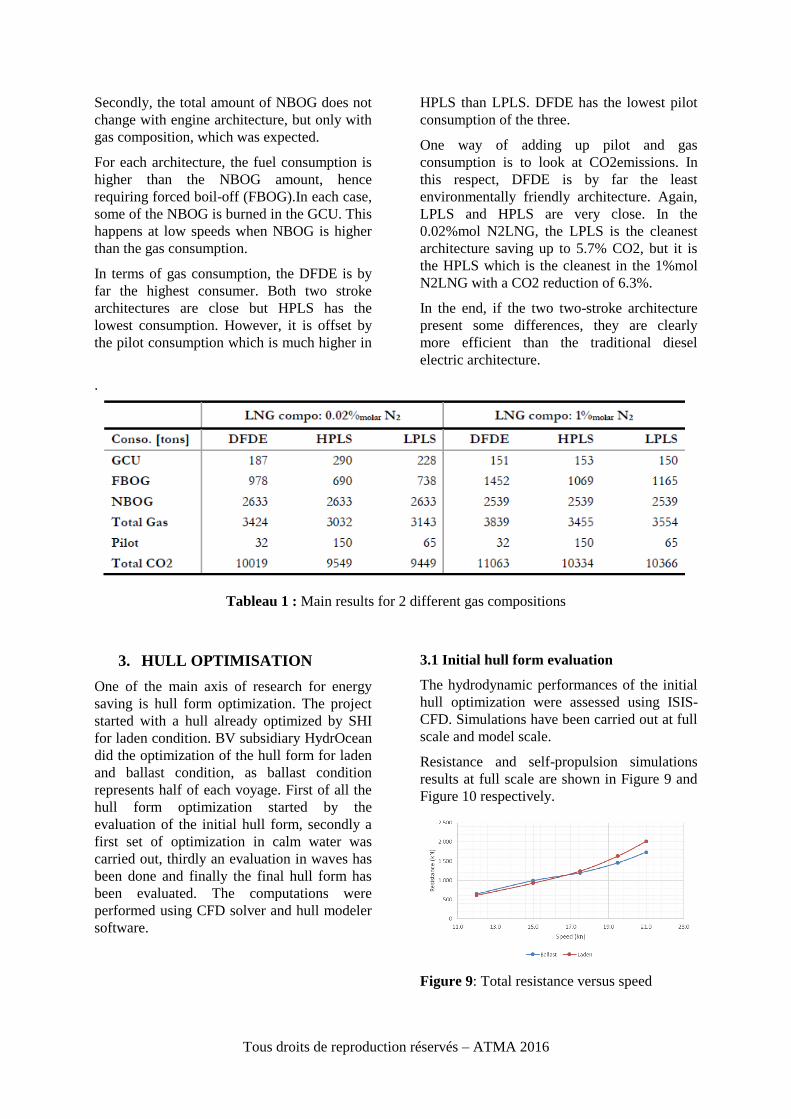
As nitrogen evaporates first and it is a light
gas, the boil-off molar mass and hence the
mass flow increases over time (see Figure 8)
instead of reducing has calculated with a static
model.
Finally, this new advanced boil-off model
makes it possible to reproduces important
physical phenomenon during boil-off,
increasing in the end the overall accuracy of
the model. The mass flow of LNG consumed
is determined more precisely as well as the
engine’s consumption. It also makes it possible
to change the LNG composition and see its
influence over engine ranking and later hull
ranking
Figure 6: Boil-off rate comparison for 2 different LNG
Tous droits de reproduction réservés – ATMA 2016
Figure 7: Evolution of Nitrogen content in LNG versus time
Figure 8: Natural Boil-off rate mass flow comparison between static and BOG model
2.4 Results
Six simulations were made, one for each
architecture and for two different LNG
compositions. Main results are presented in
Table 1.
2.5 Analysis
First of all, it can be observed that LNG
composition highly influences fuel
consumption which is crucial for economic
analysis.
Tous droits de reproduction réservés – ATMA 2016
Secondly, the total amount of NBOG does not
change with engine architecture, but only with
gas composition, which was expected.
For each architecture, the fuel consumption is
higher than the NBOG amount, hence
requiring forced boil-off (FBOG).In each case,
some of the NBOG is burned in the GCU. This
happens at low speeds when NBOG is higher
than the gas consumption.
In terms of gas consumption, the DFDE is by
far the highest consumer. Both two stroke
architectures are close but HPLS has the
lowest consumption. However, it is offset by
the pilot consumption which is much higher in
HPLS than LPLS. DFDE has the lowest pilot
consumption of the three.
One way of adding up pilot and gas
consumption is to look at CO2emissions. In
this respect, DFDE is by far the least
environmentally friendly architecture. Again,
LPLS and HPLS are very close. In the
0.02%mol N2LNG, the LPLS is the cleanest
architecture saving up to 5.7% CO2, but it is
the HPLS which is the cleanest in the 1%mol
N2LNG with a CO2 reduction of 6.3%.
In the end, if the two two-stroke architecture
present some differences, they are clearly
more efficient than the traditional diesel
electric architecture.
.
Tableau 1 : Main results for 2 different gas compositions
3. HULL OPTIMISATION
One of the main axis of research for energy
saving is hull form optimization. The project
started with a hull already optimized by SHI
for laden condition. BV subsidiary HydrOcean
did the optimization of the hull form for laden
and ballast condition, as ballast condition
represents half of each voyage. First of all the
hull form optimization started by the
evaluation of the initial hull form, secondly a
first set of optimization in calm water was
carried out, thirdly an evaluation in waves has
been done and finally the final hull form has
been evaluated. The computations were
performed using CFD solver and hull modeler
software.
3.1 Initial hull form evaluation
The hydrodynamic performances of the initial
hull optimization were assessed using ISIS-
CFD. Simulations have been carried out at full
scale and model scale.
Resistance and self-propulsion simulations
results at full scale are shown in Figure 9 and
Figure 10 respectively.
Figure 9: Total resistance versus speed

Tous droits de reproduction réservés – ATMA 2016
Figure 10: Ship delivered power vs speed
One can observe that for speed below 17 knots
resistance and power are higher for ballast
than for laden condition.
Figure 11 presents a comparison for the initial
hull between full scale resistance and
resistance extrapolated at full scale from
model scale computations. There is a very
good agreement between the full scale
resistance and resistance extrapolated at full
scale from model scale computations.
Figure 11: Comparison model test/CFD
3.2 Calm water Evaluation
After presenting the optimization constraints,
the first step of the optimization, which
consists in the evaluation of the impact of each
deformation taken separately on the resistance
and/or the ship power, is shown. Best
deformations regarding ship power reduction
are then combined in order to obtain the
optimum hull shape regarding ship power in
calm water. Computations have been
performed for the 6 main operating conditions
defined for the target operational profile (see
section 2.1): 2 loading conditions (laden and
ballast) and 3 speeds.
The optimization was performed while
respecting the constraints provided by SHI,
mainly concerning:
Engine boundary,
Cargo boundary in order to fulfil New
IGC code,
Flat of side constraints,
Propeller characteristics.
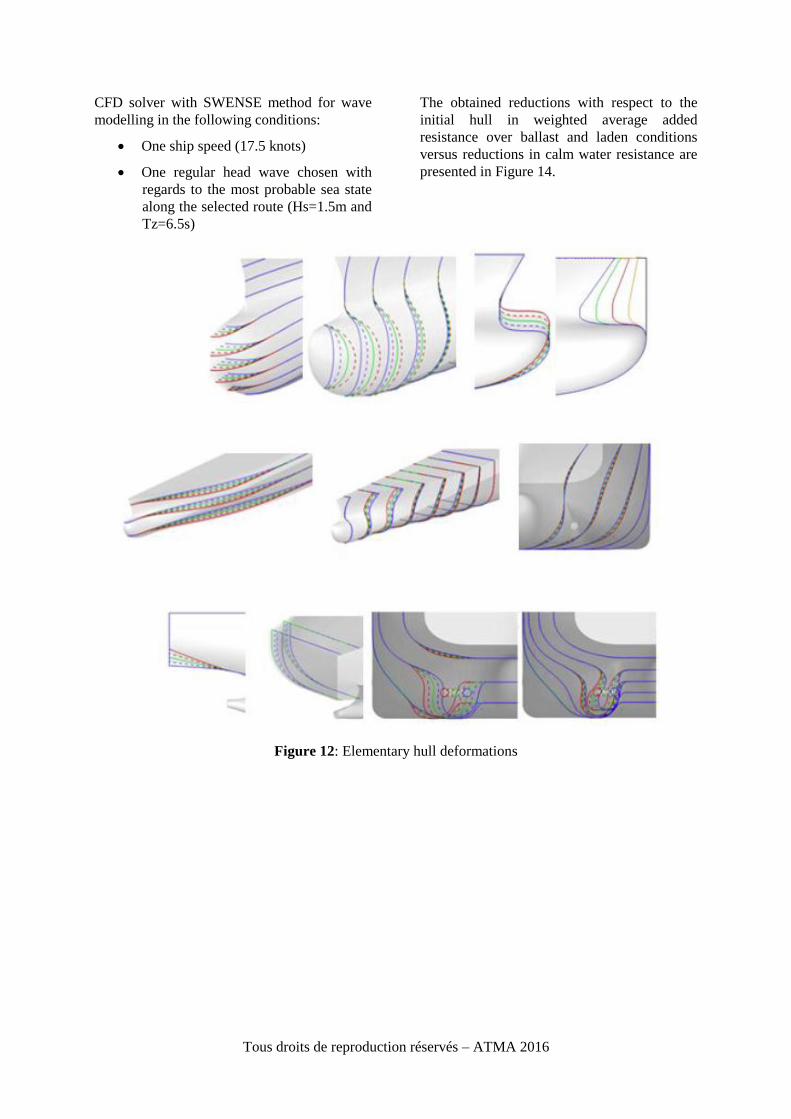
A first set of self-propulsion calculations was
first performed for elementary variations of:
Bulbous bow length, width and height,
Bow design,
Entrance angle, fore sections shape,
Transom immersion and width,
Skeg distance and angle,
Longitudinal center of buoyancy,
As illustrated on Figure 12.
Combinations of the best deformations were
then investigated in order to find the best hull
form regarding ship power reduction. An
intermediate step corresponding to the
combination of deformations applied on the
fore body separately from combination of
deformations applied on the aft body was
performed before the final evaluation of the
last candidates. All new designs were
evaluated on the 6 operating conditions.
In total, more than 100 hull forms have been
evaluated in self-propulsion for 6 operating
conditions which represented more than 600
free surfaces Navier-Stokes computations.
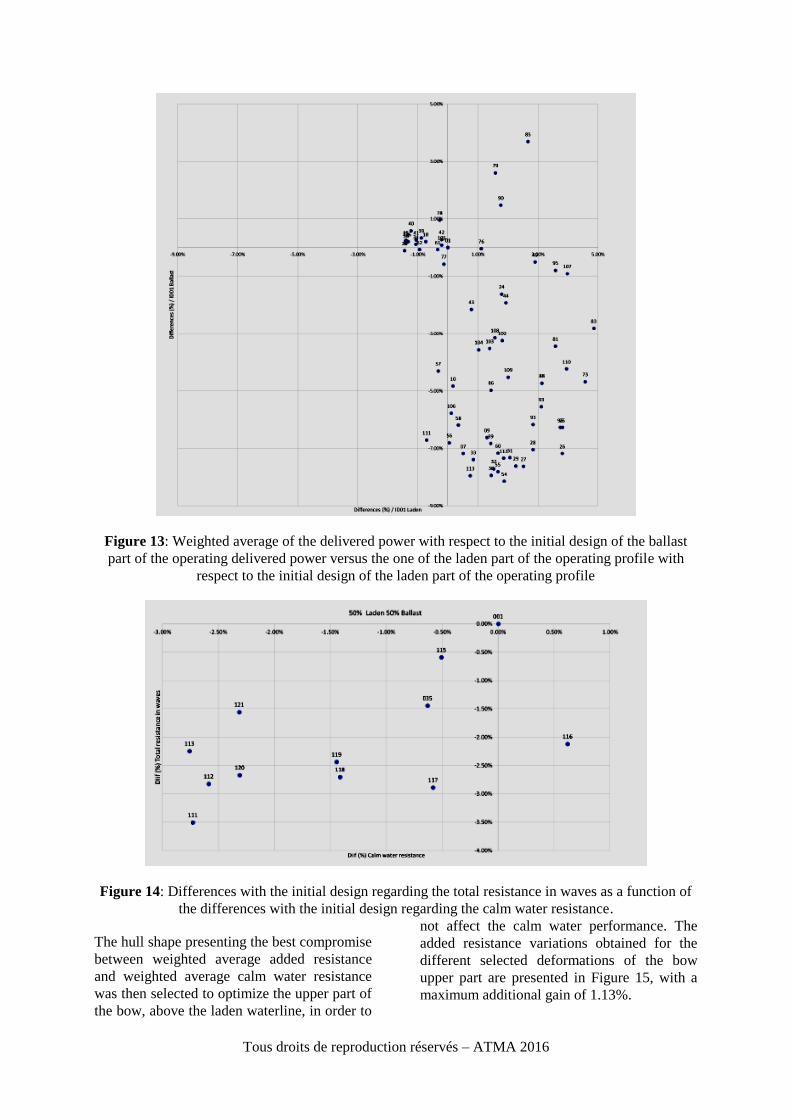
Figure 13 shows the differences on the
weighted average of the delivered power with
respect to the initial design of the ballast part
of the operating profile versus the one of the
laden part of the operating profile.
The hull form offering the lowest total
weighted average delivered power over the full
operating profile
3.3 Design evaluation in waves
Hull performance in waves was then
considered in the optimization process. First,
the added resistance on has been calculated for
the 12 best hull forms issued from the calm
water optimization process. In this purpose,
resistance calculations have been conducted at
full scale using a Navier-Stokes free surface
Tous droits de reproduction réservés – ATMA 2016
CFD solver with SWENSE method for wave
modelling in the following conditions:
One ship speed (17.5 knots)
One regular head wave chosen with
regards to the most probable sea state
along the selected route (Hs=1.5m and
Tz=6.5s)
The obtained reductions with respect to the
initial hull in weighted average added
resistance over ballast and laden conditions
versus reductions in calm water resistance are
presented in Figure 14.
Figure 12: Elementary hull deformations
Tous droits de reproduction réservés – ATMA 2016
Figure 13: Weighted average of the delivered power with respect to the initial design of the ballast
part of the operating delivered power versus the one of the laden part of the operating profile with
respect to the initial design of the laden part of the operating profile
Figure 14: Differences with the initial design regarding the total resistance in waves as a function of
the differences with the initial design regarding the calm water resistance.
The hull shape presenting the best compromise
between weighted average added resistance
and weighted average calm water resistance
was then selected to optimize the upper part of
the bow, above the laden waterline, in order to
not affect the calm water performance. The
added resistance variations obtained for the
different selected deformations of the bow
upper part are presented in Figure 15, with a
maximum additional gain of 1.13%.

Tous droits de reproduction réservés – ATMA 2016
Figure 15: Gain obtained on added resistance
3.3 Final Hull form evaluation
The hydrodynamic performances of hull form
resulting from the above described
optimization process were finally evaluated in
self-propulsion in calm water and in waves,
using ISIS-CFD, and compared to model tests
conducted by SHI.
Figure 16 shows a good agreement between
the delivered power at model scale obtained
from model tests and from CFD simulations,
acknowledging that rudders and bow thruster
that were modelled in the basin were not
modelled in the CFD computations.
Figure 16: Comparison of power between
CFD and model tests
Figure 17 shows the comparison between the
delivered power computed at full scale for the
initial and the final hull form for both loading
conditions (ballast and laden). If slightly larger
powers are needed at speeds larger than
19.5kn, significant gains are obtained at lower
speed and in particular in ballast condition
where the bump visible at 15 knots was
completely reduced by the optimization.
Figure 17: Ship delivered power function of
speed
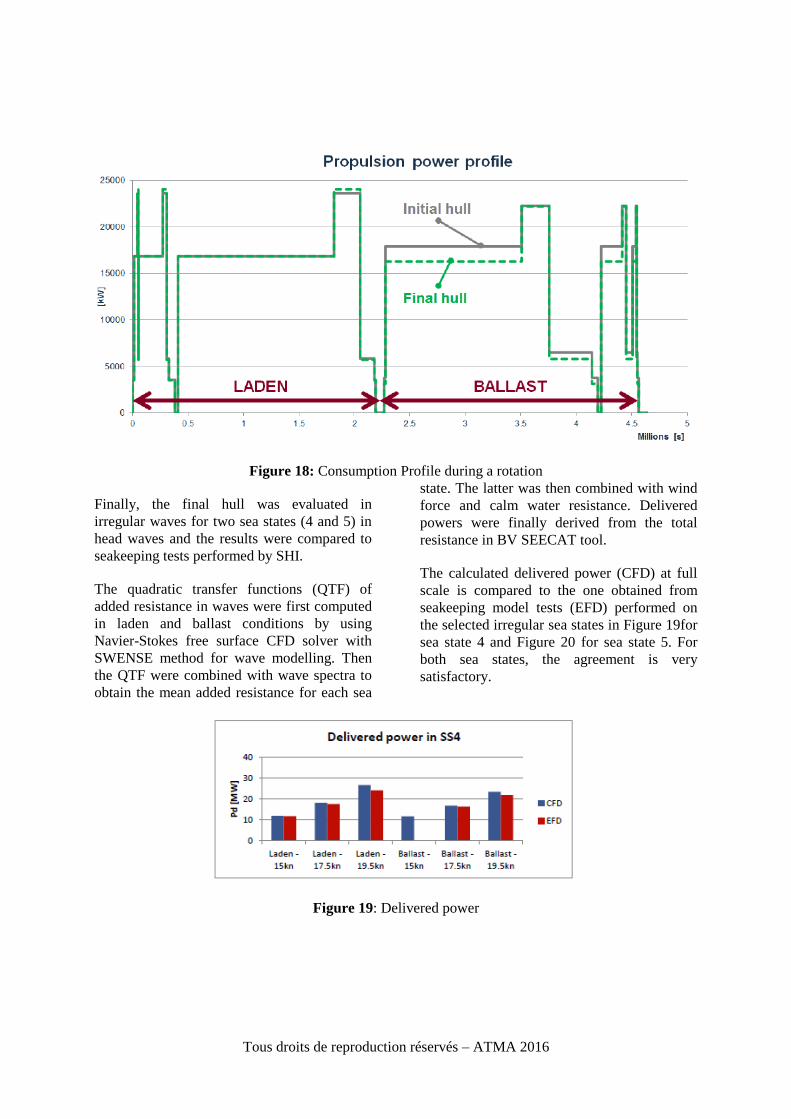
When considering the full operational profile
of the ship, as illustrated in Figure 18, the hull
optimization enabled a reduction of weighted
average delivered power of 8% in ballast
condition, for an increase of 0.3% in laden
condition, resulting in a global reduction of
3.8% over a round trip.
Tous droits de reproduction réservés – ATMA 2016
Figure 18: Consumption Profile during a rotation
Finally, the final hull was evaluated in
irregular waves for two sea states (4 and 5) in
head waves and the results were compared to
seakeeping tests performed by SHI.
The quadratic transfer functions (QTF) of
added resistance in waves were first computed
in laden and ballast conditions by using
Navier-Stokes free surface CFD solver with
SWENSE method for wave modelling. Then
the QTF were combined with wave spectra to
obtain the mean added resistance for each sea
state. The latter was then combined with wind
force and calm water resistance. Delivered
powers were finally derived from the total
resistance in BV SEECAT tool.
The calculated delivered power (CFD) at full
scale is compared to the one obtained from
seakeeping model tests (EFD) performed on
the selected irregular sea states in Figure 19for
sea state 4 and Figure 20 for sea state 5. For
both sea states, the agreement is very
satisfactory.
Figure 19: Delivered power

Tous droits de reproduction réservés – ATMA 2016
Figure 20: Delivered power
4. ECONOMICAL ANALYSIS
To evaluate the most profitable engine
architecture, economical simulations were
evaluated. They compared capital costs,
maintenance costs as well as fuel and gas
consumption. They were based on new
SEECAT simulations done with the final hull
design and with the updated two stroke
propulsion architecture (for the LPL Sand
HPLS architectures, the engines maximum
continuous rating power and specific fuel and
gas consumption have been adapted to the
latest hull along with their respective waste
heat recovery boilers and EGR
systems).Comparison was hence made
between initial hull (DFDE) and final hull
(two stroke dual fuel architecture).
4.1 Consumption cost
Consumption costs add up LNG consumed in
engines and boilers, lubricating oil and pilot
fuel. Lubricating oil consumption has been
calculated by Total “Lub Marine” services.
Whereas gas and fuel consumption figures
come from SEECAT simulations. The total
consumption cost over a round trip is
presented in Figure 21. HPLS and LPLS (with
final hull) are very close to each other (1.6 %
difference) and show significant improvement
(8.3 % savings) over DFDE (initial hull).
Moreover, the new design makes it possible to
deliver 491 additional tons of LNG at each
roundtrip, which represents 12% savings (see
Figure 22).
Figure 21: Cost comparison

Tous droits de reproduction réservés – ATMA 2016
Figure 22: Cargo consumed during one round trip. Comparison DFDE 2 strokes
4.2 Maintenance costs
Maintenance costs depend on many factors
(ship-owner, crew behavior, running hours,
fuel quality, maintenance contract commercial
agreement, unpredictable events, etc.). For
engines they are roughly function of the total
number of cylinders, which explains the gains
possible with two-stroke engines (see Figure
23). For DFDE architecture, estimations are an
average between manufacturers’ data and
effective feedback from current TOTAL
LNGC chartered fleet. For the two stroke
architectures, estimations rely only on
manufacturer’s data. As these architectures are
recent on the market, a 30 % security margin
has been added for two-stroke engine
maintenance costs.
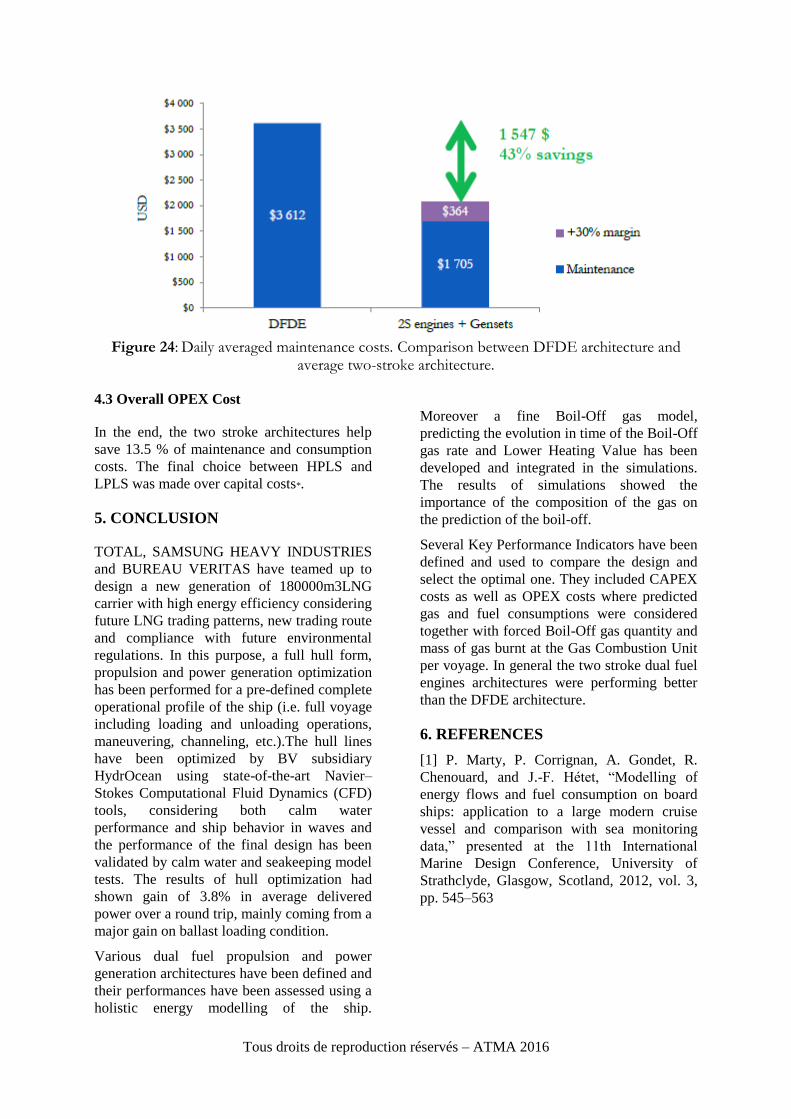
Looking at daily maintenance costs, the two-
stroke architectures help save $1547 which
represents a 43% reduction over DFDE (see
Figure 24).
Figure 23: Average maintenance cost over 20 years. Comparison between average two-stroke
architecture and diesel electric architecture.
Tous droits de reproduction réservés – ATMA 2016
Figure 24: Daily averaged maintenance costs. Comparison between DFDE architecture and
average two-stroke architecture.
4.3 Overall OPEX Cost
In the end, the two stroke architectures help
save 13.5 % of maintenance and consumption
costs. The final choice between HPLS and
LPLS was made over capital costs*.
5. CONCLUSION
TOTAL, SAMSUNG HEAVY INDUSTRIES
and BUREAU VERITAS have teamed up to
design a new generation of 180000m3LNG
carrier with high energy efficiency considering
future LNG trading patterns, new trading route
and compliance with future environmental
regulations. In this purpose, a full hull form,
propulsion and power generation optimization
has been performed for a pre-defined complete
operational profile of the ship (i.e. full voyage
including loading and unloading operations,
maneuvering, channeling, etc.).The hull lines
have been optimized by BV subsidiary
HydrOcean using state-of-the-art Navier–
Stokes Computational Fluid Dynamics (CFD)
tools, considering both calm water
performance and ship behavior in waves and
the performance of the final design has been
validated by calm water and seakeeping model
tests. The results of hull optimization had
shown gain of 3.8% in average delivered
power over a round trip, mainly coming from a
major gain on ballast loading condition.
Various dual fuel propulsion and power
generation architectures have been defined and
their performances have been assessed using a
holistic energy modelling of the ship.
Moreover a fine Boil-Off gas model,
predicting the evolution in time of the Boil-Off
gas rate and Lower Heating Value has been
developed and integrated in the simulations.
The results of simulations showed the
importance of the composition of the gas on
the prediction of the boil-off.
Several Key Performance Indicators have been
defined and used to compare the design and
select the optimal one. They included CAPEX
costs as well as OPEX costs where predicted
gas and fuel consumptions were considered
together with forced Boil-Off gas quantity and
mass of gas burnt at the Gas Combustion Unit
per voyage. In general the two stroke dual fuel
engines architectures were performing better
than the DFDE architecture.
6. REFERENCES
[1] P. Marty, P. Corrignan, A. Gondet, R.
Chenouard, and J.-F. Hétet, “Modelling of
energy flows and fuel consumption on board
ships: application to a large modern cruise
vessel and comparison with sea monitoring
data,” presented at the 11th International
Marine Design Conference, University of
Strathclyde, Glasgow, Scotland, 2012, vol. 3,
pp. 545–563

Tous droits de reproduction réservés – ATMA 2016