Embed Size (px)
Citation preview
Finance and Economics Discussion Series Divisions of Research & Statistics and Monetary Affairs
Federal Reserve Board, Washington, D.C.
ATM Surcharge Bans and Bank Market Structure: The Case of Iowa and its Neighbors
Timothy H. Hannan 2005-46
NOTE: Staff working papers in the Finance and Economics Discussion Series (FEDS) are preliminary materials circulated to stimulate discussion and critical comment. The analysis and conclusions set forth are those of the authors and do not indicate concurrence by other members of the research staff or the Board of Governors. References in publications to the Finance and Economics Discussion Series (other than acknowledgement) should be cleared with the author(s) to protect the tentative character of these papers.
ATM SURCHARGE BANS AND BANK MARKET STRUCTURE: THE CASE OF IOWA AND ITS NEIGHBORS
By
Timothy H. Hannan*
August 2005
*Senior Economist Federal Reserve Board Washington DC 20551
The views expressed herein are those of the author and do not necessarily reflect the views of the Board of Governors of the Federal Reserve System or its staff. The author would like to thank Robert Adams, Andrew Cohen, Ronald Borzekowski, Robin Prager, and Christopher Knittel for valuable comments; Robert Avery for allowing use of merger programs developed by him; and David Kite for excellent research assistance.
1
ATM Surcharge Bans and Bank Market Structure: The Case of Iowa and its Neighbors
Absract:
It is frequently claimed that high ATM surcharges actually attract customers to the banks that impose them, particularly if they operate large ATM networks. By exploiting as “natural experiments” two events associated with the lifting of surcharge bans in Iowa and in the states that neighbor Iowa, this paper seeks to test for the implications of this phenomenon as it applies to the market shares of banking institutions and to several aspects of market structure. Consistent with these implications, results of “difference-in-difference” analyses suggest that the shares of larger market participants increase, the shares of smaller market participants decrease, market concentration increases, and the number of market competitors decreases after the lifting of surcharge bans.
2
1. Introduction
When a depositor of one bank conducts a transaction using an ATM owned by
another, the depositor may incur two fees: the so-called foreign fee, levied by the
depositor’s own bank, and another fee, known as a surcharge, levied by the institution
that owns the ATM. This latter fee has been the subject of some controversy. In popular
commentary in the press and on Capitol Hill, it has been referred to as “double charging,”
since it represents a second charge on the same transaction.
A more substantive allegation, and one of perhaps more interest to the economist,
is the claim that the ATM surcharge provides an example of a price that can actually
attract customers to the firm charging a higher price. The reason is that surcharges
typically are not levied for the use of a bank’s ATMs by the bank’s own depositors.
Thus, a higher surcharge levied by a bank, particularly one that operates numerous
ATMs, provides an incentive for depositors of banks with fewer ATMs to switch their
accounts to the bank to avoid the fee. Thus, while a bank’s surcharge may discourage the
depositors of other banks from using the bank’s ATMs (the “direct effect” of
surcharging), it may actually encourage them to switch their accounts to the surcharging
bank, and there is every reason to believe that this “indirect effect,” as we will call it, is
more pronounced, the larger the number of ATMs that the surcharging bank has to offer
ATM users.
The existence of this “indirect effect” has been central to discussions regarding
the desirability of bans on surcharges. Some of this discussion has focused on the impact
of surcharging on small banks, presumably because of a concern for the state of bank
competition in the long run. Because of the indirect effect, surcharging may harm small
3
banks either because it provides an incentive for depositors of small banks to switch their
accounts to larger institutions with large networks of ATMs, or because it induces smaller
banks to lower retail fees or increase deposit rates to prevent, at least in part, the loss of
deposits. As discussed in more detail below, a few recent contributions have sought to
assess the broader welfare implications of surcharge bans, taking into account this
indirect effect.
This paper seeks to test for the existence of the indirect effect by examining the
impact of surcharge bans on the market shares of banking institutions and on several
aspects of market structure by exploiting as “natural experiments” two events associated
with the lifting of a surcharge ban in Iowa and in the states that neighbor Iowa. The first
of these events occurred on April 1, 1996, when the Cirrus and Plus national ATM
networks modified their operating rules to allow ATM owners to impose surcharges.
Surcharging thereafter spread rapidly in the states that neighbor Iowa, but, because of
state legislation, the ban remained firmly in force in Iowa. The second event occurred in
March of 2002, when a court decision resulted in the lifting of the ban in Iowa as well.
The statistical approach employed is that of a “difference-in-difference” analysis,
wherein changes in bank-specific market shares (as well as related measures of market
structure) occurring over a period in which a surcharge ban was lifted are compared to
equivalently measured changes occurring over the same time period in neighboring states
where no change in surcharge restrictions occurred. This approach, though simple,
avoids some potential problems inherent in, and at the very least provides a useful
alternative to, the more commonly employed structural econometric analyses appearing
recently in the literature. Consistent with the presence of an “indirect effect,” results
4
suggest that the shares of larger market participants increase, the shares of smaller market
participants decrease, market concentration increases, and the number of market
competitors decreases after the lifting of surcharge bans.
The plan of the paper is as follows: Section 2 discusses the relevant literature,
while section 3 outlines the “difference in difference” analysis employed. Section 4
discusses the empirical model, and section 5 describes the data and variable
measurement. Section 6 presents results, and a final section concludes.
2. The Literature
A number of recent studies have addressed the implications of bank surcharges
and policies to ban them. Massoud and Bernhardt (2002a, 2202b) develop game-
theoretic spatial models in which the pricing of ATM services by banks, the choice of
home bank by depositors, and (in the case of 2002a) the use of ATMs by depositors are
endogenized. The equilibrium delivers a number of observed regularities: Banks do not
charge their own depositors for ATM usage but charge high surcharges for the use of
their ATMs by nondepositors. Also, larger banks set higher account fees and demand
higher surcharges for ATM use than smaller banks.1 Central to their model is the
assumption that banks extract surplus efficiently from depositors but not from
nondepositors of the bank. So they set high ATM surcharges for nondepositors in order
to increase the number of their depositors (what we have termed the “indirect effect”).
In terms of welfare implications, their model implies that surcharge bans raise bank
1 For evidence consistent with these predictions, see the Annual Reports to Congress on Retail Fees and Services of Depository Institutions, Federal Reserve Board, 1998-2003 and Hannan (2004).
5
profits, have an ambiguous impact on total consumer welfare, and raise total producer
plus consumer surplus.
This latter issue—the impact of surcharging and surcharge bans on consumer or
total welfare—has been addressed empirically in several recent works that employ
detailed structural models of depositor behavior and, in some cases, bank or ATM owner
behavior as well. As Knittel and Stango (December 2004) note, surcharging reduces
consumer welfare by making the ATMs of competing banks in essence “less
compatible,” but it improves consumer welfare through the increase in available ATMs
that surcharging can bring. To address this tradeoff, they estimate a structural demand
model of bank choice, and this yields the impact of surcharges and ATM availability on
depositor utility. These estimated effects, together with some rough estimates of the
relationship between surcharging and the number of ATMs that banks find it in their
interest to deploy, allows them to assess this tradeoff between the welfare enhancing and
welfare reducing effects of surcharging. They conclude that the increased availability of
ATMs resulting from surcharging is likely to more than offset the harm from higher fees
in markets with higher population densities, where, because of higher travel costs,
depositors place a higher value on ATM availability. Their findings suggest that the
opposite may be true, however, in markets with low population densities.
Gowrisankaran and Krainer (2004) also derive welfare implications from a
structural model, but their model is based not on the observed choice of banks by
depositors but on the observed locational or “entry” choices of ATM owners. Focusing
on the rural Minnesota and Iowa counties located near the boundary between those two
states, they obtain estimates of fundamental utility and cost parameters from observed
6
entry decisions and then use these parameters to evaluate policy experiments, such as the
imposition of a surcharge ban. The fact that Iowa did not allow surcharging during the
period examined allows them to identify the role of price in their model. They conclude
that surcharging reduces consumer welfare (by about 10 percent),2 but that because it
results in an improvement in producer welfare by about an equal amount, total welfare
would be relatively unchanged with a lifting or an imposition of a surcharge ban.
In another recent “structural” paper, Ishii (2004) employs an impressive set of
data on financial institutions in the state of Massachusetts to estimate a structural model
of both demand and supply for bank deposits. The data employed include information on
actual bank-specific ATM locations and retail ATM interconnection prices. While her
conclusions regarding the welfare implications of surcharging are too tentative to cite as
of this writing (April 2005), a counterfactual policy experiment based on estimated
demand and supply parameters and conditional on network size predicts, among other
things, that surcharging leads to significantly higher market shares on the part of larger
market participants, significantly smaller marker shares on the part of small market
participants, and, consequently, significantly higher levels of market concentration. As
we will see, this paper reports similar findings, based on a very different methodology.
In another paper, Knittel and Stango (September 2004) employ a pooled time-
series of bank observations over the period from 1994 to 1999 to estimate the impact of
ATM deployment and surcharging on willingness to pay for deposit accounts and,
separately, on bank deposit shares. They find that incompatibility, as measured by
interconnection fees (primarily surcharges) or state laws that allowed surcharging, leads
2 Since these rural counties undoubtedly have low population densities, this finding of reduced consumer welfare is consistent with findings reported by Knittel and Stango ( December 2004).
7
to lower willingness to pay for deposit accounts and that incompatibility benefits firms
with large ATM fleets. Since the paper employs observations both before and after the
general relaxation of surcharge bans that occurred in 1996, it may be thought of as a
“difference-in-difference analysis,” wherein changes observed from a period before to a
period after 1996 for banks in states where surcharging was allowed both before and after
1996 are compared to changes over the same years observed for banks that were allowed
to surcharge only from 1996 on. A potential shortcoming of this particular aspect of the
paper, as the authors readily note, is that few banks in states that allowed surcharges
before 1996 may have actually chrged them at that time, implying little difference
between the two groups.
One empirical study reported recently by Hannan, Kiser, Prager, and McAndrews
(2003) found (if it may be so described) indirect evidence of the indirect effect. In
assessing the likelihood that a bank with ATMs will levy a surcharge on ATM users that
are not depositors of the bank, these authors note that if banks consider the potential for
surcharges to attract depositors, then one should see more surcharging in markets where
attracting new customers through this policy is likely to be more successful. They note
two characteristics that might index relative success in attracting new customers. First,
markets in which banks with small market shares make up collectively a large proportion
of the market should provide a relatively large number of depositors who could be more
readily induced to switch to a larger surcharging bank. The reason is that the difference
in convenience between a small bank with few ATMs and a large one with many ATMs
can be quite pronounced, and such a market provides a larger number of small bank
depositors for whom that is true. The second characteristic is the degree of in-migration
8
into the market, since people new to the market do not face switching costs to deter
changes in deposit relationships. Consistent with the existence of an indirect effect,
Hannan, Kiser, Prager, and McAndrews (2003) find that banks are more likely to
surcharge in markets that experience higher rates of in-migration. However, no
consistent, statistically significant relationship between surcharging and the variable
measuring the cumulative market share of banks with small market shares was observed.
Another examination of an implication of the indirect effect was reported by
Prager (2001). A primary motivation for this study was the frequently stated concern that
surcharging would seriously harm smaller banking organizations that compete with large
organizations that deploy large numbers of ATMs. Focusing on the period before 1996,
her approach was to compare the change in the cumulative market share of small banks
over the period 1987 to 1995 in states that did and did not drop surcharge bans sometime
between 1989 and 1994 (with some omissions for ambiguous cases). She did not find
consistent evidence of a deleterious effect on small banks (as reflected in a reduction in
their cumulative market shares) as a result of the lifting of surcharge bans. This finding
may reflect the fact that, as noted above, many banks did not levy surcharges in the years
before 1996, even if they operated in states that allowed the practice.
Because of the prominence of detailed structural estimations to explain bank
choice in general,3 and in particular the use of the methodology in the papers by Knittel
and Stango (December 2004) and Ishii (2004) to address questions relating to the impact
of ATM pricing and deployment on market share, it is useful to compare the approach
taken in these papers with the one followed here. Such models provide parameters
3 Dick (forthcoming) was the first to apply this methodology to bank choice. See also Adams, Brevoort, and Kiser (2005).
9
associated with discrete-choice demand relations, and, in the case of Ishii (2004), those
associated with the production and pricing decisions of banking organizations, under
specific assumptions regarding the nature of depositor behavior, bank behavior, and the
competitive equilibrium. With these structural estimates, it is possible to conduct a
counterfactual experiment to assess the changes produced by a surcharge ban on a
number of measures of interest, including market shares, market concentration, deposit
rates, profits, and, most importantly, total welfare. This approach can yield many
insights, and it is the only approach that can provide direct estimates of the impact of
policies on welfare.
Nonetheless, application of the approach to banking does typically rest on a very
long list of admirably explicit but not always plausible assumptions. Examples are: the
depositor chooses a single bank for depository services; each depositor is endowed with a
level of deposits that is invariant with respect to the rates offered by the chosen bank;
unobservables in the depositor’s indirect utility function are distributed i.i.d. type_1
extreme value over all individuals and products; a single generic deposit rate or deposit
fee may be used to encompass all the different types of deposit accounts at banks and
thrifts (from large CDs to small transaction accounts), and (because available data do not
allow the researcher to distinguish between the deposits of individuals and businesses)
businesses satisfy the same list of detailed assumptions as do individuals in their choice
of financial institution.
Many of these assumptions may be useful simplifications, whose violation makes
no real difference to the predictions that stem from them. They do, however, highlight
the desirability of checking the predictions of the approach, when possible, with an
10
alternative and simpler one that, while also subject to a number shortcomings, is not
generally subject to the same shortcomings. The natural experiment made possible by the
uniqueness of Iowa banking law makes possible such an alternative look.
3. A “Difference-in-Difference” Examination of the Impact of Surcharge Bans
The empirical approach pursued in this paper exploits the natural experiment
made possible by the very different policies toward surcharging taken by Iowa, on the
one hand, and five of the six states neighboring Iowa, on the other. As noted above, a
major event in the history of surcharging occurred on April 1, 1996, when the Cirrus and
Plus national ATM networks modified their operating rules to allow ATM owners to
impose surcharges. Thereafter, the incidence of surcharging rose substantially in five
states neighboring Iowa: Illinois, Minnesota, Missouri, South Dakota, and Wisconsin.
Nebraska, which also neighbors Iowa, is excluded because it lifted its surcharge ban at a
later date that is not easily determined. According to a survey of bank fees conducted in
1999, surcharges were levied by 43 of 46 surveyed ATM-owning banks in Illinois, 8 of
11 such banks in Minnesota, 19 of 19 in Missouri, 5 of 5 in South Dakota, and 13 of 17 in
Wisconsin.4 Thus, surcharging appears to have been nearly universal during this period
in the states that allowed it.
In contrast to these states, Iowa maintained a ban on surcharges until March of
2002. The 1999 survey of Iowa banks produced only 3 of 18 surveyed ATM-owning
banks responding that they imposed a surcharge, while the 2001 survey found only 3 of
4 The surveys referred to here were conducted by Moebs Services, of Lake Bluff, Illinois, under contract with the Federal Reserve Board. The samples of banks surveyed by Moebs Services were obtained through random sampling. This information is not used directly in the tests reported below in part because of the small number of available observations and in part because of the problems of endogeneity that would be introduced.
11
24 such banks indicating that they surcharged. While it is unclear why a few small banks
would respond that they are surcharging ATM users in a state that bans the practice, it is
clear that the ban, on the whole, was effective in making surcharging a rare, if not
nonexistent, practice in the state.
To assess the changes in market shares and changes in commonly measured
aspects of market structure brought about by surcharging, the approach taken will be to
compare the changes in bank-specific market shares and market-specific measures of
market structure occurring over a period in which a surcharge ban was lifted with
equivalently measured changes occurring over the same period in states where no change
in a surcharge ban occurred. Because surcharge bans were, in essence, lifted in the five
states neighboring Iowa in April of 1996, but not in Iowa, and because the Iowa ban was
lifted by a court decision in March of 2002, whereas the ban had long since been lifted in
neighboring states, these two dates are the events surrounding which difference-in-
difference analysis can be conducted.
In assessing the results of the analysis, it will be useful to keep in mind that, in
response to the lifting of a surcharge ban, the optimal level of bank decision variables
other than the surcharge may also change. Banking organizations are likely to change the
number of ATMs that they offer their customers, and they can make themselves more or
less attractive to depositors by altering deposit rates and other fees, such as the foreign
fee. Thus, any observed changes in deposit shares or other variables of interest will
presumably reflect the impact of induced changes in these items as well. Further, since it
may take some time for banks to change appreciably the size of their ATM networks and
12
for the institutional choice of depositors to reflect those changes, it may take some time
for deposit shares and other variables of interest to reach their new equilibrium.
Another issue relevant to this type of analysis concerns the possibility that other
relevant regulatory changes confound results attributed to the lifting of surcharge bans. A
brief discussion of this issue is presented below in light of the results obtained.
4. The Empirical Model
While difference-in-difference analyses are commonly conducted using
extensive panel data sets in which the units of observation are observed multiple times
both before and after the intervention studied, Bertrand, Duflo and Mullainathan (2004)
warn that, due primarily to serial correlation, such studies often severely underestimate
the standard errors associated with the effect of the intervention. They find, through
Monte Carlo simulations, that two approaches in particular can be used to successfully
deal with this problem. The first and simplest involves removing the time series
dimension by aggregating the data into two periods: pre- and post-intervention. The
second entails correction for the serial correlation by allowing for an unrestricted
covariance structure over time within groups (markets or states, in this application), with
or without an assumption that the error terms in all groups follow the same process.
Bertrand, Duflo, and Mullainathan (2004) note that the first approach is preferable to the
second when the number of different groups (states) is relatively small.
The approach taken in this paper is to conduct separate pre- and post-intervention
comparisons, where the pre-intervention state is measured as of the year before the event,
and the post-intervention state is measured as of specific years after the event. This
13
approach avoids the problems of serial correlation noted by Bertrand, Duflo and
Mullainathan, while at the same time allowing for a relatively agnostic look at the time it
takes for any event-related changes to take place.
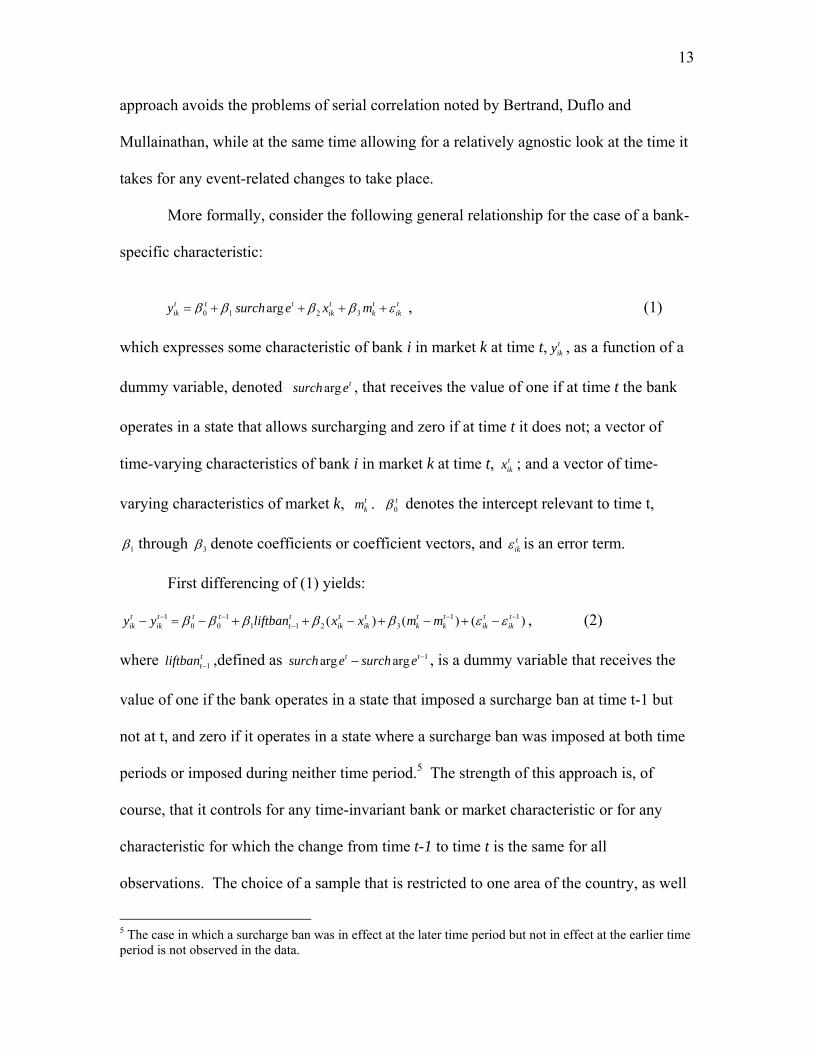
More formally, consider the following general relationship for the case of a bank- specific characteristic:
0 1 2 3argt t t t t tik ik k iky surch e x mβ β β β ε= + + + + , (1)
which expresses some characteristic of bank i in market k at time t, tiky , as a function of a
dummy variable, denoted arg tsurch e , that receives the value of one if at time t the bank
operates in a state that allows surcharging and zero if at time t it does not; a vector of
time-varying characteristics of bank i in market k at time t, tikx ; and a vector of time-
varying characteristics of market k, tkm . 0
tβ denotes the intercept relevant to time t,
1β through 3β denote coefficients or coefficient vectors, and tikε is an error term.
First differencing of (1) yields:
1 1 1 10 0 1 1 2 3( ) ( ) ( )t t t t t t t t t t t
ik ik t ik ik k k ik iky y liftban x x m mβ β β β β ε ε− − − −−− = − + + − + − + − , (2)
where 1ttliftban − ,defined as 1arg argt tsurch e surch e −− , is a dummy variable that receives the
value of one if the bank operates in a state that imposed a surcharge ban at time t-1 but
not at t, and zero if it operates in a state where a surcharge ban was imposed at both time
periods or imposed during neither time period.5 The strength of this approach is, of
course, that it controls for any time-invariant bank or market characteristic or for any
characteristic for which the change from time t-1 to time t is the same for all
observations. The choice of a sample that is restricted to one area of the country, as well
5 The case in which a surcharge ban was in effect at the later time period but not in effect at the earlier time period is not observed in the data.
14
as other restrictions to be discussed below, is made to take fullest advantage of this form
of statistical control. The resulting estimating equation for the case in which the impact
of surcharging on a market characteristic, rather than a bank characteristic, is the primary
interest is equivalent to (2), except that, of course, the term indicating the change in bank
characteristics is excluded.
The basic prediction of the indirect effect of surcharging is that, with the lifting of
a surcharge ban, financial institutions with large numbers of ATMs in the market will
gain market share at the expense of institutions with few or no ATMs, all else equal. In
addition, it also suggests that, because of the competitive disadvantage that might result
from surcharging, some small banks with few ATMs might leave the market over time,
and fewer such banks might find it in their interest to enter the market.
Data on bank-specific ATM deployments are not generally available for the
financial institutions in the states of interest over the time periods of interest. However,
Hannan, Kiser, Prager, and McAndrews ( 2003) collected data on bank-specific market
ATM shares for a nationwide sample of over 500 banks for the year 1998, and these data
indicate a correlation of approximately .77 between bank-specific deposit shares and
bank-specific ATM shares. Thus, it does not seem unreasonable to use deposit-based
measures of market shares as a proxy for the share of ATMs in a market.
With this in mind, a possible all-encompassing measure of the potential
“structural” effects of surcharging is the common Herfindahl-Hirschman index of
concentration, defined as the sum of squared deposit or account shares. For the purpose
of this study, the measure must be adjusted to exclude any changes in underlying market
shares that occur over time because of mergers. Assuming that banks with greater market
15
shares also tend to be those with more ATMs in the market, such a measure, adjusted to
exclude the impact of mergers, is predicted to increase with the lifting of a surcharge ban,
either because of an increase in the disparity of market shares induced by surcharging or
because of a reduction in the number of competitors over time induced by surcharging.
The results of explicit tests of these individual components of any observed
change in this measure will also be reported. This will include the results of difference-in
difference analyses of the change in bank-specific market shares to examine more
explicitly whether, with the legalization of surcharging, the shares of large banks gain at
the expense of the shares of smaller institutions. Also presented will be the results of an
explicit tests of the impact of the lifting of surcharge bans on the number of market
competitors over time.
5. The Data and Variable Measurement
The markets employed in the analysis are Labor Market Areas, as defined by the
Bureau of Labor Statistics. For non-metropolitan areas, these are typically identical to
counties (or Minor Civil Divisions in the case of New England) but sometimes involve
larger areas achieved by combining counties (or Minor Civil Divisions in the case of New
England) when 15 percent or more of the employed workers in one area commute to the
other.6 The use of non-urban counties or, more recently, Labor Market Areas, to
approximate banking markets is common in analyses of bank competition.7 Because of
the relative dearth of metropolitan areas in the states included in the analysis, and because
many metropolitan areas found in the states surrounding Iowa (Chicago, St. Louis, and
6 See http:/www.bls.gov/lau/laugeo.htm#geolma for a detailed description. 7 See, for example, Hannan and Prager (2003), Berger and Hannan (1989), and Calem and Carlino (1991).
16
Minneapolis, for example) are substantially larger than the largest found in Iowa, only
markets that are not part of Metropolitan Statistical Areas (MSAs) are included in the
analysis.
In calculating market shares, one may use either the dollar volume of deposits or
the number of accounts. Data on the dollar volume of deposits of a depository institution
are available by branch from the FDIC’s Summary of Deposits, which means that market
shares based on this measure can be calculated directly by market in the case of banks
that happen to span more than one market. A potential shortcoming is that these data
can include substantial business deposits. The number of accounts of a bank probably
trakts better the extent of its consumer deposits, but these data are available only at the
institution level, which means that the number of deposit accounts that an institution has
in a defined market (for institutions that operate in more than one market) must be
approximated by assigning its accounts to markets in the same proportion as its
proportion of branches in each defined market. Because of the use of account data in
recent discrete choice analyses of bank choice, results reported below are based on the
use of account data to calculate market shares. The use of market shares based on deposit
volume makes little difference to the results of the analysis.
Market shares will be calculated as the number of accounts held by an institution
in a given market, divided by the sum of all accounts in the market estimated for all
banks and thrift institutions operating in the market. In tracing the relationship between
the change in market shares over time and the lifting of a surcharge ban, it is important to
adjust for the potentially major changes in market share that can result from mergers.
The primary concern is the case of a merger between institutions in the same market,
17
whereby observed market share would increase solely because of the merger. In these
cases, the procedure followed was to combine the market shares of those institutions that
were to merge by the latest period observed and to compare the changes in market shares
on this pro forma basis. Other variables relevant to the analysis were also adjusted
accordingly.8
Other data sources used include the FDIC’s Summary of Deposits (to determine
the number of branches that each banks operates in each market), and the US Census of
Population (to measure the population of each market).
6. The Results
Results associated with the lifting of the surcharge ban in states neighboring Iowa
in 1996 and those associated with the lifting of the surcharge ban in Iowa in 2002 will be
presented separately.
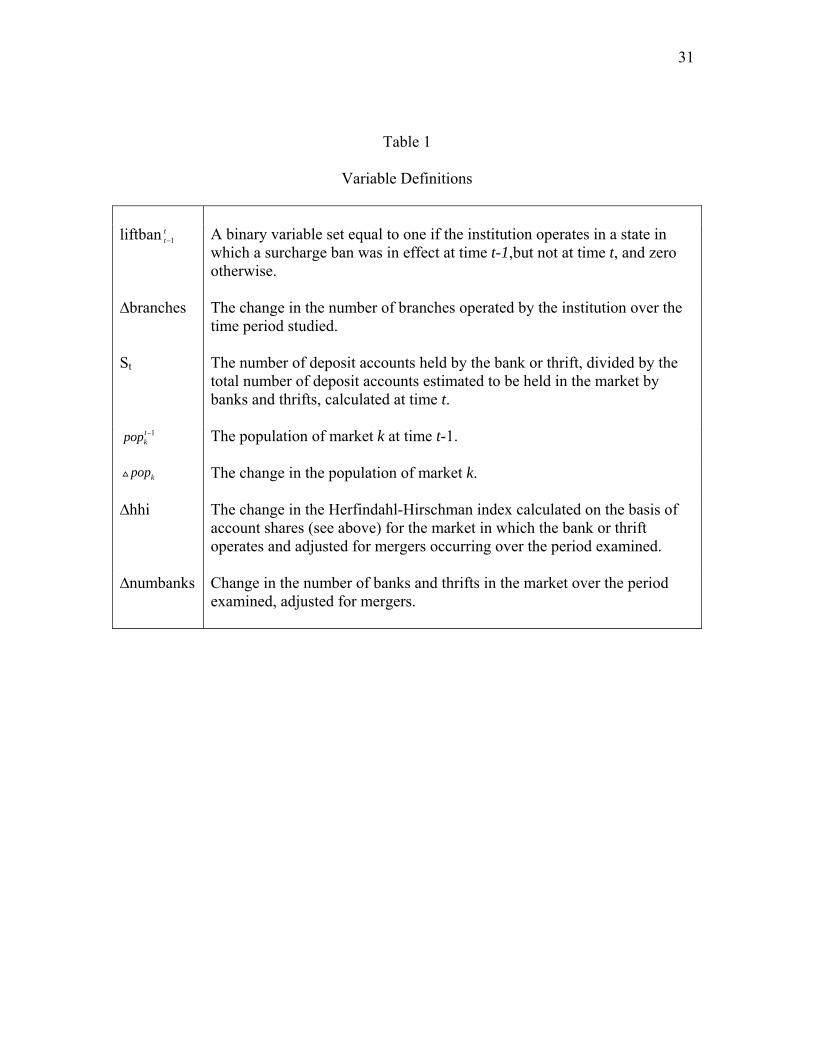
The Lifting of the Surcharge Ban in States Neighboring Iowa. Table 1 lists
the definitions of variables used in the study, while tables 2 through 4 present the results
of difference-in-difference analyses designed to assess the impact of the lifting of
surcharge bans in states neighboring Iowa in 1996. For the purpose of assessing the
differences attributable to this 1996 event, 1ttliftban − receives the value of one if the
observation (bank or market) is located in one of these states (and the time periods are
such that time t-1 occurs before 1996 and t occurs after 1996) and receives the value of
zero if it is located in Iowa.
8 The author would like to thank Robert Avery for developing the program that allowed these adjustments to be made efficiently. A small minority of the observations that form the basis of the analysis were adjusted in this way, and inclusion of a dummy variable indicating that the observation was subject to this adjustment indicates no material difference in the results of interest.
18
Because it is not clear how long it takes for a change in the legal status of
surcharging to reflect itself in an appreciable change in market shares, market
concentration, and other measures of interest, the approach taken is to estimate the
relationship between the change in these measures and their determinants over three time
periods that bracket the 1996 event: 1995-1997, 1995-1999, and 1995-2001. Because of
the plentiful number of bank observations, this approach seems preferable to a more
restrictive one that attempts to parameterize (or assume) differences in the change for
different time periods.
As noted above, observed changes in market concentration may result if surcharge
status influences the market shares of large market participants relative to small ones, or
if it influences the decision by financial institutions to leave or enter the market over
time. Thus, market concentration, and more specifically the Herfindahl-Hirschman
index, is arguably an over-all measure of the likely “structural” effects of surcharging,
and we will focus on this measure first.
The first three columns of table 2 report the results of OLS regressions in which,
for each of the three periods examined, the change in the Herfindahl-Hirschman index of
concentration, defined as the sum of squared market shares (with its change denoted
hhi∆ ), is regressed on 1ttliftban − , the population of the market at the beginning of the study
period, 1tkpop − , and the change in market population over the period, denoted kpop∆ .
These latter two variables are included to control for whatever impact the size of the
market and the change in the size of the market have on the change in concentration. As
indicated, the coefficients of 1ttliftban − are positive for all three periods and statistically
19
significant for two of them, with the largest magnitude in the case of the longest period
examined.
Coefficient magnitudes suggest that the difference in concentration accounted for
by surcharging is economically meaningful. The approximately 200 point increase in hhi
registered for the longest time period examined (from 1995 to 2001) is in the range that,
if thought to result from a proposed merger, would invite close scrutiny by regulatory
authorities. This magnitude is also fairly close to the 169-point average reduction
predicted by Ishii (2004) to result from the imposition of a surcharge ban, as derived from
her structural analysis of Massachusetts depository institutions. It bears noting, however,
that the counterfactual experiment from which she derives this prediction assumes no
change in ATM deployment as a result of the ban, while the estimates presented here
would presumably encompass any effects of such changes, whatever they may be.
It also bears emphasizing at this point that this measure of concentration and
indeed all relevant variables in the analysis have been adjusted for mergers, so that the
predicted changes in concentration are those that would occur in the absence of mergers.
The negative intercepts in these estimations thus suggest a generally deconcentrating
trend in the absence of mergers and changes in surcharge status. Coefficient magnitudes
suggest that the lifting of surcharge bans in the states neighboring Iowa simply
counteracted or substantially retarded this underlying deconcentrating trend.
In comparing results across the different time periods, it is clear that the impact of
the lifting of surcharge bans takes several years to be fully reflected in changed market
concentration. In regard to the control variables, the negative and generally significant
coefficients of kpop∆ suggest, plausibly, that as a market gets large, concentration
20
declines. This may reflect the fact that in a larger market, there is room for more firms to
operate at a scale that does not place them at a severe disadvantage.
The question next arises as to how this estimated impact of surcharging on
concentration comes about. Is it because it induces an increase in the disparity of market
shares, as implied most obviously by the “indirect effect,” or because it induces a net
reduction in the number of competitors in the market, presumably as more small firms
leave and fewer enter the market over time?
This latter possibility will be addressed first. The last three columns of table 2
report the result of OLS regressions in which the change in the number of institutions,
denoted numbanks∆ , replaces the change in concentration as the dependent variable. The
coefficients of 1ttliftban − are negative and significant for all three periods examined, with
the magnitudes observed for the two longer study periods greater than that observed for
the 1995-1997 period. This relative reduction in the number of market participants in
states that lifted surcharge bans is clearly one of the reasons why market concentration
increased in those states relative to the changes observed in Iowa. This may reflect the
phenomenon that, with surcharging resulting in a less profitable environment for smaller
institutions, such firms are more inclined to exit and less inclined to enter markets in
which surcharging is permitted. The coefficients of initial market population and change
in population are all positive and significant (except in one case), reflecting the fact that
larger markets can accommodate more institutions.
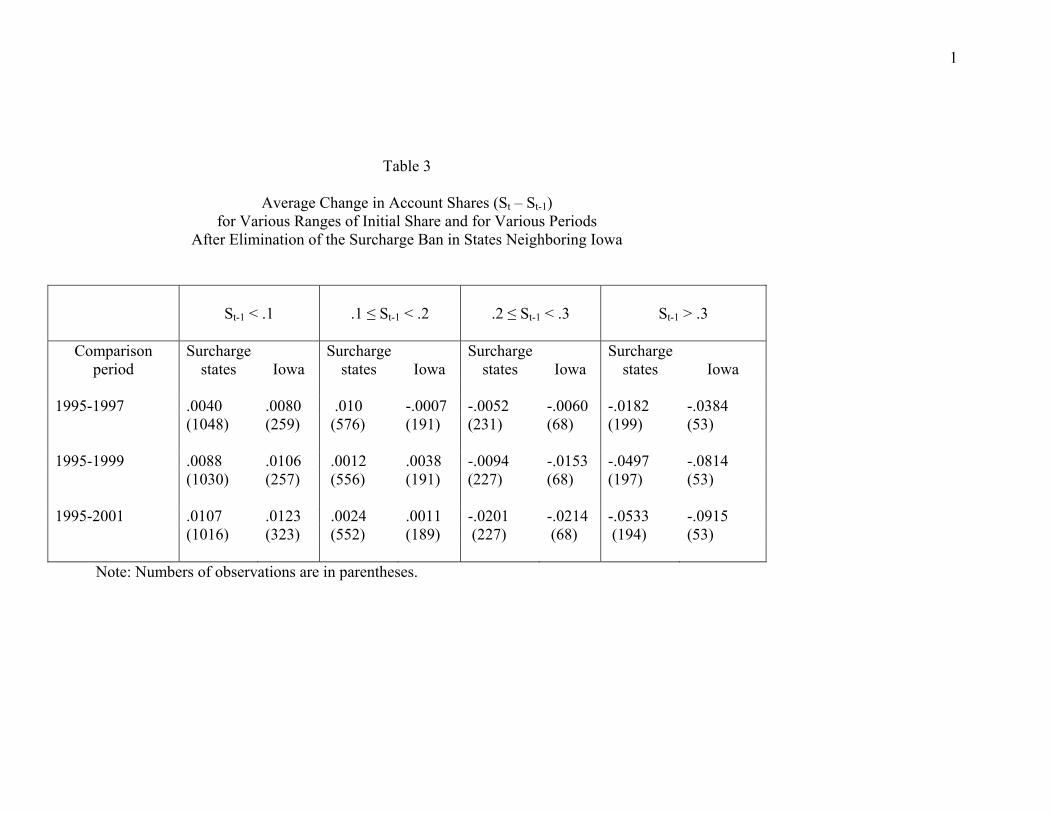
We now consider more explicitly the impact of surcharging on the market shares
of institutions that remained in the market over the time periods examined. As a first
look, table 3 reports the average change in market shares for each of the three study
21
periods, for Iowa and the neighboring “surcharge states,” and, most importantly, for four
different ranges of initial market share. These data suggest that “regression toward the
mean” is at work, since institutions with small initial market shares exhibit, on average,
an increase in market shares, while institutions with large initial shares experience, on
average, a decrease. The important point to note, however, is that in Iowa, where
surcharges were banned over the periods examined, institutions with initial market shares
less than 0.1 fared “better” in terms of subsequent market share changes than did
institutions in neighboring states where surcharge bans were lifted. For institutions with
larger initial market shares, however, the results are reversed. For institutions with initial
market shares of between O.2 and 0.3, those in states that lifted surcharge bans fared
somewhat “better” in terms of change in market share, and the differential is greater for
institutions with initial market shares greater than 0.3.
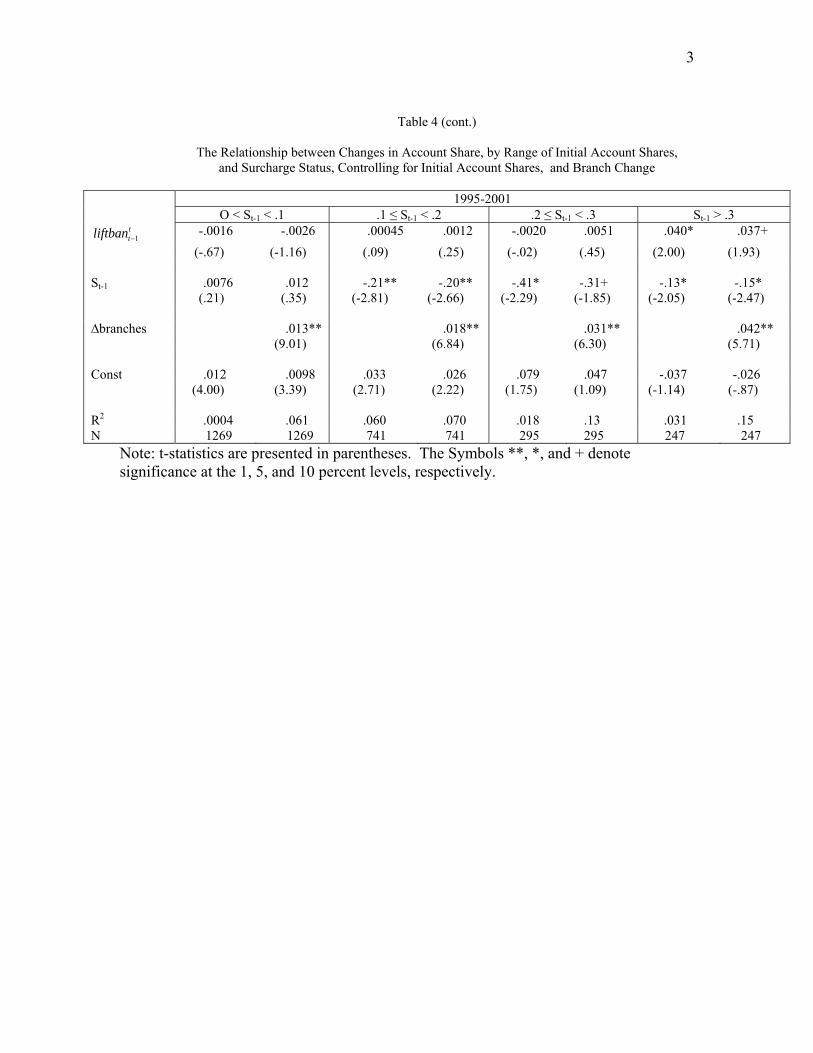
Table 4 reports regression results obtained for the same study periods and
classifications of initial market shares. For each of the four classifications of initial
market shares and for each study period, the change in market shares is regressed on
1ttliftban − , the initial market share( 1ts − ), and in some cases, the change in the number of
branches over the study period ( branches ).
The coefficient of 1ttliftban − in these regressions indicates the effect of lifting the
surcharge ban on the subsequent changes in market shares within each category of initial
market share. As indicated for the 1995-1997 period, this coefficient is negative and
statistically significant for the category containing the smallest market participants and
positive and significant (with one exception) for the category containing the largest
market participants. The market shares of institutions in the two intermediate categories
22
appear to be little affected by the lifting of the surcharge ban. The coefficients of the
initial market share, employed to account for the phenomenon of regression toward the
mean or any other factor that might cause the change in market share to be related to its
initial level, are mixed in sign and significance. The coefficients of the change in the
number of branches are positive and highly significant. This variable is not included in
all regressions, since it could be endogenous if decisions on the number of branches to
maintain are influenced by permission to surcharge. Its inclusion does not affect by
much the results obtained for the coefficients of 1ttliftban − .
For the two longer periods examined, the coefficients of 1ttliftban − are positive and
significant for the category containing the largest market participants but are not
significant for the categories of institutions with smaller initial market shares. Thus it
appears from these results that the primary influence of surcharge status on market
shares, at least among those firms remaining in the market over time, occurs at the high
end of the distribution, where permission to surcharge, as predicted, results in a
statistically significant increase in market shares. The lifting of surcharge restrictions is
found to have a statistically significant negative impact on the market shares of the
smallest market participants over the 1995-1997 period, but not for the two longer
periods examined. A possible explanation is that many of the smaller market participants
most disadvantaged by surcharging dropped out of the sample by the end of the longer
periods.
The Lifting of the Surcharge Ban In Iowa. Still more evidence on the effects of
surcharging may be unearthed by exploiting the fact that in 2002, as a result of a court
decision, Iowa also lifted its ban on ATM surcharging. Since by this time the states
23
neighboring Iowa had long since adjusted to the effective lifting of their bans in 1996,
this event provides another opportunity to investigate the impact of the lifting of a
surcharge ban using the same difference-in-difference methodology. The one obvious
limitation is that the impact of the lifting of the ban in this case can be followed for no
more than two years after the event, since 2004 is the last year for which data are
available. As in the analysis of the earlier periods, the data are adjusted to exclude the
impact of mergers and acquisitions among market participants occurring during the
period.
Tables 5 and 6 are similar in format and underlying rationale to tables 2 and 4,
respectively (the equivalent of descriptive table 3 is not reported), except that results refer
to the 2001-2004 period, and the definition of 1ttliftban − is changed so that it now receives
the value of one if the observed institution operates in Iowa and zero if it operates in a
state neighboring Iowa.9
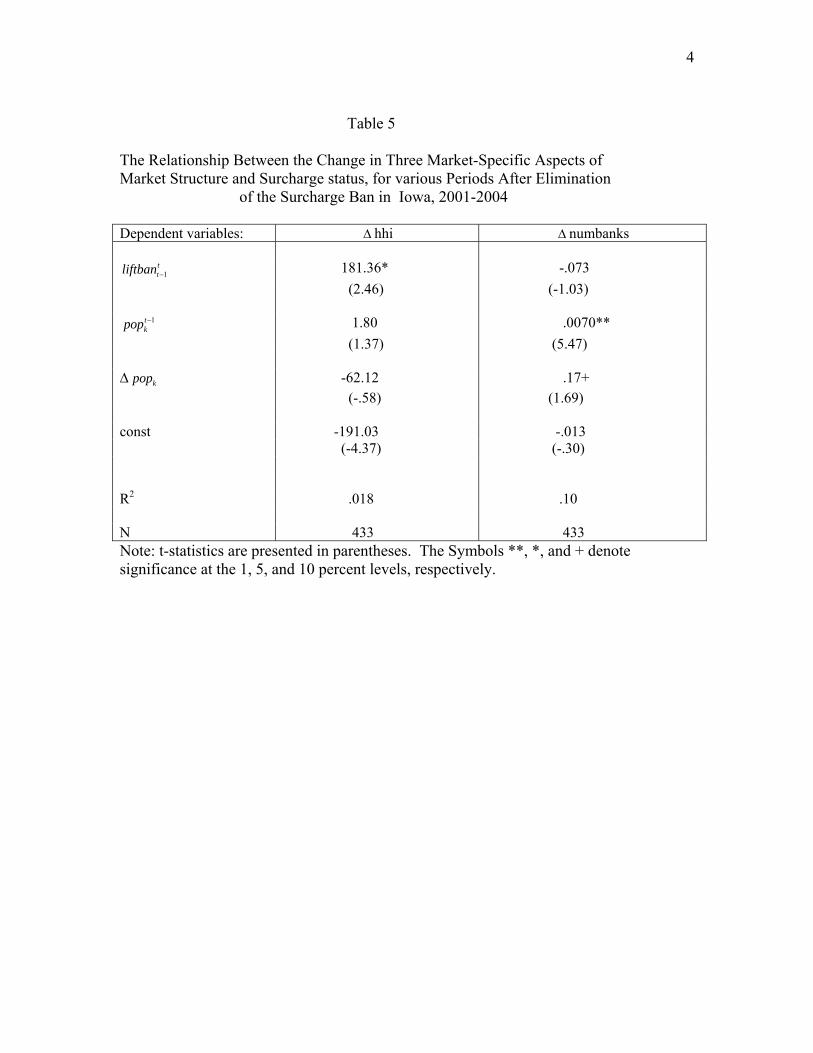
Table 5 reports the results of regressions that are identical to those reported in
table 2, except that they are run on data relevant to the 2001-2004 period. Here, as in
table 2, our concern is the relationships between the lifting of a surcharge ban and
subsequent changes in market concentration and subsequent changes in the number of
institutions operating in the market, relative to the case in neighboring states not subject
to a change in surcharge status. As indicated in the first column of table 5, the coefficient
of 1ttliftban − is positive and significant, indicating that market concentration increased in
Iowa over the 2001-2004 period, relative to the changes in concentration observed over
the same period in neighboring states, where surcharge status did not change. The
9 Nebraska institutions are included in this sample, since Nebraska’s status as a state that allowed surcharging did not change during this study period.
24
coefficient, approximately 181, is substantial in magnitude and only slightly smaller than
that found for the longer 1995-2001 period, as reported in table 2. Thus, this positive,
significant relationship between the lifting of a surcharge ban and subsequent changes in
market concentration appears to be quite robust with respect to the time period examined
and the state in which the ban was lifted. The coefficients of initial population and
change in market population over the time period, included to control for market size and
its change over time, are not statistically significant.
The second column in table 5 reports results of an equivalent estimation, except
that the change in the number of institutions ( numbanks ) is employed as the dependent
variable. As in the case of the earlier periods reported in table 2, the coefficient of
1ttliftban − is negative, but in this case is not statistically significant. The coefficients of
initial market population and the change in market population over the period are positive
and significant, suggesting that larger markets and faster growing markets experience
greater increases in the number of institutions operating in the market.
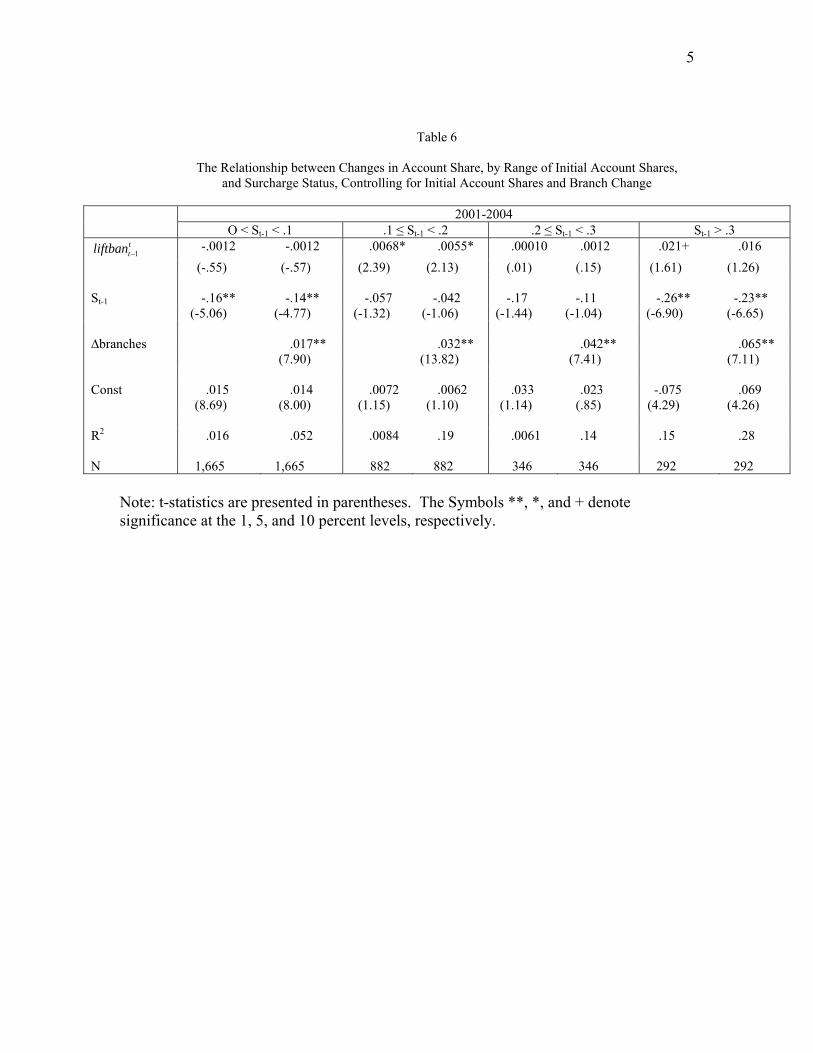
Table 6 presents, for the 2001-2004 period, regressions similar to those presented
in 4 for three earlier time periods. As in table 4, these regressions are designed to
indicate, for different ranges of initial market shares, the changes in market shares
brought about by the lifting of a surcharge ban. As indicated, the coefficients of 1ttliftban −
are negative but insignificant for the smallest category of initial market shares and
positive in the larger three categories, with statistical significance in the case of initial
market shares between 0.1 and 0.2 and marginal significance in the case of the largest
category of initial market share (with 1 .3tS − > ). Coefficient magnitudes are the largest in
the case of this category of the largest market participants. While coefficient signs and
25
magnitudes are consistent with the hypothesis that the lifting of the surcharge ban in Iowa
in 2002 caused a reduction in the market shares of the smallest market participants and an
increase in those of the largest market participants, levels of statistical significance are
not as high as those reported for the earlier periods in table 2.
As frequently observed in table 4, the coefficients of the initial market shares,
1tS − are generally negative and significant, consistent with the phenomenon of regression
toward the mean. The coefficients of the change in the number of market branches in the
market, a variable not included in all regressions because of the potential for endogeneity
bias, are positive and highly significant.
Possible Confounding Effects. An obvious concern in any difference-in-
difference analysis of a regulatory change, such as this one, is the possibility that results
are confounded by the influence of other unmeasured changes over the period. The best
candidate for concern in this application relates to the differences that existed between
Iowa and its neighbors in the treatment of de novo branches. While all states allowed
unlimited branching within the local markets defined in this study, Iowa did not fully lift
restrictions on statewide de novo branching until July of 2004. This date is well after
the first three reported comparisons and slightly after the 2001-2004 comparison (since
measures for 2004 are calculated as of June 30, 2004), but it does highlight the
importance of the assumption that characteristics that are time-invariant over the study
period “cancel out” in the derivation of equation (2).
A further complication concerns the fact that the Iowa legislation allowing
full statewide de novo branching by July 2004 also allowed a maximum of three
statewide de novo branches during a transition period starting from the legislation’s
26
passage in 2001 and ending on the date of full implementation in 2004. Such a change
should have, if anything, a deconcentrating effect on Iowa’s markets over the 2001-2004
period, as potential competitors find it easier to enter new markets de novo. Thus, it
should, if anything, bias results against the finding of a relative increase in concentration
reported for Iowa after the lifting of its surcharge ban. This in particular may explain
why the registered reduction in the number of banks after the lifting of Iowa’s ban is
considerably smaller in magnitude and less statistically significant than the equivalent
changes registered for Iowa’s neighbors in the earlier comparisons.
7. Summary and Conclusion
The goal of this paper has been to test for the impact of ATM surcharging
(inferred from information on ATM surcharge bans) on the market shares of financial
institutions and on aspects of market structure. These tests exploit as “natural
experiments” two events associated with the lifting of a surcharge ban in Iowa and in the
states that neighbor Iowa. The first of these events occurred on April 1, 1996, when the
Cirrus and Plus national ATM networks modified their operating rules to allow ATM
owners to impose surcharges. Surcharging thereafter spread rapidly in the states that
neighbor Iowa, but, because of state legislation, the ban remained firmly in force in Iowa.
The second event occurred in March of 2002, when a court decision resulted in the lifting
of the ban in Iowa as well.
Employing a “difference-in-difference” methodology, the paper reports consistent
evidence that the effective lifting of surcharge bans in states neighboring Iowa in 1996
caused a statistically significant and economically meaningful increase in the
27
concentration of non-MSA markets (as measured by the Herfindahl-Hirschman index) in
those states above that which would have prevailed had there been no lifting of surcharge
bans. This difference was found to increase over several years after the lifting of the
bans. Further tests reveal that this observed difference appears to have been attributable
to two factors. First, states lifting surcharge bans experienced a statistically significant
relative reduction in the number of market competitors, perhaps because small
institutions disadvantaged by surcharging exited the market. Second, of those institutions
remaining in the market during the different time periods examined, the market shares of
institutions with a substantial initial market presence increased, when compared to the
changes observed in Iowa over the same periods (where a surcharge ban was not lifted).
Results associated with the lifting of the surcharge ban in Iowa in 2002 are
somewhat weaker, in part because, as found for the 1996 event, the full impact of the
lifting of a ban can take several years to observe, and data for only two years after the
2002 event are available. Nonetheless, they generally suggest that the same changes
were at work in Iowa, after the lifting of its ban in 2002, as observed in neighboring
states after the effective lifting of their surcharge bans in 1996. This is most clearly
evident in the case of market concentration, which increased significantly in Iowa
(relative to changes observed for neighboring states) after the lifting of its ban, just as it
had in neighboring states (relative to changes observed in Iowa) after the lifting of their
bans in 1996.
These results also provide fairly strong and consistent evidence of the much
discussed “indirect effect” of surcharging, whereby the imposition of a surcharge
(particularly by substantial market competitors with large ATM networks) actually
28
attracts depositors to the bank, since this underlying relationship predicts all of the
reported findings.
A clear limitation of this analysis is that it does not allow us to assess the full
welfare implications of surcharging. Among other changes, legalization of surcharging
may provide greater incentive for financial institutions to invest in extensive ATM
networks, providing greater convenience for their depositors. These results do
demonstrate, however, (in a manner not dependent on the long list of detailed
assumptions common to more structural approaches) that changes in market structure
result from a change in the legal status of surcharging, and these changes appear to be
economically meaningful.
29
References
Adams, Robert, Kenneth Brevoort, and Elizabeth Kiser. “Who Competes with Whom?
The Case of Depository Institutions,” Working paper 2005-03, Federal Reserve Board
(2005).
Berger, Allen, and Timothy Hannan. “The Price-Concentration Relationship in
Banking,” Review of Economics and Statistics 71 (May 1989) pp. 291-299.
Bernhardt, Dan, and Nadia Massoud. “Endogenous ATM Location and Pricing,”
Working Paper, 2002a.
______________________. “’Rp-Off’ ATM Surcharges,” Rand Journal of Economics,
33 (1), (Spring 2002b) pp. 96-115.
Bertrand, Marianne, Esther Duflo, and Sendhil Mullainathan. “How Much Should We
Trust Differences-in-Differences Estimates?” Quarterly Journal of Economics (February
2004), pp.249-275.
Calem, Paul, and G. Carlino. The Concentration/Conduct Retlationship in Bank Deposit
Markets,” Review of Economics and Statistics 72 (1991), pp. 268-276.
Dick, Astrid. “Demand Estimation and Market Power in the Banking Industry,” Journal
of Business (forthcoming).
Gowrisankaran, Gautam, and John Krainer. “The Welfare Consequences of ATM
Surcharges: Evidence from a Structural Entry Model,” Working Paper, 2004.
30
Hannan, Timothy, Elizabeth Kiser, Robin Prager, and Jamie McAndrews. “To Surcharge
or Not to Surcharge: An Empirical Investigation of ATM Pricing,” Review of Economics
and Statistics, 85 (November 2003), pp. 990-1002.
Hannan, Timothy. “Bank Retail Fees and Multimarket Banking,” Working Paper, Federal
Reserve Board, 2004.
Hannan, Timothy, and Robin Prager. “The competitive implications of multimarket
branching,” Journal of Banking and Finance 28 (2004) pp. 1889-1914.
Isshi, Joy. “Interconnection Pricing and Compatibility in Network Industries: ATM
Networks in the Banking Industry,” Working Paper, Department of Economics, Harvard
University, 2004.
Knittel, Christoper R. and Victor Stango. “Compatibility and Pricing with Indirect
Network Effects: Evidence from ATMs,” NBER Working Paper 10074 (September
2004).
________________________. “Incompatibility, Product Attributes and Consumer
Welfare: Evidence from ATMs,” NBER Working Paper 10962 (December 2004).
Prager, Robin. “The Effects of ATM Surcharges on Small Banking Organizations,“
Review of Industrial Organization 18 (2001), pp. 161-173.
31
Table 1
Variable Definitions
liftban 1
tt− A binary variable set equal to one if the institution operates in a state in
which a surcharge ban was in effect at time t-1,but not at time t, and zero otherwise.
∆branches The change in the number of branches operated by the institution over the time period studied.
St The number of deposit accounts held by the bank or thrift, divided by the total number of deposit accounts estimated to be held in the market by banks and thrifts, calculated at time t.
1tkpop − The population of market k at time t-1.
kpop The change in the population of market k.
∆hhi The change in the Herfindahl-Hirschman index calculated on the basis of
account shares (see above) for the market in which the bank or thrift operates and adjusted for mergers occurring over the period examined.
∆numbanks Change in the number of banks and thrifts in the market over the period examined, adjusted for mergers.
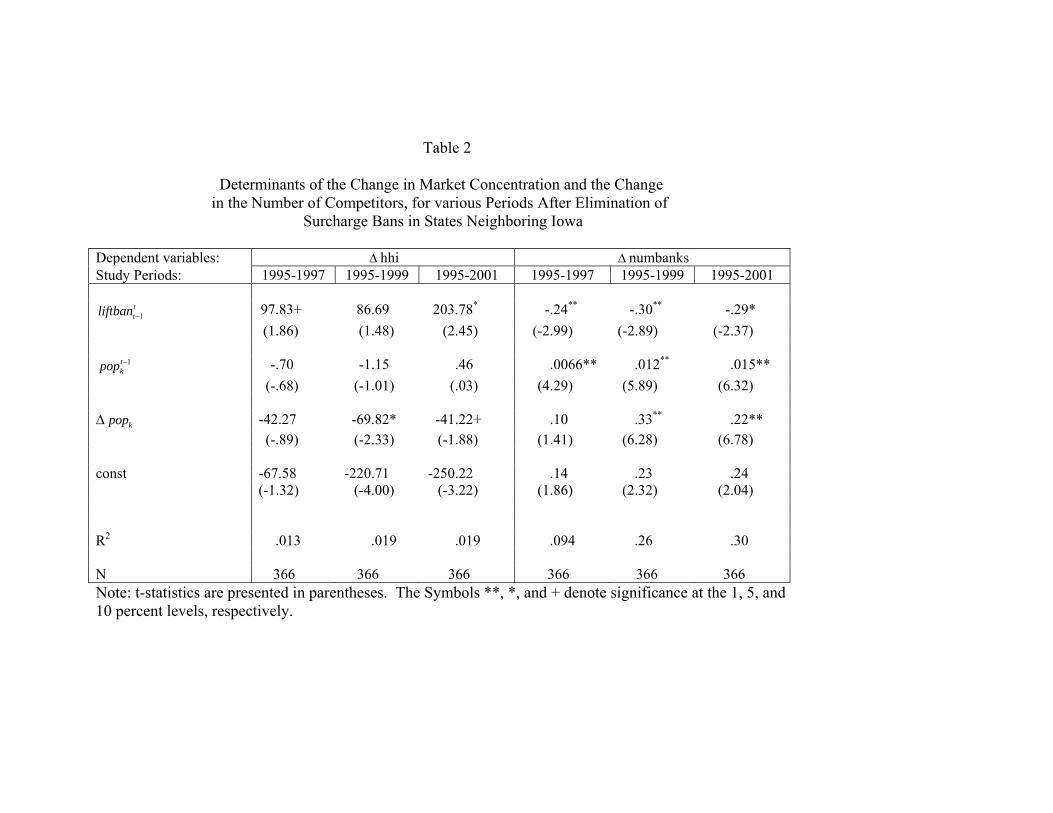
Table 2 Determinants of the Change in Market Concentration and the Change in the Number of Competitors, for various Periods After Elimination of Surcharge Bans in States Neighboring Iowa Dependent variables: ∆ hhi ∆ numbanks Study Periods: 1995-1997 1995-1999 1995-2001 1995-1997 1995-1999 1995-2001
1ttliftban − 97.83+ 86.69 203.78* -.24** -.30** -.29*
(1.86) (1.48) (2.45) (-2.99) (-2.89) (-2.37)
1tkpop − -.70 -1.15 .46 .0066** .012** .015**
(-.68) (-1.01) (.03) (4.29) (5.89) (6.32) ∆ kpop -42.27 -69.82* -41.22+ .10 .33** .22** (-.89) (-2.33) (-1.88) (1.41) (6.28) (6.78) const -67.58 -220.71 -250.22 .14 .23 .24 (-1.32) (-4.00) (-3.22) (1.86) (2.32) (2.04) R2 .013 .019 .019 .094 .26 .30 N 366 366 366 366 366 366 Note: t-statistics are presented in parentheses. The Symbols **, *, and + denote significance at the 1, 5, and 10 percent levels, respectively.
1
Table 3
Average Change in Account Shares (St – St-1) for Various Ranges of Initial Share and for Various Periods
After Elimination of the Surcharge Ban in States Neighboring Iowa
St-1 < .1
.1 ≤ St-1 < .2
.2 ≤ St-1 < .3
St-1 > .3
Comparison
period Surcharge
states
Iowa Surcharge
states
Iowa Surcharge
states
Iowa Surcharge
states
Iowa 1995-1997 .0040 .0080 .010 -.0007 -.0052 -.0060 -.0182 -.0384 (1048) (259) (576) (191) (231) (68) (199) (53) 1995-1999 .0088 .0106 .0012 .0038 -.0094 -.0153 -.0497 -.0814 (1030) (257) (556) (191) (227) (68) (197) (53) 1995-2001 .0107 .0123 .0024 .0011 -.0201 -.0214 -.0533 -.0915 (1016) (323) (552) (189) (227) (68) (194) (53)
Note: Numbers of observations are in parentheses.
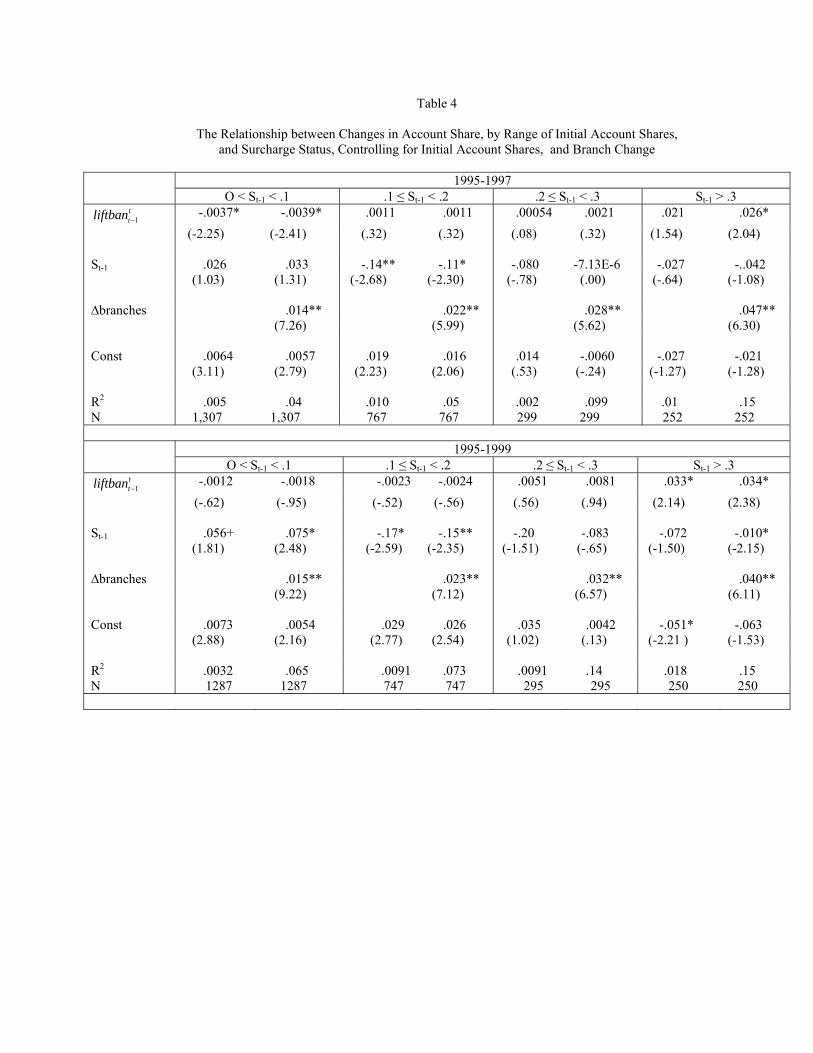
Table 4
The Relationship between Changes in Account Share, by Range of Initial Account Shares, and Surcharge Status, Controlling for Initial Account Shares, and Branch Change
1995-1997 O < St-1 < .1 .1 ≤ St-1 < .2 .2 ≤ St-1 < .3 St-1 > .3
1ttliftban − -.0037* -.0039* .0011 .0011 .00054 .0021 .021 .026*
(-2.25) (-2.41) (.32) (.32) (.08) (.32) (1.54) (2.04) St-1 .026 .033 -.14** -.11* -.080 -7.13E-6 -.027 -..042 (1.03) (1.31) (-2.68) (-2.30) (-.78) (.00) (-.64) (-1.08) ∆branches .014** .022** .028** .047** (7.26) (5.99) (5.62) (6.30) Const .0064 .0057 .019 .016 .014 -.0060 -.027 -.021 (3.11) (2.79) (2.23) (2.06) (.53) (-.24) (-1.27) (-1.28) R2 .005 .04 .010 .05 .002 .099 .01 .15 N 1,307 1,307 767 767 299 299 252 252 1995-1999 O < St-1 < .1 .1 ≤ St-1 < .2 .2 ≤ St-1 < .3 St-1 > .3
1ttliftban − -.0012 -.0018 -.0023 -.0024 .0051 .0081 .033* .034*
(-.62) (-.95) (-.52) (-.56) (.56) (.94) (2.14) (2.38) St-1 .056+ .075* -.17* -.15** -.20 -.083 -.072 -.010* (1.81) (2.48) (-2.59) (-2.35) (-1.51) (-.65) (-1.50) (-2.15) ∆branches .015** .023** .032** .040** (9.22) (7.12) (6.57) (6.11) Const .0073 .0054 .029 .026 .035 .0042 -.051* -.063 (2.88) (2.16) (2.77) (2.54) (1.02) (.13) (-2.21 ) (-1.53) R2 .0032 .065 .0091 .073 .0091 .14 .018 .15 N 1287 1287 747 747 295 295 250 250
3
Table 4 (cont.)
The Relationship between Changes in Account Share, by Range of Initial Account Shares,
and Surcharge Status, Controlling for Initial Account Shares, and Branch Change
1995-2001 O < St-1 < .1 .1 ≤ St-1 < .2 .2 ≤ St-1 < .3 St-1 > .3
1ttliftban − -.0016 -.0026 .00045 .0012 -.0020 .0051 .040* .037+
(-.67) (-1.16) (.09) (.25) (-.02) (.45) (2.00) (1.93) St-1 .0076 .012 -.21** -.20** -.41* -.31+ -.13* -.15* (.21) (.35) (-2.81) (-2.66) (-2.29) (-1.85) (-2.05) (-2.47) ∆branches .013** .018** .031** .042** (9.01) (6.84) (6.30) (5.71) Const .012 .0098 .033 .026 .079 .047 -.037 -.026 (4.00) (3.39) (2.71) (2.22) (1.75) (1.09) (-1.14) (-.87) R2 .0004 .061 .060 .070 .018 .13 .031 .15 N 1269 1269 741 741 295 295 247 247
Note: t-statistics are presented in parentheses. The Symbols **, *, and + denote significance at the 1, 5, and 10 percent levels, respectively.
4
Table 5 The Relationship Between the Change in Three Market-Specific Aspects of Market Structure and Surcharge status, for various Periods After Elimination of the Surcharge Ban in Iowa, 2001-2004 Dependent variables: ∆ hhi ∆ numbanks
1ttliftban − 181.36* -.073
(2.46) (-1.03)
1tkpop − 1.80 .0070**
(1.37) (5.47) ∆ kpop -62.12 .17+ (-.58) (1.69) const -191.03 -.013 (-4.37) (-.30) R2 .018 .10 N 433 433 Note: t-statistics are presented in parentheses. The Symbols **, *, and + denote significance at the 1, 5, and 10 percent levels, respectively.
5
Table 6
The Relationship between Changes in Account Share, by Range of Initial Account Shares, and Surcharge Status, Controlling for Initial Account Shares and Branch Change
2001-2004 O < St-1 < .1 .1 ≤ St-1 < .2 .2 ≤ St-1 < .3 St-1 > .3
1ttliftban − -.0012 -.0012 .0068* .0055* .00010 .0012 .021+ .016
(-.55) (-.57) (2.39) (2.13) (.01) (.15) (1.61) (1.26) St-1 -.16** -.14** -.057 -.042 -.17 -.11 -.26** -.23** (-5.06) (-4.77) (-1.32) (-1.06) (-1.44) (-1.04) (-6.90) (-6.65) ∆branches .017** .032** .042** .065** (7.90) (13.82) (7.41) (7.11) Const .015 .014 .0072 .0062 .033 .023 -.075 .069 (8.69) (8.00) (1.15) (1.10) (1.14) (.85) (4.29) (4.26) R2 .016 .052 .0084 .19 .0061 .14 .15 .28 N 1,665 1,665 882 882 346 346 292 292
Note: t-statistics are presented in parentheses. The Symbols **, *, and + denote significance at the 1, 5, and 10 percent levels, respectively.